1. Introduction
The additive manufacturing (AM) of metals is becoming more and more popular due to its ability to produce complex geometries and parts on-demand from many different available powder materials with efficient material use [
1,
2]. Powder bed fusion (PBF) is one of the metal AM methods which uses either laser (L-PBF) or electron beam (EB-PBF) as a heat source to build the component in a layer-by-layer fashion and can produce accurate, sub-millimeter features [
3,
4]. One widely used powder material in PBF (especially L-PBF) is austenitic stainless-steel 316L. Due to its superior corrosion resistance, 316L is widely used in different components facing demanding corrosion atmosphere in chemical, petrochemical, process and marine industry [
5]. The microstructure of PBF 316L is usually composed of columnar [
6,
7,
8,
9] grains oriented parallel to the thermal gradients, i.e., the build direction. These microstructural features are originated by the anisotropic heat removal and re-melting of previous layers, also leading to anisotropic mechanical properties [
8,
10]. Compared to the wrought sheet materials, AM-produced 316L components have better mechanical properties [
8,
9,
11,
12]. In the PBF manufactured components, the motion of dislocations is hindered by various methods that all strengthen the 316L stainless-steel material. The grain boundary strengthening according to the Hall-Petch effect [
8] of the very fine microstructure is formed due to the high cooling rate of the melt pool. In addition, other strengthening mechanisms are the production of high dislocation density in the as-built material [
8], as well as the high amount of low-angle grain boundaries [
9] and the fine cellular structure with cell sizes from 0.5 to 1 µm [
9,
10,
13,
14].
In addition to the distinct microstructural features, the residual stresses and their formation are also inherent to L-PBF manufactured components [
15] due to the rapid localized heating–cooling thermal cycling of the material. At first, the laser beam heats the material and causes it to expand against the surrounding material and thus creates compressive stresses. Then, while the laser beam moves on, the material cools rapidly and its shrinking is constrained by the surrounding material, generating tensile residual stresses [
16]. However, the produced residual stress field is said to be very complicated due to the complex heating and heat transfer [
16]. The generating residual stresses may lead the material to crack, delaminate [
17] and deform [
18], and thus the result may be broken or warped components. Therefore, the controlling of the generation and end effects of residual stresses both in-situ and after the actual manufacturing process are of great interest.
During the AM process, the controlling of residual stresses is done in-situ with either feedback control, thermal gradient control, scanning strategy control and/or mechanical control [
15,
19]. However, often the scan strategy is an important parameter in controlling the formulating residual stresses in the printing [
16,
20,
21]. For example, Robinson et al. [
16,
21] noticed that the greatest magnitudes of residual stresses are parallel to the scan vector and the scan vector direction determines the direction of primary residual stress. Residual stresses can be controlled by the scanning strategy, but it requires a high amount of designing and planning. Many characteristics of the component can be controlled during the printing but usually, the printed components are treated with different post-processing methods. These methods to control and mitigate residual stresses include heat treatments, shot and laser shock peening [
22,
23] and machining [
15]. In addition, other traditional surface treatments could be applied, such as abrasive blasting, electropolishing and plasma spraying. Surface finish optimization can also be done to improve the corrosion resistance of the component [
24]. Other reasons for post-processing are to increase the density of component, tailor the mechanical properties [
15] or homogenize the microstructure [
3,
15], for instance.
The post-processing for residual stress controlling of AM 316L often includes a stress relief annealing heat treatment (“a build-on-plate stress relief heat treatment” [
15]). Shiomi et al. [
25] stated that the post-annealing reduces the residual stresses with 70% of the as-built AM component manufactured from chrome molybdenum steel (JIS SCM440) powder mixed with copper phosphate and nickel powders. The stress relief annealing can be done in different steps: at first, the lower temperatures are used for relieving the residual stresses and then higher temperatures for microstructure manipulation to produce microstructures involving recrystallized equiaxed grains [
26]. Kirka et al. [
27] reported for EB-PBF built Alloy 718 that the equiaxed grain structure could be beneficial for the applications demanding isotropic mechanical properties. Cruz et al. [
28] studied AM 316L specimens subjected to three different stress-relieving heat treatments generating different residual stresses after printing. They concluded that after 4 h at 400 °C, no microstructural variations were found, and the cellular substructure became invisible after 5 min at 1100 °C [
28], whereas the magnitude of the residual stress was closely related to the temperature and duration of the heat treatment and the varying temperatures produced 23%, 64% and 92% stress relief at 400 °C for 4 h, 650 °C for 2 h, and 1100 °C for 5 min heat-treated specimens, respectively.
Mechanical treatments such as a shot peening (SP) as a post-treatment are used to improve the as-built surface quality [
29]. The shot peening also offers beneficial compressive residual stresses to the component surface and subsurface. In addition, some novel post-processing methods have been studied. Chen et al. [
24] used laser polishing for a stainless-steel 316L surface and studied the corrosion behavior. The laser polishing melts the top surface and therefore reduces the surface roughness. Additionally, it was observed to refine the columnar structure in as-built sample into a fine cellular structure. The surface roughness reduction and a fine cellular structure were also noticed to improve the corrosion resistance. Wang et al. [
23] utilized an ultrasonic impact peening and a laser shot peening for AM 316L. They noticed the different effects of the two methods on the surface hardness, yield strength and tendency of producing mechanical twins to the surface layer. Therefore, it can be stated that the different post-processing methods would provide lots of tools to manipulate or to tailor the surface layer characteristics [
22,
23].
Even though traditional stainless-steel 316L has a good corrosion resistance and it is used in demanding applications where superior corrosion resistance is needed, the very aggressive environments may cause pitting corrosion in chloride-bearing environments [
30]. The corrosion responses of AM 316L have not been widely studied and more research in this field is definitely needed. For example, the porosity has been noticed to affect the corrosion properties of the AM component. Cruz et al. [
28] used AM 316L specimens (three different stress-relieving heat treatments generating different residual stresses after printing) for pitting corrosion behavior tests in acidic FeCl
3 solution. The weight loss measurements after exposure showed that the residual stress did not significantly impact the kinetics of pitting to AM 316L samples. New properties of the AM components have merited testing under simulated operation conditions. Lou et al. [
31] studied the AM 316L in a high-temperature annealed condition and its stress corrosion cracking (SCC) in high-temperature water (288 °C) with either dissolved oxygen or hydrogen. They did not find any significant differences in crack growth rate between AM and traditionally manufactured 316L. However, the intragranular oxide inclusions on grain boundaries were found to cause oxidation and cracking.
In the present study, basic sheet AM 316L components were characterized by the presence of residual stress, distinct microstructural features, etc., which could be detrimental in an actual working environment. In order to change the traditional manufacturing method of certain 316L components to AM, thorough characterization is needed to verify the suitability of AM components. Therefore, it is important to study these components and the post-processing methods and investigate their effect on the microstructure, residual stress formation and corrosion behavior. On very demanding corrosion atmospheres, the question is does AM lower or eliminate the risk of SCC compared to the welded 316L component? Here, the AM 316L samples were tested in different conditions: as-built, stress relief annealed and shot peened. A systematic investigation of surface and subsurface residual stresses as well as microstructure was also done in as-built and post-treated conditions. The SCC behavior of the selected samples was also investigated. In our future work, we will study more complex AM 316L shapes after different shot peening post-processing variations to consider the effects of the shape. The complex shapes might need more adjustment of the correct post-processing and may influence the functionality of the component in demanding conditions.
2. Materials and Methods
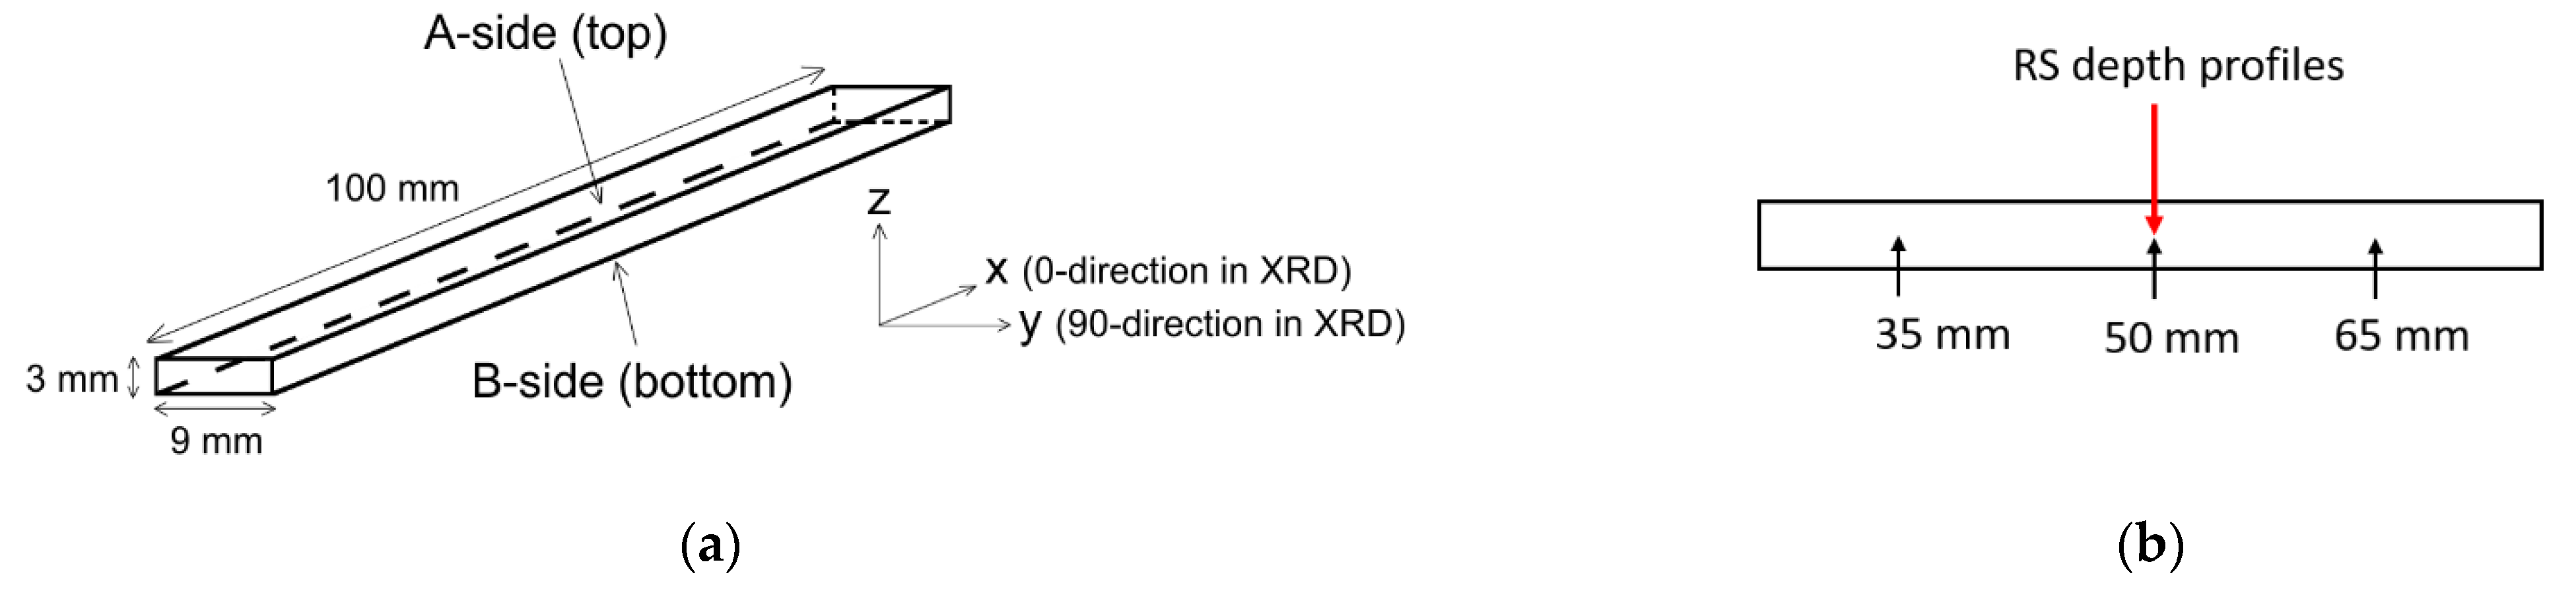
In this study, simple strip geometry samples were printed with L-PBF and studied with various material characterization methods. The high molybdenum austenitic stainless steel (EN 1.4432) 316L powder was used in AM (
Table 1) manufactured by EOS Finland. The AM samples were manufactured to match B-type U-bend samples according to American Society for testing and Materials (ASTM) G30 [
32], giving them dimensions of 100 mm × 9 mm × 3 mm, as illustrated in
Figure 1. For the reference in the SP and immersion tests, similar samples (100 mm × 9 mm) were cut from the cold-rolled sheet. Low molybdenum variant 316L (EN 1.4404) was used for the shot peening and high molybdenum variant 316L (EN 1.4432) for the immersion tests. The low molybdenum variant was provided in 3 mm thick sheets, while the high molybdenum variant was only available in 1.95 mm thick sheets.
The AM strip samples were manufactured by 3DFormtech (Jyväskylä, Finland) with an EOS M290 L-PBF machine (Krailling, Germany) to a solid support structure. In total, 11 samples were printed to the solid structure build plate, at the same time, the 100 mm × 9 mm surface was parallel to the build plate. All samples were oriented in the same direction and they were located on two columns side by side with six or five samples on separate rows, one below another. The printing parameters were the standard recommended settings given by EOS-printing software. Hatch angle rotation of 47° and layer height of 40 µm was used. The edges of samples were printed with 100 W laser power and 900 mm/s scanning speed. The infill was done with 214 W laser power, 928 mm/s scanning speed and 100 µm hatch spacing. The top surfaces of the samples were printed with 150 W laser power, 515 mm/s scanning speed and 100 µm hatch spacing. The bottom sides of the samples were printed with the infill parameters. Eleven strips were treated with four different post-process treatments introduced in the process diagram in
Figure 2. After the printing, five as-built samples were cut from the build plate with a band saw. The remaining six on the build plate were heat-treated with a stress relief annealing at 1030 °C for 60 min under vacuum. The samples were cooled using flowing nitrogen gas. After this, the remaining samples were cut from the build plate using a band saw.
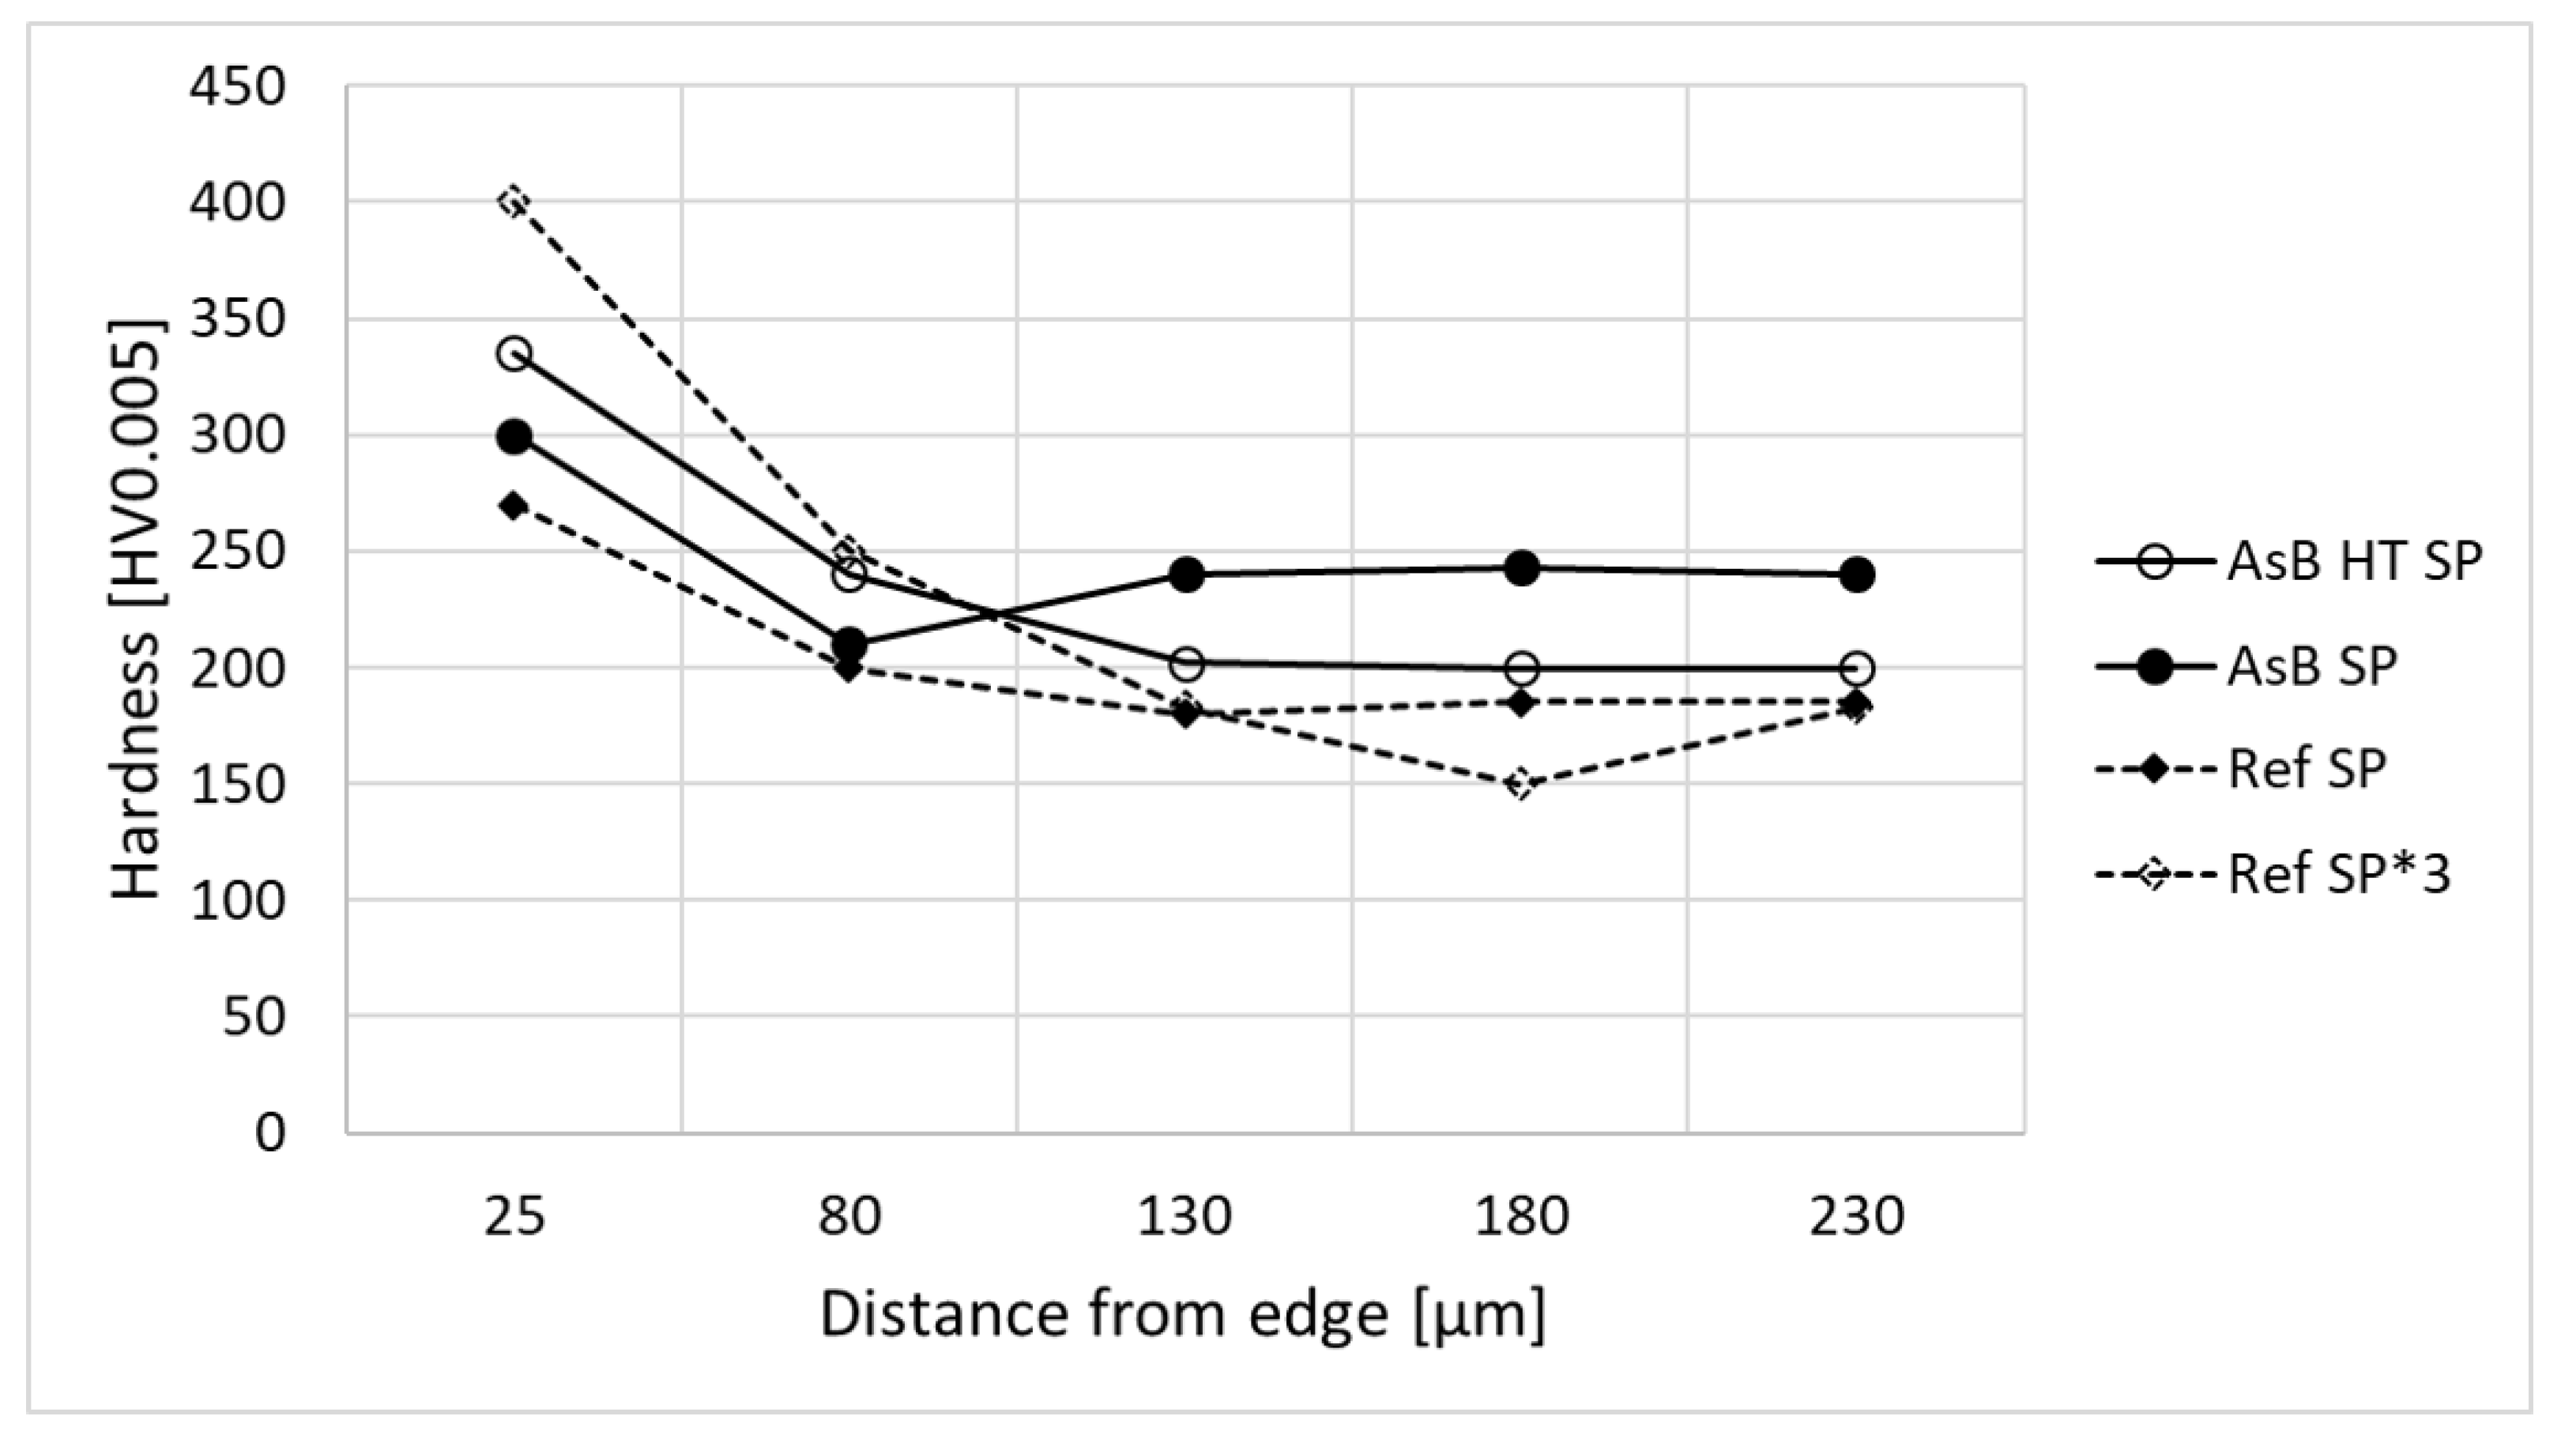
Shot peening was done as a post-treatment for two as-built samples, for three stress relief annealed samples and for three reference samples. The shot peening was carried out in the manual shot peening (SP) cabinet with silicon carbide (SiC) shots with hardness reported at 2000 HV [
34], being much harder than the samples (as-built average hardness 220 HV
0.05). Pressure in the SP system was 7 bar, and the flow rate of the shots were calculated to be 11.4 g/s. The peening was carried out at a 20 cm distance from the sample surface for either 1, 2 or a total of 3 s per surface. Overall, three of the samples were in the as-built (AsB) condition, three were stress relief annealed (AsB HT), three were both annealed and shot peened (HT SP), two samples were as-built and shot peened (AsB SP) and three reference samples were shot peened, as illustrated in
Figure 2.
The metallographic cross-sectional samples were prepared by grinding them with 320–4000 SiC papers and then electrolytical polisher (Struers, Ballerup, Denmark) with 10% oxalic acid using 10 s etching time, 20 V as the voltage and a flow rate of 10. The hardness depth profiles were done from the cross-sectional samples using the MMT-X7 (Matsuzawa, Toshima, Japan) microhardness measurement device with a test load of 50 g.
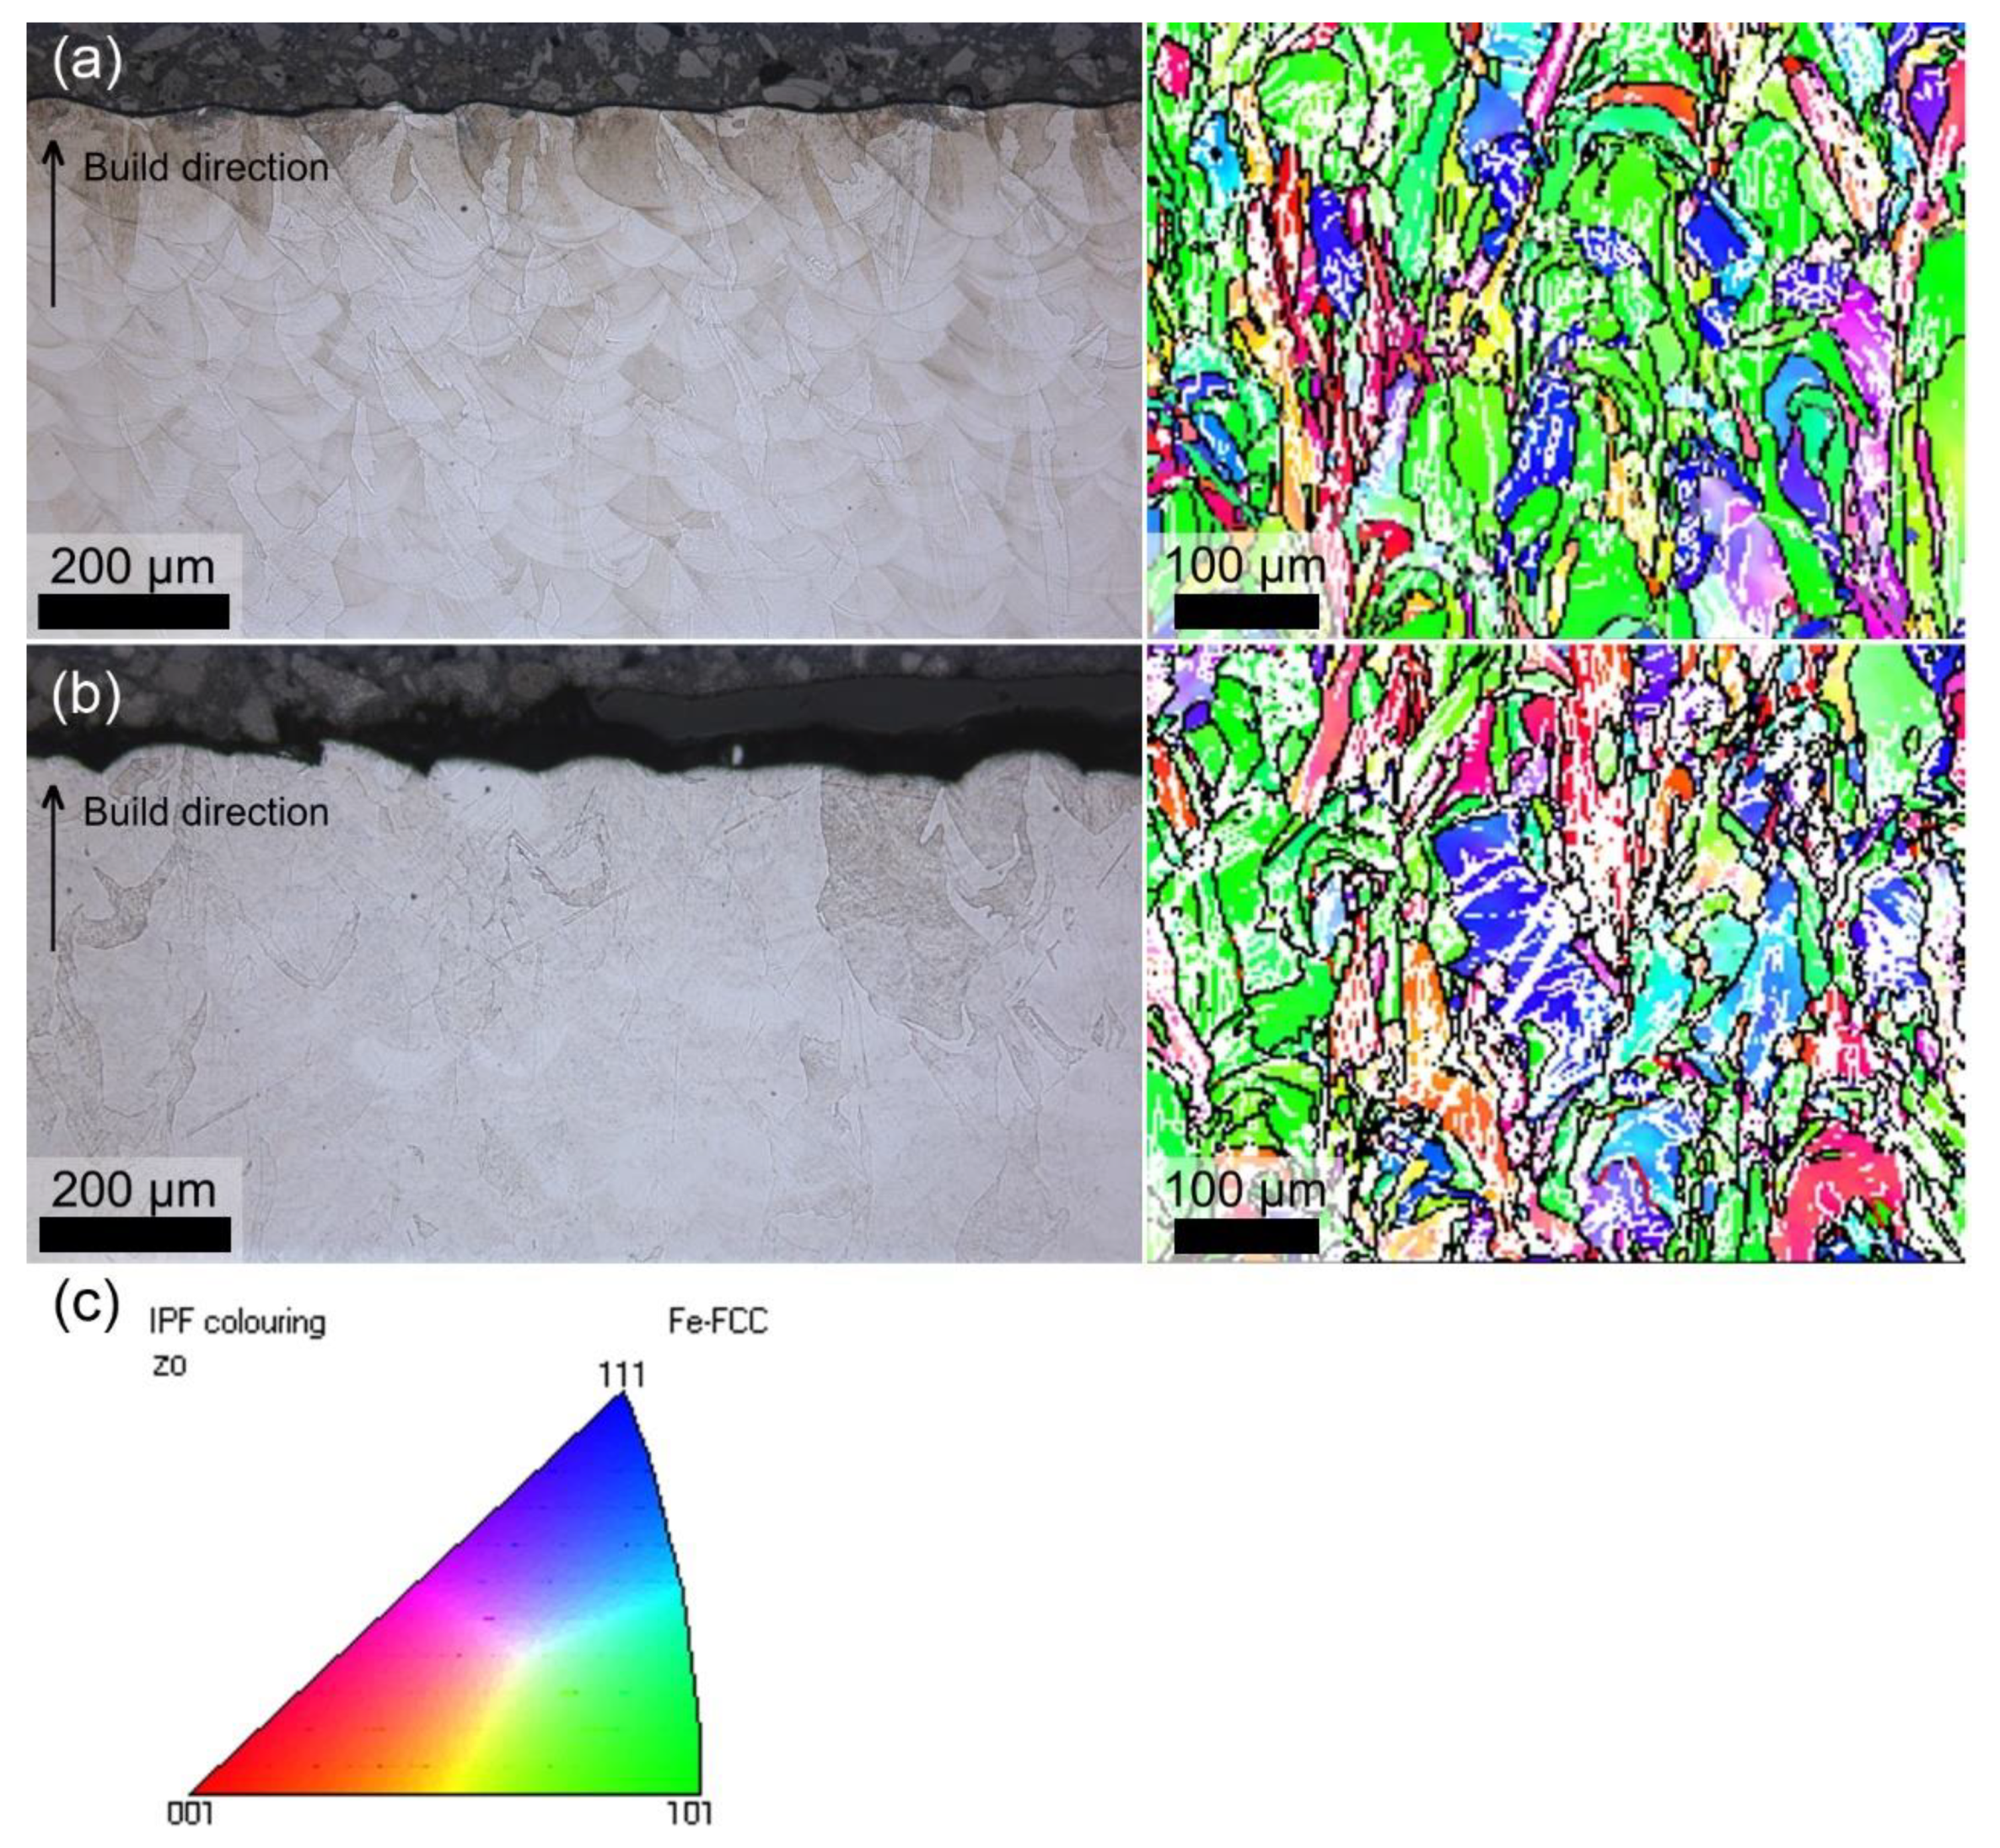
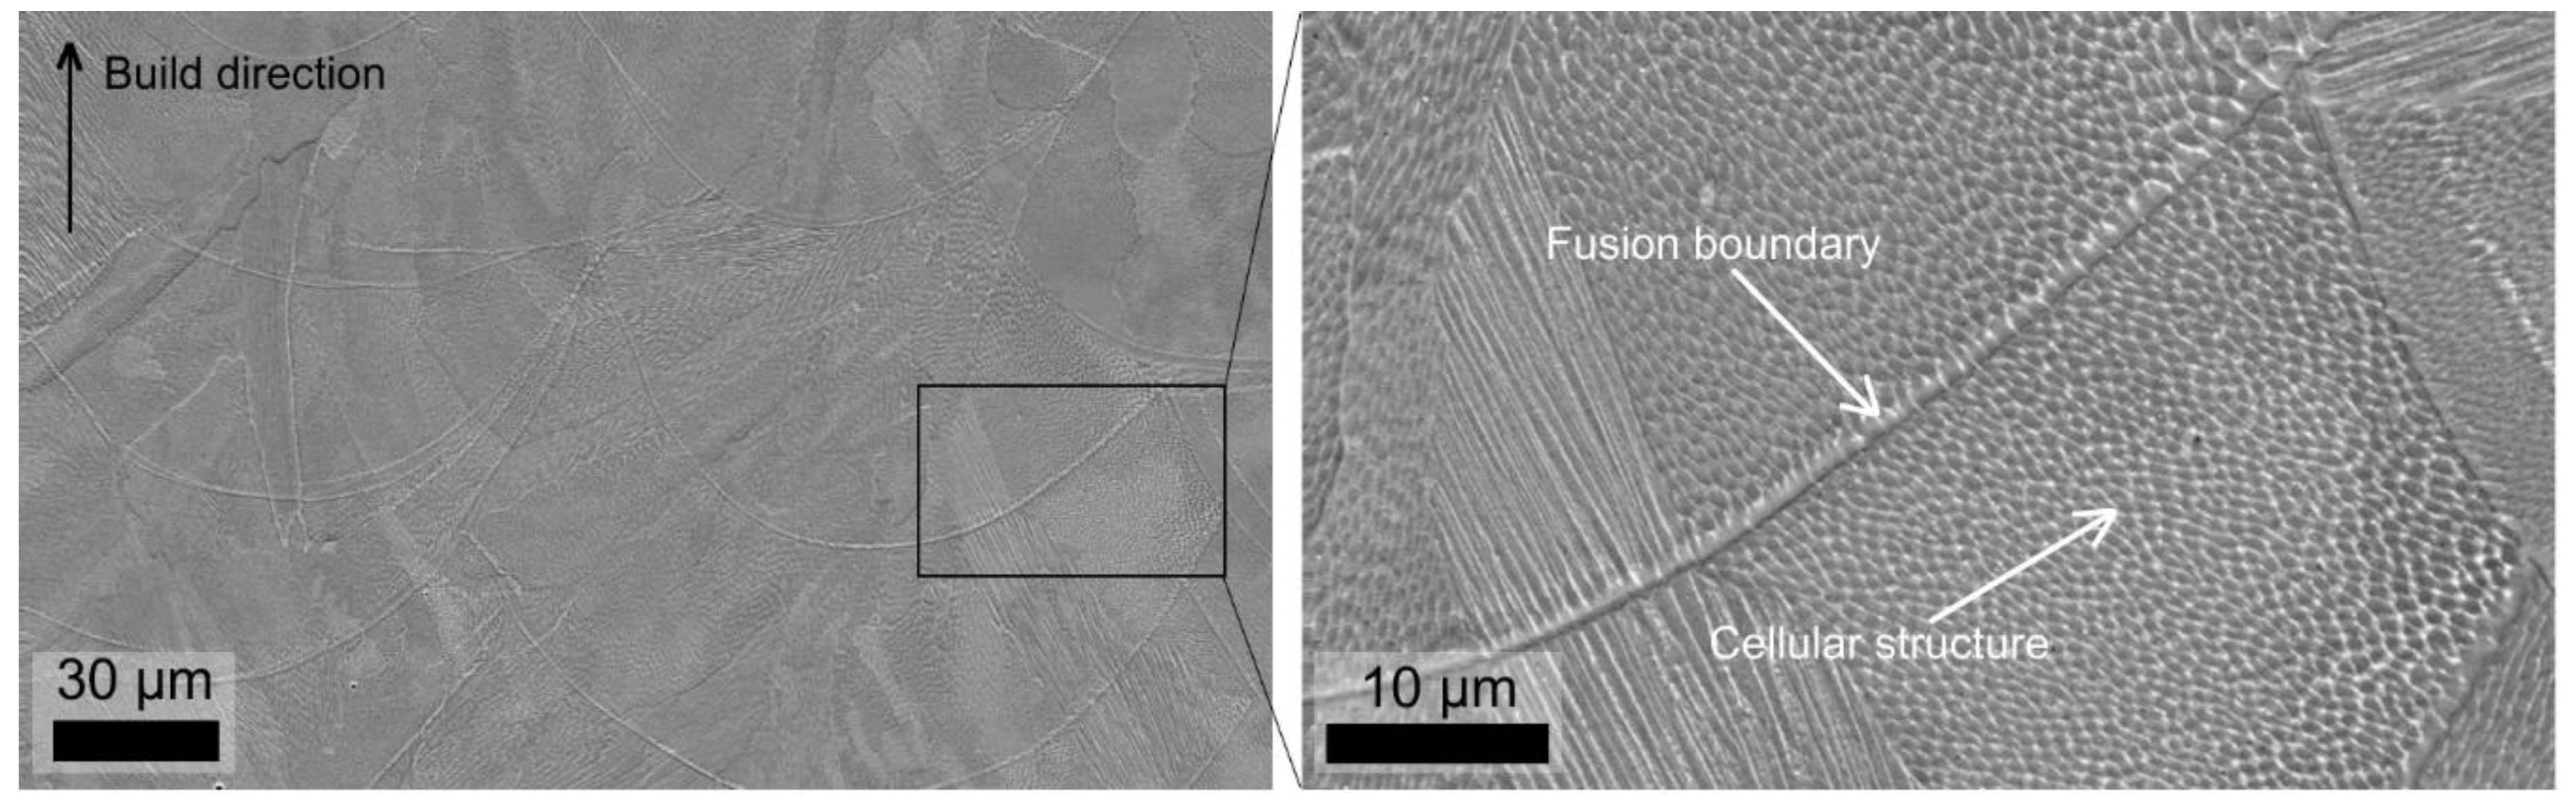
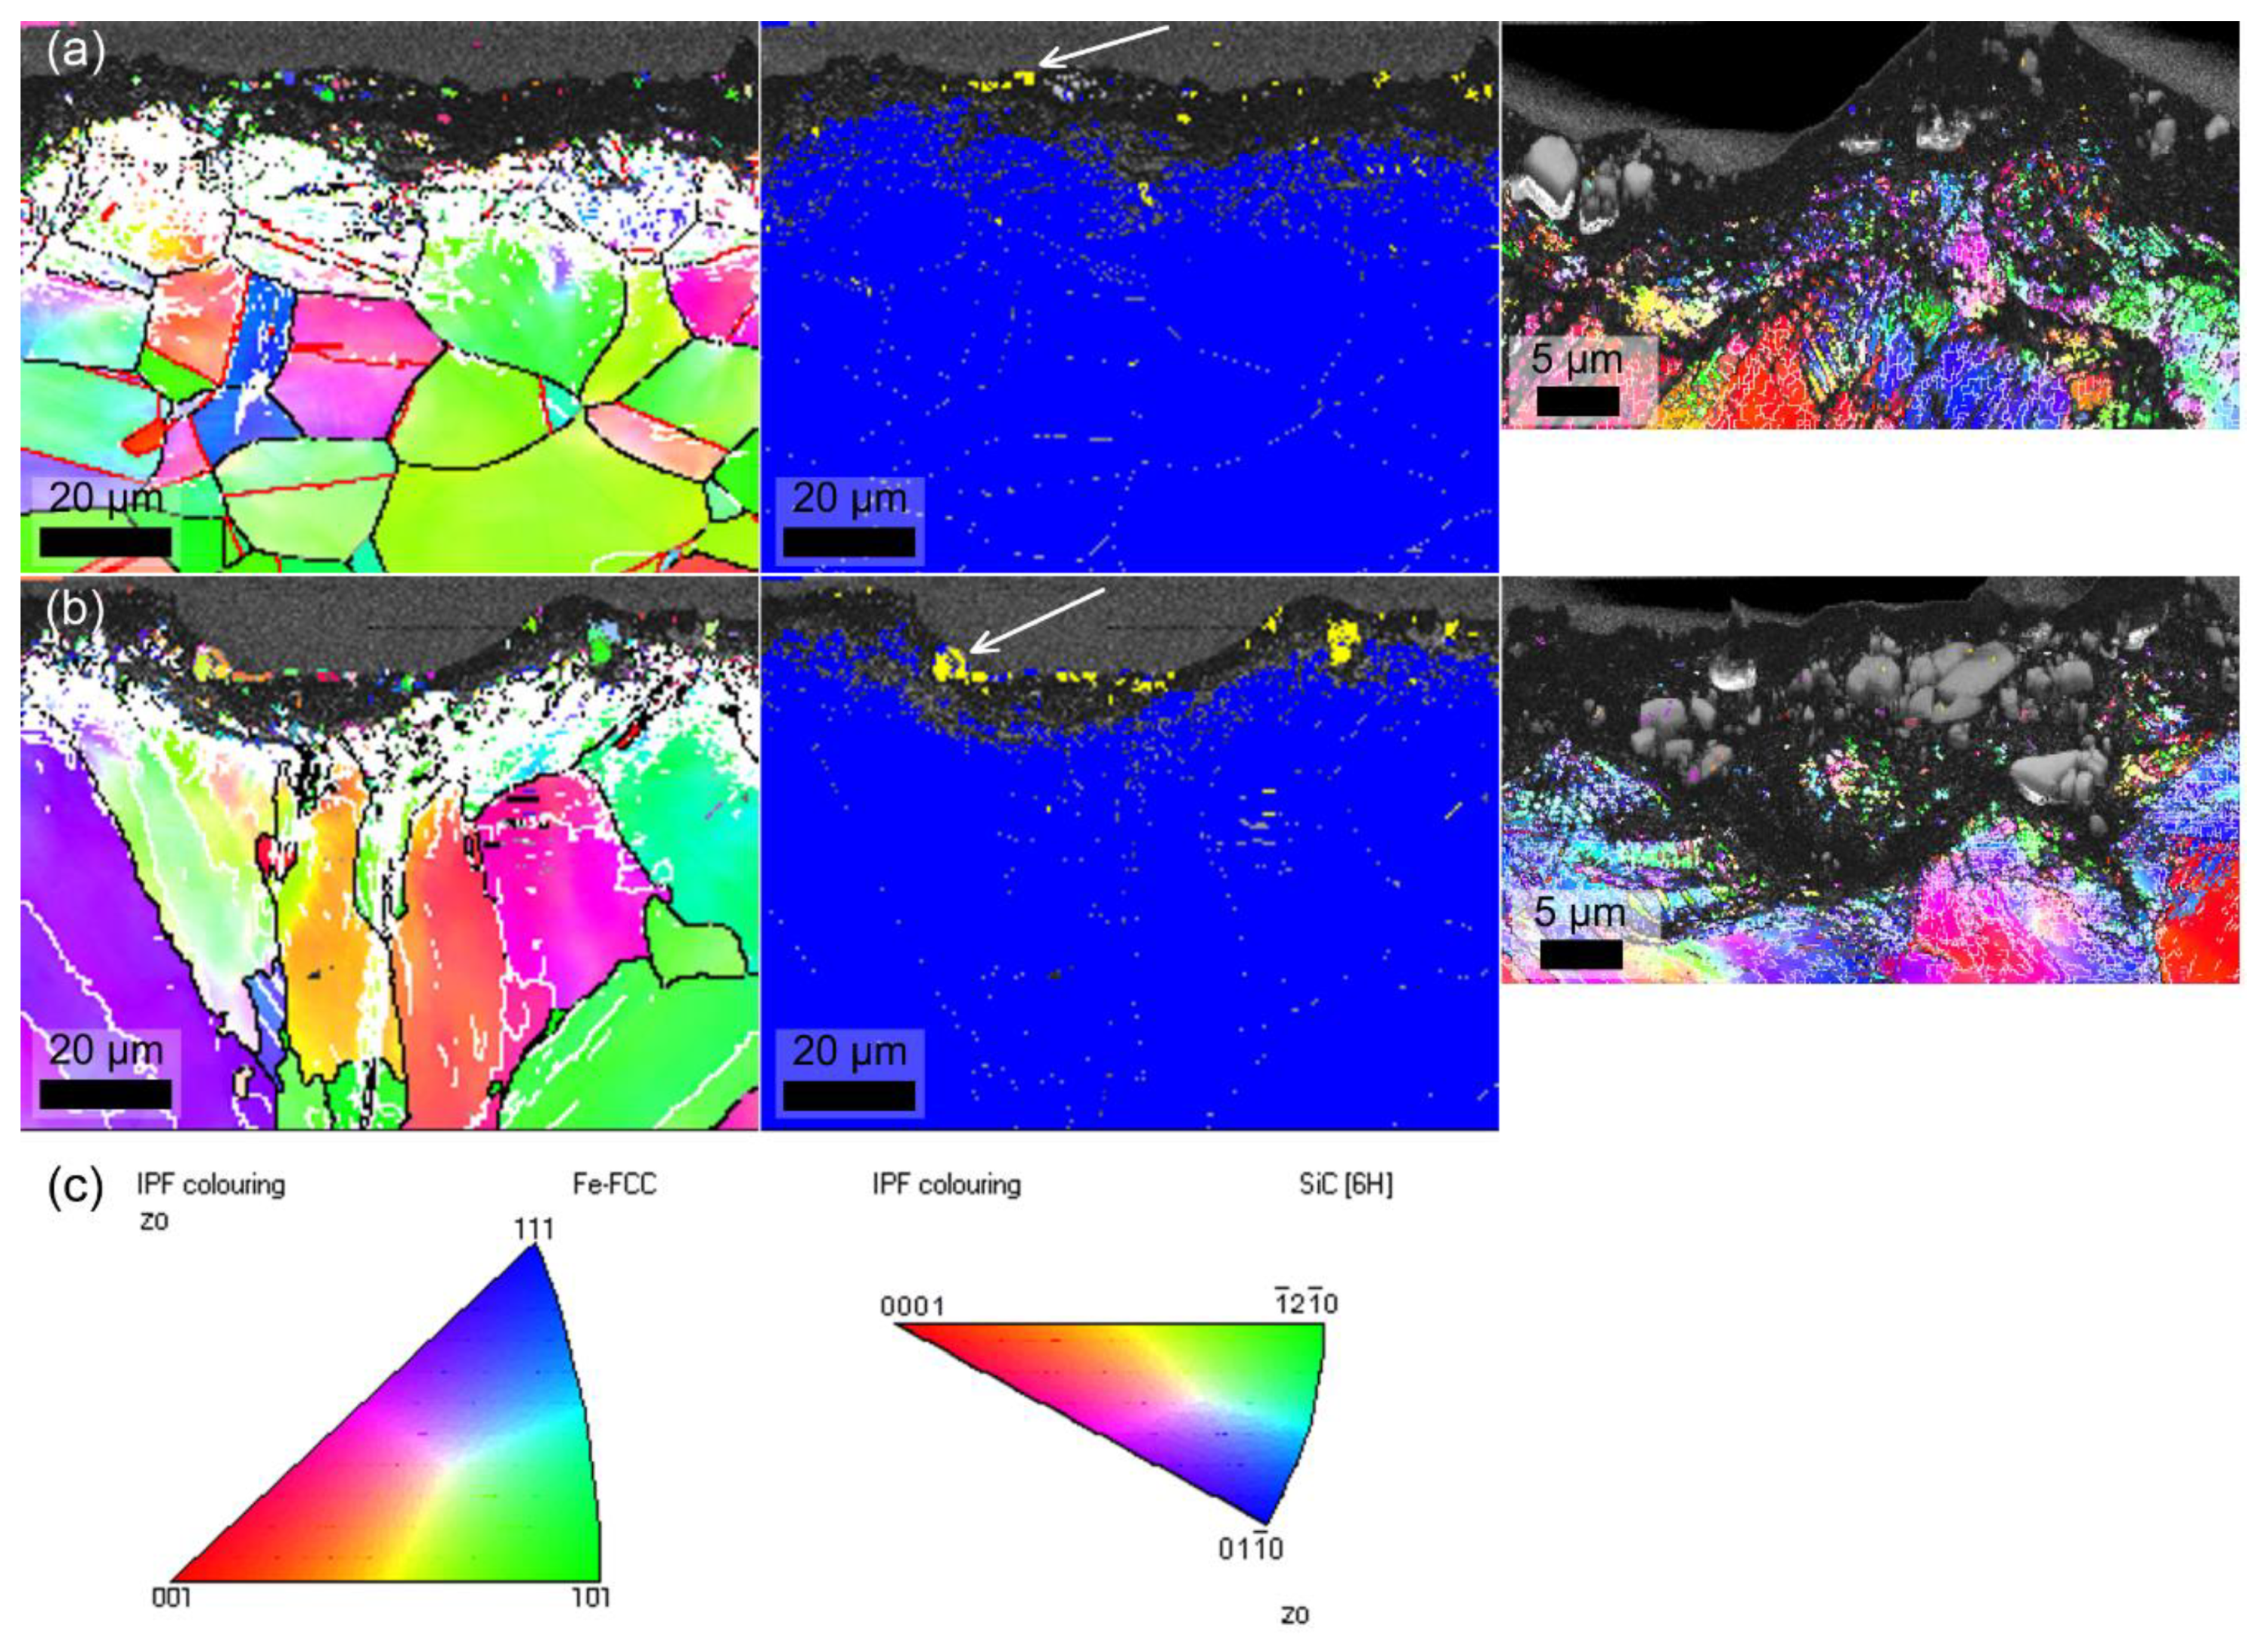
The microstructure of the cross-sectional samples was studied by an optical microscope DM 2500 M (Leica Microsystems, Renens, Switzerland) and a field emission scanning microscope (FESEM) ULTRAplus (Zeiss, Jena, Germany). The microstructure of the samples was also studied by a Symmetry electron backscatter diffraction (EBSD) system (Oxford Instruments, Abingdon, United Kingdom) combined to the FESEM. A step size of 0.15 µm and an acceleration voltage of 15 kV were used. The cross-sectional EBSD samples were prepared by a traditional metallographic method followed by a final polishing using colloidal silica suspension (0.04 µm). The EBSD data were collected by the AZtec software (Oxford Instruments, Abingdon, United Kingdom) and post-processed and analyzed by the CHANNEL 5 software (Oxford Instruments, Abingdon, United Kingdom). In the EBSD results, a band contrast (BC) map represents the quality of the Kikuchi diffraction pattern for each measurement pixel. In the BC map, bright color means that the pattern quality is good, and the crystal orientation can be determined. Black signifies that the pattern quality is poor, and indexing is not possible. The colors in the inverse pole figure (IPF) maps correspond to the crystallographic orientations parallel to the observed plane (z direction), as indicated by a colored stereographic triangle, i.e., an IPF coloring key. Different boundaries were also analyzed and marked on the BC + IPF maps. Low-angle boundaries were considered when the misorientation angle was 2–10°, high-angle boundaries with the angles >10° and twin boundaries (Σ3) were defined by a 60° misorientation along the axis <111>. Phase maps show the distribution of iron and silicon carbide.
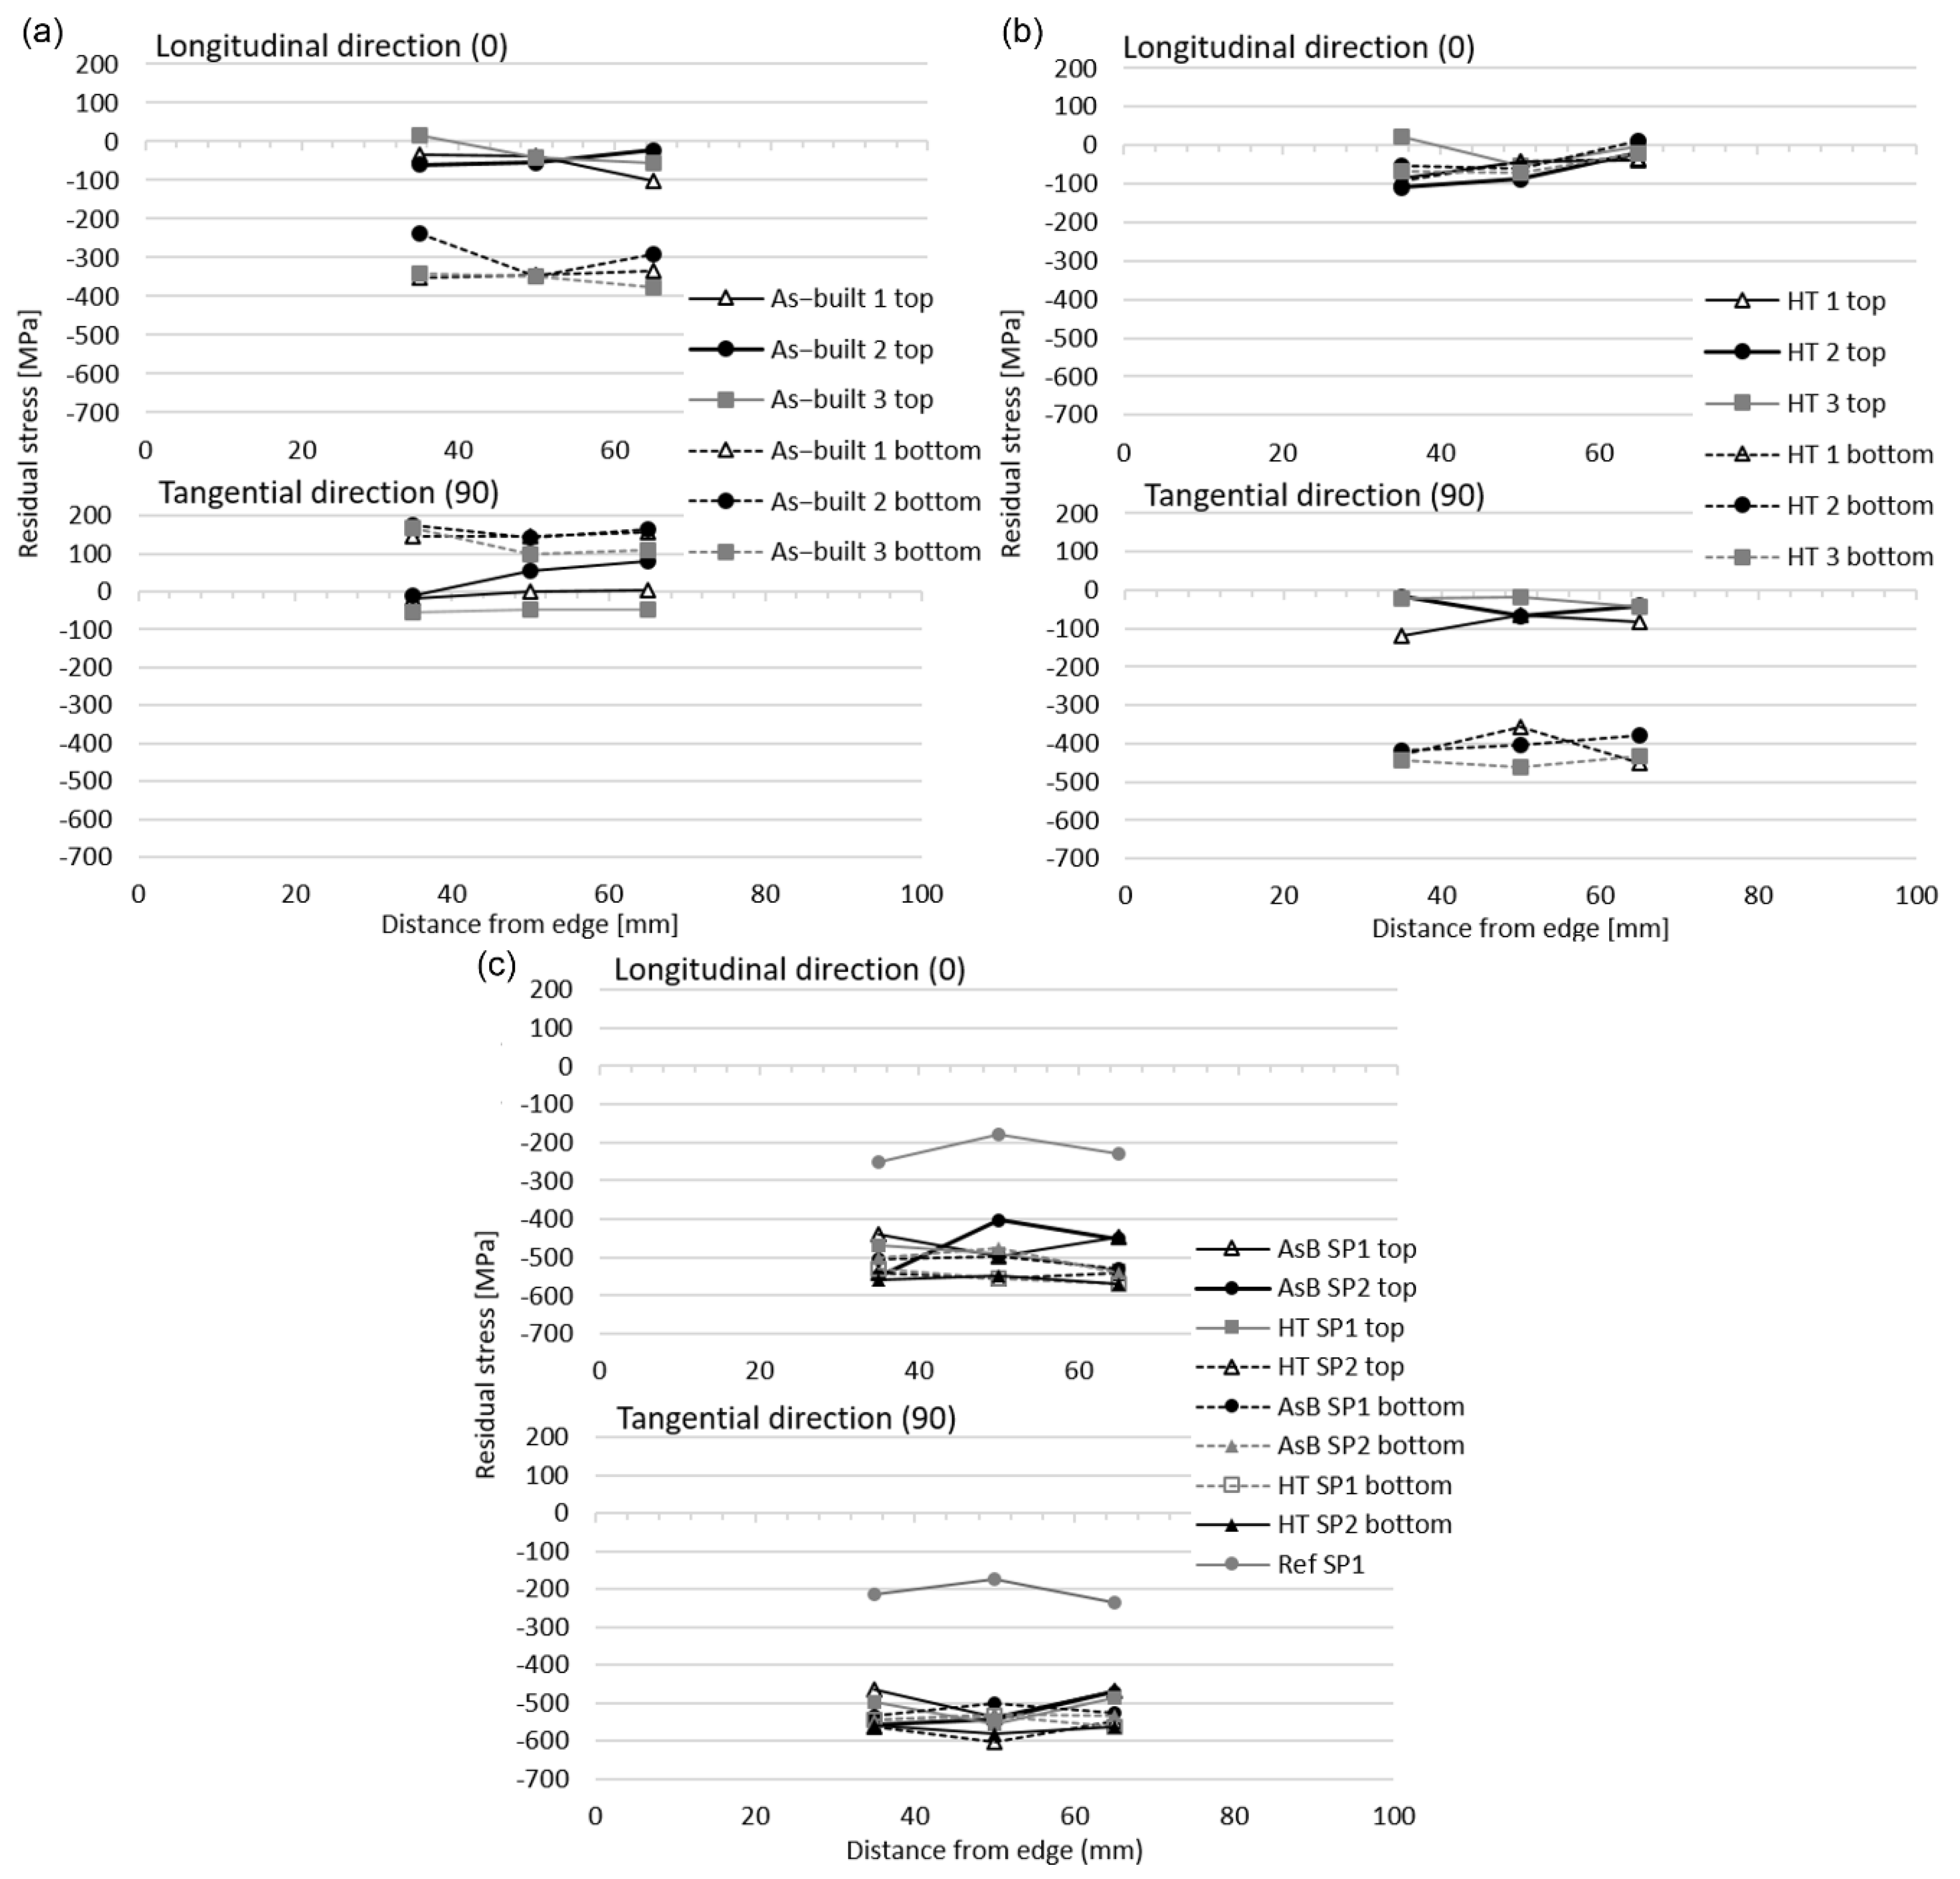
The residual stresses (RS) were measured with a portable X-ray diffraction (XRD)-based system XStress 3000 residual stress diffractometer (Stresstech Oy, Jyväskylä, Finland) with the modified Chi method [
35]. Measurements from all the samples were done along the longitudinal (0) and transverse directions (90) in relation to the specimen surfaces (illustrated in
Figure 1a). The residual stresses from an austenitic steel at lattice plane (311) with a diffraction angle of 148.9° were used with chromium K beta radiation. Measurements were done with 3 mm diameter collimator. In total, six different surface RS measurements were taken from one sample (
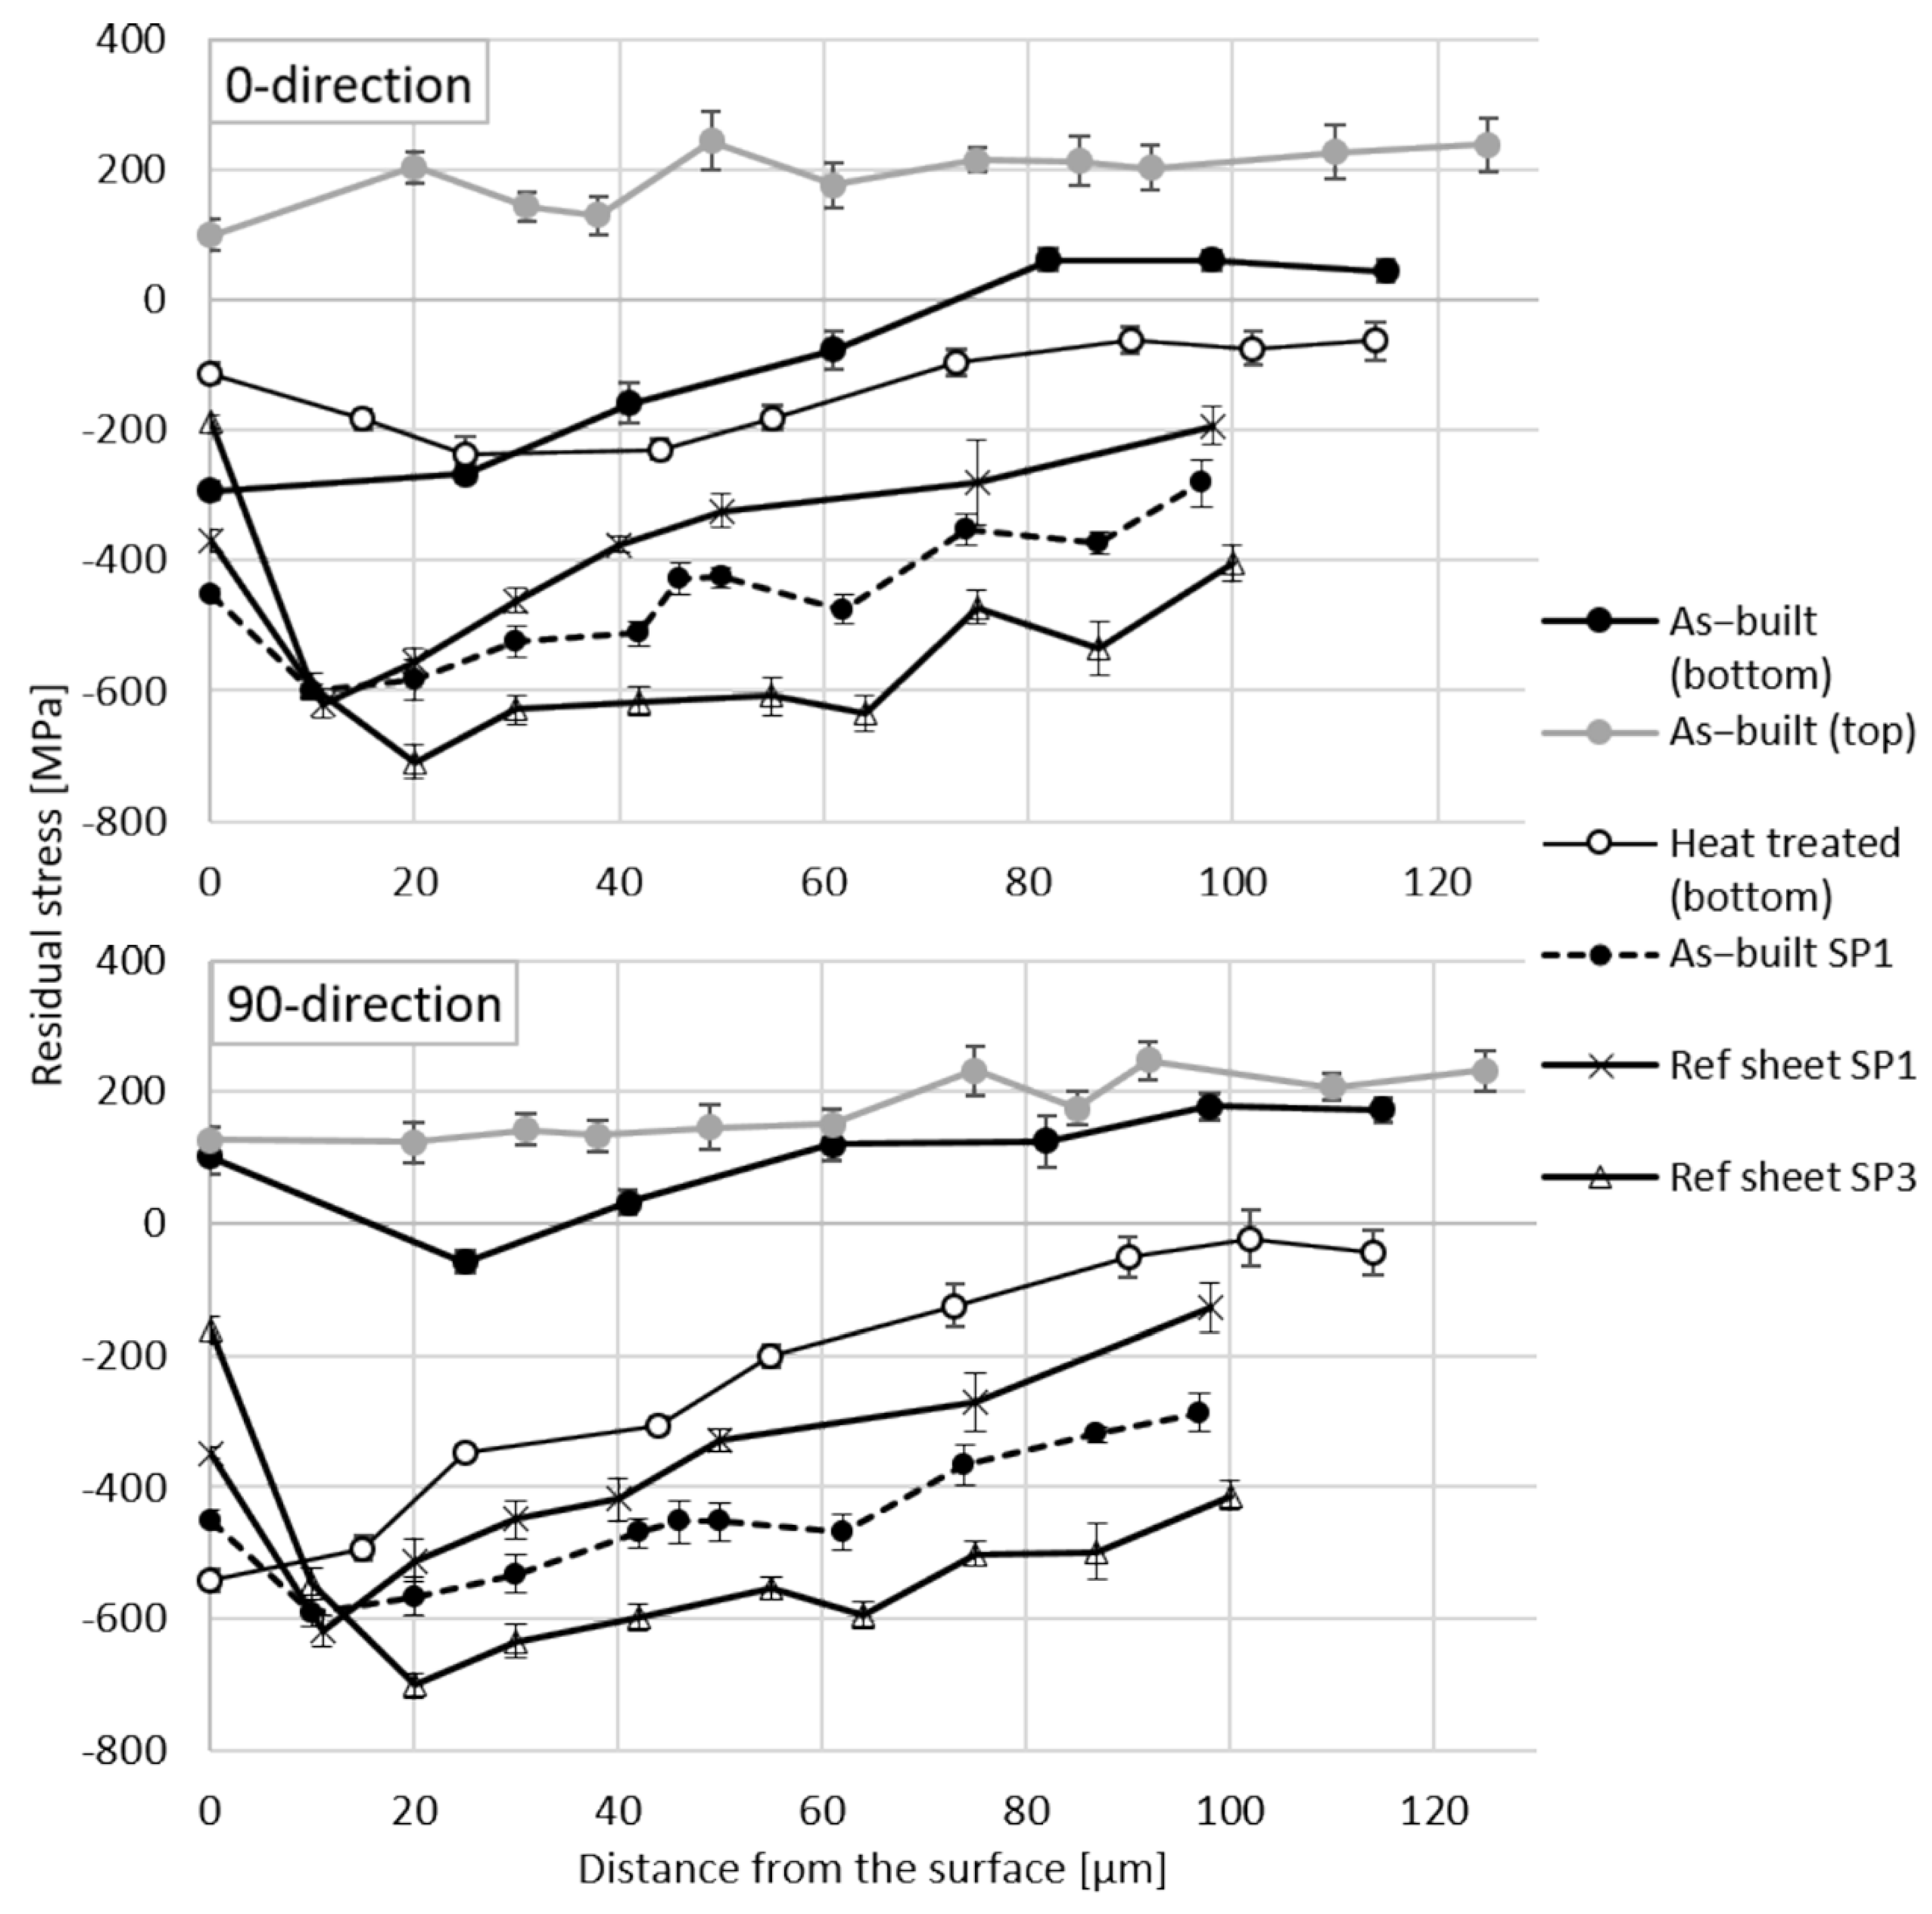
Figure 1b). The measurement locations were from both surfaces A (top) and B (bottom), from 35, 50 and 65 mm from the other end in the centerline of the sheet sample. One of the locations (50 mm) was in the middle of the samples. Residual stress depth profiles were taken from as-built, HT and reference samples together with certain shot peened samples (one reference sheet, as-built and shot peened sample). At first, the surface residual stress measurement was done. Next, material was removed by electrolytical polishing with the MoviPol-5 electrolytical polisher (Struers, Ballerup, Denmark) with A2 electrolyte containing perchloric acid and ethanol. The removed layer was measured with a dial gage. This routine was repeated up to 100–120 µm depth below the surface.
In order to verify the SCC behavior, the corrosion testing was performed in two test series containing one as-built AM sample, one stress relief annealed AM sample and two reference samples. One reference sample had high Mo content and other was similar, having a weld in the middle. The samples were fixed to specially prepared 4-point bending rigs manufactured from aluminum and painted with epoxy paint. The immersion was performed at 80 °C in a thermal cabinet in a 50% magnesium chloride solution with 75% of yield strength condition with the 4-point bending rigs. The corrosion test series exposure times were 237 and 674 h for two separate test series. After the immersion tests, sample cross-sections were analyzed with an optical microscope in order to reveal possible stress corrosion cracks.
4. Discussion
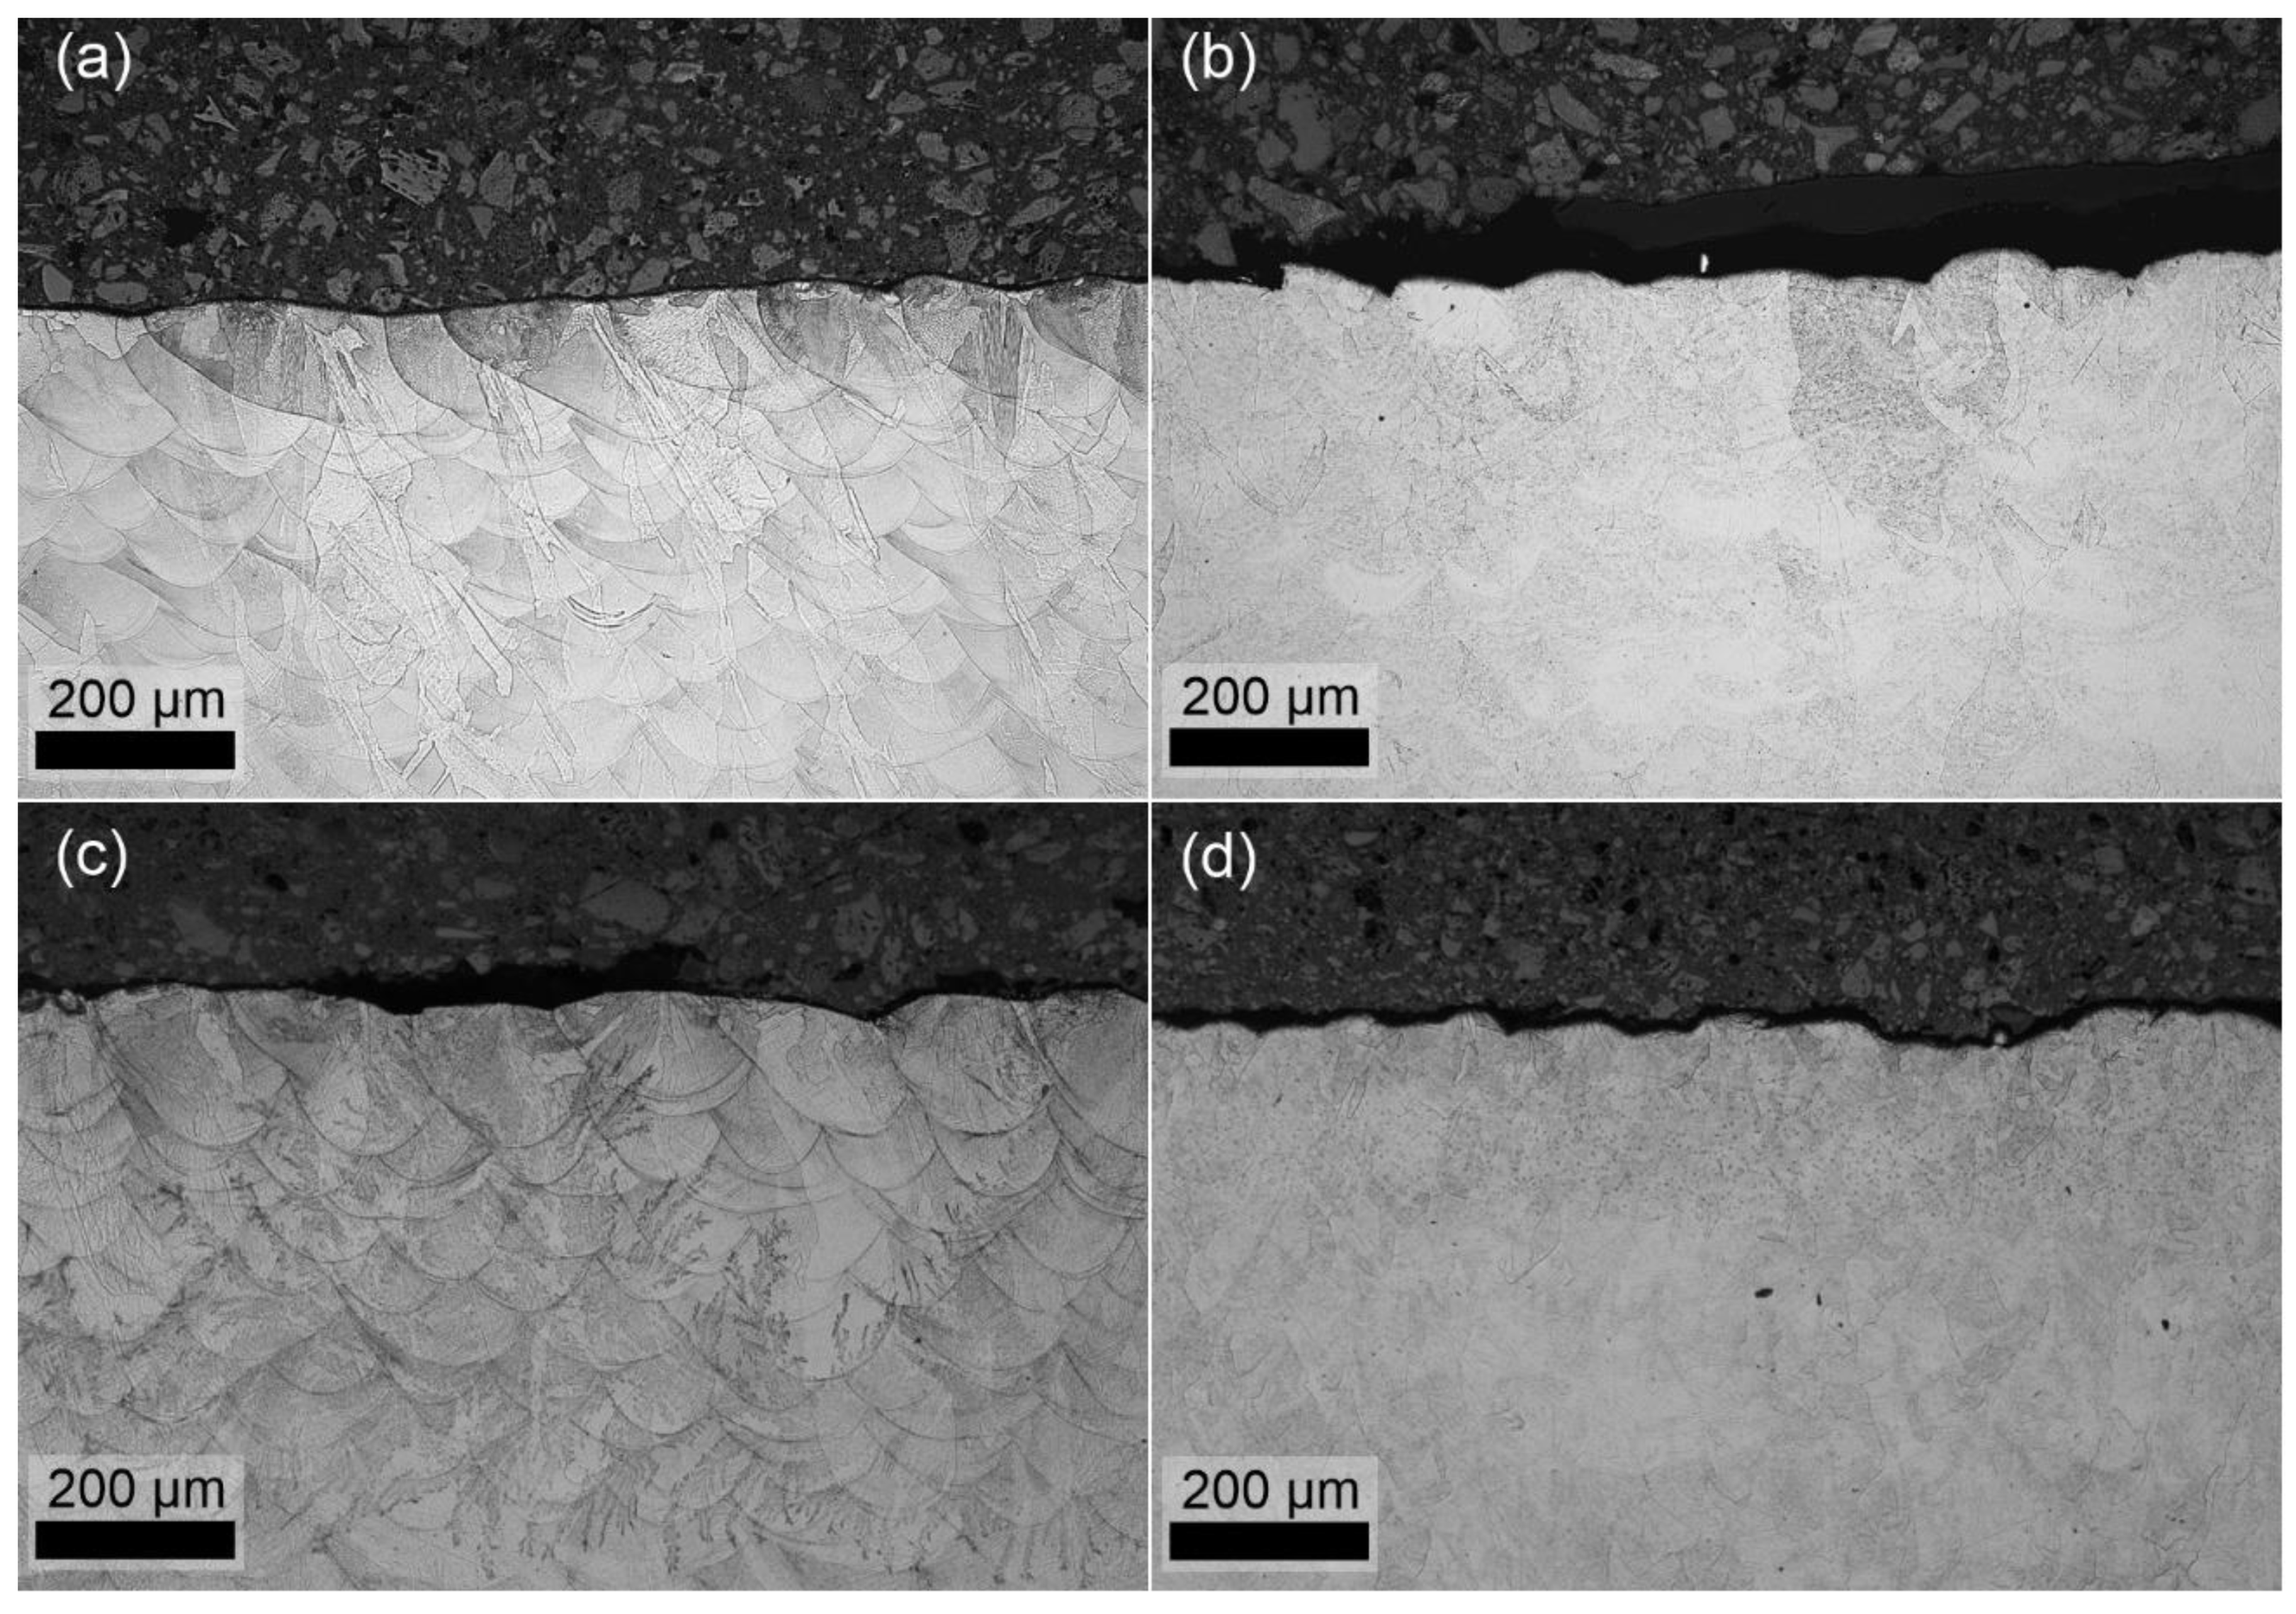
Different post-processing treatments (as-built, stress relief annealed and shot peening) for simple AM 316L samples were investigated and their effect on the residual stress state and microstructure were determined. The microstructures of AsB AM 316L consisted of bowl-shaped fusion boundary structures and the elongated, different-sized grains were oriented parallel to the build direction. In addition, there were many low-angle boundaries within the austenitic grains, agreeing with the literature that a large fraction of low-angle grain boundaries exist in AM 316L, e.g., References [
9,
14]. The melt pool boundaries were no longer as visible in the stress relief annealed AM sample compared to the as-built sample. The AsB sample contained cellular structure within the grains which changed at the austenite grain boundaries, and some of the grains continued across the fusion boundaries. This kind of hierarchical and inhomogeneous microstructure is typical for AM 316L [
9,
14,
36].
Microstructural studies showed that the bulk reference sheet sample consisted of homogenous, round-shaped austenite grains with some twin boundaries (Σ3), considered as annealing twins. All studied samples had a non-indexable or weakly identified 10–20 µm thick surface layer, indicating the formation of extremely refined or heavily deformed crystals during the SP. Below this surface layer, many strain-induced, mainly low-angle, boundaries were formed within the austenitic grains. Very small amount of martensite was observed in the subsurface layer of the reference sample. However, martensite was not observed from AM samples. The hardness depth profiles of the cross-sectional samples verified the increased hardness values after the SP in the subsurface layer, probably because of the grain refinement and formation of low-angle boundaries. Our findings here agree well with the literature. Based on the studies by Shakhova et al. [
37], cold-working of conventional austenitic stainless-steel results in strain-induced boundaries, mainly associated with deformation twin boundaries, and then a martensitic transformation starts primarily at these twins. Both strain-induced martensitic transformation and deformation twins promote the grain refinement [
37]. Hong et al. [
14] noticed that in the AM 316L sample, no martensite and deformation twins existed after a tensile test at room temperature. They assumed that the high density of low-angle boundaries and a fine cellular microstructure hinder dislocation slip and deformation twinning, decreasing the nucleation sites for martensite. Pham et al. [
38] noticed deformation-induced twins (Σ3) in AM 316L after tensile tests at room temperature but no martensite transformation.
AsB AM components had different surface residual stresses on the top and bottom surfaces. One reason for this is the different printing parameters on the top and bottom surfaces. In addition, a sample removal with a band saw from the build plate affected the bottom surface stresses. The difference in residual stress values between measurement directions in the as-built samples can be explained by the fact that they have different orientation on the build plate while printing, or that the sample had different orientation during band sawing. It should be noted that the surface residual stresses on all as-built samples (1, 2, 3) had variations between the different measurement locations on the AM strip and some variations existed also on the band saw bottom surface results. In addition, normally, the components are removed from the build plate after the heat treatment. The causes for the surface residual stress variations might also be the anisotropic heat removal and re-melting of previous layers producing thermal gradients and their effects on the produced residual stresses [
16,
21]. The surface residual stress results from the top surfaces of the as-built samples are similar to the results reported by Ghasri-Khouzani et al. [
18] with 5 mm thick disks of 316L after being removed from the build plate. The varying residual stresses in the different surface regions may be caused by the heterogeneous microstructure and the location-dependent lattice spacings, as suggested in Li et al. [
15].
The annealing treatment was noticed to decrease the surface residual stresses compared to the AsB samples in top and bottom surfaces. One reason for the different stress levels for the bottom surface is that the heat-treated samples were cut in a different orientation than the as-built samples, which was verified by visual observations of the cutting marks on the samples. When comparing the top surface results, the stress state was, somewhat unexpectedly, slightly more compressive in the annealed sample than in the as-built sample. The stress state after the heat treatment was expected to be more homogeneous and stress-free. Regardless of the original AM condition (as-built or heat-treated), the post-processing shot peening decreased the surface residual stress results approximately −400 to −600 MPa in both directions. Even if the SP was rather quick, it produced notable compressive residual stresses.
The AsB sample had almost a constant tensile RS depth profile in the top surface in both measured directions. This result is in line with previous studies [
18,
39]. While the metal powder is added on to the surface of the build plate, it causes the molten metal to cool rapidly and to contract. Tensile residual stresses are developing in the material as the shrinking material is constrained. Correspondingly, compressive residual stresses are developing in the build plate. These stresses are relieved when a new powder is added on the top of the first layer, while layers re-melt and new hot powder effectively anneals it [
8]. This continuous process of cooling and annealing generates a residual stress state such that the bottom of the component is in compression while the top is in tension, with a neutral axis somewhere in between.
Based on the measurements here, it is obvious that a stress state with compression at the bottom and tension at the top was present in the as-built samples if they were cut from the build plate prior to the heat treatment. The stress relief annealed samples were cut from the build plate after the heat treatment. The residual stress profile from the heat-treated bottom surface showed compressive residual stresses both in longitudinal and in transverse directions. The transverse direction showed even higher compression on the surface. The band saw might also affect 90 µm below the surface from the bottom surface because the residual stress was closer to zero, compared to the bottom surface of the as-built sample, but it still compressed.
In addition, the stress corrosion cracking resistance of AM 316L was tested in magnesium chloride atmosphere. The magnesium chloride solution was chosen as it is widely known, and it has been shown to be more aggressive than sodium chloride [
40]. Due to our testing equipment limitations, the standardized ASTM G36 boiling magnesium chloride test was not possible, but an 80 °C study was conducted. Any signs of corrosion or cracking were not detected in the AM components or reference samples. Therefore, it can be summarized that the AM components had similar tolerance against stress corrosion cracking to the 316L sheet and the sheet with the weldment. It is generally known that SCC might be rapid in sheet 316L, and the failure can occur, in the worst case, also in a short time [
41]. Some results of the SCC behavior of austenitic stainless-steels in chloride solutions have been reported. SCC of 316 stainless-steel at 3.5 and 9.35 wt.% NaCl solutions at room temperature under a constant load was studied by Elsariti and Haftirman [
41]. They [
41] reported that no cracks were detected after 404 h of exposure. After 838 h in the 9.35 wt.% NaCl solution and after 1244 h in 3.5 wt.% NaCl, the samples had cracked [
41]. The tests here were performed for AM 316L steel in 50 wt.% MgCl
2 solution at 80 °C for up to 674 h. The conditions and materials here and in Reference [
41] are quite different, making a comparison hard, but possible. 316L is generally considered to be more corrosion-resistant owing to its added molybdenum content [
42]. Elsariti’s and Haftirman’s [
41] observations about SCC in 316 steel in the 9.35 wt.% NaCl solution indicated a relation between chloride concentration and SCC incubation time. Therefore, it is surprising that no SCC was observed in our study on 316L at much higher chloride concentration at an exposure time between the two observation times of 404 and 838 h of Elsariti and Haftirman [
41]. The immersion in this study was carried out at 80 °C, while their [
41] tests were done at room temperature. The intensity of loading was not mentioned in Reference [
41], stating only that a constant load setup was used. The studied materials (316 vs 316L) were also slightly different, although 316L is generally considered more corrosion-resistant only after welding, where the low carbon content of 316L inhibits the precipitation of chromium carbides [
42]. The tensioning of the samples might have been influenced and caused the stress to be under the threshold stress required to initiate SCC. In the future, immersion tests will be performed also for the shot peened AM samples to verify the possible effect of SiC residues on the corrosion behavior.

 ,
, 


