

Abstract
We investigate the change of the neutron-skin thickness from parent to daughter nuclei involved in the cluster decay process. The neutron-skin thickness is obtained using self-consistent Hartree–Fock–Bogolyubov calculations based on Skyrme-SLy4 effective nucleon–nucleon interaction. The experimental data of the cluster decay modes observed to date indicate that the shell effect then the released energy play the predominate role of determining the spontaneous cluster decay modes. The effect of the change in the neutron-skin thickness from parent to daughter nuclei comes next to them. The cluster decay preferably proceeds to yield the least possible increase in the neutron-skin thickness of the daughter nucleus (δn). δn decreases when the isospin-asymmetry of the emitted cluster increases. The relative stability of the radioactive nucleus and its corresponding partial half-life increase for the cluster decays leading to a significant increase in the neutron-skin thickness.
Export citation and abstract BibTeX RIS
1. Introduction
For more than a century, the disintegration of the heavy nuclei into more stable lighter ones has been experimentally and theoretically investigated. The study of nuclear decays is fundamental for many crucial problems in modern nuclear physics and astrophysics. Just as the discovery of α-decay [1, 2] was a real beginning of nuclear physics, the discovery of nuclear fission [3, 4] was a landmark. In addition to spontaneous binary fission [3–5], other rare fission modes were observed in the 1940s, such as ternary [6, 7] and quaternary fission [7]. Unlike other decay modes, cluster-decay was theoretically predicted [8] four years before it was confirmed empirically [9]. Practically detected cluster decays included emission of 14C, 18,20O, 23F, 22,24–26Ne, 28–30Mg and 32,34Si clusters, leaving daughter nuclei with Z and N around the doubly magic nucleus 208Pb [10, 11].
The correlations between nuclear structure and the α and heavier cluster decay modes have been confirmed by dozens of studies [12–28]. Accurate knowledge of nuclear density distributions is essential to understand the fundamental properties of nuclear matter and the nature of nuclear force. Nuclear charge distributions of stable isotopes [29–32] and short-lived isotopes [33, 34] were accurately measured by electron scattering. Experimental efforts on the neutron distributions are mainly directed to measure the distribution root-mean-square (rms) radii [35–37] and the neutron-skin thickness [35, 38]. In general, the distributions of protons and neutrons are qualitatively and quantitatively different, and the concept of 'skin thickness' is especially important for this reason because it abstracts the difference between the two distributions as the difference between their rms radii.
In conjunction with the experimental studies, several theoretical approaches have been developed to study the nuclear structure and the density distributions. There are currently two common approaches for calculating the nuclear structure of heavy and superheavy nuclei, namely, the self-consistent Hartree–Fock–Bogolyubov (HFB) approach [39, 40] and the semi-microscopic approach [26, 41–44]. The semi-microscopic approaches show remarkable success in the calculation of nuclear masses, deformation [26, 41–44], and nuclear decays [45–48]. However, the self-consistent models outperform other models in calculating the distributions of protons and neutrons as the sum of single-particle densities, and this justifies density fluctuation in practical charge distributions that cannot be described by common analytical formulae [49, 50].
Numerous studies have indicated the importance of neutron- and proton-skin thickness in many fundamental problems in nuclear physics and astrophysics. Considering the neutron-skin thickness significantly improved the calculations [51–53]. It has also been reported that the change in the neutron- or proton-skin thickness from the parent to daughter nuclei is significantly related to the observed half-lives and determines the relative stability of parent nuclei [54]. To our knowledge, the influence of neutron-skin thickness on the cluster decay has not been investigated yet as with α-decay. In this study, we investigate the change in the thickness of neutron-skin from parent to daughter involved in the cluster decay process. The small number of confirmed cluster-emitters, which do not exceed a few tens of observed cluster decays, may be an advantage for the present study, as these few observations are hallmarks of the cluster-decays of the highest probabilities.
In the present work, we consider the self-consistent HFB calculations to extract the neutron skin thickness, and the preformed cluster approach to deduce the cluster-decay calculation. The studied decays cover the whole set of experimentally observed cluster-decay modes, in addition to investigating the decays of the U isotopic chain in order to understand the difference between the observed and the less likely decays. We organize the paper in four sections. The theoretical approaches used to obtain the neutron-skin thickness and to calculate the half-life against cluster decay are outlined in section 2. Both the structure and the necessary decay calculations are performed using mean-field methods based on the same Skyrme-SLy4 NN interaction. In section 3, we present and discuss the obtained results. Section 4 is devoted for the drawn conclusions.
2. Theoretical framework
The calculations in the current study are divided into two main parts. The first part includes the calculation of the nuclear structure to infer the neutron skin thickness, which is done in the framework of Skyrme HFB approach. The second part includes the cluster-decay calculations and it is performed within the cluster model.
In HFB approach, both the mean-field and the pairing field are treated self-consistently in an iterative optimization procedure. With Skyrme forces, the HFB energy has the form of a local energy density functional,

where the energy density  is the sum of the mean-field and pairing energy densities,

The mean-field energy density H(r) is a function of the nucleon densities ρq (r), the kinetic energy densities τq (r) and the spin densities Jq (r) [55], where q = n or p labels the neutron or proton densities, respectively. The total matter density is ρ = ρn + ρp and the total kinetic density is τ = τn + τp. H(r) includes the kinetic energy, nuclear interaction and Coulomb interaction energy parts,

where  is the Coulomb interaction, including direct and exchange parts [55]. The nuclear interaction is considered in the framework of Skyrme effective interaction
  including several terms, namely, the zero-range, finite range, density dependent, effective mass, spin–orbit terms, in addition to tensor coupling with spin and gradient [56]. The pairing energy density
  is given by,

The pairing strength (V0) and saturation density (ρ0) in addition to the parameters V1 and γ depend on the Skyrme force [57, 58]. For the SLy4 force, considered in the present study, V0 = −244.72 MeV fm3, ρ0 = 0.16 fm−3, V1 = 0.5, and γ = 1.0. Taking the derivatives of the energy ![$E\left[\rho ,\tilde {\rho }\right]$](https://content.cld.iop.org/journals/0954-3899/48/2/025111/revision3/gabd233ieqn5.gif) with respect to the local particle density ρ(r) and the local pairing density
with respect to the local particle density ρ(r) and the local pairing density  gives the self-consistent particle field (h) and pairing field (
 ), respectively. In the framework of independent quasiparticle approach, the Skyrme HFB equation can be written as [59]:

where Ek is the kth state quasiparticle energy, φ1,k and φ2,k are the upper and the lower components of the quasiparticle wavefunction. Since the Bogoliubov transformation does not conserve the number of particles, Lagrange multiplier λ is introduced to guarantee that the average particle number is equal to the actual number of particles in the system. The self-consistent solution of Skyrme HFB in transformed-harmonic-oscillator (THO) basis [40] generates an orthogonal set of quasiparticle wavefunctions, from which one obtains the particle and pairing density matrices as,


The local particle density can be determined from the scalar part of the density matrix at which r = r' [60] as,

The proton and neutron blocks are separately considered in the calculation. The resulting rms radii of neutron (Rn) and proton (Rp) distributions are then used to obtain the neutron-skin thickness (Δn),

where

The change of the neutron-skin thickness (δn) after the cluster decays is determined as,

The Skyrme HFB calculations can be performed using THO basis with zero-range pairing interaction [40]. The approximate particle number projection can be also considered by the Lipkin–Nogami (LN) method in the pairing interaction approximation [40], where the particle-number symmetry is approximately restored then it followed by an accurate particle number projection after the variation (THO + LN). The Skyrme–Hartree–Fock calculations can be also performed with schematic pairing force within the Bardeen–Cooper–Schrieffer (BCS) approximation (HF + BCS) [61]. It is worth noting that the LN method performs better than the BCS method when the neutron–proton pairing interaction is considered [62], and below the critical value of the pairing force at which BCS approach fails [63].
In the cluster model [64, 65] based on the Gamow two-step mechanism of α-decay, the light nucleus emitted in a cluster decay is assumed to be formed at first as a distinguished entity, within the surface region of the parent nucleus [66], with a certain preformation probability (Sc). Then the formed cluster periodically knocks against the produced cluster-core Coulomb barrier, with a particular frequency, in a trial to tunnel through it. Eventually, it penetrates the barrier with a specific penetrability. The knocking frequency (ν) and the penetration probability (P) can be calculated using the semi-classical Wentzel–Kramers–Brillouin (WKB) method as,

and

with the wave number,

While  defines the reduced mass of the cluster (mc)-daughter (mD) system, the Qc-value represents the energy released in the spontaneous cluster decay, in MeV. The three classical turning points Ri=1,2,3 (fm) are defined along the radial path of the cluster-core system at which
  . The total interaction potential
  between the emitted cluster and the core daughter nucleus, at a radial separation distance r, includes nuclear (VN), Coulomb (VC), and centrifugal (Vℓ
) contributions,
between the emitted cluster and the core daughter nucleus, at a radial separation distance r, includes nuclear (VN), Coulomb (VC), and centrifugal (Vℓ
) contributions,

The nuclear part of the potential is usually normalized by the factor λ to guarantee a quasi-stationary state for the binary cluster-cores system [67, 68]. One can determine a suitable value of λ using the Bohr–Sommerfeld quantization conditions [69, 70],

The quantum number n represents the number of nodes of the internal part of the quasibound radial wave function for the cluster-core system [21, 71]. In the present work, the nuclear part of the interaction potential is evaluated using the Hamiltonian energy density approach [28, 72–74] based on the Skyrme energy functional with the Skyrme-SLy4 parameterization of the nucleon–nucleon force [56].

Here, H, Hc and HD define the energy density functionals, given by equation (3) without the Coulomb part, for the compound system, emitted cluster (c), and daughter nucleus (D), respectively. The same Skyrme-SLy4 NN interaction has been used to compute the neutron-skin thickness of the involved parent and daughter nuclei. The Coulomb potential ( ) in equation (15) is calculated by the double-folding model using the multipole expansion method [75, 76], in terms of the charge densities of the involved nuclei and using. The centrifugal part of the potential is calculated in terms of the minimum orbital angular momentum ℓℏ carried by the emitted cluster to conserve the angular momentum and parity in the decay process,
  . More details regarding the method of calculating the different parts of the total potential are outlined in references [28, 73, 75].
The partial half-life of the parent nucleus against the cluster decay can be then determined in terms of the decay width (νP) of the decay process and the cluster preformation factor Sc as,

One can estimate the preformation factor Sc(Ac) of a specific cluster of mass number Ac inside the parent nucleus in terms of the α-preformation factor Sα inside it [78, 79] by,

The α-preformation factor can be extracted from the observed half-life against α-decay ( ) and the calculated α-decay width (να
Pα
),
) and the calculated α-decay width (να
Pα
),  [17, 80]. For the parent nuclei which have no observed α-decay, accurate empirical formulas can be used to find the α-preformation factor [77].
3. Results and discussion
Most of the known U isotopes have shown observed α-decay modes. Only 237,239,241–243U did not show α-decays yet. Figure 1(a) shows the Q-values of the probable 28Mg and 24,26Ne decay modes of the different 215–243U isotopes. These nuclei are the most particles heavier than α-particle that spontaneously observed from the U isotopes. Five cluster decay modes of 28Mg and four modes of 24Ne were observed from 232–236U and 232–234,236U isotopes, respectively [10]. Also, two 26Ne-decay modes were experimentally indicated for 234,236U [10, 81]. Other singular decays of 20,22,25Ne and 30Mg were observed from 230,235,236U [10].The Q-values presented in figure 1(a) are determined from the masses of the nuclei [82] involved in each decay. The solid symbols in figure 1(a) represent the isotopes of observed 28Mg and 24,26Ne cluster decays. The minimum Q-values for observed 28Mg and 24,26Ne of U isotopes are those of 236U(28Mg, Q = 70.733 MeV), 236U(24Ne, 55.945 MeV) and 236U(26Ne, 56.692 MeV). However, as seen in figure 1(a), the 222–231U(28Mg, 24Ne), 231–233U(26Ne) and 235U(24,26Ne) decays show larger Q-values than the mentioned minimum Q-values. Then, those 28Mg and 24,26Ne decays are expected to be energetically favorable than the 236U(28Mg, 24,26Ne) decays. Figure 1(b) confirms the preference of these decay modes over some of the observed half-lives against cluster decays. In figure 1(b) we display the calculated partial half-lives of the 220–238,240U isotopes against their probable 28Mg and 24,26Ne cluster decays. The corresponding calculated half-lives of the other 215–219,239,241–243U isotopes presented in figure 1(a) are extremely large (>1033 years). The calculations presented in figure 1(b) are carried out in the framework of the preformed cluster model based on the Skyrme-SLy4 NN interaction, equations (12)–(19). The cross symbols in figure 1(b) represent the experimentally observed partial half-lives. Figure 1(b) shows that the 28Mg decay modes of the three 226,228,230U isotopes exhibit estimated partial half-lives shorter than the observed half-life of the 28Mg decay of 233U(28Mg, 3.9 × 1027 s), which is the largest half-life of an observed 28Mg decay of U isotopes. Also, the 24Ne and 26Ne decays of the 223,226,228–231U and 228–233U isotopes, respectively show estimated half-lives shorter than the observed half-life of the 24Ne decay of 236U(24Ne, >1.9 × 1026 s) and the 26Ne decay of 234U(26Ne, 8.6 × 1025 s), respectively, which are the largest confirmed half-lives of 24,26Ne decays of U isotopes.
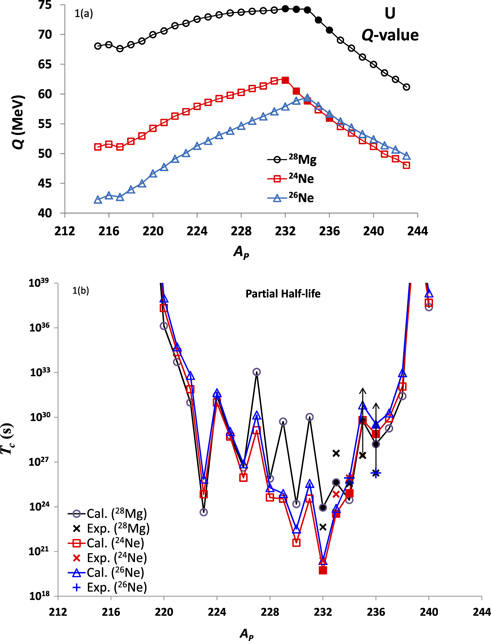
Figure 1. The variation of (a) the Q-values, and (b) partial half-lives (Tc) associated with probable 28Mg and 24,26Ne decay modes of 215–243U isotopes, against parent mass number (Ap). The solid symbols represent the observed 28Mg and 24,26Ne cluster emitters, and the cross symbols represent the experimentally observed partial half-lives [10, 81].
Download figure:
Standard image High-resolution imageFigures 1(a) and (b) highlight the predominant role of the shell effect in the cluster decay phenomena, which would explain the non-detection of 28Mg and/or 24Ne cluster decay modes of 226,228,230U and 223,226,228–231U isotopes, respectively. As shown in figures 1(a) and (b), the observed 28Mg and 24Ne cluster decay modes of the U isotopes start with 232U, leading to the neutron magic 204Hg (N = 124) and the doubly magic 208Pb (Z = 82, N = 126) daughter nuclei. Also, the observed 26Ne decays start with that of 234U, leading to the doubly magic nucleus 208Pb. Generally, among the observed 34 cluster decays [10], there are 17, 8 and 4 decays modes produce 208–212Pb (N = 126–130), 206–208Hg (N = 126–128) and 207Tl (N = 126) daughter nuclei, respectively. Five single decays were observed with 211Bi (N = 128), 207,215Pb (N = 125, 133) and 204,205Hg (N = 124, 125) daughter nuclei. Except three, these daughter nuclei have neutron numbers at or beyond the closed shell N = 126. The appearance of the three daughter nuclei with N = 124 and 125 can be understood in view of arrangement of the neutron levels just below N = 126 with the ν3p1/2 orbital at the top, followed by the ν2f5/2, ν3p3/2 and ν1i13/2 orbitals [83]. The last one or two neutrons forming the emitted cluster in the 232,233U(28Mg)204,205Hg and 221Ra(14C)207Pb decays are then coming from the ν3p1/2 state.
Now, we turn to the change (δn) of the neutron-skin thickness (Δn) after the cluster decays. The neutron-skin thicknesses of the involved nuclei are obtained using HFB calculations based on the Skyrme-SLy4 NN interaction and the transformed harmonic oscillator states along with the LN scheme (THO + LN) to consider the pairing treatment [40], as discussed in section 2. In principle, it is useful to employ the same Skyrme-SLy4 NN interaction to perform both the structure and half-life calculations for the investigated nuclei on an equal footing. The Skyrme-SLy4 NN interaction effectively estimate the nuclear matter and nuclear structure properties, including the mass, binding energy, the proton- and neutron skin thicknesses, and the other isospin properties from the β-stability line to the drip lines [56, 84–90]. It is also successfully used to study the α and cluster decays [15, 26, 77, 91–94] of heavy nuclei, as well as their reactions [74, 95–99]. Figure 2 shows the change in the neutron skin thickness (equation (11)) and in the isospin asymmetry (δI = ID − IP), from the parent to daughter nuclei, for the investigated cluster decay modes presented in figures 1(a) and (b). The isospin asymmetry coefficient is defined as I = (N − Z)/A. For the examined cluster decays of 215,231U, the δn change is very small (δn ⩽ 0.021 fm) and the corresponding change in the isospin asymmetry is less than it for the observed cluster decays. As we mentioned above, these decays are of less probability upon the dominant influences of the shell effect and/or the Q-values. For the 232–243U isotopes, δn starts with small values, δn(232U(28Mg)) ≈ 0.020 fm, δn(232U(24Ne)) ≈ 0.017 fm, and δn(233U(26Ne)) ≈ 0.005 fm, and it increases with increasing the mass number, up to δn ≈ 0.047 fm for the decay modes of 243U. For the experimentally observed decays, the maximum estimated change in Δn is δn(236U(28Mg)) = 0.028 ± 0.002 fm. The associated change in the isospin asymmetry (δI) steadily increases with increasing the mass number of the parent nucleus. The observed cluster decays often yield daughter nuclei of larger isospin asymmetry than their parent nuclei (0.001 ⩽ δI ⩽ 0.012). Only the three observed 26Ne decays of 232Th (δI = −0.0008) and 234,236U (−0.0013, −0.0021) and the 23F decay of 231Pa (−0.0006) yield daughter nuclei of slightly less isospin asymmetry.
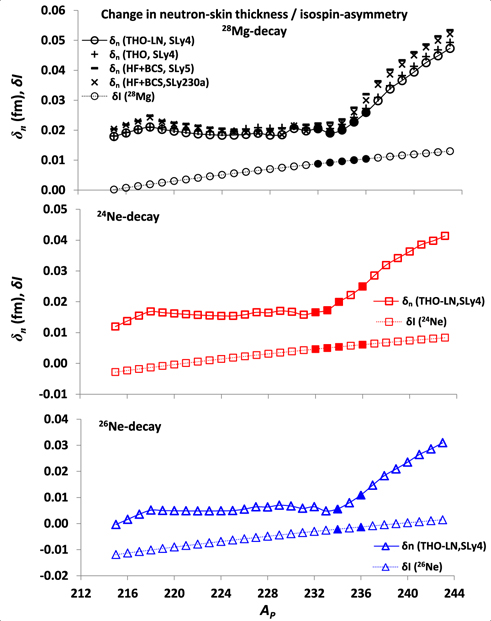
Figure 2. The change in neutron-skin thickness (δn) and in the isospin-asymmetry (δI) associated with probable 28Mg and 24,26Ne decay modes of 215–243U isotopes, against parent mass number (Ap). The solid symbols represent the observed 28Mg and 24,26Ne cluster emitters. δn is calculated using the THO + LN mean field method (section 2) based on the Skyrme-SLy4 NN interaction. For the 28Mg decays, the THO and the HF + BCS calculations based on the SLy4, SLy230a and SLy5 parameterizations of the Skyrme NN interaction are added for comparison.
Download figure:
Standard image High-resolution imageTo provide an estimate of the uncertainty in the calculated neutron-skin thickness, either related to the used structure model and/or the used NN interaction, we compare in the first panel of figure 2 the calculated δn due to the 28Mg decays of the U isotopes based on the mean field calculations in terms of the SLy4 [56], SLy230a [84], and SLy5 [56] parameterizations of the Skyrme NN interaction. Moreover, different schemes of the mean field method have been used to calculate δn(28Mg), namely the THO, THO + LN, and HF + BCS schemes, mentioned in section 2. As shown in figure 2, the different methods and interactions considered in calculating the change in the neutron-skin thickness give the same characteristic behavior of δn as a function of AP, with the same minima and maxima. The different considered schemes yield a systematic small uncertainty (<0.006 fm) in the calculated δn. This uncertainty reduces around the obtained minimal value of δn(28Mg) to be less than 0.002. Figure 2 shows that the observed 24,26Ne and 28Mg decays of U isotopes correspond to the minimum visual spacing between the increase of neutron skin thickness and the change in the isospin asymmetry. This indicates that the cluster decay most likely proceeds to minimize the increase in the neutron skin thickness relative to the corresponding increase (slight decreases) of the isospin asymmetry. Although the estimated decays of some of the U isotopes lighter than 232U exhibit change in the neutron skin thickness and Q-values that are comparable to those obtained for experimentally observed decays, they are not preferred due to the controlling role of the shell effect.Examples are the 222–231U (28Mg), 222–231U (24Ne) and 231–233U (26Ne) decays displayed in figure 1, which produce the 194–203Hg (N = 114–123), 198–207Pb (N = 116–125) and 205–207Pb (N = 123–125) daughter nuclei, respectively. The supposed daughter nuclei in these decays will have one or a few neutron holes at the orbits below N = 126, instead of a few valence neutrons outside the closed shell of N = 126 in their parent nuclei, which suppress the likelihood of such decays.
The change in the neutron-skin thickness after the more probable cluster decay modes of the 236U nucleus is displayed in figure 3(a) as a function of the atomic number of the emitted cluster (Zc), and as a function of the Qc-value in figure 3(b). The decay modes shown in figure 3(a) are picked out upon determining the maximum Qc-value for each Zc. Also, we added in figure 3 the other probable cluster decays (Qc > Qα ) of Zc = 8, 10, 12, 16 and 20, for which the emitted cluster is lighter than the indicated most probable Ac(Zc).The probability of emitting clusters heavier than the most probable Ac(Zc), with a less Qc-value, strongly decreases with increasing Ac. The experimentally observed decays among the more probable decay modes presented in figure 3 are marked by black solid symbols. δn(QMax(Zc = 2, 10, 12)) appear in figure 3 as black-red solid symbols because they correspond to QMax(Zc) and they are also experimentally observed. Figures 3(a) and (b) show that the more probable cluster decay modes tend to exhibit less changes in the neutron-skin thickness compared with the less probable cluster decay modes,which have the same Zc but smaller Ac. All the more probable cluster decay modes indicated in figure 3 show δn ⩽ 0.035 fm, even with the wide range of the corresponding Qc-value, which extends from 9 to 117 MeV.

Figure 3. The estimated change of the neutron-skin thickness δn(THO + LN) involved in the more probable cluster decays of the 236U isotope (red solid symbols), which have maximum Qc-value for each Zc, (a) as a function of the atomic number of the emitted cluster, and (b) as a function of the corresponding Qc-value. The open symbols indicate the other probable cluster decay modes of Zc = 8, 10, 12, 16 and 20, in which the emitted cluster is lighter than the indicated most probable Ac(Zc). The black solid symbols represent the experimentally observed decays.
Download figure:
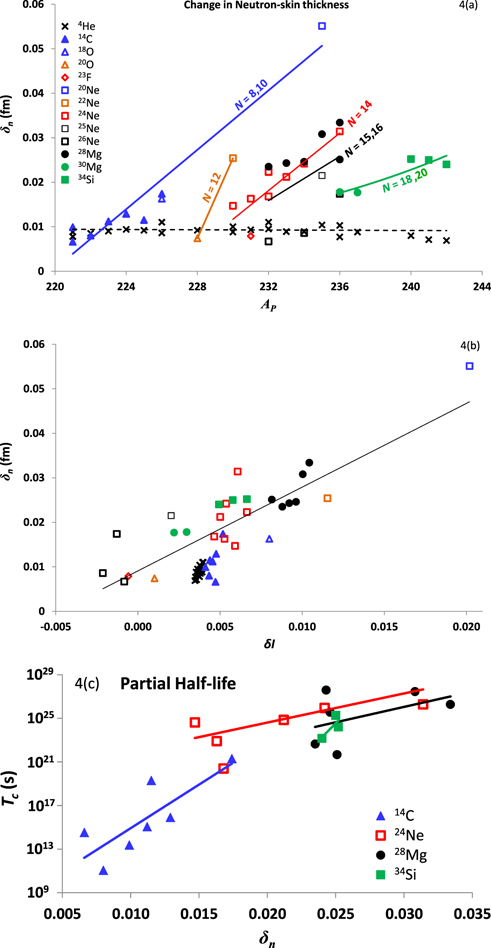
Standard image High-resolution imageFigures 4(a) and (b) show the change in the neutron-skin thickness after emission for the whole set of cluster decay modes observed to date, and after their corresponding α decays. δn is displayed versus the mass number of the parent nucleus in figure 4(a) and versus the change in the isospin asymmetry from parent to daughter nuclei in figure 3(b). In addition to their dedicated symbols, the decays are further classified in figures 4(a) and (b) in a color code according to the neutron number N of the emitted cluster. In addition to the set of α decays (N = 2), the five cluster decay sets distinguished in figure 4(a) include the emitted cluster isotones of N = 8 and 10(14C, 18O, 20Ne) in blue, N = 12(20O, 22Ne) in brown, N = 14(23F, 24Ne) in red, N = 15 and 16 (25,26Ne, 28Mg) in black, as well as N = 18 and 20(30Mg, 34Si) in green. Figure 4(a) shows that δn tends to increase with decreasing the neutron number of the emitted heavy cluster and with increasing the mass number of the parent nucleus. On contrary, α decays yield the minimum change in Δn, and remains almost constant with increasing AP. This is because the change in the isospin asymmetry after α decays is almost constant (δIα = 0.003–0.004) for the all observed cluster emitters, as shown in figure 4(b). Except the slightly larger value of δn[235U(20Ne)215Pb, δI = 0.020] = 0.055 fm, the change in Δn after the all observed cluster decays lies in the narrow range of the small values δn(δI ⩽ 0.012) = 0.007–0.033 fm. The change in Δn after the corresponding α decays lies within the range of δnα (δIα = 0.003–0.004) = 0.009 ± 0.002 fm. Figure 4(b) clearly shows the increasing behavior of δn with increasing the isospin asymmetry of daughter nucleus relative to the parent nucleus. The decays of the clusters which have large isospin-asymmetry such as 20O, 23F and 26Ne trivially increase the neutron-skin thickness of the daughter nucleus relative to that of the parent nucleus. Heavier clusters of a larger isospin-asymmetry would decrease the neutron-skin thickness.
Figure 4. The change in the neutron-skin thickness (δn) against (a) the parent mass number (Ap), and (b) the change in the isospin-asymmetry (δI) after cluster emission and α emission for all the observed cluster emitters. The color code of the emitted clusters symbols is assigned to their neutron number, namely blue (N = 8, 10), brown (N = 12), red (N = 14), black (N = 15, 16), and green (N = 18, 20). (c) The observed cluster-decay partial half-lives (Tc) [10, 81] against the corresponding change in δn due to 14C, 24Ne, 28Mg and 34Si cluster decays.
Download figure:
Standard image High-resolution image
Figure 4(c) displays the observed partial half-lives (Tc) of the 14C, 24Ne, 28Mg and 34Si cluster decays, as function of the corresponding change in Δn due to the decay. One can clearly see in figure 4(c) that the half-lives relatively increase for the decays yielding larger change in the neutron-skin thickness. This indicates that the cluster decay becomes more favorable to the daughter nuclei of less increase in Δn, relative to their parent nuclei. The nucleus then becomes more stable against the cluster decays that produce a relatively large increase in the neutron-skin thickness.
4. Conclusions
We studied the change in the neutron-skin thickness from parent to daughter nuclei, after cluster decays. To investigate the key factors influencing the cluster decays, we compared the more-probable decays which manifest themselves energetically with those already observed. We started by investigating the probable 28Mg and 24,26Ne decay modes of the all known 215–243U isotopes. These light nuclei are the most particles heavier than α-particle that spontaneously observed from the U isotopes. We then investigated the more probable cluster decays that theoretically estimated for the 236U isotope, which shows 4 observed cluster decay modes in addition to its α-decay. All the cluster decay modes that have been observed to date are investigated. We found that this change in Δn is one of the key factors affecting the cluster decay process, after the shell effect and the released energy. The cluster decay most likely takes place along with the minimum possible increase of the neutron-skin thickness (δn) from parent to daughter nuclei. Generally, the more probable cluster decays of a certain cluster emitter, based on the released energy and the mass number of the emitted cluster, tend to show smaller change in the neutron-skin thickness compared with the less probable cluster decays of the same Zc. This correlation between increasing the decay rate and the small change in the neutron-skin thickness is due to that they are both arising from the same nuclear-structure influences, which affect the probability of forming the emitted cluster within the surface region of the parent nucleus and its penetrability. For the emitted light clusters heavier than α-particle, Δn increases upon decreasing the neutron number of the emitted cluster, and consequently it decreases with increasing its isospin-asymmetry. Also, δn shows an increasing behavior with increasing the isospin asymmetry of daughter nucleus relative to the parent. The relative stability of a given radioactive nucleus and its partial half-life against a certain cluster decay increase if this decay produces a relatively large increase in the neutron-skin thickness.