Possible Indications of Variations in the Directionality of Beta-Decay Products
 Peter A. Sturrock
 Ephraim Fischbach2
  Oksana Piatibratova
 Felix Scholkmann
- 1Center for Space Science and Astrophysics and Kavli Institute for Particle Astrophysics and Cosmology, Stanford University, Stanford, CA, United States
- 2Department of Physics and Astronomy, Purdue University, West Lafayette, IN, United States
- 3Geological Survey of Israel, Jerusalem, Israel
- 4Research Office for Complex Physical and Biological Systems, Zurich, Switzerland
Some experiments seem to yield strong evidence of variability of beta-decay rates, but other experiments may show little or no such evidence. Some recent experiments help clarify the situation. In particular, a certain oscillation appears in neutrino measurements made at the Super-Kamiokande Neutrino Observatory and in radon beta-decay measurements made at the Geological Survey of Israel, with identical frequency (9.43 years−1), amplitude and phase, strengthening the case for an influence of neutrinos on beta decays. A review of current experimental information leads us to suggest that 1) beta-decay rates do not change, but 2) the angular distribution of decay products may be anisotropic, and 3) the angular distribution of decay products may be influenced by the ambient neutrino flux. It appears that experiments at standards laboratories tend to be insensitive to direction, and this may be the reason that they tend not to exhibit evidence of variability.
Introduction, Including Early Evidence for Variability
There has for some time been evidence that some beta decay processes exhibit some form of variability. Whether or not beta decays are intrinsically variable is significant for geologists who rely on radon measurements to probe the outer layers of the lithosphere. Whether or not the solar neutrino flux is variable is important not only to solar physicists, but also to physicists for whom solar-neutrino measurements yield a test of our comprehension of nuclear physics.
Alburger et al. [1] reported the results of their study at the Brookhaven National Laboratory (BNL) of the decay of 32Si over the time period 1982–1986, using the long-lived nuclide 36Cl as a calibration standard. Reviewing the ratio of the 32Si count rate to the 36Cl count rate, Alburger et al. noted “small periodic annual deviations of the data points from an exponential decay curve [that were] of uncertain origin.” One may note that the depths of modulation–of order 0.05%–for the two nuclides are similar, even though there is a wide difference in the decay half-lives (172 years for 32Si, 300,000 years for 36Cl).
Siegert et al. [2], at the Physikalisch-Technische Bundesanstalt (PTB), reported the results of a 20-year study of the beta decays of 152Eu and 154Eu, using 226Ra as a standard. They noted annual oscillations in the measured decay rates of both 152Eu and 226Ra.
Falkenberg [3] claimed to find evidence of an annual oscillation in the beta decay rate of tritium, which he attributed to the annual variation of the Earth-Sun distance, suggesting a possible role of neutrinos.
Parkhomov [4] has found evidence of variability in beta decays but not in alpha decays.
FIschbach et al. [5], in their review of the field, presented an overview of (then) recent research dealing with “the question of whether nuclear decay rates (or half-lives) are time-independent constants of nature, as opposed to being parameters which can be altered by an external perturbation.” It was then not unreasonable to assume that variations in flux measurements should be interpreted as variations in decay rates. It was also not unreasonable to attribute an annual variation in these measurements to the annual variation in the Earth-Sun distance.
An overview of reported anomalies in decay rates can be found in the recently published work of McDuffie et al. [6].
In this article, we claim that more recent experiments yield conclusive evidence of variability. We point out that a reanalysis of the experimental results shows that an apparent conflict between experimenters who find evidence of variation and experimenters who do not find such evidence hinges on the conventional understanding of the role of neutrinos. We suggest that the conventional role may need to be revised, along lines suggested in the Discussion section.
Early Evidence Against Variability
Whether or not nuclear decay rates are constant or variable is clearly a question of interest to standards laboratories. As we noted in the introduction, Including Early Evidence for Variability, analysts at PTB reported apparent variations in decay measurements of 152Eu and 226Ra, but Nahle and Kossert [7] of PTB advanced reasons to discount the early results as evidence of variability. Kossert and Nahle [8] later claimed that measurements of 90Sr/90Y decays, in a specially designed experiment, gave no evidence of variability. However, a re-analysis of the Kossert-Nahle measurements [9] revealed evidence of variability.
Pommé, of the European Commission Joint Research Center, and his collaborators have published many articles discounting evidence of the variability of nuclear decay processes. An early article of this group [10] gives a summary of 67 measurements of the decay rates of several different nuclides, giving results from several different laboratories, covering several different decay mechanisms. Measurements were made by a wide variety of techniques, but most of the datasets were of limited length (less than 1,000 lines). The individual datasets were tested for annual oscillations, which were typically found to be a small fraction of a percent with phases that varied over a wide range. Pommé et al. concluded that “the observed seasonal modulations could be attributed to instrumental instability” [10]. For a recent publication and guide to earlier articles, see [11].
Radon Decay Measurements Acquired at the Geological Survey of Israel Laboratory
The most extensive set of nuclear decay measurements is one that has been acquired at the Geological Survey of Israel (GSI) laboratory in Jerusalem. This experiment, in operation from day 86 of 2007 to day 312 of 2016, recorded, every 15 min, measurements of beta-related gamma rays, alpha radiation, and three environmental measurements (temperature, pressure and supply voltage), for a total of over 350,000 lines, each with seven entries [12].
Figures 1A,B show power spectra for the frequency ranges 0–6 year−1 and 6–16 year−1, respectively. These figures show power spectra formed from gamma measurements acquired at local noon (shown in red) and at local midnight (shown in blue). The principal peaks in these power spectra are listed in Tables 1–4.
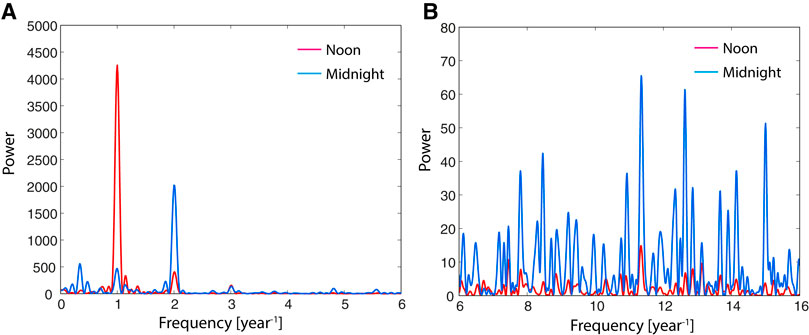
FIGURE 1. (A) Power spectra formed from the 4-h band of measurements centered on noon (red) and midnight (blue) for the frequency band 0–6 years−1. We see that the biggest daytime oscillation is at 1 year−1; the biggest nighttime oscillation is at 2 years−1. (B) Power spectra formed from the 4-h band of measurements centered on noon (red) and on midnight (blue) for the frequency band 6–16 years−1. We see that there are strong oscillations in the expected rotational frequency band 10–14 years−1 (note especially the peaks at 11.35 and 12.64 years−1) in the nighttime data, but comparatively small oscillations in the daytime data (Cf Tables 3, 4).
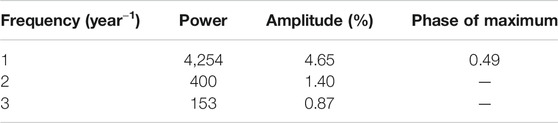
TABLE 1. The annual oscillation and the leading two harmonics as derived from the GSI noon-centered measurements.
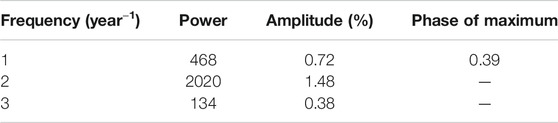
TABLE 2. The annual oscillation and the leading two harmonics as derived from the midnight-centered measurements.
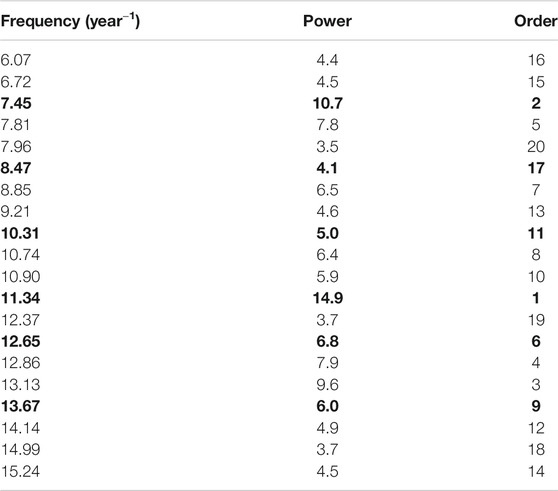
TABLE 3. Top 20 peaks in the power spectrum formed from GSI noon data in the frequency band 6–16 years−1. Entries in bold comprise a triplet and two doublets with frequency separations close to 1 year−1: 7.45, 8.45 and 9.45 year−1; 11.35 and 12.35 year−1; and 12.65 and 13.65 year−1.
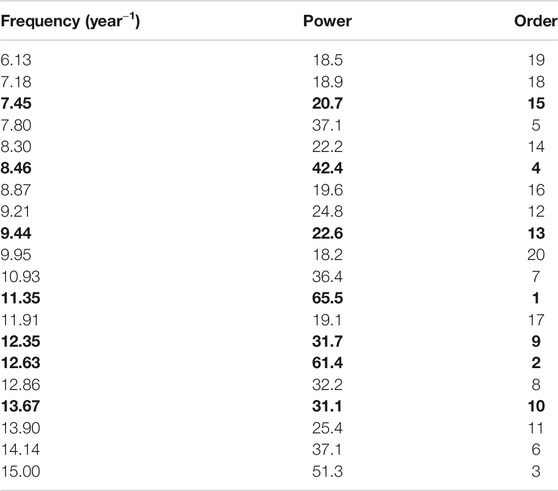
TABLE 4. Top 20 peaks in the power spectrum formed from midnight data in the frequency band 6–16 years−1 Entries in bold comprise a triplet and two doublets with frequency separations close to 1 year−1: 7.45, 8.45 and 9.45 year−1; 11.35 and 12.35 year−1; and 12.65 and 13.65 year−1.
We find that the strongest oscillation is an annual oscillation, found primarily in the noon data, with a power of 4,254. (There is also a strong semiannual oscillation.) According to the standard expression
for the probability of obtaining by chance a power of S or more at a selected frequency [13] from normally distributed random measurements, this value of the power corresponds to a false-alarm probability of less than 10−1700. (This obviously rules out any environmental effect, such as has been suggested by Pommé [11].
We see from Figure 1B and Table 4 that the two strongest oscillations in the frequency band 6–16 year−1 (which covers the frequency band expected for solar rotation) are found in the midnight data at 11.35 year−1 with S = 65.5 and at 12.63 year−1 with S = 61.4. The geometry of the experiment is such that the detector reveals signals traveling vertically upwards. Since these signals have originated in the Sun, they have traveled through the Earth, indicating that the radon beta-decay photons somehow have their origin in neutrinos.
However, the gamma detector records a stronger signal at noon (Table 1). By analogy with the solar influence (attributed to solar neutrinos) detected primarily at midnight, we are led to consider the possibility that the influence detected primarily at noon may be attributable to neutrinos traveling toward the Sun. These can only be cosmic neutrinos, which will be the topic of a later article.
Evidence for Anisotropy
A significant variation of the basic GSI experiment was carried out at the GSI laboratory in late 2013 [14]. The setup comprised two cylinders at right angles to each other. One cylinder was oriented to be parallel to the Earth’s rotation axis. The axis of the other cylinder was oriented to be in a vertical plane that contained the axis of the first cylinder, oriented to be normal to the axis of the first cylinder. If the measurements acquired by the two detectors appended to the two cylinders were subject to an isotropic influence (such as weather), the two detectors would have recorded identical measurements.
That did not happen. The apparent half-life of the radon source was found to be 0.861 ± 0.003 days in the pole direction and 2.308 ± 0.008 days in the orthogonal direction. The authors comment that “the outcome is in conformity with observations on radon signals in confined conditions and their different manifestation at different directions.”
This experiment provides conclusive evidence that whatever process influences the beta decay process is intrinsically anisotropic. Any interpretation of beta-decay measurements must take this fact into account.
Evidence for an Influence of the Environment
Two experiments by Bellotti et al. [15] offer further information relevant to the mechanism of variability of nuclear decays.
The First Bellotti Experiment
A glass sphere (130 mm diameter) was connected through a pipe to a stainless steel cylinder containing 0.3 kg of rock rich in uranium. The radon from the radium decay fills the glass sphere which, after 5–6 days, was isolated from the radon source. Gamma rays from the radon progeny were detected by a 3” by 3” NaI crystal placed a few millimeters from the surface of the sphere. Both the detector and the glass sphere were enclosed in a 5 cm thick lead shield.
The normalized residual of the count rate, divided by the expected rate, is shown as a function of time in the upper panel of Figures 2A. The experimenters reported that “instead of having a statistical distribution around zero, there is clearly a 24 h period.” They found the same behavior if they took into account only the peaks due to 214Pb and 214Bi.
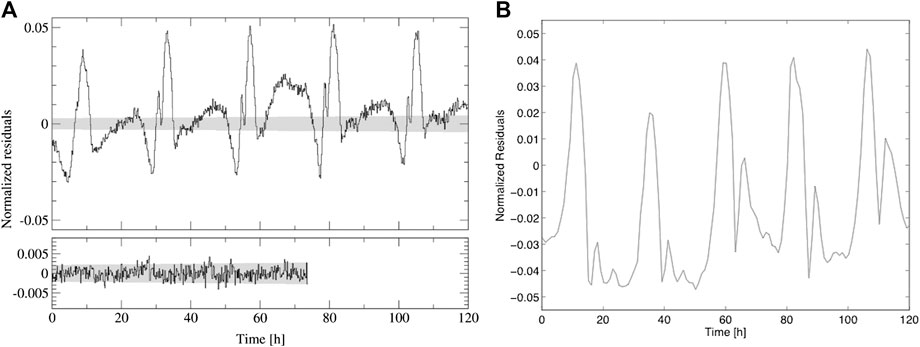
FIGURE 2. (A) Normalized deviations from the exponential trend of the measured count rate for radon in air measured by Bellotti et al. [15]. The upper panel shows the data without polystyrene particles inside the glass sphere containing air charged with radon, the lower panel with these particles. Fluctuations within ±2σ are shown with shaded areas. Reprinted from Bellotti et al. [15] with permission from Elsevier. (B) A plot of a 120-h sample of the normalized hourly measurements of the gamma count rate registered by the GSI experiment (Radon Decay Measurements Acquired at the Geological Survey of Israel Laboratory), showing a diurnal variation very similar to that shown in (A).
The Second Bellotti Experiment
Bellotti and his colleagues speculated that the diurnal modulation evident in their first experiment could be attributed to the displacement of the radioactive nuclei inside the gas volume, together with a variation of the detector efficiency. The experimenters set out to evaluate that hypothesis by filling the sphere with polystyrene particles (diameter: 0.7–0.9 mm), so that the radon atoms were confined to the interstitial space between the polystyrene particles. Measurements made with that configuration exhibited no modulation, as shown in the lower panel of Figure 2A. The authors concluded that the displacement of radioactive atoms was the cause of the diurnal modulation.
As a further check of that hypothesis, the experimenters added a second NaI detector diametrically opposite to the first detector. They found that the variation with time of the difference in count rates of the two detectors was very similar to the difference in the temperatures at the locations of the two detectors, and inferred that the diurnal variation of the count rate evident in their first experiment was attributable to the diurnal variation of the location of the radioactive nuclei inside the gas volume.
However, we show in Figure 2B a short section (120 h) of gamma measurements recorded by the GSI experiment. We see that this experiment exhibits a diurnal oscillation very similar to that recorded by the Bellotti experiment (Figures 2A)–similar in both amplitude and structure. This strong similarity suggests that both experiments are responding to a similar or identical influence.
As a further test, Bellotti et al. modified the experiment to “immobilize” radon and its progeny, allowing at the same time for a rather high radon concentration. To achieve these goals, the experimenters diffused radon into olive oil which has a much higher viscosity than air and which permits a radon concentration 29 times higher than in air. To minimize the background and its fluctuations, the experiment was carried out underground at the Gran Sasso National Laboratory (LNGS). The olive oil, charged with radon, was contained in a copper tube, 10 cm diameter, with wall thickness 2 mm. The detector was again a 3” by 3” NaI detector (but its relationship to the tube has not been specified). The shielding was provided by at least 15 cm of lead and the laboratory temperature was kept between 12°C and 13°C.
Measurements were made for four intervals of lengths ranging from 1,185 to 1,462 h. Their analysis of these four intervals gave no evidence of variability: the relative half-life variation was 7 × 10⁻⁶, one order of magnitude less than the statistical error. The experimenters concluded that their final result was a very precise value for the 222Rn half life of 3.82146 (16)stat(4)syst d. The experimenters remark that using radon diffused in olive oil removed the large fluctuations (presumably the diurnal oscillations) in the count rate that were a feature of the first experiment.
An Oscillation Evident in Both Super‐kamiokande and Geological Survey of Israel Measurements
The Super-Kamiokande (SK) Observatory, which has been in operation for 35 years (since 1985, with one unfortunate lapse), began data-taking in 1996 and released 5 years of data in 2003. There have been a number of analyses of that dataset. One from the SK Consortium [16] claimed to establish that their dataset yields no evidence of variability. However, concerning the two most detailed analyses of that dataset, that of Sturrock and Scargle [17] revealed evidence of a significant oscillation at 9.43 year−1, and that of Ranucci et al. [18] contains the following conclusion: “multiple peaks significance assessment and alias prediction delineate a … complex picture in which a line at 9.42 cycles/year … emerges in the spectrum with an individual significance which cannot exclude the constant rate hypothesis, but accompanied by other indicators that do not fully endorse such a conclusion.”
We have carried out analyses of the SK and GSI datasets using an extension of the Lomb-Scargle procedure that yields amplitude and phase as well as power. The result is shown in Table 5 and Figure 3.We see that there is remarkable agreement not only in frequency but also in amplitude and phase.
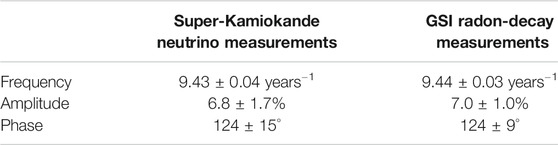
TABLE 5. The frequency, amplitude and phase of the (nominally) 9.43 years−1 oscillation, as it occurs in Super-Kamiokande data and GSI data.
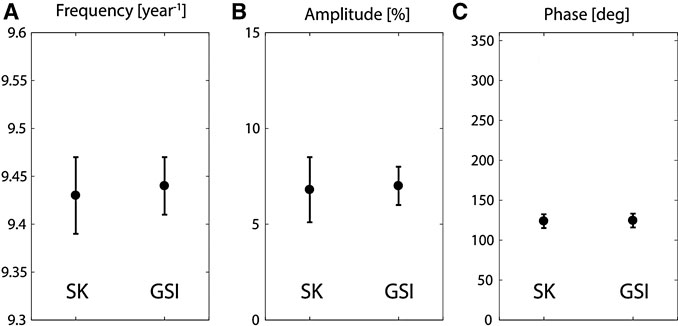
FIGURE 3. Frequency, amplitude and phase of the 9.43 years−1 oscillation as it appears in Super-Kamiokande (SK) measurements and in GSI measurements.
We see from Table 3 that not only is the 9.43 year−1 oscillation evident in GSI data, but we also find two annual sidebands (effectively at 8.43 and 7.43 year−1). Such sidebands are attributable to oblique rotation, i.e., to rotation about an axis that is not normal to the ecliptic [19].
Discussion
The results shown in the previous section concerning the GSI measurements present a strong case that some nuclear decay processes are in some sense variable. Tables 1, 2 and Figures 1A present evidence that beta-decay measurements are influenced by the varying Earth-Sun configuration. Figure 1B and Tables 3, 4 strongly suggest that these measurements are influenced by solar rotation. This inference is reinforced by the finding that some of the rotational oscillations are accompanied by sidebands with displacements of 1 year−1. Such sidebands are comprehensible if the rotation axis departs significantly from the normal to the ecliptic [19] (and therefore differs significantly from the rotation axis inferred from optical observations). Different oscillations presumably correspond to different regions of the solar interior, the triplet at effectively 7.43, 8.43, and 9.43 year−1, possibly corresponding to the solar core.
We saw in Evidence for an Influence of the Environment that a completely different experiment (the first Bellotti experiment) exhibits a diurnal oscillation very similar to that found in the midnight data of the GSI experiment. The agreement is one not only of shape but also of magnitude. Since the same pattern is found in two completely different experiments, it can hardly be attributed to any environmental process. One must suspect that there is a physical explanation for this relationship.
We saw in An Oscillation Evident in Both Superkamiokande and GSI Measurements that an oscillation (at 9.43 years−1) is evident in both Superkamiokande solar neutrino measurements and GSI radon-decay measurements. Remarkably, the agreement is not simply one of frequency but also one of amplitude and phase. It is difficult to avoid the conclusion that both sets of measurements have a common cause. The simplest such interpretation is that neutrinos somehow influence beta decays.
The second Bellotti experiment, discussed in Evidence for an Influence of the Environment, shows that evidence for variability is suppressed if the radiation is isotropized by scattering. An apparent implication is that (as previously suggested [20]) variability involves the directional characteristics of measurements, not simply time dependence. Indeed, it is possible that time variation of measurements may actually be due to an anisotropy of what is being measured. Measurements made by an experiment that isotropizes radiation would then yield no evidence of variability.
Hence there may be no conflict between evidence of variability reviewed in this article and the null findings of many standards experiments, in which the target nucleus may be part of a molecule in a chemical form that is dissolved in a “cocktail” contained in a vial that may or may not be transparent, since such a design would tend to isotropise radiation from the nucleus under investigation.
The process by which neutrinos might influence beta decays is (if real) currently unknown. That such a process may exist would seem surprising, in view of the known very weak interaction of neutrinos with other particles. In seeking to reconcile these two apparently contradictory properties of neutrinos, one may consider as a possible analogy the interaction of electrons and ions in an electron-ion plasma. In that situation, there are two types of interaction: one is the direct short-range particle-particle interaction (typically negligible); the other is a long-range collective process by which large numbers of charged particles can interact [21]. One may therefore consider the possibility that the influence of neutrinos on nuclear processes may be a collective process, not a particle-particle process. This would require a mechanism for a long-range coupling of neutrinos, which may require the mediation of a boson to play the same role as the electromagnetic field in an electron-ion plasma. The examination of this hypothesis may require a new suite of experiments, including a search for evidence of spatial correlation that might be expected of a collective process, but mght not be expected of a non-collective process.
Data Availability Statement
The original contributions presented in the study are included in the article/Supplementary Material, further inquiries can be directed to the corresponding author.
Author Contributions
Conceptualization, software, visualization, original draft preparation: PS; review and editing: EF, OP, FS.
Conflict of Interest
The authors declare that the research was conducted in the absence of any commercial or financial relationships that could be construed as a potential conflict of interest.
Acknowledgments
We thank the Super-Kamiokande consortium, the Geological Survey of Israel, and Karsten Kossert and Ohle Nahle of the Physikalisch Technische Bundesanstalt, for making their data available for analysis. We also thank Jeffrey Scargle and Guenther Walther for their valuable guidance concerning time-series analysis.
References
1. Alburger DE, Harbottle G, Norton EF. ‘Half-life of 32Si’. Earth Planet. Sci Lett (1986) 78(2-3):168-76. doi:10.1016/0012-821x(86)90058-0
2. Siegert H, Schrader H, Schoetzig U. Half-life measurements of europium radionuclides and the long-term stability of detectors. Appl Radiat Isot (1998) 49(9-11):1397–401. doi:10.1016/s0969-8043(97)10082-3
4. Parkhomov AG. Bursts of count rate of beta-radioactive sources during long-term measurements. Int J Pure Appl Phys (2005) 1:119–28.
5. Fischbach E., Buncher JB, Gruenwald JT, Jenkins JH, Krause DE, Mattes JJ, et al. Time-dependent nuclear decay parameters: new evidence for new forces?. Space Sci Rev (2009) 145(3-4):285–335. doi:10.1007/s11214-009-9518-5
6. McDuffie MH, Graham P, Eppele JL, Gruenwald JT, Javorsek II D, Krause DE, Fischbach E. Anomalies in Radioactive Decay Rates: A Bibliography of Measurements and Theory. https://arxiv.org/abs/2012.00153
7. Nahle O, Kossert K. Comment on "Comparative study of beta-decay data for eight nuclides measured at the Physikalisch-Technische Bundesanstalt" [Astropart. Phys. 59 (2014) 47-58]. Astropart Phy (2015) 66:8–10. doi:10.1016/j.astropartphys.2014.11.005
8. Kossert K, Nahle OJ. Disproof of solar influence on the decay rates of 90Sr/90Y. Astropart Phy (2015) 69:18–23. doi:10.1016/j.astropartphys.2015.03.003
9. Sturrock PA, Steinitz G, Fischbach E, Parkhomov A, Scargle JD. Analysis of beta-decay data acquired at the Physikalisch-Technische Bundesanstalt: evidence of a solar influence. Astropart Phy (2016) 84:8–14. doi:10.1016/j.astropartphys.2016.07.005
10. Pommé S, Stroh H, Paepen J, Van Ammel R, Marouli M, Altzitzoglou T, et al. Evidence against solar influence on nuclear decay constants. Phy Letters B (2016) 761:281–86. doi:10.1016/j.physletb.2016.08.038
11. Pommé S. Solar influence on radon decay rates: irradiance or neutrinos? Eur. Phys. JC. (2019) 79:73. doi:10.1140/epjc/s10052-019-6597-7
12. Steinitz G, Kotlarsky P, Piatibratova O. Radon signals in geological (natural) geogas and in a simultaneous enhanced confined mode simulation experiment. Proc Math Phys Eng Sci (2018) 474:2216. doi:10.1098/rspa.2017.0787
13. Scargle JD. Studies in astronomical time series analysis. II - Statistical aspects of spectral analysis of unevenly spaced data. ApJ (1982) 263:835–53. doi:10.1086/160554
14. Steinitz G, Kotlarsky P, Piatibratova O. Observations of the relationship between directionality and decay rate of radon in a confined experiment. Eur Phys J Spec Top (2015) 224(4):731–40. doi:10.1140/epjst/e2015-02403-2
15. Bellotti E, Broggini C, Di Carlo G, Laubenstein M, Menegazzo R. Precise measurement of the 222Rn half-life: a probe to monitor the stability of radioactivity. Phy Lett B (2015) 743:526–30. doi:10.1016/j.physletb.2015.03.021
16. Yoo J, Ashie Y, Fukuda S, et al. Search for periodic modulations of the solar neutrino flux in Super‐Kamiokande‐I. Phys Rev D (2003) 68:092002
17. Sturrock PA, Scargle JD. Comparative analysis of Super-Kamiokande and SNO Solar-Neutrino Data and the photospheric magnetic field. Sol Phys (2006) 239(1-2):1–27. doi:10.1007/s11207-006-0143-0
18. Ranucci G. Likelihood scan of the Super-Kamiokande I time series data. Phys Rev D (2006) 73:103003. doi:10.1103/physrevd.73.103003
19. Sturrock PA, Bai T. Search for evidence of a clock related to the solar 154 day complex of periodicities. ApJ (1992) 397:337–46. doi:10.1086/171789
20. Sturrock PA, Steinitz G, Fischbach E. Analysis of gamma radiation from a radon source: II. Indications of influences of both solar and cosmic neutrinos. Astropart Phys (2018). 100:1–12.
Keywords: radioactivity, radioactive decay, neutrinos, radon, anisotropy, solar interior
Citation: Sturrock PA, Fischbach E, Piatibratova O and Scholkmann F (2021) Possible Indications of Variations in the Directionality of Beta-Decay Products. Front. Phys. 8:584101. doi: 10.3389/fphy.2020.584101
Received: 16 July 2020; Accepted: 17 November 2020;
Published: 19 January 2021.
Edited by:
Nunzio Itaco, University of Campania Luigi Vanvitelli, ItalyReviewed by:
Giuseppe Verde, Ministry of Education, Universities and Research, ItalyPasquale Migliozzi, National Institute of Nuclear Physics of Naples, Italy
Copyright © 2021 Sturrock, Fischbach, Piatibratova and Scholkmann. This is an open-access article distributed under the terms of the Creative Commons Attribution License (CC BY). The use, distribution or reproduction in other forums is permitted, provided the original author(s) and the copyright owner(s) are credited and that the original publication in this journal is cited, in accordance with accepted academic practice. No use, distribution or reproduction is permitted which does not comply with these terms.
*Correspondence: Felix Scholkmann, Felix.Scholkmann@usz.ch