Microstructures and Tensile Fracture Behavior of 2219 Wrought Al–Cu Alloys with Different Impurity of Fe

1
National Key Laboratory of Science and Technology for National Defence on High-Strength Structural Materials, Central South University, Changsha 410083, China
2
Department of Mechanical Engineering, Guilin University of Aerospace Technology, Guilin 541004, China
3
Light Alloy Research Institute, Central South University, Changsha 410083, China
4
State Key Laboratory of Powder Metallurgy, Central South University, Changsha 410083, China
*
Author to whom correspondence should be addressed.
Metals 2021, 11(1), 174; https://doi.org/10.3390/met11010174
Submission received: 28 December 2020
/
Revised: 14 January 2021
/
Accepted: 15 January 2021
/
Published: 19 January 2021
Abstract
:The Fe-rich intermetallic phases have a broadly detrimental effect on the mechanical properties of Al–Cu alloy. In this paper, the continuous evolution of Fe-rich intermetallics and their effects on mechanical properties, especially the tensile fracture behavior of 2219 wrought Al–Cu alloys as a function of Fe content against different processing approaches (i.e., as-cast, homogenization, multidirectional forging, and solution-peak aging treatment) were investigated using optical microscopy, scanning electron microscopy, and tensile tests. The results indicated that needle-like Al7Cu2Fe or Al7Cu2(Fe, Mn) intermetallics mainly presented in the final microstructures of all alloys with various Fe contents. The size and number of Al7Cu2Fe/Al7Cu2(Fe, Mn) intermetallics increased with the increase of Fe content. The increase of Fe content had little influence on the ultimate tensile strength and yield strength, while obvious deterioration in the elongation, because fracture initiators mainly occurred at the Al7Cu2Fe/Al7Cu2(Fe, Mn) particles or particles–matrix interface. Therefore, the 2219 Al–Cu alloy with 0.2 wt.% Fe content presented relatively low tensile ductility. The tensile fracture mechanism has been discussed in detail.
1. Introduction
The heat-treatable type 2xxx Al–Cu alloys have been widely used in transportation and aerospace industry owing to its high specific strength and good weldability. Such as the employment of 2219 Al–Cu alloy in fabricating propellant tank of large launch vehicle [1,2] and the utilization of 2519 Al–Cu alloy as structure component of armored vehicle [3]. It is well known that the solubility of impurity Fe in Al–Cu alloys is very poor. As a result, Fe-rich intermetallics, including needle-like morphology Al7Cu2Fe/Al7Cu2(Fe, Mn) (named as β-Fe) [4] and Al3(FeMn) [5] or Chinese script-shaped Al15(FeMn)3(CuSi)2 (named as α-Fe) [6], Al6(FeMn) [7], and AlmFe [8] phases, can be formed readily during the solidification process. Generally, these Fe-rich intermetallics are hard to dissolve into the α-Al matrix during solution treatment and can act as crack initiation sites due to its incompatible plastic deformation with the softer α-Al matrix during deformation, thereby deteriorating the mechanical properties and in particular, the fracture properties of the alloy [2,8]. Therefore, a low upper limit of Fe content can be set in wrought aluminum alloy. For instance, Fe content is usually limited to a maximum amount of 0.3 wt.% in 2219 wrought Al–Cu alloy.
The needle-like β-Fe particles have been thought of as the most detrimental Fe-rich intermetallics. Thus, it is necessary to modify, refine, and even inhibit the formation of the needle-like Fe-rich intermetallics. Several effective methods have been employed to prevent the form of needle-like β-Fe particles or transform the needle-like morphology into Chinese script-shaped Fe-rich intermetallics, which is thought to be less harmful to the mechanical properties of the alloy. These methods include adding Mn and/or Si as neutralization elements, increasing cooling rate during solidification and the improvement in melt quality (i.e., squeeze or ultrasonic casting and superheated melt).
In the work of Tseng et al. [7,9], the needle-like β-Fe phase was reported to be the dominant Fe-rich intermetallics in A206 alloy when Fe content was lower than 0.3 wt.%, while the β-Fe phase was found to partly transform into Chinese script-shaped Fe-rich intermetallics when Mn content was more than 0.29 wt.%. With further addition of Mn to 0.66 wt.%, the β-Fe phase completely converted into Chinese script-shaped Fe-rich intermetallics. Liu et al. [10] found that the combined addition of both Mn and Si was more helpful to transform β-Fe into α-Fe than the individual addition of either Mn or Si. Based on the data from 206 Al–Cu alloys with different Fe, Mn, and Si contents [11,12,13], it seems that the lower Fe content, the higher Mn/Fe, and/or Si/Fe ratios for the efficient modification of β-Fe phase into Chinese script-shaped Fe-rich intermetallics. For instance, both Mn/Fe and Si/Fe ratios are about 1 in 206 Al–Cu alloys with 0.3 wt.% Fe [6], but about 2 at 0.15 wt.% Fe [10,12,13], even up to 13 (Mn/Fe ratio) at 0.05 wt.% Fe-0.01 wt.% Si [7].
Increasing the solidified cooling rate is another widely used way to refine Fe-rich intermetallic particles. For instance, research on the Al–Mg (Mg 4.7, Mn 0.76, Cr 0.14, Fe 0.22, Si 0.15, Cu 0.014, wt.%) and Al–Cu (Cu 4.97, Fe 0.4, Si 0.12, Zn 0.11, Ni 0.08, wt.%) alloys indicated that almost all the alloying elements are dissolved into the α-Al matrix due to a sufficiently high cooling rate of 105~107 K/s during melt spinning [14,15]. Chobaut et al. [16] also found that the coarse Fe-rich intermetallics in AA2618 Al–Cu–Mg alloy could be completely inhibited under the condition of near-rapid cooling rate. However, Liu et al. [10] studied the influence of cooling rate on the formation of Fe-rich intermetallics in Al–Cu alloys and found that there existed a critical cooling rate to completely hinder the formation of β-Fe at a given alloy composition. Normally, a higher cooling rate was required at the lower contents of Mn and Si. In other words, β-Fe intermetallics compound cannot be completely eliminated in the Al–Cu alloys with low levels of Mn and Si. This phenomena was also observed in the Al–5Mg–0.8Mn–xFe alloys with low content of Si in which the morphology of Al6(CuFe) phase did not change under a near-rapid cooling rate of 20 °C/s [13].
In addition, in the study of Zhang and Lin et al. [5,12], the needle-like β-Fe completely disappeared in the Al–5.0Cu–0.6Mn–0.5Fe squeeze cast alloy with an applied pressure of 75 MPa. However, the metastable Chinese script-shaped α-Fe, Al6(FeMn), AlmFe, or needle-like Al3(FeMn) easily transformed to the stable β-Fe phase after solution heat treatment [17,18], which was similar to the results shown by Tseng et al. [9]. To inhibit the transformation from α-Fe to β-Fe during the solution heat treatment, a high content of Si was employed in Al–6.5Cu–0.6Mn–0.5Fe alloy, however, the second intermetallics obviously agglomerated due to the precipitation of excess Si particles [11].
There exist two main kinds of intermetallics in 2219 wrought Al–Cu alloy, including Cu-rich intermetallics and Fe-rich intermetallics [19,20]. It is hard to prevent the formation of these intermetallics, since they may originate from (1) the content of Cu and Fe in 2219 Al–Cu alloy is over the solubility limit of Cu in Al. (2) before being forged or rolled into desirable components for the propellant tanks of large launch vehicle, a cylindrical ingot must be supplied. Generally, the cooling rate ranges from 1 to 20 K·s−1. (3) the excess of Mn in 2219 Al–Cu alloy forms Mn-rich compounds (named as Al20Cu2Mn3), which are mainly concentrated along the boundary during homogenization. The rod-like Al20Cu2Mn3 phase also can act as crack initiation sites during deformation, thereby deteriorating the ductility of the alloy. Thus, the nominal content of Mn is less than 0.4 wt.%.
Therefore, it is necessary to refine these coarse particles to improve the mechanical properties of 2219 wrought Al–Cu alloy. The ultrasonic melt treatment has been successfully employed to manufacture large-scale 2219 aluminum alloy ingots by Li et al. [20,21,22]. They observed that the coarse constituents were modified and its area fraction could be decreased from the center (69.07%) to the edge (22.10%) in the ultrasonicated ingot. In the work of He et al. [1,23], the number of Al2Cu coarse particles was clearly decreased, and the characteristic of Al2Cu particles exhibited a more spheroidized shape with increasing the temperature of multi-directional forging. They also observed that increasing the cold pre-deformation before solution treatment can promote the dissolution of coarse Al2Cu particles during solution treatment and a similar phenomenon was reported in the literature [24]. Dong et al. [3] employed cryogenic deformation to 2219 Al alloy forgings prior to solution treatment and found that the coarse Al2Cu particles were apt to dissolution because the cryogenic deformation caused more dislocation near the coarse particles. As a large number of dislocation formed around the particles during deformation, these particles could be in a higher energy state and were activated readily. In addition, dislocations also can act as fast channels for atomic diffusion. Thus, more coarse particles could dissolve into the matrix. All of these aforementioned conclusions were developed based on the refinement of the coarse Al2Cu particles. However, the evolution of Fe-rich intermetallic particles are rarely reported.
In the present work, we investigated the continuous evolution of Fe-rich intermetallic particles in 2219 wrought Al–Cu alloys as a function of Fe content across casting, homogenization, multidirectional forging (MDF), and solution-peak aging treatment. In addition, a comparative study of corresponding mechanical properties between casting, homogenization, MDF, and solution-peak aging treatment was carried out. Finally, the formation of Fe-rich intermetallic particles and correlation between these particles and tensile fracture behavior were discussed in detail.
2. Materials and Methods
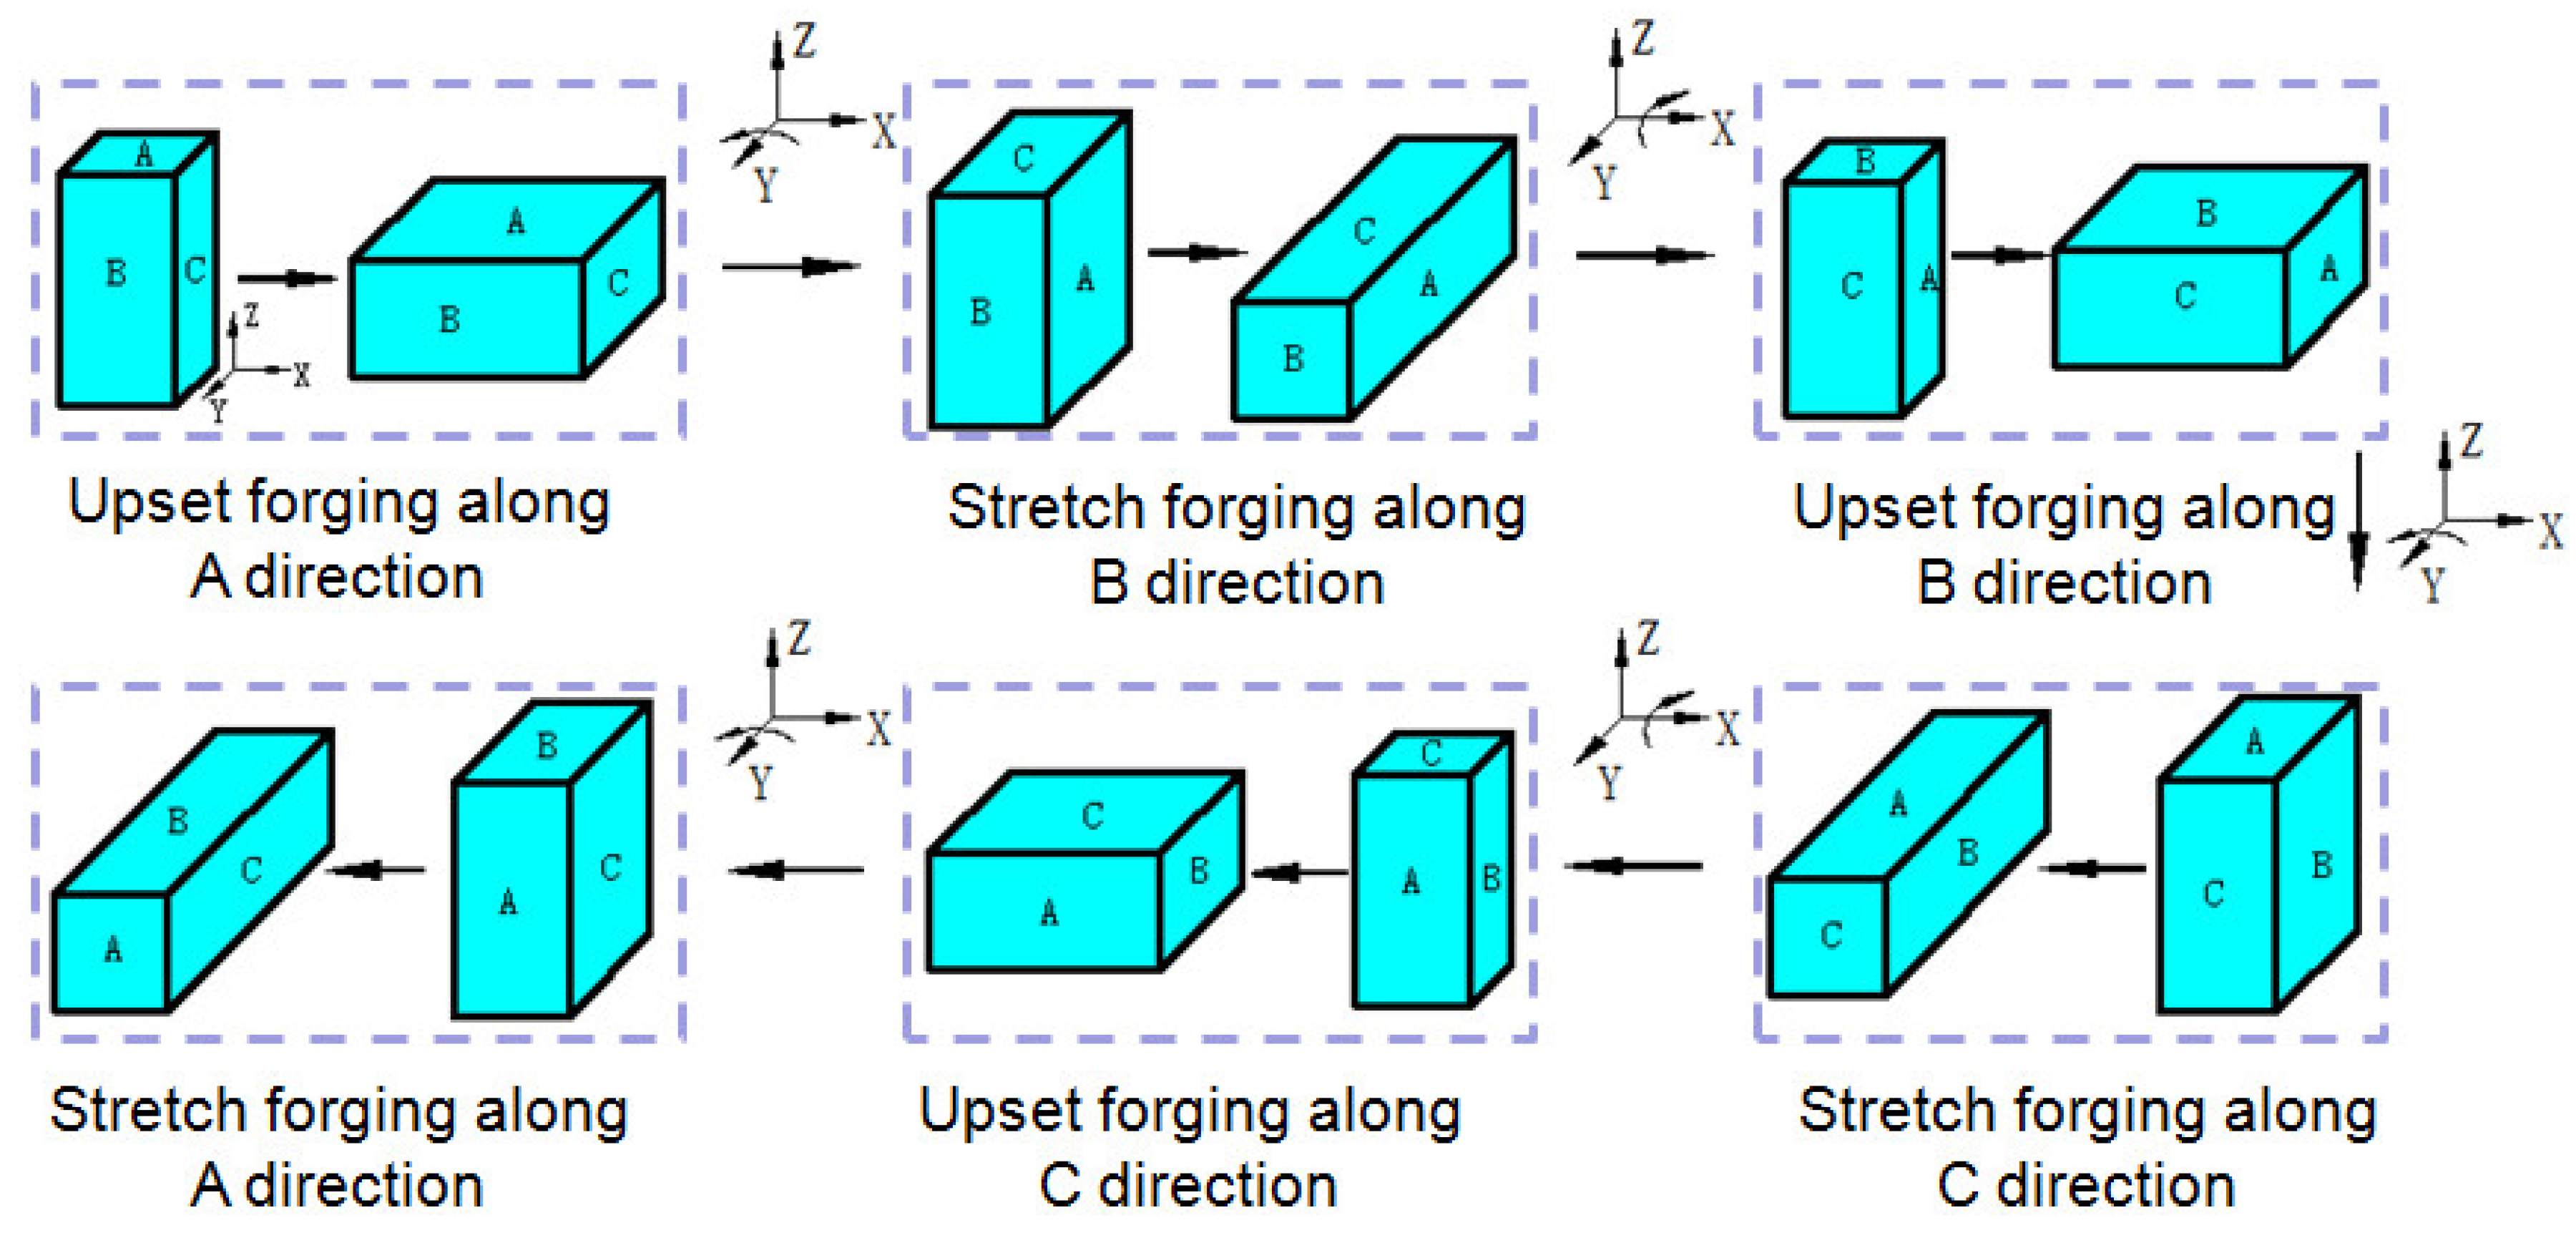
The 2219 Al–Cu alloys with different Fe contents were melted in an electrical resistance furnace and the final chemical compositions were listed in Table 1. The temperature of the melt was kept at 750–760 °C, followed by gentle stirring, degassing by C2Cl6, and filtering. The temperature of the melt dropped and held at 720–730 °C for 30 min, and then it was poured into a cylindrical steel mold with a diameter of 100 mm. The as-cast alloys were firstly homogenized at 525 ± 2 °C for 24 h, and then cubic samples measuring 90 mm × 90 mm × 150 mm were cut off from the homogenized ingots. Subsequently, the samples were subjected to complex thermo-mechanical treatment (TMT) process, including 2 cycles of MDF by changing the axis through 90° (X, Y, Z), adding solution treatment at 545 ± 2 °C for 4 h in the middle of the MDF, and 1 pass of shape-forging with a height reduction of 50%. Before the MDF process, the cubic samples were kept at 450 °C for 1.5 h. The temperature of MDF was around 450 ± 20 °C and the compression speed of MDF was 6 mm/s by using a numerically controlled hydraulic press (YH27-500T; Hefei Forging Machine Co. Ltd., Hefei, China). The schematic diagram of the MDF process was shown in Figure 1. In each upset forging, the samples were compressed along different direction (A, B, C in order) at a forging ratio of 50%. Then samples were flipped around the Y axis and forced to stretch along the un-deformed direction. After MDF, the samples were solution-treated at 537 ± 2 °C for 4 h and immediately quenched in water at room temperature, followed by cold pre-deformation by 3% and artificial aging at 165 °C for 24 h.
The microstructures and fracture morphologies were examined by using a Leica DM4000M optical microscopy (OM; Leica Microsystems, Wizz, German) and a Nova Nano SEM230 scanning electron microscopy (SEM; FEI Co., Hillsboro, OR, USA) equipped with an energy dispersive X-ray spectrometer (EDS). After that, the size of the second-phase particles was the arithmetic mean of at least ten measured values using Image J analyzer software at the basis of ten SEM images from different positions for each sample. The tensile specimens were machined from different processing approaches according to the standard of GB/T228-2002. The gauge dimensions of tensile samples were 70 mm in length, 10 mm in width, and 2 mm in thickness. Following mechanical grinding, the tensile tests were performed in an Instron 3369 electronic universal testing machine (Instron Co., Canton, MA, USA) at room temperature. The extension was 2 mm/min. The data reported below were an average value of at least three independent tensile samples.
3. Results
3.1. The Microstructure Evolution of Fe-Rich Intermetallics
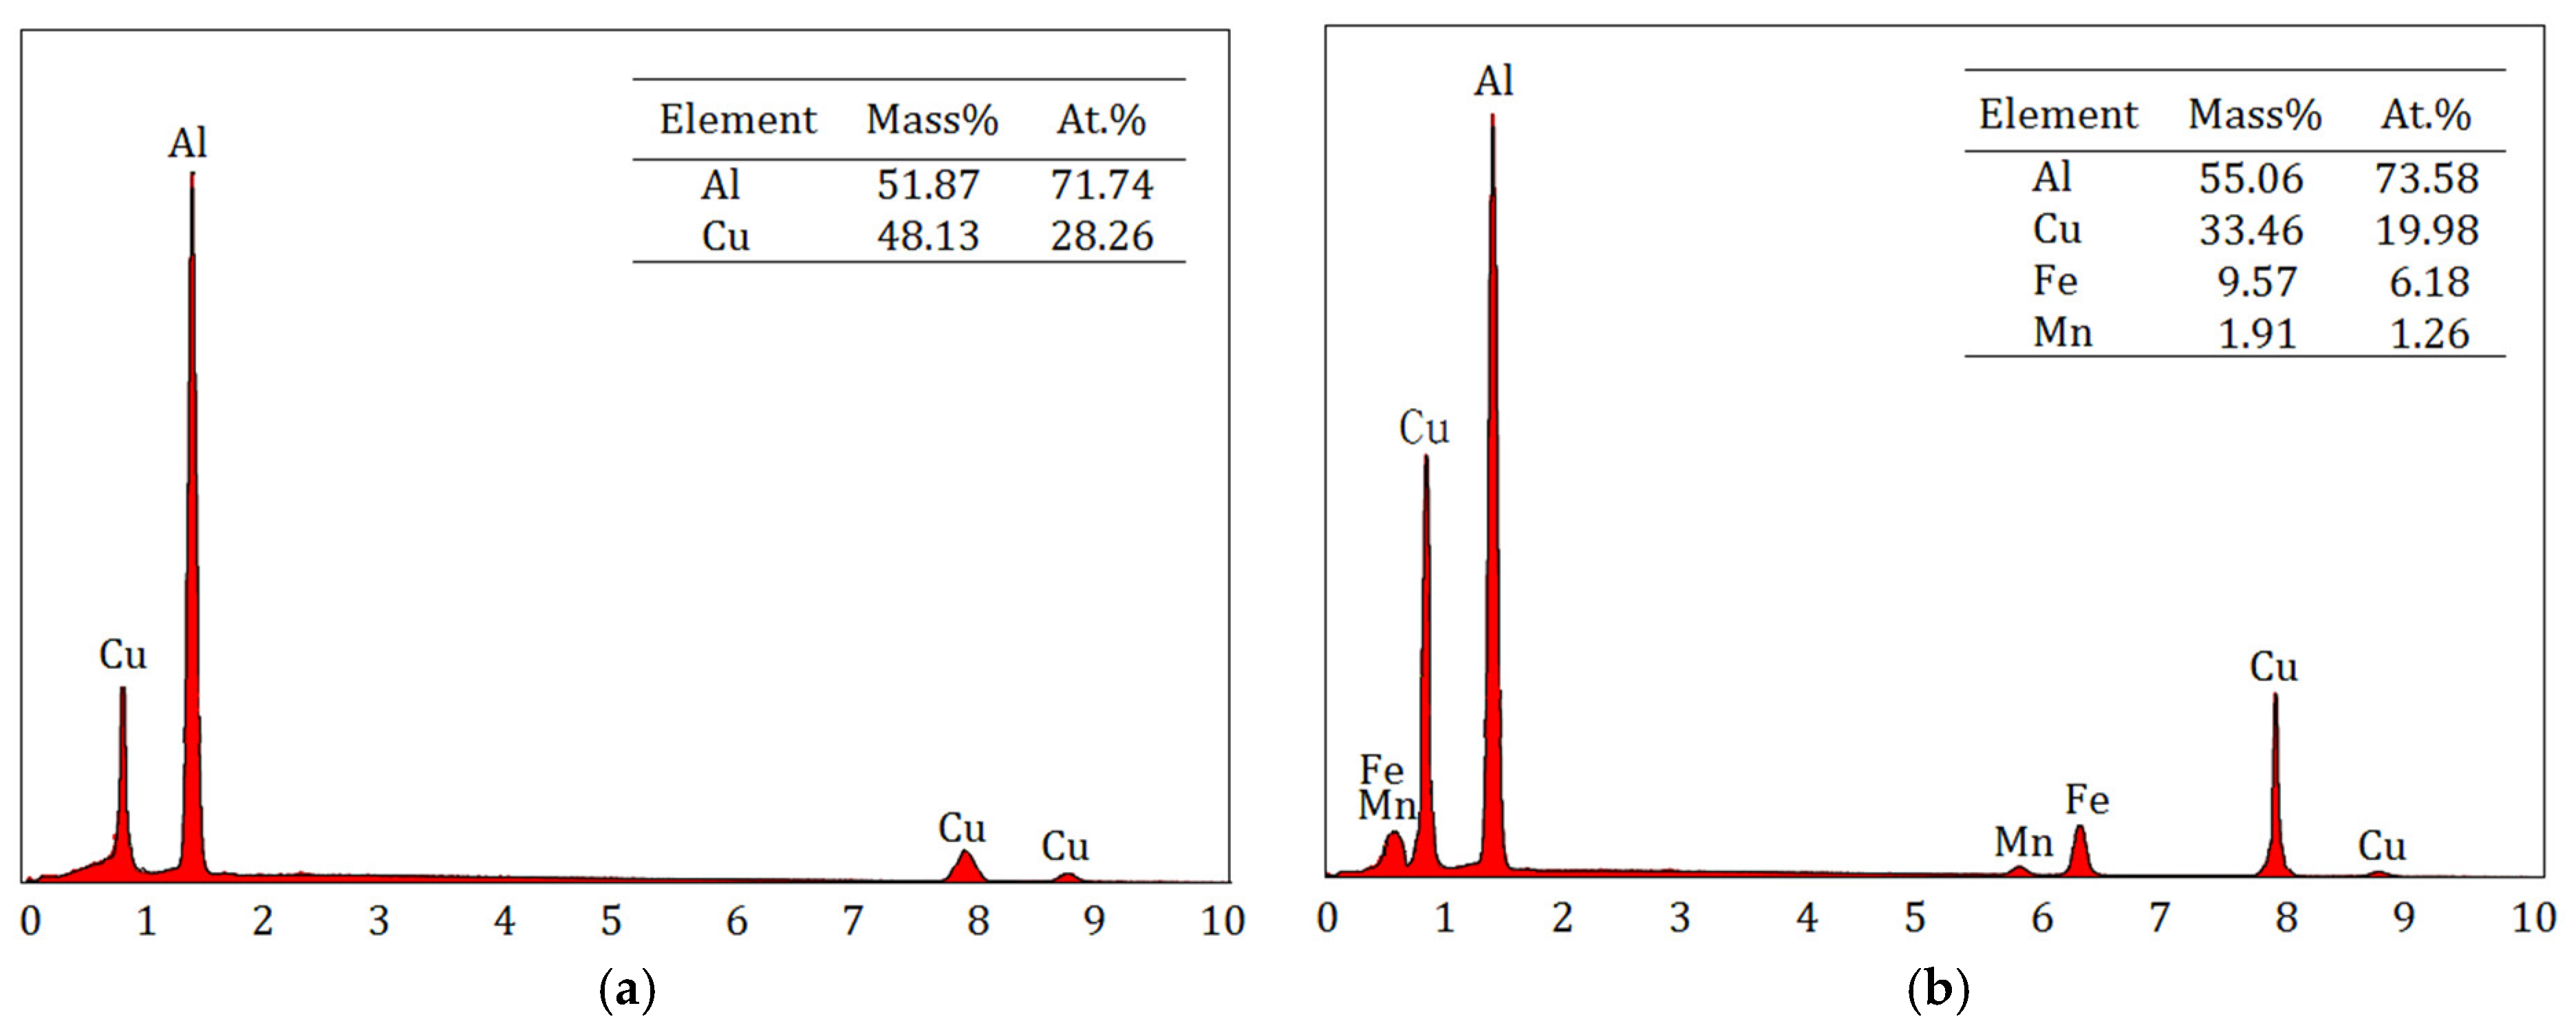
Figure 2 shows the microstructures of as-cast alloys with Fe content varying from 0.03 to 0.20 wt.%. A typical dendrite features can be observed in all as-cast alloys, while a new phase obviously appeared as needle-like in 0.10 wt.% Fe alloy. The black needle-like intermetallics were observed to increase significantly in both size and amount with the increase of Fe content from 0.1 to 0.2 wt.% (as indicated by the arrows). To confirm these constituents (as marked by the crosses in Figure 2c), EDS was employed (as seen in Figure 3). The results indicated that the Cu-rich intermetallics (Point A) contained 71.74 at.% Al and 28.26 at.% Cu, which agreed with the Al2Cu phase, while the composition of the needle-like phase (Point B) was close to Al7Cu2(Fe, Mn). It is worth noticing that the needle-like Al7Cu2(Fe, Mn) phase mainly distributed across the dendrite, due to its formation through a peritectic reaction.
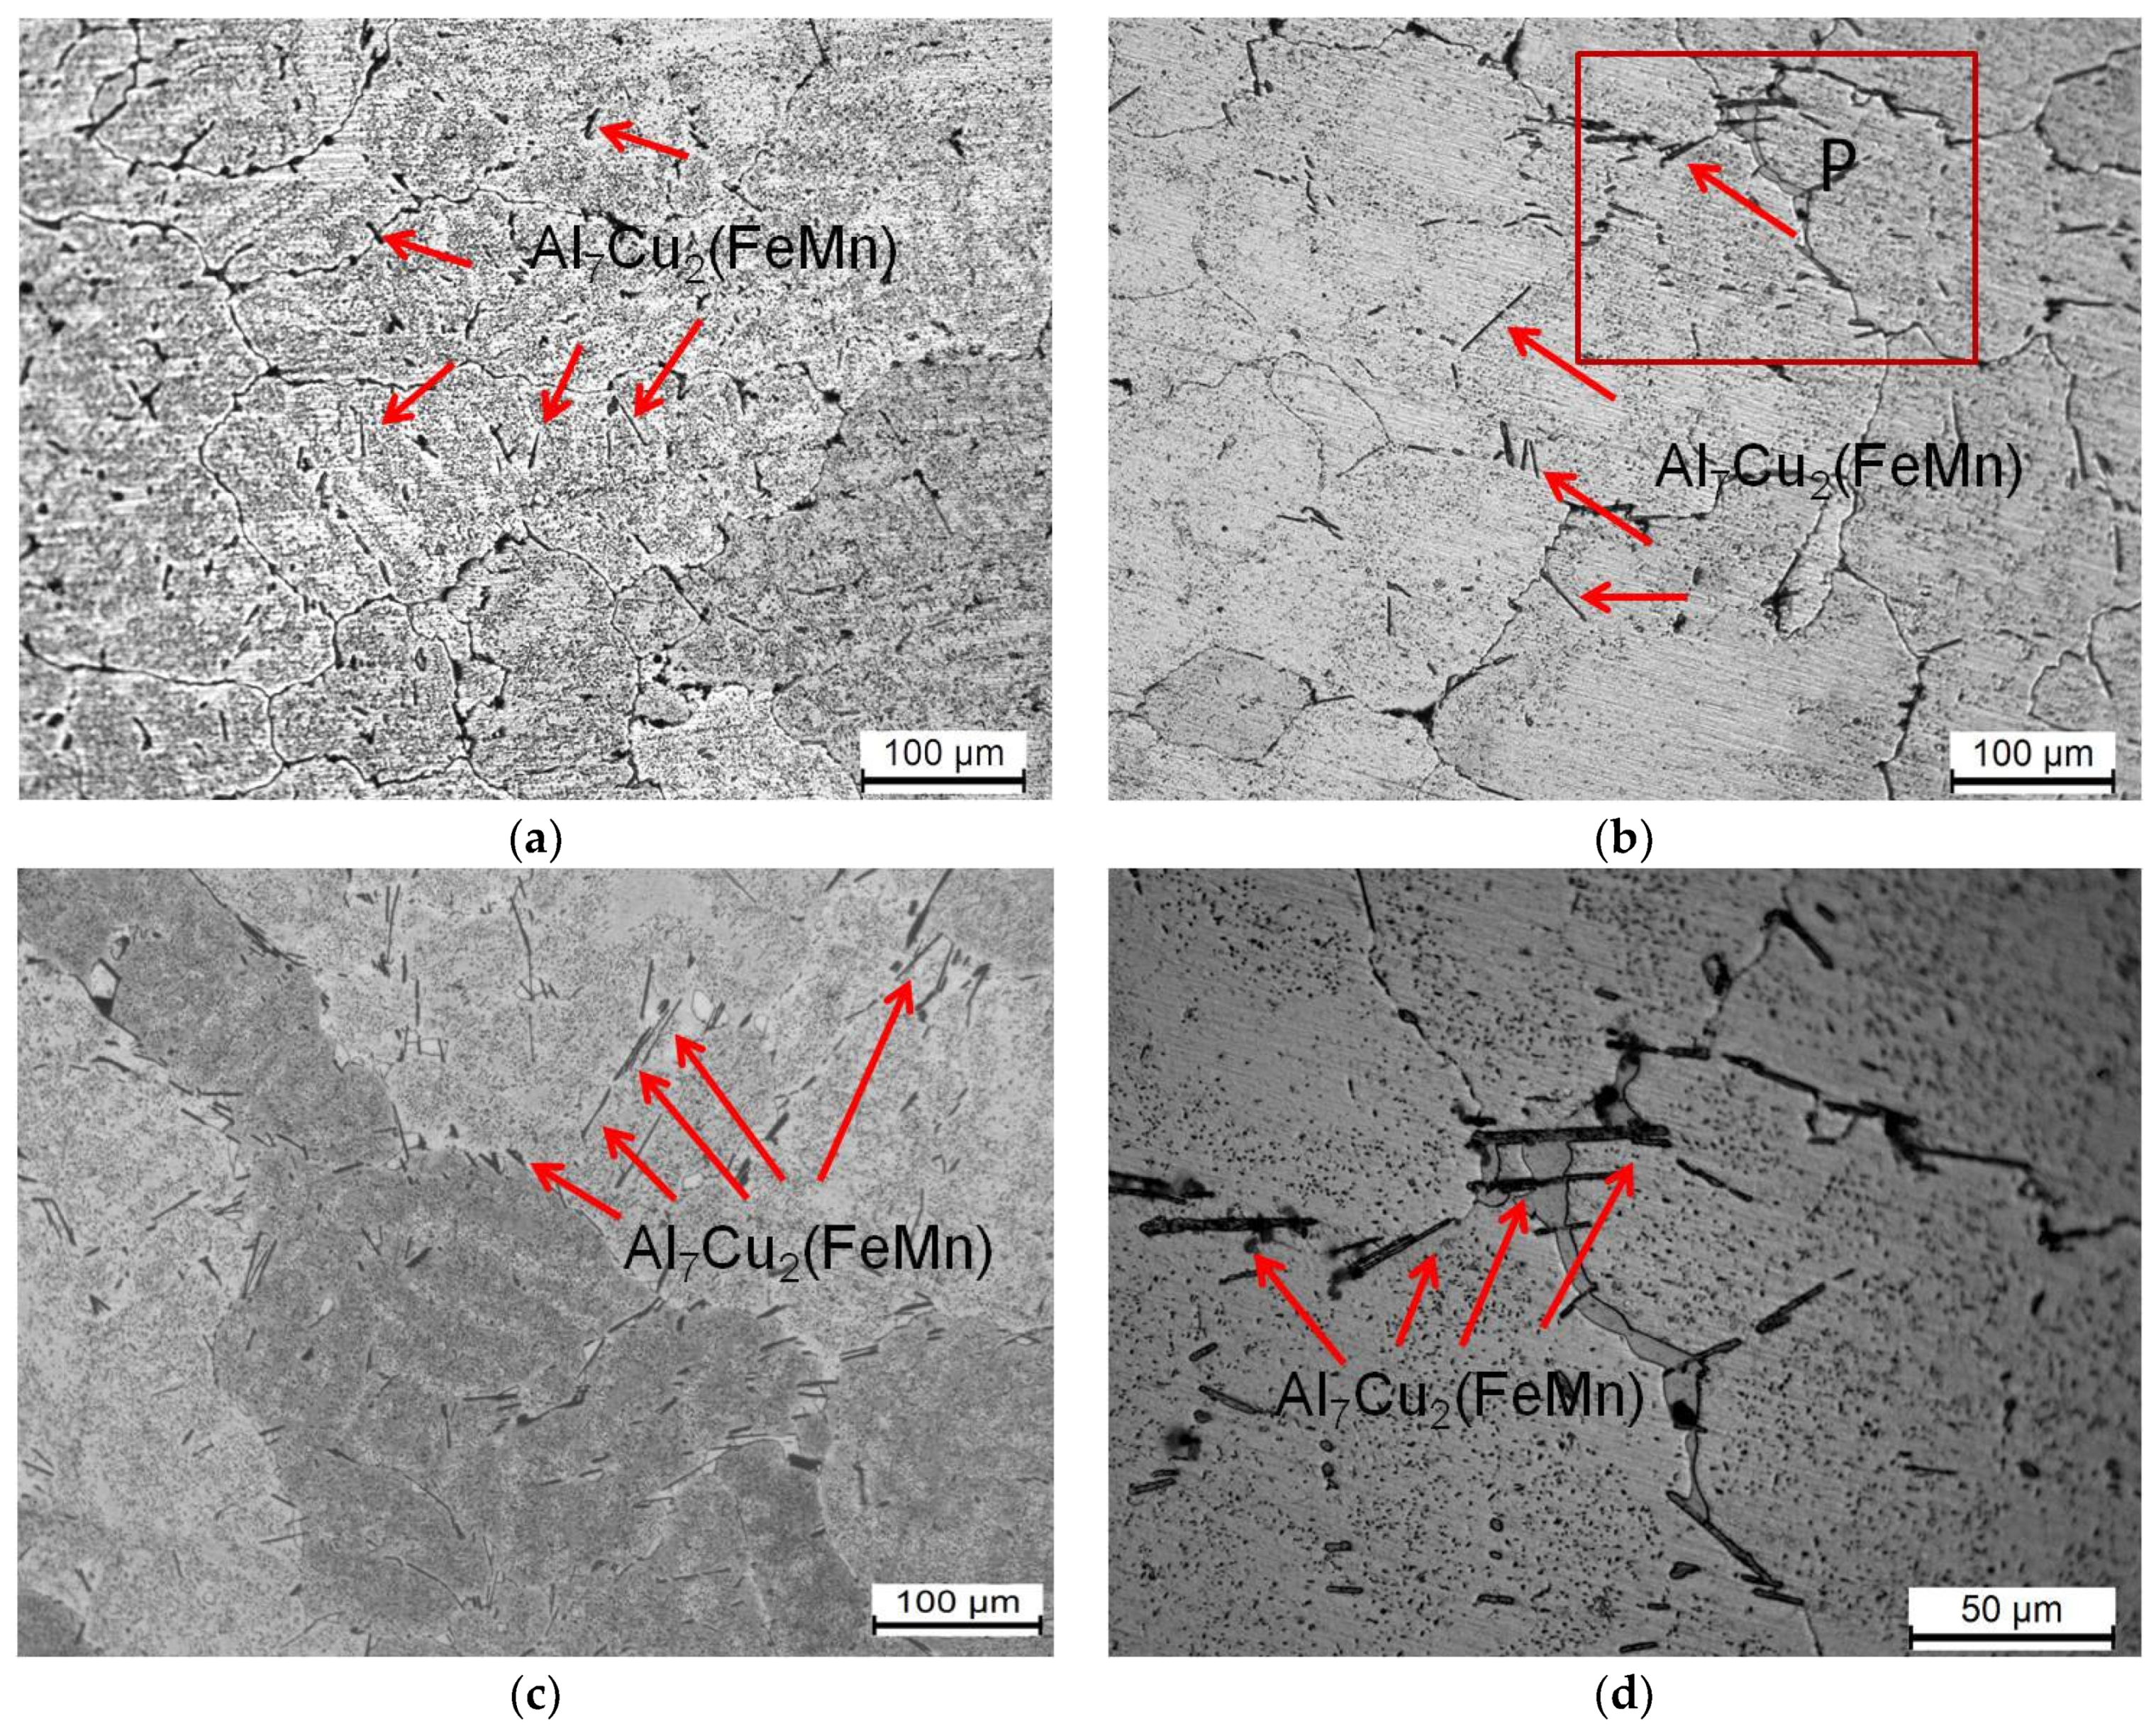
Figure 4 shows the microstructures of homogenized alloys with Fe content varying from 0.10 to 0.20 wt.%. It can be seen that the dendrite features still existed, whereas they became thinner and clearer. However, the overall morphology of the needle-like Al7Cu2(Fe, Mn) intermetallics does not change (as seen in Figure 4d).
Figure 5 shows the microstructures of aged alloys with Fe content varying from 0.03 to 0.20 wt.%. It can be seen that the average grain sizes were large and the un-dissolved coarse particles mainly exhibited inside the grain. Meanwhile, the amount and size of the coarse particles decreased obviously (as indicated by the arrows). During the multidirectional forging process, the coarse particles were subjected to stress concentration then can act as crack initiators because of the different elastic modulus of the coarse particle and its matrix counterpart. Moreover, the high density of dislocations can accumulate at their interfaces. These particles could be in a higher energy state and were activated readily, inducing the cracking of these coarse particles. Thus, the dynamic fragmentation of these coarse particles was expected to take place during forging. During the subsequent solution treatment, most of the fragmented Al2Cu particles were dissolved in the alloy matrix, while the Al7Cu2(Fe, Mn) particles were un-dissolved in the alloy matrix due to the different solubility of Cu and Fe in the Al matrix.
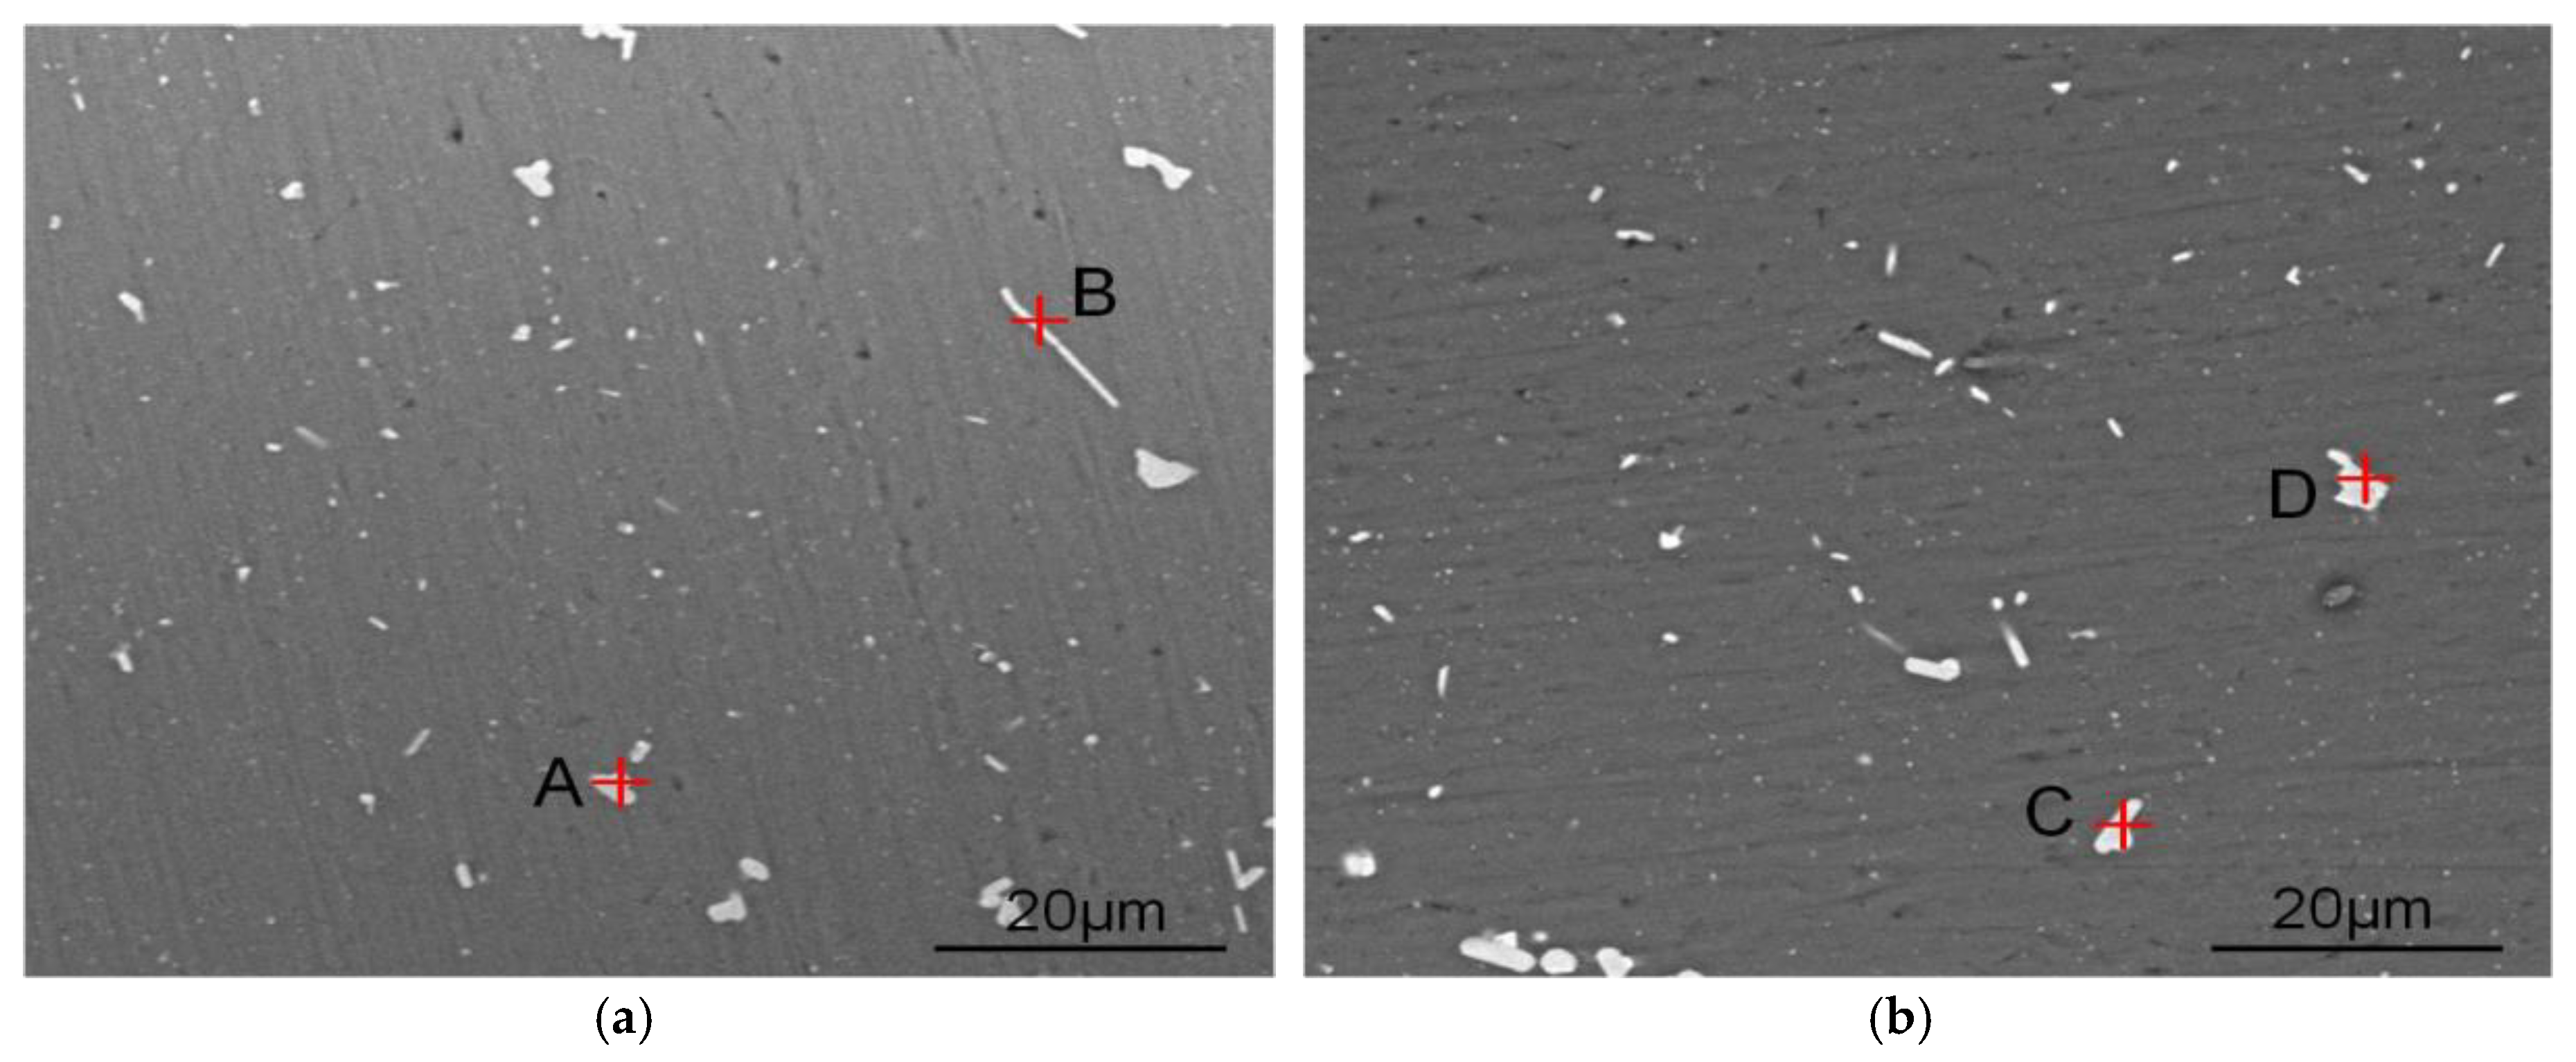
In order to evaluate the un-dissolved particles, the microstructures of aged alloys with different Fe contents were further observed by SEM, as shown in Figure 6. The corresponding EDS analysis as shown in Table 2 reveals that the more granular particles were Al2Cu phase (as marked by point A and D) and the rod-like particles with sharp edges were Al7Cu2(Fe, Mn) phase (as marked by point B and C in Figure 6). The reason was that compressive stress can be exerted on Al2Cu and Al7Cu2(Fe, Mn) particles during multidirectional forging process, then the particle can be fragmented when the applied stress was greater than its strength limit. In the subsequent solution treatment, partial Al2Cu particles would be dissolved into the Al matrix, however, the fragmented Al7Cu2(Fe, Mn) particles could not be dissolved into the Al matrix due to the insolubility of Fe in Al–Cu alloy. Namely, compared with the refinement mechanism of Al2Cu particles, only fragmentation took place in Al7Cu2(Fe, Mn) particles.
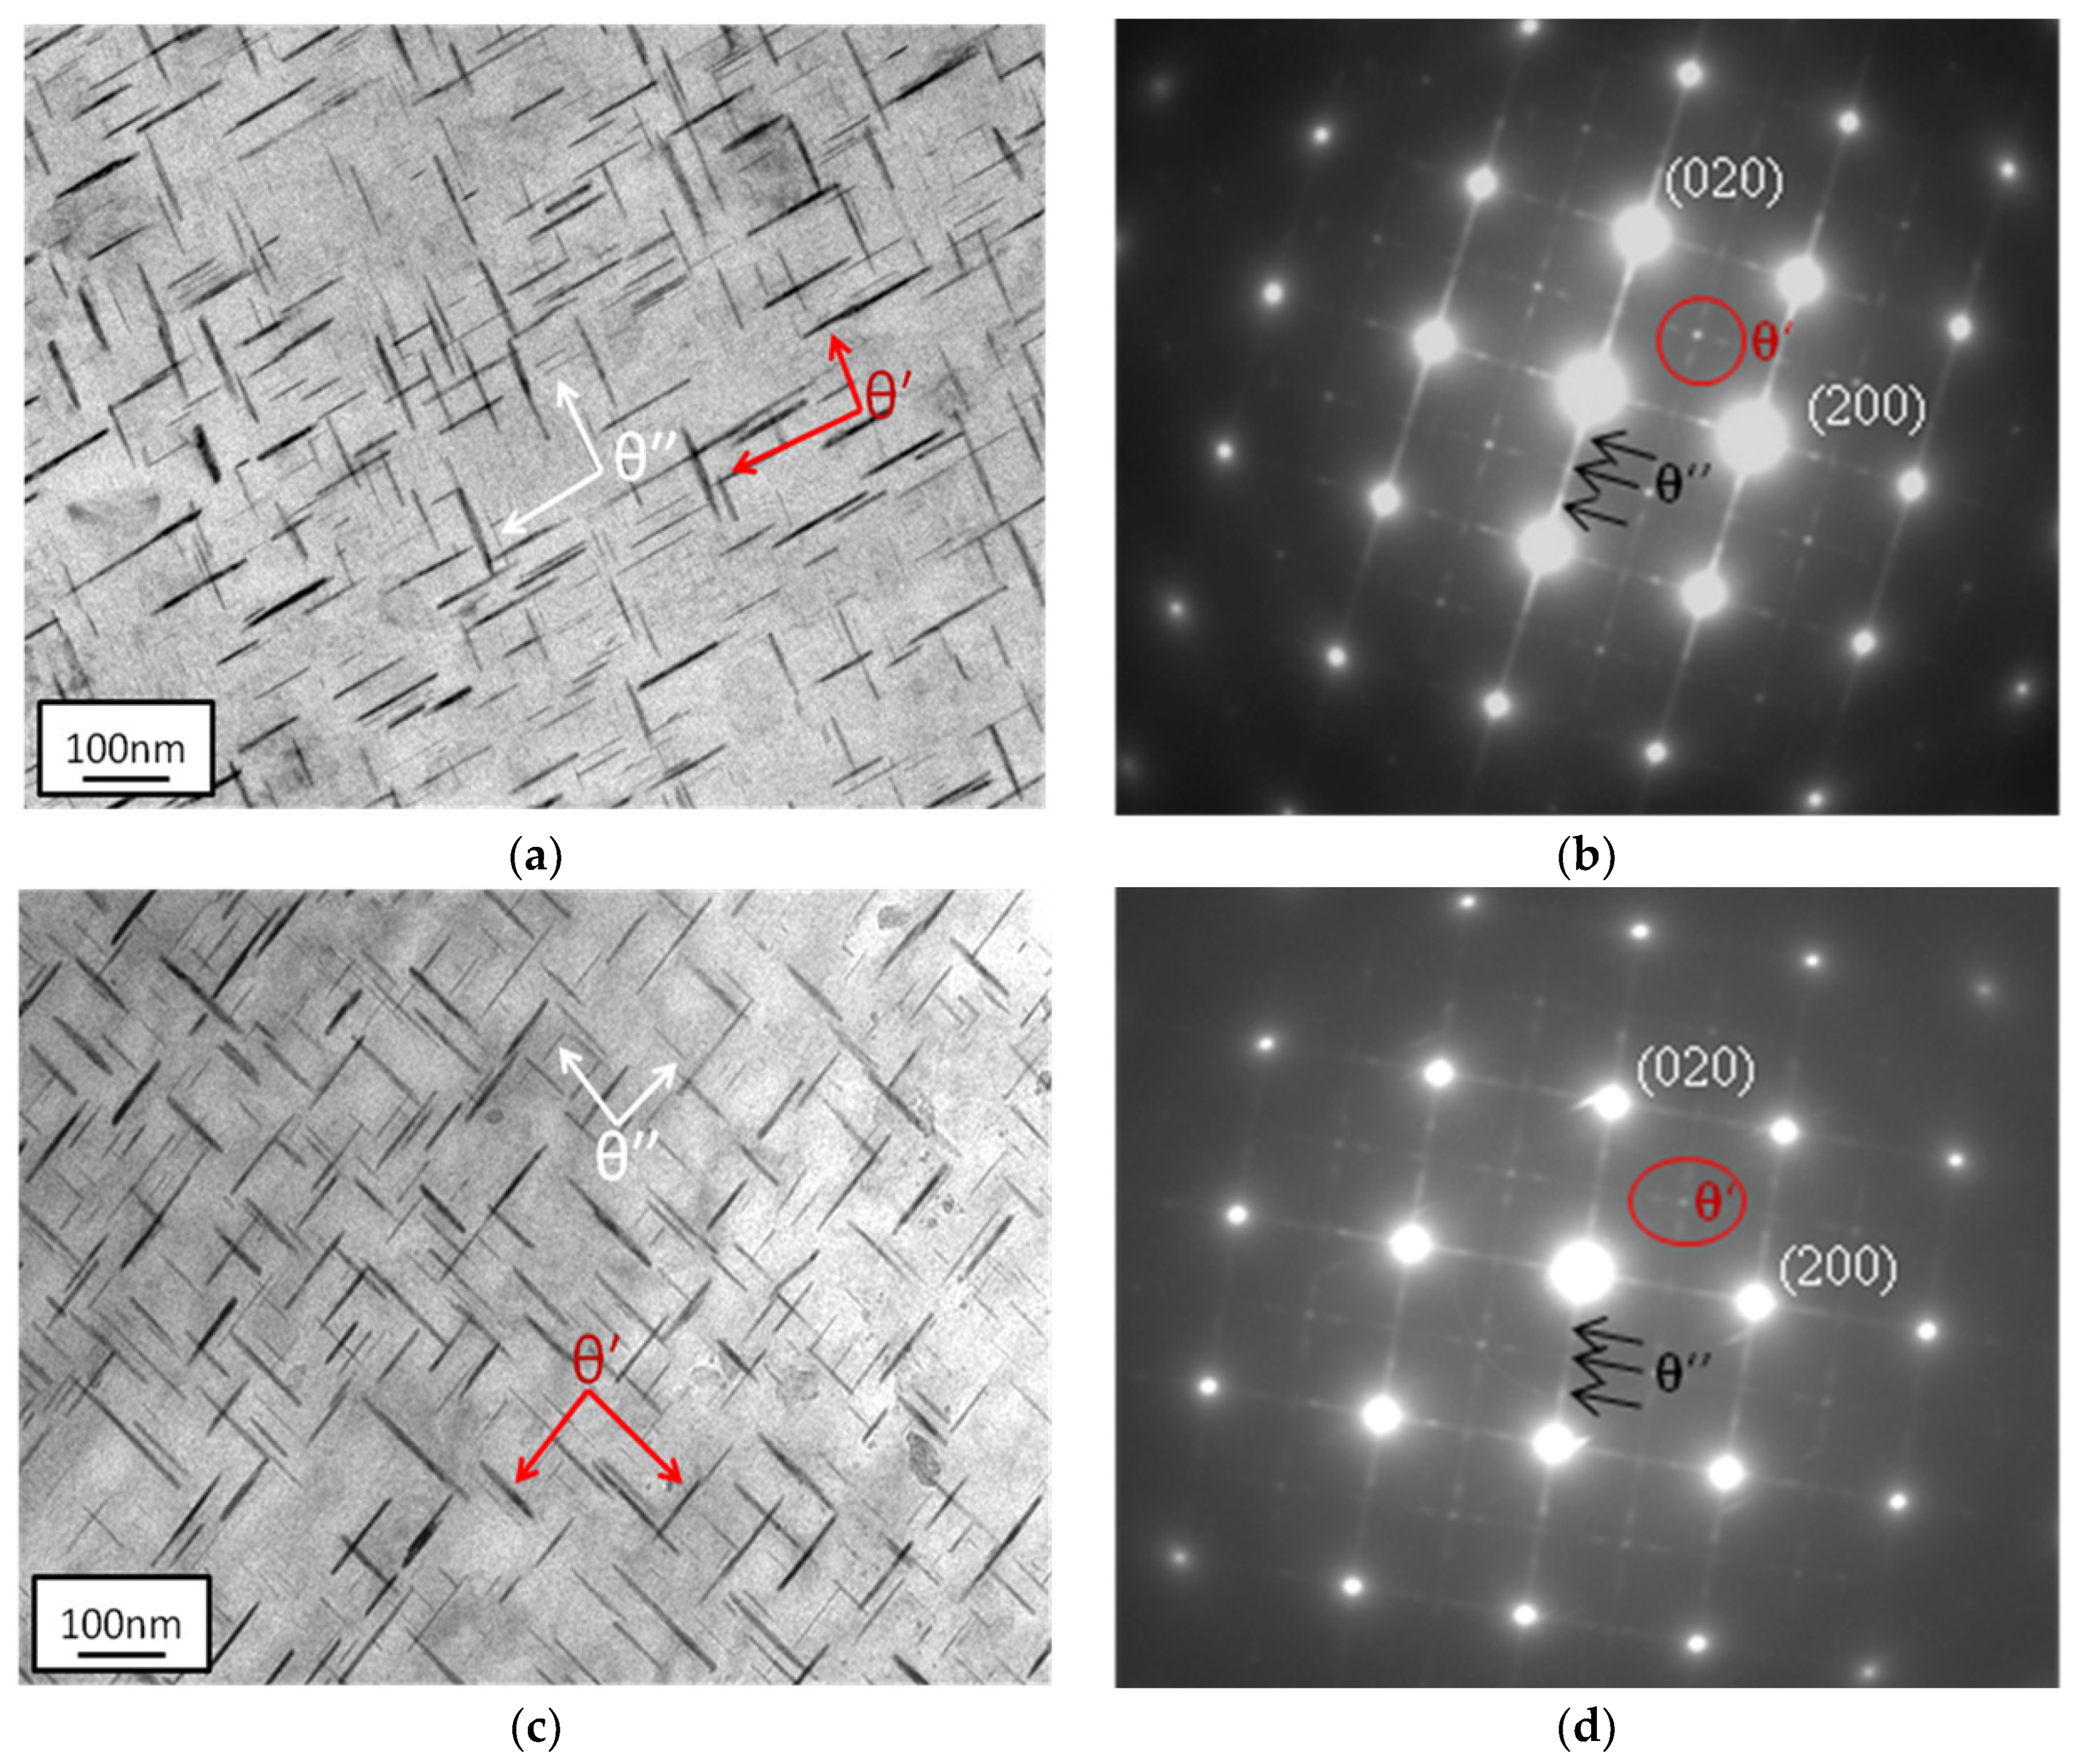
Figure 7 shows the Transmission electron microscopy (TEM) images and corresponding diffraction spots of aged alloys with Fe contents. As seen from the diffraction spots, there were two kinds of perpendicular precipitates, named as θ′ phase (coarse precipitates with a mean length of ~99 nm) and θ″ phase (fine precipitates with a mean length of ~26 nm), respectively. It was found that the number and size of these two precipitates did not change obviously with the increase of impurity Fe content. Calculated carefully by the particle-diameter analysis software, the area fraction of the precipitates reduced from 6.5% to 6.1% with increasing the Fe content from 0.03 to 0.20 wt.%. Compared with the tensile tested results with different Fe contents, the change of Fe content had little influence on strength, as shown in Figure 8.
3.2. Mechanical Properties and Tensile Fracture Morphology
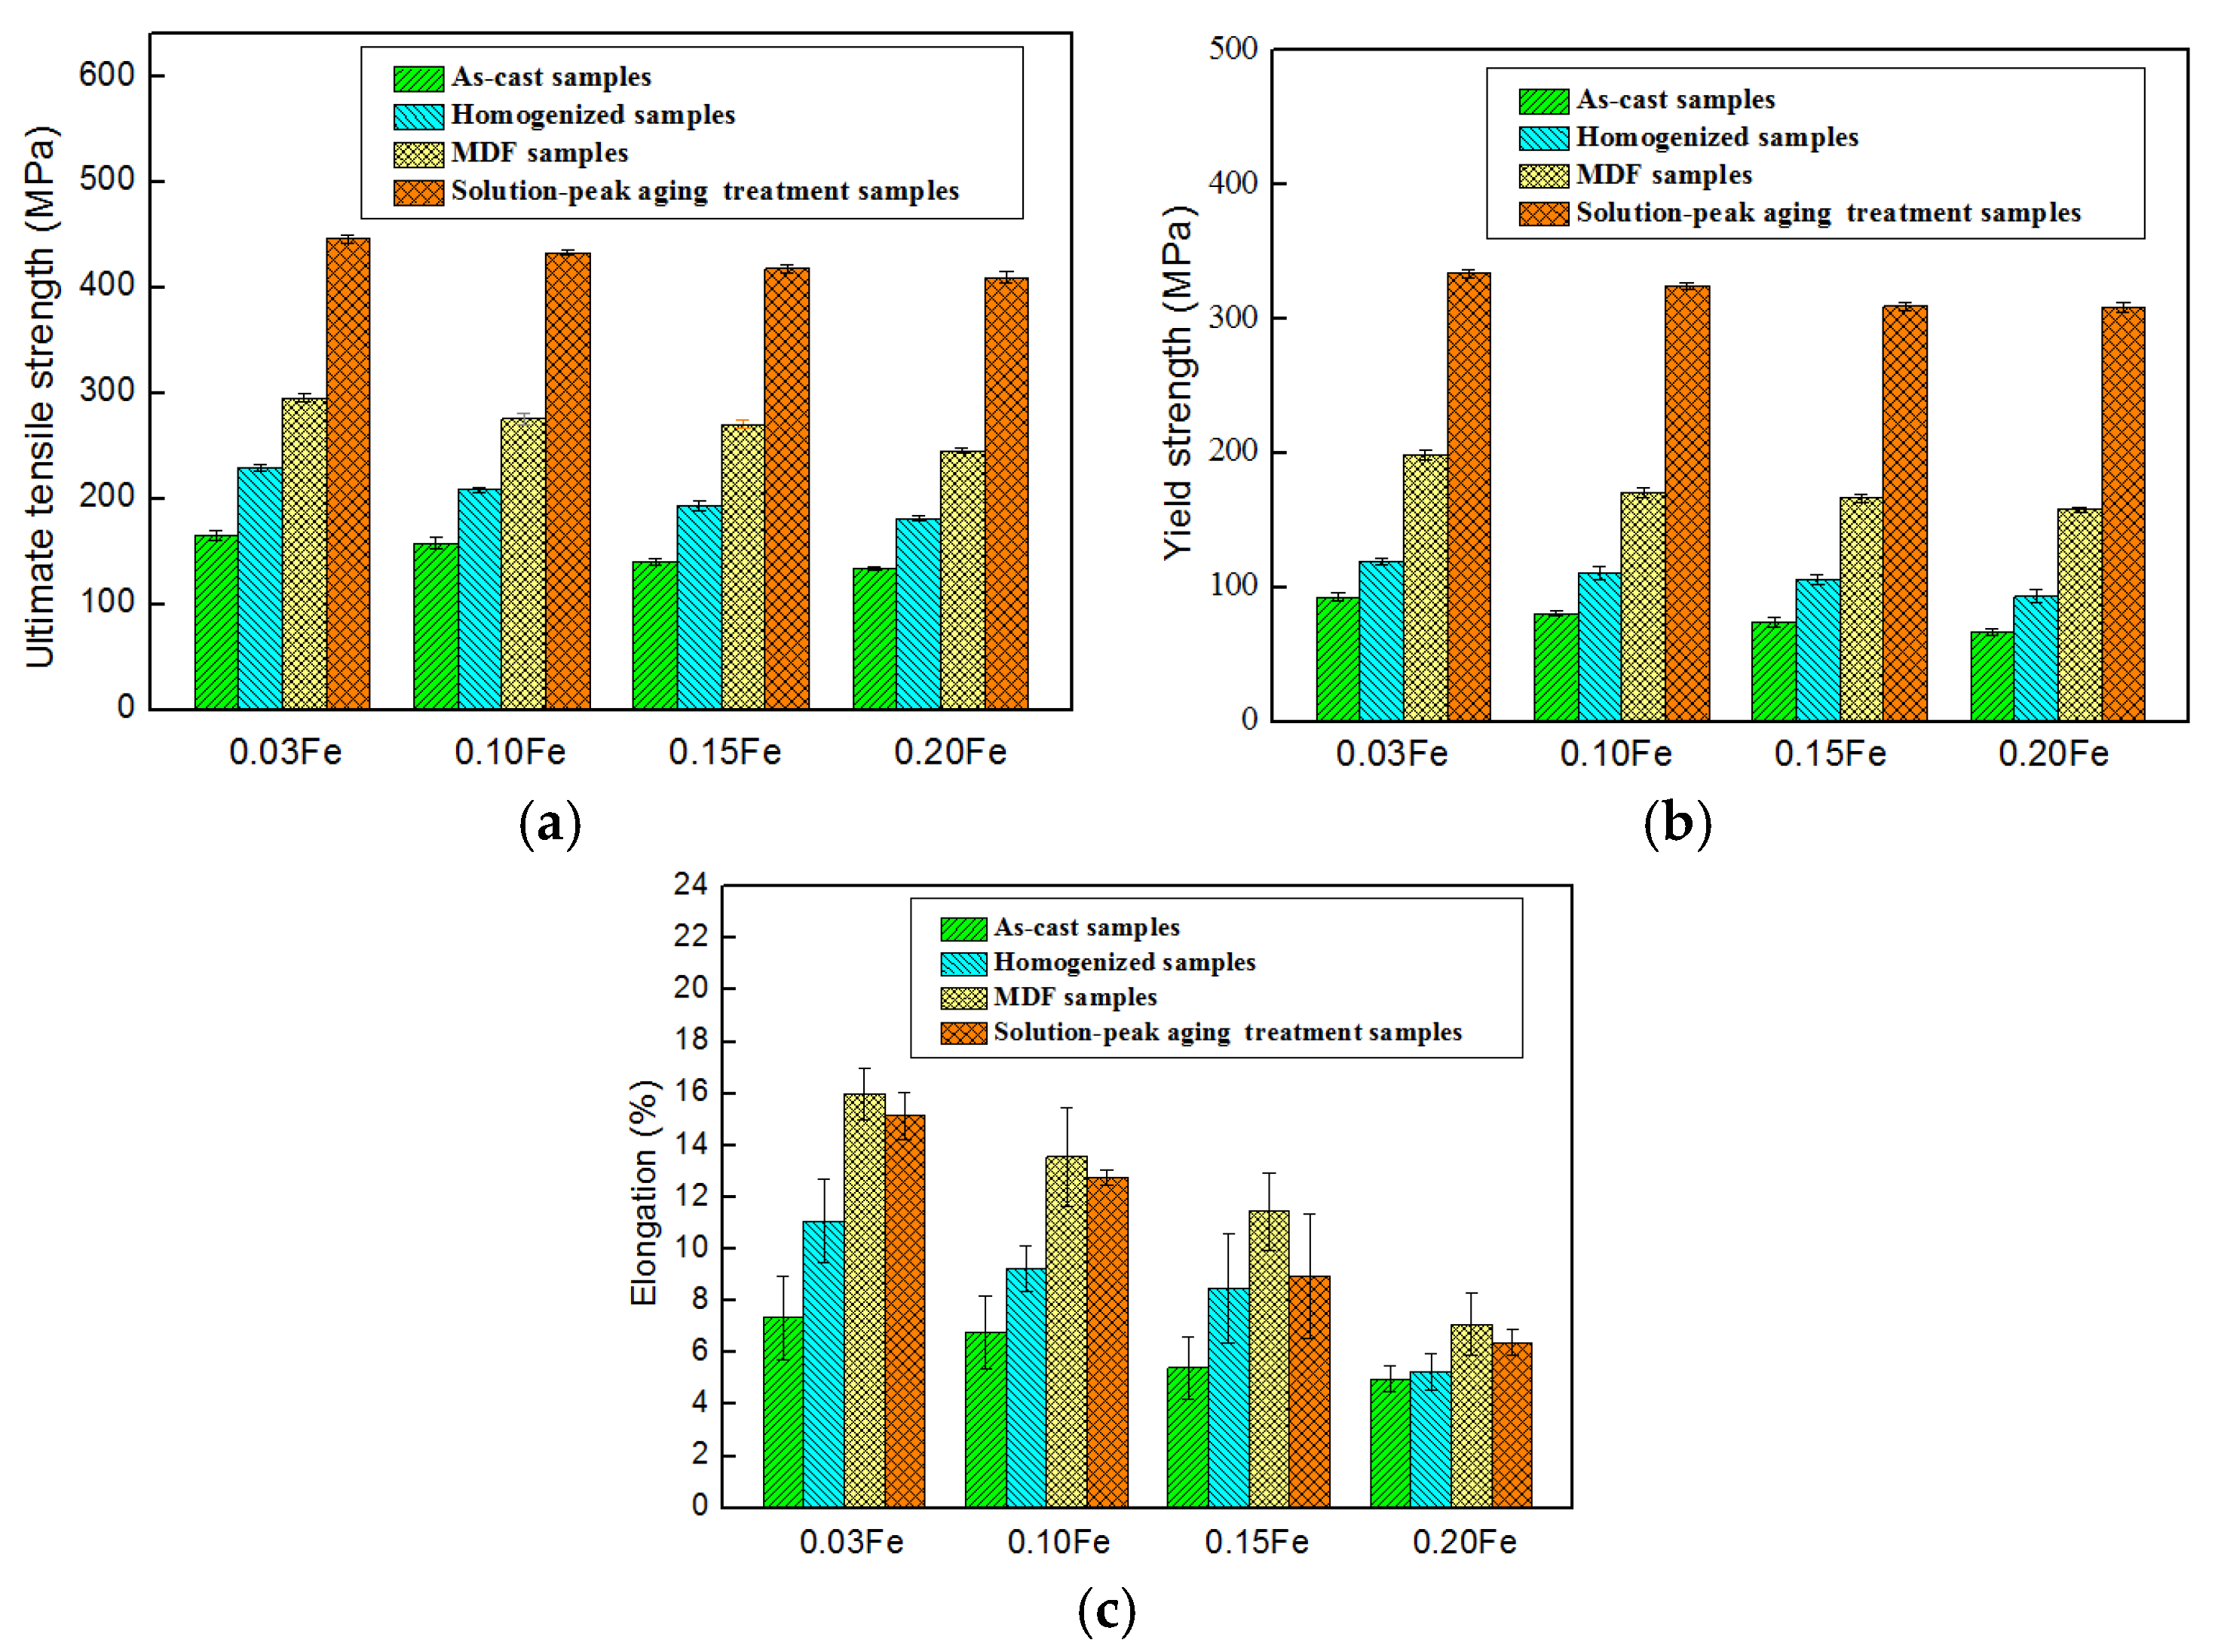
Figure 8 illustrates the mechanical properties against different processing approaches, i.e., as-cast, homogenization, MDF, and solution-peak aging treatment. All of the samples show the same trend of ultimate tensile strength (UTS), yield strength (YS), and elongation (EL) variation from the processes of as-cast to peak aging stage. It also can be seen that under the same processing condition, similar tendency of UTS, YS, and EL variation with increasing the Fe content. The as-cast samples presented relatively low values of UTS/YS/EL, i.e., 165.35/92.56 MPa and 7.34% for 0.03 wt.% Fe alloy, 157.61/80.67 MPa and 6.79% for 0.10 wt.% Fe alloy, 140.29/74.44 MPa and 5.41% for 0.15 wt.% Fe alloy, and 133.77/66.52 MPa and 4.98% for 0.20 wt.% Fe alloy. The UTS/YS/EL values of all as-homogenized samples increased slightly compared with cast process. For MDF samples, the UTS/YS values continued to rise slightly, while the maximum EL values were observed to be 15.99%, 13.56%, 11.46%, and 7.09% corresponding to the Fe contents of 0.03, 0.10, 0.15, and 0.20 wt.%, respectively. The solution-peak aging treatment significantly increased the UTS/YS values by at least 270/90 MPa, respectively, compared with the as-cast condition. For peak aging samples, the UTS and YS decreased slightly from 445.64 to 432.87 MPa (an decrease by 2.87%) and 333.76 to 324.36 MPa (a decrease by 2.81%) respectively, and the EL decreased remarkably from 15.14 to 12.76% (a decrease by 15.71%) with an increase in Fe content from 0.03 to 0.10 wt.%. Further increasing the Fe content to 0.20 wt.%, the UTS and YS decreased to 409.34 and 308.29 MPa, respectively, and the EL reduced to 6.37%. The UTS, YS, and EL decreased by 36 MPa, 25 MPa, and 57.92%, respectively, which compared to the respective values of the 0.03 wt.% Fe alloy.
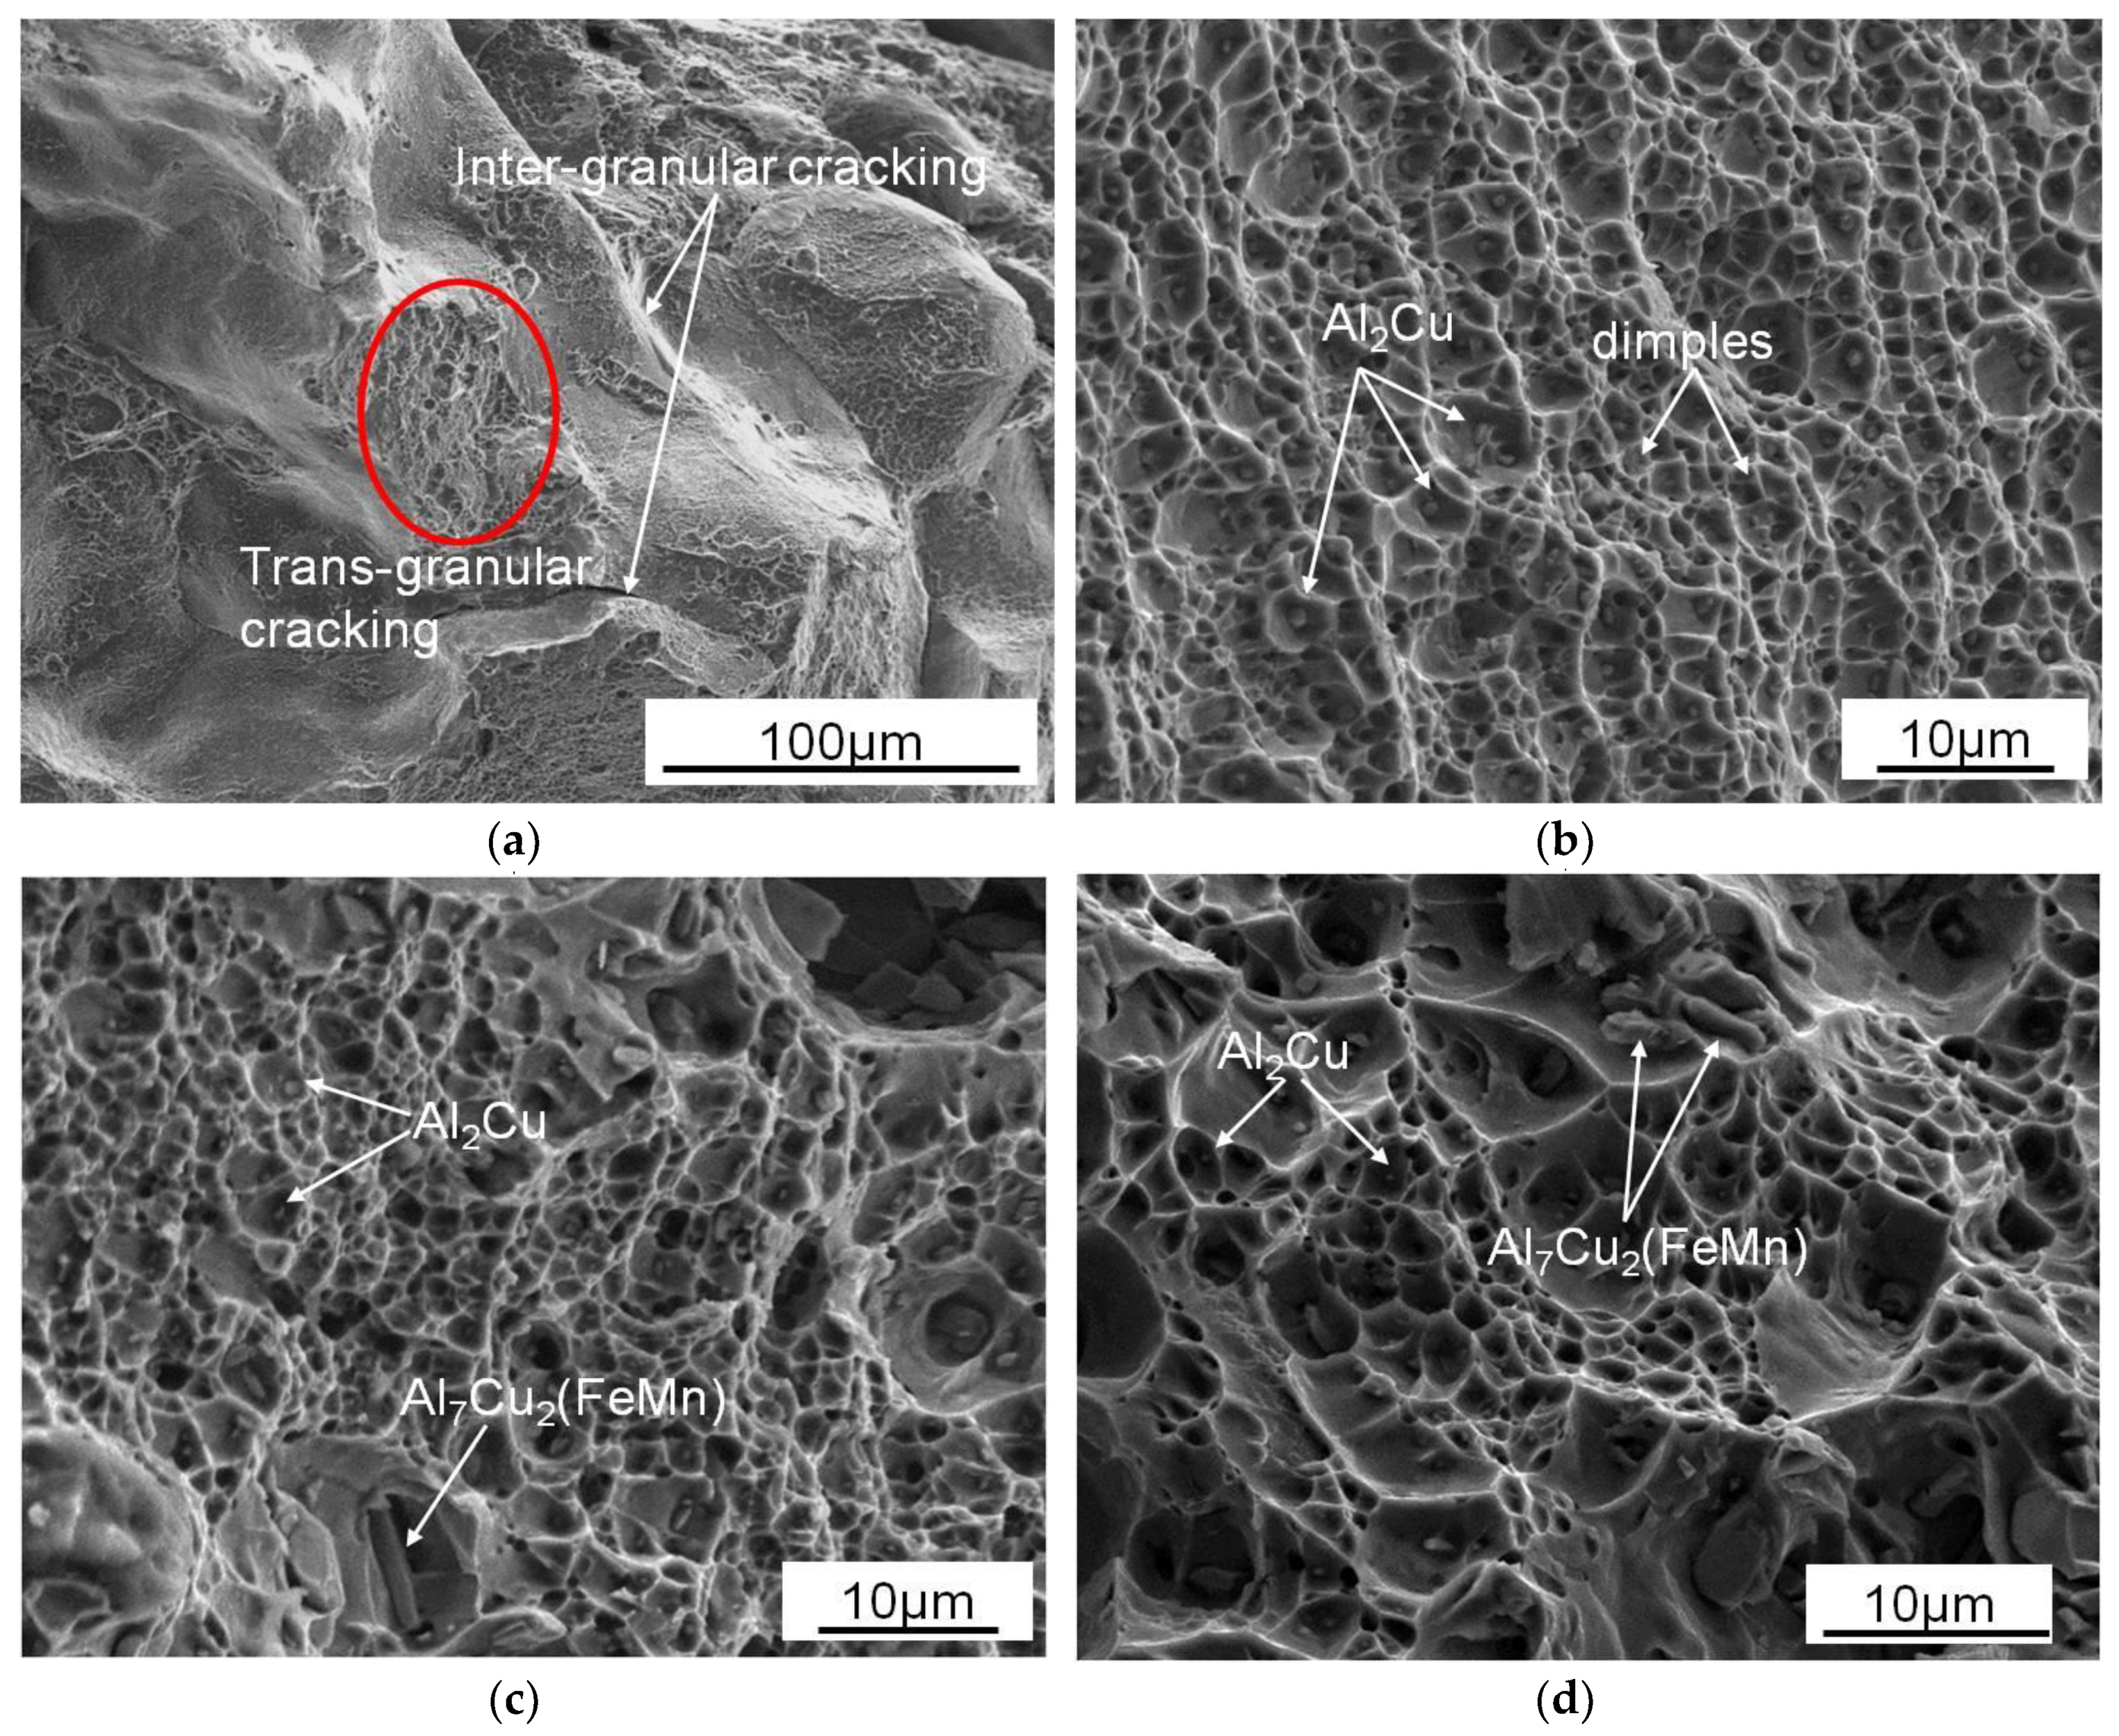
Figure 9 shows the tensile fracture morphology of aged alloys with different Fe contents. It can be seen that the fracture of tensile specimens with 0.03 wt.% Fe was predominantly dominated by inter-granular fracture (as seen in Figure 9a). Higher magnification observations of a rough surface (as marked by the ellipse in Figure 9a), trans-granular fracture caused by the particle-matrix interface decohesion also existed, as shown in Figure 9b. The dimples around the fine spherical Al2Cu particles were considerably shallow in the size less than 6 um. As the Fe content increased to 0.10 wt.%, a typical bimodal dimple size distribution was observed on the rough surface and the main fracture mode was diverted to trans-granular fracture, as shown in Figure 9c. The first population of dimples, named as larger primary dimples, were formed by the fracture of Fe-rich constituent particles, whereas the other population of dimples with finer sizes occupied the ligaments between the primary dimples were the result of particle–matrix interface de-cohesion. The similar fracture feature was found in the tensile specimen with 0.20 wt.% Fe (as seen in Figure 9d). However, the population of primary dimples caused by coarse constituent particles was observed to be more and the size of partial dimples increased to 20 µm. In brief, with an increase in Fe content, the un-dissolved Fe-rich impurity particles increased as a result, and tended to crack formation because a higher stress concentration existed at the larger particles during deformation, which was in accord with the tensile tested results.
4. Discussion
4.1. Fe-Rich Intermetallics Analysis
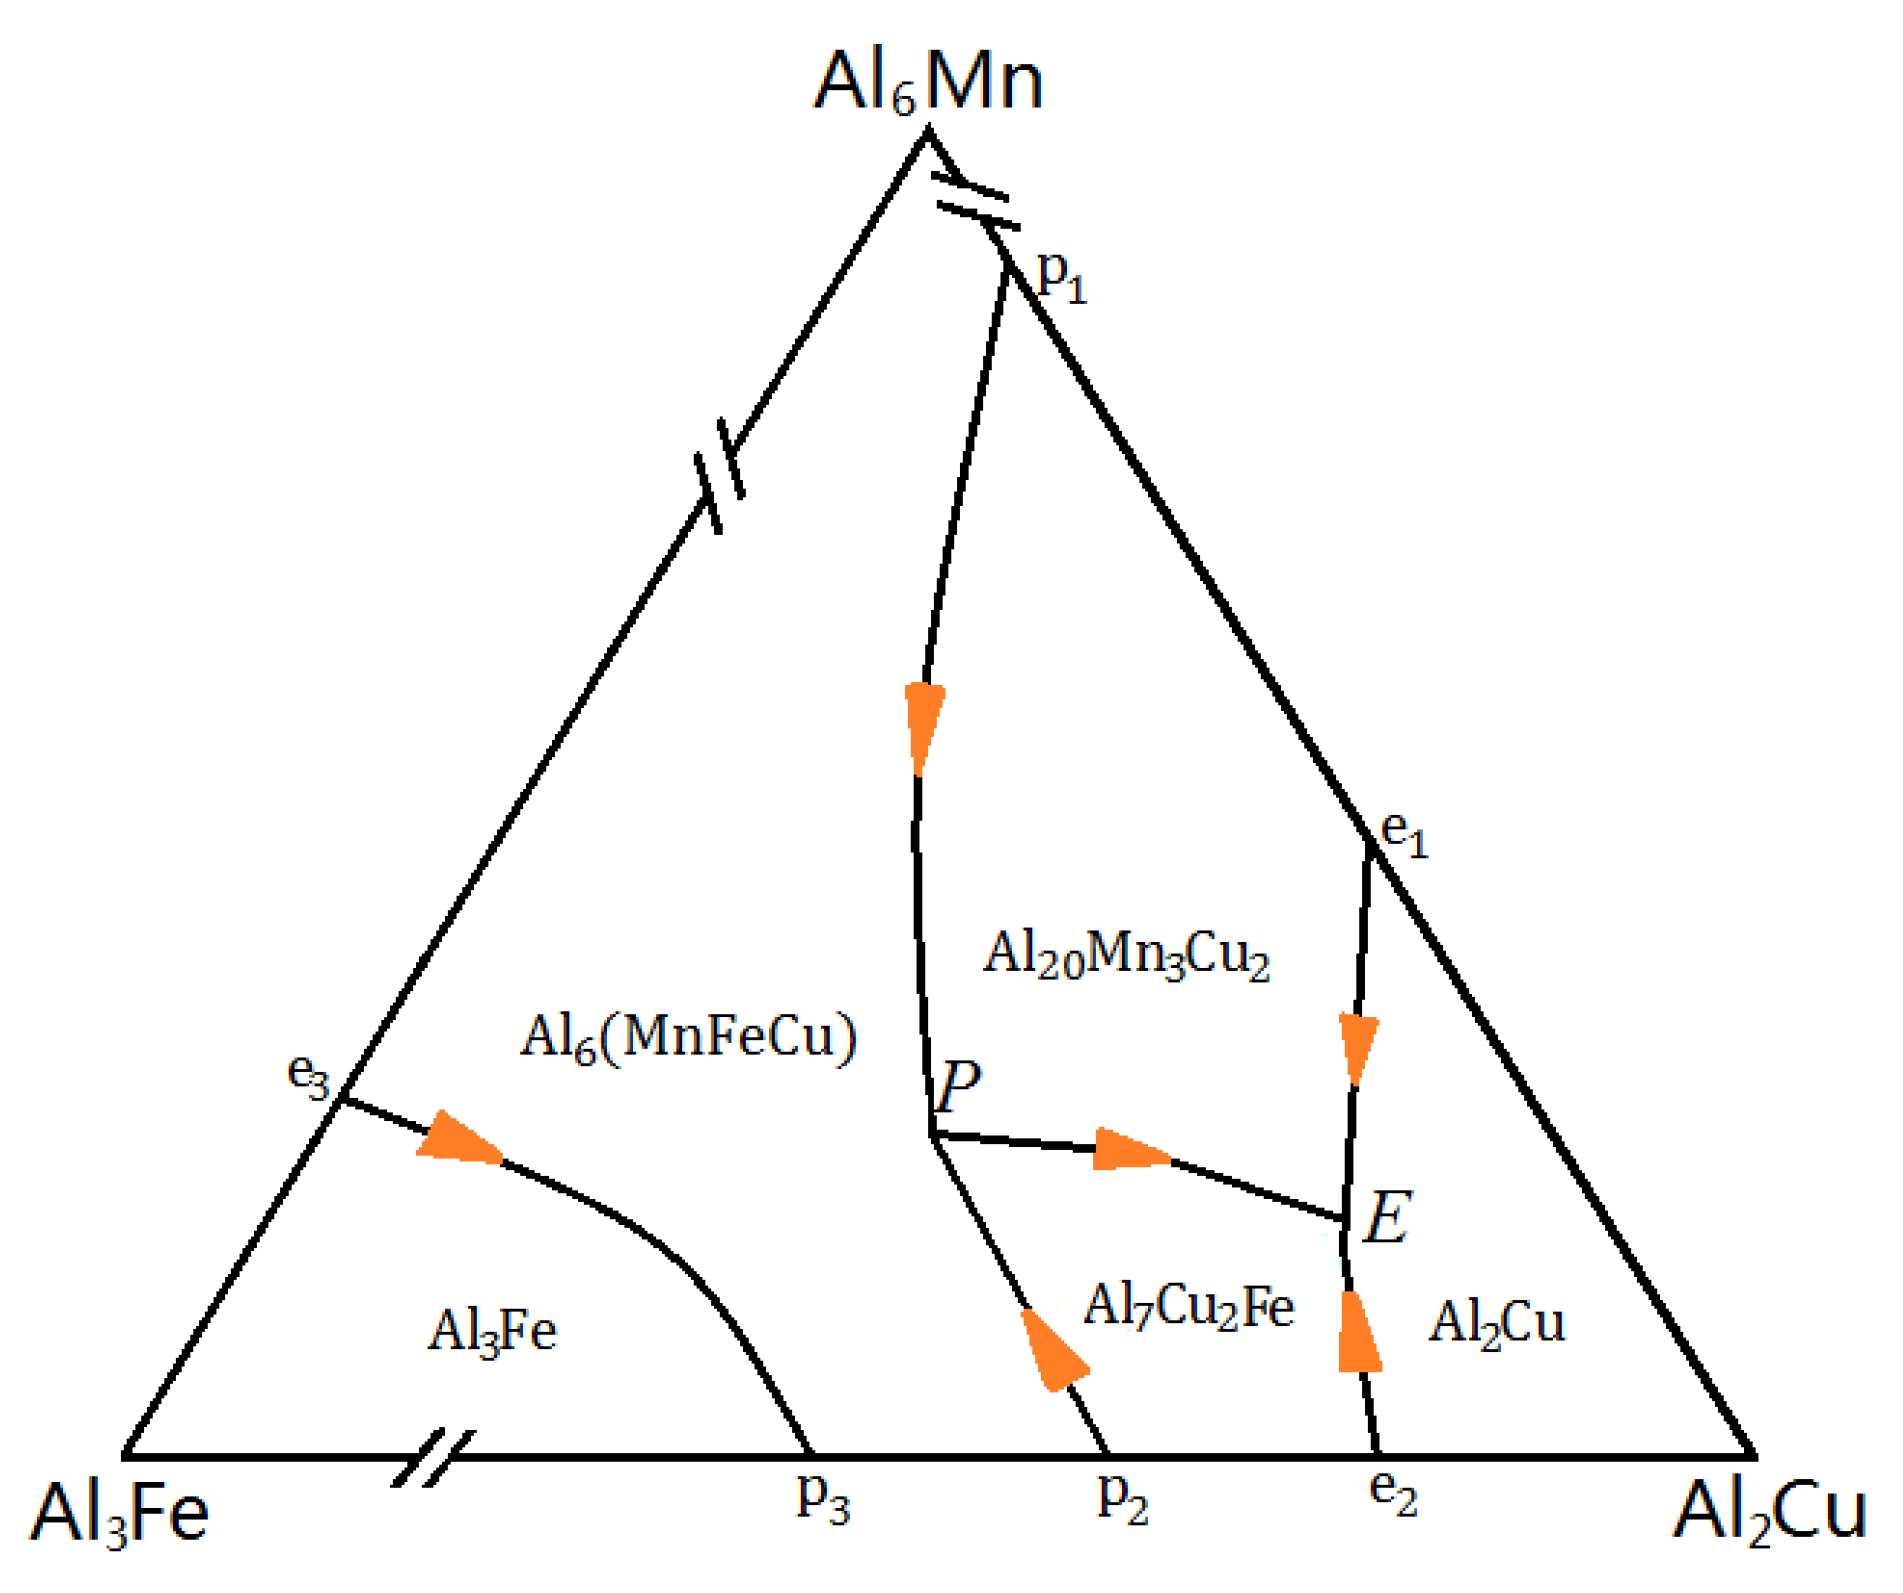
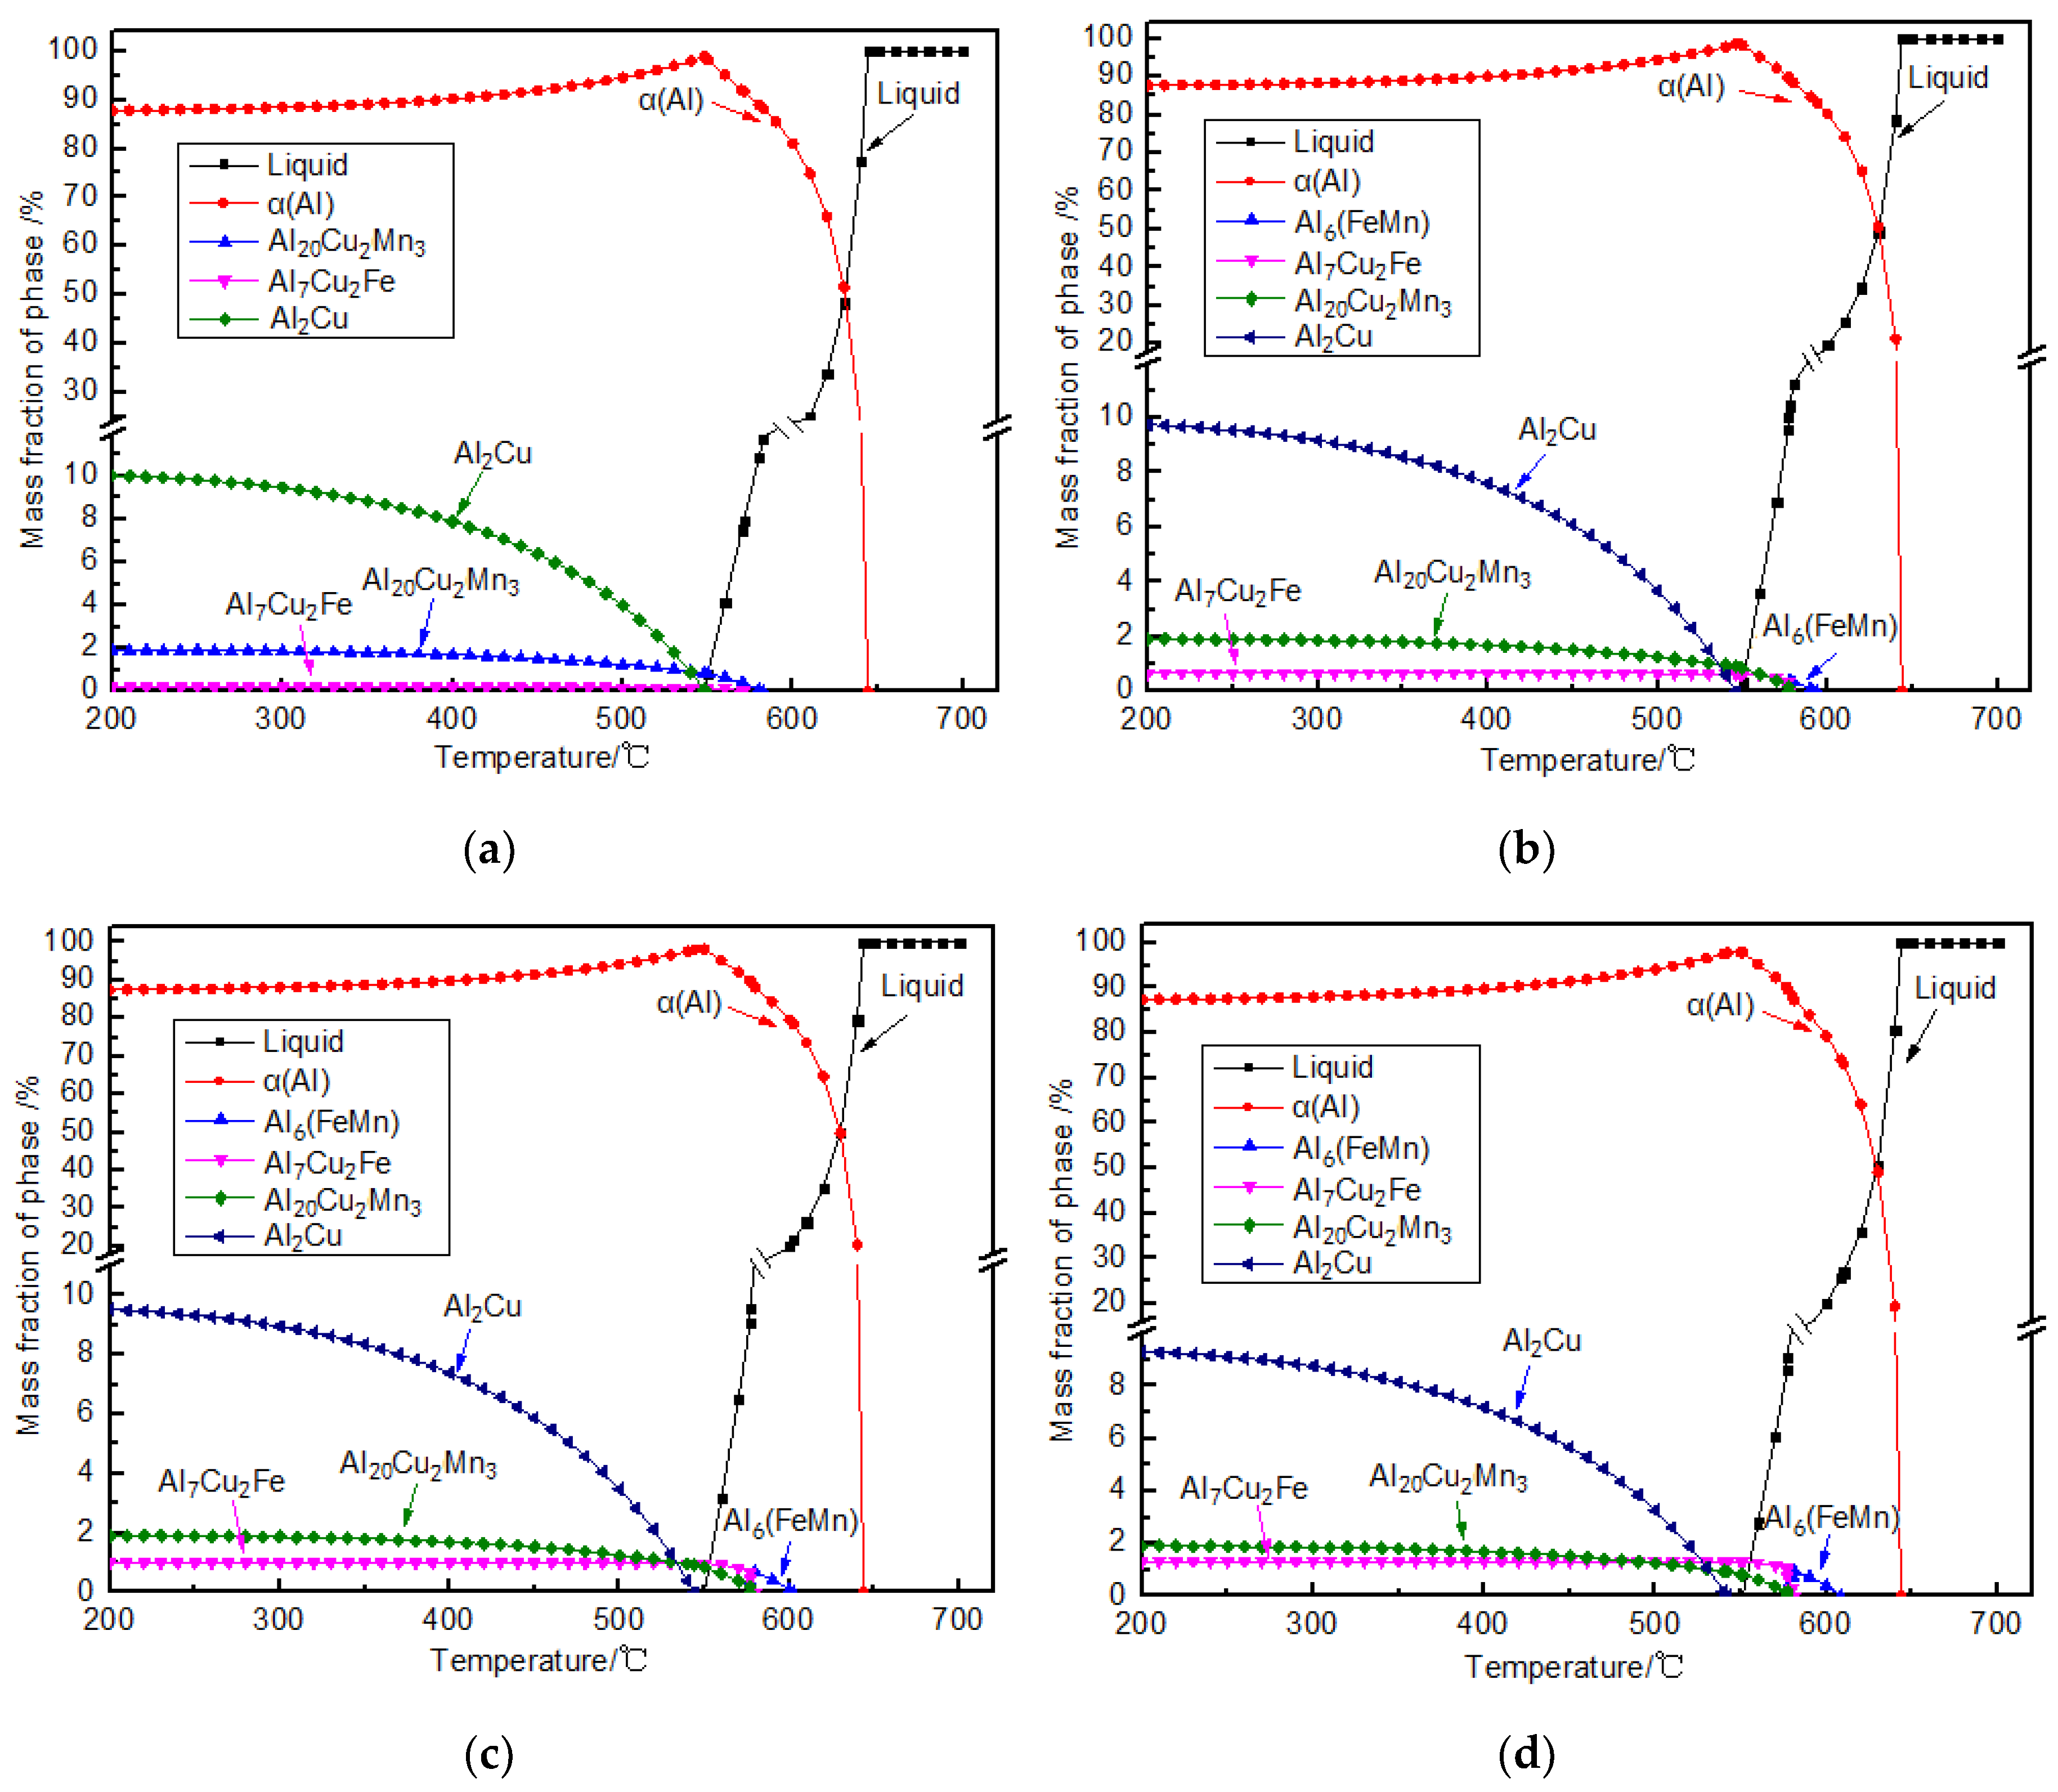
Referring to Al–Cu–Fe–Mn quaternary phase diagram [25] (as indicated in Figure 10), it can be seen that the Fe-rich phases including Al3Fe, Al6(FeMn) and Al7Cu2Fe phases may appear in Al–Cu cast alloys. For the 2219 Al–Cu alloy, the solubility of Mn in Al–Cu alloy can reach 2%, form a supersaturate solid solution as a result, which leads to the formation of Al20Mn3Cu2 dispersoids during homogenization. With the increasing of Fe content to a certain extent, the solubility of Mn in Al–Cu alloy significantly reduces and Al6(FeMn) phase can form readily, which is in line with the results calculated by software JMatPro 7, as shown in Figure 11. This phenomenon was related to the strong segregation tendency of Fe. Since the solubility of Fe in Al–Cu alloy is quite low, almost all of the Fe segregates to the interface front during solidification and combines with a small amount of Mn to form Al6(FeMn) by eutectic reaction (L→α-Al+Al6(FeMn)). With a further increase in the content of Fe, the amounts of Al6(FeMn) increase, meanwhile, the temperature of eutectic reaction also rises (from about 577 to 608 °C), as shown in Figure 11b–d. But no Al6(FeMn) phase existed in 2219 Al–Cu alloy (as shown in Figure 3), which would be explained by the solid-state transformation from Al6(FeMn) phase into Al7Cu2Fe or Al7Cu2(Fe, Mn) phase during solidification, as shown in Table 3. As a result, the Al7Cu2Fe or Al7Cu2(Fe, Mn) phases increased with the increase of the Fe content. In addition, the content of impurity Fe in 2219 Al–Cu alloy is generally controlled below 0.30 wt.%. So, only needle-like Al7Cu2Fe or Al7Cu2(Fe, Mn) phase in 2219 Al–Cu cast alloy, which is agreement with the reference of Tseng et al. [7,21].
Based on the Al–Cu–Fe–Mn quaternary phase diagram (as seen in Figure 10), the calculation results by the software JMatPro 7 (seen in Figure 11), the metallographic observations with SEM, and those reported by Liu et al. [13,26,27], the possible solidification reactions are listed in Table 3. During the solidification, the liquid alloys are nucleated at about 648–651 °C and the α-Al dendrite network forms, then the eutectic and peritectic reactions shall take place. If there is only a small amount of Fe existing in Al–Cu–Mn alloy, the solidification ends with the formation of Al7Cu2Fe, Al2Cu, and Al20Mn3Cu2 though the ternary eutectic reactions L→α-Al + Al2Cu + Al20Mn3Cu2 (e1-E line) and L→α-Al + Al2Cu + Al7Cu2Fe (e2-E line). However, the amount of Al7Cu2Fe phase was too small to be found in 0.03 wt.% Fe cast alloy (as shown in Figure 2a). With the increasing of Fe content to 0.10 wt.%, Al6(FeMn) intermetallic phase shall precipitate firstly at about 600 °C, and then the peritectic transformation L+Al6(FeMn)→α-Al+Al20Mn3Cu2+Al7Cu2Fe (p1-P line or p2-P line) leads to form the Al7Cu2Fe intermetallics, which always distribute across the dendrite network (as shown in Figure 2b). The solidification ends with the formation of the eutectic reactions L→α-Al+Al2Cu+Al20Mn3Cu2+Al7Cu2Fe. For a further increase in Fe content, the solidification sequence of 0.15 wt.% Fe alloy and 0.20 wt.% Fe alloy remains unchanged. However, the precipitation temperature for Al6(FeMn) intermetallic phase rises, and its volume fraction also goes up, which leads to the increase of Al7Cu2Fe intermetallic phase (as shown in Figure 2c,d).
4.2. Effect of the Fe-Rich Intermetallic Particles on Tensile Fracture Behavior of 2219 Al–Cu Alloys
Figure 8 indicated that both MDF and heat treatment could improve the tensile fracture behavior. For a metallographic point of view, the fracture mechanisms of 2219 wrought Al–Cu alloys are simultaneously dominated by the multi-scale second-phase particles, and grains and grain boundaries [28,29,30].
Firstly, as mentioned in Figure 2, Figure 4 and Figure 5, coarse grains with an average size of about 380 ± 40 um (average of at least 100 grains) were observed in 2219 Al–Cu–xFe alloys under different processing condition. The large initial grain size was controlled by the solidification condition. However, during MDF at 450 °C, dynamic recovery readily occurred and therefore the deformation energy was timely relieved for grain growth during subsequent solution treatment. Thus, coarse grains were obtained after solution-peak aging treatment, which was agreement with the reference of Dong et al. [1,2,3,19,20,31]. Therefore, the effect of grains and grain boundaries on tensile fracture behavior of 2219 Al–Cu alloys as a function of Fe content can be considered to be identical.
Secondly, as mentioned in Figure 7, large amounts of precipitates (θ′ and θ″) were observed in 2219 Al–Cu-xFe (x = 0.03, 0.20 wt.%) alloys. In general, volume fraction, size and characteristic of precipitates were of significant roles in influencing the tensile fracture properties. The UTS and YS values of solution-peak aging stage 2219 Al–Cu–xFe alloys were higher than those of as cast, homogenized and MDF processed 2219 Al–Cu–xFe alloys, while their EL values in solution-peak aging stage were relatively lower than MDF processed alloys due to strengthening precipitates could reduce the ductility of alloys. Compared Figure 7a with Figure 7b, the number, size and area fraction of precipitates (θ′ and θ″) did not change obviously with the increase of impurity Fe content. Consequently, the change of Fe content had little influence on values of strength in peak aging heat treatment.
Finally, as mentioned in Figure 2, Figure 4 and Figure 5, the number, size, area fraction, and characteristic of coarse intermetallic particles decreased obviously against different processing approaches (i.e., as-cast, homogenization, MDF, and solution-peak aging treatment). The coarse intermetallics are always considered as hard-brittle phases and therefore those particles have no deformation abilities. Under external service loading, they were easy to dehisce or separate from the matrix and so acted as crack initiators. Therefore, the decrease of primary coarse intermetallics could also improve the tensile fracture properties of alloys.
As mentioned in Figure 2 and Figure 3, the main constituents in as-cast 2219 Al–Cu–xFe alloys were Al2Cu and Al7Cu2(Fe, Mn) phases. Through different processing approaches, Al2Cu particles exhibited an ellipse or spherical shape due to the interactions with fragmentation, dissolution, and diffusion, whereas, Al7Cu2(Fe, Mn) particles were just fragmented into rod-like with sharp edges due to the insolubility of Fe in Al–Cu alloy, as shown in Figure 4, Figure 5 and Figure 6. To further understand the mechanical characteristics of coarse second-phase particles in the alloys, Pugh [32,33] proposed a method to predict the ductility of the second particles based on their B/G and . Here, B and G is bulk modulus and shear modulus, respectively, and the values of B and G were calculated using the Voigt–Reuss–Hill approximation from the elastic constant of the second-phase particles. Poisson’s ratio () can be derived from B and G using formula . In the study of Tian et al. [34,35,36], the B/G ratio and values of Al2Cu phase are 2.65 and 0.332, respectively. However, the B/G ratio and values of Al7Cu2(Fe, Mn) phase are 1.31 and 0.154, respectively. This means that Al7Cu2(Fe, Mn) particles are easier to act as crack initiators than Al2Cu particles. Therefore, the greater the number of Al7Cu2(Fe, Mn) particles was, the lower the plastic nature (as shown in Figure 8). In addition, rod-like Al7Cu2(Fe, Mn) particles with sharp edges would fracture readily because they were subjected to higher stress concentration, and then cracks propagated along themselves (as shown in Figure 9c,d).
5. Conclusions
In this paper, the microstructures evolution of Fe-rich intermetallics, mechanical properties of 2219 Al–Cu alloys with different Fe content against different processing approaches (i.e., as-cast, homogenization, MDF, and solution-peak aging treatment) were studied. The main conclusions are as follows.
- (1)
- When the Fe content was less than 0.03 wt.%, the main constituents were Al2Cu intermetallics. As the Fe content increased to 0.10 wt.%, a new needle-like Al7Cu2Fe or Al7Cu2(Fe, Mn) phase presented. Further increase in the Fe content, the characteristic of the needle-like Al7Cu2Fe or Al7Cu2(Fe, Mn) intermetallics did not change, whereas their sizes became longer and wider.
- (2)
- The fragmented Al7Cu2Fe or Al7Cu2(Fe, Mn) intermetallics were obtained during multidirectional forging process. However, they were un-dissolved in the α-Al matrix in subsequent solution treatment due to the low tolerance of Fe in Al–Cu alloys. The sharp edges of the fragmented Al7Cu2Fe or Al7Cu2(FeMn) particles can act as crack initiators and then as crack propagation paths because they were subjected to higher stress concentrations during deformation.
- (3)
- For all the samples, the same trend of UTS, YS, and EL variation from the processes of as-cast to peak aging stage. The as-cast samples presented relatively low values of UTS/YS/EL, i.e., 165.35/92.56 MPa and 7.34%, 157.61/80.67 MPa and 6.79%, 140.29/74.44 MPa and 5.41%, and 133.77/66.52 MPa and 4.98% as a function of the Fe content ranging from 0.03 to 0.20 wt.%. The MDF samples possessed the maximum EL values, i.e., 15.99%, 13.56%, 11.46%, and 7.09% corresponding to the Fe contents of 0.03, 0.10, 0.15, and 0.20 wt.%, respectively. The solution-peak aging treatment significantly increased the UTS/YS values by at least 270/90 MPa, respectively, compared with the as-cast condition.
- (4)
- For peak aging condition, the UTS, YS, and EL values decreased with the increase of Fe content. For 0.03 wt.% Fe alloy, the UTS, YS, and EL values were 445.64 MPa, 333.76 MPa, and 15.14%, respectively. Increasing the Fe content from 0.03 to 0.20 wt.%, the UTS, YS, and EL decreased by 36 MPa, 25 MPa, and 57.92%, respectively.
Author Contributions
D.X.: Conceptualization, Methodology, Investigation, Writing original manuscript. C.Z.: Draft revision, Supervision, writing assistance. C.X.: Writing assistance. K.C.: Deriving the theoretical framework, Supervision, Design guide. All authors have read and agreed to the published version of the manuscript.
Funding
This work was funded by the National Natural Science Foundation of China (Grant No. U1637601), the Transformation of Scientific and Technological Achievements Program of Jiangsu Province (BA2015075), the National Key Research and Development Program of China (Grant No. 2016YFB0300801), the Major Research Equipment Development Projects of National Natural Science Foundation of China (Grant No. 51327902), the Science and Technology Major Project of Guangxi, China (Grant No. AA17204012), and the Opening Project of Guangxi Colleges and Universities Key Laboratory of robot and welding (Grant No. JQR2018ZR02).
Conflicts of Interest
The authors declare no conflict of interest.
References
- He, H.; Yi, Y.-P.; Huang, S.-Q.; Zhang, Y. Effects of deformation temperature on second-phase particles and mechanical properties of 2219 Al-Cu alloy. Mater. Sci. Eng. A 2018, 712, 414–423. [Google Scholar] [CrossRef]
- Xu, D.F.; Chen, K.H.; Chen, Y.Q.; Chen, S.Y. Evolution of the second-phase particles and their effect on tensile fracture behavior of 2219 Al-xCu alloys. Metals 2020, 10, 197. [Google Scholar] [CrossRef] [Green Version]
- Dong, F.; Yi, Y.; Huang, C.; Huang, S. Influence of cryogenic deformation on second-phase particles, grain structure, and mechanical properties of Al–Cu–Mn alloy. J. Alloys Compd. 2020, 827, 154300. [Google Scholar] [CrossRef]
- Backerud, L.; Chai, G.; Tamminen, J. Solidification Characteristics of Aluminum Alloys; American Foundrymen’s Society: Schaumburg, IL, USA, 1990; p. 266. [Google Scholar]
- Zhang, W.; Lin, B.; Zhang, D.; Li, Y. Microstructures and mechanical properties of squeeze cast Al–5.0Cu–0.6Mn alloys with different Fe content. Mater. Des. 2013, 52, 225–233. [Google Scholar] [CrossRef]
- Liu, K.; Cao, X.; Chen, X.-G. Solidification of Iron-Rich Intermetallic Phases in Al-4.5Cu-0.3Fe Cast Alloy. Met. Mater. Trans. A 2010, 42, 2004–2016. [Google Scholar] [CrossRef]
- Tseng, C.-J.; Lee, S.-L.; Wu, T.-F.; Lin, J.-C. Effects of Fe Content on Microstructure and Mechanical Properties of A206 Alloy. Mater. Trans. JIM 2000, 41, 708–713. [Google Scholar] [CrossRef] [Green Version]
- Lin, B.; Xu, R.; Li, H.; Xiao, H.; Zhang, W.; Li, S. Development of high Fe content squeeze cast 2A16 wrought Al alloys with enhanced mechanical properties at room and elevated temperatures. Mater. Charact. 2018, 142, 389–397. [Google Scholar] [CrossRef]
- Tseng, C.-J.; Lee, S.-L.; Tsai, S.-C.; Cheng, C.-J. Effects of manganese on microstructure and mechanical properties of A206 alloys containing iron. J. Mater. Res. 2002, 17, 2243–2250. [Google Scholar] [CrossRef]
- Liu, K.; Cao, X.; Chen, X.-G. Effect of Mn, Si, and Cooling Rate on the Formation of Iron-Rich Intermetallics in 206 Al-Cu Cast Alloys. Met. Mater. Trans. A 2012, 43, 1231–1240. [Google Scholar] [CrossRef]
- Xu, R.; Lin, B.; Li, H.Y.; Xiao, H.Q.; Zhao, Y.L.; Zhang, W.W. Microstructure evolution and mechanical properties of Al-6.5Cu-0.6Mn-0.5Fe alloys with different Si additions. Trans. Nonferrous Met. Soc. China 2019, 29, 1583–1591. [Google Scholar] [CrossRef]
- Zhang, W.; Lin, B.; Fan, J.; Zhang, D.; Li, Y. Microstructures and mechanical properties of heat-treated Al–5.0Cu–0.5Fe squeeze cast alloys with different Mn/Fe ratio. Mater. Sci. Eng. A 2013, 588, 366–375. [Google Scholar] [CrossRef]
- Liu, Y.; Luo, L.; Han, C.; Ou, L.; Wang, J.; Liu, C. Effect of Fe, Si and Cooling Rate on the Formation of Fe- and Mn-rich Intermetallics in Al–5Mg–0.8Mn Alloy. J. Mater. Sci. Technol. 2016, 32, 305–312. [Google Scholar] [CrossRef]
- Lin, Y.; Wu, B.; Li, S.; Mao, S.; Liu, X.; Zhang, Y.; Wang, L. The quantitative relationship between microstructure and mechanical property of a melt spun Al–Mg alloy. Mater. Sci. Eng. A 2015, 621, 212–217. [Google Scholar] [CrossRef]
- Lichioiu, I.; Peter, I.; Varga, B.; Rosso, M. Preparation and Structural Characterization of Rapidly Solidified Al–Cu Alloys. J. Mater. Sci. Technol. 2014, 30, 394–400. [Google Scholar] [CrossRef]
- Chobaut, N.; Carron, D.; Drezet, J.-M. Characterisation of precipitation upon cooling of an AA2618 Al–Cu–Mg alloy. J. Alloys Compd. 2016, 654, 56–62. [Google Scholar] [CrossRef] [Green Version]
- Lin, B.; Zhang, W.; Zhao, Y.; Li, Y. Solid-state transformation of Fe-rich intermetallic phases in Al–5.0Cu–0.6Mn squeeze cast alloy with variable Fe contents during solution heat treatment. Mater. Charact. 2015, 104, 124–131. [Google Scholar] [CrossRef]
- Lin, B.; Zhang, W.W. Effect of heat treatment on morphology of Fe-rich intermetallics in Al–Cu alloys. Mater. Sci. Technol. 2016, 33, 738–743. [Google Scholar] [CrossRef]
- Zhang, Y.; Li, R.; Chen, P.; Li, X.; Liu, Z. Microstructural evolution of Al2Cu phase and mechanical properties of the large-scale Al alloy components under different consecutive manufacturing processes. J. Alloys Compd. 2019, 808, 151634. [Google Scholar] [CrossRef]
- Zhang, L.; Li, X.; Li, R.; Jiang, R.; Zhang, L. Effects of high-intensity ultrasound on the microstructures and mechanical properties of ultra-large 2219 Al alloy ingot. Mater. Sci. Eng. A 2019, 763, 138–154. [Google Scholar] [CrossRef]
- Liu, Z.; Li, R.; Jiang, R.; Zhang, L.; Li, X. Scalable Ultrasound-Assisted Casting of Ultra-large 2219 Al Alloy Ingots. Met. Mater. Trans. A 2019, 50, 1146–1152. [Google Scholar] [CrossRef]
- Peng, H.; Li, R.; Li, X.; Ding, S.; Chang, M.; Liao, L.; Zhang, Y.; Chen, P. Effect of Multi-Source Ultrasonic on Segregation of Cu Elements in Large Al–Cu Alloy Cast Ingot. Materials 2019, 12, 2828. [Google Scholar] [CrossRef] [PubMed] [Green Version]
- He, H.; Yi, Y.-P.; Huang, S.-Q.; Zhang, Y. Effects of cold predeformation on dissolution of second-phase Al2Cu particles during solution treatment of 2219 Al–Cu alloy forgings. Mater. Charact. 2018, 135, 18–24. [Google Scholar] [CrossRef]
- Lu, Y.; Wang, J.; Li, X.; Li, W.; Li, R.; Zhou, D. Effects of pre-deformation on the microstructures and corrosion behavior of 2219 aluminum alloys. Mater. Sci. Eng. A 2018, 723, 204–211. [Google Scholar] [CrossRef]
- Belov, N.A.; Eskin, D.G.; Aksenov, A.A. Multicomponent Phase Diagrams, Applications for Commercial Aluminum Alloys; Elsevier: London, UK, 2005. [Google Scholar]
- Tang, K.; Du, Q.; Li, Y. Modelling microstructure evolution during casting, homogenization and ageing heat treatment of Al-Mg-Si-Cu-Fe-Mn alloys. Calphad 2018, 63, 164–184. [Google Scholar] [CrossRef]
- Li, Y.; Arnberg, L. A eutectoid phase transformation for the primary intermetallic particle from Alm(Fe,Mn) to Al3(Fe,Mn) in AA5182 alloy. Acta Mater. 2004, 52, 2945–2952. [Google Scholar] [CrossRef]
- Sharma, V.; Kumar, K.S.; Rao, B.N.; Pathak, S. Effect of microstructure and strength on the fracture behavior of AA2219 alloy. Mater. Sci. Eng. A 2009, 502, 45–53. [Google Scholar] [CrossRef]
- Elgallad, E.M.; Zhang, Z.; Chen, X.-G. Effect of two-step aging on the mechanical properties of AA2219 DC cast alloy. Mater. Sci. Eng. A 2015, 625, 213–220. [Google Scholar] [CrossRef]
- An, L.; Cai, Y.; Liu, W.; Yuan, S.; Zhu, S.; Meng, F. Effect of pre-deformation on microstructure and mechanical properties of 2219 aluminum alloy sheet by thermomechanical treatment. Trans. Nonferrous Met. Soc. China 2012, 22, 370–375. [Google Scholar] [CrossRef]
- Liu, L.; Wu, Y.; Gong, H.; Dong, F.; Ahmad, A. Modified kinetic model for describing continuous dynamic recrystallization behavior of Al 2219 alloy during hot deformation process. J. Alloys Compd. 2020, 817, 153301. [Google Scholar] [CrossRef]
- Pugh, S. Relations between the elastic moduli and the plastic properties of polycrystalline pure metals. Philos. Mag. 1954, 45, 823–843. [Google Scholar] [CrossRef]
- Li, C.M.; Zeng, S.M.; Chen, Z.Q.; Cheng, N.P.; Chen, T.X. First-principles calculations of elastic and thermodynamic properties of the four main intermetallic phases in Al–Zn–Mg–Cu alloys. Comput. Mater. Sci. 2014, 93, 210–220. [Google Scholar] [CrossRef]
- Tian, J.; Yu-Hong, Z.; Hou, H.; Han, P. First-principles investigation of the structural, mechanical and thermodynamic properties of Al 2 Cu phase under various pressure and temperature conditions. Solid State Commun. 2017, 268, 44–50. [Google Scholar] [CrossRef]
- Xie, D.; Guo, H.; Yang, X.; Ma, T. First-principles study of structural, mechanical, and electronic properties of typical iron-containing phases in Al-Cu alloys under different pressures. Phys. B Condens. Matter 2019, 555, 112–117. [Google Scholar] [CrossRef]
- Tian, J.; Yu-Hong, Z.; Wen, Z.; Hou, H.; Han, P. Physical properties and Debye temperature of Al 7 Cu 2 Fe alloy under various pressures analyzed by first-principles. Solid State Commun. 2017, 257, 6–10. [Google Scholar] [CrossRef]
Figure 1.
Schematic diagram of multidirectional forging (MDF) process.

Figure 2.
Microstructures of the as-cast alloys with different Fe contents: (a) 0.03 wt.%; (b) 0.10 wt.%; (c) 0.15 wt.%; and (d) 0.20 wt.%.
Figure 2.
Microstructures of the as-cast alloys with different Fe contents: (a) 0.03 wt.%; (b) 0.10 wt.%; (c) 0.15 wt.%; and (d) 0.20 wt.%.

Figure 3.
Energy dispersive X-ray spectrometer (EDS) of the second-phase particles in as-cast 0.15 wt.% Fe alloy: (a) Point A (Al2Cu) and (b) Point B (Al7Cu2(Fe, Mn)).
Figure 3.
Energy dispersive X-ray spectrometer (EDS) of the second-phase particles in as-cast 0.15 wt.% Fe alloy: (a) Point A (Al2Cu) and (b) Point B (Al7Cu2(Fe, Mn)).

Figure 4.
Microstructures of homogenized alloys with Fe contents: (a) 0.10 wt.%; (b) 0.15 wt.%; (c) 0.20 wt.%; and (d) high-magnification at location P.
Figure 4.
Microstructures of homogenized alloys with Fe contents: (a) 0.10 wt.%; (b) 0.15 wt.%; (c) 0.20 wt.%; and (d) high-magnification at location P.

Figure 5.
Microstructures of aged alloys with Fe contents: (a) 0.03 wt.%; (b) 0.1 wt.%; (c) 0.15 wt.%; and (d) 0.2 wt.%.
Figure 5.
Microstructures of aged alloys with Fe contents: (a) 0.03 wt.%; (b) 0.1 wt.%; (c) 0.15 wt.%; and (d) 0.2 wt.%.

Figure 6.
Scanning electron microscopy (SEM) images of aged alloys with Fe contents: (a) 0.10 wt.% and (b) 0.20 wt.%.
Figure 6.
Scanning electron microscopy (SEM) images of aged alloys with Fe contents: (a) 0.10 wt.% and (b) 0.20 wt.%.

Figure 7.
Transmission electron microscopy (TEM) images and corresponding diffraction spots obtained along the (100)Al zone axis of aged alloys with Fe contents: (a,b) 0.03 wt.% and (c,d) 0.20 wt.%.
Figure 7.
Transmission electron microscopy (TEM) images and corresponding diffraction spots obtained along the (100)Al zone axis of aged alloys with Fe contents: (a,b) 0.03 wt.% and (c,d) 0.20 wt.%.

Figure 8.
Mechanical properties of 2219 Al–Cu alloys with different processes: (a) The ultimate tensile strength; (b) the yield strength; (c) elongation.
Figure 8.
Mechanical properties of 2219 Al–Cu alloys with different processes: (a) The ultimate tensile strength; (b) the yield strength; (c) elongation.

Figure 9.
Fracture morphology of aged alloy with different Fe contents. (a,b) 0.03 wt.%; (c) 0.10 wt.%; and (d) 0.20 wt.%.
Figure 9.
Fracture morphology of aged alloy with different Fe contents. (a,b) 0.03 wt.%; (c) 0.10 wt.%; and (d) 0.20 wt.%.

Figure 10.
Phase diagram of intermetallics Al–Cu–Fe–Mn system alloy, reproduced from [25], with permission of Elsevier, 2005.
Figure 10.
Phase diagram of intermetallics Al–Cu–Fe–Mn system alloy, reproduced from [25], with permission of Elsevier, 2005.

Figure 11.
Phase fraction vs. temperature curves of 2219 Al–Cu alloy with different Fe contents calculated by the software JMatPro 7: (a) 0.03 wt.%; (b) 0.1 wt.%; (c) 0.15 wt.%; and (d) 0.2 wt.%.
Figure 11.
Phase fraction vs. temperature curves of 2219 Al–Cu alloy with different Fe contents calculated by the software JMatPro 7: (a) 0.03 wt.%; (b) 0.1 wt.%; (c) 0.15 wt.%; and (d) 0.2 wt.%.


Table 1.
The actual chemical compositions of experimental alloys, wt.%.
| Sample No. | Cu | Mn | Fe | Si | Mg | V | Zr | Al |
|---|---|---|---|---|---|---|---|---|
| 0.03 wt.% Fe | 5.87 | 0.362 | 0.026 | <0.0005 | ≤0.02 | 0.070 | 0.138 | Bal. |
| 0.10 wt.% Fe | 5.90 | 0.359 | 0.101 | <0.0005 | ≤0.02 | 0.068 | 0.136 | Bal. |
| 0.15 wt.% Fe | 5.89 | 0.361 | 0.147 | <0.0005 | ≤0.02 | 0.036 | 0.130 | Bal. |
| 0.20 wt.% Fe | 5.88 | 0.362 | 0.195 | <0.0005 | ≤0.02 | 0.059 | 0.135 | Bal. |
Table 2.
SEM-EDS analysis results of the un-dissolved particles shown in Figure 6 (at. %).
Table 2.
SEM-EDS analysis results of the un-dissolved particles shown in Figure 6 (at. %).
| Point | Elements | |||
|---|---|---|---|---|
| Al | Cu | Fe | Mn | |
| A | 67.96 | 32.04 | - | - |
| B | 71.01 | 20.62 | 6.64 | 1.73 |
| C | 73.28 | 17.42 | 7.61 | 1.69 |
| D | 72.54 | 27.46 | - | - |
Table 3.
The possible solidification reactions in 2219 Al–Cu alloys.
| Reactions | T (°C) |
|---|---|
| L→α-Al | 651–648 |
| L→α-Al+Al6(FeMn) | 608–577 |
| L+ Al6(FeMn)→α-Al+Al20Mn3Cu2+Al7Cu2Fe | 597–576 |
| L→α-Al +Al20Mn3Cu2+Al7Cu2Fe | 587–537 |
| L→α-Al+Al2Cu+Al20Mn3Cu2+Al7Cu2Fe | 547–540 |
Publisher’s Note: MDPI stays neutral with regard to jurisdictional claims in published maps and institutional affiliations. |
© 2021 by the authors. Licensee MDPI, Basel, Switzerland. This article is an open access article distributed under the terms and conditions of the Creative Commons Attribution (CC BY) license (http://creativecommons.org/licenses/by/4.0/).
Share and Cite
MDPI and ACS Style
Xu, D.; Zhu, C.; Xu, C.; Chen, K. Microstructures and Tensile Fracture Behavior of 2219 Wrought Al–Cu Alloys with Different Impurity of Fe. Metals 2021, 11, 174. https://doi.org/10.3390/met11010174
AMA Style
Xu D, Zhu C, Xu C, Chen K. Microstructures and Tensile Fracture Behavior of 2219 Wrought Al–Cu Alloys with Different Impurity of Fe. Metals. 2021; 11(1):174. https://doi.org/10.3390/met11010174
Chicago/Turabian StyleXu, Daofen, Changjun Zhu, Chengfu Xu, and Kanghua Chen. 2021. "Microstructures and Tensile Fracture Behavior of 2219 Wrought Al–Cu Alloys with Different Impurity of Fe" Metals 11, no. 1: 174. https://doi.org/10.3390/met11010174
Note that from the first issue of 2016, this journal uses article numbers instead of page numbers. See further details here.