 Swati Walia1,2
 Rakesh Kumar1,2*
- 1Academy of Scientific and Innovative Research, Ghaziabad, India
- 2Agrotechnology Division, CSIR-Institute of Himalayan Bioresource Technology, Council of Scientific and Industrial Research, Palampur, India
Fertilization plays an irreplaceable role in raising crop yields; however, there are issues with unnecessary and blind use of chemical fertilizers, which raise the risk of contamination in the atmosphere. It is hypothesized that fertilization of nitrogen (N) and sulfur (S) will together improve the essential oil (EO) yield and composition of Tagetes minuta L. Thus, 2 years field experiment were carried out to evaluate the outcomes of N (0, 60, 90, and 120 kg ha–1) and S levels (0, 20, 40, and 60 kg ha–1) on T. minuta during 2018 and 2019. The growth, biomass, EO content and composition were influenced (P = 0.05) by N and S fertilization. N at 120 kg ha–1 and S at 60 kg ha–1 registered higher biomass (183.89 and 178.90 q ha–1, respectively) and EO yield (102.09 and 88.60 kg ha–1, respectively), than control. Stomatal density reduced significantly with increase of N and S levels, however, density of oil glands substantially increased with S at 40 and 60 kg ha–1. The major component of EO (Z-β-ocimene) significantly increased with 120 kg N ha–1 (42.59%) and 60 kg S ha–1 (42.35%), respectively. Available nutrients in soil and plant tissues substantially increased with N and S fertilization upto 120 and 60 kg ha–1, respectively. The highest nutrient use efficiency traits were recorded at 60 kg N ha–1 and 20 kg S ha–1. It was concluded that 120 kg N ha–1 and 40 kg S ha–1 can be proposed for T. minuta as a result of agronomic responses, which serves as a sustainable means of cropping.
Introduction
Wild marigold (Tagetes minuta L.) is the most widely cultivated species (Family Asteraceae) which grows in moist and dry areas of the tropical, subtropical and temperate region within an altitude ranging from 1000 to 2500 m amsl (Singh et al., 2003). It is a strongly scented annual herb with erect and highly branched stem and it has an affinity for disturbed sites and can colonize waste ground, roadsides, gardens, orchards, and vine yards. It has traditionally been used in diverse health problems such as colds, stomach ailments and breathing problems, and act as sedative, anti-septic, insecticidal, anti-parasitic and antispasmodic agent (Walia and Kumar, 2020). Food and flavoring, perfumery, pharmaceutical, and agrochemical industries are the major user of its essential oil (EO). Its EO has Z-β-ocimene, dihydrotagetone, (E and Z) tagetone and (E and Z) ocimenones as the major compounds (Walia et al., 2020). EO with higher percentage of Z-β-ocimene (35–50%) has high rate in international market. During 2016, its EO has world annual production of about 15 tons (Cornelius and Wycliffe, 2016) and its EO market is expected to reach 11.8 USD million by 2025 with a CAGR of 7.0% from 2020 to 2025 (as per EO market report 2020).
Latest studies showed that wild marigold may be a profitable EO crop for the western Himalaya and probably in the north India as this crop remains unaffected by biotic and abiotic factors and the essential oil obtained from hilly region are rich in ocimene and dihydrotagetone which are the major compounds used in perfumery and flavor industries (Rathore et al., 2018). Plant fertilization in Tagetes was not yet examined in the western Himalayas, however, previous studies on plant nutrients have shown a substantial effect in general (Sunitha and Hunje, 2010; Negahban et al., 2014; Chand et al., 2015) and nitrogen (N) fertilization (Omidbaigi et al., 2008; Singh et al., 2008; Singhal and Sharma, 2010) on wild marigold production and quality. Sulfur (S) is an important macronutrient in plants due to its important function in synthesis of proteins, as it is an important part of cysteine and methionine amino acids and coenzymes (Marschner, 1999). From many years’ deficiency of S in crops with high S requirement has been a main concern worldwide (Etienne et al., 2018). Soil receives S with rain and through fertilizer application of NPK, but recently highly pure fertilizers are in use with negligible S, leading to continuous removal of S without any supply making soil S deficient (Riley et al., 2002). S deficiency also affects the N uptake further reducing yield and quality of plants (Srinivasarao et al., 2008). Earlier studies showed that addition of S increased yield and EO quality in mint (Mentha arvensis L.), dragonhead (Dracocephalum moldavica L.) and sweet basil (Ocimum basilicum L.) (Aziz et al., 2010; Kumar et al., 2010; Oliveira et al., 2014). For wild marigold S requirement is unclear or did not appear in the literature.
Fertilizer occupies an important role in increasing biomass yield of wild marigold, with the percentage increase of even more than 50% (Prakasa Rao et al., 2000; Singh and Rao, 2005; Singh et al., 2008) and improves livelihood of people’s. However, while ensuring agricultural production, there are issues with unnecessary and blind use of chemical fertilizers, which raise the risk of contamination in the atmosphere. It is therefore imperative to limit unnecessary inputs of fertilizers and ensure their efficient supply, both of which facilitate sustainable agricultural growth. The level of fertilization should be realistically designed to minimize blind application of fertilizers and should depend on soil conditions, yield capacity and systematic control of nutrients in different regions. Therefore, it is imperative to standardize the doses of fertilizers and increase the quality of usage, with the goal of encouraging sustainable development in T. minuta.
This study assessed the hypothesis that yield and EO composition of wild marigold will be significantly influenced by standardized doses of N and S. In wild marigold, major components of EO viz. Z-β-ocimene, dihydrotagetone and tagetone are of great interest to different industries; hence, in such systems oil yield and quality are more important. So, this study standardize the doses of N and S and improve nutrient use efficiency, aiming to increase total Tagetes production (viz. herbage yield, EO yield, and composition), and promote the sustainable development.
Materials and Methods
Site Description and Field Procedures
This study was conducted at CSIR-Institute of Himalayan Bioresource Technology (CSIR-IHBT, Palampur, India; 32°11′N, 76°56′E; 1325 m amsl) during 2018 and 2019 with mean temperature and rainfall of 18°C and 250 cm, respectively. Mean weekly data during crop growing season obtained from agro-meteorological advisory, crop weather outlook (Anonymous, 2019), are detailed in Figure 1. The soil traits were: texture silty clay; acidic pH (5.26); low electrical conductivity (0.05 mmhos cm–1); low organic C (0.70%); low available nitrogen (112.37 kg ha–1); low available phosphorus (8.80 kg ha–1); high available potassium (394.00 kg ha–1) and very low available sulfur (7.64 kg ha–1). During March–April of both the years, seedbed preparation was done. Before seed sowing, farm yard manure (FYM) at 15t/ha was incorporated into the soil. During both the years pre sowing fertilization include 60 kg ha–1 P2O5 (triple superphosphate) and 40 kg ha–1 K2O (muriate of potash). Seeds of HIM GOLD (IHBT.MARIGOLD.I) an improved variety of T. minuta, developed by CSIR-Institute of Himalayan Bioresource Technology, Palampur, India were planted at rate of 3 kg ha–1, at 60 cm row spacing in the first week of June during both the years. To maintain homogeneity and to allow adequate space for the remaining plants to grow efficiently crop thinning was done in all the plots, keeping eight plants per row.
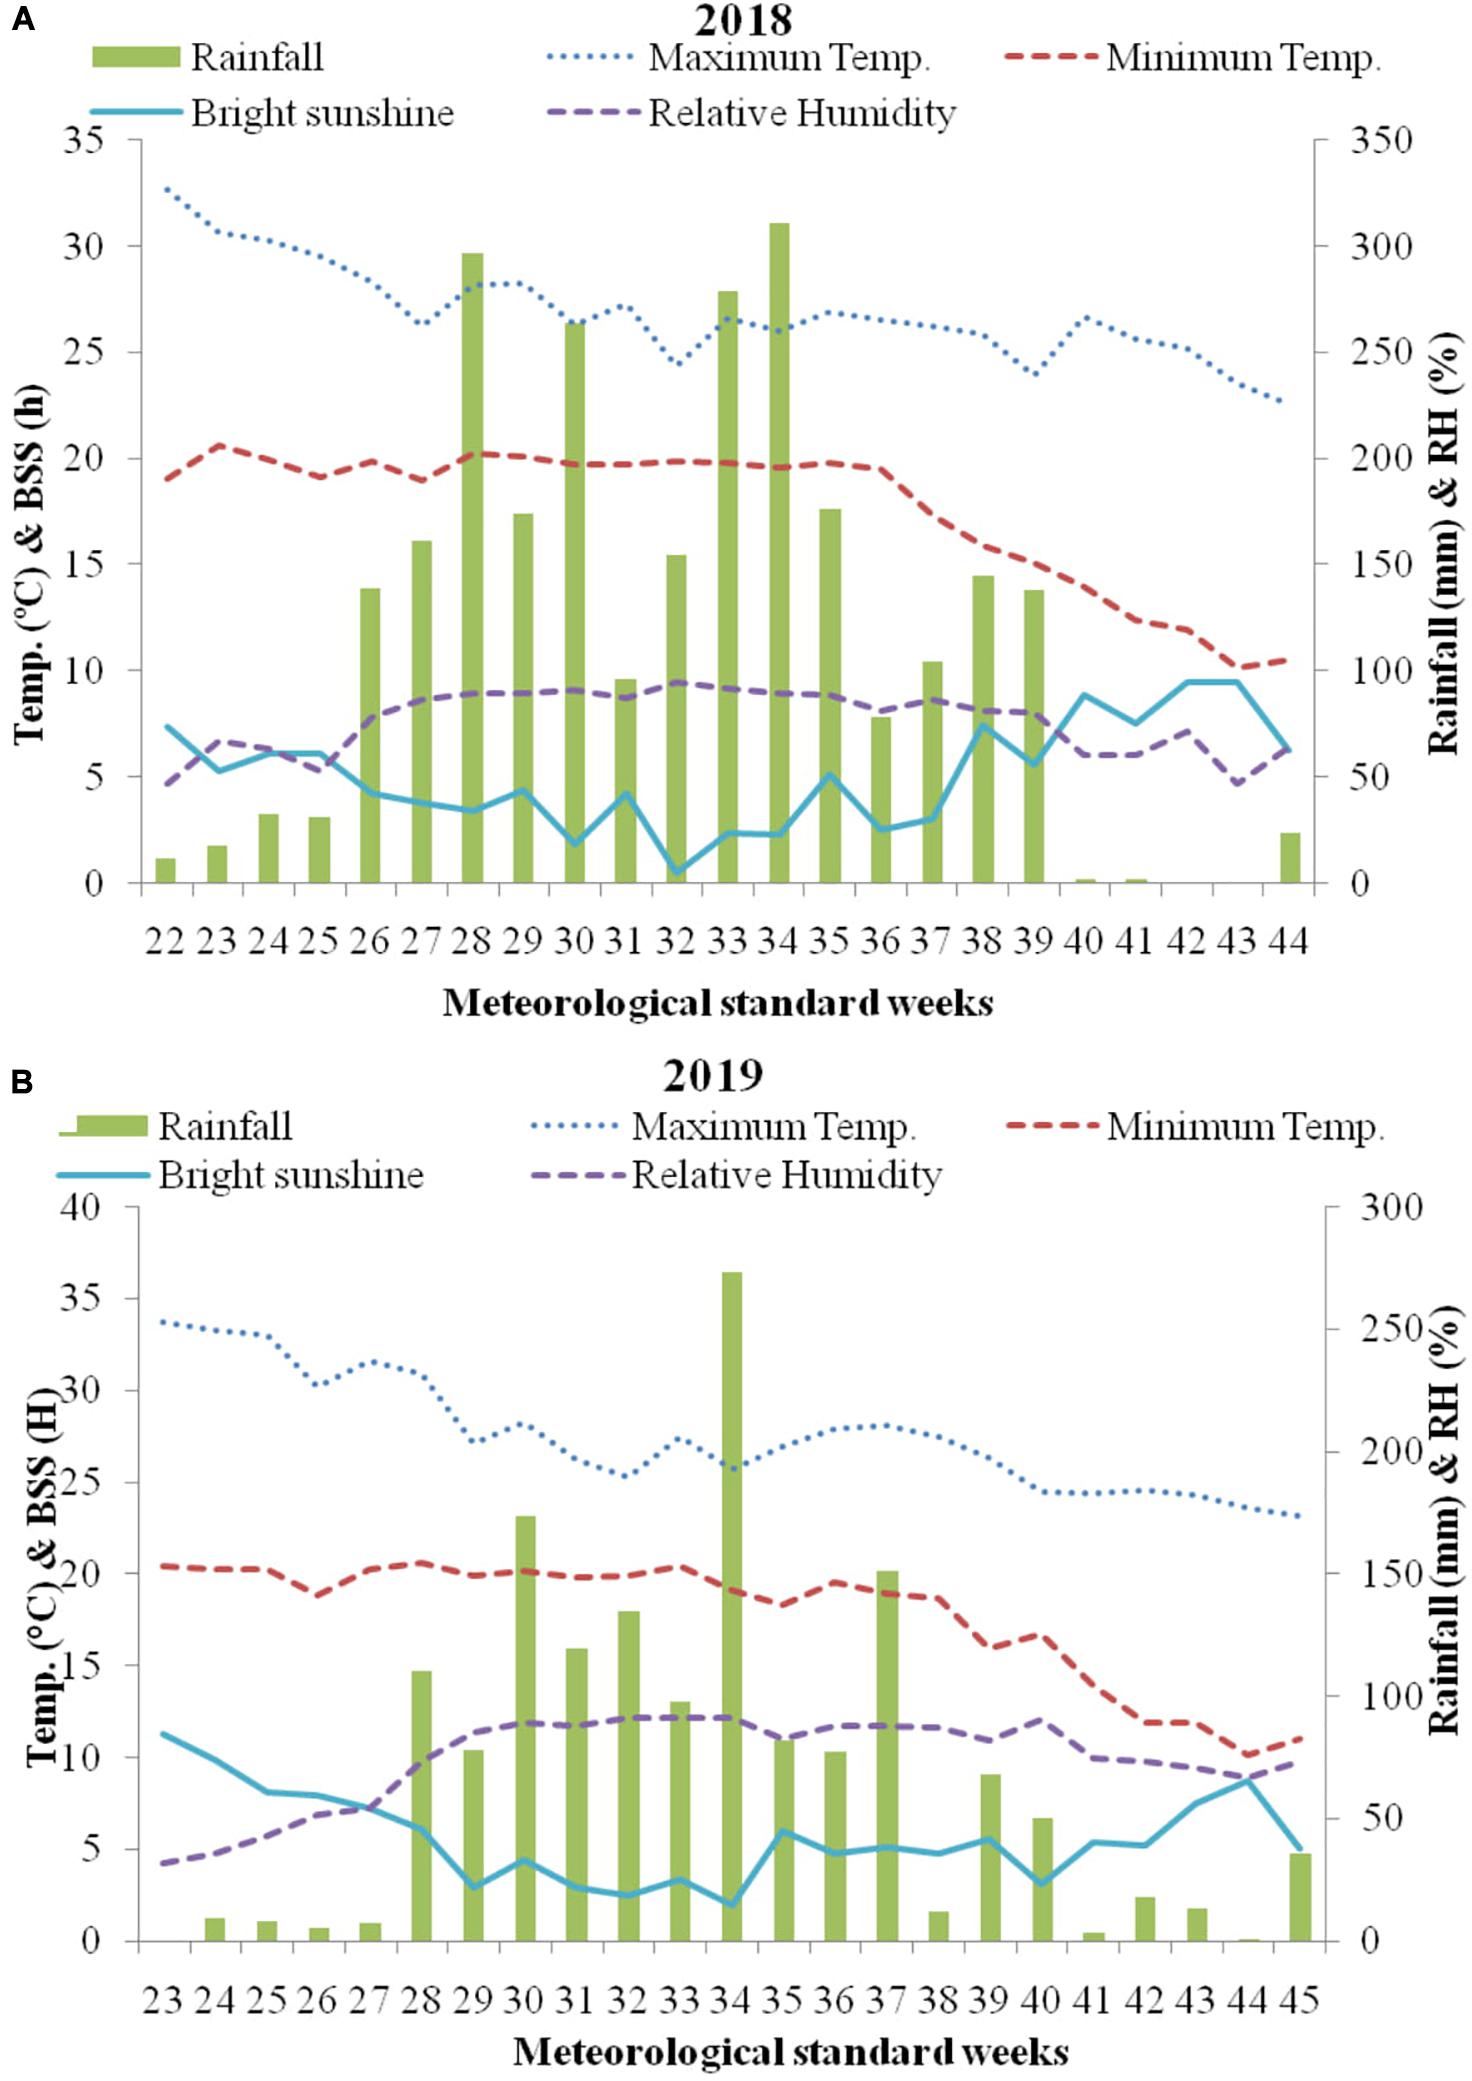
Figure 1. Weekly mean climatological data (temperature, rainfall, sunshine hours, and relative humidity) during the growing season (A) 2018 and (B) 2019 at Palampur, India. BSS, Bright sunshine hours; RH, Relative humidity.
Treatments and Data Collection
Experimental design was factorial randomized block design (RBD) during 2018 and 2019 with two factors, i.e., four N (Control, 60, 90, and 120 kg ha–1) and four S levels (Control, 20, 40, and 60 kg ha–1). The experiment consists of 16 treatments with three replicates. During both the years, 1/3 dose of N and full dose of S were given as pre sowing fertilization through urea (N 46%) and elemental S (S 99%). Top dressing consists of N through urea 1/3 dose each at stem elongation and flowering times, as per the treatments.
At harvest, growth parameters viz., plant height and numbers of branches were recorded from five selected plant from each plot. Fresh biomass was calculated by manually harvesting the plants in the month of October during both the years with the help of sickles at maturity stage 30 cm above the ground to minimize experimental error. The leaf-to-stem ratio was calculated on a fresh weight basis.
Stomatal and Leaf Oil Gland Characteristics
To observe the morphological characteristics of the leaf, stomata and oil glands, surface topography of leaf sample were examined at full boom stage of crop during second cropping season by Scanning Electron Microscope (SEM S-3400 N) of Hitachi, Japan. On aluminum stubs fresh leaf samples were mounted using double-sided carbon tape and then coated with a thin layer of gold with the help of sputter-coater at a vacuum of 10 Pa for 10 s to provide electrical conductivity. The sample stub was further loaded to specimen holder which was then connected to specimen exchange chamber in SEM. The images were captured at desired magnification at an accelerating filament voltage of 30 Kv. At least 3 leaflets treatment–1 and 1 leaflet plant–1 were used to observe the distribution and density of distinctive structures, averaging the density on 1 mm2 areas and length and width in micrometer (μm) on the micrograph obtained for each leaf.
Essential Oil Extraction and Identification of Compounds by GCMS and GC
Essential oil was extracted from fresh plant material of T. minuta through hydro distillation in Clevenger equipment upto 4 h. The EO content (v/w %) and EO yield was calculated. EO obtained was analyzed gas chromatography (GC) and Gas chromatography–Mass spectrometry (GC–MS) analyses as per the procedure mentioned in Walia et al. (2020).
NPKS Analysis in Plant Parts and Soil
For studying the outcome of experiment on nutrient (NPKS) uptake dry samples of leaf, flower, and stem from each treatment was prepared. Samples were digested with concentrated H2SO4 for N estimation and a mixture of concentrated H2SO4 and perchloric acid (5:1) for P, K, and S estimation. N and K was estimated with automatic nitrogen analyzer Kel Plus; P and S with spectrophotometer (model T 90 + UV/vis, PG Instrument Ltd.), while K with flame photometer (model BWB XP, UK Ltd., United Kingdom) as per method given by Yaduvanshi et al. (2009). In order to study the outcome of N and S on available nutrients (NPKS), samples of soil were obtained after the crop harvesting of both cropping season from surface layer of 0–15 cm. Soil available N was estimated with the help of an automatic N analyzer unit by Kel Plus. Available P, K (BWB XP, UK Ltd., United Kingdom) and S were measured according to the method given by Yaduvanshi et al. (2009), respectively.
Nutrient Use Efficiency Traits
Nutrient recovery (NR) and nutrient use efficiency (NUE) of the crop were find out through formulas given by Fageria et al. (2011).
Agronomic efficiency (AE kg kg–1) described as yield per unit of nutrient applied.
Where, Yf: yield in fertilized plots; Yu: yield in unfertilized plots; Na: nutrient applied.
Apparent recovery efficiency (ARE%) is nutrient uptake per unit of nutrient applied.
Where, Nf: total nutrient uptake of the fertilized plot, Nu: total nutrient uptake of unfertilized plot; Na: quantity of nutrient applied.
Agro-physiological efficiency (APE kg kg–1) determined as
Where, Yf: yield in fertilized plots; Yu: yield in unfertilized plots; Nf: total nutrient uptake of the fertilized plot; Nu: total nutrient uptake of unfertilized plot.
Statistical Analysis
The data recorded were checked for homogeneity of variance prior to analyzing the data for different parameters through analysis of variance (ANOVA) technique for factorial Randomized Block Design. Least significant difference (LSD) values were determine at P = 0.05 to the find the significant disparity between treatment means. A second degree- polynomial regression model was also established between fertilizer level of N and S, and yield parameters (biomass yield and essential oil yield) of Tagetes. Agronomic traits and essential oil composition were subjected to the principal component analysis (PCA) to understand those which were largely influenced by the treatments. PAST3 software was used for principal component analysis.
Results
Growth and Yield Parameters
The effect of cropping season was significant on growth parameters (Table 1). Statistically higher plant height (49.92, 145.89, and 243.15 cm) and number of branches plant–1 (14.71, 16.75, and 18.43) at 60, 90 DAS and harvest, respectively, were recorded during 2018 as compared to 2019 (Table 2). Despite the lowest growth parameters, significantly higher leaf + flower biomass (74.80 q ha–1), stem biomass (113.24 q ha–1), total biomass (188.03 q ha–1), and EO yield (93.91 kg ha–1) were found during 2019 than 2018 (Table 3). The second cropping year (2019), registered 17.79% and 26.29% higher total biomass and oil yield, respectively, than the first cropping year (2018).
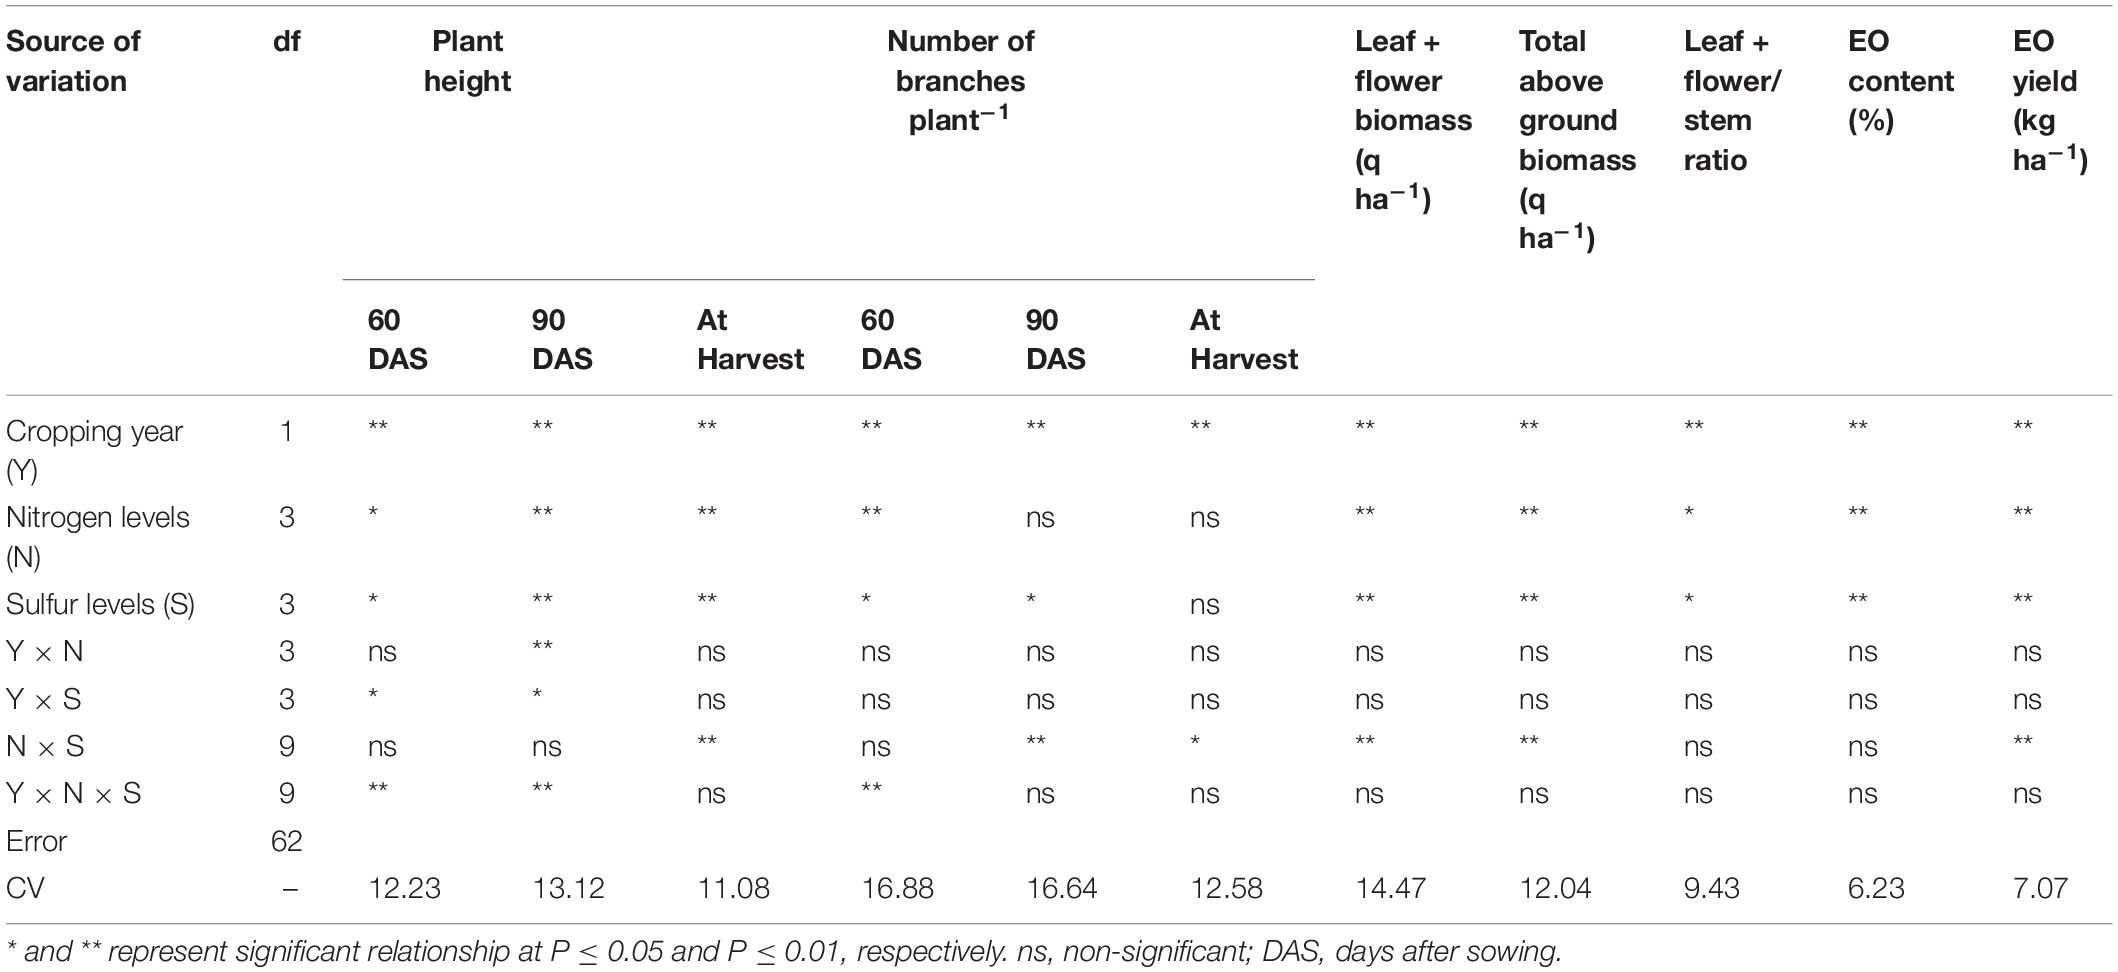
Table 1. Analysis of variance for effect of cropping year and nutrient application on growth and yield traits of T. minuta.
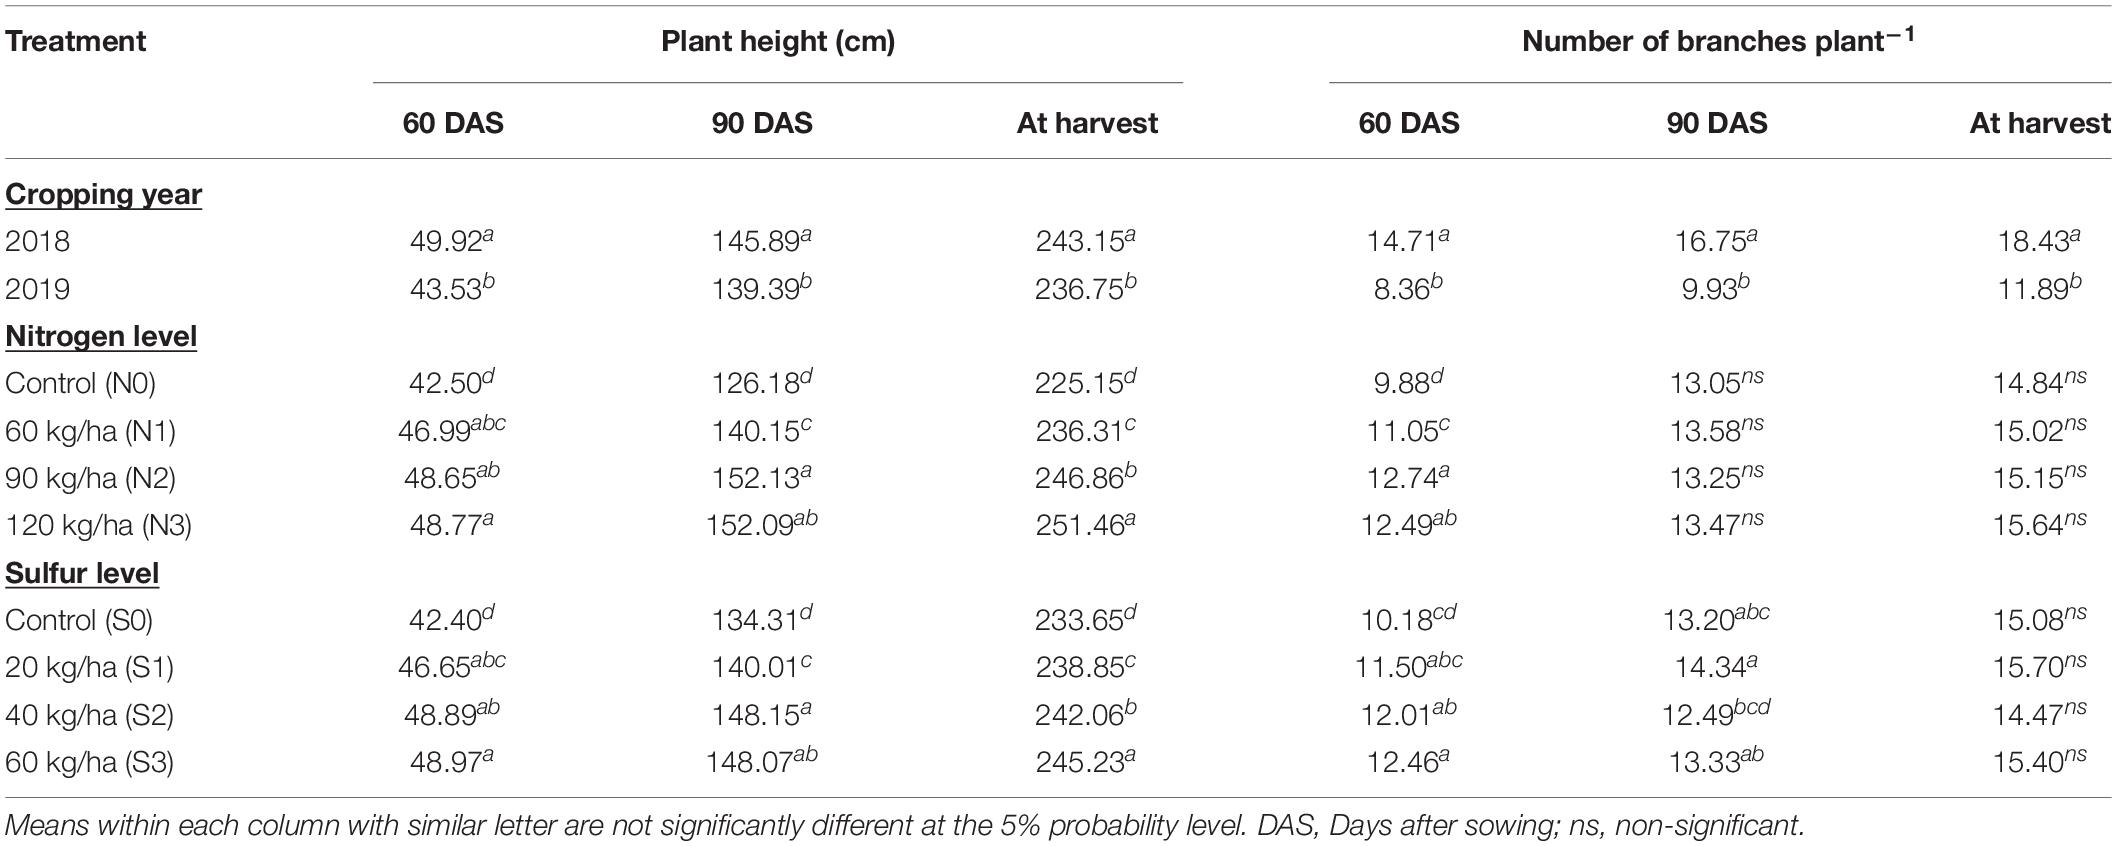
Table 2. Effect of year and fertilization levels on growth parameters of T. minuta at different growth stages.
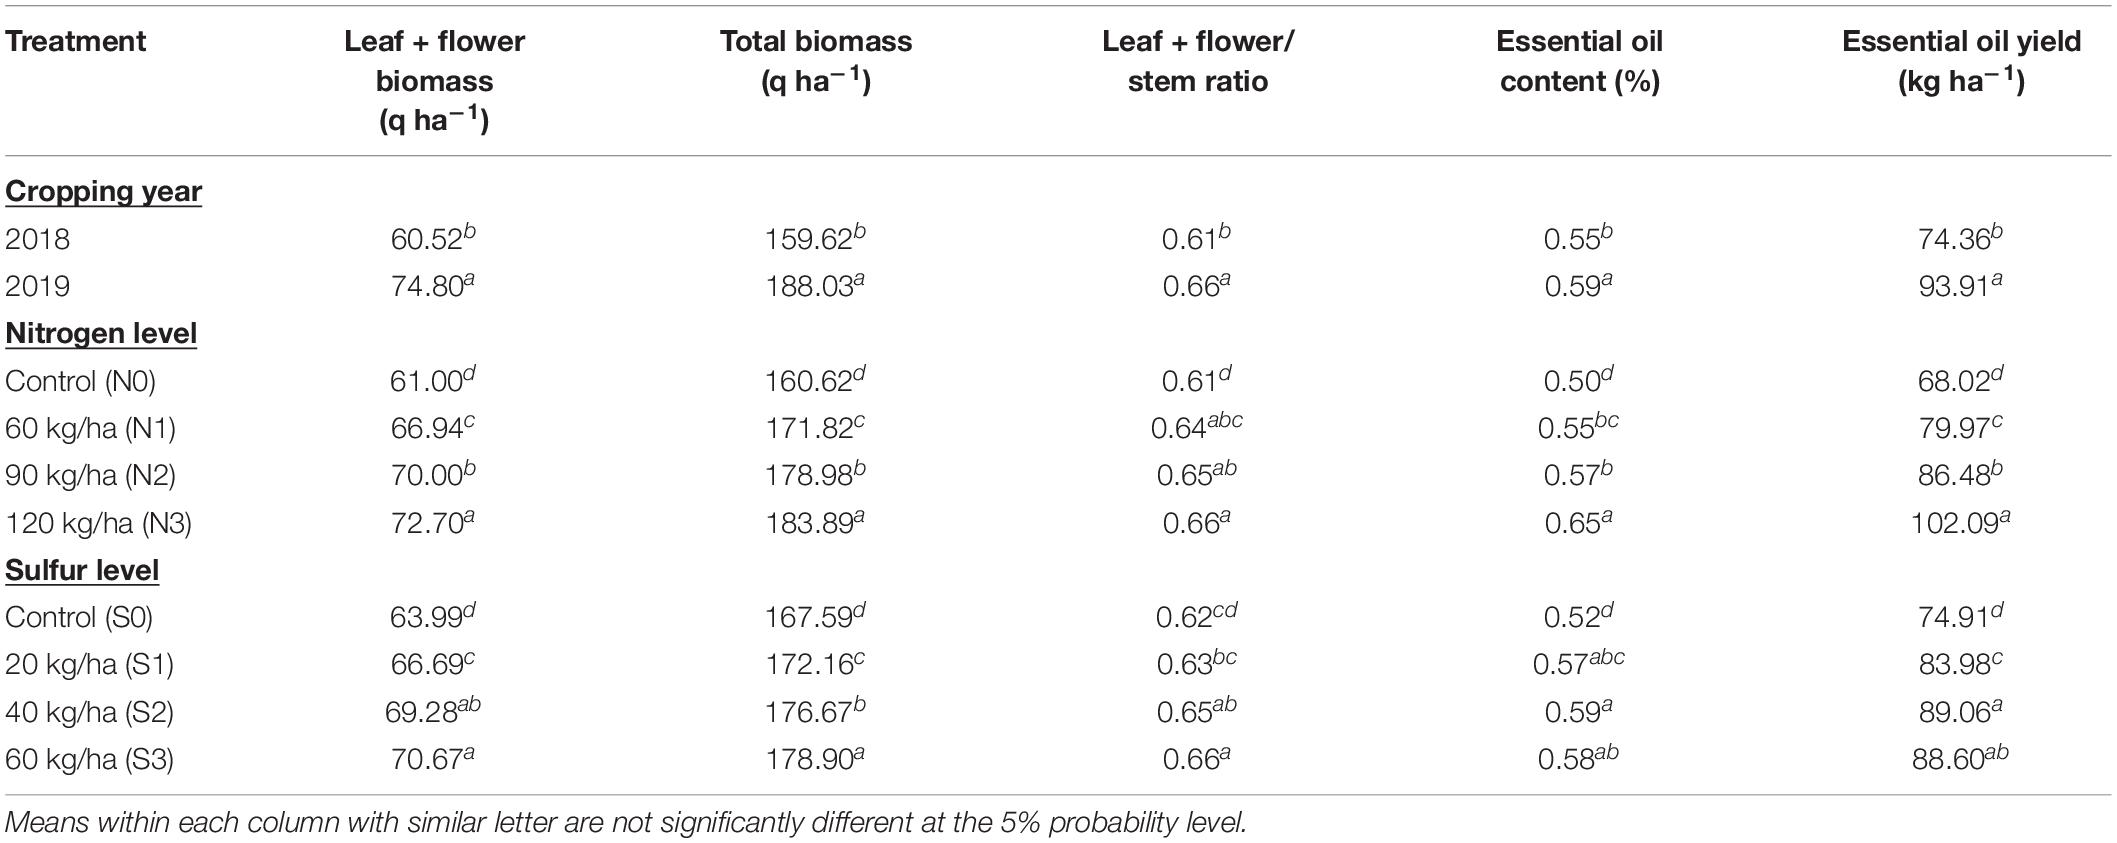
Table 3. Effect of year and fertilization levels on biomass and essential oil yield of T. minuta.
Among the nutrient levels, N at 120 kg ha–1 and S at 60 kg ha–1 produced taller plants (48.77 cm and 48.97 cm, respectively) at 60 DAS which remained statically at par with other two doses of N and S than control. At 90 DAS, significantly higher plants were produced with N at 90 kg ha–1 (152.13 cm) and S at 40 kg ha–1 (148.15 cm) which were in line with N at 120 kg ha–1 and S at 60 kg ha–1, respectively, than control. Significantly taller plants were recorded with 120 kg N ha–1 (251.46 cm) and 60 kg S ha–1 (245.23 cm) than other treatments at harvest. Higher number of branches plant–1 were produced by 90 kg N ha–1 (12.74) and 60 kg S ha–1 (12.46) at 60 DAS than other treatments, whereas former was in line with N at 120 kg ha–1. No significant effect was noticed at 90 DAS and harvest on number of branches plant–1 with N and S application except for S at 90 DAS, which was maximum at 20 kg ha–1 and behaved statistically similar with S at 60 kg ha–1 (Table 2).
In case of yield parameters, significantly higher leaf + flower biomass (72.70 q ha–1), stem biomass (111.20 q ha–1), total biomass (183.89 q ha–1), and EO yield (102.09 kg ha–1) were found with N at 120 kg ha–1 as compared to other treatments. However, S at 60 kg S ha–1 observed maximum leaf + flower biomass (70.67 q ha–1), stem biomass (108.22 q ha–1), and total biomass (178.90 q ha–1), when former two parameters were similar with S at 40 kg ha–1. EO yield (89.06 kg ha–1) was statistically higher at 40 kg S ha–1 than control, but in line with 60 kg S ha–1 (Table 3). In this investigation, the effects of cropping season and nutrient application on EO content (%) were significant (P ≥ 0.05) (Table 3). Year 2019 recorded significantly higher EO content (0.59%) than 2018 (0.55%). Irrespective of years, N application increased the EO content by 30.00% at 120 kg ha–1 than control. However, EO content (0.59%) at 40 kg ha–1 was statistically higher with 13.46% than control, but found similar with remaining S doses.
Correlation and Regression Analysis
The correlation matrix of T. minuta (Figure 2) showed positive and negative correlation of EO yield with plant height (r = 0.57) and number of branches (r = −0.49), respectively. Among biomass significantly (P = 0.01) positive correlation of EO yield was observed with leaf + flower biomass (r = 0.91), stem biomass (r = 0.91), and total biomass (r = 0.92). Total biomass showed positive (P = 0.01) correlation with leaf + flower (r = 0.99) and stem biomass (r = 0.99), and negative with number of branches (r = −0.72). Leaf + flower and stem biomass showed positive correlation with plant height (r = 0.33 and r = 0.31, respectively) and negative with number of branches (r = −0.71 and r = −0.73, respectively).
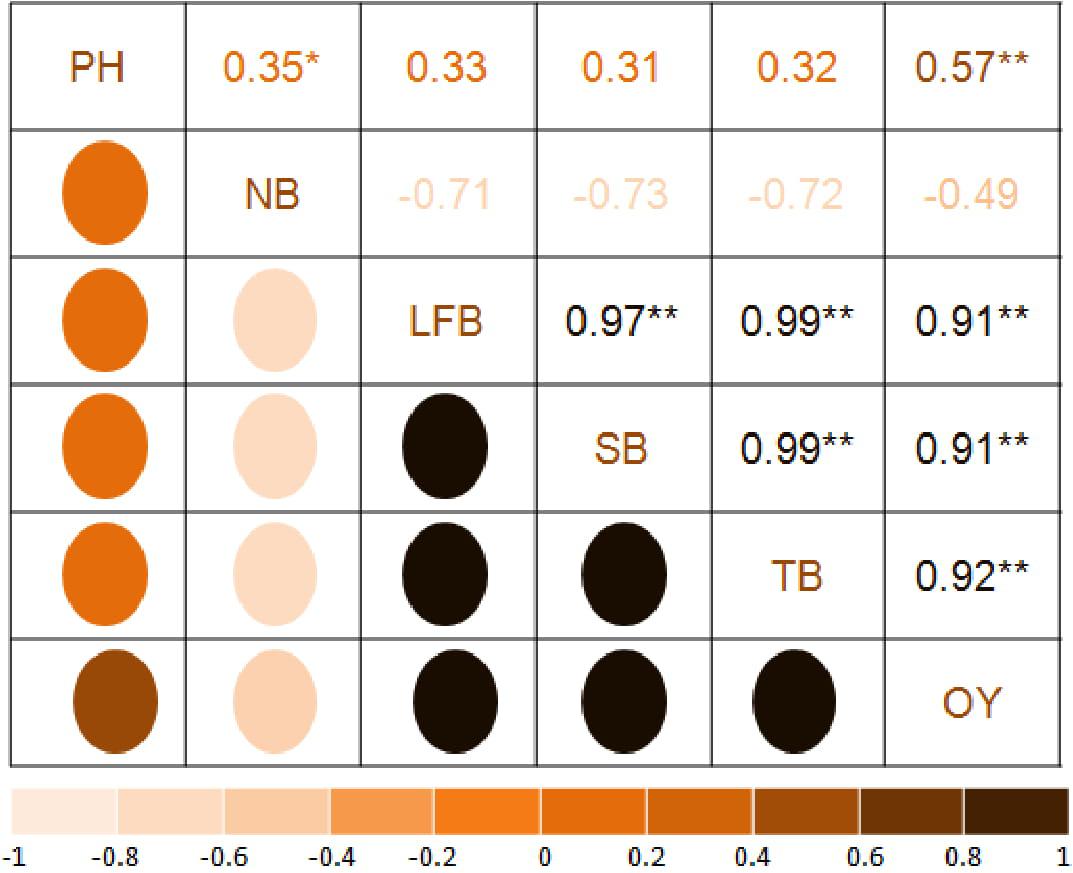
Figure 2. Correlation analysis of growth and yield parameters. PH, plant height; NB, number of branches per plant; LFB, leaf+flower biomass; SB, stem biomass; TB, total biomass. OY, oil yield. The mean values of the 2 years pooled data of the corresponding treatments are used (where N1 = N2 = 16); * and ** Indicate that the corresponding values are significant at P = 0.05 and P = 0.01, respectively.
Regression equations among independent variables N and S and dependent variables total biomass and EO yield were created (Figure 3). The magnitude of total biomass and EO yield increased with increase in N dose and was found highest in 120 kg N ha–1 (Figure 3A). A strong relationship was observed for N doses with total biomass and EO yield with equation y = 160.53 + 0.1974x −4E-06x2 (R2 = 0.997; P = 0.01) and y = 68.25 + 0.0667x + 0.0017x2 (R2 = 0.989; P = 0.01), respectively. Among S doses, total biomass enhanced with higher doses of S, while EO yield enhanced till 40 kg S ha–1 with a decline thereafter (Figure 3B). Therefore, a strong relationship was established by levels of S with total biomass (167.40 + 0.28x −0.001x2; R2 = 0.996; P = 0.01) and EO yield (y = 74.83 + 0.588x – 0.006x2; R2 = 0.999; P = 0.01).
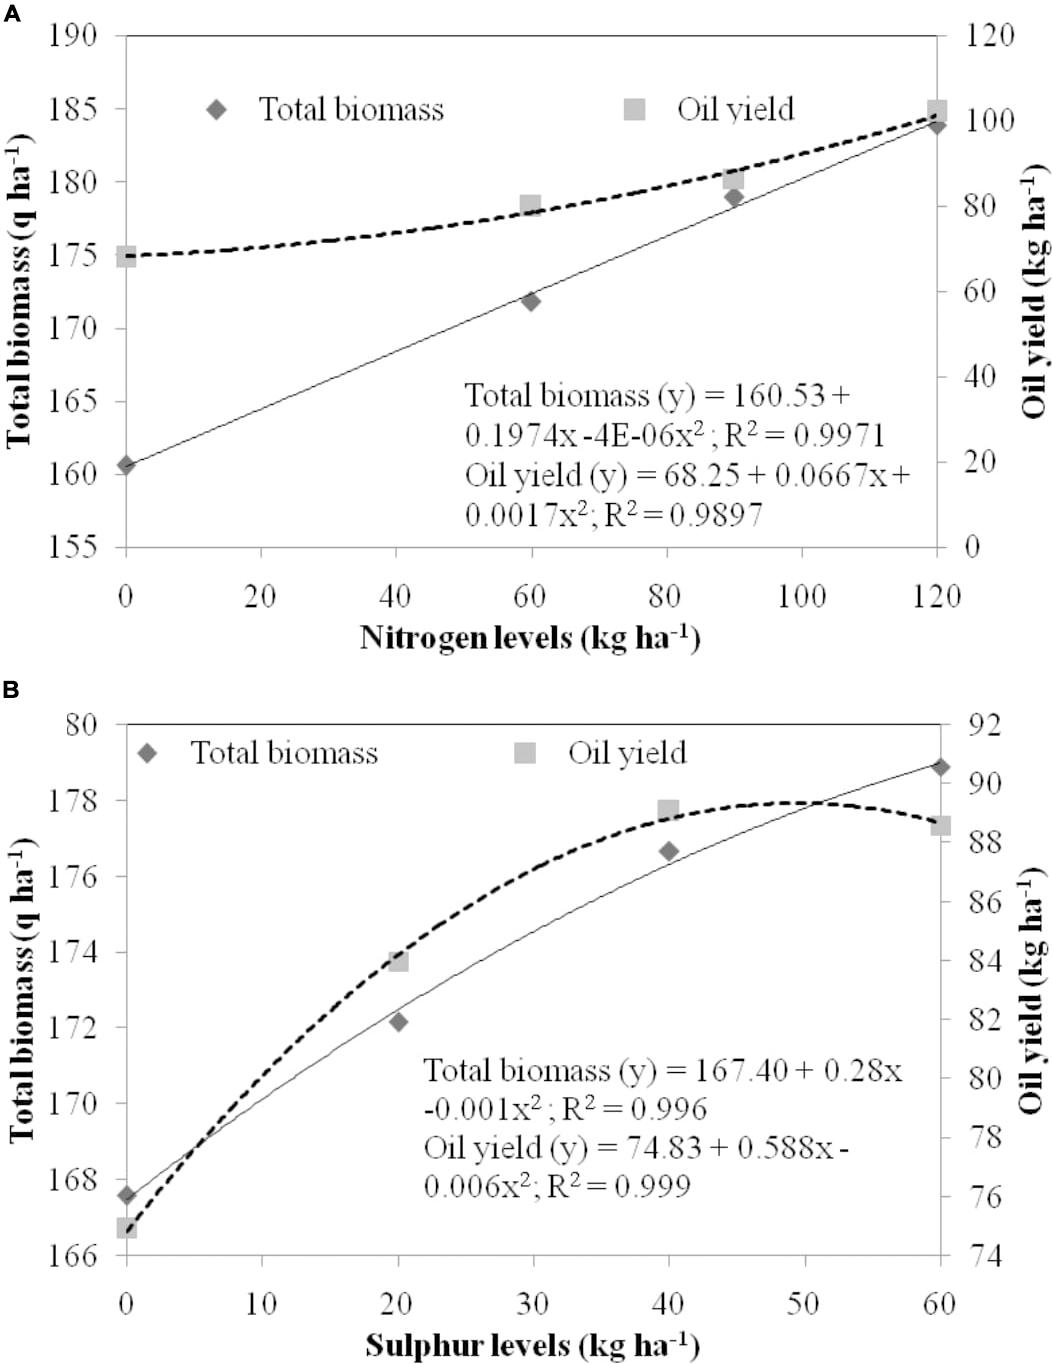
Figure 3. Regression equation between independent variable, (A) levels of nitrogen (B) levels of sulfur and dependent variables, i.e., total biomass (q ha– 1) and oil yield (kg ha– 1). The doses of nitrogen and sulfur are represented in the primary X axis. Total biomass and oil yield are presented in the primary Y axis and secondary Y axis, respectively.
Stomatal and Leaf Oil Glands Characteristics
Electron-microscopic observations of abaxial surface of leaves showed significant result on stomatal densities and dimensions (stomata length and pore length) with the use N and S fertilizers (Figure 4). The decrease in stomatal density seems to be consistent with increasing N and S doses, and was found higher in control than other treatments. In case of stomatal length, 120 kg N ha–1 and 40 kg S ha–1 observed higher (P = 0.05) length than control. Stomatal aperture did not follow any particular trend (Table 4).
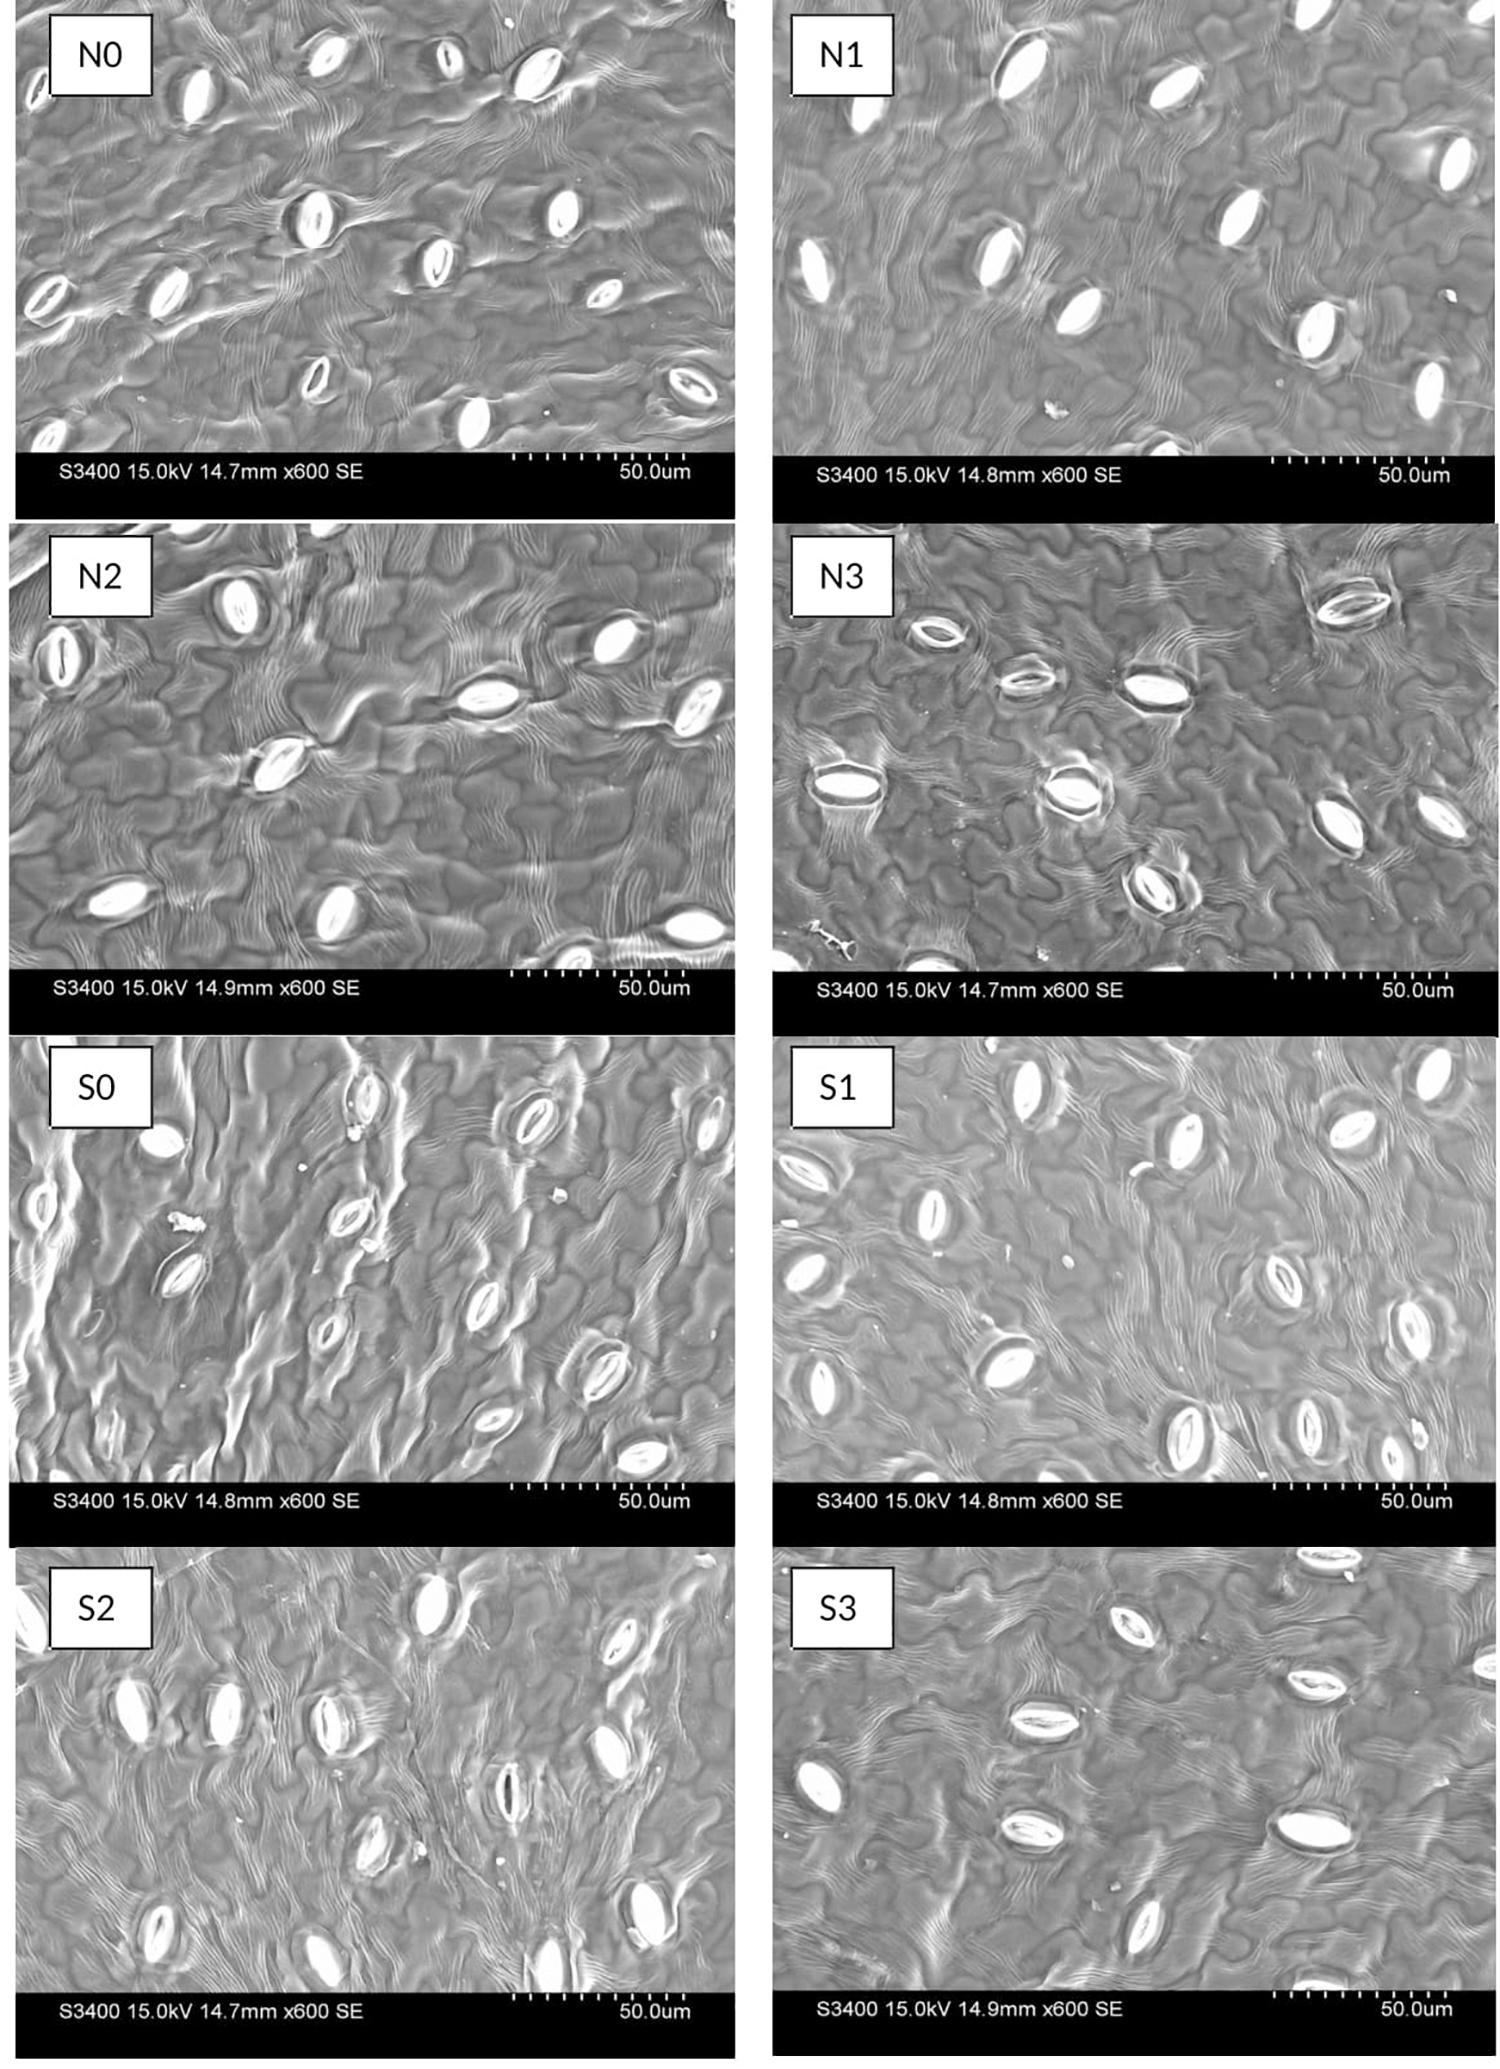
Figure 4. Effect of nitrogen (N) and sulfur (S) fertilization levels on stomatal characteristics. N0, N1, N2, and N3 are the level of nitrogen @ 0, 60, 90, and 120 kg ha– 1, respectively, while S0, S1, S2, and S3 are representing the level of sulfur @ 0, 20, 40, and 60 kg ha– 1, respectively.
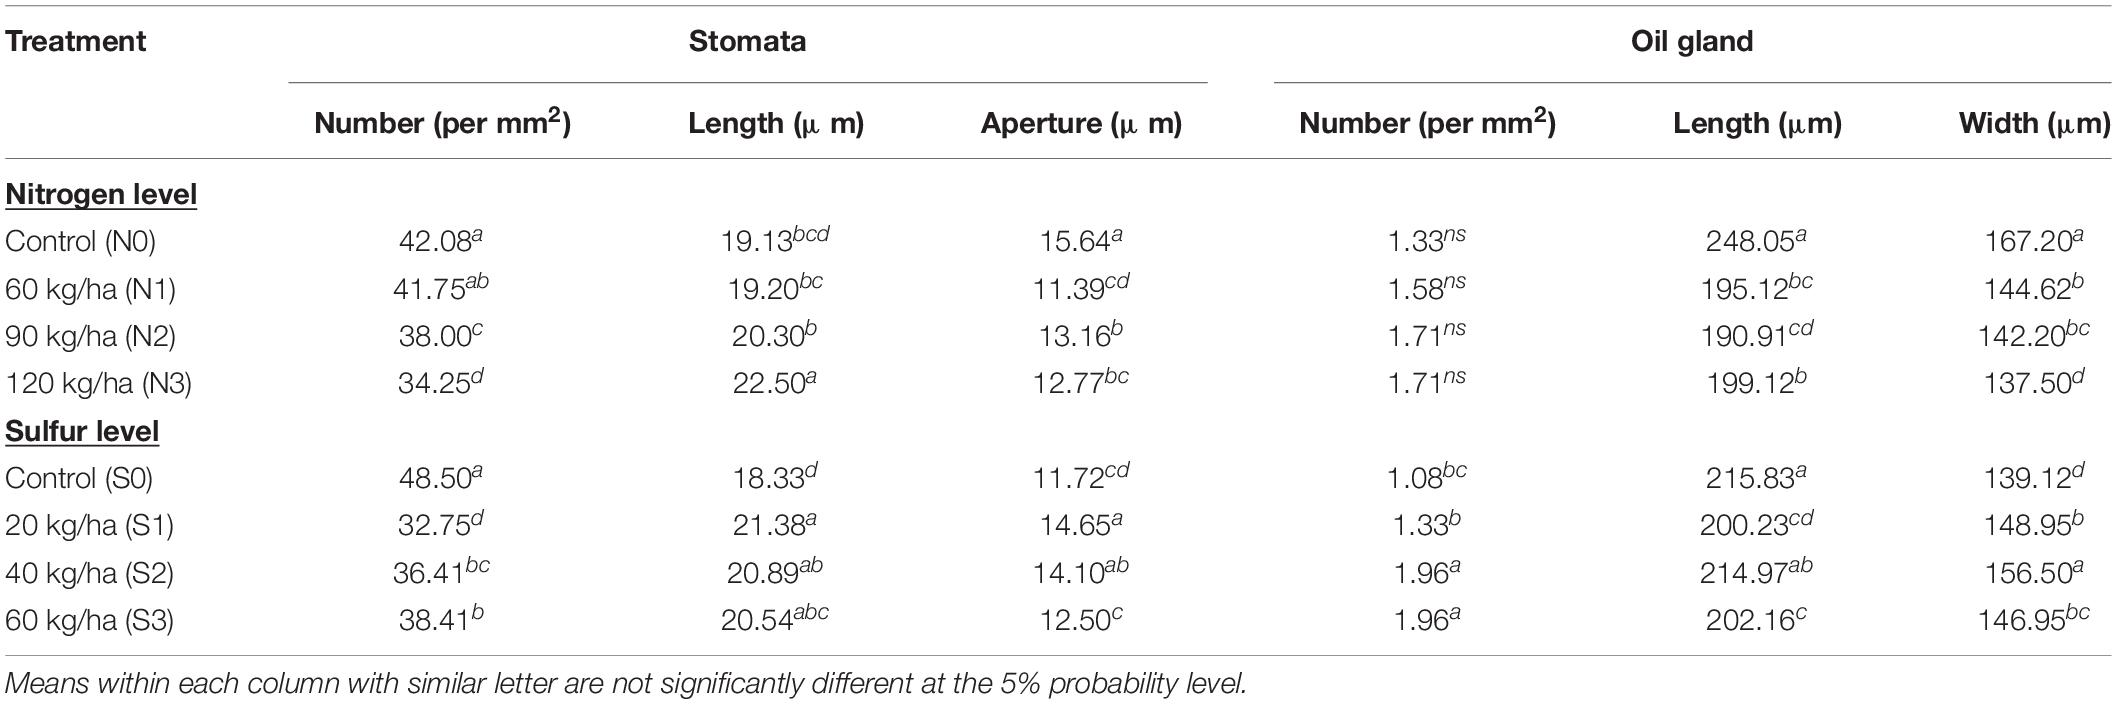
Table 4. Effect of fertilization levels on stomata and oil gland parameters of T. minuta during 2019.
The oil glands were observed on abaxial surface of T. minuta leaves (Figure 5). N and S dose recorded marked impact on oil gland characteristics in T. minuta. The population of oil glands appears more in S treated plants as compared to control, however, no significant effect was observed with N fertilization (Table 4). The plants with 60 and 40 kg S ha–1 reported about 81.48% higher leaf oil glands than control. In case of length and width of oil glands, leaves from control plots recorded significantly higher values in comparison to other doses of both N and S.
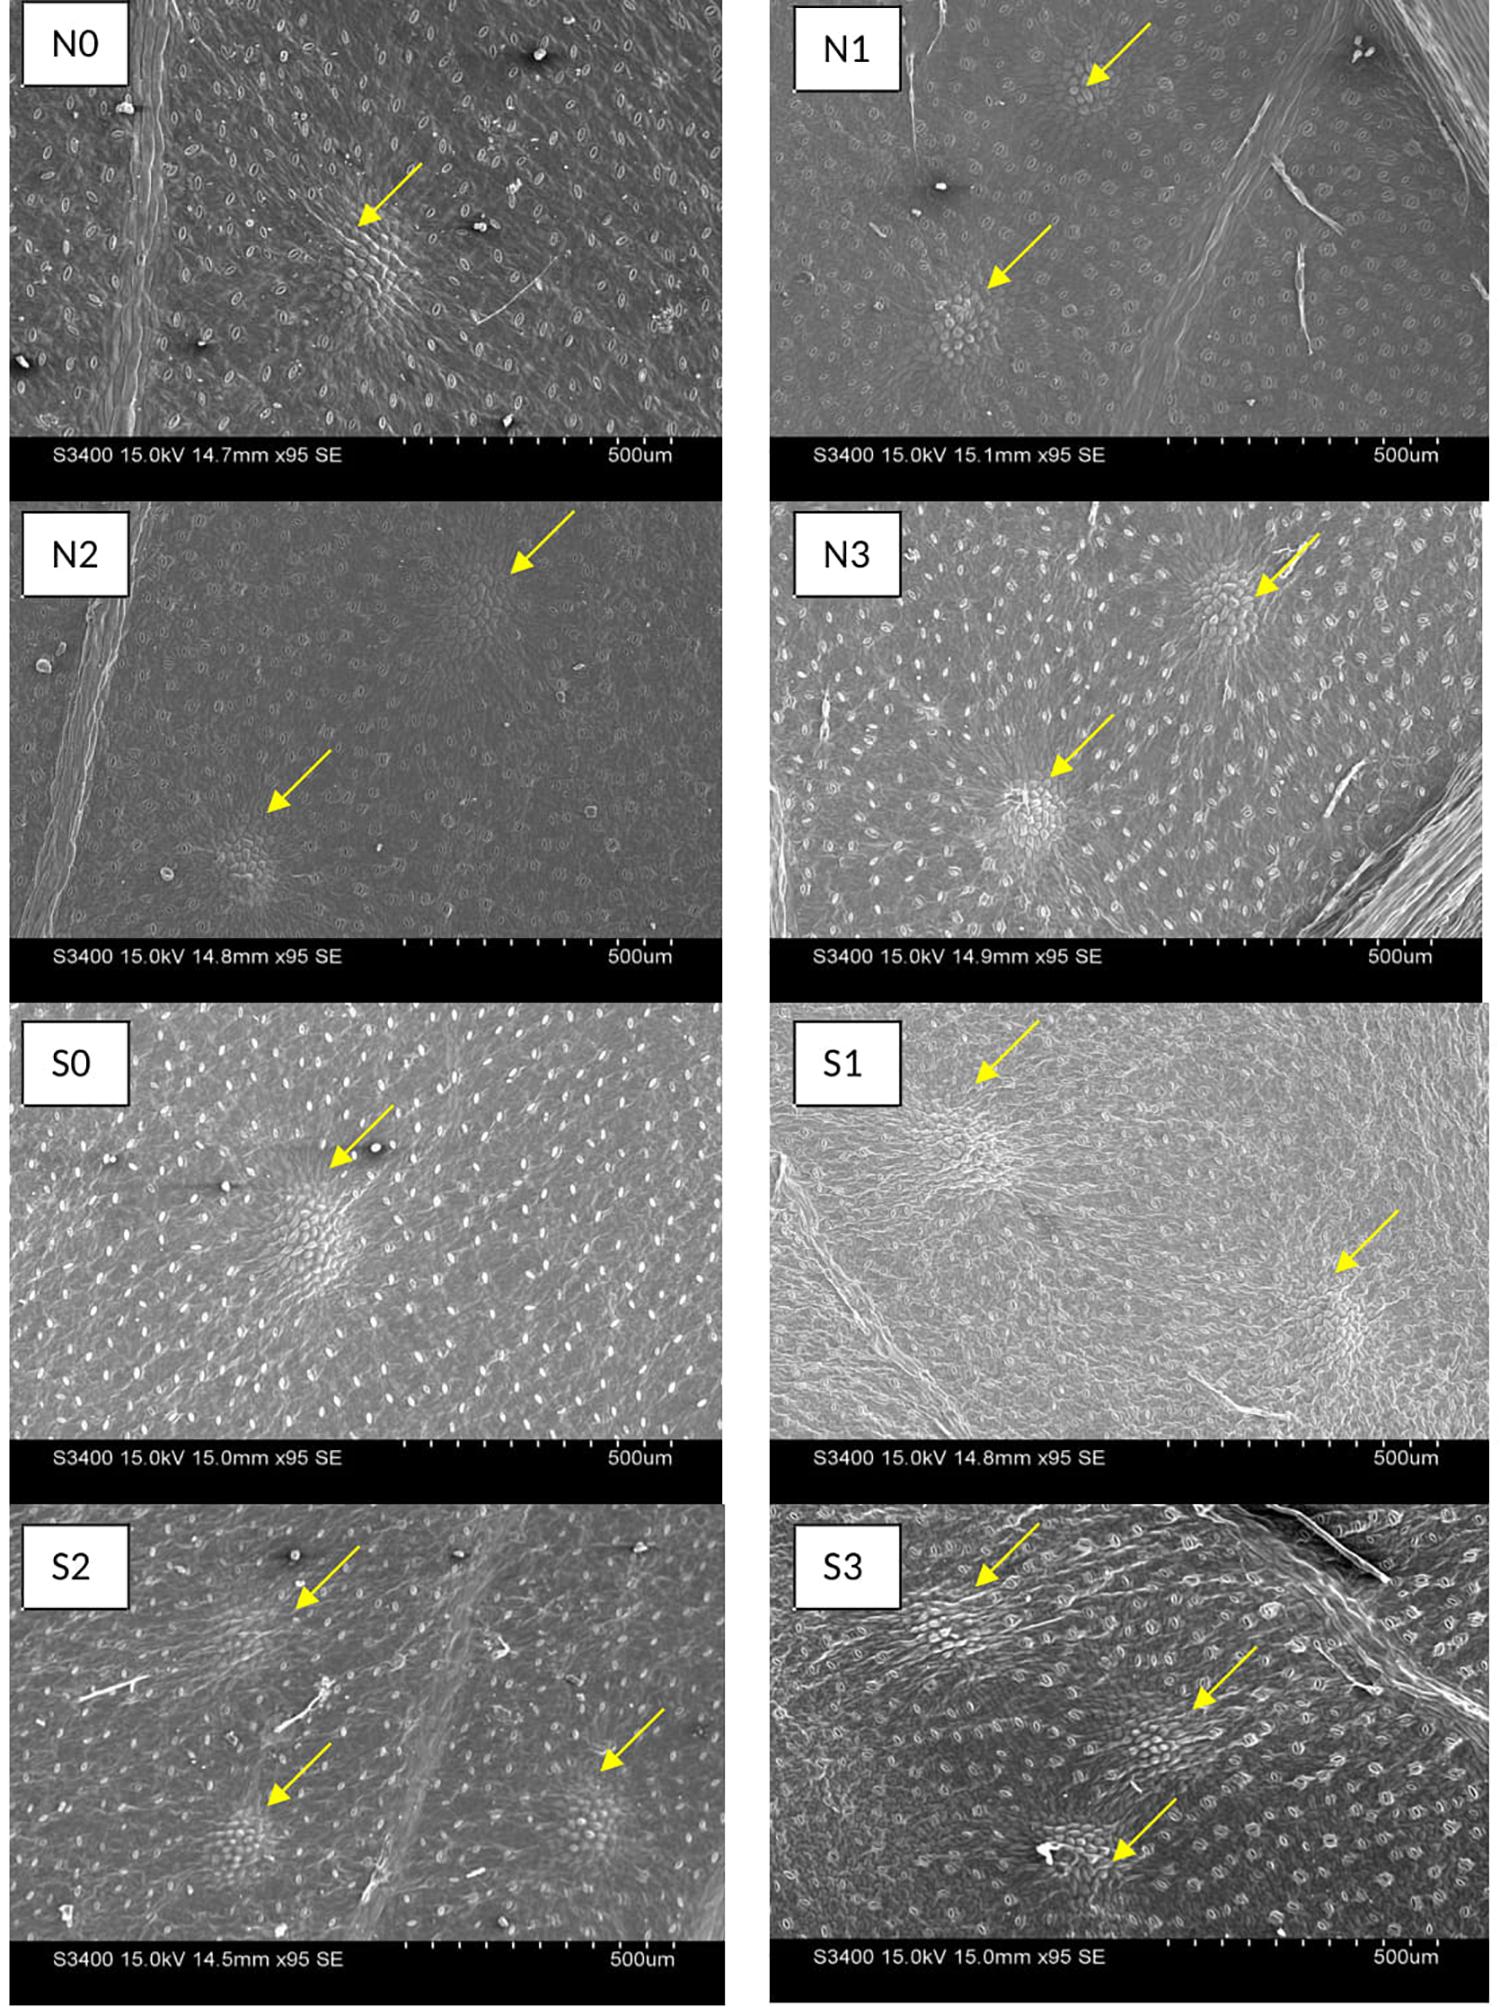
Figure 5. Effect of nitrogen (N) and sulfur (S) fertilization levels on leaf oil glands characteristics. N0, N1, N2, and N3 are the level of nitrogen @ 0, 60, 90, and 120 kg ha– 1, respectively, while S0, S1, S2, and S3 are representing the level of sulfur @ 0, 20, 40, and 60 kg ha– 1, respectively.
N × S Interaction
Total biomass and EO yield recorded significant interaction of N and S fertilization treatment during both the years (Table 5). Among N fertilization levels, highest total biomass yield was observed in N3 (120 kg N ha–1) than other levels during 2018 and 2019. Among S fertilization levels, S3 (60 kg S ha–1) showed enhanced total biomass yield than other treatments but was in line with S2 (40 kg S ha–1) during 2019. Among all treatment combinations N3S3, gave highest total biomass yield during 2018 and 2019, but remained statistically similar with N3S2 during 2019. In case of EO yield, N3 (120 kg N ha–1) recorded highest EO yield among N levels during both the years. Among S fertilization levels, S2 (40 kg S ha–1) recorded enhanced EO yield in 2018 and 2019, but were statistically similar to S3 (60 kg S ha–1) during both the years. Among all treatment combinations N3S2 recorded highest EO yield during 2018 and 2019, but were statistically in line with N3S3 during both the years. It was concluded that N3S2, i.e., 120 kg N ha–1 and 40 kg S ha–1 can be suggested for T. minuta based on biomass and EO yield response.
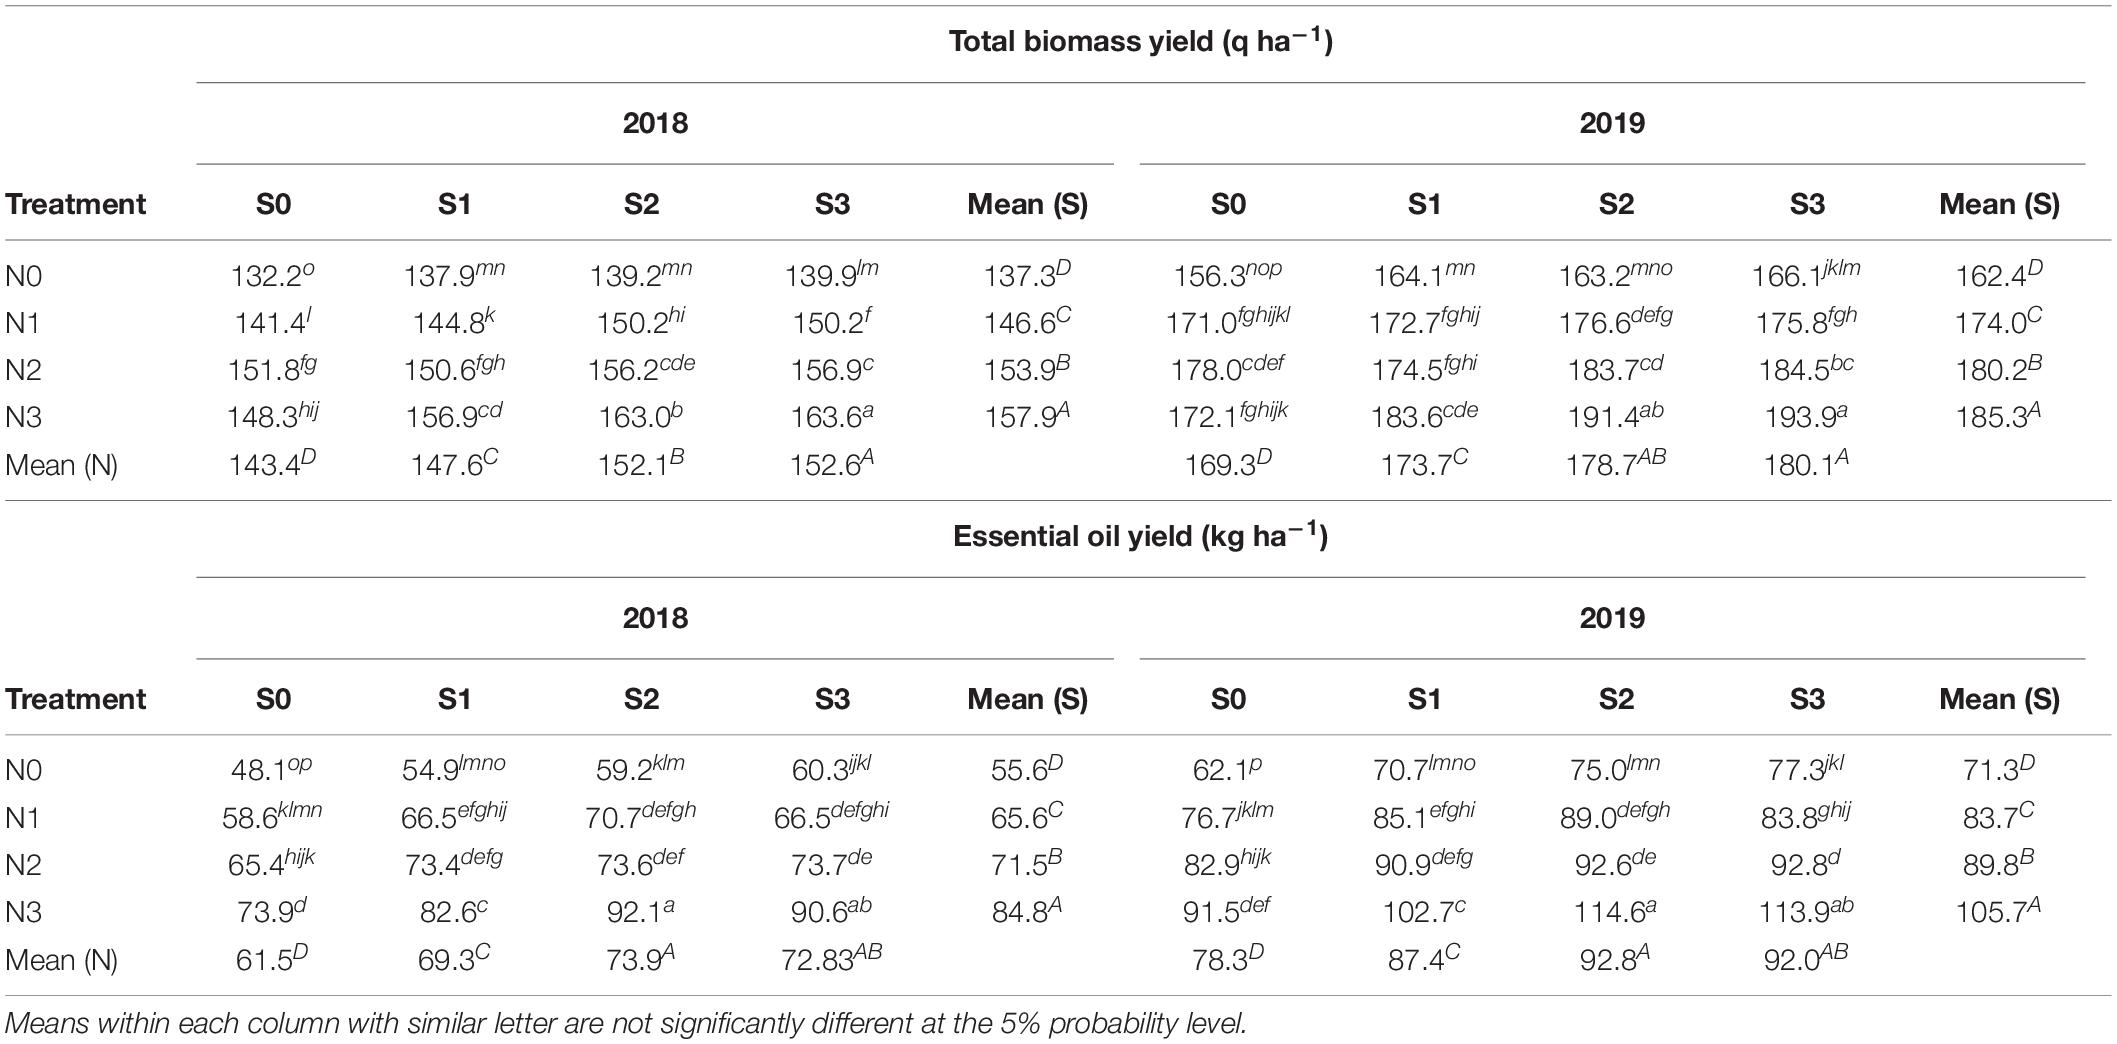
Table 5. Interaction effect of N and S fertilization levels on yield of T. minuta during 2018 and 2019.
Essential Oil Composition
The outcome of various treatments was assessed on EO constituents of T. minuta (Table 6). Overall, analysis of EO identifies 10 constituents accounting for 91.17–94.36% of the total percentage. The GC-FID reported Z-β-ocimene (34.18–42.59%), dihydrotagetone (18.83–24.73%), E-tagetone (0.80–1.17%), Z-tagetone (8.54–9.68%), Z-ocimenone (6.01–8.42%), and E-ocimenone (8.43–12.85%) as major constituents of EO. T. minuta EO presented acyclic monoterpenes (87.05–90.86%) as one of the major chemical group of terpenes.
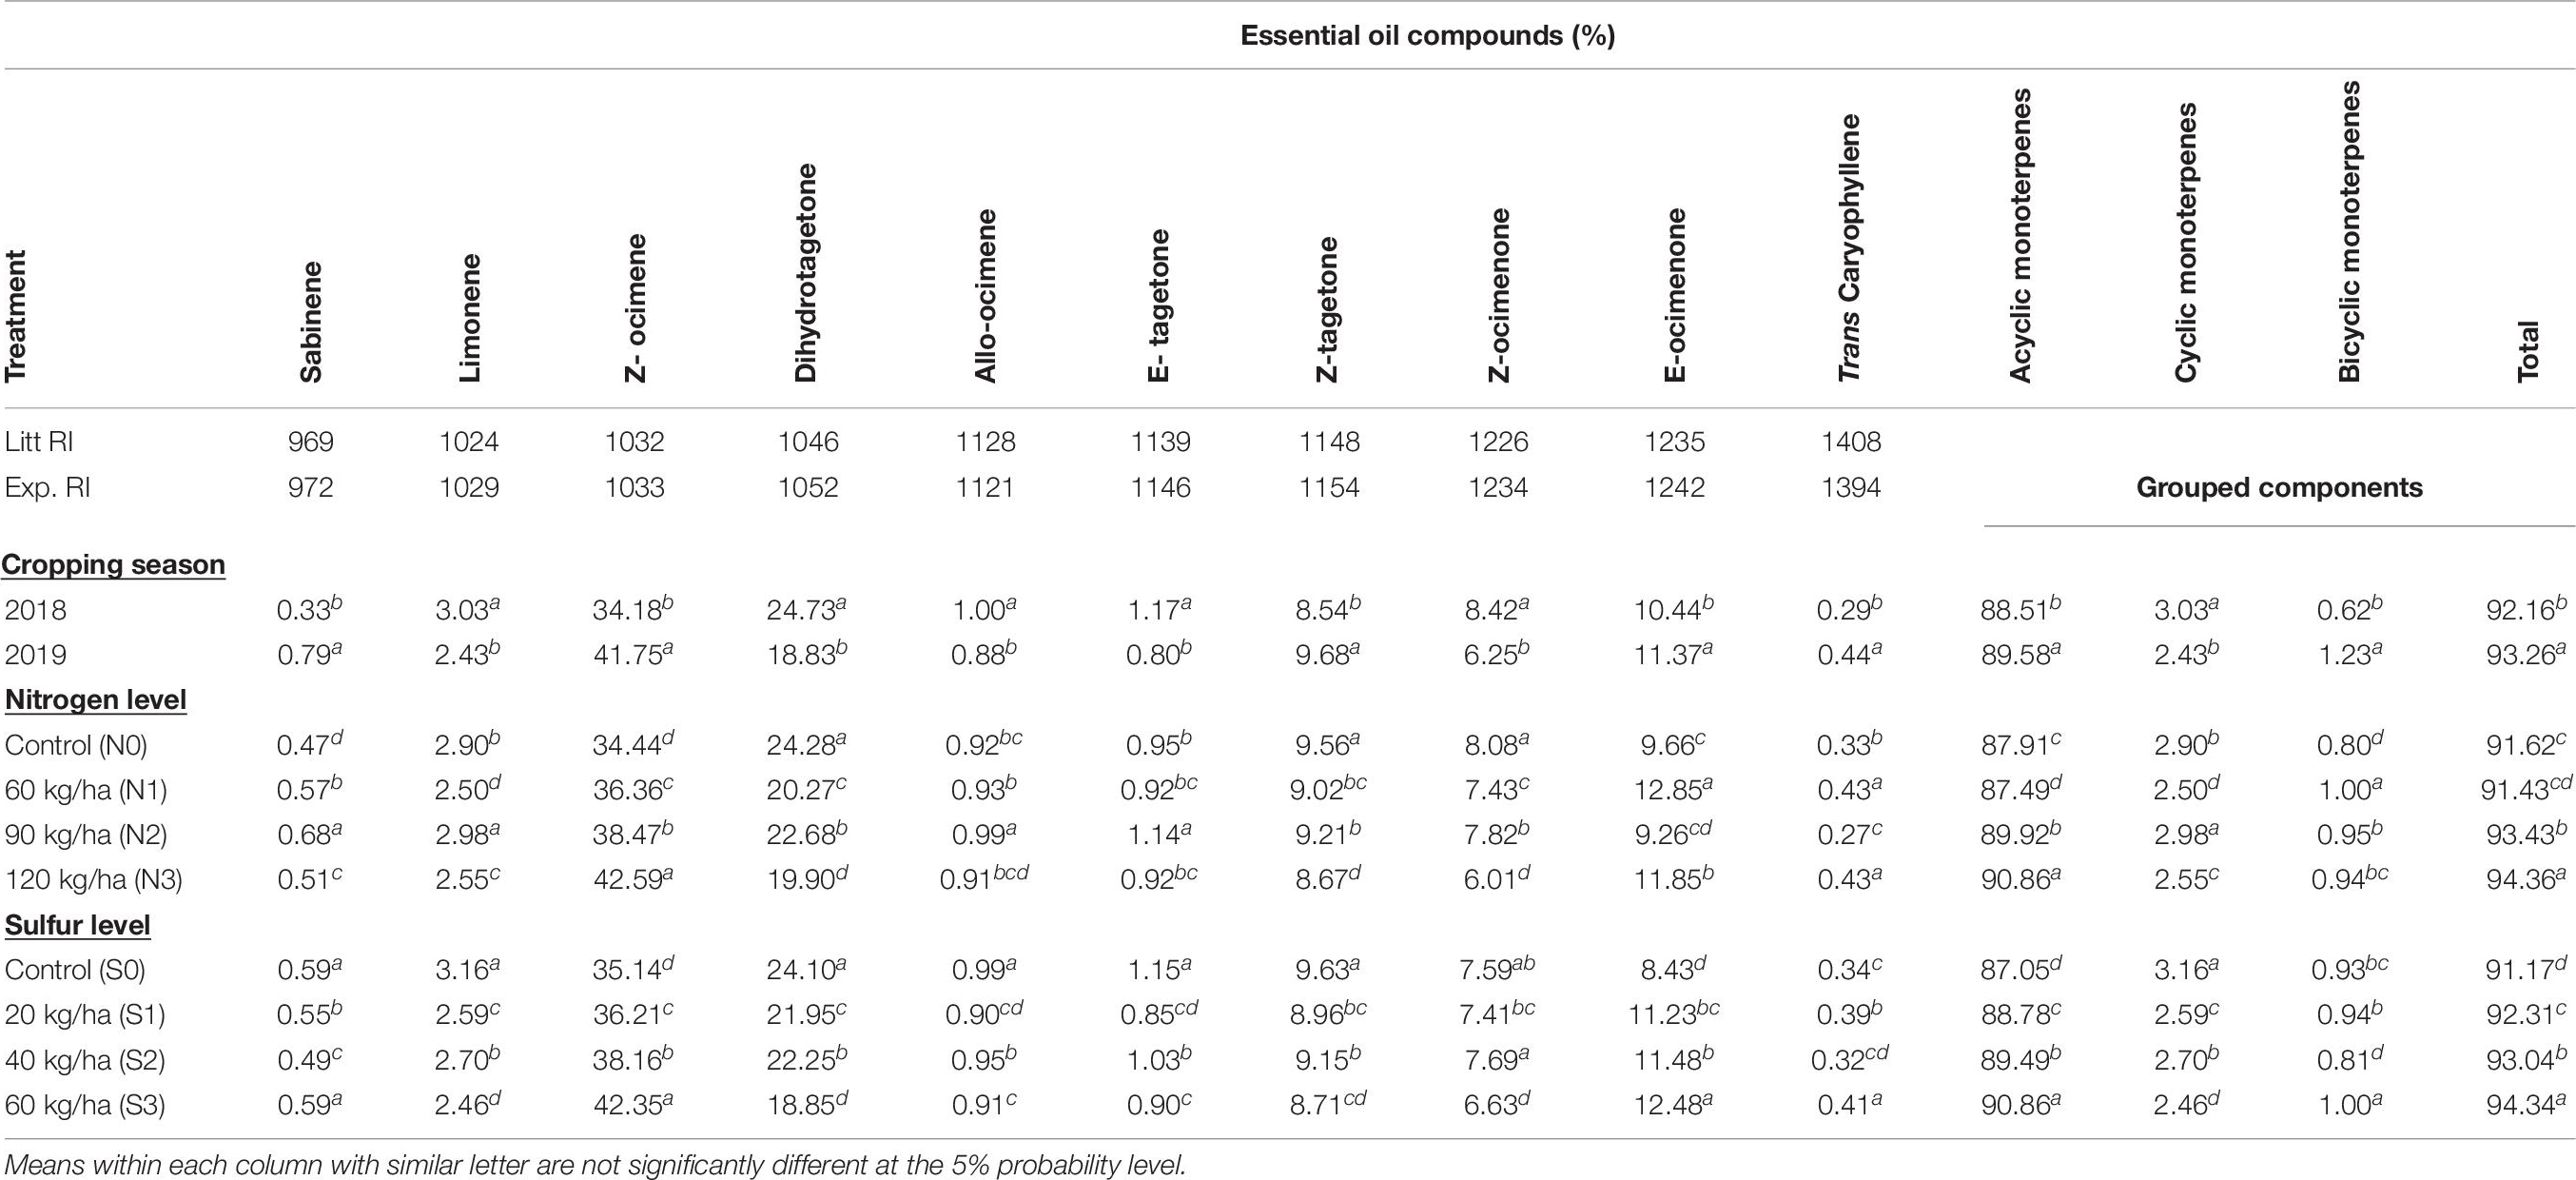
Table 6. Effect of year and fertilization levels on essential oil composition of T. minuta.
The percentage of EO constituents, i.e., dihydrotagetone, E-tagetone, and Z-ocimenone in 2019 reduced by 23.85, 31.62, and 25.77%, respectively, compared to 2018, however, percentage of Z-ocimene, Z- tagetone, and E- ocimenone increased by 22.14, 13.34, and 8.90%, respectively, during 2019 as compared to 2018. Nutrient fertilization treatments affected the percentage of main constitutes differently. N and S showed significant effect on Z-β-ocimene, and the maximum quantity (42.59 and 42.35%, respectively) was recorded with N (120 kg ha–1) and S (60 kg ha–1). These application rates recorded about 23.66 and 20.51% higher Z-β-ocimene, respectively, as compared to control. Dihydrotagetone, Z-tagetone, and Z-ocimenone in case of N levels, while dihydrotagetone, E-tagetone, and Z- tagetone in case of S levels reported significantly higher percentages in control as compared to other fertilization levels. Among N levels, the percentage of E-tagetone (1.14%) and E-ocimenone (12.85%) increased with 90 and 60 kg N ha–1, respectively, than rest of N treatments. Significantly higher quantity of Z-ocimenone (7.69%) and E-ocimenone (12.48%) was observed with S at 40 and 60 kg ha–1, respectively, than other S application rates. These application rates recorded 1.31 and 48.04% higher Z-ocimenone and E-ocimenone, respectively, as compared to control.
Among grouped components acyclic monoterpenes covered maximum area percentage as compared to cyclic and bicyclic monoterpenes (Table 6). N and S observed significant effect on acyclic monoterpenes, and the maximum quantity (90.86%) was recorded with N (120 kg ha–1) and S (60 kg ha–1). Total percentage area of EO also showed similar trend with the maximum quantity (94.36 and 94.34%, respectively) with N (120 kg ha–1) and S (60 kg ha–1).
Principal Component Analysis (PCA)
Principal component analysis was carried out using eight variables (six agronomic traits and two EO compounds) of Tagetes to know the relation between N and S doses and these variables (Figure 6). The statistics revealed that 85.21% of the total variations were jointly clarified by PC1 and PC2. Figure 6A represents the distribution of variables and treatment combinations. Among variables, except dihydrotagetone (V8), all variables [plant height (V1), branches (V2), flower + leaf biomass (V3), stem biomass (V4), total biomass (V5), EO yield (V6), and Z-β-ocimene (V7)] showed affirmative involvement in PC1. Similarly, in PC2, except for branches and Z-β-ocimene all other variables showed positive involvement (Figures 6A,C). The PCA also separated the treatment T11 (N2S2) and T15 (N3S2) by PC1 and PC2 and showed positive involvement in both PCs with strong relationships with most of the variables (Figure 6A). This study also showed that first three PCs with eigenvalues 5.85, 0.97, and 0.89, respectively, were most informative accounting for approximately 96.45% of the overall variance for the entire variables (Figure 6B).
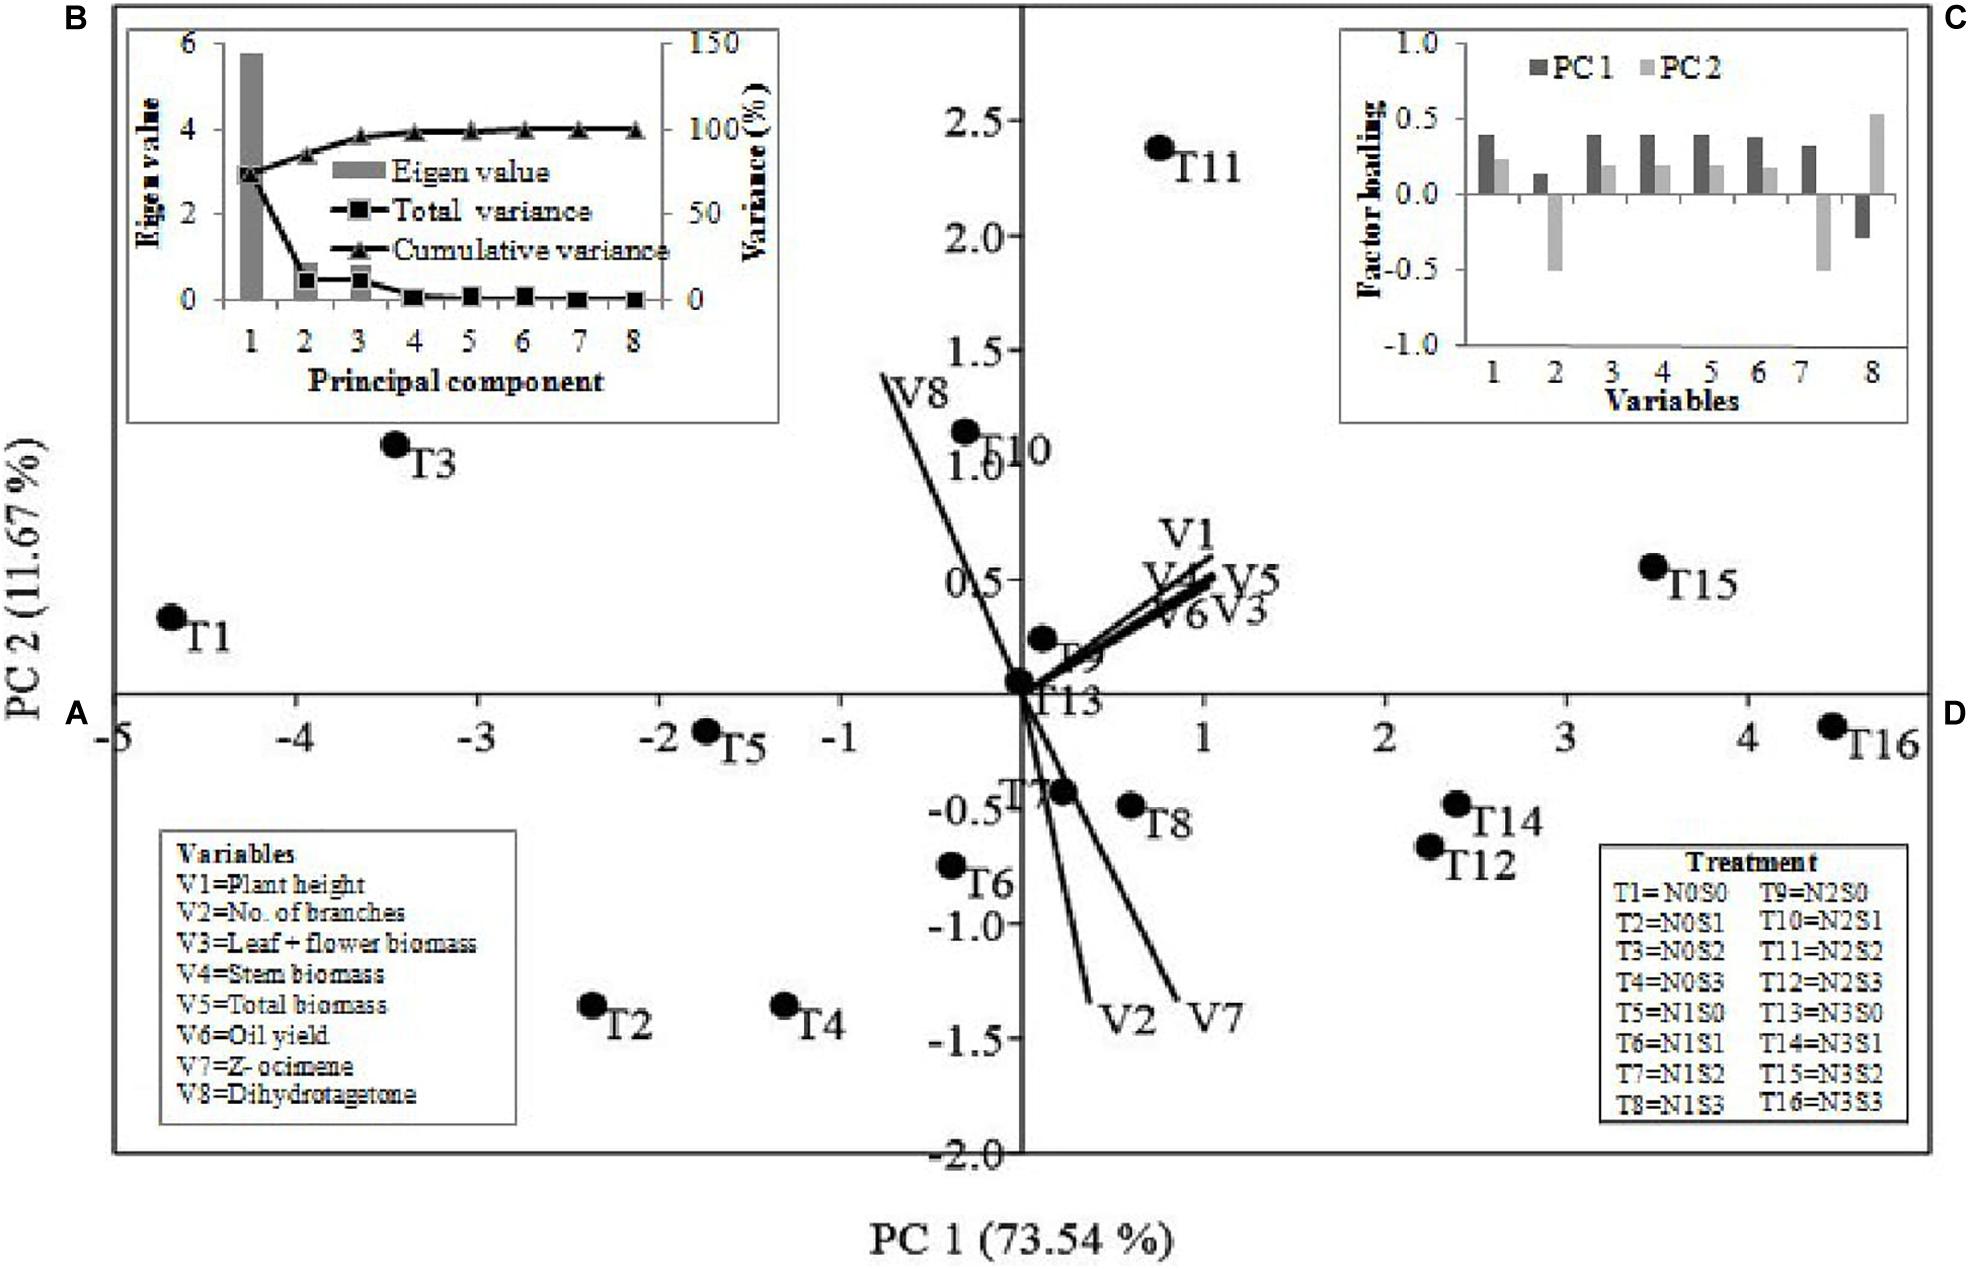
Figure 6. The multivariate analyses of mean value of growth parameters, yield and major compounds of essential oil were conducted through principal component analysis. PC1 and PC2 jointly explained the variations of 85.21% (A–D). The loading values of variables and treatment combinations (A) are presented as vectors in the space of the PCA. (B,C) presented eigenvalues and loading scores of the variables with PC1 and PC2. N0, N1, N2, and N3 are the level of nitrogen @ 0, 60, 90, and 120 kg ha–1, respectively, while S0, S1, S2, and S3 are representing the level of sulfur @ 0, 20, 40, and 60 kg ha–1, respectively.
Plant Nutrient Concentration, Soil Available Nutrients and Nutrient Use Efficiency Traits
The data revealed significant (P = 0.05) relation between nutrients concentration (N/P/K/S mg g–1 dry plant tissue) in above ground parts of wild marigold and different fertilizer doses of N and S, except for N (stem) and K (flower and stem) concentration in case of S fertilization (Figure 7). Higher N dose (120 kg N ha–1) showed higher N (22.94, 21.02, and 12.50 mg g–1), P (5.91, 4.16, and 3.49 mg g–1), K (16.71, 25.49, and 23.91 mg g–1), and S (5.82, 5.45, and 5.46) concentration by Tagetes flower, leaf and stem, respectively, than lower dose (60 and 90 kg/ha). Concentration of nutrients among S levels followed similar results as that of N, with highest nutrient concentration at higher dose of S (60 kg S ha–1). S at 60 kg ha–1 observed 22.19, 20.26, and 11.09 mg g–1 N, 5.84, 4.19, and 3.53 mg g–1 P, 16.24, 24.37, and 23.11 K and 5.29, 4.91, and 4.93 mg g–1 S concentration in flower, leaf and stem, respectively, of T. minuta.
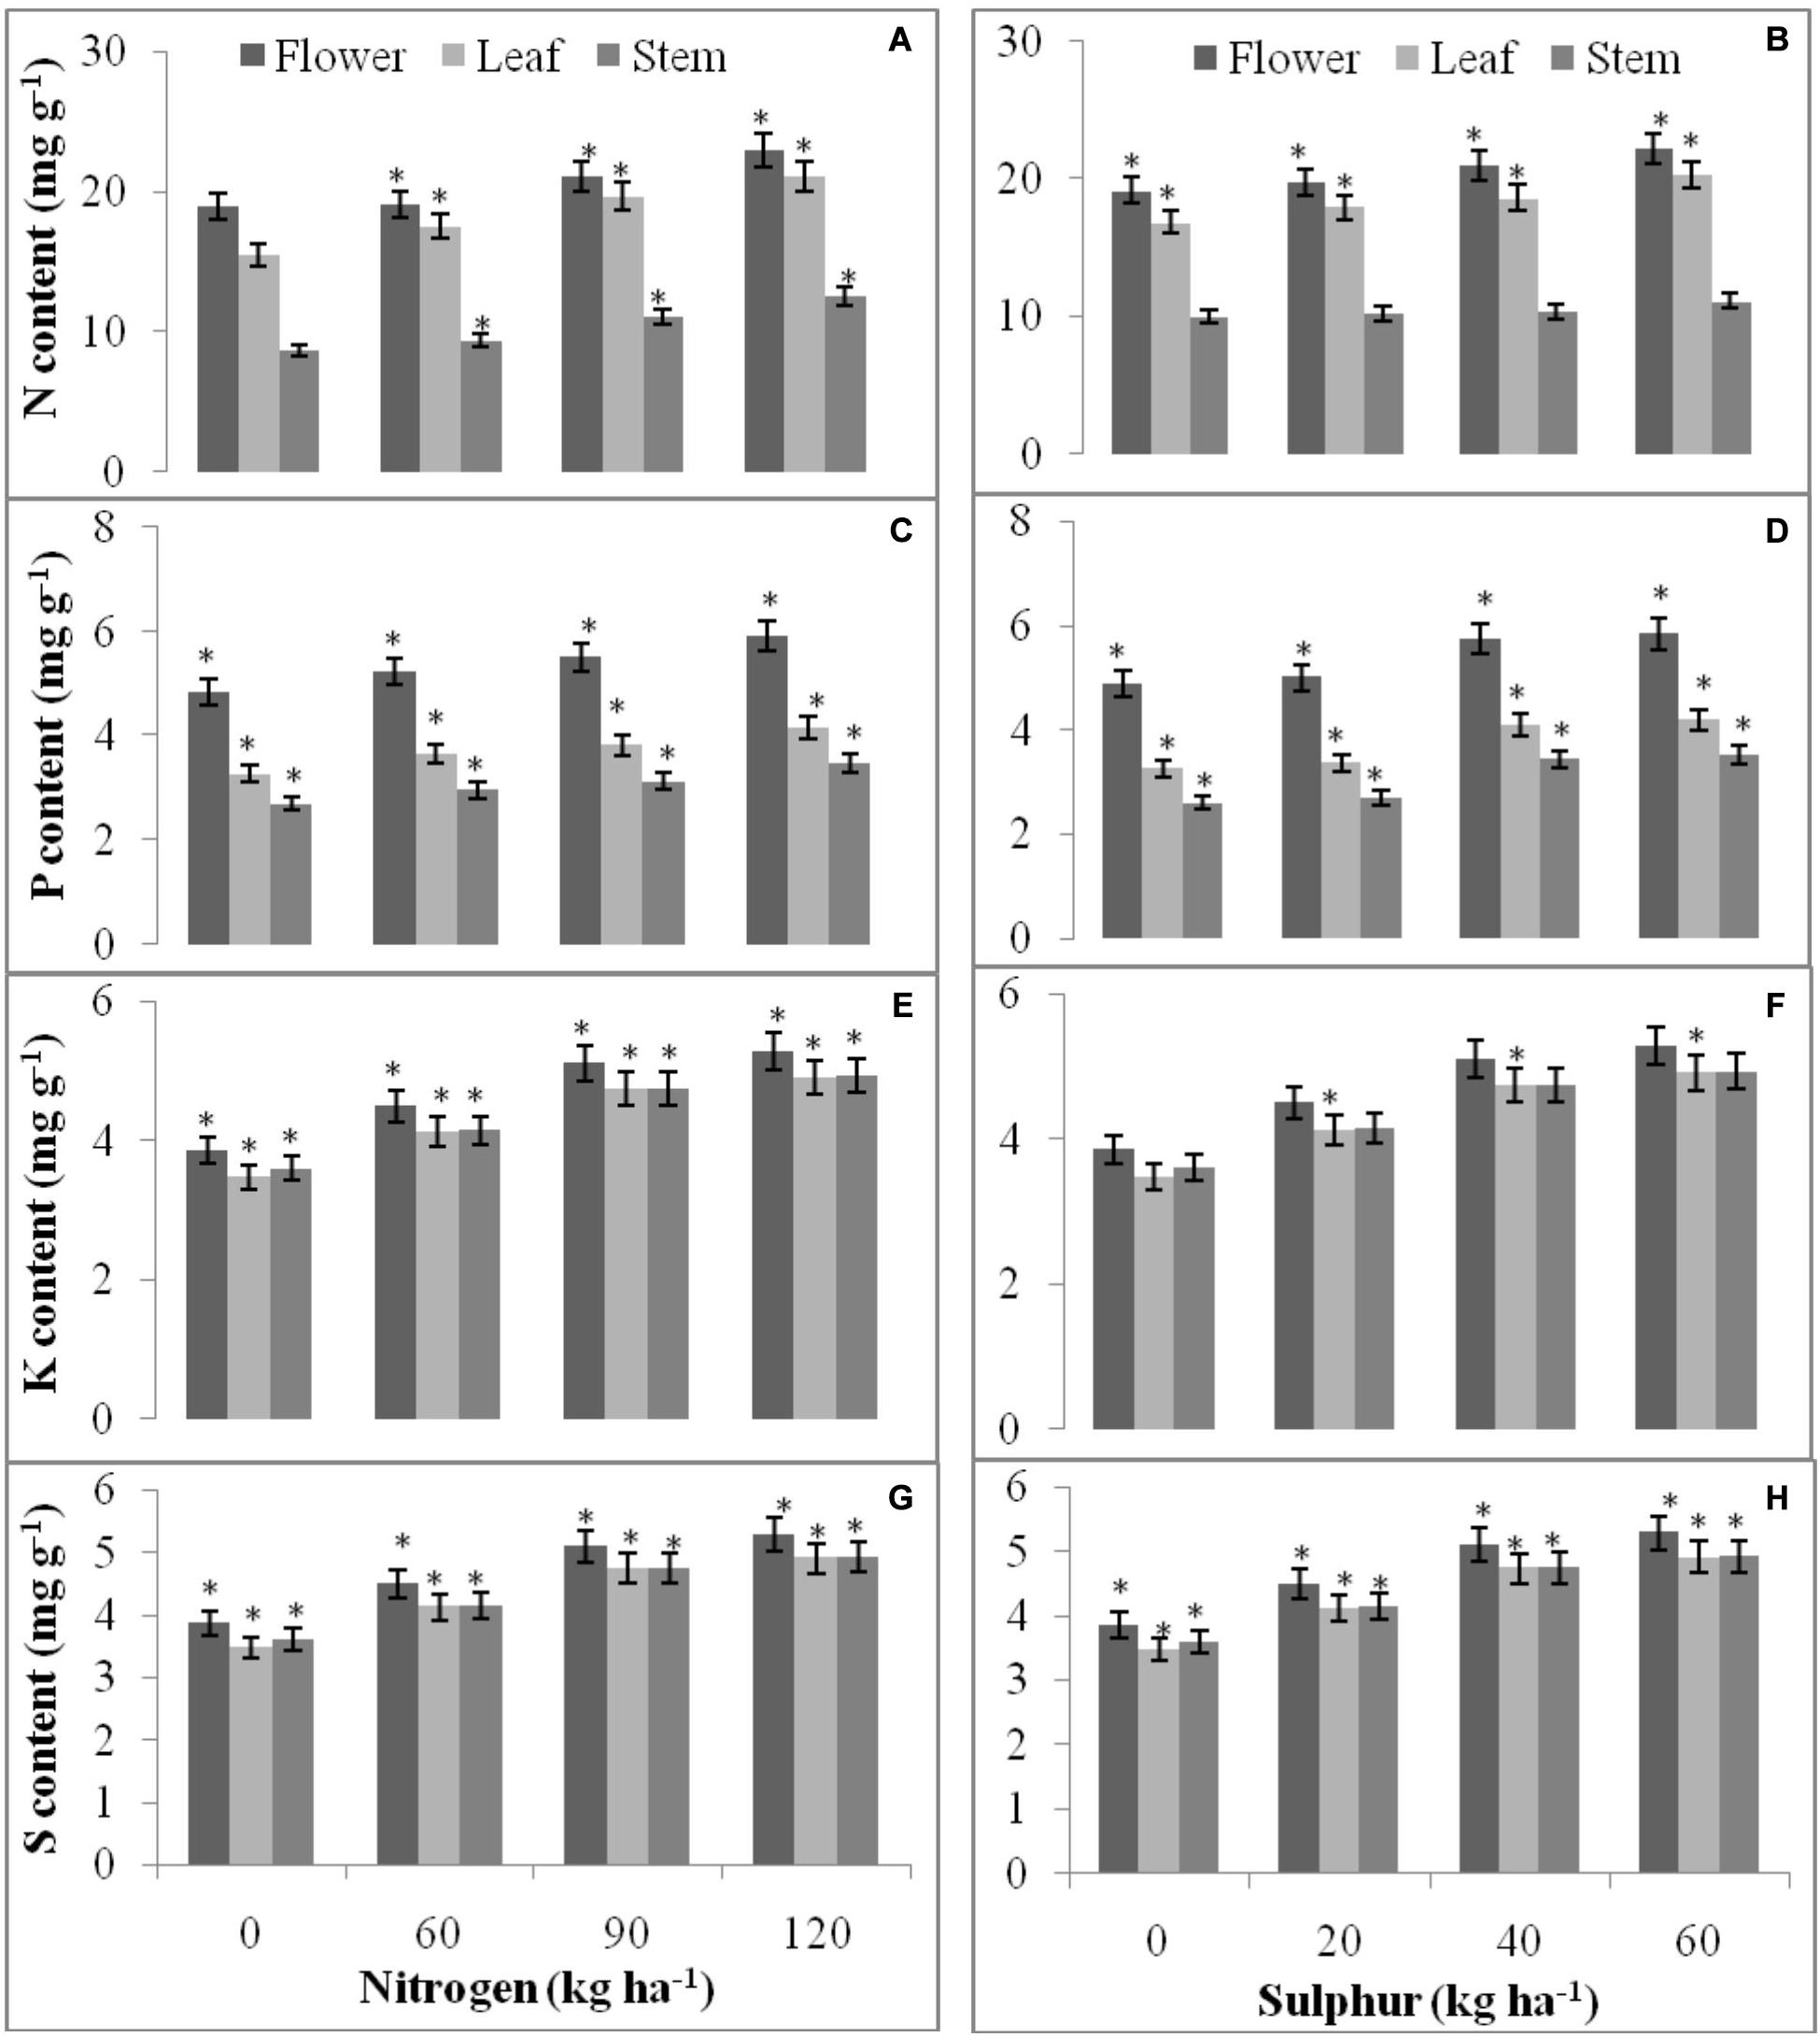
Figure 7. Spatial and temporal accumulation of N (A,B), P (C,D), K (E,F), and S (G,H) in T. minuta flower, leaf, and stem as influenced by applied N and S fertilizers. The mean values of 2 years pooled data are presented. Within each bar, the asterisk (*) indicates significant differences among fertilizer levels at P = 0.05. Vertical bars indicate a mean standard error (±).
Significant effect was also observed on available soil nutrients due to different cropping years and nutrient doses, except for available P and K due to S application (Table 7). Second cropping year recorded a higher available N (195.53 kg ha–1), P (14.42 kg ha–1), K (438.93 kg ha–1), and S (12.62 kg ha–1) at harvest than first year. Among the nutrient applications, higher available N, P, and S (203.48, 14.21 cm, and 12.55 kg ha–1, respectively) were noticed in N at 120 kg ha–1 than other treatments, whereas available P was statistically similar with N at 90 kg ha–1 and N at 60 kg ha–1. No significant effect was show by N application on available K. Among S applications, significantly higher available N and S (213.98 and 13.22 kg ha–1, respectively) were found in S at 60 kg ha–1, where former was in line with S at 40 kg ha–1 than other treatments.
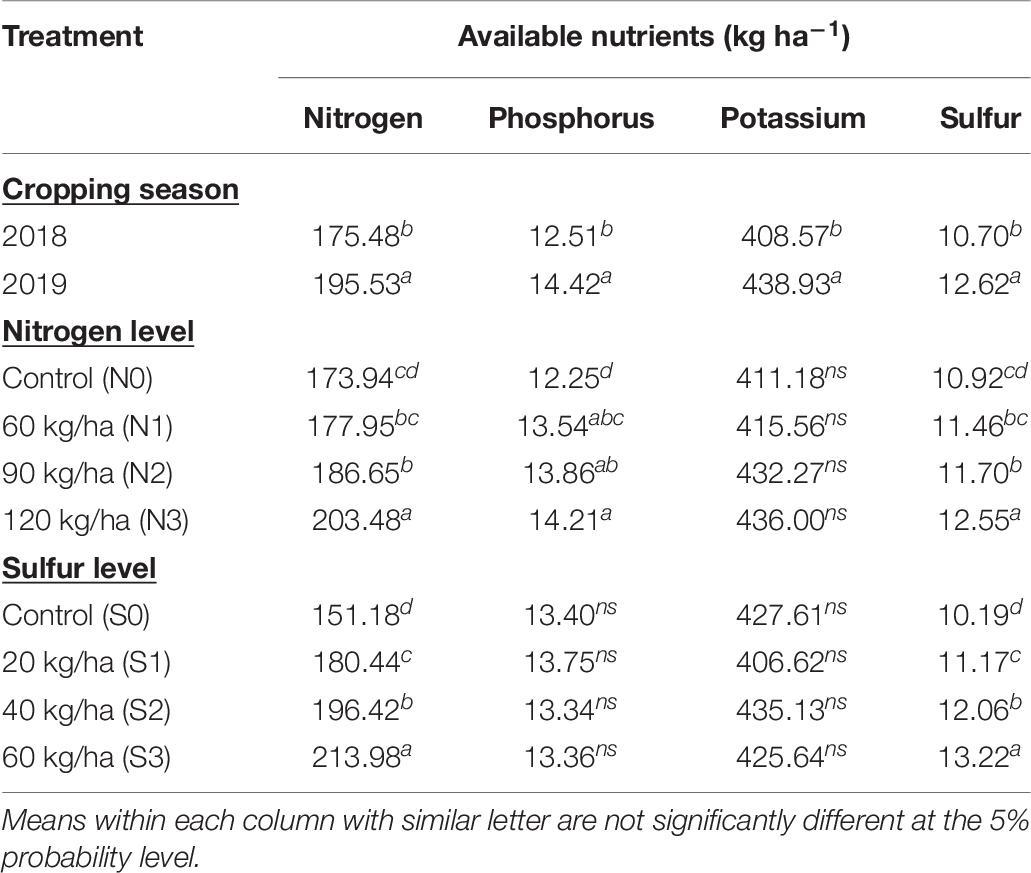
Table 7. Effect of year and fertilization levels on soil available nutrients.
The effect of nutrient application on nutrient use efficiency (NUE) traits was found to be significant; except for agro physiological efficiency (APE) in case of S levels (Figure 8). Agronomic efficiency (AE) of nutrients reduced with higher N and S doses. Among N levels, significantly higher AE (28.70 kg kg–1) and APE (8.95 kg kg–1) was found with N at 60 kg ha–1 than other doses. Apparent recovery efficiency (ARE) values for N levels varied from 328.05 to 383.31%, and was found significantly higher in N at 90 kg ha–1 which further decreases with increase in N level. Among S levels, significantly higher AE (87.76 kg kg–1) and ARE (571.71%) was recorded at 20 kg ha–1 S than other doses.
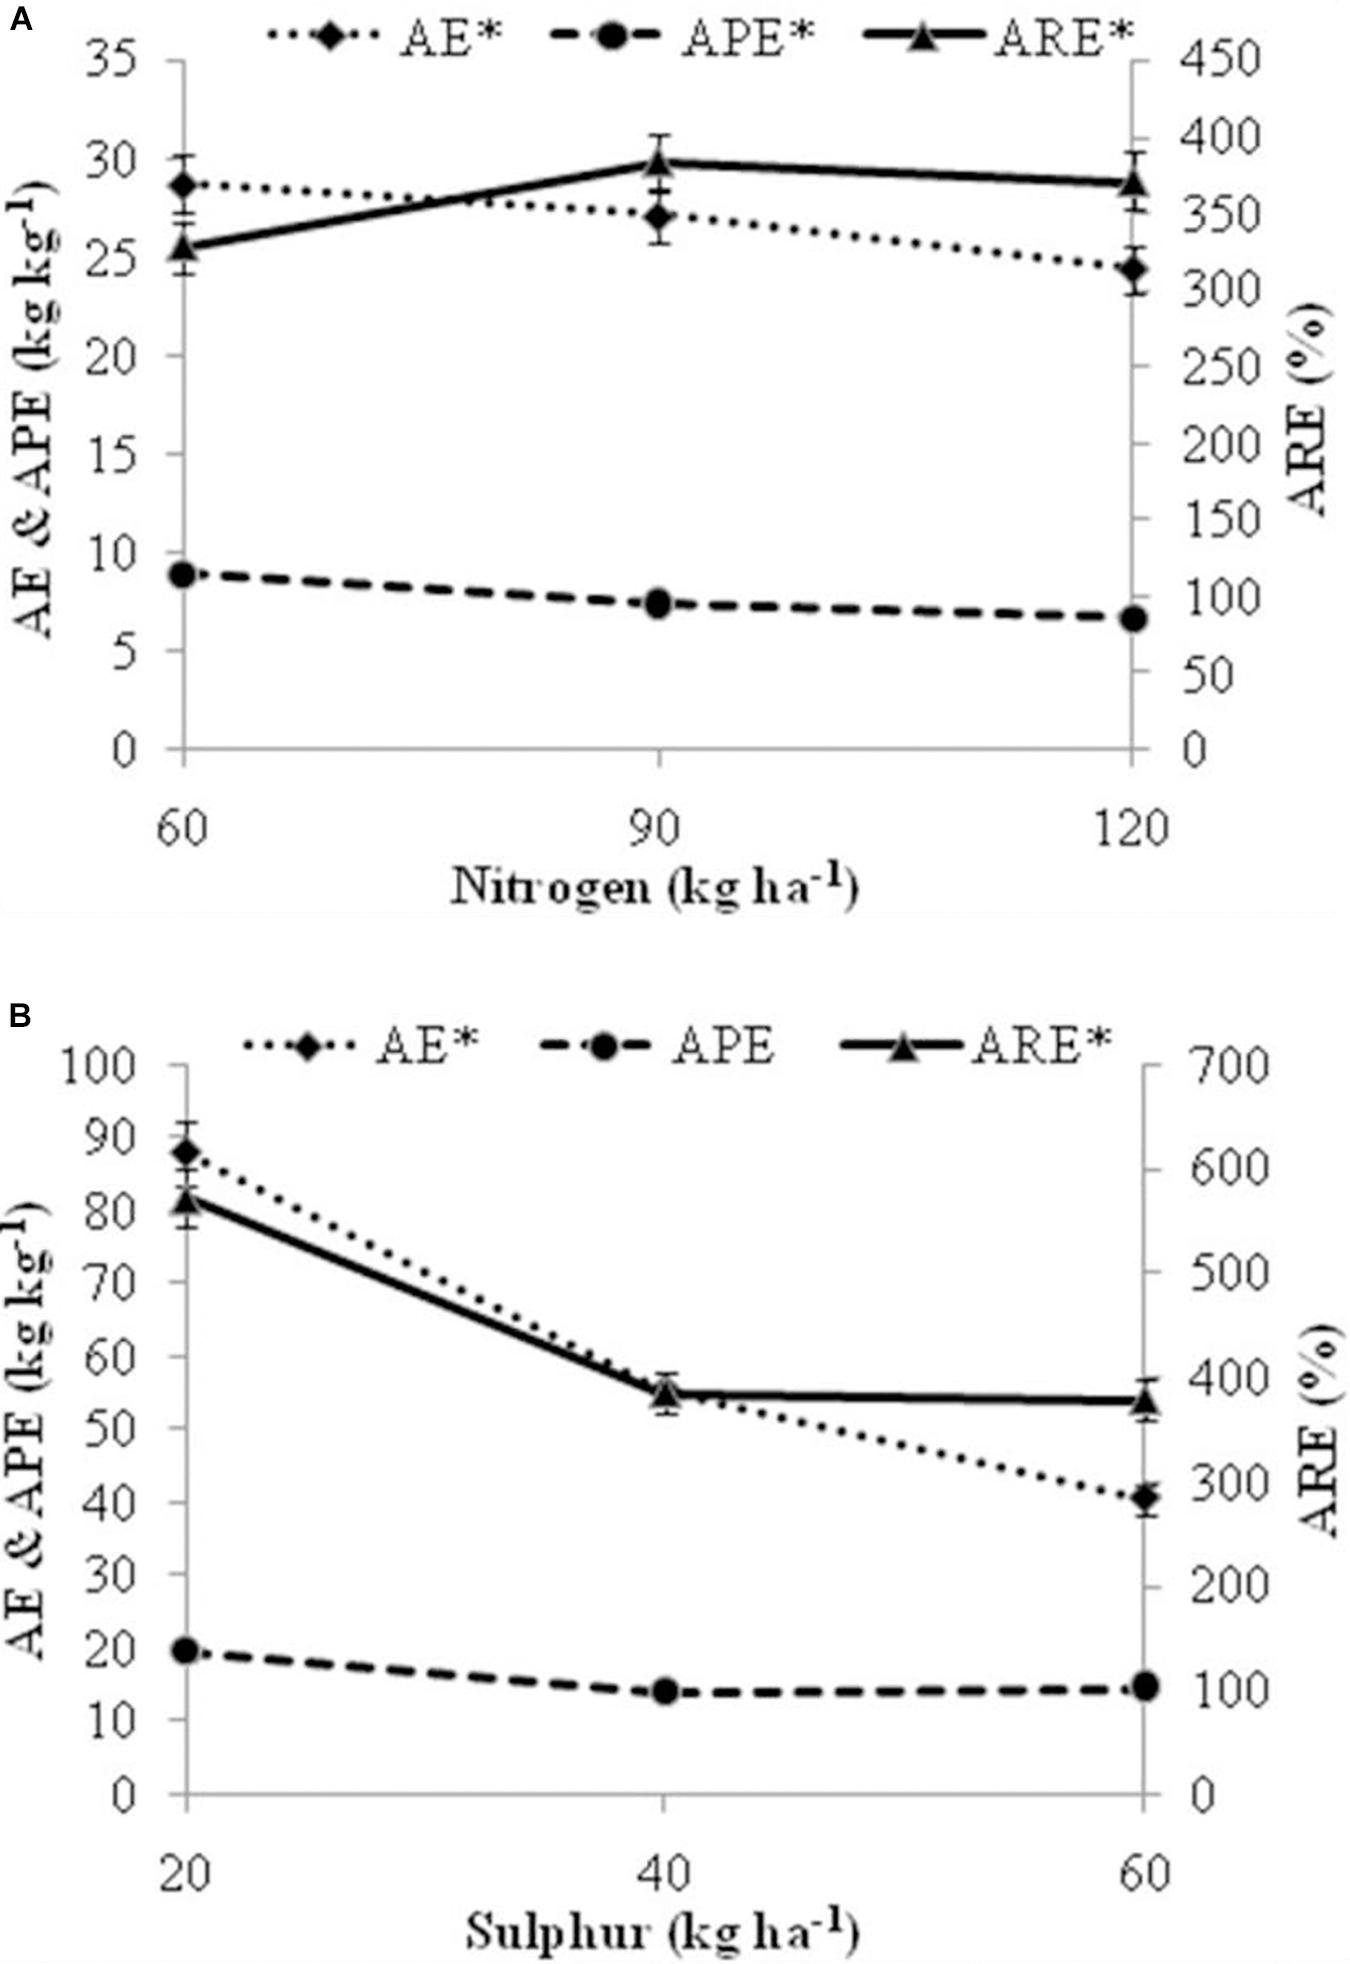
Figure 8. Effect of fertilization levels (A) levels of nitrogen (B) levels of sulfur on nutrient efficiency traits viz. AE, Agronomic efficiency; APE, Agro physiological efficiency; ARE, Apparent recovery efficiency. The mean values of 2 years pooled data are presented. Asterisk (*) on nutrient efficiency traits indicates significant differences among fertilizer levels at P = 0.05. Vertical bars indicate a mean standard error (±).
Discussion
Growth and Yield Parameters
Growth parameters were higher in first year during all the observations (Table 2), due to favorable environmental conditions like temperature and humidity for plant growth during 2018. In this study, relative humidity was recorded higher in first cropping year (Figure 1), which might have reduced stomata function and subsequently reduces the growth attributes. These results are in line with Mortensen and Fjeld (1995). Irrespective of significantly higher growth parameters in first cropping year, yield parameters were significantly higher in second cropping year during harvest (Table 3). This is because in our study rainfall was higher throughout the first cropping year, i.e., from mid of July to September as compared to second cropping season (Figure 1), which might have deteriorated the plants in excessive water and lead to reduced biomass and oil yield.
Among the nutrient applications, N and S at higher dose recorded significantly higher growth and yield parameters (Tables 2, 3). The promotional influence of N on growth parameters is due to enhanced growth of meristematic cells leading to development of shoots besides plant height. Omidbaigi et al. (2008) and Singhal and Sharma (2010) observed positive effect of N fertilization on vegetative parameters of wild marigold, reporting higher and heavier plants in N treated plots as compared to control. In our results higher doses of N and S recorded higher yield. This is because in our results higher growth parameters were recorded in higher dose of N which has lead to higher vegetative growth, which resulted in increased herbage production and EO content, consequently, EO yield increased to greater extent. These results were in line with Chrysargyris et al. (2016) in lavender (Lavandula angustifolia Mill.). Due to better availability of S at higher doses, enhance activities of different enzyme occur which lead to synthesis of more protein, increasing growth parameters. Kumar et al. (2010) while working on M. arvensis recorded higher plants with more branches and leaf area index due to higher S application. Increase in S doses had major impact on biomass and oil yield of sweet basil O. basilicum with highest yield beyond 80 kg ha–1 S in Oliveira et al. (2014).
Essential oil content was significantly higher in second cropping season (Table 3). This is because of slight drop in temperature during second year during reproductive phase which controls the synthesis of EO, as environment plays a major role in it. At flowering stage low temperature during night reduces the EO synthesis (Najem et al., 2011). N at 120 kg ha–1 recorded higher EO content; these results can be because the application of N is directly involved in the vegetative growth of plant which results in increasing the proportion of leafy parts in the herb which will lead to more leaf to stem ratio as compared to control plants. Since in Tagetes EO is mostly present in leaves and flowers, so plants with N application and more leaf+flower to stem ratio will have increased EO content as compared to control plants. These results were in line with Kucukyumuk et al. (2015) in lavandin (Lavandula intermedia L.). Application of higher dose of S recorded higher EO content because S has major function in synthesis of proteins which further led enhanced EO content (Oliveira et al., 2014).
Stomatal and Leaf Oil Glands Characteristics
Stomatal density was significantly higher in control while stomatal length was higher in plots with nutrient application (Table 4). It occurred because higher N and S lead to higher growth with bigger cells, which lead to increase in size of stomata. On the same view range, SEM brought about lower stomatal density and lower stomatal length using higher dosage of nutrient than the control. Numbers of oil glands were higher in S treated plots than control, while N did not show any significant effect (Table 4). This is because S application increases oil and protein contents in plant by higher availability of other nutrients as P, K, Zn which has major role in the growth of reproductive organs and regulation of oil glands (Malhi et al., 2007).
Essential Oil Composition
Our results showed that Z-β-ocimene, dihydrotagetone, tagetone, and ocimenone were the major chemical components in T. minuta EO similar to the previous researcher’s studies (Pazcel et al., 2018; Rathore et al., 2018). In this experiment, percentage of major components of Tagetes, EO was altered by the fertilizer application but in terms of quality at 120 kg N ha–1 and 60 kg S ha–1 were best. The relative percentage of major compound Z-β-ocimene (35–50%) is important in determining the quality of T. minuta EO at the international market (Cornelius and Wycliffe, 2016). Significant differences were observed in EO composition of T. minuta with different N and S doses. Our results reported that major compound Z-β-ocimene increases with higher N dose and found maximum in N at 120 kg ha–1 (Table 6). N fertilization may have enhanced the EO biosynthesis process through its direct or indirect role in plant metabolism which resulted in more plant metabolites. Nutrients like N and S promote terpenoid emissions by promoting electron transport rate and leaf photosynthesis which provide ATP requirements and carbon substrate availability for isoprene synthesis. All carbon-based secondary metabolites ultimately depend on CO2 fixation and, as a result, a relationship between nutrients and stored terpenoids (Ormeno and Fernandez, 2012). According to carbon nutrient balance hypothesis (CNBH) carbon and nutrient availability in the plant environment determines the production of metabolites. Limited nutrient resources curtailed plant growth, rather than photosynthesis, resulting in an excess of carbohydrates. Under such conditions, the CNBH asserts that the excess of carbohydrates is not used for growth but provides, instead, an additional substrate to synthesize defense secondary metabolites (Bryant et al., 1983). However, as per growth differentiation balance hypothesis (GDBH) under soils rich in nutrient resources, growth (biomass production), will be favored over differentiation (cell maturation and production of defensive compounds). As nitrogen becomes scarcer, differentiation will predominate, and consequently terpenoid accumulation will increase at the expense of growth, since the plant allocates proportionately more of an abundant resource, such as carbon, to the acquisition of the scarce resource or secondary metabolites, resulting in more terpenoid synthesis (Lorio, 1986). Similar to our results major constituent dihydrotagetone decreases with higher N dose above 50 kg ha–1, with increase in limonene, (Z)-tagetone and (Z)-tagetenone (Singh et al., 2008). Omidbaigi et al. (2008) observed that EO from 100 kg N ha–1 contained highest amount of dihydrotagetone (57.1%). Significantly higher percentage of Z-β-ocimene was reported with 60 kg S ha–1 (Table 6). S application increases oil and protein contents in plant with higher growth of reproductive organs and regulation of oil glands which may have led to variation among EO components. The major chemical components of EO of O. basilicum changed as the S increased, the concentration of linalool and eugenol increased in comparison with the control (Oliveira et al., 2014). Kumar et al. (2010) while studying M. arvensis reported 70% higher menthol in NPK+Zn+S than NPK+Zn, showing direct influence of S on major component.
Plant Nutrient Concentration, Available Nutrients in Soil and Nutrient Use Efficiency Traits
The concentration of nutrients in plant parts steadily increases with rise in N and S doses (Figure 7). Better supply of N and S facilitates root growth by synthesis of auxin and cytokinin (Krouk et al., 2010), leading to elimination of huge nutrients from small and deep area of soil. Higher biomass yield with moderate concentration of nutrients in plant parts can also be the source of higher absorption of nutrients under rising N and S dosage. Application of N recorded statistical results on available N, P, and S in soil (Table 7). The higher the value for soil N supply the more likely it is that the microorganisms in a soil will convert more organic N into mineral N for plant uptake. N decomposition, provide acidic compounds, with more available nutrients in the soil (Rakshit et al., 2015). These results were in line with Kamble and Kathmale (2015) in onion. Similarly, in our results S application recorded significant effect on available N and S, while no effect was seen on available P and K (Table 7). This is because deficiency in S decreases the N efficiency; and higher S dose will increase the use efficiency of nitrogenous fertilizer, increasing availability of N and S in soil. Fazili et al. (2008) and Baligar et al. (2001) also reported higher nutrient availability in soil due to application of N and S fertilizers in oilseed crops similar to our results. The NUE traits decline with raising nutrient levels (Figure 8). A declining pattern in AE was observed with raising N from 30 to 120 kg ha–1 (Arduini et al., 2006) and 120 to 360 kg ha–1 (Belete et al., 2018). Zemichael et al. (2017) also reported decreasing trend in NUE traits with increasing doses of nutrients, explaining better performance with idea of supplying N at maximum absorption period resulting in higher biomass production while, supplying N at higher doses at planting time results in reduced uptake of N and S loses of nutrient with reduced efficiency.
Conclusion
The results reveal that N and S application alter the biomass yield and essential oil yield, and secondary metabolite profile of T. minuta under western Himalayas. Over highest N and S fertilizer application rate (i.e., 120 kg N ha–1 and 60 kg S ha–1) total biomass yield was 14.48 and 6.74% higher than that under no fertilizer application (N0 and S0), respectively. Essential oil gland density showed marked improvement with the application of S upto 40 kg ha–1. On the other hand, application of 120 kg N ha–1 and 40 kg S ha–1 registered about 50.08 and 18.27% higher essential oil yield, respectively, compared with control. These application increases the availability and uptake of nutrients with low NUE traits over those achieved under control in the present study. Substantial variations in major compounds (Z-β-ocimene and dihydrotagetone) of essential oil were also observed in this experiment. Thus, it can be concluded that higher N (120 kg ha–1) and intermediate S (40 kg ha–1) may be adopted to enhance the biomass and essential oil yield of T. minuta with desired quality. However, further studies are required to understand the unknown pathways of these nutrients in aromatic crops in enhancing physiological (oil gland characteristics), yield and quality characteristics.
Data Availability Statement
The original contributions presented in the study are included in the article/supplementary material, further inquiries can be directed to the corresponding author.
Author Contributions
SW: experiment execution, data collection, data processing, oil analysis, identification of compounds, soil analysis, statistical analysis, and literature search and manuscript writing. RK: develop the idea, designing the experiment, overall supervision of the experiment, data processing, and manuscript editing. Both authors contributed to the article and approved the submitted version.
Funding
This work was supported by the Council of Scientific and Industrial Research, New Delhi under CSIR-Aroma Mission (HCP 0007).
Conflict of Interest
The authors declare that the research was conducted in the absence of any commercial or financial relationships that could be construed as a potential conflict of interest.
Acknowledgments
The authors are grateful to the Director, CSIR-IHBT, Palampur, for necessary facilities during the course of study. The authors also thank Mr. Kuldip Singh, Senior Technician, Mr. Ramdeen Prasad, Mr. Shiv Kumar, and Ms. Avnesh Kumari, Senior Technical Officers for providing technical support during the work (in field and lab study).
References
Anonymous (2019). Crop Weather Outlook. All India Coordinated Research Project on Agrometeorology (AICRPAM). Available online at: http://www.cropweatheroutlook.in/ (accessed November 24, 2019).
Arduini, I., Masoni, A., Ercoli, L., and Mariotti, M. (2006). Grain yield, and dry matter and nitrogen accumulation and remobilization in durum wheat as affected by variety and seeding rate. Eur. J. Agron. 25, 309–318. doi: 10.1016/j.eja.2006.06.009
Aziz, E. E., El-Danasoury, M. M., and Craker, L. E. (2010). Impact of sulfur and ammonium sulfate on dragonhead plants grown in newly reclaimed soil. J. Herbs Spices Med. Plants 16, 126–135. doi: 10.1080/10496475.2010.508973
Baligar, V. C., Fageria, N. K., and He, Z. L. (2001). Nutrient use efficiency in plants. Commun. Soil Sci. Plant Anal. 32, 921–950. doi: 10.1081/CSS-100104098
Belete, F., Dechassa, N., Molla, A., and Tana, T. (2018). Effect of nitrogen fertilizer rates on grain yield and nitrogen uptake and use efficiency of bread wheat (Triticum aestivum L.) varieties on the Vertisols of central highlands of Ethiopia. Agric. Food Secur. 7:78. doi: 10.1186/s40066-018-0231-z
Bryant, J. P., Chapin, F. S., and Klein, D. R. (1983). Carbon nutrient balance of boreal plants in relation to vertebrate herbivory. Oikos 40, 357–368. doi: 10.2307/3544308
Chand, S., Kumari, R., and Patra, D. D. (2015). Effect of nickel and vermicompost on growth, yield, accumulation of heavy metals and essential oil quality of Tagetes minuta. J. Essent. Oil Bear. Plants 18, 767–774. doi: 10.1080/0972060X.2015.1029992
Chrysargyris, A., Panayiotou, C., and Tzortzakis, N. (2016). Nitrogen and phosphorus levels affected plant growth, essential oil composition and antioxidant status of lavender plant (Lavandula angustifolia Mill.). Ind. Crops Prod. 83, 577–586. doi: 10.1016/j.indcrop.2015.12.067
Cornelius, W. W., and Wycliffe, W. (2016). “Tagetes (Tagetes minuta) oils,” in Essential Oils in Food Preservation, Flavor and Safety, ed. V. R. Preedy (Cambridge, MA: Academic Press), 791–802. doi: 10.1016/b978-0-12-416641-7.00090-0
Etienne, P., Sorin, E., Maillard, A., Gallardo, K., Arkoun, M., Guerrand, J., et al. (2018). Assessment of sulfur deficiency under field conditions by single measurements of sulfur, chloride and phosphorus in mature leaves. Plants 7:37. doi: 10.3390/plants7020037
Fageria, N. K., Baligar, V. C., and Jones, C. A. (2011). Growth and Mineral Nutrition of Feld Crops, 3rd Edn. Boca Raton, FL: Taylor, Francis group, 530.
Fazili, I. S., Jamal, A., Ahmad, S., Masoodi, M., Khan, J. S., and Abdin, M. Z. (2008). Interactive effect of sulphur and nitrogen on nitrogen accumulation and harvest in oilseed crops differing in nitrogen assimilation potential. J. Plant Nutri. 31, 1203–1220. doi: 10.1080/01904160802134905
Kamble, B. M., and Kathmale, D. K. (2015). Effect of different levels of customized fertilizer on soil nutrient availability, yield and economics of onion. J. Appl. Nat. Sci. 7, 817–821. doi: 10.31018/jans.v7i2.688
Krouk, G., Lacombe, B., Bielach, A., Perrine-Walker, F., Malinska, K., Mounier, E., et al. (2010). Nitrate-regulated auxin transport by NRT1.1 defines a mechanism for nutrient sensing in plants. Dev. Cell 18, 927–937. doi: 10.1016/j.devcel.2010.05.008
Kucukyumuk, Z., Erbas, S., Erdal, I., Baydar, H., and Eraslan, F. (2015). Effect of different nitrogen doses on plant growth, quality characteristics and nutrient concentrations of lavandin (Lavandula × intermedia Emeric ex Loisel. var. Super A). J. Essent. Oil Bear. Plants 18, 36–43. doi: 10.1080/0972060X.2014.960279
Kumar, A., Patro, H. K., and Kewalanand. (2010). Effect of Zinc and Sulphur on herb, oil yield and quality of Menthol mint (Mentha arvensis L.) var. Kosi. J. Chem. Pharm. Res. 2, 642–648.
Lorio, P. L. (1986). Growth-differentiation balance – a basis for understanding Southern pine-beetle tree interactions. For. Ecol. Manag. 14, 259–273. doi: 10.1016/0378-1127(86)90172-6
Malhi, S., Gan, Y., and Raney, J. (2007). Yield, seed quality, and sulfur uptake of oilseed crops in response to sulfur fertilization. Agron. J. 99, 570–577. doi: 10.2134/agronj2006.0269
Mortensen, L. M., and Fjeld, T. (1995). High air humidity reduces the keeping quality of cut roses. Acta Hortic. 405, 148–155. doi: 10.17660/actahortic.1995.405.18
Najem, W., Beyrouthy, M. E., Wakim, L. H., Neema, C., and Ouaini, N. (2011). Essential oil composition of Rosa damascena Mill. From different localities in Lebanon. Acta Bot. Gall. 158, 365–373. doi: 10.1080/12538078.2011.10516279
Negahban, M., Aboutalebi, A., and Zakerin, A. (2014). The effect of phosphorus on the growth and productivity of Mexican marigold (Tagetes minuta L.). Russ. J. Biol. Res. 2, 93–99. doi: 10.13187/ejbr.2014.2.93
Oliveira, M., Moura, G. M., Zardetto, G., Cardoso, B. K., Alves, A. A. R., Tsukui, A., et al. (2014). Effect of sulphur on yield and chemical composition of essential oil of Ocimum basilicum L. Afr. J. Agric. Res. 9, 688–694. doi: 10.5897/ajar2013.7973
Omidbaigi, R., Dadman, B., and Fattahi, F. (2008). Influence of nitrogen fertilizer on the herb yield, essential oil content and composition of Tagetes minuta L. J. Essent. Oil Bear. Plants 11, 45–52. doi: 10.1080/0972060X.2008.10643596
Ormeno, E., and Fernandez, C. (2012). Effect of soil nutrient on production and diversity of volatile terpenoids from plants. Curr. Bioact. Compd. 8, 71–79. doi: 10.2174/157340712799828188
Pazcel, E. M. M., Wannaz, E. D., Pignata, M. L., and Salazar, M. J. (2018). Tagetes minuta L. Variability in terms of lead phytoextraction from polluted soils: is historical exposure a determining factor? Environ. Process. 5, 243–259. doi: 10.1007/s40710-018-0293-8
Prakasa Rao, E. V. S., Puttanna, K., and Ramesh, S. (2000). Effect of nitrogen and harvest stage on the yield and oil quality of Tagetes minuta L. In tropical India. J. Herbs Spices Med. Plants 7, 19–24. doi: 10.1300/j044v07n03_03
Rakshit, R., Patra, A. K., Purakayastha, T. J., Singh, R. D., Pathak, H., and Dhar, S. (2015). Effect of super-optimal dose of NPK fertilizers on nutrient harvest index, uptake and soil fertility levels in wheat crop under a maize (Zea mays)-wheat (Triticum aestivum) cropping system. Int. J. Biores. Stress Manag. 6, 015–023. doi: 10.5958/0976-4038.2015.00001.9
Rathore, S., Walia, S., and Kumar, R. (2018). Biomass and essential oil of Tagetes minuta influenced by pinching and harvesting stage under high precipitation conditions in the western Himalayas. J. Essent. Oil Res. 30, 360–368. doi: 10.1080/10412905.2018.1486744
Riley, N. G., Zhao, F. J., and McGrath, S. P. (2002). Leaching losses of sulphur from different forms of sulfphur fertilizers: a field lysimeter study. Soil Use Manag. 18, 120–126. doi: 10.1111/j.1475-2743.2002.tb00229.x
Singh, M., and Rao, G. (2005). Effects of nitrogen, potassium and soil moisture regime on growth, herbage, oil yield and nutrient uptake of South American marigold (Tagetes minuta L.) in a semi-arid tropical climate. J. Hortic. Sci. Biotechnol. 80, 488–492. doi: 10.1080/14620316.2005.11511965
Singh, M., Tripathi, R. S., Singh, S., and Yaseen, M. (2008). Influence of row spacing and nitrogen levels on herb, essential oil production and oil quality of Tagetes minuta L. J. Spices Aromat. Crops 17, 251–254.
Singh, V., Singh, B., and Kaul, V. K. (2003). Domestication of wild marigold (Tagetes minuta L.) as a potential economic crop in western Himalaya and north Indian plains. Econ. Bot. 57, 535–544. doi: 10.1663/0013-00012003057
Singhal, V., and Sharma, P. (2010). Development of agro techniques in wild marigold. Progres. Hortic. 42, 165–168.
Srinivasarao, C., Wani, S. P., Sahrawat, K. L., Rego, T. J., and Pardhasarandhi, G. (2008). Zinc, boron, and sulfur deficiencies are holding back the potential of rainfed crops in semi-arid India: experiences from participatory watershed management. Int. J. Plant Prod. 2, 89–99.
Sunitha, H. M., and Hunje, R. (2010). Effect of plant population and integrated nutrient management on growth, seed yield and quality of African marigold (Tagetes erecta L.) Karnataka. J. Agric. Sci. 23, 783–786.
Walia, S., and Kumar, R. (2020). Wild marigold (Tagetes minuta L.) an important industrial aromatic crop: liquid gold from the Himalaya. J. Essent. Oil Res. 32, 373–393. doi: 10.1080/10412905.2020.1813211
Walia, S., Mukhia, S., Bhatt, V., Kumar, R., and Kumar, R. (2020). Variability in chemical composition and antimicrobial activity of Tagetes minuta L. Essential oil collected from different locations of Himalaya. Ind. Crops Prod. 150:112449. doi: 10.1016/j.indcrop.2020.112449
Yaduvanshi, N. P. S., Chaudhari, S. K., Lal, K., Bundela, D. S., Dey, P., and Singh, G. (2009). Methods of Soil, Plant and Climate Analysis. Karnal: Central Salinity Research Institute, 110.
Keywords: wild marigold, yield, nitrogen, sulfur, oil glands, quality, Z-β-ocimene, NUE
Citation: Walia S and Kumar R (2021) Nitrogen and Sulfur Fertilization Modulates the Yield, Essential Oil and Quality Traits of Wild Marigold (Tagetes minuta L.) in the Western Himalaya. Front. Plant Sci. 11:631154. doi: 10.3389/fpls.2020.631154
Received: 19 November 2020; Accepted: 30 December 2020;
Published: 18 January 2021.
Edited by:
Carla S. Santos, Catholic University of Portugal, PortugalReviewed by:
Anju Patel, National Botanical Research Institute (CSIR), IndiaJose Ferreira Lustosa Filho, Federal University of Viçosa, Brazil
Copyright © 2021 Walia and Kumar. This is an open-access article distributed under the terms of the Creative Commons Attribution License (CC BY). The use, distribution or reproduction in other forums is permitted, provided the original author(s) and the copyright owner(s) are credited and that the original publication in this journal is cited, in accordance with accepted academic practice. No use, distribution or reproduction is permitted which does not comply with these terms.
*Correspondence: Rakesh Kumar, rakeshkumar@ihbt.res.in