Article

Renewable Energy Powered Membrane Technology: Electrical Energy Storage Options for a Photovoltaic-Powered Brackish Water Desalination System

by
Sheying Li
1,
Ana P. S. G. de Carvalho
1,
Andrea I. Schäfer
2 and
Bryce S. Richards
1,*
1
Institute of Microstructure Technology (IMT), Karlsruhe Institute of Technology, Hermann-von-Helmholtz-Platz 1, 76344 Eggenstein-Leopoldshafen, Germany
2
Institute for Advanced Membrane Technology (IAMT), Karlsruhe Institute of Technology (KIT), Hermann-von-Helmholtz-Platz 1, 76344 Eggenstein-Leopoldshafen, Germany
*
Author to whom correspondence should be addressed.
Appl. Sci. 2021, 11(2), 856; https://doi.org/10.3390/app11020856
Submission received: 4 November 2020 / Revised: 10 January 2021 / Accepted: 12 January 2021 / Published: 18 January 2021
(This article belongs to the Special Issue Water Desalination Powered by Renewable Energy)

Abstract

:
The potential for lithium-ion (Li-ion) batteries and supercapacitors (SCs) to overcome long-term (one day) and short-term (a few minutes) solar irradiance fluctuations with high-temporal-resolution (one s) on a photovoltaic-powered reverse osmosis membrane (PV-membrane) system was investigated. Experiments were conducted using synthetic brackish water (5-g/L sodium chloride) with varied battery capacities (100, 70, 50, 40, 30 and 20 Ah) to evaluate the effect of decreasing the energy storage capacities. A comparison was made between SCs and batteries to determine system performance on a “partly cloudyday”. With fully charged batteries, clean drinking water was produced at an average specific energy consumption (SEC) of 4 kWh/m3. The daily water production improved from 663 L to 767 L (16% increase) and average electrical conductivity decreased from 310 µS/cm to 274 μS/cm (12% improvement), compared to the battery-less system. Enhanced water production occurred when the initial battery capacity was >50 Ah. On a “sunny” and “very cloudy” day with fully charged batteries, water production increased by 15% and 80%, while water quality improved by 18% and 21%, respectively. The SCs enabled a 9% increase in water production and 13% improvement in the average SEC on the “partly cloudy day” when compared to the reference system performance (without SCs).

1. Introduction

1.1. Water Scarcity

The provision of potable water via brackish water desalination powered by solar energy is an attractive option for coping with the scarcity of natural freshwater resources in many regions worldwide. The International Energy Agency has reported that around 45% of the population of Sub-Saharan Africa lives without access to electricity, with this figure dropping to 26% in rural areas [1]. It is estimated by the United Nations that over 330 million people in Sub-Saharan Africa are still relying on unimproved drinking water sources (unprotected wells, springs and surface water) [2]. A direct correlation exists between the availability of electricity and drinking water, with the effect of energy poverty indicating that the population living with electricity is also very likely to have access to an improved water source (and vice versa) [3]. Thus, opportunities for decentralized technologies exist for the applications where little water and energy infrastructure exists and the population density is sparse.
When examining desalination technologies, nanofiltration/reverse osmosis (NF/RO) membranes have gained the highest level of acceptance due to a modular design, easy scaling of capacity and their low specific energy consumption (SEC). While several emerging desalination technologies—such as membrane distillation (MD), forward osmosis (FO), pervaporation and capacitive deionization (CDI)—are being developed, only bench-scale systems have been demonstrated [4]. MD technology is a thermal-driven process that operates at atmospheric pressure and high salt rejection for seawater desalination, yet it exhibits high energy consumption and low water production [5]. FO appears to be promising for desalinating extremely saline water—containing a total dissolved solids (TDS) of >100,000 mg/L—that cannot be treated with RO [5]. Pervaporation can cope with a wide range of saline water with high rejection (>99.99%), but the choices of membrane material and low flux remain as obstacles in its development [5]. CDI is an electrochemical desalination technology based on the electrosorption of ions by porous electrodes. Several challenges exist for the identification of optimum material for manufacturing electrodes [5]. Other electrically driven separation desalination processes—such as electrodeionization (EDI) and electrodialysis (ED)—transport charged ions in a solution by utilizing an electric field. EDI is an energy-efficient option for brackish water desalination. Whilst ED exhibits significant promise and is well-suited for treating lower salinity feedwater (<1700 µS/cm) [6], it remains much less developed than NF/RO membrane technology.
Many remote regions of developing countries that possess a significant solar energy resource are also located far away from the coast, thus suggesting that the most energy-efficient treatment option would be the desalination of brackish groundwater. For such applications, pilot-scale NF/RO membrane technology has been widely used as an energy-efficient and robust option for the provision of clean drinking water [7,8]. In order to make the desalination technology more sustainable, renewable energy sources are increasingly deployed for providing the energy requirements. When renewable energy-powered membrane (RE-membrane) systems are deployed in remote areas that lack an electricity grid, such decentralized technologies can provide an ideal solution. In particular, photovoltaic (PV) energy has become an affordable source of clean electricity due to steady price declines over the last decade [7] and is currently (2020 data) one of the cheapest sources of electricity [9]. When examining energy efficiency and cost estimations, many of the emerging technologies are based on bench-scale systems. In addition, the majority of these technologies are typified by having a high energy consumption. Recent investigations at the Plataforma Solar de Almeria indicated that vacuum-assisted air gap MD technology could reduce the SEC [10,11]. The pilot MD system for seawater desalination – which exhibited an electrical conductivity (ED) of 37–40 mS/cm – exhibited a thermal SEC of 208 kWh/m3 and an electrical SEC of 5–20 kWh/m3 [10]. However, the water cost was hardly comparable due to the large data variations and different applications from the literature [11]. Unfortunately, no reliable energy and cost data on a solar-powered FO desalination system can be found. The electrical SEC of pervaporation technology indicated a value < 0.3 kWh/m3, but a considerable thermal energy was required for heating and maintaining the feed stream [12]. Various models suggested have shown that CDI could operate with a SEC of less than 1 kWh/m3 for low-salinity brackish water but remains less energy-efficient than RO [13,14,15]. In a pilot 1-kW photovoltaic (PV)-powered membrane CDI system for treating 6700-µS/cm brackish water, the system exhibited a low SEC (the sum of battery, pump and power supply associated with an electrode) in the range of 0.7–1.1 kWh/m3 for producing 5-m3/d potable water [16]. For other electrochemical systems, an EDI system performed with an SEC in the range of 0.3~0.7 kWh/m3 when treating water with a TDS of 5 g/L [17]. However, these SEC values were not consistent, as many values stem from bench-scale systems operating with a low-feed salinity and salt removal. Comparatively, in a field demonstration of a solar-powered ED reversal system in rural India for treating ground water (salinity of 2100–2500 µS/cm), the solar system produced 6 m3/d, with a SEC of 1.7 kWh/m3 and an estimated levelized cost of water of US$ 1.9/m3 [18]. A RO system typically exhibited a SEC in the range of 0.6–4 kWh/m3 for desalinating brackish groundwater (depending on the salinity of the water and the size of the system) at a low water cost of US$ 0.2–0.4/m3 [19]. Hence, PV-powered membrane filtration (PV-membrane) systems appear attractive for small-scale (~1 m3/d), distributed and robust systems where no electricity is present [20], and it is envisaged that these can potentially help break the paradigm of the water–energy nexus [3].

1.2. Directly Coupled PV-Membrane System

The concept of directly coupled PV-membrane systems—where no energy storage components are included—is to capitalize on the ability of the system to easily, efficiently and cost-effectively store clean drinking water that was created during hours of sunshine, instead of storing electricity. Several reports have demonstrated the successful operation of directly coupled renewable energy-powered membrane (RE-membrane) systems, the challenge of which is naturally dealing with the intermittency and fluctuations inherent to the wind and solar energy resource [20,21,22,23,24,25,26,27,28,29,30]. In the group of Murdoch University, Mathew et al. designed a PV-membrane system for brackish water desalination based on a piston pump with 120-W PV power that was capable of producing 400 L/d of potable water with a recovery of either 16% or 25% [24,25,27]. The group of Infield et al. designed a directly coupled RO desalination system that could be powered by wind or PV energy [26,28,29]. Thomson and Infield reported the PV-membrane system for seawater desalination, which produced ~1.5 m3/day of permeate at a SEC of 4 kWh/m3 [26]. Bilton et al. designed a battery-less PV-membrane desalination plant, which enabled a clean water production of 300 L on a sunny summer day with an overall SEC in the range of 2.5–4 kWh/m3 [31]. In a final example, Ruiz-García and Nuez [32] investigated the long-term performance of a RO desalination plant operating under intermittent conditions for 14 years (around nine h/d) when treating brackish groundwater with conductivity in the range of 7–9.6 mS/cm. The results indicated a specific energy consumption (SEC) in the range of 1.8–2.2 kWh/m3. Such directly coupled systems can potentially exhibit higher efficiency when no batteries or additional electrical devices are incorporated, leading to a higher output power due to less power loss. However, because such systems are subject to fluctuations and intermittency from the RE source, this can result in a lower permeate quality and productivity [25,26,33]. A further economic issue is the underutilization of the equipment—due to operating only during the day—that ultimately affects the cost of water.

1.3. Energy Storage Options for Small-Scale PV Systems

Short-term energy buffering has been introduced to PV-membrane systems via the addition of supercapacitors (SCs) with a suitable charge controller. SCs have proven to be good candidates for short-term energy buffering [33,34,35,36], with the technology being chosen due to its ability to endure hundreds of thousands of charge/discharge cycles, as well as being able to provide a large amount of instantaneous power. For example, Soric et al. developed a regulator with the use of relays and a 250-F supercapacitor (maximum voltage of 32 V) to stabilize the solar power supply to the pump in a PV-membrane desalination system [36]. The system exhibited a SEC of 2.9–4.3 kWh/m3 when treating brackish water, synthesized using 8–22 g/L of sodium chloride (NaCl). Further advantages of SCs are the high efficiency (85–98%) of energy storage [37] and the relatively long lifetime (8–12 years) [38,39], significantly longer than classical lead–acid (LA) batteries. However, the disadvantage of SCs are, firstly, the high self-discharging rate, which was calculated to be 1.5% per day in a previous work [40]. This is significantly higher than that encountered with either LA or lithium-ion (Li-ion) batteries, which achieve 5% per month and 1% to 2% per month, respectively [37]. Secondly, the amount of electrical energy that can be stored in SCs is much more limited than that in batteries, typically only providing energy buffering for a period of minutes [34].
For long-term electrical energy storage, LA batteries remain the most common solution applied to PV systems due to their global availability and relatively low cost [37,41]. There are several studies of the successful operation of RE-membrane systems that incorporate LA batteries. A seawater desalination plant equipped with a 4.8-kWp PV array and 60 kWh of LA battery storage was installed on the island of Gran Canaria, Spain, being capable of providing 0.8–3 m3/d of drinking water [42]. The lower limit of the amount of energy stored in the batteries remained ~19 kWh. This corresponds to a depth of discharge (DoD) of 32%, a value that should be remained above in order to prevent damage and extend the lifetime of the batteries. The batteries enabled an improvement of water production by ~15% compared to the daily water production of 800 L without batteries being present. A small-scale PV-membrane pilot plant that was installed at a vocational training center in Northern Tanzania [43] was equipped with 2.25-kWp PV power and 2.2-kWh batteries (battery technology not stated), which allowed for two hours of an additional operation when no PV power was available. The system was operated successfully over a nine-month period, with a water production of 2.4 m3/d at a SEC of 4.4 kWh/m3 when treating feedwater with an electrical conductivity (EC) of 3000 µS/cm [43]. Another small-scale PV-membrane desalination system was designed with 2 kWp of PV power and 2.4-kWh LA batteries in Malaysia [44]. The system was capable of producing 5.1 m3 of clean water per day (10 h) at a SEC of 1.1 kWh/m3 while treating brackish water at a salinity of 2000 mg/L. Batteries were used to provide a stable current supply and store energy during cloudy weather. The total hours of autonomy via the addition of batteries during the daytime and nighttime operation modes (10 h of operation per day) were tested to be ~22 h and 24 h, respectively; however, the number of hours of autonomy afforded by the battery bank declined to 11 h after one year of operation during the daytime due to the high ambient temperature (exceeding 35 °C). The overall disadvantages of LA batteries are their low roundtrip efficiency of 75–84%, limited number of charging/discharging cycles (~2000) [45], reduced operational lifetime (three–five years) and DoD of higher than 50% [37].
Alternatively, Li-ion batteries—which are already commonplace in transportation applications due to their high energy density—are becoming increasingly popular in on-grid PV systems. This is primarily due to their increased number of charge/discharge cycles (4000) and long lifetimes (10 years) [46], whilst also exhibiting a higher efficiency (>90%) [46] and DoD > 80% [47] and reduced cost per kWh [48]. In 2015, Mueller et al. emphasized that Li-based batteries would play an increasingly important role and were more attractive than other energy storage technologies due to their ongoing innovation [49]. Moreover, with the reduced cost per kWh of the Li-ion batteries, they are considered to be promising energy storage units for fluctuating RE systems and will emerge as a very competitive technology for medium- and long-term PV applications [50]. Tan et al. [51] applied 2 kWh of Li-ion batteries as an energy storage solution for on-grid PV systems in the range of 10–30 kWp. The batteries allowed short-term (3–30 min) power leveling of schools and buildings that were equipped with PV generation systems. Li-ion batteries were also employed in a residential PV system, which was analyzed by simulations to gain insights into the sizing and grid integration issues [52]. The system was sized with 4 kWp of PV and a Li-ion battery bank with a capacity of 4 kWh (converted by battery capacity times voltage, Ah∙V∙10−3). The state-of-charge (SOC) of the battery was constrained to a 20–80% (of the nominal battery capacity) range and enabled an extra six hours of energy provision at night [52].

1.4. System Control with Energy Storage Options

Several control strategies have been implemented in the RE system that are equipped with energy storage units. SCs have been used in combination with batteries to extend the battery lifetime by buffering the peak current pulses and reducing the charge/discharge cycles in the battery. Glavin et al. [53] designed a hybrid SC–battery energy storage system for a PV system, where the SCs supplied the high peak power while the battery supplied the low power in terms of operating conditions. It was concluded that the addition of SCs increased the battery SOC by 12% under peak load, hence reducing the size of the battery and avoiding a deep discharge of the batteries. Bludszuweit et al. [54] proposed a hybrid battery and SCs for large-scale grid-connected wind turbine systems in order to smooth fluctuations. The LA batteries smoothed the power output for ~10 min, while the SCs absorbed the short transients in energy (1–10 s) that prevented the current peaks from reaching the battery. These applications highlight the feasibility of coupling SCs in parallel with batteries to RE systems to improve the performance with the inherent variability of the resource and the ability of SCs to reduce the size of the battery so that the cost can be reduced. Mehr et al. [55] proposed a current control scheme for Li-ion battery energy storage systems (energy storage capacity of 0.55 kWh) that was designed based on the SOC of the batteries for load leveling and peak shaving of the on-grid system. A bidirectional converter was designed to transfer power in both directions by including a current control loop. Provided the SOC is limited to the upper and lower thresholds, the simulated results indicated that the batteries absorbed 35-W power from the grid while injecting 200 W of power to the grid in a time period of 25 ms (corresponding to the energy capacity of 10−3 Wh). The energy transfer of the bidirectional alternating current (AC)/direct current (DC) converter was confirmed.

1.5. Research Needs

It has been demonstrated that off-grid PV-membrane systems can function from a varying RE source. The usage of SCs and LA batteries for storing energy has been elaborated in several studies, while the application of Li-ion batteries in off-grid PV systems—in particular, with the impacts on the SEC, water quality and quantity—needs further investigation due to its high energy intensity and large charging/discharging cycles. Furthermore, experiments comparing the performance of different energy storage options—SCs vs. Li-ion batteries vs. the reference (directly coupled) system without storage—need to be conducted. In this paper, the following research questions will be addressed:
(i)
How does the addition of up to one day’s worth of energy storage via Li-ion batteries affect water production and the SEC of a PV-membrane system operated under a variety of weather conditions (so-called “partly cloudy”, “sunny” and “very cloudy” days)?
(ii)
What are the effects of using different amounts of battery storage capacity (realized by limiting the initial SOC of the batteries) on the PV-membrane system?
(iii)
What are the impacts of different energy storage options on the PV-membrane system when compared with SCs and Li-ion batteries?
Previous research by the authors resulted in the design of a PV-membrane system coupled with SCs [40], which, in this work, was used to investigate the performance of such systems under real weather conditions. The system setup, including Li-ion batteries, was based on a modified version of the system described in Li et al. [40] by (i) reconfiguring the PV characteristics (PV maximum point voltage and current), (ii) adding a new charge controller to regulate the power from the PV to the Li-ion batteries and load (the pump and membrane system) and (iii) adding a DC/DC converter to boost the output voltage of the batteries to assure the operation of the pump. This setup was used to study the impacts of Li-ion batteries and then enable the comparison with SCs on the PV-membrane system performance under real solar days.

2. Materials and Methods

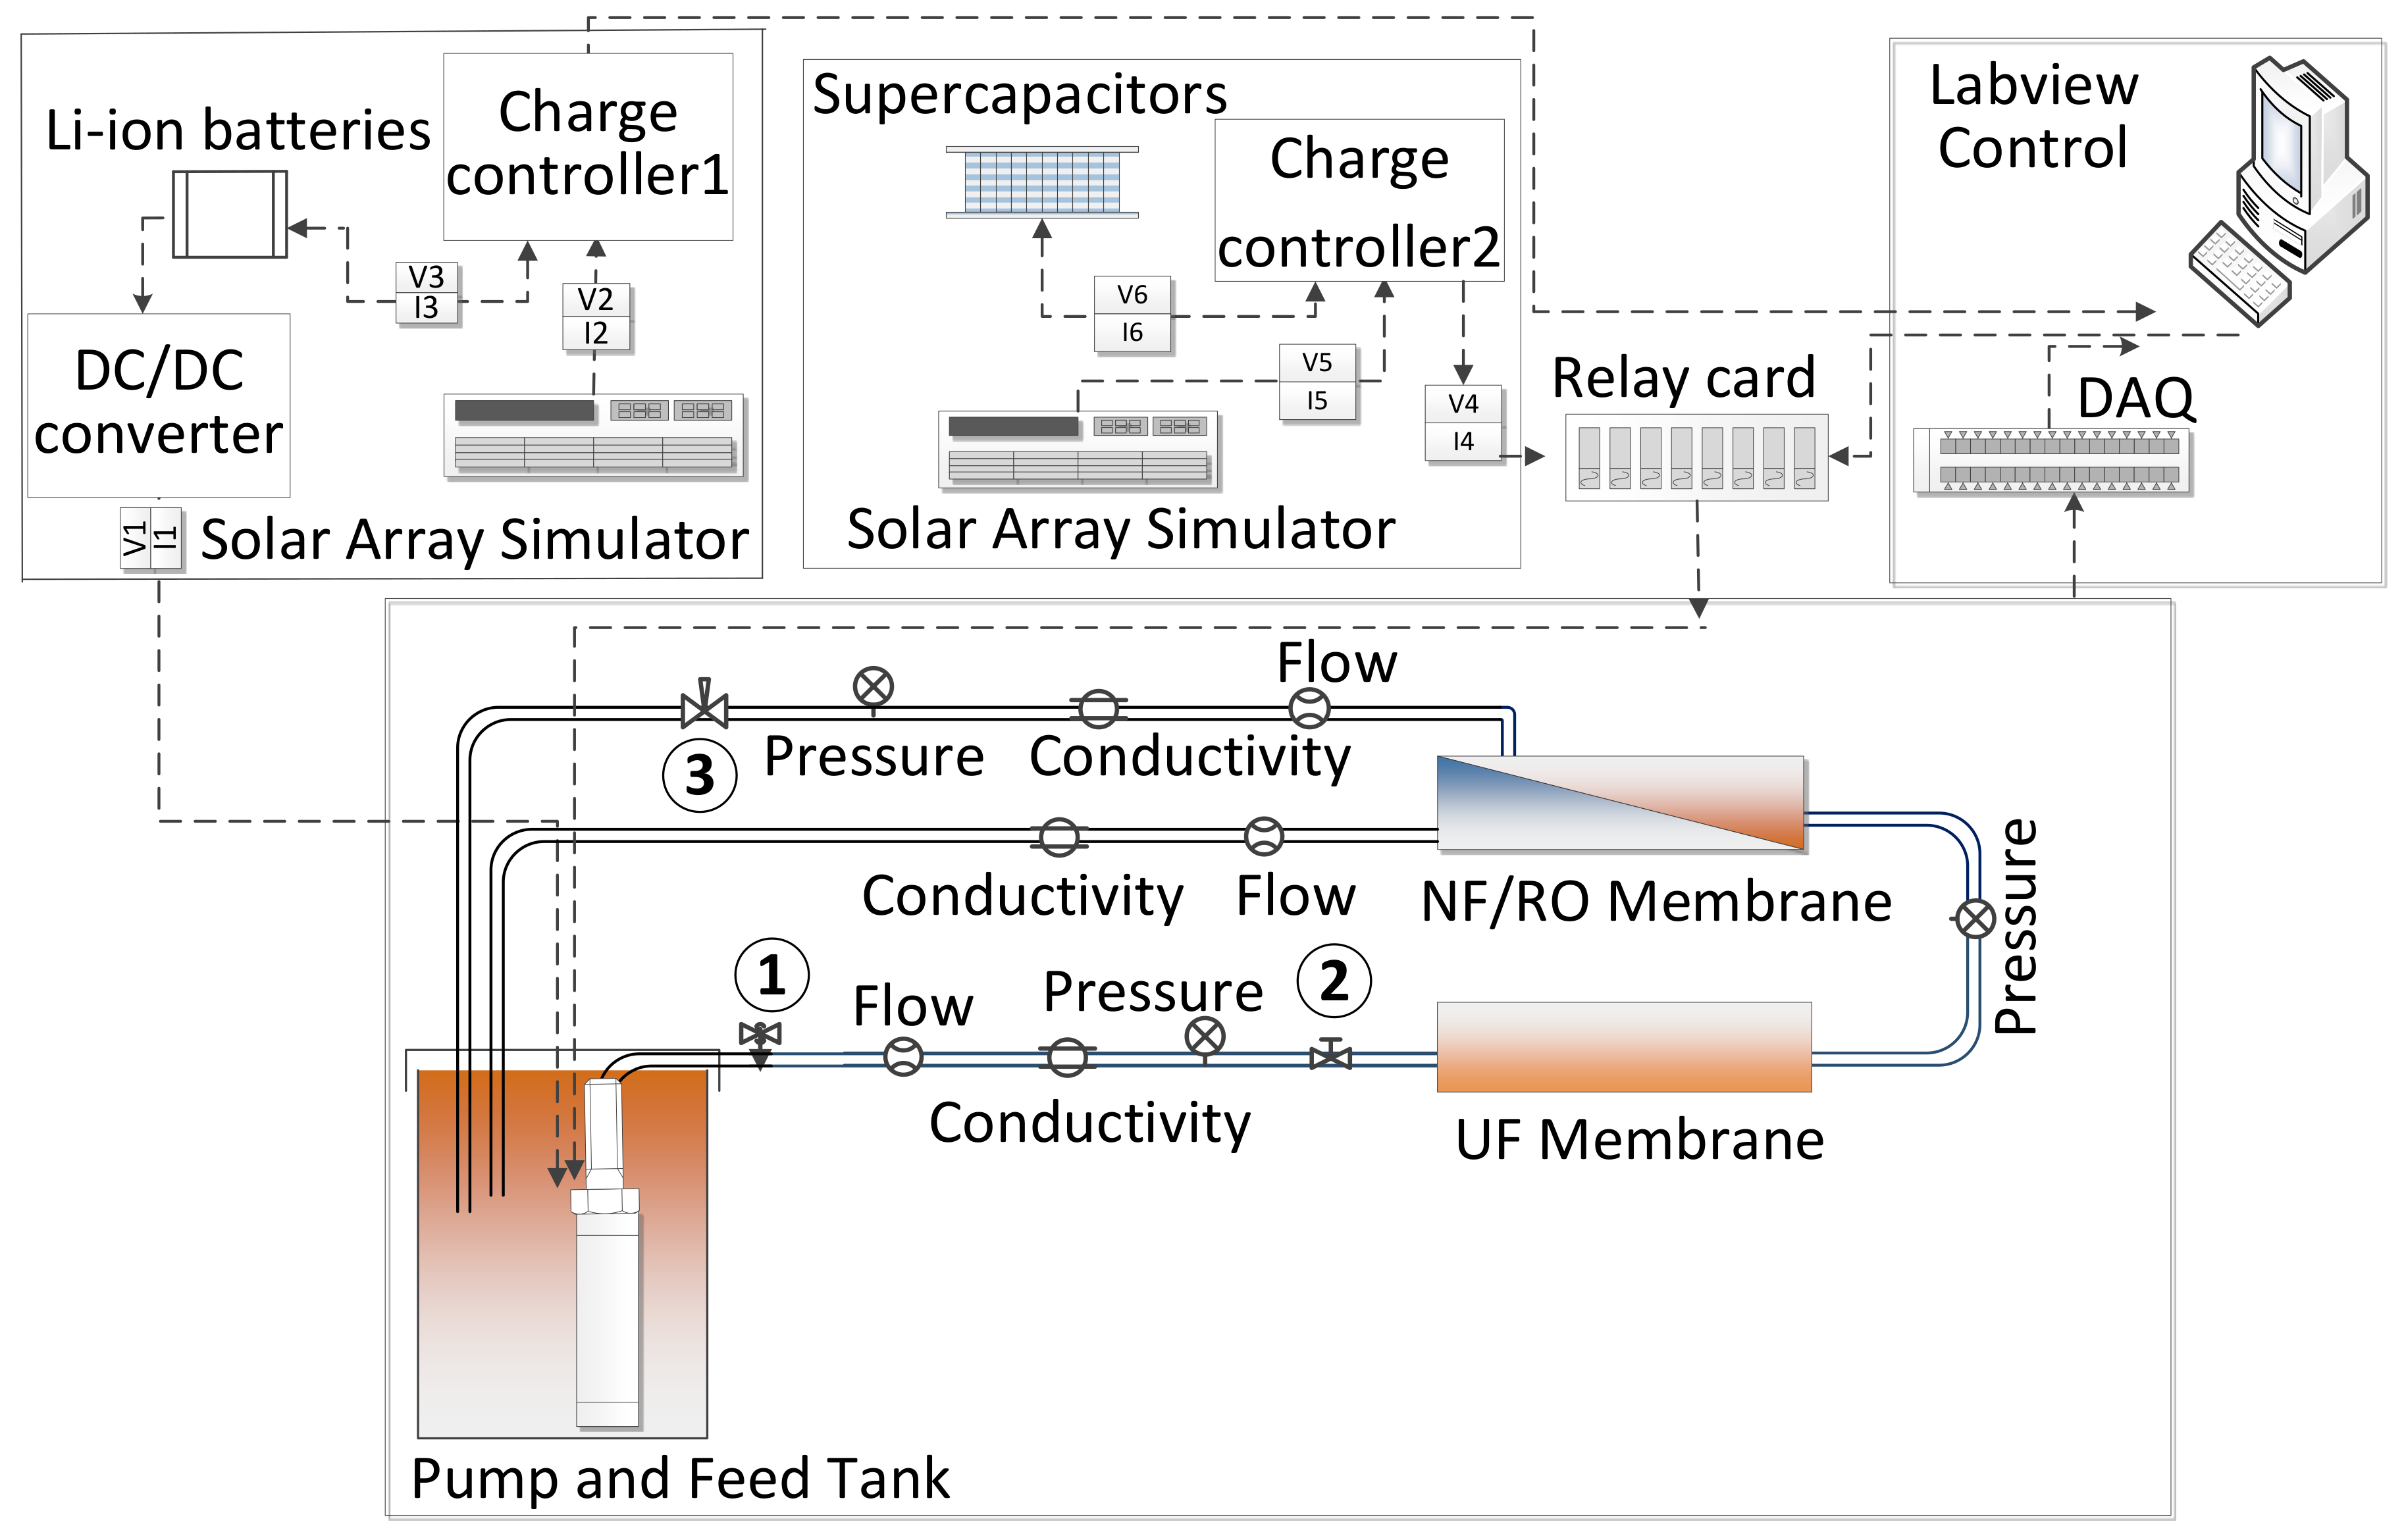
2.1. PV Membrane System Description

The filtration experiments were conducted with a PV-membrane system—comprised of both ultrafiltration (UF) pretreatment and NF/RO membranes—that was equipped with either a Li-ion battery bank or SCs as energy storage components. A system schematic is shown in Figure 1, while the majority of the present system components have already been described in a previous paper [40]. Briefly, a solar array simulator (SAS; Chroma 62000H; Taiwan) was used to simulate the output of the PV panels (detailed below) to ensure the reproducibility of the experiments—using real-world measured solar irradiance (SI)—being conducted in an indoor laboratory. A helical rotor pump (Grundfos SQFlex 0.6–2 N; Denmark) was employed to achieve the desired pressure and flowrate. The pump can be operated over a very wide voltage range (30–300 Vdc). It should be noted that the pump has a built-in maximum power point tracker (MPPT) that is designed to extract the maximum power available from the PV panels.
For electrical energy storage, two lithium iron-phosphate (LiFePO4) battery packs (Power Brick 24 Vdc and 50 Ah, PowerTech Systems, France) were connected in parallel to provide a maximum battery capacity of 100 Ah for the PV-membrane system. A charge controller (Victron MPPT 100/20, the Netherlands) was used to regulate the charging and discharging behaviors of the batteries with a maximum current up to 20 A (claimed—this was actually 15 A in practice). A DC/DC converter (MeanWell SD-500L-48, Taiwan) was used to convert the battery voltage from 24 Vdc up to 48 Vdc in order to supply a suitable voltage to drive the pump. Pairs of current (DRF-IDC, Omega, Bridgeport, N.J., USA) and voltage (DRF-VDC, Omega, Bridgeport, N.J., USA) sensors were installed to measure the electrical characteristics of both batteries and pump. These sensors were monitored to determine the status of the pump and batteries (charging or discharging).
The other energy storage option was twelve SCs (Maxwell Boostcap BPAK0058-E015-B01; San Diego, California, USA) connected in a series to achieve a maximum output voltage of 180 V and a capacitance of 4.8 F. A charge controller was designed based on preset voltage thresholds to control the state of the pump (on/off) and the charging/discharging behaviors of the SCs, as described previously [40]. It should be noted that the switching of the energy storage options (Li-ion vs. SC vs. reference) is carried out manually.
Inline sensors for measuring the pressure, flowrate and EC were installed in feed, permeate and concentrate streams of the PV-membrane system to monitor instantaneous performances during transient periods (details found in [40]). All the sensors exhibited a response time of 1 s or less, and their outputs were recorded using a data acquisition card (DAQ, National Instruments 6229; Austin, Texas, USA) and displayed instantaneously on a computer running LabVIEW for data logging and control. A needle valve in the concentrate stream (see ③ in Figure 1) was used to regulate the desired back pressure for the system. Throughout all the experiments, the permeate and concentrate streams flew back into the feed tank to maintain a constant feed concentration. The feedwater temperature was maintained at 20 ± 0.5 °C via a chiller (Julabo, FC600).

2.2. Water Quality and Membrane Type

The feedwater was prepared using deionized water and NaCl (Sigma-Aldrich, general purpose grade) to create synthetic brackish water with a salt concentration of 5 g/L. The concentration was calculated from EC values that were measured with conductivity electrodes (Bürkert 8222, Germany) using a conversion factor of k = 0.59, determined by calibration with NaCl dissolved in deionized water (BWT Moro 350, Germany) at 20 °C.
The UF membrane (DuPont Dizzer P4040-6.0, Wilmington, Delaware, USA, membrane area: 6 m2 [56]) was chosen as a pretreatment to remove large particles and protect the RO membrane against fouling, while a loose 4″ spiral-wound brackish water RO membrane (DuPont BW30-4040, Wilmington, Delaware, USA, [57]) was used for desalination. The BW30 membrane exhibited 24% recovery and 97.5% retention when treating 5-g/L NaCl saline feedwater with the system operating at 300 W of power and a transmembrane pressure (TMP) of 10 bar under steady-state conditions [40]. The membrane-specific parameters (flux, TMP, retention, recovery and SEC) were calculated using well-known relationships, detailed in Equations (1) to (5) [58,59] below.
J = Q P A   ,
where J represents the flux (L/m2∙h), A is the membrane-active area (m2), and Qp is the permeate flowrate (L/h).
TMP = P i n t e r v e s s e l + P C 2 P p e r m   ,
where TMP represents the transmembrane pressure, Pinter-vessel is the pressure after the UF membrane (bar), PC is the pressure in the concentrate stream (bar), and Pperm is the relative pressure of the permeate side (0 bar)
R = 1 E C P E C F × 100   %   ,
where R represents the recovery (%), ECP and ECF represent the electrical conductivity of permeate and feed (µS/cm), respectively.
Y = Q P Q F × 100   %   ,
where Y represents the recovery (%), QP and QF represent the flowrate of permeate and feed stream (L/h), respectively.
SEC = P p u m p Q P   ,
where SEC represents the specific energy consumption (kWh/m3), Ppump is the electrical power of pump motor (W).

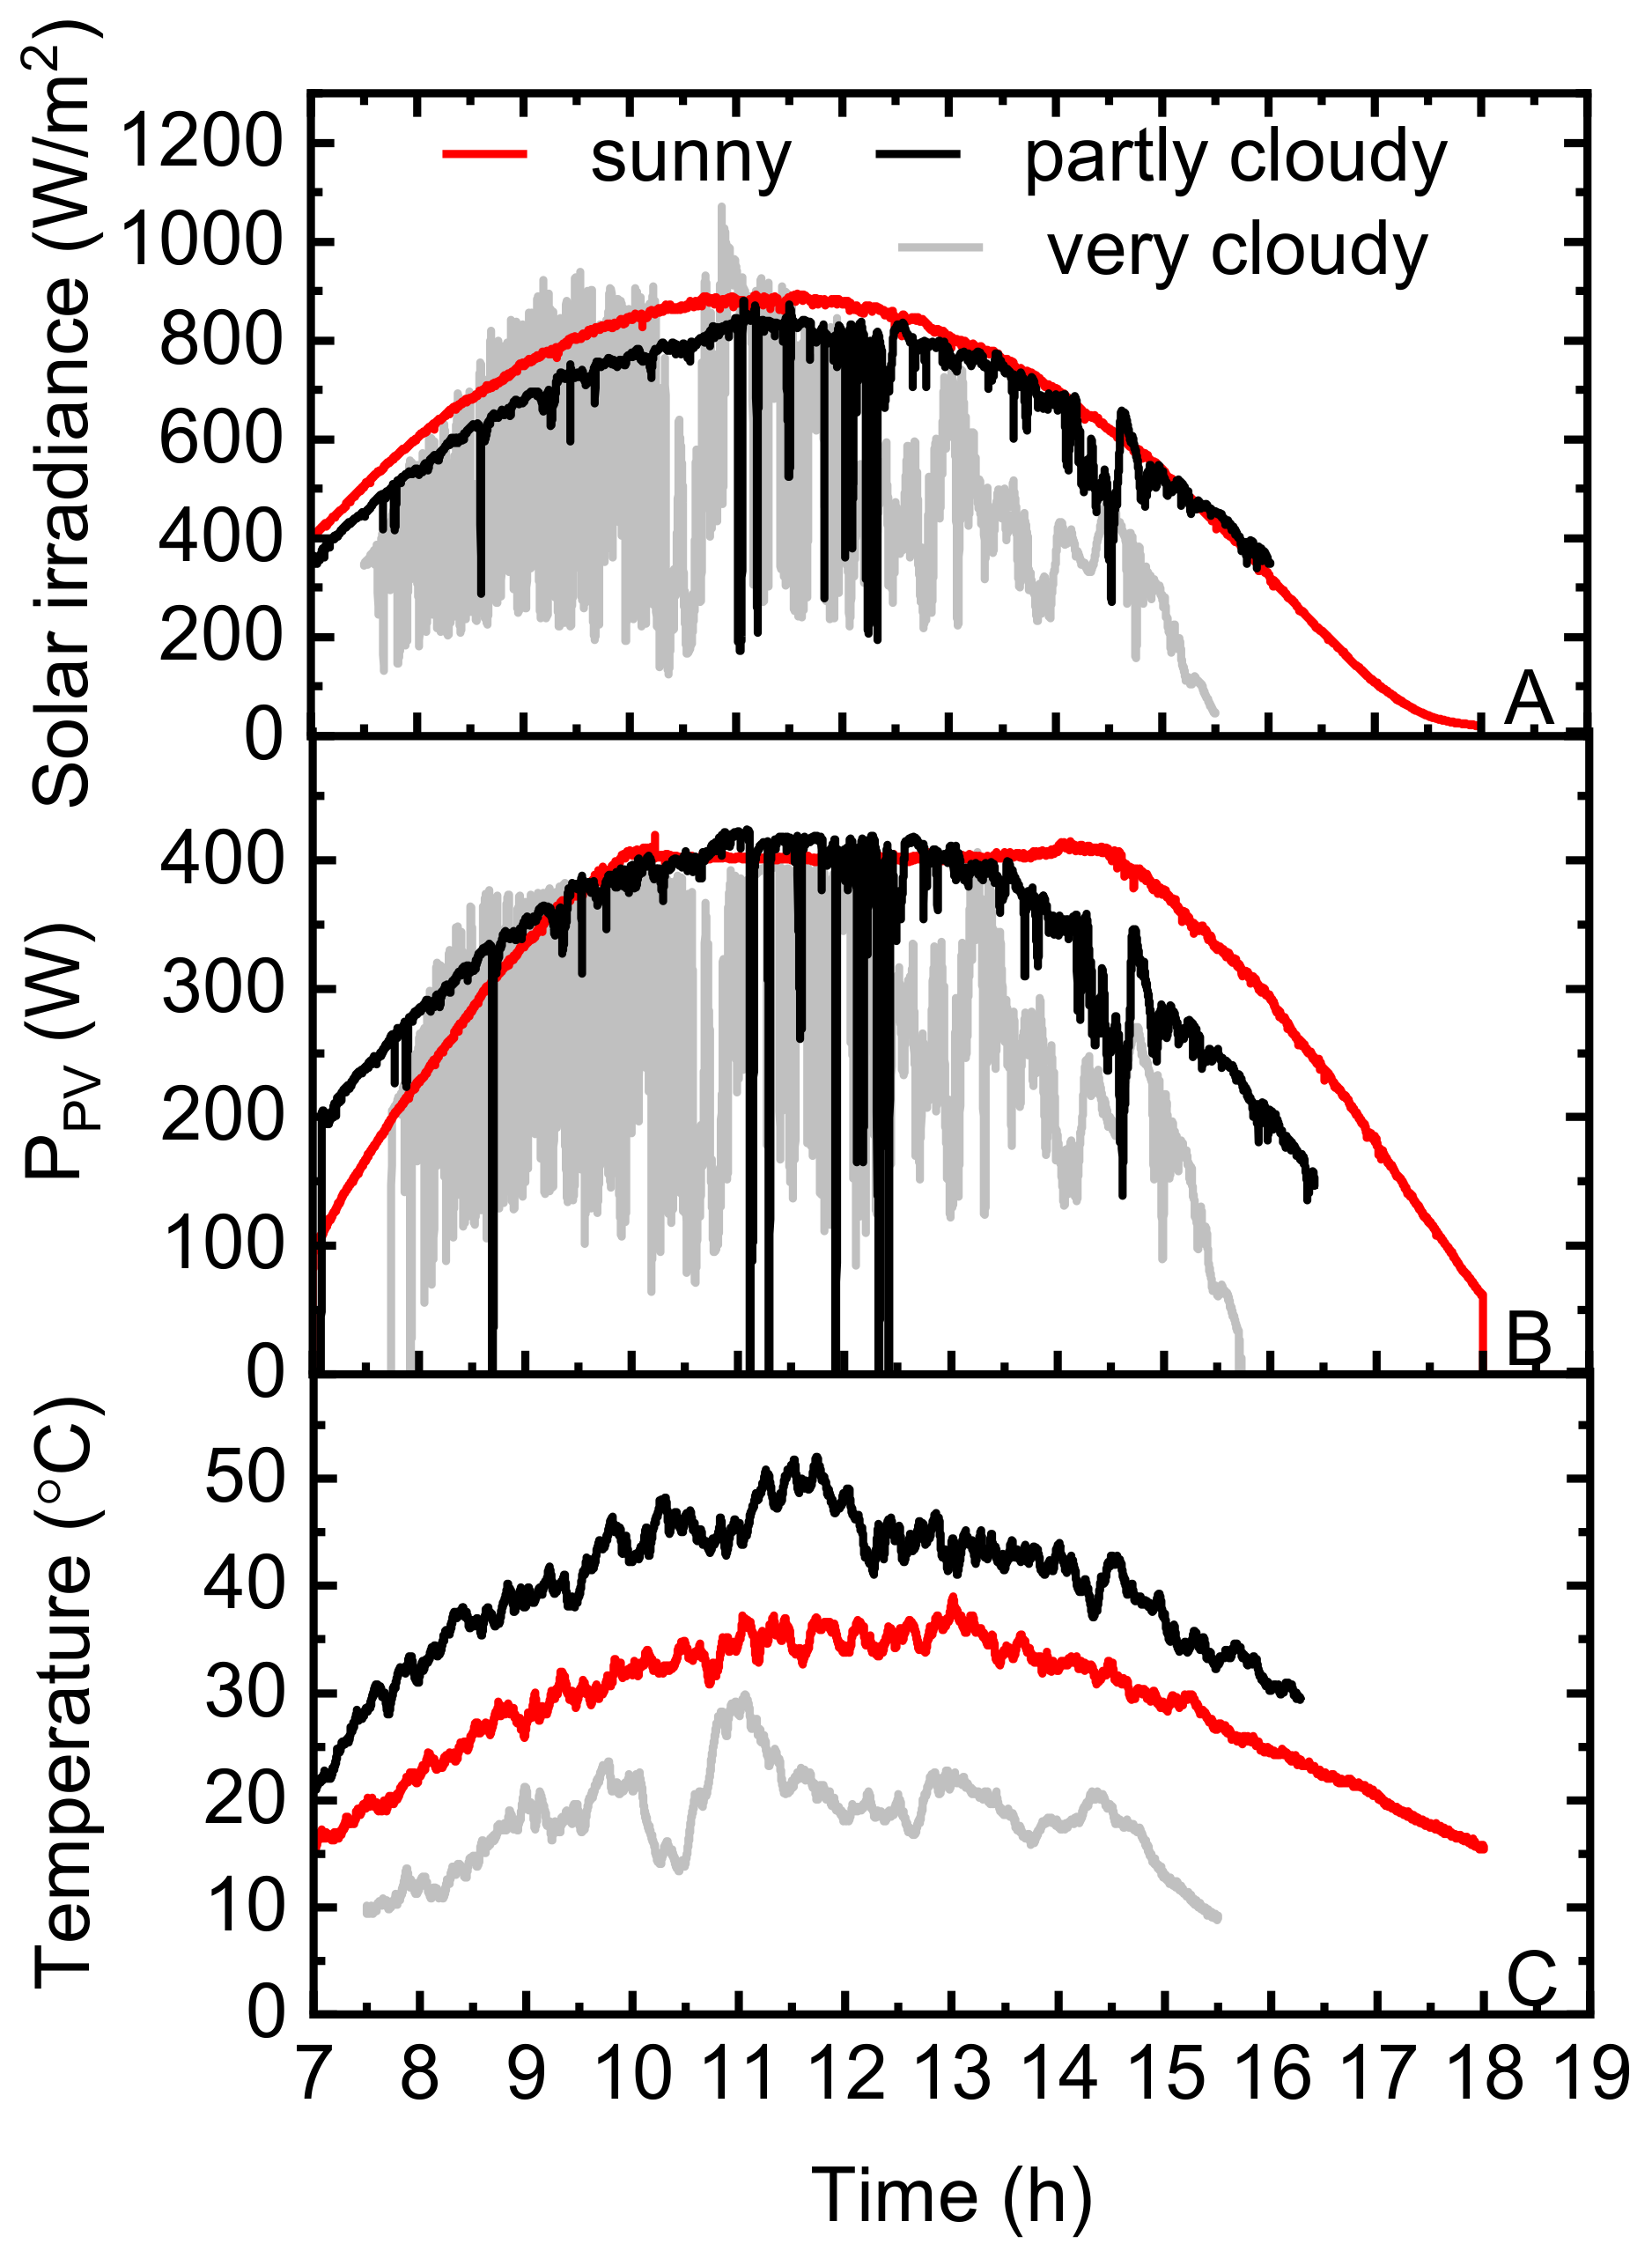
2.3. Solar Energy and “Solar Days”

Solar irradiance data with 1-s resolution were collected via an irradiance sensor (meteocontrol; SI-12-TC, Germany) at the KIT Solar Park—a 1-MW PV system located on the KIT campus in Karlsruhe, Germany (latitude: 40°00′33.73″, longitude: 82°4′15.98″ E)—and used as the input for the SAS. The SI data were converted into a current–voltage (I–V) curve via the built-in Sandia formula [60], while the module temperature was provided via an external temperature sensor.
There were two different settings for the SAS for the experiments conducted using i) batteries and ii) SCs (as well as the battery-less reference directly coupled with the pump). Both configurations rely on simulated PV panels with a 500-W maximum point power (Pmp) under standard solar radiation conditions (SI = 1000 W/m2) and a module temperature of 25 °C. The SAS parameters used for battery configurations were set as follows: Vmp = 75.2 V (voltage at maximum power) and Imp = 6.6 A (current at maximum power), with a fill factor (FF) of 75% and a relative temperature coefficient of the maximum power (Pmp) −0.41%/°C. For the SC configurations, the SAS was used to simulate the output of an array of five 100-W silicon PV modules (Sunmodule SW100 Poly [61]) connected in a series. These PV modules resulted in a high system voltage at the maximum power point (Vmp = 188 Vdc) that could be used to charge the SCs. The PV module specifications—Pmp, FF and temperature coefficient—were kept the same as mentioned above, along with the SI used as inputs for the SAS. The FF is defined as the ratio of the Pmp of the solar cell to the product of the open-circuit voltage (VOC) and short-circuit current (ISC) and is essentially a measure of the efficiency of PV modules. The temperature coefficient affects the output power of the PV panels, such that, as the temperature of the PV panel increases, the output power decreases. Note that the PV settings for the batteries were based on those used for previous SC experiments [40]; however, here, the PV area was scaled up by 25% in order to get a higher current and maintain the same voltage; hence, four PV panels were connected in a series to obtain a PV power of 500 W. The SAS combines all of these inputs to determine the PV power output at all times of the day.
The SI data were chosen to represent very different levels of fluctuations that occurred within one year of data (2016) —namely, (i) a “sunny day” (5 May), (ii) a “partly cloudy day” (26 May) and (iii) a “very cloudy day” (13 October), as illustrated in Figure 2A. To demonstrate the impacts of SI on the performance of the system without Li-ion batteries, the PV output power on the three “solar days” is plotted in Figure 2B. The module temperature data is presented in Figure 2C for further comparisons. Note that the measurements can be slightly different from real weather conditions due to the occurrence of dust or shadows on the PV panels. On the “partly cloudy day”, several sharp drops in the SI occurred in the periods around 8:30, 11:00–13:00 and 14:30. The timeframe of these fluctuations in the SI was typically seconds to minutes. The SI on a “very cloudy day” exhibited periods of large fluctuations as thick clouds passed overhead from 7:30 to 14:30, and subsequently, the already low SI dropped steadily from 14:30 to 15:30. The “sunny day” illustrated a typical SI in the range of 100–900 W/m2. The SI does not reach 1000 W/m2 due to the season in this latitude (beginning of May in Germany) and the temperature exceeding 25 °C (see Figure 2C). It can be seen from Figure 2B that the maximum PV power output maintains ~400 W when it reaches the maximum SI, and the power saturation occurs at SI > 800 W/m2. Note that saturation is defined as the state when no more PV power can be used. The testing durations on “very cloudy”, “partly cloudy” and “sunny” days were 8 h 30 min, 9 h and 11 h, respectively—the latter two being significantly longer, as May is closer to the summer equinox (21 June). It should be noted that all experiments commenced after 7 a.m., when the SI > 300 W/m2, in order to have adequate power to start the system and produce permeate.
When these varied “solar days” were reflected in a regional climate, a rough and simplified estimation of the distribution of the three different weather conditions was carried out based on an 18-month research campaign in Tanzania 2012–2014 [62]. The “very cloudy day” (daily average solar irradiance of 4 kWh/m2/d, assuming 10 h of sunshine) was an indicator for a typical day in the rainy seasons, of which there are two in Northern Tanzania, with an amount of rainfall from 50–200 mm per month. The “short” rainy season occurred from mid-November to mid-January, while the “long” rainy season was from March to May. The “sunny day” (average solar irradiance of 7 kWh/m2/d, assuming 10 h of sunshine) was indicative of the performances during the dry season. Hence, seven months of each year were estimated to encompass the dry seasons in Northern Tanzania. Consequently, the annual solar irradiance was added up to 2070 kWh/m2/y, which roughly agrees with previously published annual solar irradiance values (the city of Arusha exhibited an annual solar irradiance of 2420 kWh/m2/y) [63]. Therefore, for this location, roughly 210 days were estimated to be “sunny days”, and the rest of the days were “very cloudy days”. However, it needs to be noted that this is a very rough and simplified estimate as an example, and the distribution of solar days is very dependent on local weather conditions.

2.4. Lithium-Ion Batteries Sizing

In order to estimate the capacity that is required for batteries to supplement the PV output power under a worst-case scenario (“very cloudy day”) and to bring it up to the amount generated under a best-case scenario (“sunny day”), the total additional energy required for one solar day (Etot) is calculated in Equation (6):
E t o t = P s u n n y d t P v e r y   c l o u d y d t ,
where Psunny and Pvery cloudy represent the PV output power (W) on a “sunny” and a “very cloudy” day, respectively, while t is the operation time (h) over the entire day. The estimated total additional energy required during one solar day was calculated to be ~1.5 kWh (marked in Figure A1 in Appendix A.1).
An equation that is commonly used to determine the battery capacity and that accurately selects and sizes the battery pack for the stand-alone system is given by Equation (7) [64]:
C x = E t o t V d c · T a u t D o D m a x ,
where C x   is the required battery capacity (Ah) at a specified discharge rate x, E t o t is the total energy required over one day, as mentioned above (Wh), Vdc is the dc nominal voltage (V), T a u t is the number of days of autonomy and DoDmax is the maximum depth of discharge of the battery (%). Assuming the battery voltage = 24 V, Taut = 1 (assuming that there will always be some power generated by the PV panels, even during a worst-case scenario like on a “very cloudy day”) and DoDmax = 80%, the total battery capacity is calculated to be ~84 Ah (energy capacity of 2 kWh). Hence, two batteries connected in parallel exhibit a voltage of 24 V and a nominal battery capacity of 100 Ah (energy capacity of 2.4 kWh), and the discharge rate x is calculated to be 0.2 C, assuming the maximum required discharge current from the pump is 20 A (detail found in the datasheet [65]).

2.5. State-of-Charge Estimation

One way of expressing the energy storage capacity of a battery is via the SOC. An alternative way to represent the capacity is the DoD, which is most frequently applied when discussing the lifetime of a battery after repeated use. The SOC indicates the amount of capacity available in the battery as a fraction of the total nominal capacity, while the DoD indicates the usage of the battery capacity as a fraction of the initial total nominal capacity. Here, the initial SOC was varied in order to simulate having a battery bank with a range of energy storage capacities. The initial SOC of the Li-ion batteries was calculated based on the VOC method that was used by Baccouche et al. [66] at the beginning of each experiment. The SOC-VOC characteristics of a Li-ion cell were divided into eight segments by approximating the piecewise linear curve, with each segment expressed as a linear relationship, as shown in Equation (8):
S O C = f V o c = a · V o c b ,
where the varying coefficients a and b (%/V) are dependent on the VOC intervals [66,67]. Assuming a single lithium-ion cell has a VOC of 3.6 V [68], the equation is adapted with a factor of 7 to have an output voltage of 24 V. The VOC was firstly measured, and then, the initial SOC was calculated based on this method, which was implemented in a computer running LabVIEW. The calculations of the SOC during the experiments were estimated by the Coulomb counting method [66]:
S O C = S O C 0 + 1 Q r a t e d t 0 t 0 + τ I b d τ · 100
where SOC0 is the initial SOC, Qrated is the rated capacity of the battery (Ah; here, higher than C x ), Ib is the current of the battery (A), t0 is the initial time (h) and τ is the time interval of charging/discharging (h).

2.6. Supercapacitors Energy Buffering and Charge Controller

For the final experiments conducted in this work, SCs were applied as the other energy storage option in the PV-membrane system to buffer short-term fluctuations and intermittency on the “partly cloudy day”. A charge controller based on preset voltage thresholds (Vpump_off, Vpump_on, Vcharging_off and Vcharging_on) was designed to control the state of both the pump (on/off) and the SCs (charging/discharging). Full details about the charge controller and flow chart detailing all the operational states can be found in a previous paper [40]. In the present work, the difference of the charge controller is that the charge off/on thresholds were activated in order to control the depths of the charging and discharging of SCs throughout the whole day. In order to avoid previously reported conflicts with the built-in MPPT of the pump [40], a positive temperature coefficient (PTC) lamp was connected in a series with the pump to increase the inner resistance. The variable resistance was used to buffer the sudden changes caused by the built-in MPPT between the SCs and SAS. This leads to an average power loss of ~50 W via the PTC lamp on this solar day; thus, ultimately, an improved control system is required in the future that does not induce such a large loss.

2.7. Experimental Design

Experiments were carried out to evaluate the impacts of Li-ion battery storage on the system performance when incorporating fluctuations and intermittency (different “solar days”), focusing on the impact on water production and SEC. Particularly, on the “partly cloudy day”, the final tests were conducted with SCs to enable comparisons with the results of the batteries. The experiments conducted are specified below:
(i)
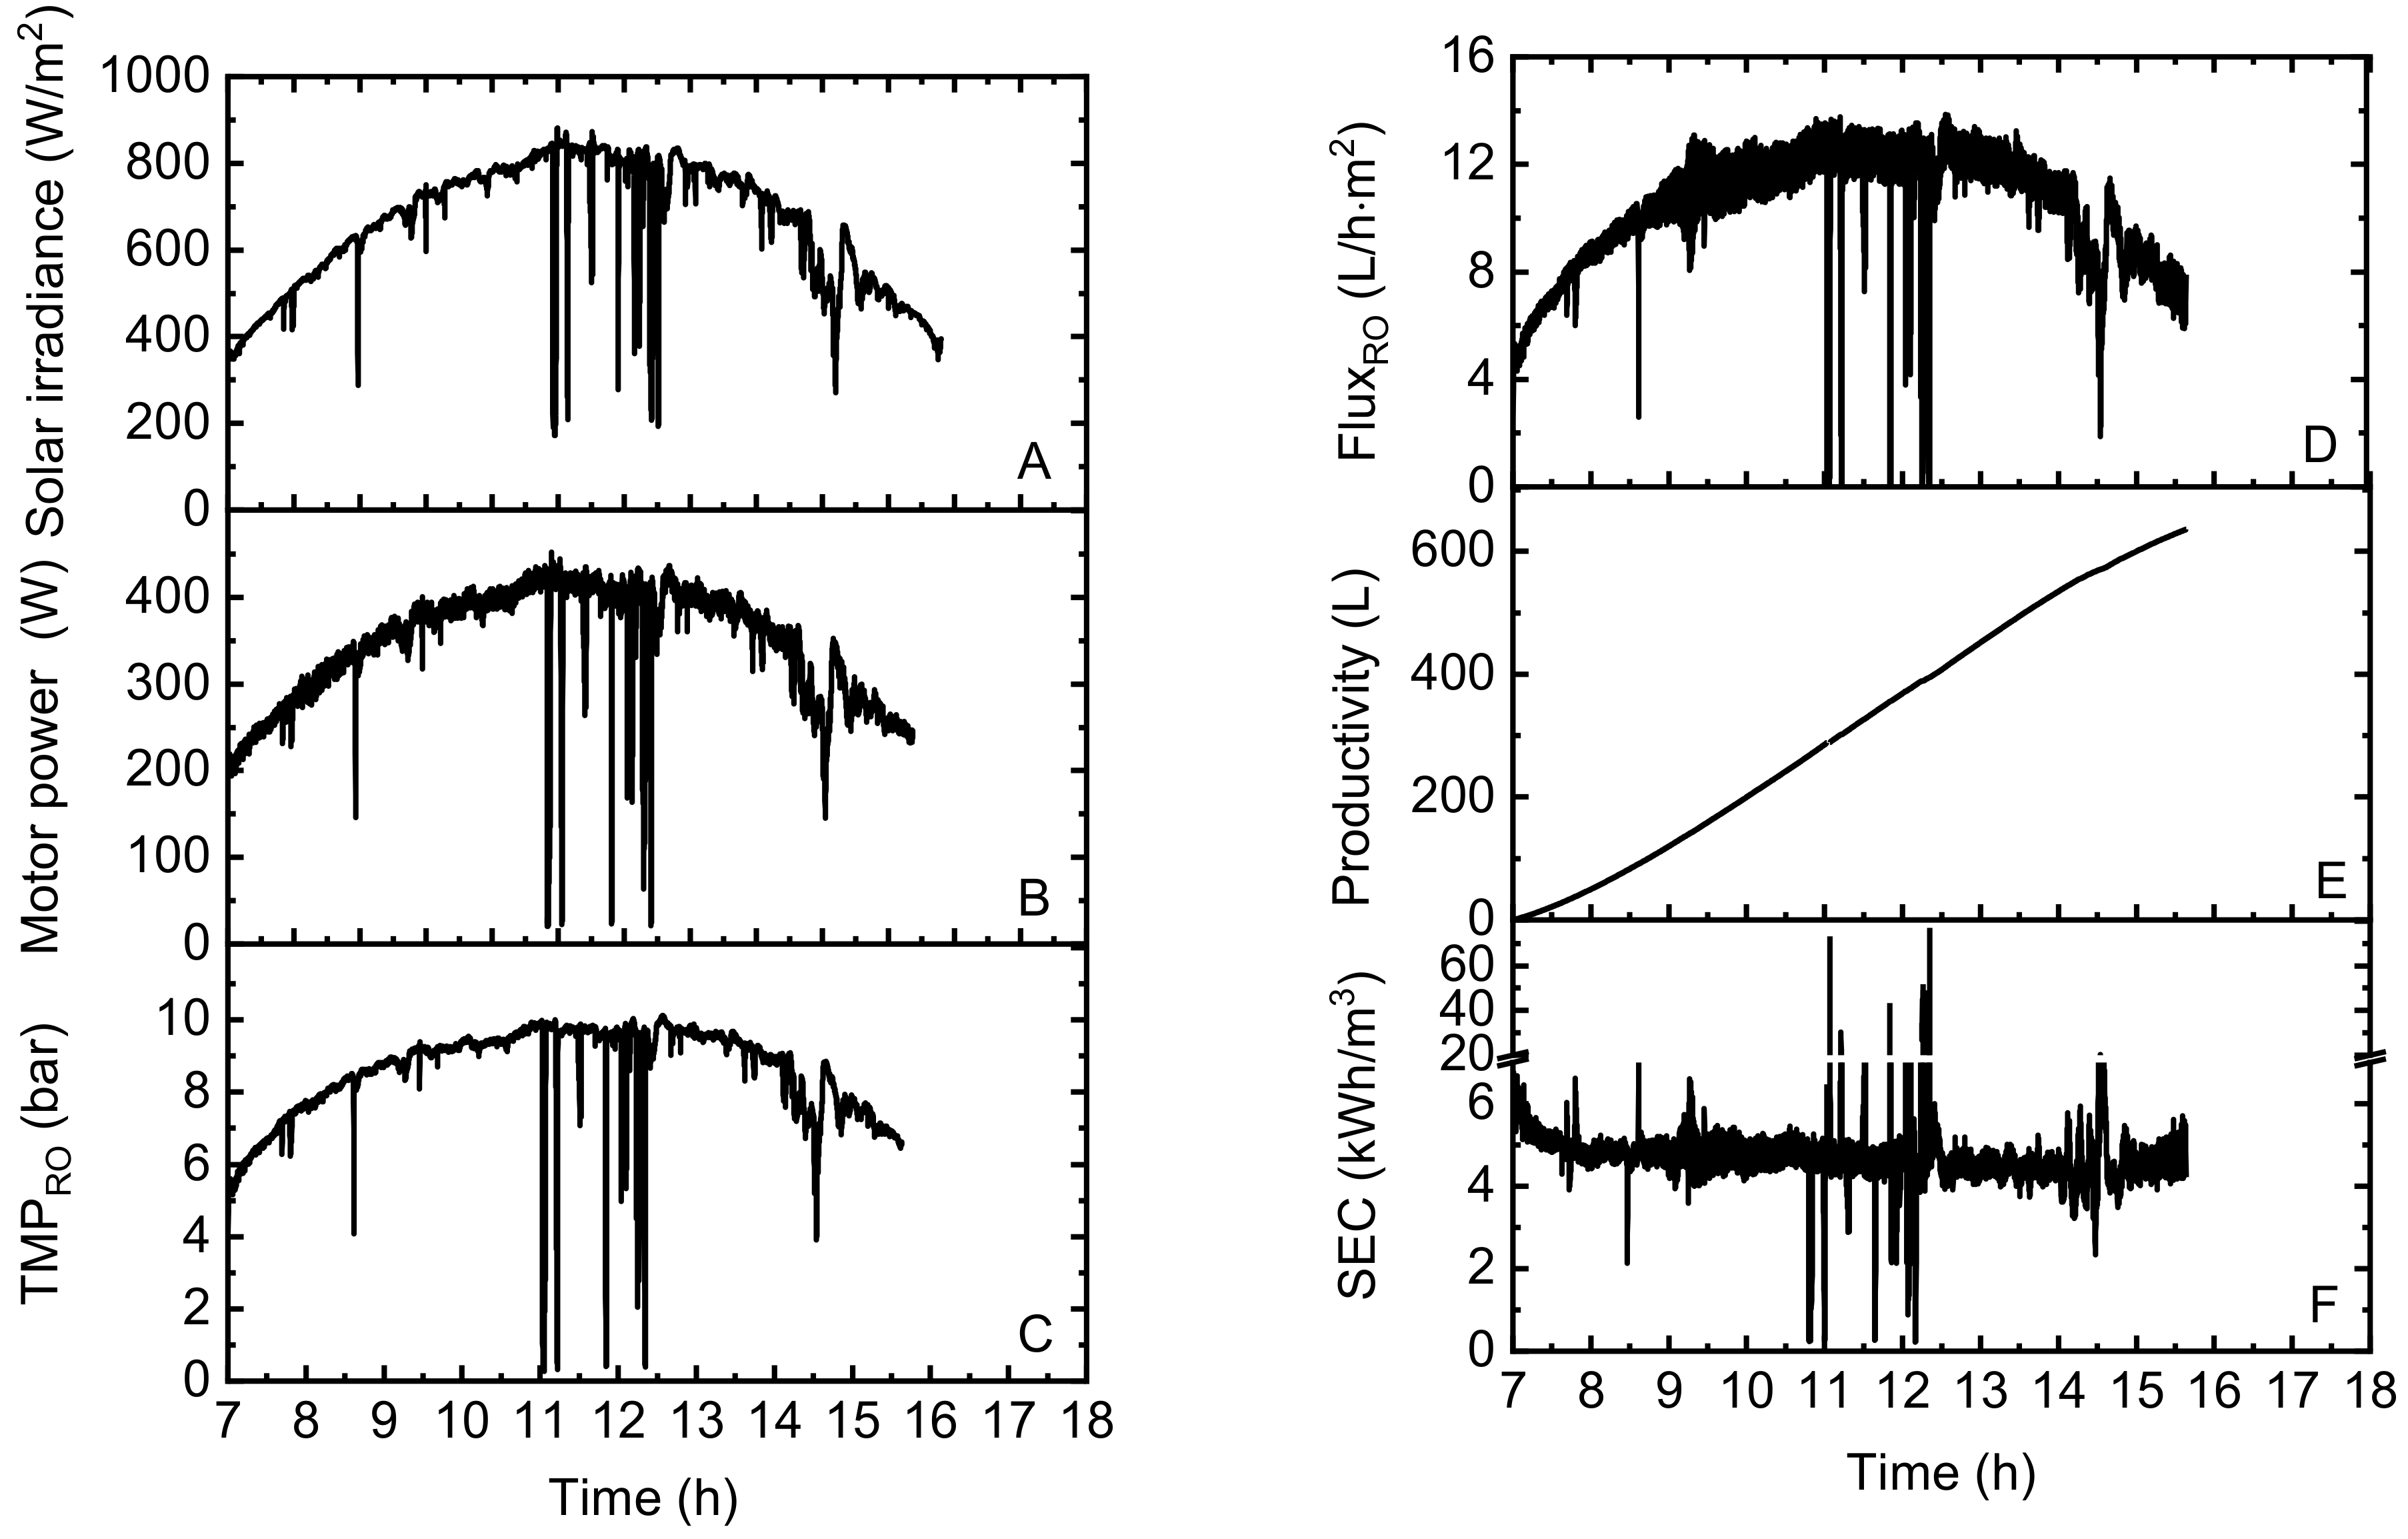
Operation on the “partly cloudy day”: The system performance using the BW30 membrane (5-g/L NaCl feedwater) on the “partly cloudy day” was determined to examine the directly coupled system performance (no energy storage) when subjected to real weather conditions. Comparisons of the system performance—in particular, the permeating production and SEC—were made between the reference (directly coupled without energy storage) and fully charged Li-ion batteries on that day.
(ii)
Operations on other “solar days”: The experiments (using the BW30 membrane and 5-g/L NaCl feedwater) were conducted with and without fully charged batteries (100% SOC) on the “very cloudy” and “sunny” days to evaluate the impacts of batteries on the dynamic characteristics of the PV system when subjected to different solar conditions.
(iii)
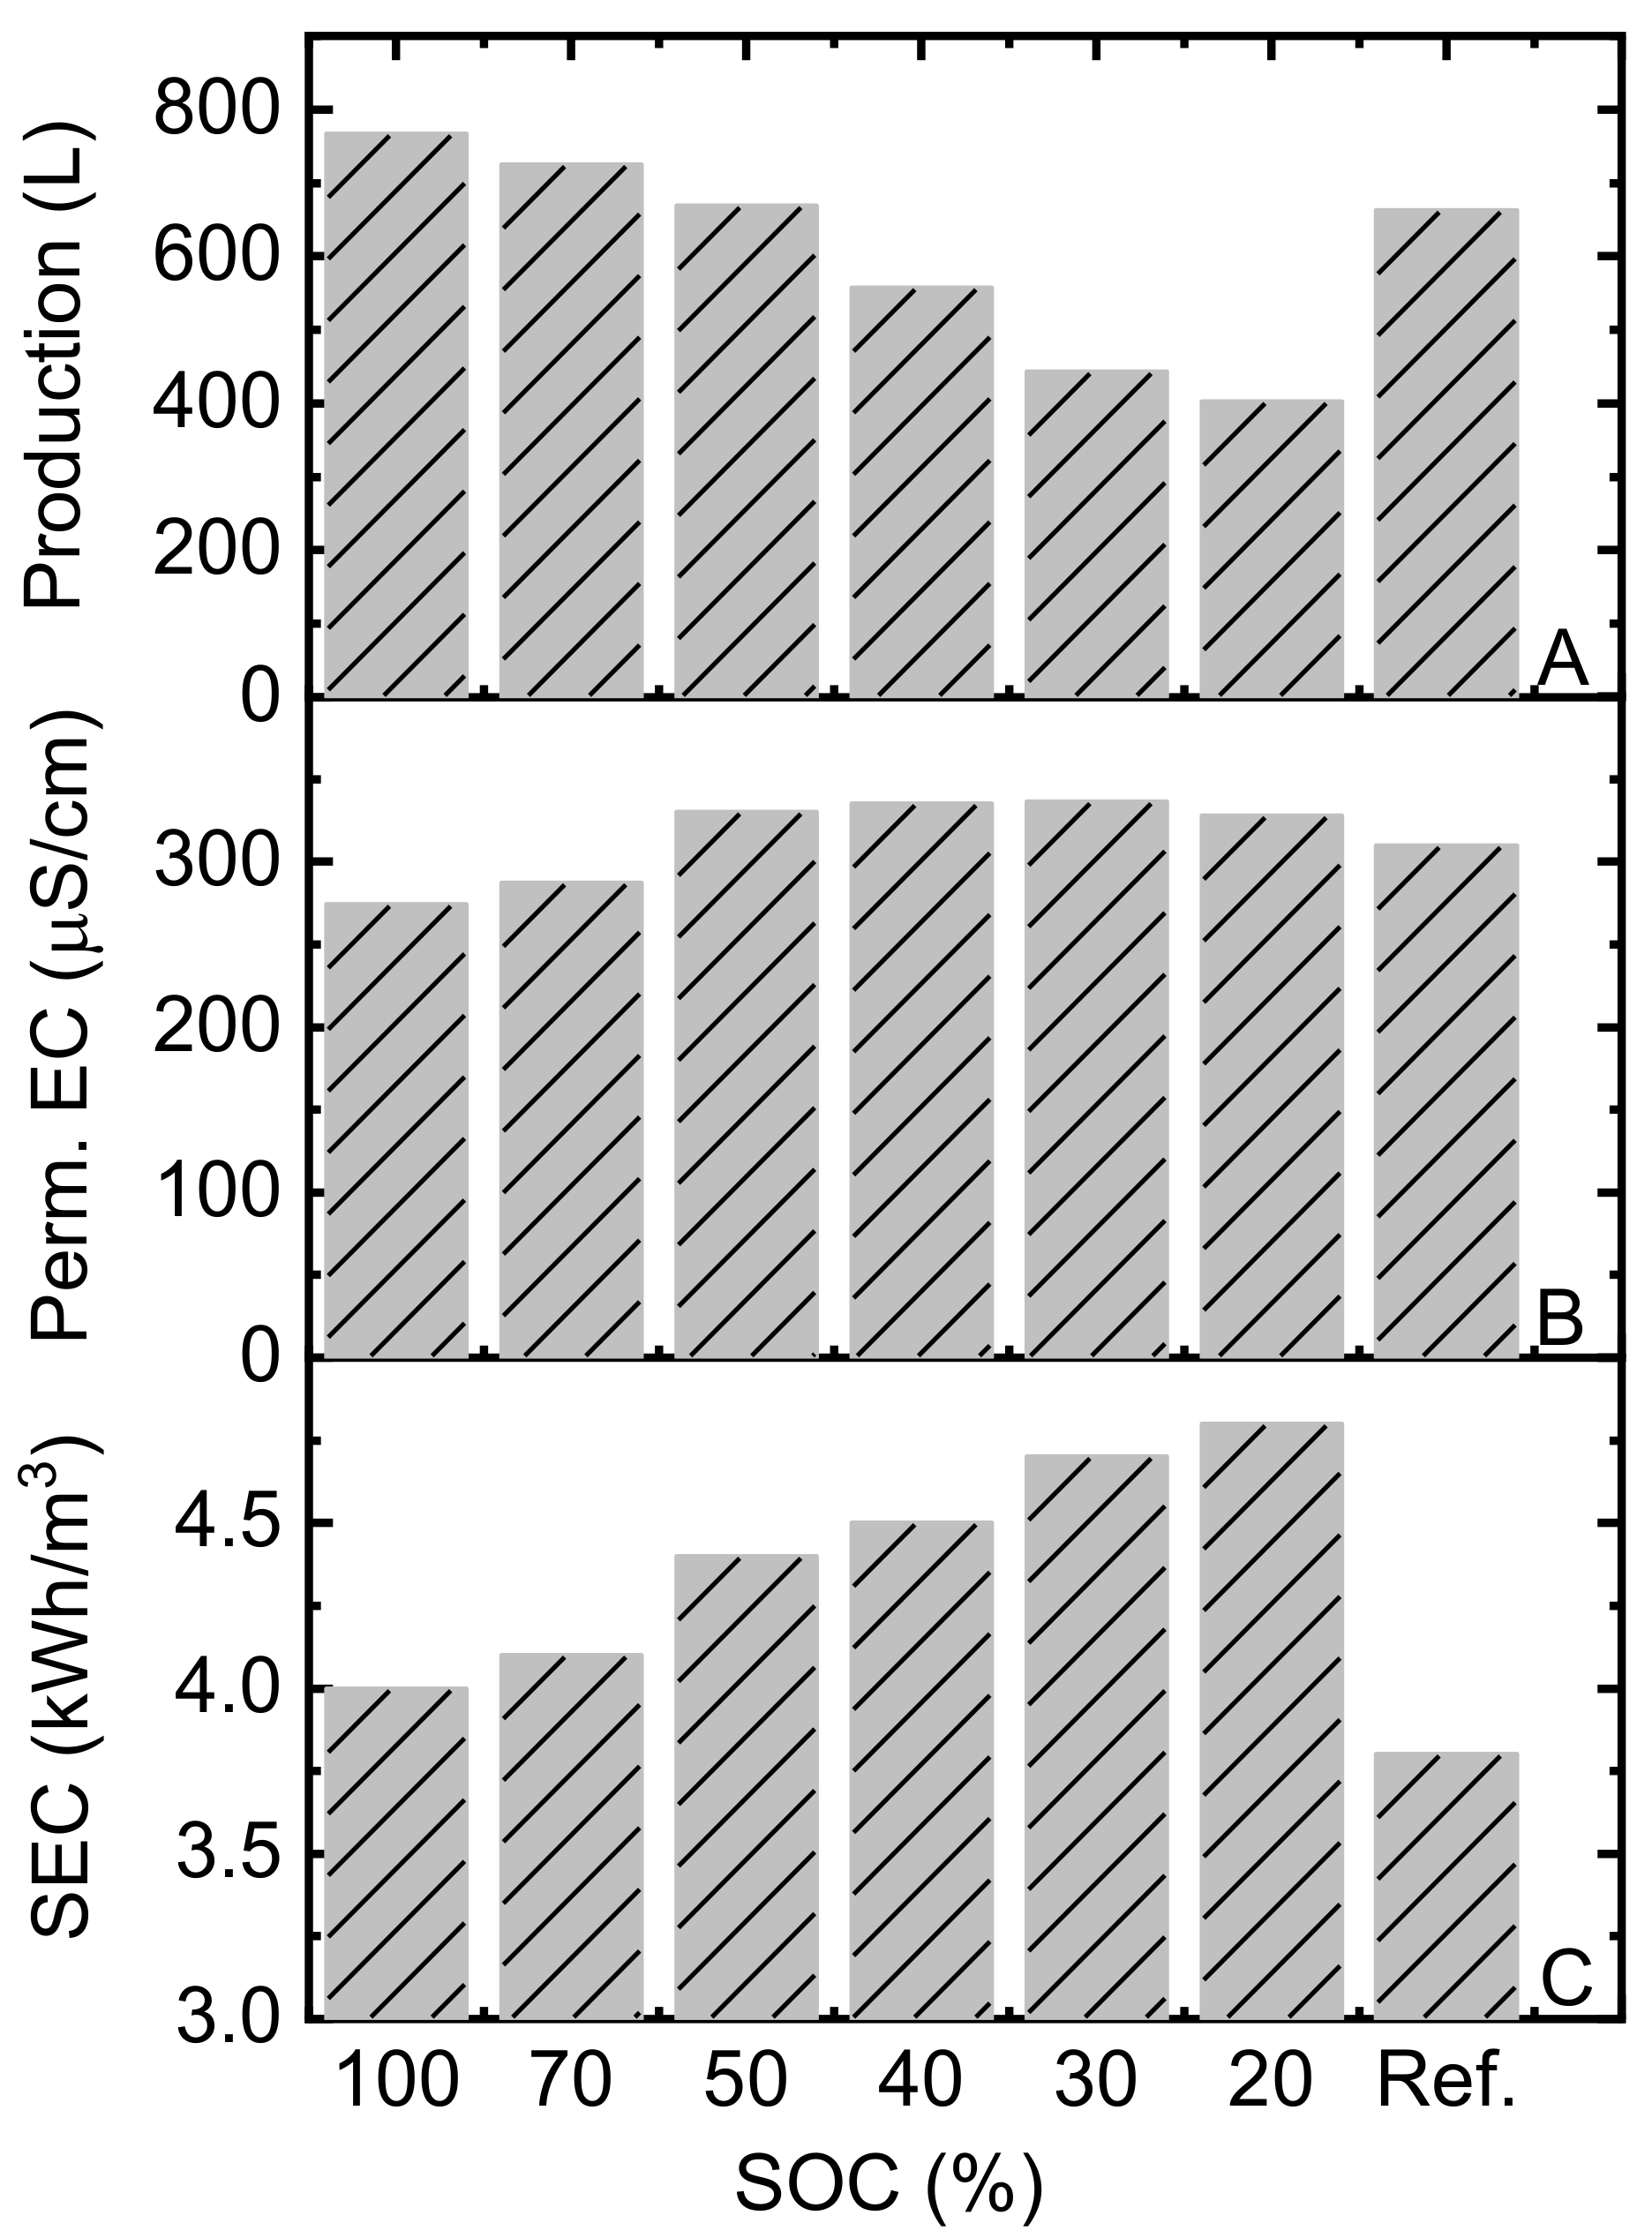
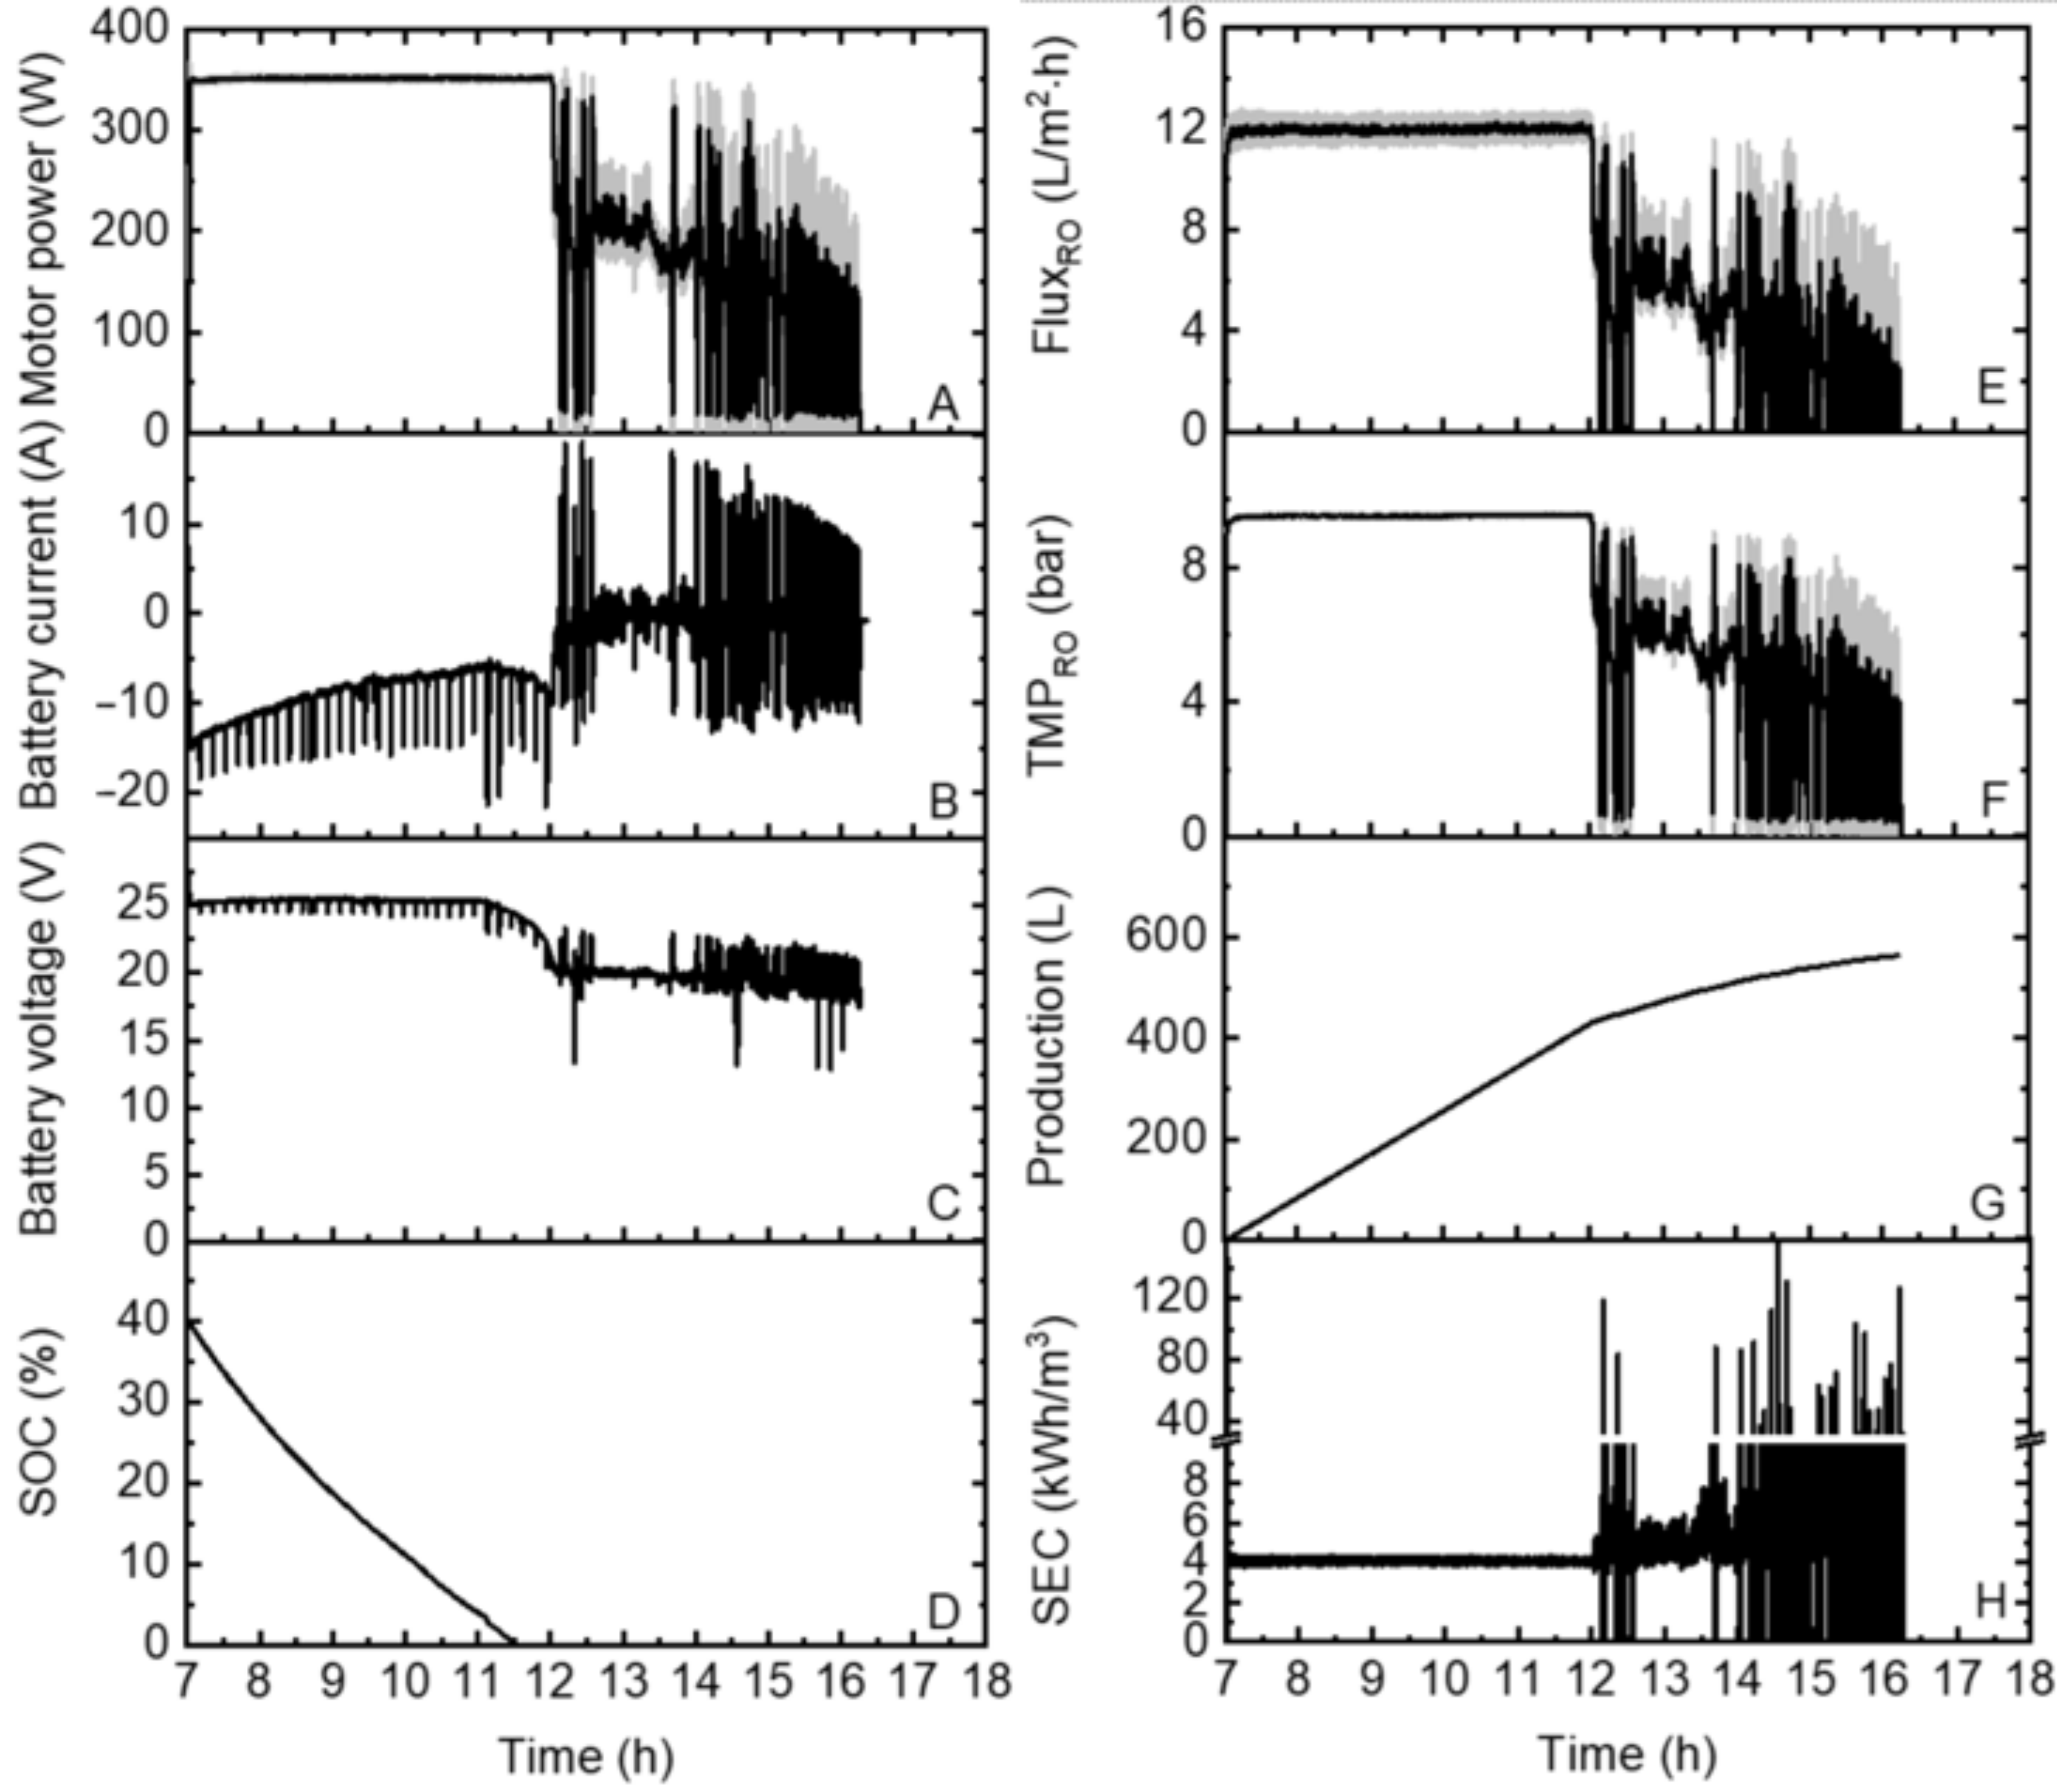
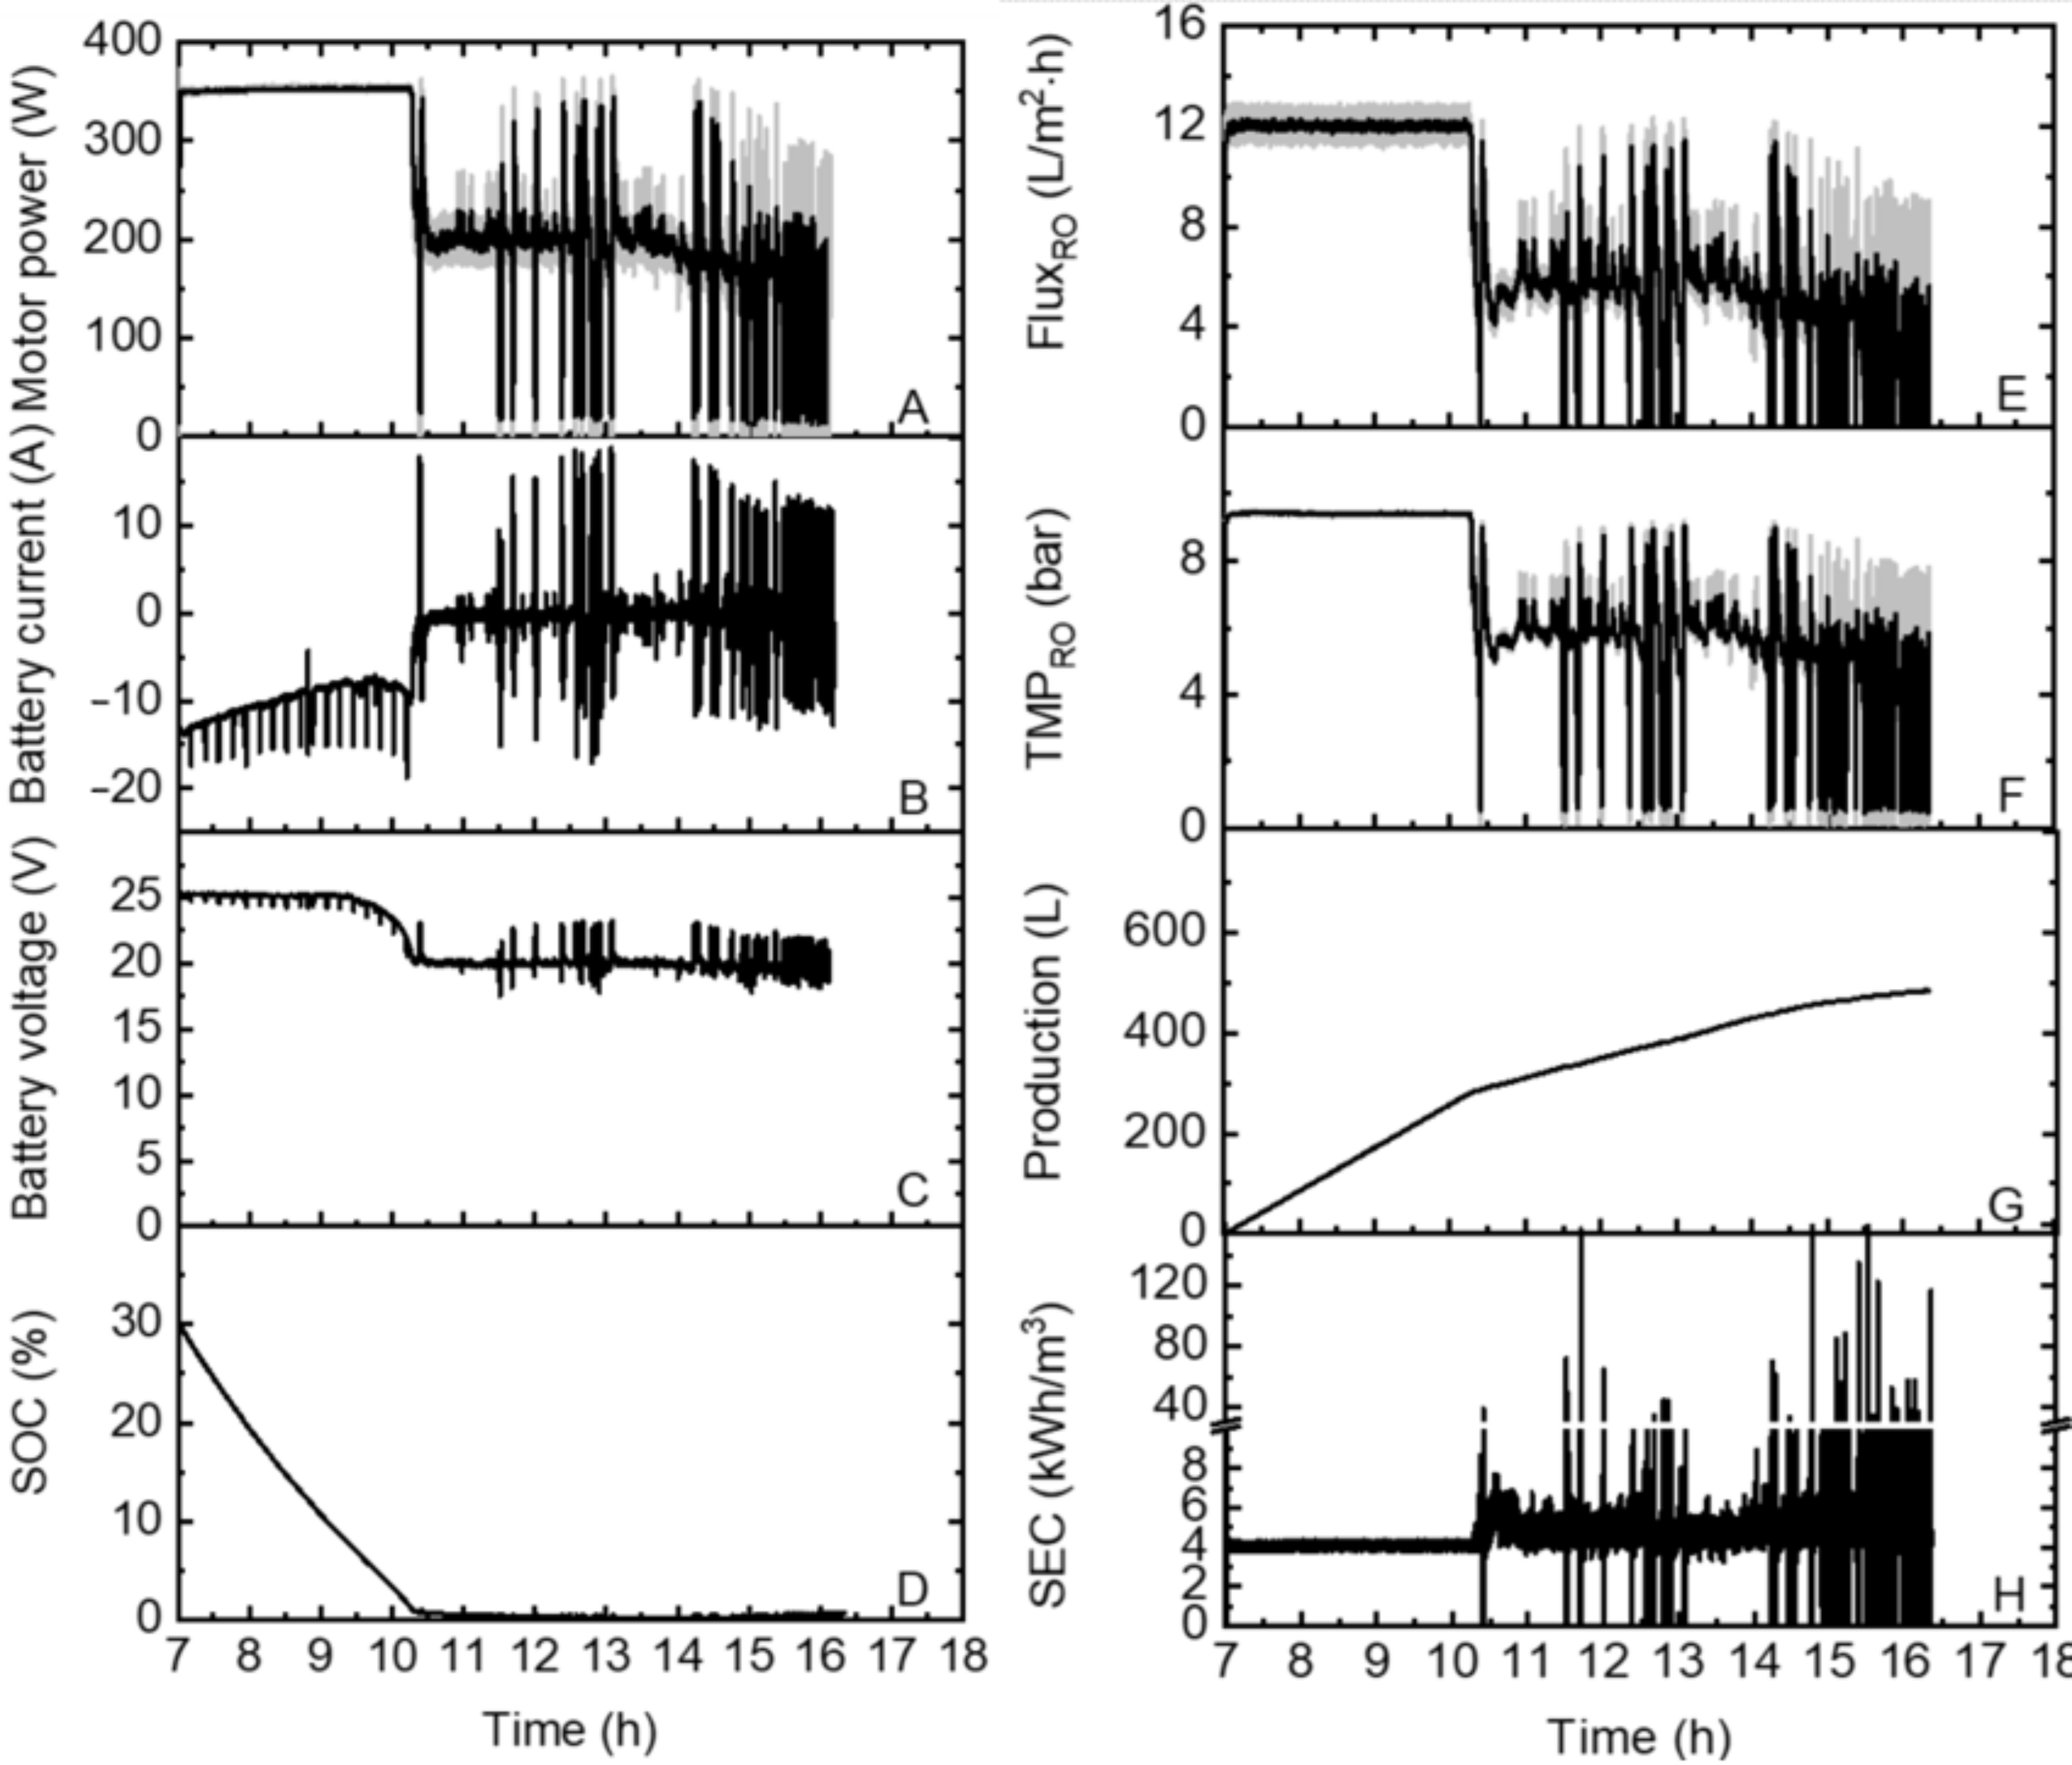
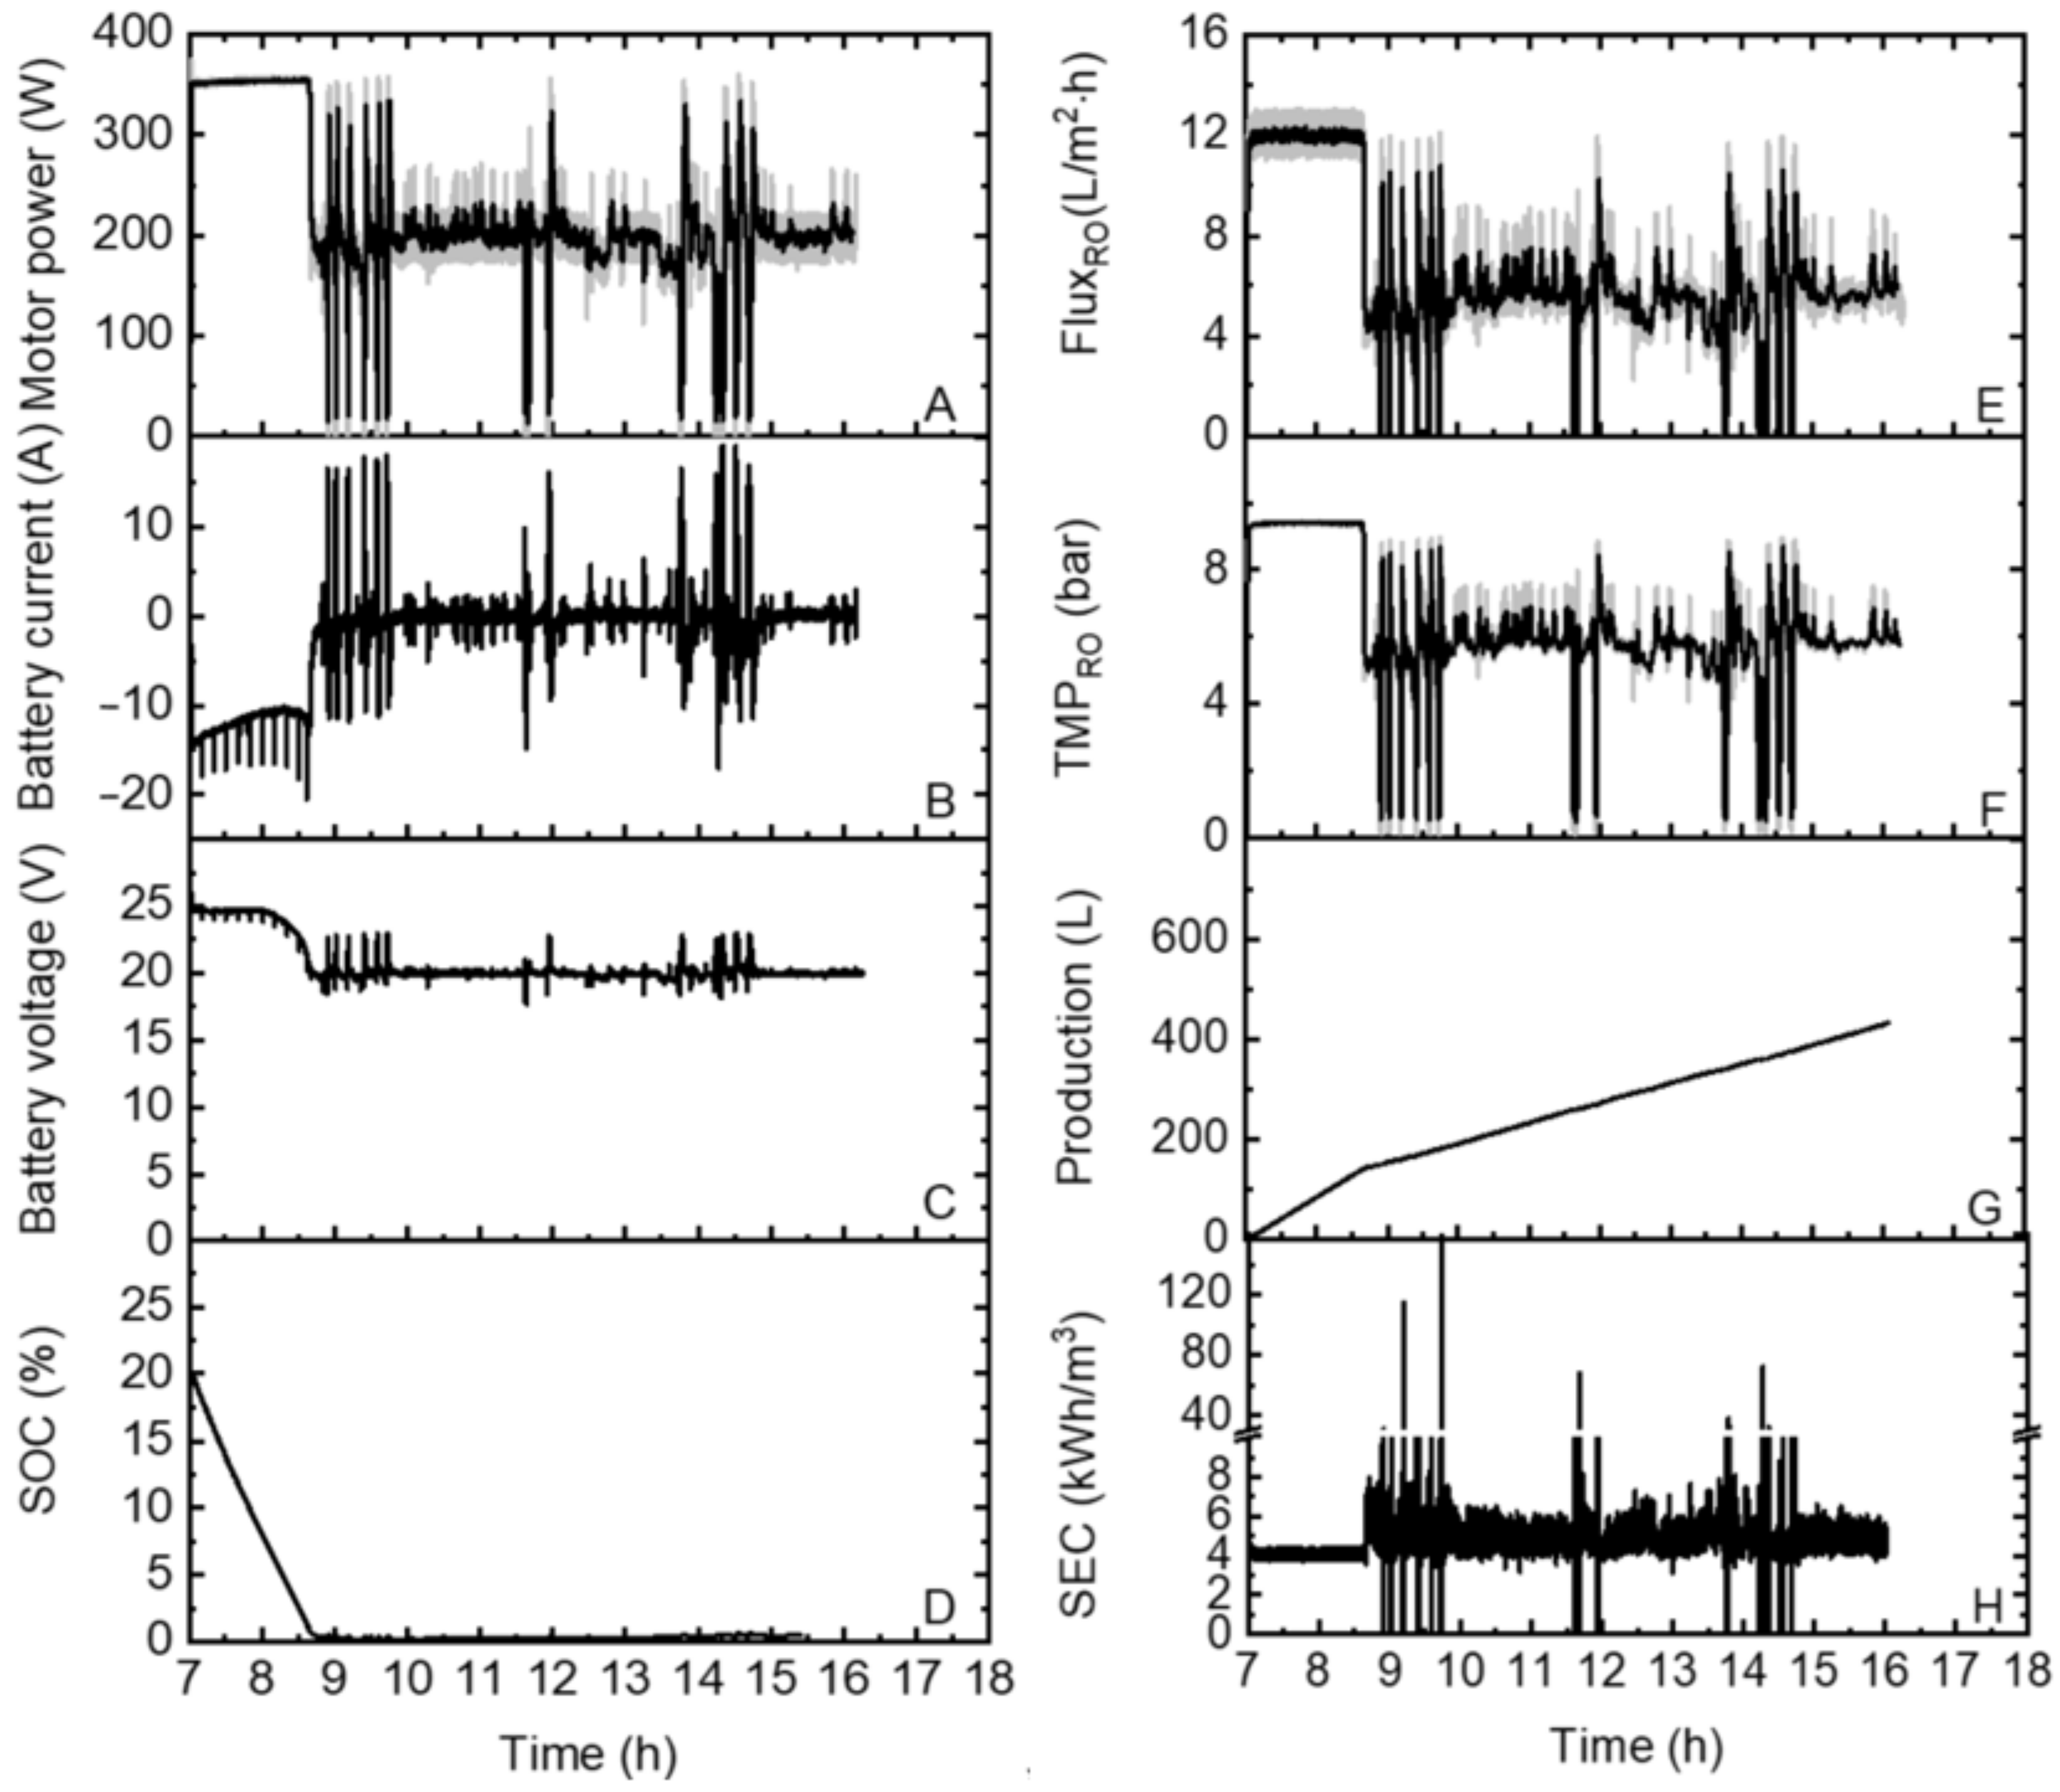
Operation with different battery capacities: The initial SOC varied over a wide range (70%, 50%, 40%, 30% and 20%) and was tested on the “partly cloudy day” to investigate how the PV-membrane system would respond if it was equipped with a smaller capacity battery bank—in particular, with respect to the SEC, permeating EC and production. The varied initial SOCs correspond to the energy storage capacities of 1.7, 1.2, 1, 0.7 and 0.5 kWh of the Li-ion batteries.
(iv)
Comparison between Li-ion batteries and SCs: To examine the impacts of different energy storage technologies on the PV-membrane system, the system performances were compared when equipped with SCs and a charge controller and fully charged Li-ion batteries on the “partly cloudy day” with the same PV power rating.

3. Results and Discussion

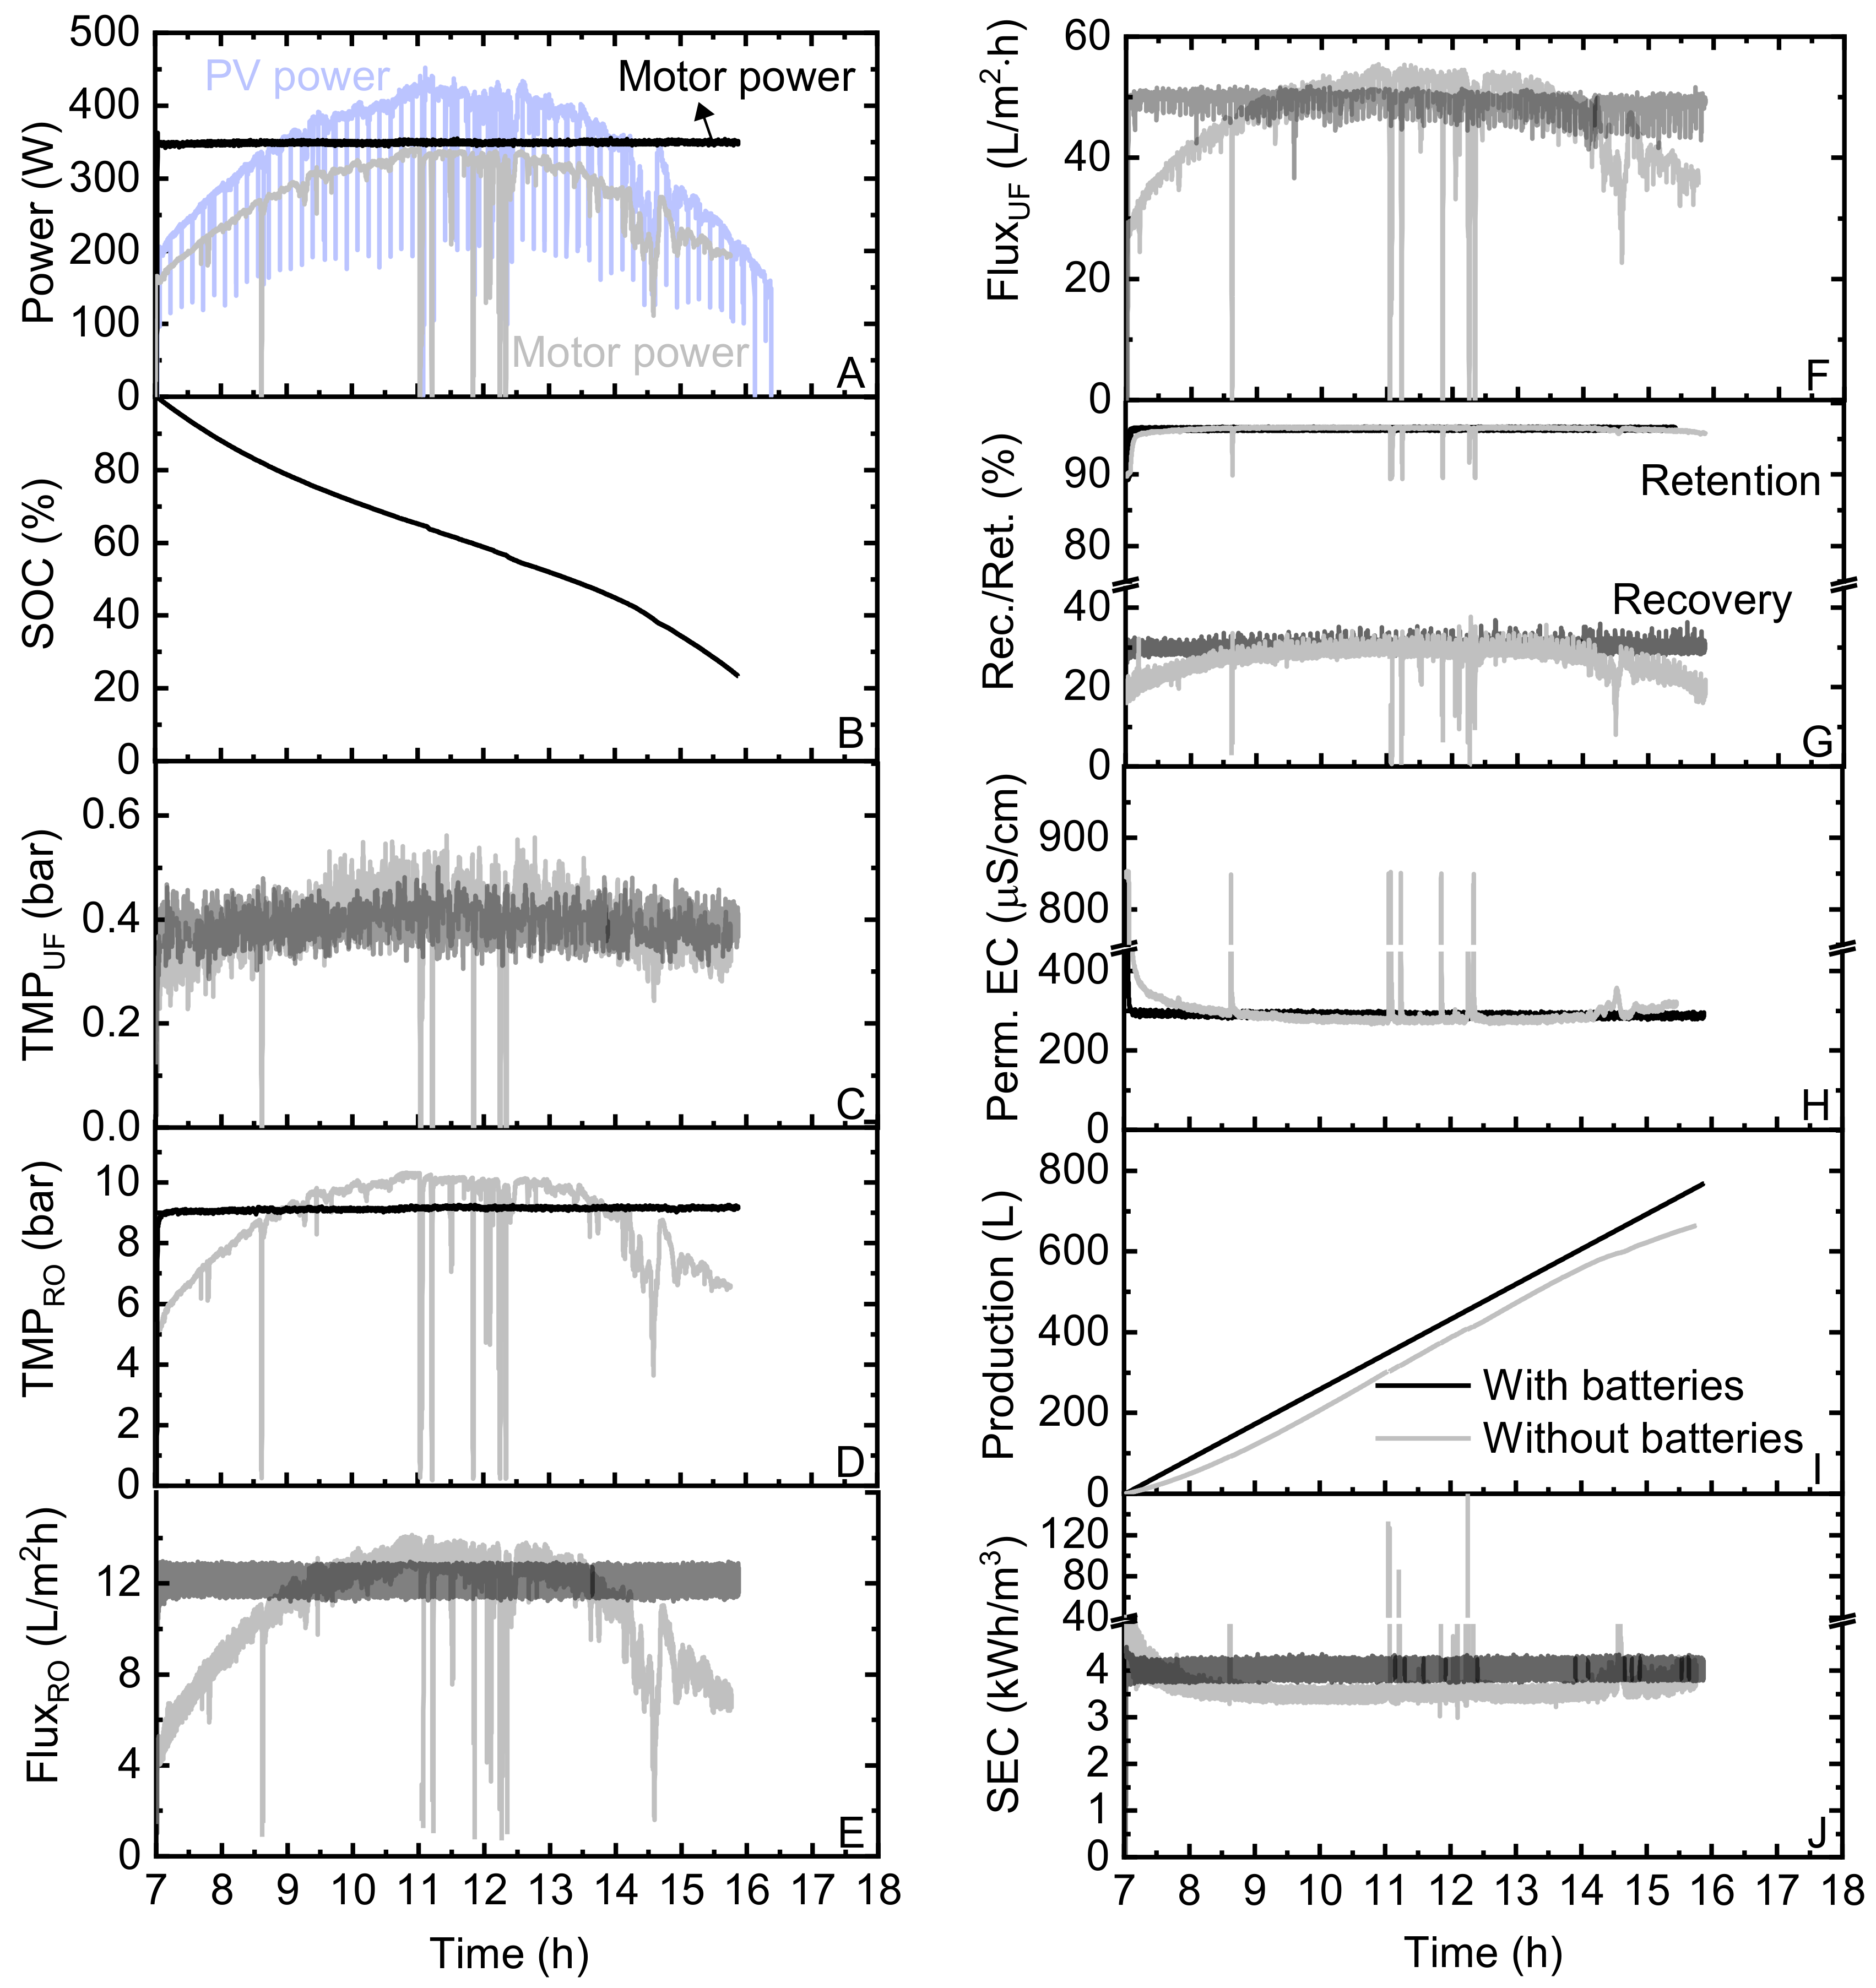
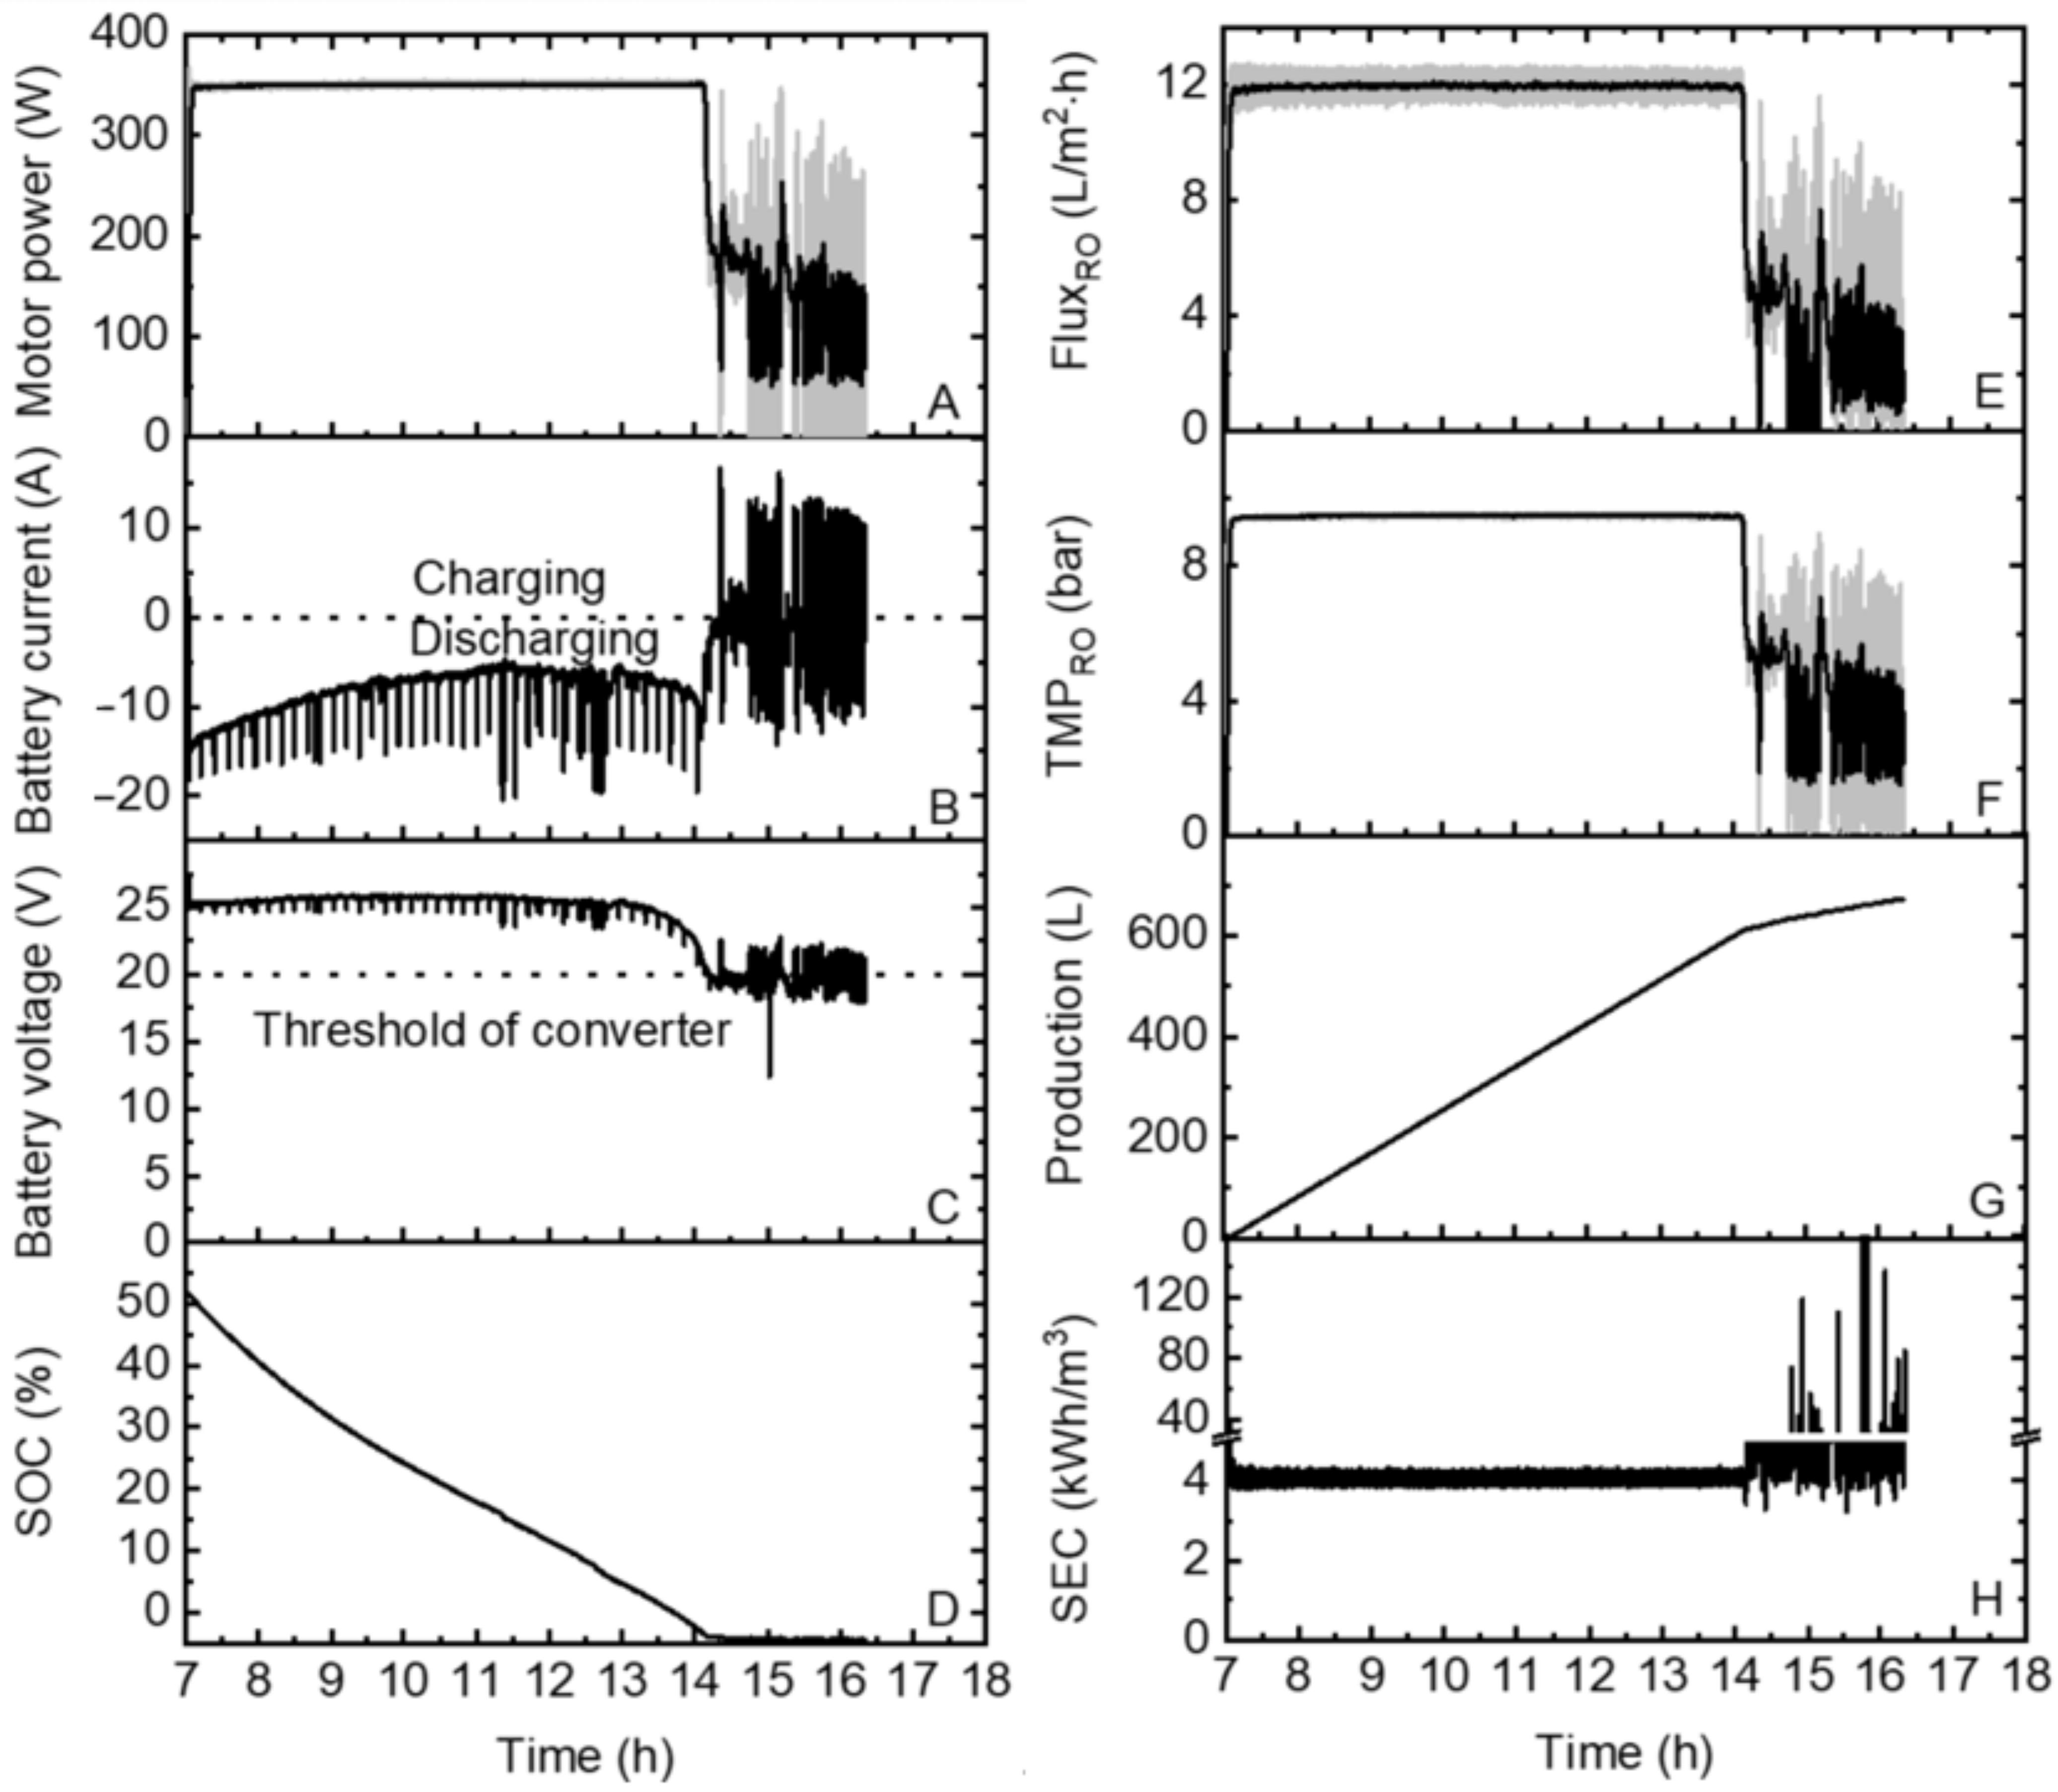
3.1. Operation Carried out on the “Partly Cloudy Day” (With and without Fully Charged Batteries)

To demonstrate the effects of adding one day’s worth of energy storage to the water production and SEC to the PV-membrane system, comparisons of the system performance on the “partly cloudy day” were performed as shown in Figure 3. When batteries were used, the motor power consumption remained constant around 350 W throughout the entire period (Figure 3A, black curve). This is ~20 W higher than the motor power when no batteries were implemented in the system during the middle of the day (Figure 3A, grey curve). This occurred, because the pump was always seeking to extract the desired current from the power source (both PV and batteries). Hence, the discharging current of the batteries was added to the PV current to supply the pump. As a result, the batteries were discharged continuously throughout the day, resulting in the drop of the SOC from 100% to 20% (Figure 3B). Comparing the maximum PV output power (light blue in Figure 3A) and the pump power, this resulted in ~50 W power losses in the additional electronics—namely, the batteries (efficiency of 96% [65]), DC/DC converter (efficiency of 88% [69]) and charge controller (efficiency of 98% [70]). This resulted in a total efficiency of power delivery to the pump motor of 83%. A further reason for high power consumption is that the motor is supplied with a constant voltage of 48 Vdc when connected to batteries. This relatively low voltage limits the ability of the pump motor to start [71] and also draws a higher current, which, in turn, reduces the motor efficiency further and results in greater resistive losses.
As a result, the low system efficiency leads to a low TMPRO and, hence, a RO flux (black curve in Figure 3C,D). In comparison, the TMPRO and RO flux (grey curve in Figure 3C,D) followed the same trend as the changes in the SI when the system was operated without batteries. This is due to the driving force that change with the variations of the SI for the desalination process by providing the hydraulic pressure needed to overcome the osmotic pressure of the feedwater, hence affecting the recovery and retention that are controlled by a mass transfer at low pressure (grey curve in Figure 3E) and ultimately result in fluctuations in the permeate EC (grey curve in Figure 3F) and SEC (grey curve in Figure 3H).
Further, it can be seen from the weather conditions on the “partly cloudy day” that the motor power (grey curve in Figure 3A) directly followed the changes in SI when no batteries were deployed. It dropped to 0 W several times during periods of fluctuations and intermittency due to the lack of energy from the PV panels, resulting in system shutdowns. The impact of adding batteries was clearly reflected in the TMP and flux (black curve in Figure 3C,D), where the operation was very constant due to the fact that power could be drawn from the batteries continuously throughout the day. Overall, the recovery of ~30% (Figure 3G) resulted in an average permeate EC of 294 µS/cm (Figure 3H (World Health Organization guideline value of 1000 mg/L (1700 µS/cm) [72]) and SEC of ~4 kWh/m3 (Figure 3J).
Another concern for the system operations is the potential brine disposal, which is a crucial environmental issue and, in more concentrated seawater applications, may comprise up to 33% (worst case) of the total cost of the seawater desalination process [73]. In large-scale seawater desalination plants, brine is commonly discharged into the sea, with costs ranging from US$ 0.05/m3 to US$ 0.3/m3 [74,75], causing significant environmental issues on marine ecosystems [73]. In small-scale brackish water desalination plants, brine can be discharged into the sewer system (if available), with disposal costs between US$ 0.3/m3 and US$ 0.7/m3 [74,75]. For inland plants, deep-well injection and evaporation ponds are suitable brine disposal choices, with a wide range of costs (US$ 0.5–10/m3) [74,75], respectively. Land applications are mainly used for low brackish water brine volumes, as well as the availability of suitable land and groundwater conditions, which cost in the range of US$ 0.7–2/m3 [74,75]. In this work, the relatively low recovery of low-pressure RO or NF membranes assures a low salinity concentrate stream, and the possibilities for using the disinfected waste stream for washing and livestock watering can result in zero concentrate generation, depending on the feedwater quality [58]. A general guide for groundwater salinity and stock tolerances in South Australia has been reported [76]. For example, it is noted that the requirements to maintain the conditions of sheep and beef cattle are up to 21,600 and 8300 µS/cm, while the maximum values for health growth are 10,000 µS/cm and 6700 µS/cm, respectively [76]. Hence, a concentrate stream can be used for these purposes when the value remains at a level below these limits. In summary, fully charged batteries enabled an increase of production by ~16%, from 664 to 767 L/d, with the water quality also improving by just over 3%, from 304 to 294 µS/cm. The average parameters are summarized in Table 1 in Section 3.3.

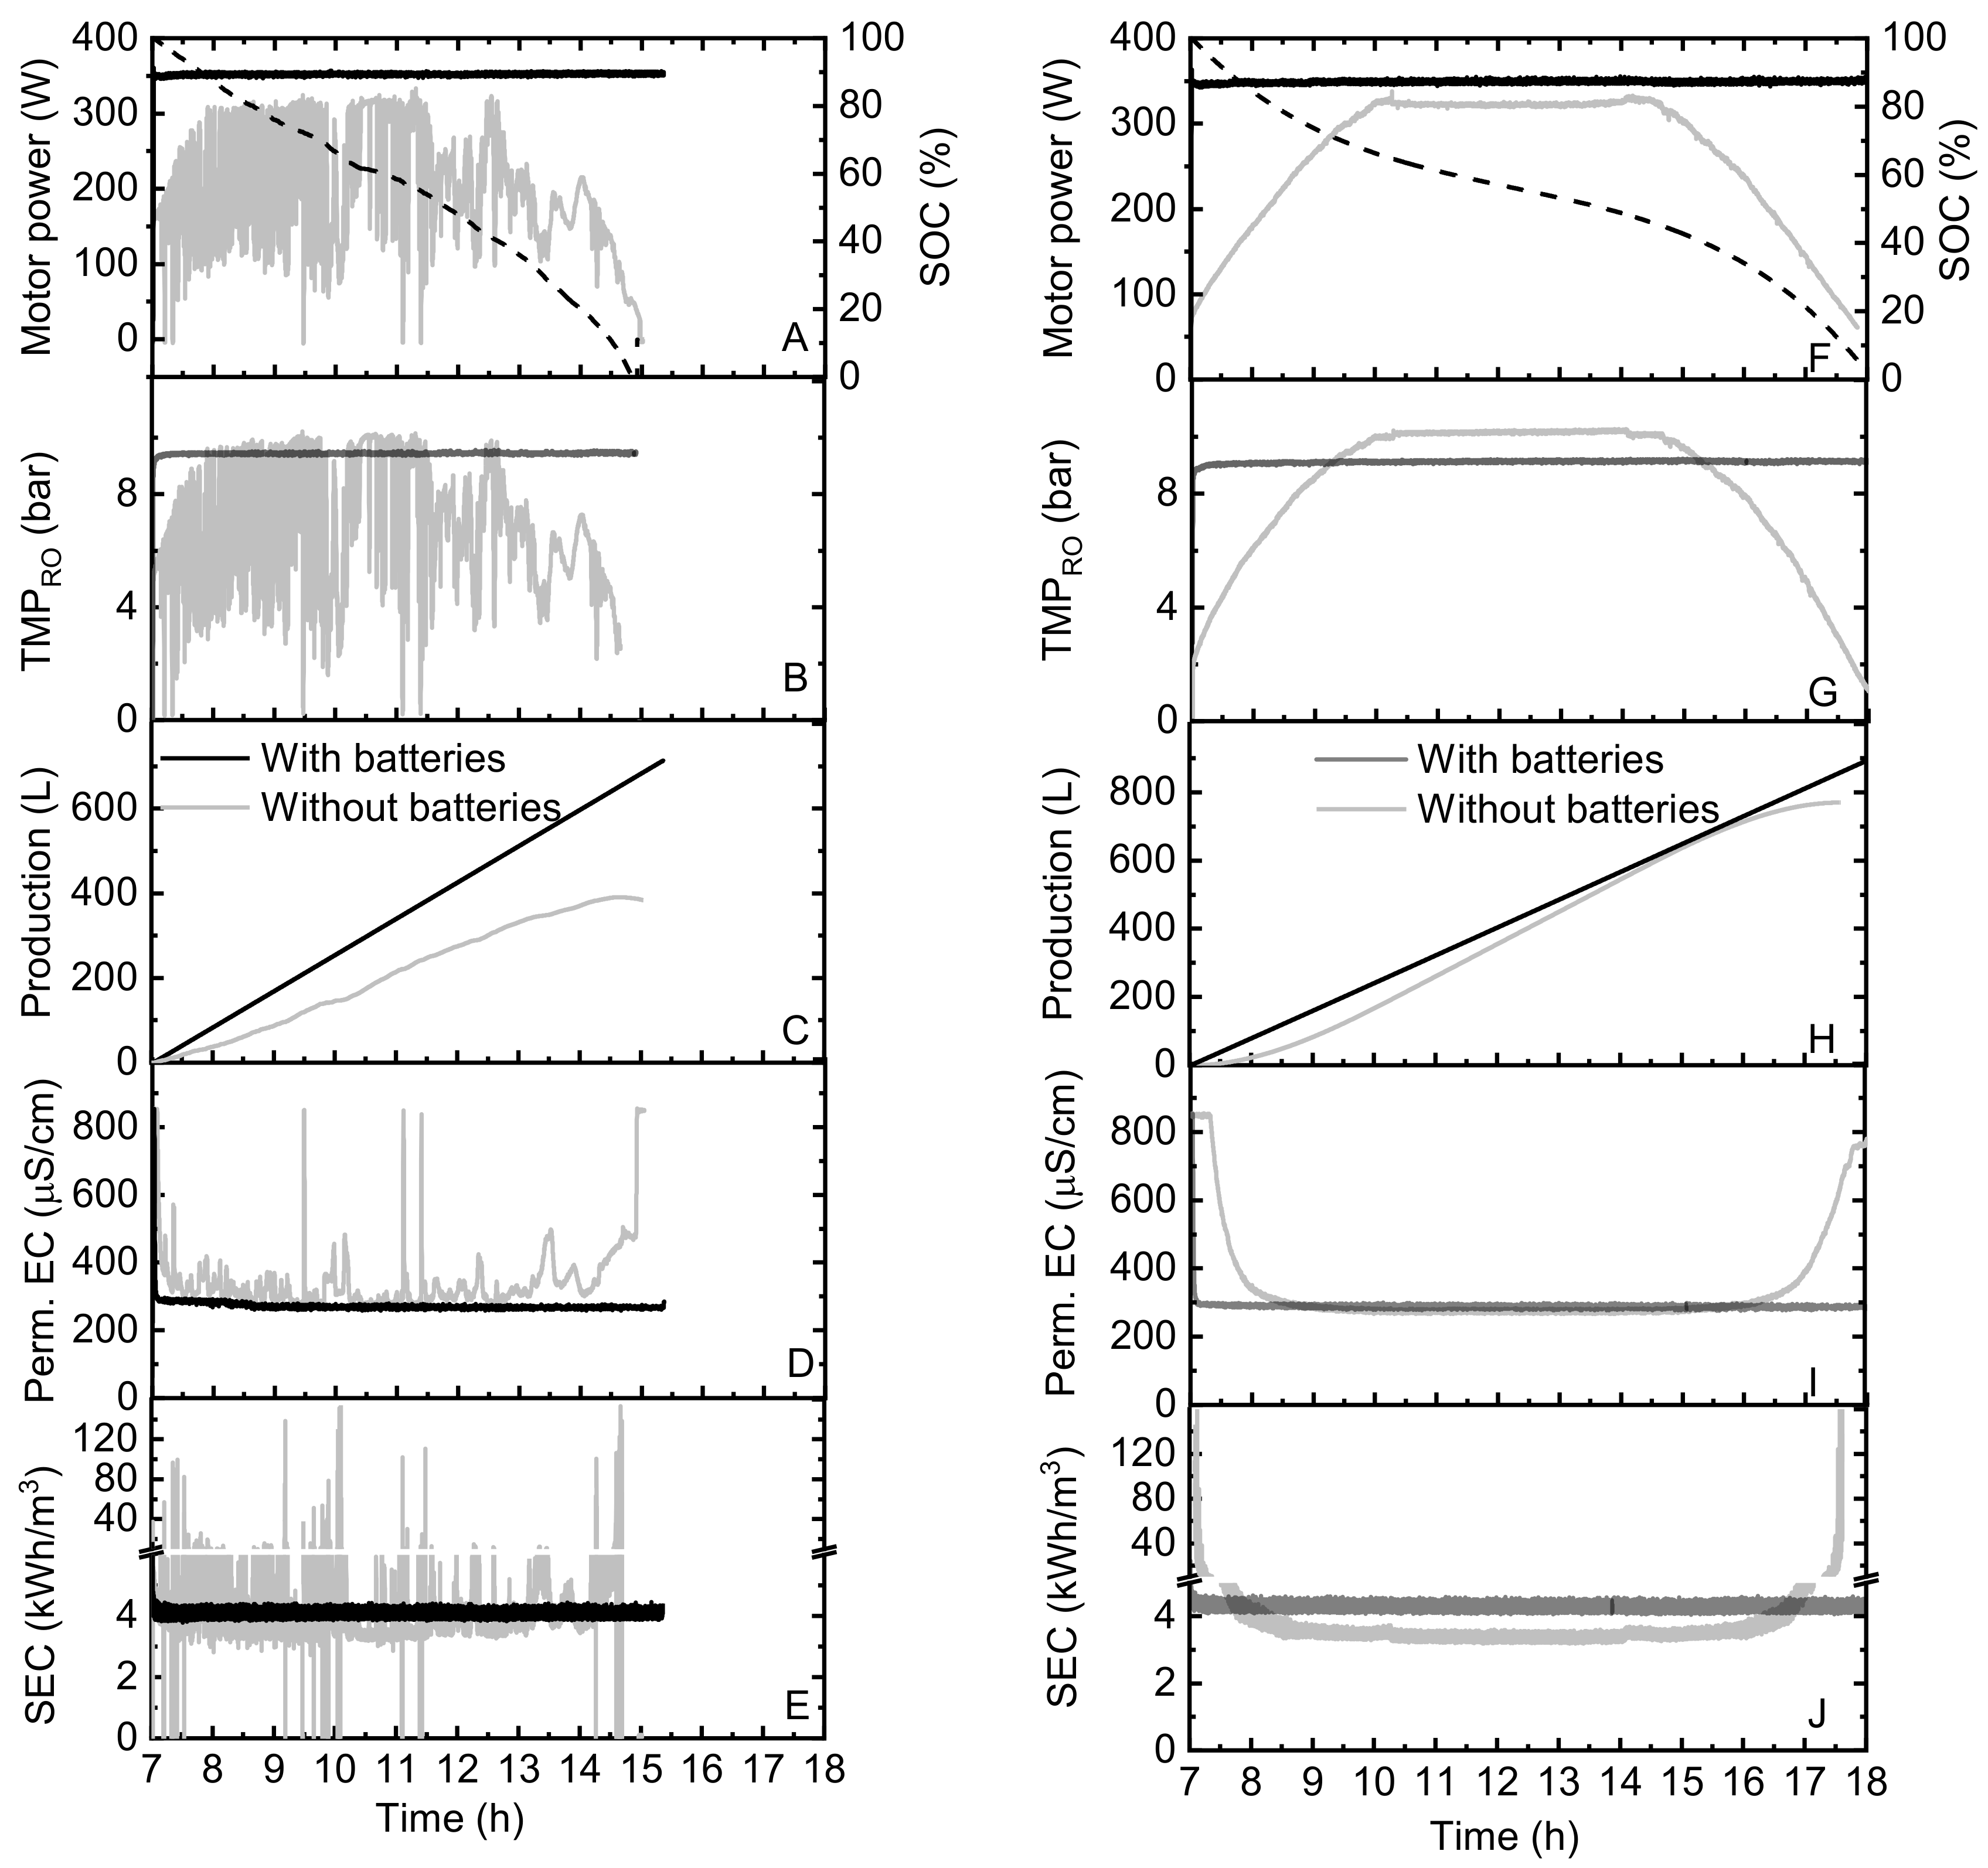
3.2. Operations on Other “Solar Days” (With and without Fully Charged Batteries)

The aim of this section is to investigate the effects of very different solar radiation conditions on the system performance, again both in the directly coupled configuration and with fully charged batteries. Figure 4 indicates the cumulative permeate water production and permeate EC and SEC of the PV-membrane system over the “very cloudy” and the “sunny” days. From the top two graphs of Figure 4, it can be seen that, when incorporating the batteries into the system, the motor power was maintained constantly at 350 W throughout the day, despite two different weather conditions (Figure 4A,F). This was ~20 W higher than the motor power without batteries present in the system during the middle of the day. This is for the same reasons as discussed in the previous section, 3.1 (Figure 3A). When comparing the values at which the motor power is saturated with that from the “partly cloudy day”, it was observed that the saturation in Figure 4A,F was more pronounced. It can be found that the saturation occurred at a SI > 800 W/m2, where the shortest duration appeared on the “partly cloudy day” (see Figure 2B). Furthermore, a high temperature (above 40 °C; see Figure 2C) also resulted in a low PV voltage (~10 V lower when reaching saturation), hence reducing the power input to the pump (see Figure 2).
On the “very cloudy day”, the performance with batteries improved as follows: production increased by 81% from 395 to 714 L/d, the average permeate EC was improved by 27% from 347 to 274 µS/cm and the average SEC was reduced by 17 % from 4.8 to 4.1 kWh/m3 as well. Again, the average parameters are summarized in Table 1 in Section 3.3. Additionally, on the “sunny day”, as is shown in Figure 4H, it was noted that the permeate production without batteries was lower in the morning due to the low SI; then, it approached the same level as the case with the batteries at 4:00 p.m. This occurred during the time periods (9:30 to 15:15) when the TMPRO without batteries exceeded the TMPRO with batteries (see Figure 4G). This is due to the fact that the directly coupled PV-membrane system exhibited a higher efficiency, as discussed above, thus producing a much higher permeate for most of the day (from 9:30 to 15:15) at SI > 800 W/m2. Amongst these three “solar days”, the SEC with batteries on the “sunny day” exhibited the highest value. This occurred as the high-average SI was capable of providing a higher current to the pump from the PV and a small current from the batteries, hence slowing down the discharging rate of the batteries (a fraction of ~20% of the current supplement to the pump when the SI reached the maximum value during the middle of the day). Thus, the batteries played a minor role in producing sufficient permeate throughout the day, but losses were still encountered, resulting in an increase of the SEC. It indicated the likelihood of system redundancy by involving an additional device. The performance on the “sunny day” indicated that the water production increased from 770 to 892 L/d, the permeate EC improved from 353 to 290 µS/cm and the average SEC increased from 4.0 to 4.3 kWh/m3. This represented an improvement in the water production by 15.8% and average permeated EC by 17.8%, respectively (see Table 1 in Section 3.3).
From the operation of the system with/without batteries over the three different days, it can be concluded that batteries play a significant role in smoothing fluctuations and intermittency, reducing shutdown events of the pump and improving the water quantity and quality. These results are not surprising, given the fact that Li-ion batteries exhibit a high efficiency and energy intensity. Nevertheless, the main drawback was the expense of increasing the cost of the system due to its special packaging and internal overcharge protection circuits, which ultimately affected the cost of the water (discussed in Section 3.4). This is anticipated to reduce over time as the technology matures.

3.3. Operation with Different Energy Storage Capacities

The next task was to evaluate the impacts of different energy storage capacities—realized by varying the initial SOC of the battery bank—on the PV-membrane system performance when operated throughout the “partly cloudy day”, with a particular focus on the SEC and permeate production. The results can be seen from Figure 5, which starts with the batteries at an initial SOC of 50%. The batteries were capable of providing full power to the pump for 7 h 20 min (see Figure 5A) before reaching the limits of their capacities. Thus, after 14:00, the pump was directly subjected to the fluctuations in the SI and repeated attempts at charging and discharging of the batteries. This was compared to a pump that was operated at full power for 9 h 20 min with fully charged batteries (see Figure 3A). As indicated in Figure 5B, a positive current value represented the PV-membrane system source current via photocurrent generation (Ipv), while a negative current occurred during the discharging of the batteries. From the beginning of the day until around 14:00, the batteries were discharged continuously at a maximum current up to 20 A (see Figure 5B). This corresponded with the decline of the SOC to 0% at 14:15 (Figure 5D). Subsequently, oscillations occurred due to the batteries reaching the lower threshold of DC/DC converter (20 V). Then, the PV membrane started charging the batteries and caused the shutdown of the pump. These power fluctuations were encountered due to the charge controller not being able to power the pump and charge the batteries simultaneously, indicating a system shortcoming that needs to be improved for future research. The flux and TMP of the RO membrane followed the same pattern as the pump discussed above (see Figure 5E,F). Overall, the system produced 669-L permeate, which was comparable with the production (663 L) when the system was operated without batteries. The SEC was increased by 15.9% from 3.7 to 4.0 kWh/m3. Hence, it is recommended to use batteries with an initial SOC > 50% (energy capacities > 1.2 kWh) to further enhance the water quality and quantity.
The impacts of different energy storage capacities (varied SOC) on the PV-membrane system—in particular, the average SEC and water quality and quantity—are presented in Figure 6. It can be clearly seen that the water production declined with the decrease of the initial battery SOC (see Figure 6A). Compared to the reference, the increase of the water production started at an initial SOC > 50%. The average permeate EC was less affected by the SOC (see Figure 6B) due to the dense membrane with high retention (BW30) used in these experiments. The SEC (see Figure 6C) was increased with the decrease of the SOC, indicating that the lower SOC reduced the flux and increased the SEC. It is perhaps intuitive that the SEC is expected to return to the state of the reference case after the batteries are empty. However, this will only happen when the batteries are no longer coupled with the pump so that they do not have the same voltage potential, avoiding the repeatable attempts of the charging and discharging behaviors.
The remaining performance graphs of the PV-membrane system in terms of the varied initial SOC (70%, 40%, 30% and 20%) are provided in Appendix A (Figure A2, Figure A3, Figure A4 and Figure A5) for further comparisons. In order to have a clear overview of the system performance when batteries are present in terms of the varied energy storage capacities over the three “solar days”, the overall average performance values are summarized in Table 1. The improvements of the production and water quality were discussed above. The SEC of the reference exhibited the highest value on the “very cloudy day”, which is likely attributed to (i) the flux decreasing instantaneously with a significant reduction in the power input due to large fluctuations of the SI (not shown in graphs), (ii) the reduction of the flux to 0 L/h·m2 due to insufficient effective pressure for producing permeate and (iii) several shutdown events occurring due to insufficient power to achieve the system pressure, which resulted from large variations of the SI, hence causing the slow recovery (resilience) of the system to be able to produce adequate permeate due to the input power discontinuity [77]. The average retention and permeate EC indicated no big differences, due to the tight membrane with high retention used being more resilient to variations in the permeate quality [77].
Once batteries were added, the influence of changing the energy capacity (varied initial SOC from 100% full down to 20% full) on the “partly cloudy day” became more apparent. The permeate production gradually increased from 402 to 767 L due to the pump drawing the power through the batteries and PV source, enabling the pump to run at full power during the entire period. This can be seen from the full-power duration that is shown in Table 1. On the contrary, the average SEC declined from 4.8 to 4.0 kWh/m3 as the system spent more time operating on full power. The average values of the RO flux exhibited the same trends as the permeate production. When comparing the SEC with fully charged batteries and the directly coupled reference case, it was found that, for the “sunny” and “partly cloudy” days, the reference SEC was lower than with the batteries. However, for the “very cloudy day”, the reference SEC was significantly higher. This underlines the role of incorporating Li-ion batteries to gain more permeate as a result of providing constant power vs. the additional power that the pump consumes in terms of the fluctuations in the SI. It highlights the design of systems with a focus on energy consumption and the enhancement of the water quality and quantity, which can be achieved at the expense of system efficiency and the potential of underutilizing the energy storage units.
From the experiments conducted above, it can be seen that further improvements of the charge controller to avoid power fluctuations need to be carried out. For example, a buck-boost converter needs to be designed to control the bidirectional power from the PV and batteries to improve the system performance. Moreover, the system performance can be improved by connecting the batteries in a series to have a higher voltage output (48 Vdc), eliminating the need of the DC/DC converter, as the pump indicates a wide operating voltage range (30~300 Vdc). In this case, the lower limit voltage of the batteries was not constrained at 20 V, which avoided repeatable charging and discharging behaviors. Further, the power loss was reduced due to less electronics deployed in the system. The minor disadvantages are: (i) this battery configuration increases the failure rate if one battery is dysfunctional, resulting in a voltage collapse and the battery pack turning off [78], and (ii) careful cell matching is required for connections in a series, especially when drawing heavy loads [78]. Therefore, a trade-off between a robust long-term system operation and performance needs to be determined.

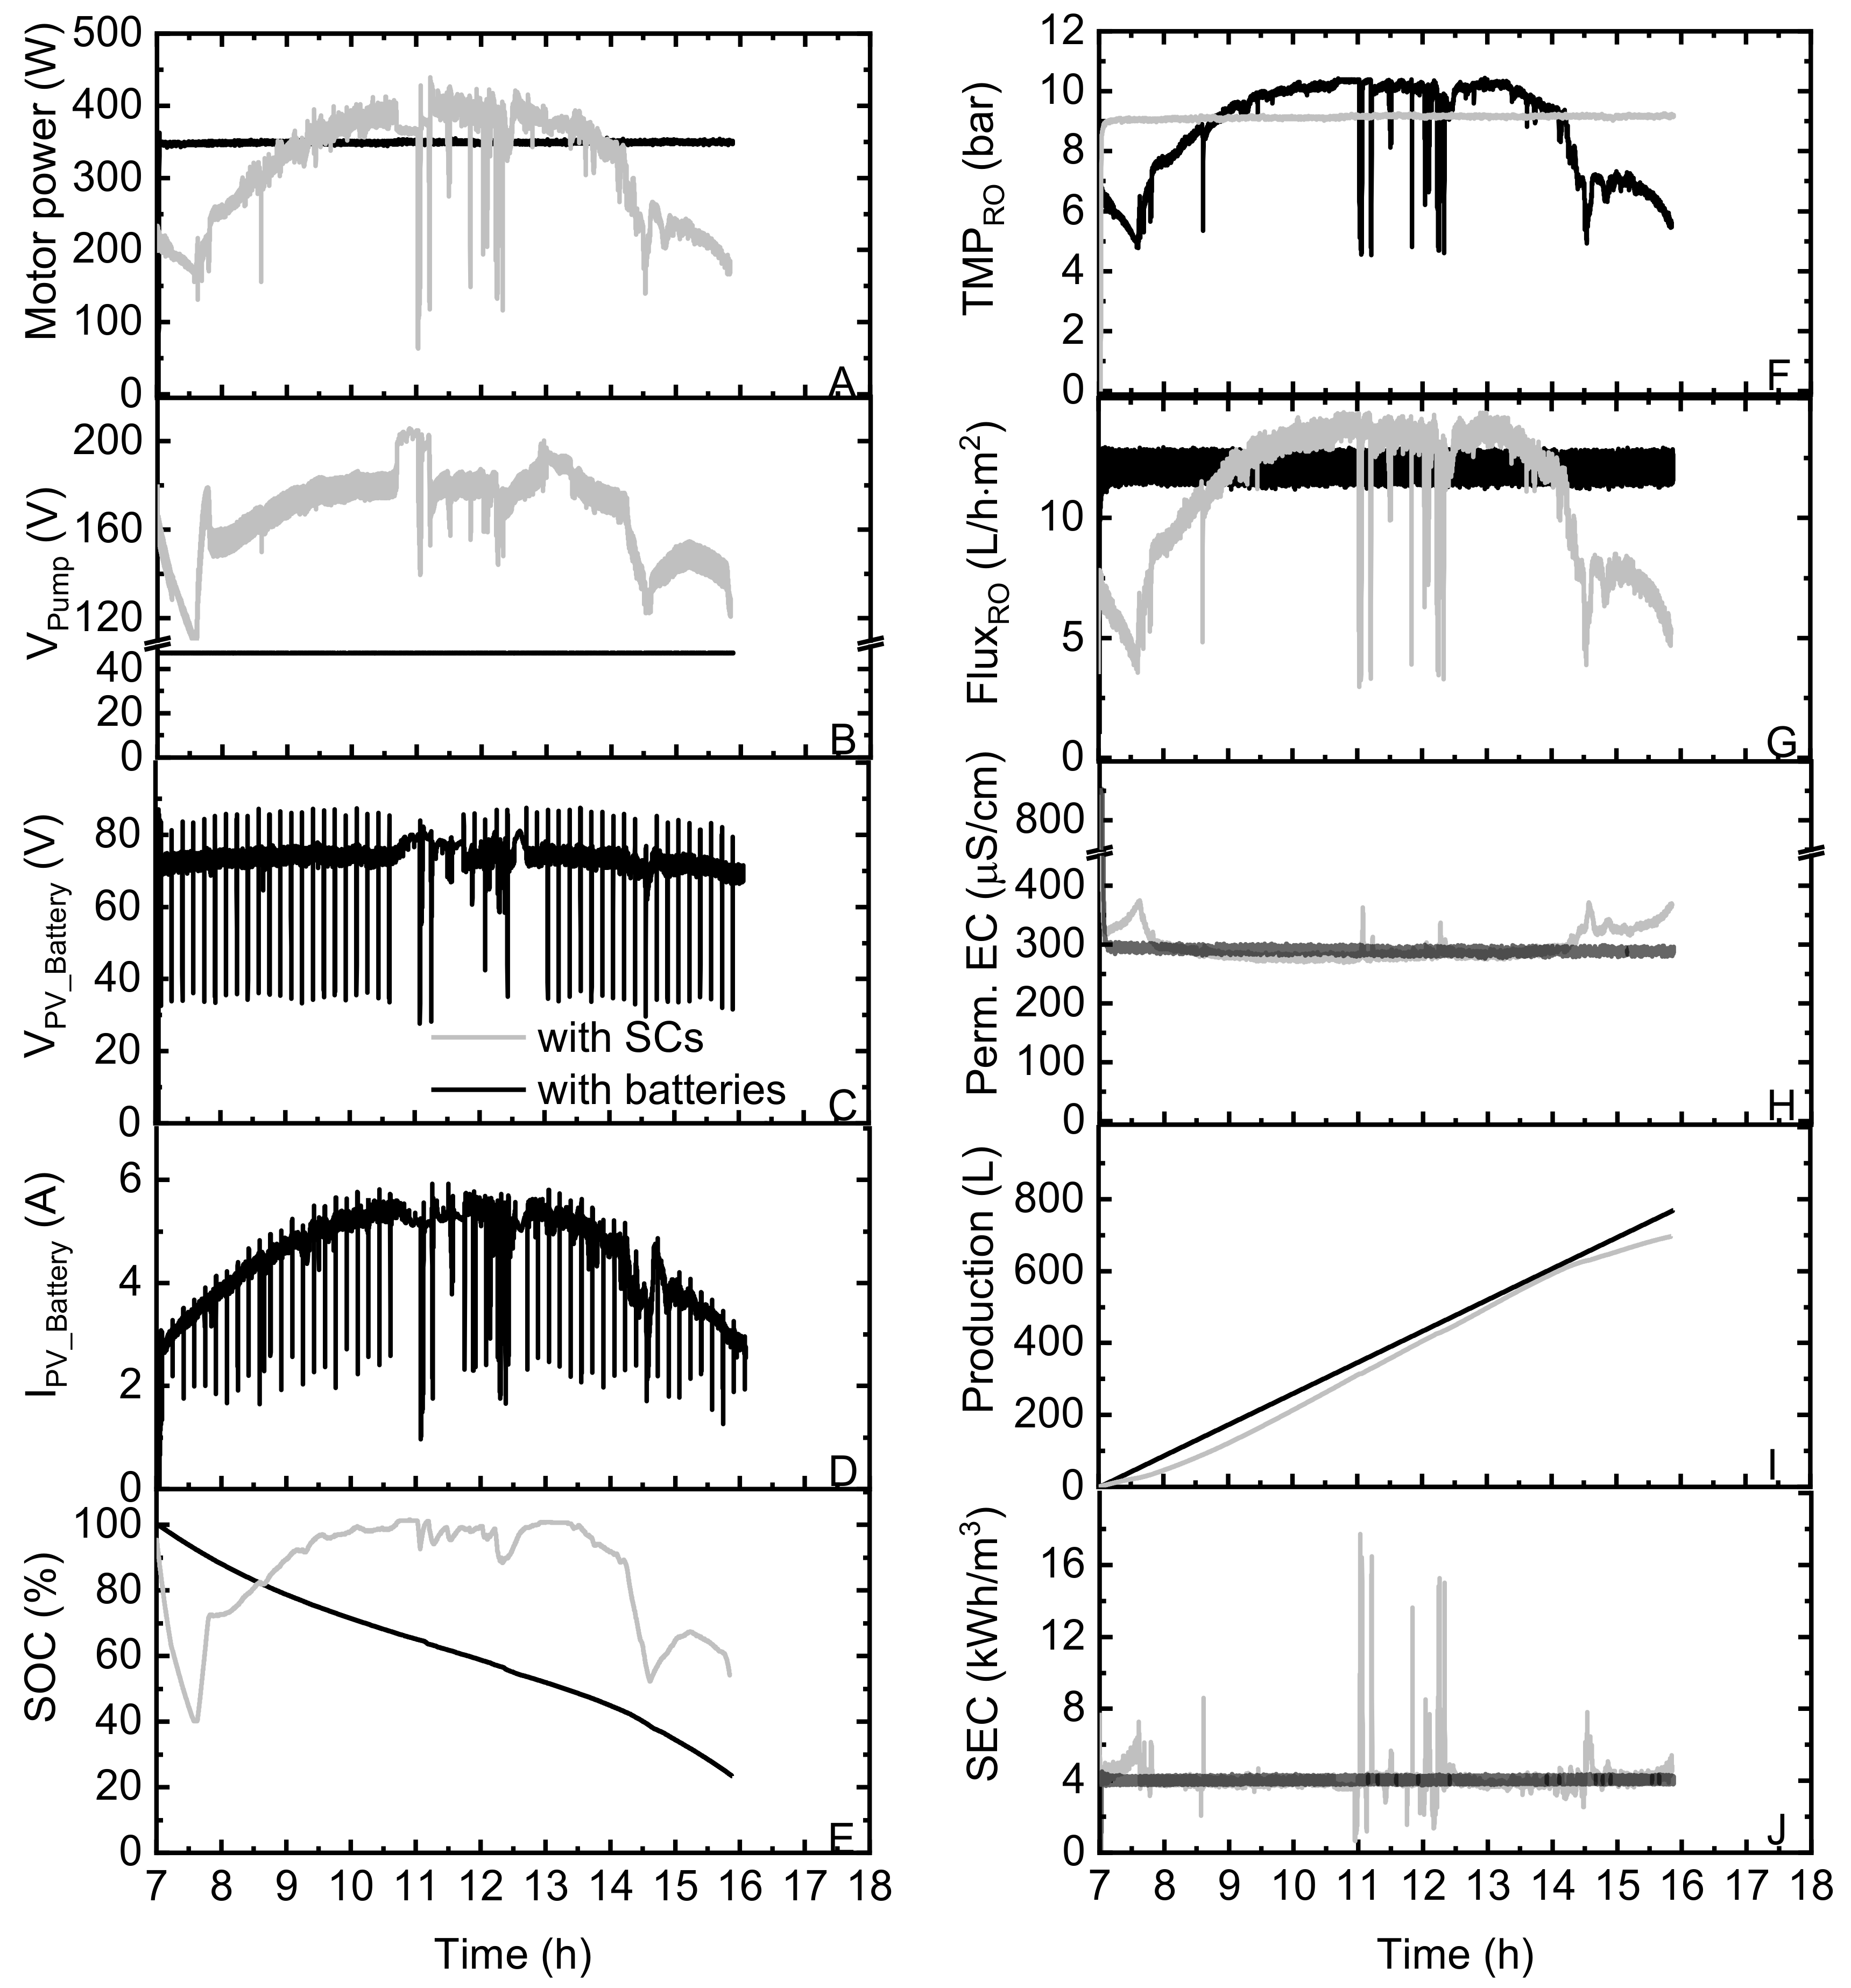
3.4. System Performance Comparisons of Batteries and SCs

The final important result can be drawn from the comparisons of the system performance when equipped with batteries or SCs, as indicated in Figure 7. It is worth noting that these two system setups have the same PV power rating (500 W), but the PV voltage settings are different due to the voltage constraints between the SCs and batteries (discussed in Section 2.6).
The power consumption of the motor pump with batteries remained constant around 350 W (black curve in Figure 7A), as in the previous experiments discussed above. The pump with batteries worked at a constant voltage of 48 Vdc (see Figure 7B), and the PV provided the photocurrent (see Figure 7D) to the pump as required. Meanwhile, the batteries were capable of providing a continuous current to the pump during the entire day (see Figure 7E) due to high energy storage capacity (2.4 kWh), whereas the motor power with SCs largely followed the changes in the SI trend (plotted earlier in Figure 2). This is due to the fact that the pump with SCs operated in terms of the PV voltage (controlled by preset voltage thresholds, as discussed in Section 2.6; see grey curves in Figure 7C) and mainly extracted the current from the PV, hence resulting in a higher power consumption of the pump. In addition, a PTC lamp was connected in a series with the pump to increase the inner resistance, which buffered the sudden changes caused by the built-in MPPT between the SCs and SAS (with the resistance values throughout the day provided in Figure A7). However, this was at a cost of an average power loss of ~50 W on this solar day. As indicated in Figure 7E, the SCs were discharged promptly at the beginning of the day. During the periods of 11:00 to 12:30, when large fluctuations occurred, the SCs started discharging to the pump for energy buffering, with the SOC dropping to ~85%, which was limited by the preset voltage threshold settings (Vcharging_off) to prevent deep discharging of the SCs, and hence, a big voltage drop of the pump can be avoided. This was implemented on the charge controller settings, as the pump always extracts the maximum power from the power sources (both PV and SCs); consequently, the SCs cannot step in for energy buffering when encountering the next large fluctuation. As a result, the pump with SCs worked continuously (no shutdown events), despite the occurrence of large fluctuations. The benefits of eliminating the shutdown events were reducing the potential damage to the pump and RO membrane [79], as well as improving the permeate water quality and quantity [30].
The desalination performance of the PV-membrane system was determined by the SOC of the energy storage components, which were dependent on the availability of the power from the PV. The TMPRO (Figure 7C), which was the driving force, determined the RO flux (Figure 7E) and permeate EC (Figure 7F). Furthermore, as the permeate production with SCs approached the same value as the batteries (see Figure 7G), it indicated that the system with SCs produced much higher permeate for most of the day. The SEC with batteries was much lower than the value with SCs, suggesting that less energy was required to produce a unit of clean water. When compared to the directly coupled system without SCs (see Figure A6), the use of SCs to buffer those fluctuations resulted in a 9% increase in water production and 13% improvement in the SEC. As discussed in Section 3.1, the improvement of the batteries was due to the improved power quality supplied to the membrane system as a result of providing energy and constant power over the entire day. The water quantity increased by 16% with the Li-ion batteries (energy capacity of 2.4 kWh) when compared to the reference. It can be anticipated that there is a region where the Li-ion batteries overlaps with SCs if the batteries have small capacities (such as ~1 Ah providing five min of power to the system). Therefore, it is recommended to employ Li-ion batteries instead of SCs as energy storage units in this PV-membrane system due to their high energy intensities, charge/discharge cycles and reduced costs per kW.
It is intuitive that increasing the size of the energy storage units would provide power for longer periods of fluctuations. This would be a trade-off between the benefits of increasing the storage time vs. the added cost of the energy storage capacity. As indicated in a recent report, the capital cost of SCs was estimated to be relatively stable at US$ 1600/kWh [80]. The cost of Li-ion batteries reached US$ 135/kWh in 2020 and is projected to fall below US$ 100/kWh in 2024. This was attributed to the technological advancements and economies of scale [81]. The operation and maintenance (O&M) costs of the SCs were ~US$1/kW-yr [80], while the O&M costs of the Li-ion batteries were in the range of US$ 6-14/kW-yr in 2017 [82], with further cost reductions anticipated, to attain US$ 8/kW-yr by 2025 [80].
Further work is required to (i) choose a better version of the charge controller for batteries with high voltage outputs, such as 48 Vdc, (ii) sense the preset voltage slopes for the charge controller to avoid the prompt discharging of SCs at the start of the day and (iii) examine the effects of integrating Li-ion batteries and SCs on the PV-membrane system performance and the overall improvements in water quality and quantity. An energy management system is required to distribute the energy flow among the pump, batteries and SCs to provide higher water quality and quantity.

4. Conclusions

The suitability of two different electrical energy storage options—Li-ion batteries and SCs—to improve the water quantity of a PV-membrane system was investigated and compared to a battery-less performance. The tests with/without energy storage were conducted under varied weather conditions using high-temporal-resolution (one-s) SI data. The addition of one day’s worth of energy storage (2.4 kWh) Li-ion batteries enabled the full-power operation of the pump for 8–11 h over the three “solar days”, which exhibited different levels of fluctuations in solar irradiance. Consequently, the fully charged batteries allowed a 15–80% increase in the permeate production and a 3–27% increase in the permeate quality. The average permeate quality with/without Li-ion batteries all fulfilled the WHO guidelines, which highlights the good system design and appropriate choice of membrane and PV array sizing. In particular, the effects of varied energy storage capacities on the PV-membrane system on the “partly cloudy day” were investigated. It was found that the improvement of water production occurred at an initial SOC higher than 50% (energy capacity of 1.2 kWh), while the lower initial SOC and, therefore, the low energy storage capacity caused a system shutdown after fully discharging due to repeated attempts of charging and discharging behaviors. Finally, the system performance comparisons on the “partly cloudy day” between the additions of Li-ion batteries and SCs were studied. The use of SCs for short-term energy buffering resulted in a 9% increase in water production and 13% improvement in the SEC. This was compared with Li-ion batteries for providing long-term power, which resulted in a 16% increase in water production and an 8% increase in the SEC.
In summary, Li-ion batteries are an interesting energy storage option for PV-membrane systems, due to their high energy intensity, large number of charging/discharging cycles and their steadily decreasing costs. When considering long-term system operations for periods up to 20 years in remote regions, the option of oversizing the PV array and allowing for a directly coupled PV-membrane system potentially offers a more reliable solution. Further investigations on this sizing approach and the associated life cycle costs need to be carried out. Moreover, the option of combining SCs and Li-ion batteries should be examined, which would enable the short-term delivery of large amounts of power (buffering) and longer-term energy storage. This approach would require further research and development on a suitable energy management system to distribute the energy flows required.

Author Contributions

S.L.: conceptualization, methodology, software, formal analysis, investigation, data curation, writing—original draft preparation and visualization; A.P.S.G.d.C.: conceptualization, methodology, software, investigation and data curation; A.I.S.: conceptualization, methodology, validation, resources, writing—review and major editing, visualization, supervision, project administration and funding acquisition and B.S.R.: conceptualization, methodology, formal analysis, validation, investigation, resources, data curation, writing—review and major editing, visualization, supervision, project administration and funding acquisition. All authors have read and agreed to the published version of the manuscript.

Funding

This research received funding for equipment from the Helmholtz Association.

Institutional Review Board Statement

Not applicable.

Informed Consent Statement

Not applicable.

Data Availability Statement

The data presented in this study are available on request from the corresponding author.

Acknowledgments

The Chinese Scholarship Council (CSC) is acknowledged for the provision of a PhD scholarship for SYL. The Karlsruhe School of Photonics (KSOP), Science and Technology of Nanosystems (STN) and Helmholtz are thanked for sponsoring the equipment. James Barry (formerly from Project Competence E) is thanked for sharing the weather data from KIT Solar Park. DuPont Chemical Company is acknowledged for donating the UF membranes and RO modules. Bürkert is acknowledged for donating the pressure, flow and electrical conductivity sensors. Special thanks to Achim Voigt for valuable scientific discussions and Jürgen Benz for technical support.

Conflicts of Interest

The authors declare no conflict of interest.

Appendix A

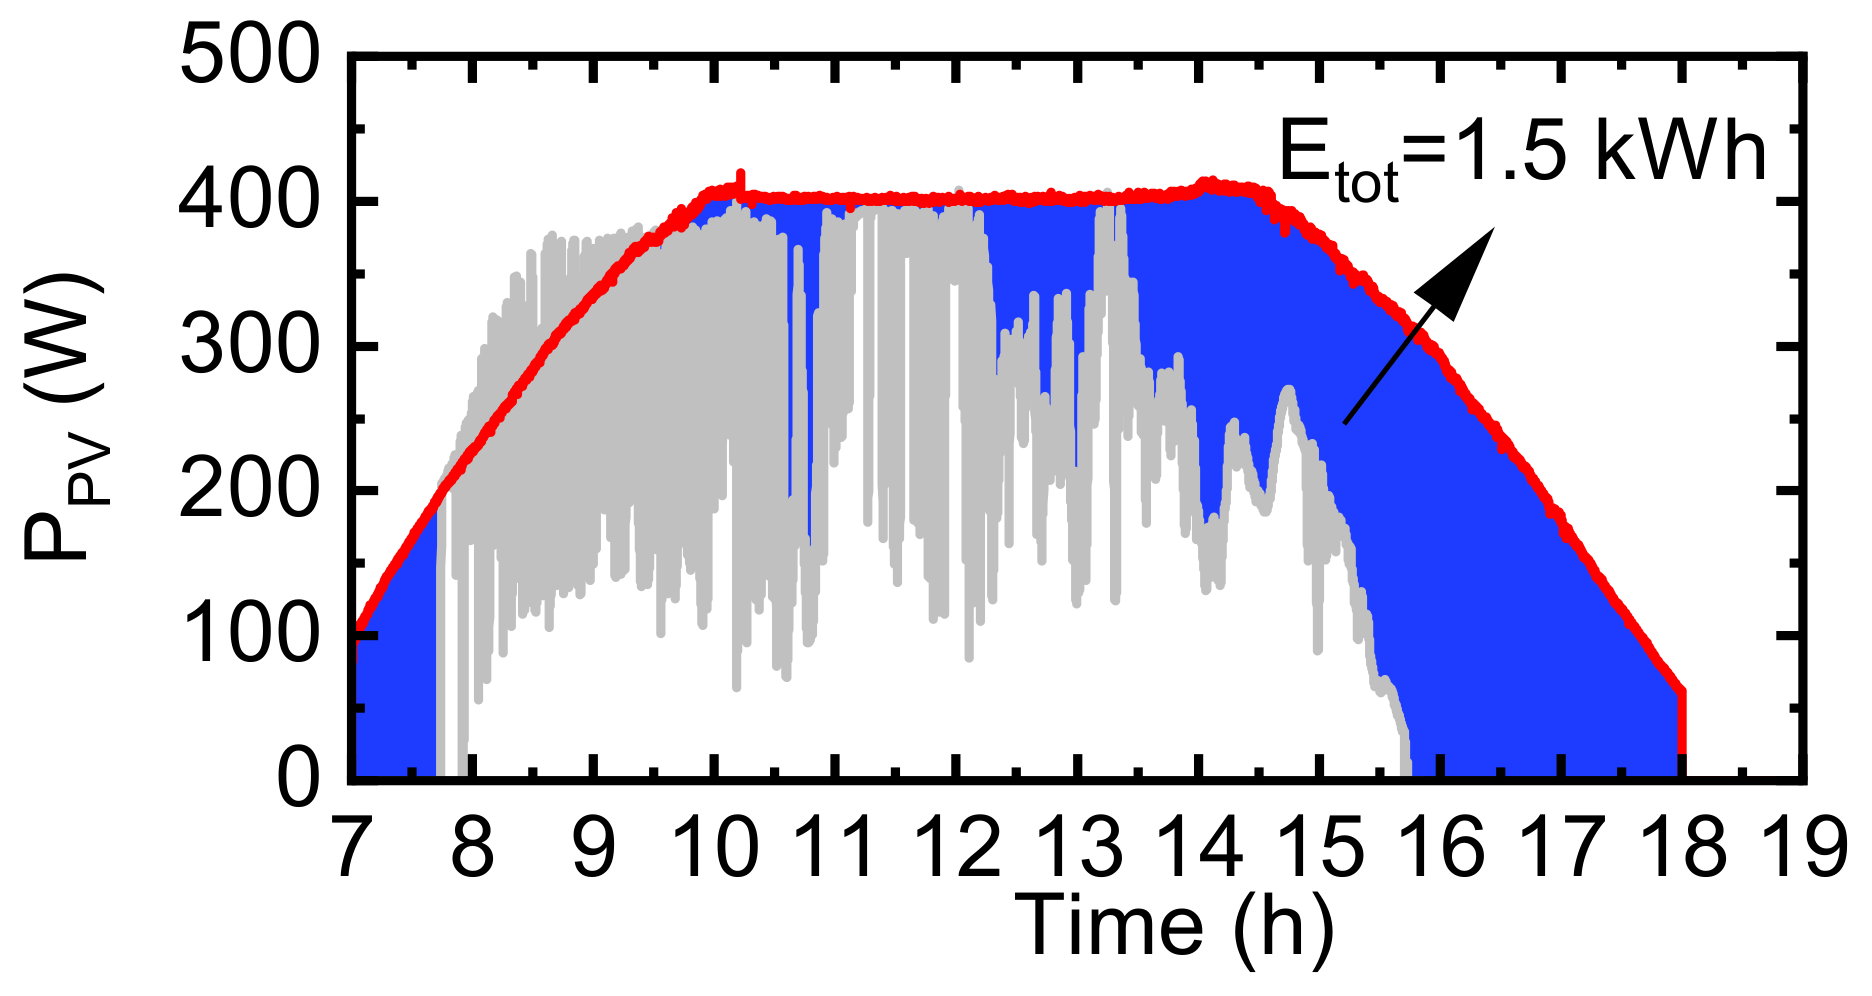
Appendix A.1. The Calculation of the Total Amount of Energy Required from the Batteries (Etot)

The Etot is the integrated area between the “very cloudy” and “sunny” days. This is used to estimate the amount of energy that needs to be supplied from the batteries to supplement the PV power generated under the worst-case conditions (the “very cloudy day”) and to increase this to the amount generated under the best-case conditions (the “sunny day”), as indicated in Figure A1.
Figure A1. Total amount of energy required (Etot) over the entire day, indicating the energy capacity required from the batteries.
Applsci 11 00856 g0a1

Appendix A.2. The Performance of the PV-Membrane System at 70% of the SOC on the “Partly Cloudy Day”

The additional performances of the PV-membrane system with the Li-ion batteries at a 70% SOC (energy capacities of 1.7 kWh) are presented here as supplementary results for Section 3.3.
Figure A2. The performance of the PV-membrane system on the “partly cloudy day” equipped with batteries at 70% SOC, indicating (A) the motor power, (B) battery current, (C) battery voltage, (D) SOC, (E) RO flux, (F) TMPRO, (G) production and (H) SEC. Note that the black curves on graphs (A), (E) and (F) are the moving average values of 10 points.
Applsci 11 00856 g0a2

Appendix A.3. The Performance of the PV-Membrane System at 40% of the SOC on the “Partly Cloudy Day”

The additional performances of the PV-membrane system with the Li-ion batteries at a 40% SOC (energy capacities of 1 kWh) are presented here as supplementary results for Section 3.3.
Figure A3. The performance of the PV-membrane system on the “partly cloudy day” equipped with batteries at 40% SOC, indicating (A) the motor power, (B) battery current, (C) battery voltage, (D) SOC, (E) RO flux, (F) TMPRO, (G) production and (H) SEC. Note that the black curves on graphs (A), (E) and (F) are the moving average values of 10 points.
Applsci 11 00856 g0a3

Appendix A.4. The Performance of the PV-Membrane System at 30% of the SOC on the “Partly Cloudy Day”

The additional performances of the PV-membrane system with the Li-ion batteries at a 30% SOC (energy capacities of 0.7 kWh) are presented here as supplementary results for Section 3.3.
Figure A4. The performance of the PV-membrane system equipped on the “partly cloudy day” with batteries at 30% SOC, indicating (A) the motor power, (B) battery current, (C) battery voltage, (D) SOC, (E) RO flux, (F) TMPRO, (G) production and (H) SEC. Note that the black curves on graphs (A), (E) and (F) are the moving average values of 10 points.
Applsci 11 00856 g0a4

Appendix A.5. The Performance of the PV-Membrane System at 20% of the SOC on the “Partly Cloudy Day”

The additional performances of the PV-membrane system with the Li-ion batteries at a 20% SOC (energy capacities of 0.5 kWh) are presented here as supplementary results for Section 3.3.
Figure A5. The performance of the PV-membrane system on the “partly cloudy day” equipped with batteries at 20% SOC, indicating (A) the pump power, (B) battery current, (C) battery voltage, (D) SOC, (E) RO flux, (F) TMPRO, (G) production and (H) SEC. Note that the black curves on graphs (A), (E) and (F) are the moving average values of 10 points.
Applsci 11 00856 g0a5

Appendix A.6. Performance of the Directly Coupled PV-Membrane System without SCs on the “Partly Cloudy Day”

The additional performances of the directly coupled PV-membrane system without SCs are presented here as supplementary results for Section 3.4.
Figure A6. The directly coupled PV-membrane system performance on the “partly cloudy day” without SCs, indicating (A) the solar irradiance, (B) motor power, (C) TMPRO, (D) FluxRO, (E) production and (F) SEC.
Applsci 11 00856 g0a6

Appendix A.7. Varied Resistances of the Positive Temperature Coefficient Lamp Coupled in a Series with the Pump

An additional PTC lamp was connected to minimize the effects of a built-in MPPT on the charge controller and SCs.
Figure A7. Varied resistances with the PTC lamp connected in a series with the feed pump in the PV-membrane system, indicating (A) solar irradiance (W/m2) and (B) resistance (Ω).
Applsci 11 00856 g0a7

References

  1. International Energy Agency. World Energy Outlook—Electricity Database; International Energy Agency: Paris, France, 2019; Available online: https://www.iea.org/reports/world-energy-outlook-2019 (accessed on 17 September 2020).
  2. Gao, G.; Busko, D.; Joseph, R.; Turshatov, A.; Howard, I.A.; Richards, B.S. High Quantum Yield Single-Band Green Upconversion in La2O3:Yb3+,Ho3+ Microcrystals for Anticounterfeiting and Plastic Recycling. Part. Part. Syst. Charact. 2019, 36, 1800462. [Google Scholar] [CrossRef]
  3. Richards, B.S.; Shen, J.; Schäfer, A.I. Water-Energy Nexus Perspectives in the Context of Photovoltaic-Powered Decentralized Water Treatment Systems: A Tanzanian Case Study. Energy Technol. 2017, 5, 1112–1123. [Google Scholar] [CrossRef] [Green Version]
  4. Zarzo, D.; Prats, D. Desalination and energy consumption. What can we expect in the near future? Desalination 2018, 427, 1–9. [Google Scholar] [CrossRef]
  5. Subramani, A.; Jacangelo, J.G. Emerging desalination technologies for water treatment: A critical review. Water Res. 2015, 75, 164–187. [Google Scholar] [CrossRef] [PubMed]
  6. Karimi, L.; Abkar, L.; Aghajani, M.; Ghassemi, A. Technical feasibility comparison of off-grid PV-EDR and PV-RO desalination systems via their energy consumption. Sep. Purif. Technol. 2015, 151, 82–94. [Google Scholar] [CrossRef]
  7. Ali, A.; Tufa, R.A.; Macedonio, F.; Curcio, E.; Drioli, E. Membrane technology in renewable-energy-driven desalination. Renew. Sustain. Energy Rev. 2018, 81, 1–21. [Google Scholar] [CrossRef]
  8. Li, S.; Cai, Y.-H.; Schäfer, A.I.; Richards, B.S. Renewable energy powered membrane technology: A review of the reliability of photovoltaic-powered membrane system components for brackish water desalination. Appl. Energy 2019, 253, 113524. [Google Scholar] [CrossRef]
  9. European Technology & Innovation Platform PV: Fact Sheets about Photovoltaics (Update September 2020). Available online: https://etip-pv.eu/publications/fact-sheets/ (accessed on 17 September 2020).
  10. Andrés-Mañas, J.A.; Ruiz-Aguirre, A.; Acién, F.G.; Zaragoza, G. Assessment of a pilot system for seawater desalination based on vacuum multi-effect membrane distillation with enhanced heat recovery. Desalination 2018, 443, 110–121. [Google Scholar] [CrossRef]
  11. Zaragoza, G.; Andrés-Mañas, J.A.; Ruiz-Aguirre, A. Commercial scale membrane distillation for solar desalination. NPJ Clean Water 2018, 1. [Google Scholar] [CrossRef] [Green Version]
  12. Xie, Z.; Ng, D.; Hoang, M.; Zhang, J.; Gray, S. Study of Hybrid PVA/MA/TEOS Pervaporation Membrane and Evaluation of Energy Requirement for Desalination by Pervaporation. Int. J. Environ. Res. Public Health 2018, 15, 1913. [Google Scholar] [CrossRef] [Green Version]
  13. Qin, M.; Deshmukh, A.; Epsztein, R.; Patel, S.K.; Owoseni, O.M.; Walker, W.S.; Elimelech, M. Comparison of energy consumption in desalination by capacitive deionization and reverse osmosis. Desalination 2019, 455, 100–114. [Google Scholar] [CrossRef]
  14. Wang, L.; Lin, S. Intrinsic tradeoff between kinetic and energetic efficiencies in membrane capacitive deionization. Water Res. 2018, 129, 394–401. [Google Scholar] [CrossRef] [PubMed]
  15. Qu, Y.; Campbell, P.G.; Gu, L.; Knipe, J.M.; Dzenitis, E.; Santiago, J.G.; Stadermann, M. Energy consumption analysis of constant voltage and constant current operations in capacitive deionization. Desalination 2016, 400, 18–24. [Google Scholar] [CrossRef] [Green Version]
  16. Tan, C.; He, C.; Tang, W.; Kovalsky, P.; Fletcher, J.; Waite, T.D. Integration of photovoltaic energy supply with membrane capacitive deionization (MCDI) for salt removal from brackish waters. Water Res. 2018, 147, 276–286. [Google Scholar] [CrossRef] [PubMed]
  17. Pan, S.-Y.; Snyder, S.W.; Ma, H.-W.; Lin, Y.J.; Chiang, P.-C. Development of a Resin Wafer Electrodeionization Process for Impaired Water Desalination with High Energy Efficiency and Productivity. ACS Sustain. Chem. Eng. 2017, 5, 2942–2948. [Google Scholar] [CrossRef]
  18. He, W.; Amrose, S.; Wright, N.C.; Buonassisi, T.; Peters, I.M.; Winter, A.G. Field demonstration of a cost-optimized solar powered electrodialysis reversal desalination system in rural India. Desalination 2020, 476. [Google Scholar] [CrossRef]
  19. Shahzad, M.W.; Burhan, M.; Ang, L.; Ng, K.C. Energy-water-environment nexus underpinning future desalination sustainability. Desalination 2017, 413, 52–64. [Google Scholar] [CrossRef]
  20. Schäfer, A.I.; Shen, J.; Richards, B.S. Renewable energy-powered membrane technology in Tanzanian communities. NPJ Clean Water 2018, 1, 24. [Google Scholar] [CrossRef]
  21. Riffel, D.B.; Carvalho, P.C.M. Small-scale photovoltaic-powered reverse osmosis plant without batteries Design and simulation. Desalination 2009, 247, 378–389. [Google Scholar] [CrossRef]
  22. Aybar, H.Ş.; Akhatov, J.S.; Avezova, N.R.; Halimov, A.S. Solar powered RO desalination: Investigations on pilot project of PV powered RO desalination system. Appl. Sol. Energy 2010, 46, 275–284. [Google Scholar] [CrossRef]
  23. Shen, J.; Mkongo, G.; Abbt-Braun, G.; Ceppi, S.L.; Richards, B.S.; Schäfer, A.I. Renewable energy powered membrane technology: Fluoride removal in a rural community in northern Tanzania. Sep. Purif. Technol. 2015, 149, 349–361. [Google Scholar] [CrossRef]
  24. Robinson, R.; Ho, G.E.; Mathew, K. Development of a reliable low cost RO desalination unit for remote communities. Desalination 1992, 86. [Google Scholar] [CrossRef]
  25. Mathew, K.; Dallas, S.; Ho, G.E.; Anda, M. Solar-Powered Village Water Supply System from Brackish Water. In World Renewable Energy Congress VI; Pergamon Press: Oxford, UK, 2000; pp. 2061–2064. [Google Scholar] [CrossRef]
  26. Thomson, M.; Infield, D. Laboratory demonstration of a photovoltaic-powered seawater reverse-osmosis system without batteries. Desalination 2005, 183, 105–111. [Google Scholar] [CrossRef]
  27. Dallas, S.; Sumiyoshi, N.; Kirk, J.; Mathew, K.; Wilmot, N. Efficiency analysis of the Solarflow—An innovative solar-powered desalination unit for treating brackish water. Renew. Energy 2009, 34, 397–400. [Google Scholar] [CrossRef]
  28. Thomson, M.; Miranda, M.S.; Infield, D. A small-scale seawater reverse osmosis system with excellent energy efficiency over a wide operating range. Desalination 2002, 153, 229–236. [Google Scholar] [CrossRef]
  29. Miranda, M.S.; Infield, D. A wind-powered seawater reverse-osmosis system without batteries. Desalination 2002, 153, 9–16. [Google Scholar] [CrossRef]
  30. Park, G.L.; Schäfer, A.I.; Richards, B.S. The Effect of internittent operation on a wind-powered membrane system for brackish water desalination. Water Sci. Technol. 2012, 65, 867–874. [Google Scholar] [CrossRef]
  31. Bilton, A.M.; Kelley, L.C.; Dubowsky, S. Photovoltaic reverse osmosis—Feasibility and a pathway to develop technology. Desalin. Water Treat. 2012, 31, 24–34. [Google Scholar] [CrossRef]
  32. Ruiz-García, A.; Nuez, I. Long-term intermittent operation of a full-scale BWRO desalination plant. Desalination 2020, 489. [Google Scholar] [CrossRef]
  33. Park, G.L.; Schäfer, A.I.; Richards, B.S. Renewable energy powered membrane technology: The effect of wind speed fluctuations on the performance of a wind-powered membrane system for brackish water desalination. J. Membr. Sci. 2011, 370, 34–44. [Google Scholar] [CrossRef]
  34. Park, G.L.; Schäfer, A.I.; Richards, B.S. Renewable energy-powered membrane technology: Supercapacitors for buffering resource fluctuations in a wind-powered membrane system for brackish water desalination. Renew. Energy 2013, 50, 126–135. [Google Scholar] [CrossRef] [Green Version]
  35. Richards, B.S.; Park, G.L.; Pietzsch, T.; Schäfer, A.I. Renewable energy powered membrane technology: Brackish water desalination system operated using real wind fluctuations and energy buffering. J. Membr. Sci. 2014, 468, 224–232. [Google Scholar] [CrossRef]
  36. Soric, A.; Cesaro, R.; Perez, P.; Guiol, E.; Moulin, P. Eausmose project desalination by reverse osmosis and batteryless solar energy: Design for a 1m3 per day delivery. Desalination 2012, 301, 67–74. [Google Scholar] [CrossRef]
  37. Gür, T.M. Review of electrical energy storage technologies materials and systems: Challenges and prospects for large-scale grid storage. Energy Environ. Sci. 2018, 11, 2696–2767. [Google Scholar] [CrossRef]
  38. Gee, A.M.; Robinson, F.V.P.; Dunn, R.W. Analysis of Battery Lifetime Extension in a Small-Scale Wind-Energy System Using Supercapacitors. IEEE Trans. Energy Convers. 2013, 28, 24–33. [Google Scholar] [CrossRef]
  39. Sufan, M.; Rahim, N.A.; Aman, M.M.; Tan, C.K.; Raihan, S.R.S. Sizing and applications of battery energy storage technologies in smart grid system A review. J. Renew. Sustain. Energy 2019, 11, 014105. [Google Scholar] [CrossRef]
  40. Li, S.; Voigt, A.; Schäfer, A.I.; Richards, B.S. Renewable energy powered membrane technology: Energy buffering control system for improved resilience to periodic fluctuations of solar irradiance. Renew. Energy 2020, 149, 877–889. [Google Scholar] [CrossRef]
  41. Olabi, A.G.; Onumaegbu, C.; Wilberforce, T.; Ramadan, M.; Abdelkareem, M.A.; Al-Alami, A.H. Critical Review of Energy Storage Systems. Energy 2020, 11, 2696–2767. [Google Scholar] [CrossRef]
  42. Herold, D.; Neskakis, A. A small PV-driven reverse osmosis desalination plant on the island of Gran Canaria. Desalination 2001, 137, 285–292. [Google Scholar] [CrossRef]
  43. Bouhadjar, S.I.; Kopp, H.; Britsch, P.; Deowan, S.A.; Hoinkis, J.; Bundschuh, J. Solar powered nanofiltration for drinking water production from fluoride-containing groundwater– A pilot study towards developing a sustainable and low-cost treatment plant. J. Environ. Manag. 2019, 231, 1263–1269. [Google Scholar] [CrossRef]
  44. Alghoul, M.A.; Poovanaesvaran, P.; Mohammed, M.H.; Fadhil, A.M.; Muftah, A.F.; Alkilani, M.M.; Sopian, K. Design and experimental performance of brackish water reverse osmosis desalination unit powered by 2 kW photovoltaic system. Renew. Energy 2016, 93, 101–114. [Google Scholar] [CrossRef]
  45. May, G.J.; Davidson, A.; Monahov, B. Lead batteries for utility energy storage: A review. J. Energy Storage 2018, 15, 145–157. [Google Scholar] [CrossRef]
  46. VARTA: VARTA Pulse /Pulse Neo. Available online: https://www.varta-storage.com/fileadmin/varta_storage/downloads/products/energy/varta-pulse/Datasheet_VARTA_pulse_en_17.pdf (accessed on 16 May 2020).
  47. Vega-Garita, V.; Hanif, A.; Narayan, N.; Ramirez-Elizondo, L.; Bauer, P. Selecting a suitable battery technology for the photovoltaic battery integrated module. J. Power Sources 2019, 438. [Google Scholar] [CrossRef]
  48. Alexander, D. Li-Ion Batteries for Transportation Applications. Available online: https://www.batterypoweronline.com/blogs/li-ion-batteries-for-transportation-applications/ (accessed on 29 September 2020).
  49. Mueller, S.C.; Sandner, P.G.; Welpe, I.M. Monitoring innovation in electrochemical energy storage technologies: A patent-based approach. Appl. Energy 2015, 137, 537–544. [Google Scholar] [CrossRef] [Green Version]
  50. Zubi, G.; Dufo-López, R.; Carvalho, M.; Pasaoglu, G. The lithium-ion battery: State of the art and future perspectives. Renew. Sustain. Energy Rev. 2018, 89, 292–308. [Google Scholar] [CrossRef]
  51. Tan, N.M.L.; Abe, T.; Akagi, H. A 6-kW, 2-kWh Lithium-Ion Battery Energy Storage System Using a Bidirectional Isolated DC-DC Converter. In Proceedings of the 2010 International Power Electronics Conference, Sapporo, Japan, 21–24 June 2010. [Google Scholar]
  52. Weniger, J.; Tjaden, T.; Quaschning, V. Sizing and grid integration of residential PV battery systems. IEEE Trans. Energy Convers. 2019, 34, 562–571. [Google Scholar]
  53. Glavin, M.E.; Chan, P.K.W.; Armstrong, S.; Hurley, W.G. A Stand-Alone Photovoltaic Supercapacitor Battery Hybrid Energy Storage System. In Proceedings of the 2008 13th International Power Electronics and Motion Control Conference (EPE-PEMC 2008), Poznan, Poland, 1–3 September 2008. [Google Scholar]
  54. Bludszuweit, H.; Fandos, J.M.; Domínguez, J.A.; Llombart, A.; Sanz, J. Simulation of a Hybrid System Wind Turbine-Battery-Ultracapacitor. Renew. Energy Power Qual. J. 2005, 1, 254–259. [Google Scholar] [CrossRef] [Green Version]
  55. Mehr, T.H.; Masoum, M.A.S.; Jabalameli, N. Grid-Connected Lithium-Ion Battery Energy Storage System for load levelling and Peak Shaving. In Proceedings of the Australasian Universities Power Engineering Conference, AUPEC 2013, Hobart, TAS, Australia, 29 September–3 October 2013. [Google Scholar]
  56. Bansal, A.K.; Holzer, W.; Penzkofer, A.; Tsuboi, T. Absorption and emission spectroscopic characterization of platinum-octaethyl-porphyrin (PtOEP). Chem. Phys. 2006, 330, 118–129. [Google Scholar] [CrossRef]
  57. Dupont: FilmTec Fiberglassed Elements for Light Industrial Systems. Available online: https://www.dupont.com/products/filmtecbw304040.html (accessed on 29 September 2020).
  58. Schäfer, A.I.; Broeckmann, A.; Richards, B.S. Renewable energy powered membrane technology. 1. Development and characterization of a photovoltaic hybrid membrane system. Environ. Sci. Technol. 2007, 41, 998–1003. [Google Scholar] [CrossRef]
  59. Richards, B.S.; Capão, D.P.S.; Schäfer, A.I. Renewable energy powered membrane technology. 2. The effect of energy fluctuations on performance of a photovoltaic hybrid membrane system. Environ. Sci. Technol. 2008, 42, 4563–4569. [Google Scholar] [CrossRef]
  60. Pristash, S.R.; Corp, K.L.; Rabe, E.J.; Schlenker, C.W. Heavy-Atom-Free Red-to-Yellow Photon Upconversion in a Thiosquaraine Composite. ACS Appl. Energy Mater. 2020, 3, 19–28. [Google Scholar] [CrossRef]
  61. Sunmodule SW 100 Poly RGP. Available online: https://www.boutiquesolaire.fr/Docs/Solarworld/SW_poly_100-24.pdf (accessed on 9 June 2020).
  62. Aschermann, G.; Jeihanipour, A.; Shen, J.; Mkongo, G.; Dramas, L.; Croue, J.P.; Schafer, A. Seasonal variation of organic matter concentration and characteristics in the Maji ya Chai River (Tanzania): Impact on treatability by ultrafiltration. Water Res. 2016, 101, 370–381. [Google Scholar] [CrossRef] [PubMed] [Green Version]
  63. Photovoltaic Geographical Information System. Available online: https://re.jrc.ec.europa.eu/pvg_tools/en/#MR (accessed on 8 December 2020).
  64. Australian Standard. Australian Standard: AS 4509.2-2002 Stand-Alone Power Systems—System Design Guidelines; Council of Standards Australia: Sydney, Australia, 2002; Available online: https://www.planetarypower.com.au/info/ausstd4509_2.pdf (accessed on 17 July 2020).
  65. Cheng, Y.Y.; Fückel, B.; Khoury, T.; Clady, R.G.C.R.; Tayebjee, M.J.Y.; Ekins-Daukes, N.J.; Crossley, M.J.; Schmidt, T.W. Kinetic Analysis of Photochemical Upconversion by Triplet−Triplet Annihilation: Beyond Any Spin Statistical Limit. J. Phys. Chem. Lett. 2010, 1, 1795–1799. [Google Scholar] [CrossRef]
  66. Baccouche, I.; Jemmali, S.; Mlayah, A.; Manai, B.; Amara, N.E.B. Implementation of an Improved Coulomb-Counting Algorithm Based on a Piecewise SOC-OCV Relationship for SOC Estimation of Li-Ion Battery. Int. J. Renew. Energy Res. 2018, 8, 178–187. [Google Scholar]
  67. Baccouche, I.; Jemmalil, S.; Manai, B.; Chaibi, R.; Amaral, N.E.B. Hardware Implementation of an Algorithm Based on Kalman Filter for Monitoring Low Capacity Li-Ion Batteries. In Proceedings of the 7th International Renewable Energy Congress (IREC), Hammamet, Tunisia, 22–24 March 2016; pp. 1–6. [Google Scholar]
  68. Schulze, T.F.; Schmidt, T.W. Photochemical upconversion: Present status and prospects for its application to solar energy conversion. Energy Environ. Sci. 2015, 8, 103–125. [Google Scholar] [CrossRef] [Green Version]
  69. Mean Well: 500 W Single Output DC-DC Converter. Available online: https://www.meanwell-web.com/content/files/pdfs/productPdfs/MW/SD-500/SD-500-spec.pdf (accessed on 24 June 2020).
  70. Dilbeck, T.; Hanson, K. Molecular Photon Upconversion Solar Cells Using Multilayer Assemblies: Progress and Prospects. J. Phys. Chem. Lett. 2018, 9, 5810–5821. [Google Scholar] [CrossRef]
  71. Cowern, E. The Highs and Lows of Motor Voltage. 2000. Available online: https://www.ecmweb.com/design/article/20901278/the-highs-and-lows-of-motor-voltage (accessed on 29 June 2020).
  72. World Health Organization. Guidelines for Drinking-Water Quality, 4th ed.; World Health Organization: Geneva, Switzerland, 2017; Available online: https://www.who.int/publications/i/item/9789241549950 (accessed on 29 June 2020).
  73. Panagopoulos, A.; Haralambous, K.J.; Loizidou, M. Desalination brine disposal methods and treatment technologies—A review. Sci. Total Environ. 2019, 693, 133545. [Google Scholar] [CrossRef]
  74. Mansour, S.; Arafat, H.A.; Hasan, S.W. Brine Management in Desalination Plants. In Desalination Sustainability: A Technical, Socioeconomic, and Environmental Approach; Elsevier: Amsterdam, The Netherlands, 2017; pp. 207–236. [Google Scholar]
  75. Ziolkowska, J.R.; Reyes, R. Prospects for Desalination in the United States—Experiences From California, Florida, and Texas. In Competition for Water Resources; Elsevier: Amsterdam, The Netherlands, 2017; pp. 298–316. [Google Scholar] [CrossRef]
  76. Fact Sheet 32: Salinity of Groundwater in SA. Available online: https://catalogue.nla.gov.au/Record/4941705 (accessed on 18 December 2020).
  77. Boussouga, Y.-A.; Richards, B.S.; Schäfer, A.I. Renewable energy powered membrane technology: System resilience under solar irradiance fluctuations during the treatment of fluoride-rich natural waters by different nanofiltration/reverse osmosis membranes. J. Membr. Sci. 2021, 617, 118452. [Google Scholar] [CrossRef]
  78. Rüdiger, M.; Fischer, S.; Frank, J.; Ivaturi, A.; Richards, B.S.; Krämer, K.W.; Hermle, M.; Goldschmidt, J.C. Bifacial n-type silicon solar cells for upconversion applications. Sol. Energy Mater. Sol. Cells 2014, 128, 57–68. [Google Scholar] [CrossRef]
  79. McBride, R.; Morris, R.; Hanbury, W. Wind Power A Reliable Source for Desalination. Desalination 1987, 67, 559–564. [Google Scholar] [CrossRef]
  80. Mongird, K.; Fotedar, V.; Viswanathan, V.; Koritarov, V.; Balducci, P.; Hadjerioua, B.; Alam, J. Energy Storage Technology and Cost Characterization Report; Pacific Northwest National Lab.: Richland, WA, USA, 2019. Available online: https://www.energy.gov/sites/prod/files/2019/07/f65/Storage%20Cost%20and%20Performance%20Characterization%20Report_Final.pdf (accessed on 24 November 2020).
  81. Statista Research Department: Lithium-ion Battery Pack Costs Worldwide between 2011 and 2020. 2020. Available online: https://www.statista.com/statistics/883118/global-lithium-ion-battery-pack-costs/ (accessed on 24 November 2020).
  82. Aquino, T.; Roling, M.; Baker, C.; Rowland, L. Battery Energy Storage Technology Assessment. 29 Novermber 2017. Prepared for the Platte River Power Authority by HDR/Omaha, Nebraska. 2017. Available online: https://www.prpa.org/wp-content/uploads/2017/10/HDR-Battery-Energy-Storage-Assessment.pdf (accessed on 24 November 2020).
Figure 1. Schematic of the photovoltaic (PV)-membrane system equipped with a lithium-ion (Li-ion) battery pack or supercapacitors (SCs) for energy storage. Note the directly coupled system is configured by connecting the solar array simulator (SAS) to the pump, and the change between the battery and SC configurations is manually switched. All sensors for measuring flow, pressure, conductivity, voltage (V) and current (I) are connected to a data acquisition card (DAQ) and computer. The solid lines represent the hydraulic connections, while dashed lines represent the electrical connections. Note: The numbers indicate the valves within the system: ①: safety valve, ②: check valve and ③: needle valve for creating back pressure. NF/RO: nanofiltration/reverse osmosis, UF: ultrafiltration and DC: direct current.
Applsci 11 00856 g001
Figure 2. Variations of the amount of sunlight (plotted as (A): solar irradiance, (B): PV power and (C): temperature) as a function of time on different “solar days”, illustrating a “sunny day”, “partly cloudy day” and “very cloudy day”. Data were taken from the KIT Solar Park on 5 May 2016, 26 May 2016 and 13 Oct 2016, respectively.
Applsci 11 00856 g002
Figure 3. Performance of the PV-membrane system shown, firstly, with fully charged battery storage (100% initial state-of-charge (SOC), black curves) and, secondly, the reference system without energy storage (grey curves) on the “partly cloudy day”: (A) power, (B) SOC, (C) transmembrane pressure of UF membrane (TMPUF), (D) transmembrane pressure of RO membrane (TMPRO) (E) flux of RO membrane (fluxRO), (F) flux of UF membrane (fluxUF), (G) retention/recovery, (H) permeate electrical conductivity (EC), (I) production and (J) specific energy consumption (SEC).
Applsci 11 00856 g003
Figure 4. Cumulative performance of the PV-membrane system with/without (grey curves) fully charged battery storage (100% initial SOC, black curves) on the “very cloudy day” (left graph) and “sunny day” (right graph) in terms of (A,F) the motor power and SOC, (B,G) TMPRO, (C,H) production, (D,I) permeated EC and (E,J) SEC.
Applsci 11 00856 g004
Figure 5. The performance of the PV-membrane system equipped with batteries at a 50% SOC on the “partly cloudy day”, indicating (A) the pump power, (B) battery current, (C) battery voltage, (D) SOC, (E) FluxRO, (F) TMPRO, (G) production and (H) SEC. Note that the black curves on graphs (A), (E) and (F) are the moving average values of 10 points, while the grey curves are the original measurement data from the sensors.
Applsci 11 00856 g005
Figure 6. Key performance indicators of the PV-membrane system as a function of the initial energy storage capacity of the batteries (different SOC) on the “partly cloudy day”: (A) water production, (B) permeate EC and (C) SEC. Note that the Ref. represents the directly coupled system performance (without batteries), as discussed in Section 3.1.
Applsci 11 00856 g006
Figure 7. Performance of PV-membrane system with fully charged Li-ion batteries (black curve) compared to the system with SCs and the charge controller (grey curve) on the “partly cloudy day”, and the results shown for (A) the motor power, (B) voltage of pump (VPump), (C) voltage of PV equipped with battery (VPV_Battery), (D) current of PV equipped with battery (IPV_Battery), (E) SOC, (F) TMPRO, (G) fluxRO, (H) permeate EC, (I) permeate production and (J) SEC.
Applsci 11 00856 g007
Table 1. The overall average performance of the photovoltaic (PV)-membrane system with/without batteries over the three “solar days”. FluxRO: flux of RO membrane, TMPRO: transmembrane pressure of RO membrane, SOC: state-of-charge and EC: electrical conductivity.
Solar DayInitial SOC
(%)
Avg.
FluxRO
(L/m2·h)
Avg.
TMPRO
(bar)
Avg.
Perm. EC
(µS/cm)
Avg.
Retent.
(%)
Perm.
Prod.
(L)
Avg.
SEC
(kWh/m3)
Full-Power Duration
(hh:mm)
Partly cloudy207.36.632896.24024.81:55
307.46.733696.04434.73:02
409.07.233595.95574.55:09
509.98.233095.96694.47:22
7011.88.928796.37254.18:16
100129.427496.476749:20
Ref.10.78.431096.36633.7
Very cloudy10011.89.427496.36464.18:00
Ref.7.36.534795.93964.6
Sunny10011.39.129096.48924.311:00
Ref.10.28.235395.87704.0
Publisher’s Note: MDPI stays neutral with regard to jurisdictional claims in published maps and institutional affiliations.

