Effects of High Proportion Unground Sea Sand Ore on the Preparation Process and Reduction Performance of Oxidized Pellets

School of Metallurgy, Northeastern University, Shenyang 110819, China
*
Authors to whom correspondence should be addressed.
†
These authors contributed equally to this work and should be considered as co-first authors.
Minerals 2021, 11(1), 87; https://doi.org/10.3390/min11010087
Submission received: 28 December 2020
/
Revised: 14 January 2021
/
Accepted: 15 January 2021
/
Published: 18 January 2021
(This article belongs to the Section Mineral Processing and Extractive Metallurgy)
Abstract
:The New Zealand sea sand ore is a kind of vanadia–titania magnetite formed by erosion in the coastal zone. Because of its coarse particle size, smooth spherical particles, complex chemical composition, it has been added to sinter as an auxiliary material. Based on the principle of optimizing ore blending to strengthen advantages and weaken disadvantages, this paper used New Zealand sea sand raw ore that has not undergone any pretreatment as the main material and prepared it into oxidized pellets using a disc pelletizer and explored the influence of high-proportion unground sea sand ore on the preparation process and reduction performance of oxidized pellets. The influence of unground sea sand ore on the falling strength, compressive strength, reduction swelling index, and reduction degree of pellets was analyzed by the ICPAES, XRF, XRD, SEM-EDS, and other detection methods, and the change laws and influencing factors of oxidized pellets were analyzed. With the increase of the amount of unground sea sand ore used, the falling strength and compressive strength of the green pellets first decreased and then gradually increased, while the compressive strength of the oxidized pellets first increased and then decreased. At the same time, as the amount of sea sand ore used increased, the reduction process of pellets was restricted. The reduction swelling index and the reduction degree index generally show a downward trend. However, the compressive strength of the pellets gradually increased after reduction. Through the research on the pellet-forming performance and reduction properties of unground sea sand ore, it is shown that when the amount of unground sea sand ore used was 40%, it can still be used as raw material for blast furnace ironmaking. Thus, this research provided specific data support for iron and steel enterprises to improve the ratio of unground sea sand ore and reduce production cost.
1. Introduction
Sea sand ore is a kind of low-grade inferior iron ore resource formed by erosion with titanomagnetite as the main mineral phase. The main gangue component is quartz, and there is some aluminum spinel on the surface of some heterogeneous sea sand particles. Sea sand ore is distributed along the coast of New Zealand, the Philippines, Japan, Indonesia, and Australia. Its reserves are very rich, easy to mine, and low cost [1,2,3,4,5]. The vanadia–titania sea sand ore is currently recognized globally as an iron ore resource that is difficult-to-beneficiate and difficult-to-smelt [6]. The total iron grade of sea sand ore is about 60%, the content of titanium dioxide is about 7–9%, and it also contains relatively high amounts of V2O5, Al2O3, K2O, Na2O, and other minerals that are difficult to sinter. The increase of TiO2 content in blast furnace smelting affects the flow performance of slag [7,8,9]. In addition, the particle size of sea sand ore is relatively coarse, the specific surface area and wet capacity are relatively small, the hydrophilicity and pellet-forming performance are relatively poor, and its application in the iron ore pelletizing process is limited [10,11]. Therefore, sea sand ore has not been used on a large scale in the iron and steel smelting process. Many studies have focused on the pre-oxidation treatment and direct reduction of sea sand ore.
To realize the comprehensive utilization of iron, vanadium, and titanium in sea sand ore, many scholars have carried out significant research work. Wright et al. [12,13,14] conducted basic research on New Zealand sea sand ore, and it was clear that the main phases of the sea sand ore were titanomagnetite, aluminum spinel, and a small amount of ilmenite. Xu [15] studied sinter with New Zealand sea sand ore and found that the addition of New Zealand sea sand ore had a negative effect on the production of sinter. Some studies have found that the amount of sea sand ore used in sinter should be strictly controlled within 20% [16,17]. Han et al. [18] prepared oxidized pellets from ground Malaysian sea sand ore and found that the amount of ground sea sand ore used in pellets should be strictly controlled within 30%.
Many scholars have also undertaken numerous research works on the direct reduction characteristics of sea sand ore. Park et al. [19,20,21] studied the phase transition of sea sand ore in the process of gas-based reduction; Longbottom et al. [22,23,24] studied the phase transition process of sea sand ore during the reduction process and analyzed the effect of reduction temperature on the strength of the sinter. Sun et al. [25,26] proposed the coal-based direct reduction-magnetic separation method to recover iron and titanium from sea sand ore and conducted related research to verify the feasibility of this method.
To increase the of sea sand ore used as an ironmaking raw material, the sea sand ore without any pretreatment was prepared into oxidized pellets in this paper. The influence of the amount of sea sand ore added on the falling strength, compressive strength, reduction swelling index, and reduction degree of pellets were investigated, and the change laws and influencing factors were analyzed. The phase composition of experimental raw materials and pellets before and after reduction was analyzed by the X-Ray Diffraction (XRD) (X’Pert Pro; PANalytical, Almelo, the Netherlands), and Scanning Electron Microscope (SEM) (Ultra Plus; Carl Zeiss GmbH, Jena, Germany) was used to detect the microstructure of the pellets before and after reduction, and the influence of the amount of sea sand ore added on the microstructure of the oxidized pellets before and after reduction are discussed.
2. Materials and Methods
2.1. Experimental Materials
The experiment used New Zealand sea sand ore (HS), Sijiaying (SJY), Oukongfen (GOK), and bentonite as raw materials, and the experimental raw materials were quantitatively analyzed by Atomic Emission Spectrometer (ICP-AES) (Optima 8300DV; PerkinElmer, Waltham, MA, USA) and X-Ray Fluorescence (XRF) (ZSXPrimus-II; Rigaku, Tokyo, Japan). The results are shown in Table 1 and Table 2. It can be seen that New Zealand sea sand ore is a vanadia–titania magnetite, the content of total iron was 58.36%, the content of TiO2 and V2O5 was 6.95% and 0.47%, respectively. The experiment was mainly based on the principle of optimizing ore blending. Oxidized pellets were prepared from the above raw materials to make use of sea sand ore.
2.2. Characteristic Analysis of New Zealand Sea Sand Ore
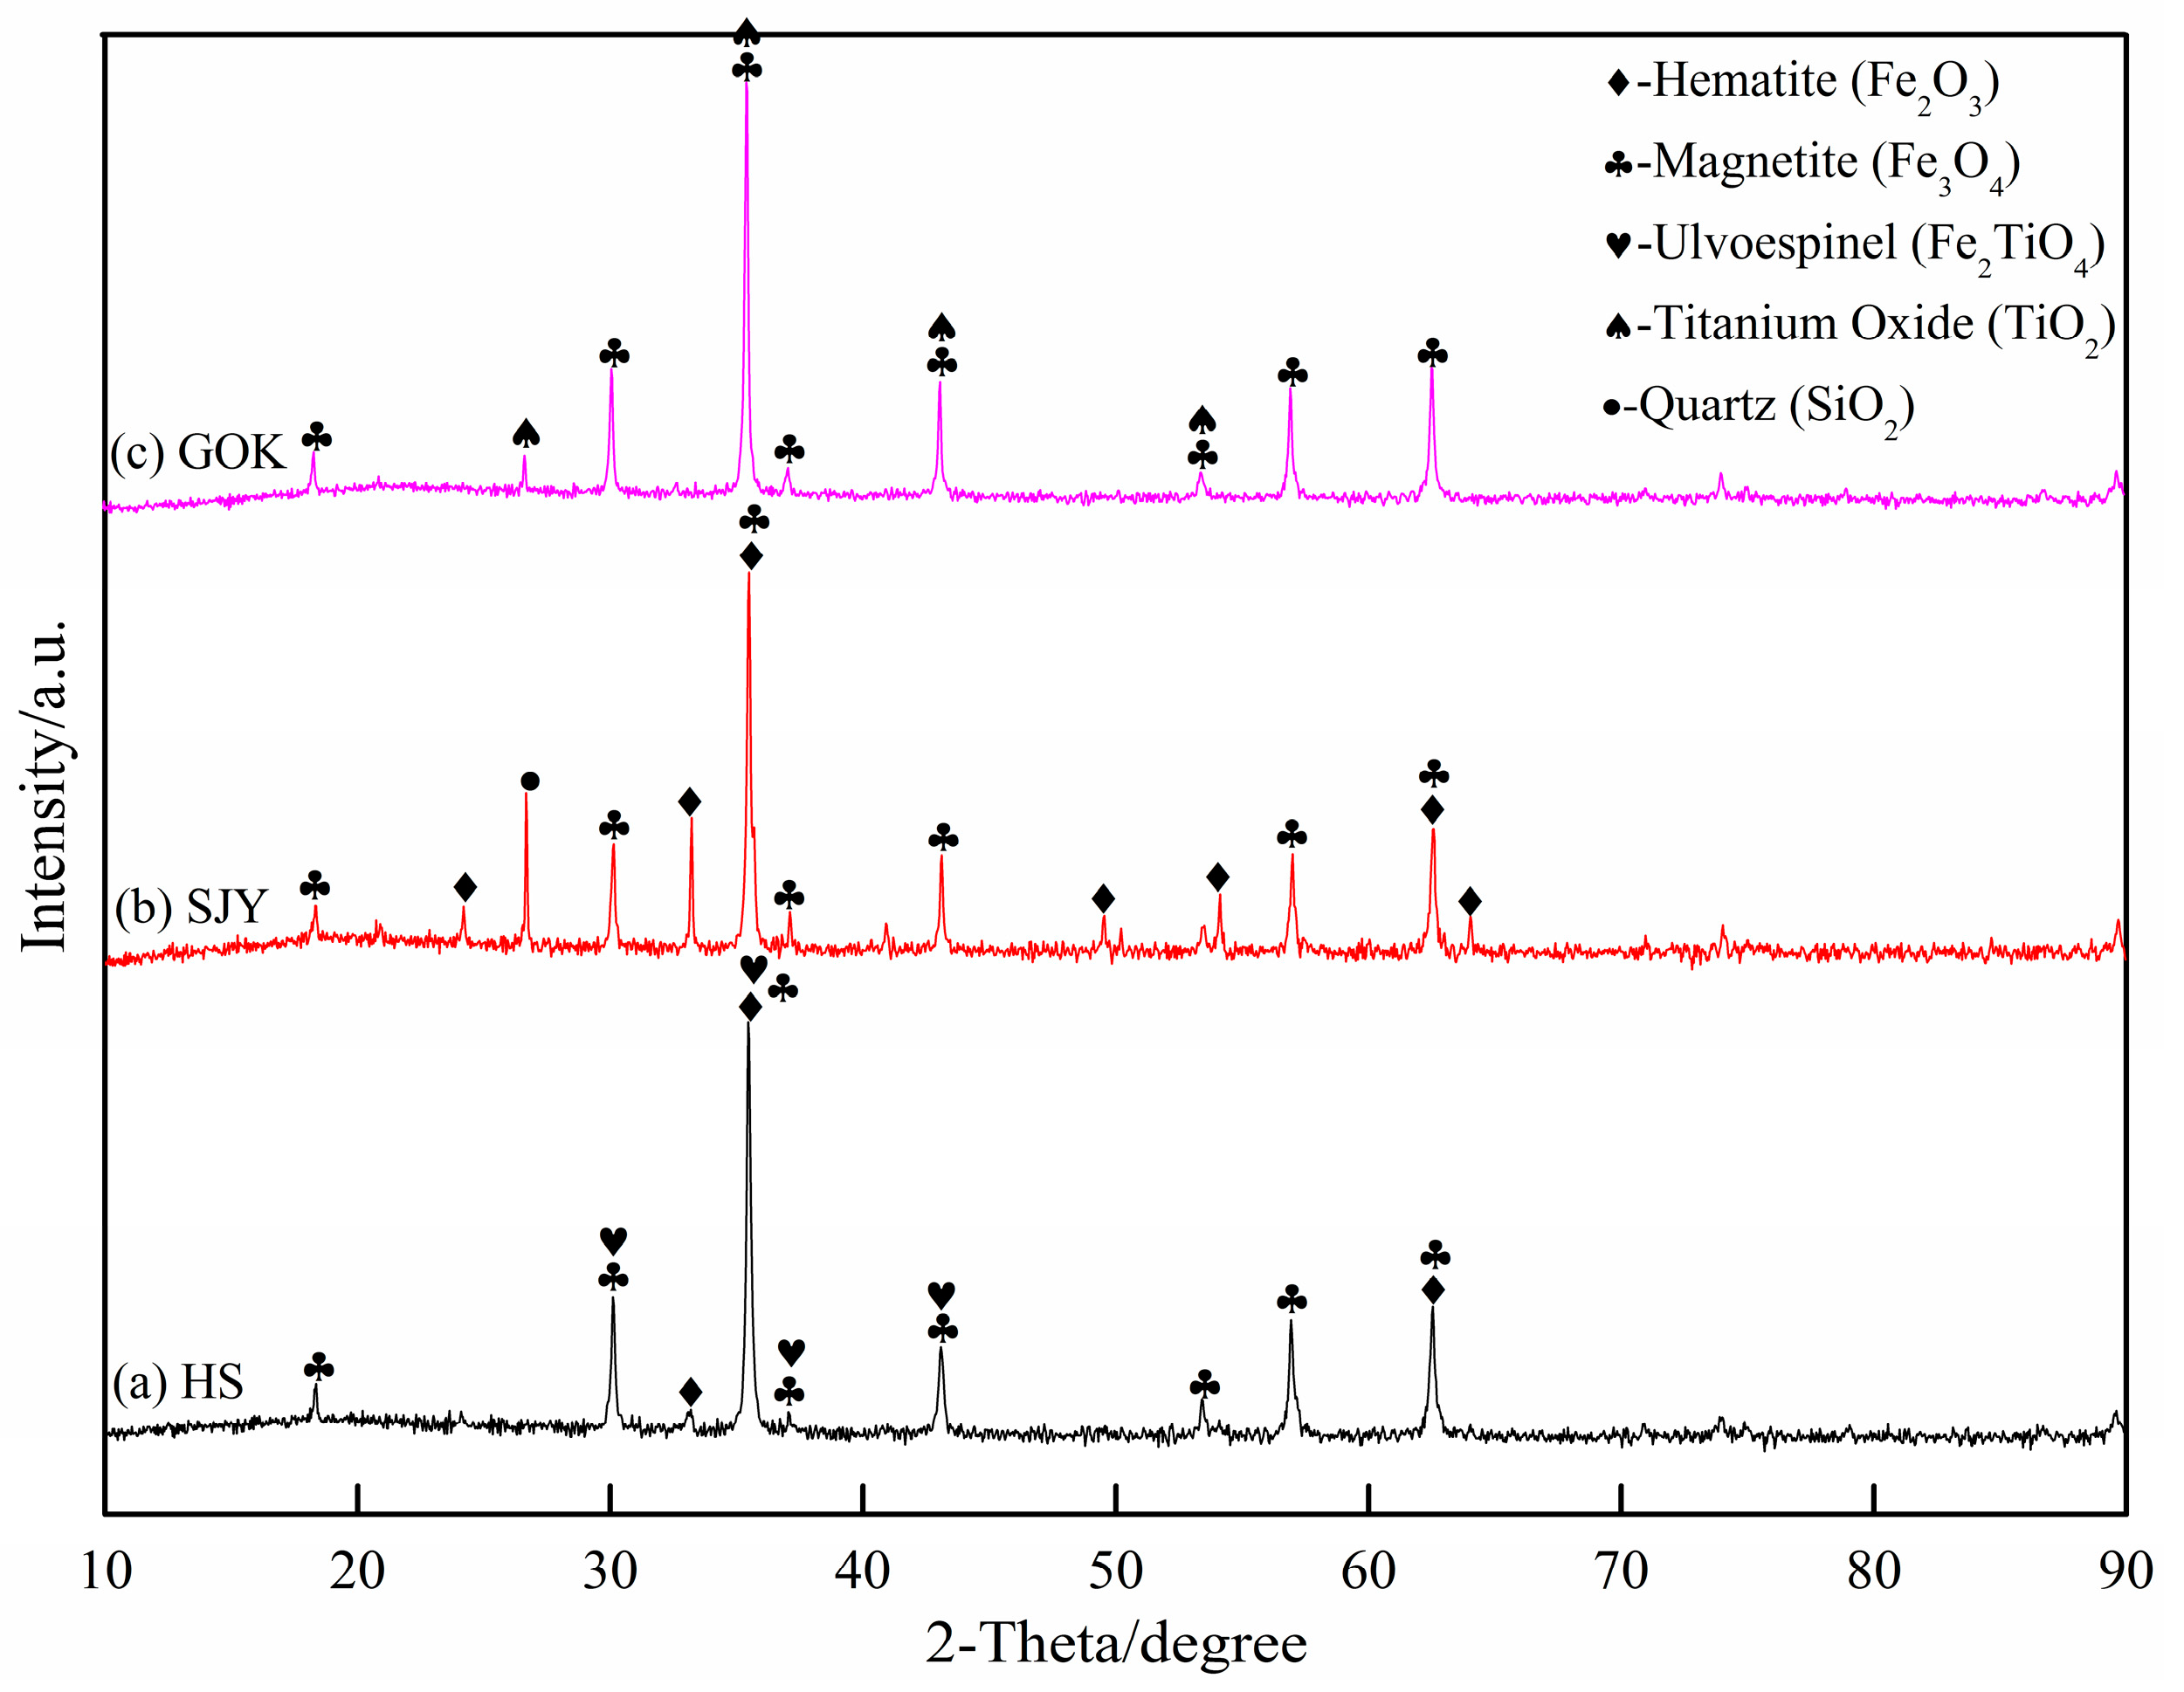
The phase composition of the experimental raw materials was analyzed by XRD, and the results are shown in Figure 1. Sea sand ore was mainly composed of hematite (Fe2O3), magnetite (Fe3O4), and ilmenite spinel (Fe2TiO4). The main phases of SJY were hematite (Fe2O3), magnetite (Fe3O4), and silica (SiO2), and GOK was mainly composed of magnetite (Fe3O4) and a small amount of titanium oxide (TiO2).
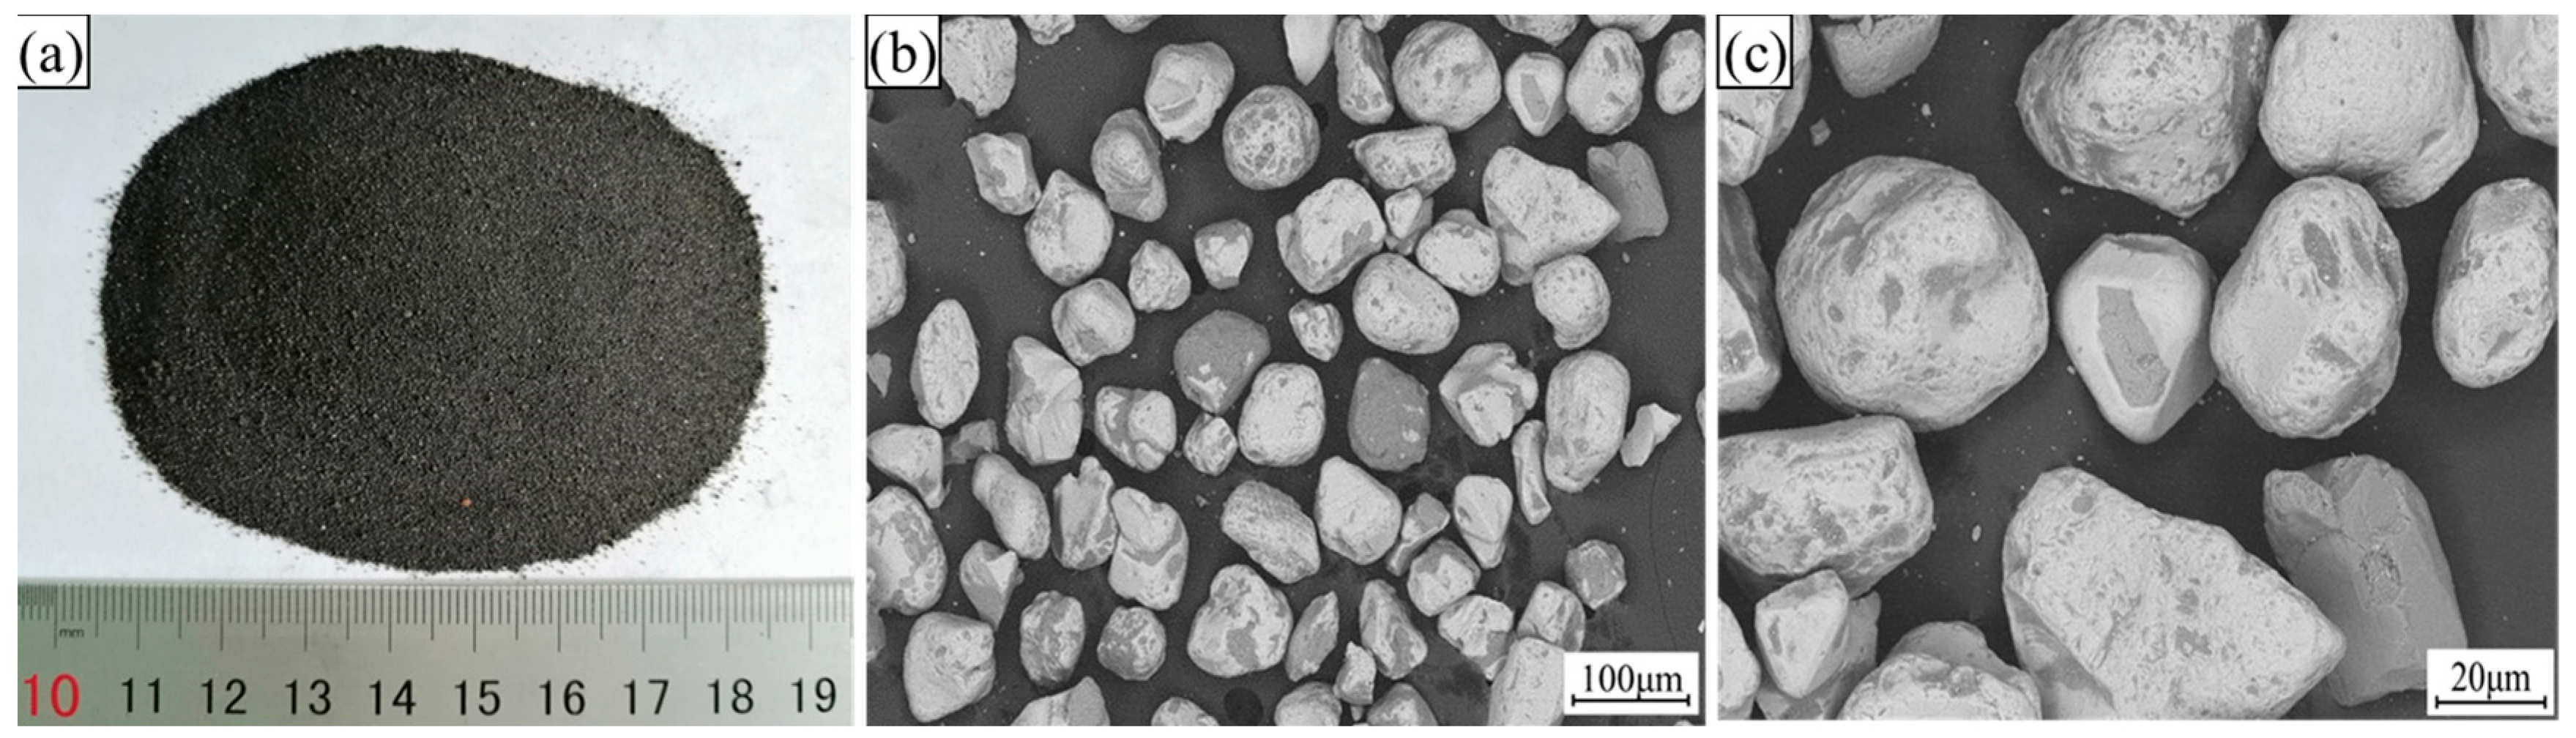
After the sea sand ore was dried, its morphological characteristics were observed, as shown in Figure 2. It can be seen from Figure 2 that the shape of sea sand ore particles was relatively regular, showing a spherical shape, and the texture of the particles was smooth. These characteristics are not conducive to the preparation of oxidized pellets with sea sand ore.
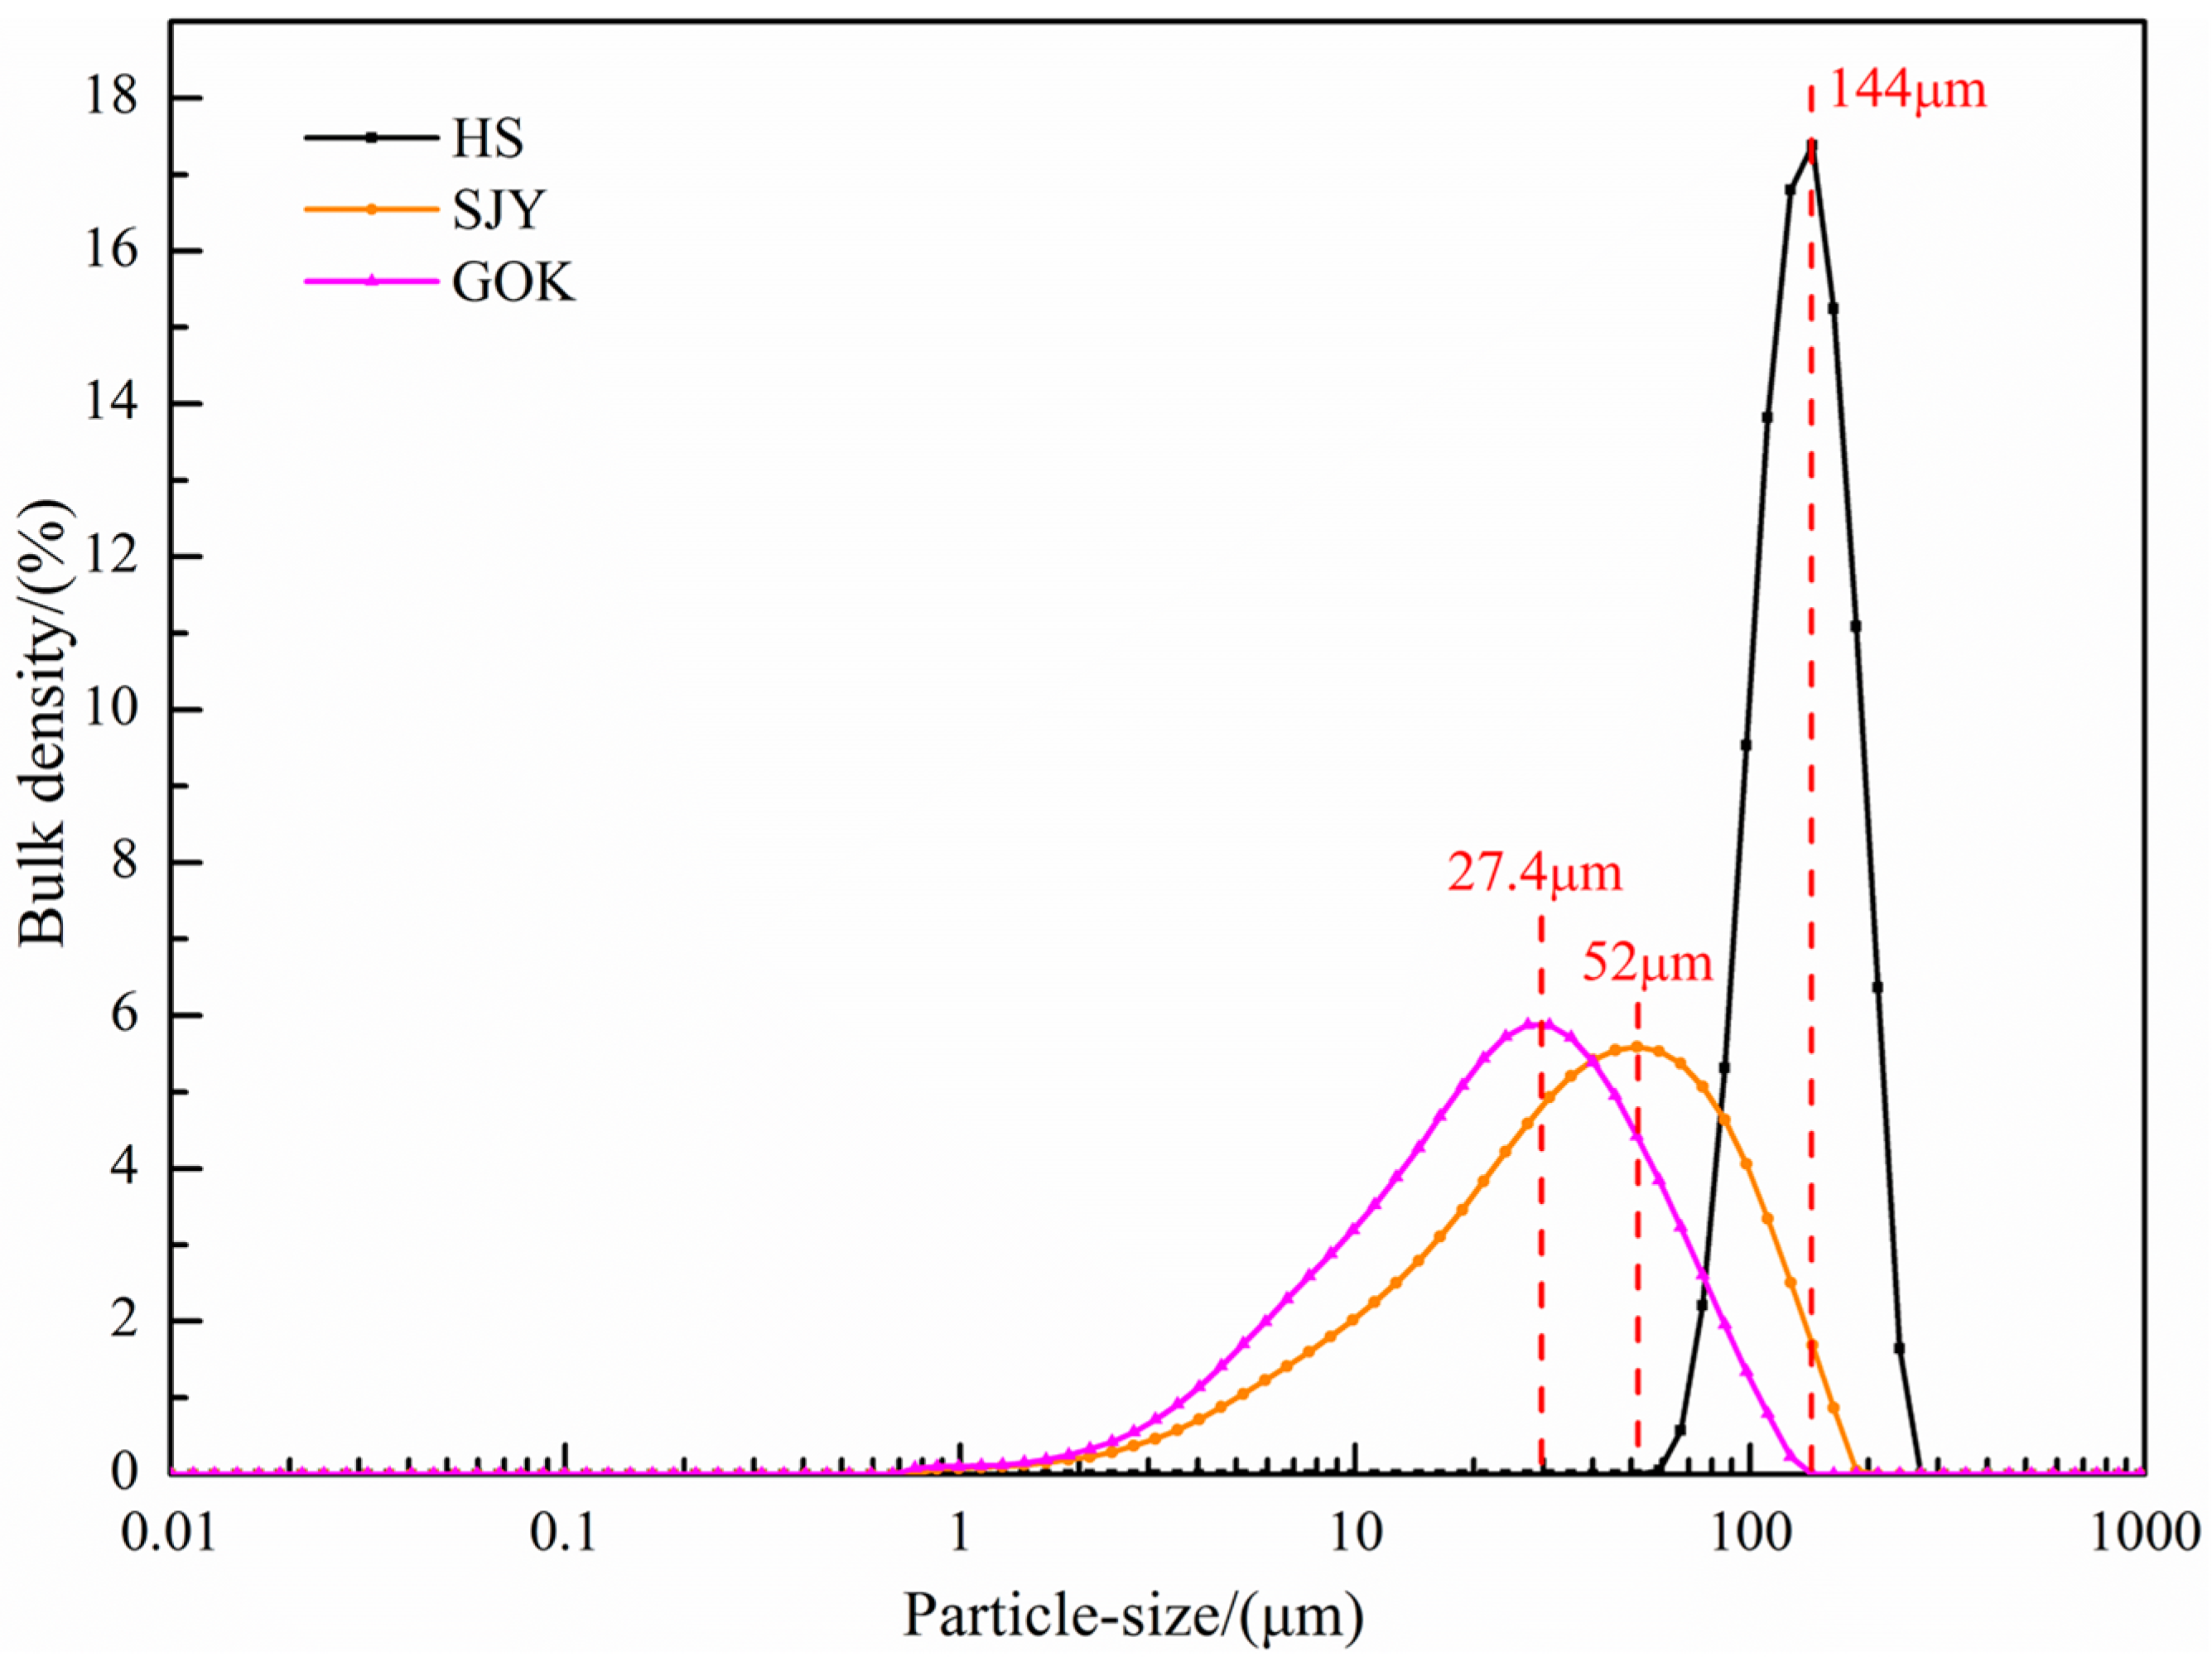
The particle size composition of the three raw materials was used to analyze a laser particle size analyzer (Mastersizer 3000; Malvern, UK), and the results are shown in Figure 3. It can be seen from the particle size distribution diagram that the particle size of the sea sand ore was coarsest, followed by Sijiaying ore, and GOK ore was the finest. Among them, the particle size distribution of the large part of the sea sand ore was about 144 μm, and the particle size of Sijiaying and GOK was relatively fine, most of which were distributed around 52 μm and 27.4 μm, respectively.
To further characterize the surface condition of the raw material particles, the specific surface area of the three raw materials was determined and analyzed by a surface area and pore size analyzer (NOVA-1200e; Quantachrome, Boynton Beach, FL, USA) and nitrogen adsorption Brunner−Emmet−Teller (BET) method. The results are shown in Table 3. Among the three raw materials, the specific surface area of sea sand ore was the smallest, only 0.3 m2/g, the specific surface area of GOK was the second, 3.2 m2/g, and the specific surface area of Sijiaying was the largest, as high as 70.2 m2/g.
2.3. Experimental Methods
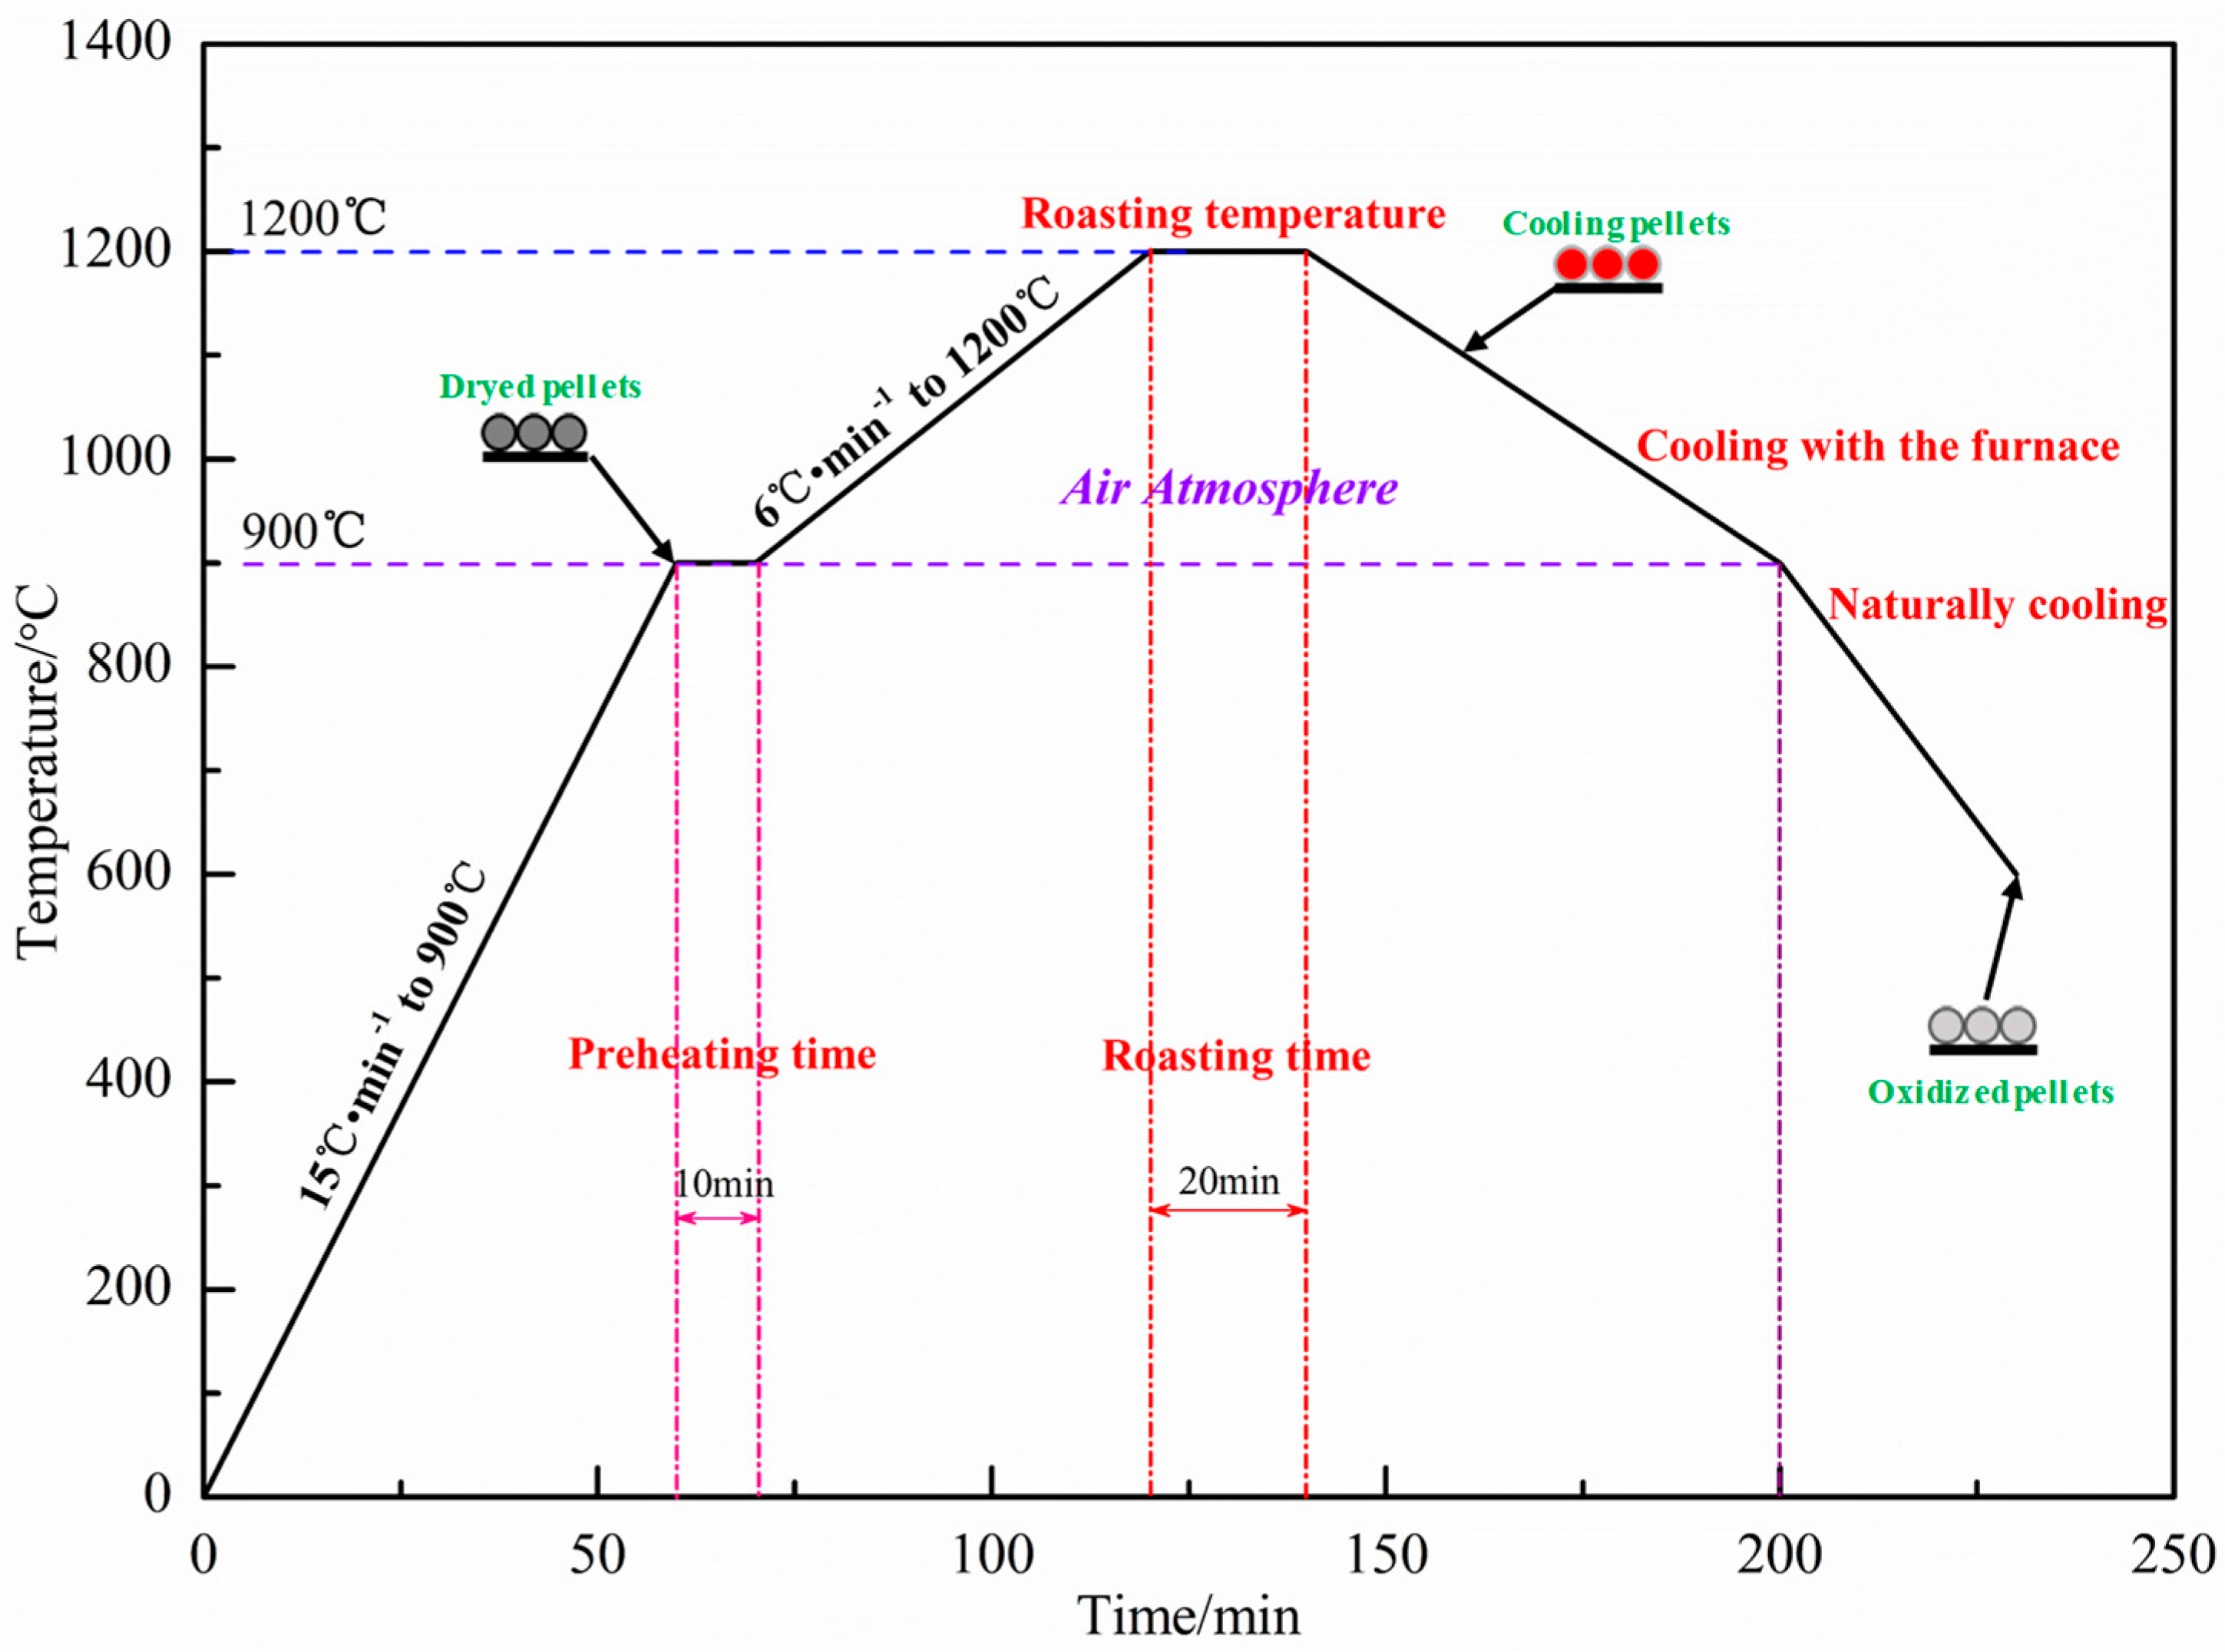
The ingredient scheme is shown in Table 4. The dosage of Sijiaying was unchanged at 50%, and the addition of sea sand ore and GOK changed, and the external dosage of bentonite was 1.5%. The qualified green pellets of 10–12.5 mm were prepared in the disc pelletizer, and the performance of the green pellets was tested. The qualified green pellets were dried in a drying oven at 110 °C for 180 min. Then, the dried pellets were taken out and put into a muffle furnace for oxidation roasting. The roasting system is shown in Figure 4. The compressive strength of oxidized pellets was tested by a digital display automatic pellet pressure testing machine.
A certain amount of 10–12.5 mm qualified pellets were selected as samples for the reduction experiment of oxidized pellets. After the oxidized pellets were heated to 900 °C under an inert atmosphere, the reducing atmosphere was adjusted to 10.5 L/min nitrogen (N2) and 4.5 L/min carbon monoxide (CO). After 60 min of reduction, the pellets were cooled to ambient temperature under an inert atmosphere. Formula (1) was used to calculate the volume of pellets before and after reduction swelling, and Formula (2) was used to calculate the reduction swelling index (RSI), expressed as a percentage of volume.
where D is the average diameter of the sample (mm), V0 is the average volume of the sample before reduction (mm3), V1 is the average volume of the sample after reduction (mm3), RSI is the reduction swelling index (%).
Five hundred grams of pellets were selected as the sample for the reduction experiment. After the oxidized pellets were heated to 900 °C under an inert atmosphere, the reducing atmosphere was adjusted to 10.5 L/min nitrogen (N2) and 4.5 L/min carbon monoxide (CO). After 180 min of reduction, the pellets were cooled to ambient temperature under an inert atmosphere. Formula (3) was used to calculate the reduction degree index (RI) of pellets after reduction for 180 min. Fe3+ was taken as the benchmark and expressed as the mass percentage.
where m0 is the mass of the sample before reduction (g), m1 is the mass of the sample after 180 min reduction (g), W1 is the content of FeO in the sample before the test (mass%), W2 is the total iron content of the sample before the test (mass%), RI is the reduction index (%), 0.11 represents the oxygen demand conversion coefficient when converting FeO to Fe2O3, 0.43 represents the oxygen demand conversion coefficient when converting Fe to Fe2O3.
3. Results and Discussion
3.1. Effect of Sea Sand Ore Dosage on the Performance of Green Pellets
Table 5 shows the performance of green pellets with different dosages of sea sand ore. From the data in the table, it can be observed that the moisture of the green pellet was basically maintained at about 8%, which was the best moisture of green pellets. Under the condition of little difference in the moisture of the green pellet, with the increase in the amount of sea sand ore added, the falling strength and compressive strength of the green pellet first decreased and then gradually increased, which can meet the requirements of steel enterprises in the production and transportation process of green pellets. When the amount of sea sand ore added was 40%, the falling strength of the green pellets was the largest, 32 times/pellet, and the compressive strength of the green pellets was 11 N/pellet.
3.2. Effect of Sea Sand Ore Dosage on the Compressive Strength of Oxidized Pellets
3.2.1. Compressive Strength of Oxidized Pellets
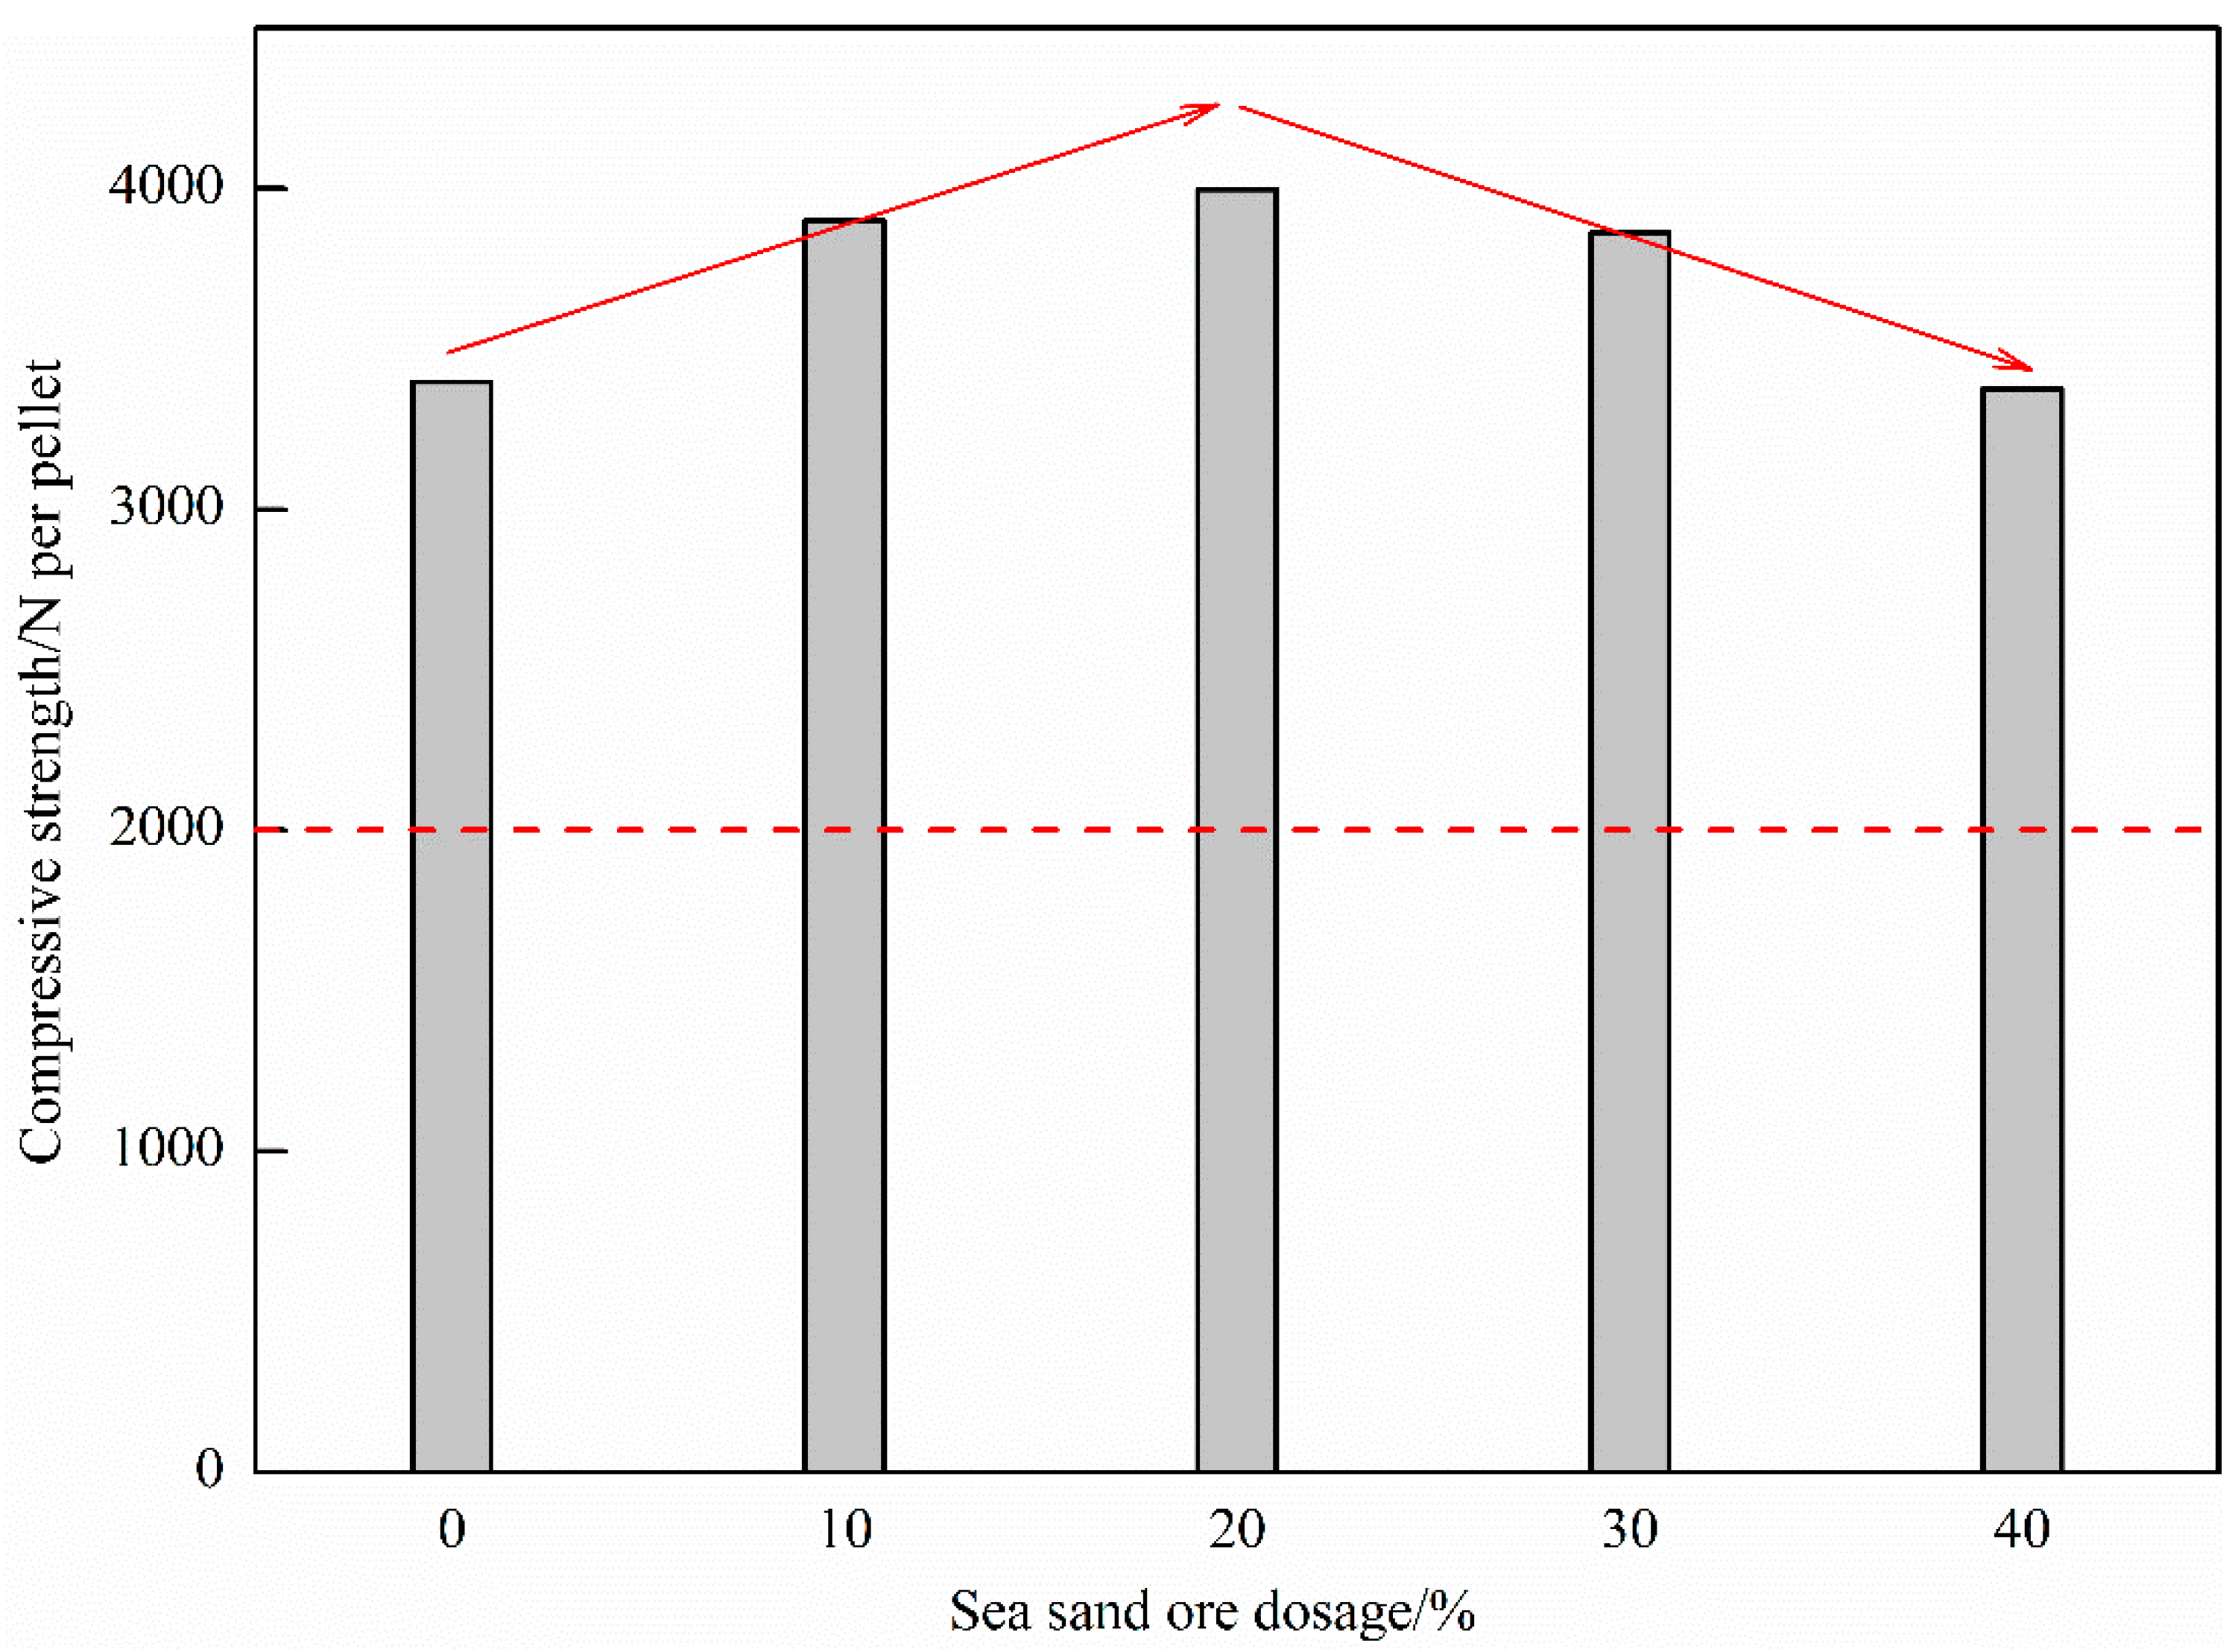
Figure 5 shows the influence of the dosage of sea sand ore on the compressive strength of oxidized pellets. It can be seen from the figure that as the amount of sea sand ore added increased, the compressive strength of the oxide pellets first increased and then decreased. When the amount of sea sand ore added was 20%, the maximum compressive strength of the oxidized pellets was 3997 N/pellet. With the continuous increase of the amount of sea sand ore added, the compressive strength of the oxidized pellets gradually decreased to 3377 N/pellet, which still met the actual production requirements of the enterprise.
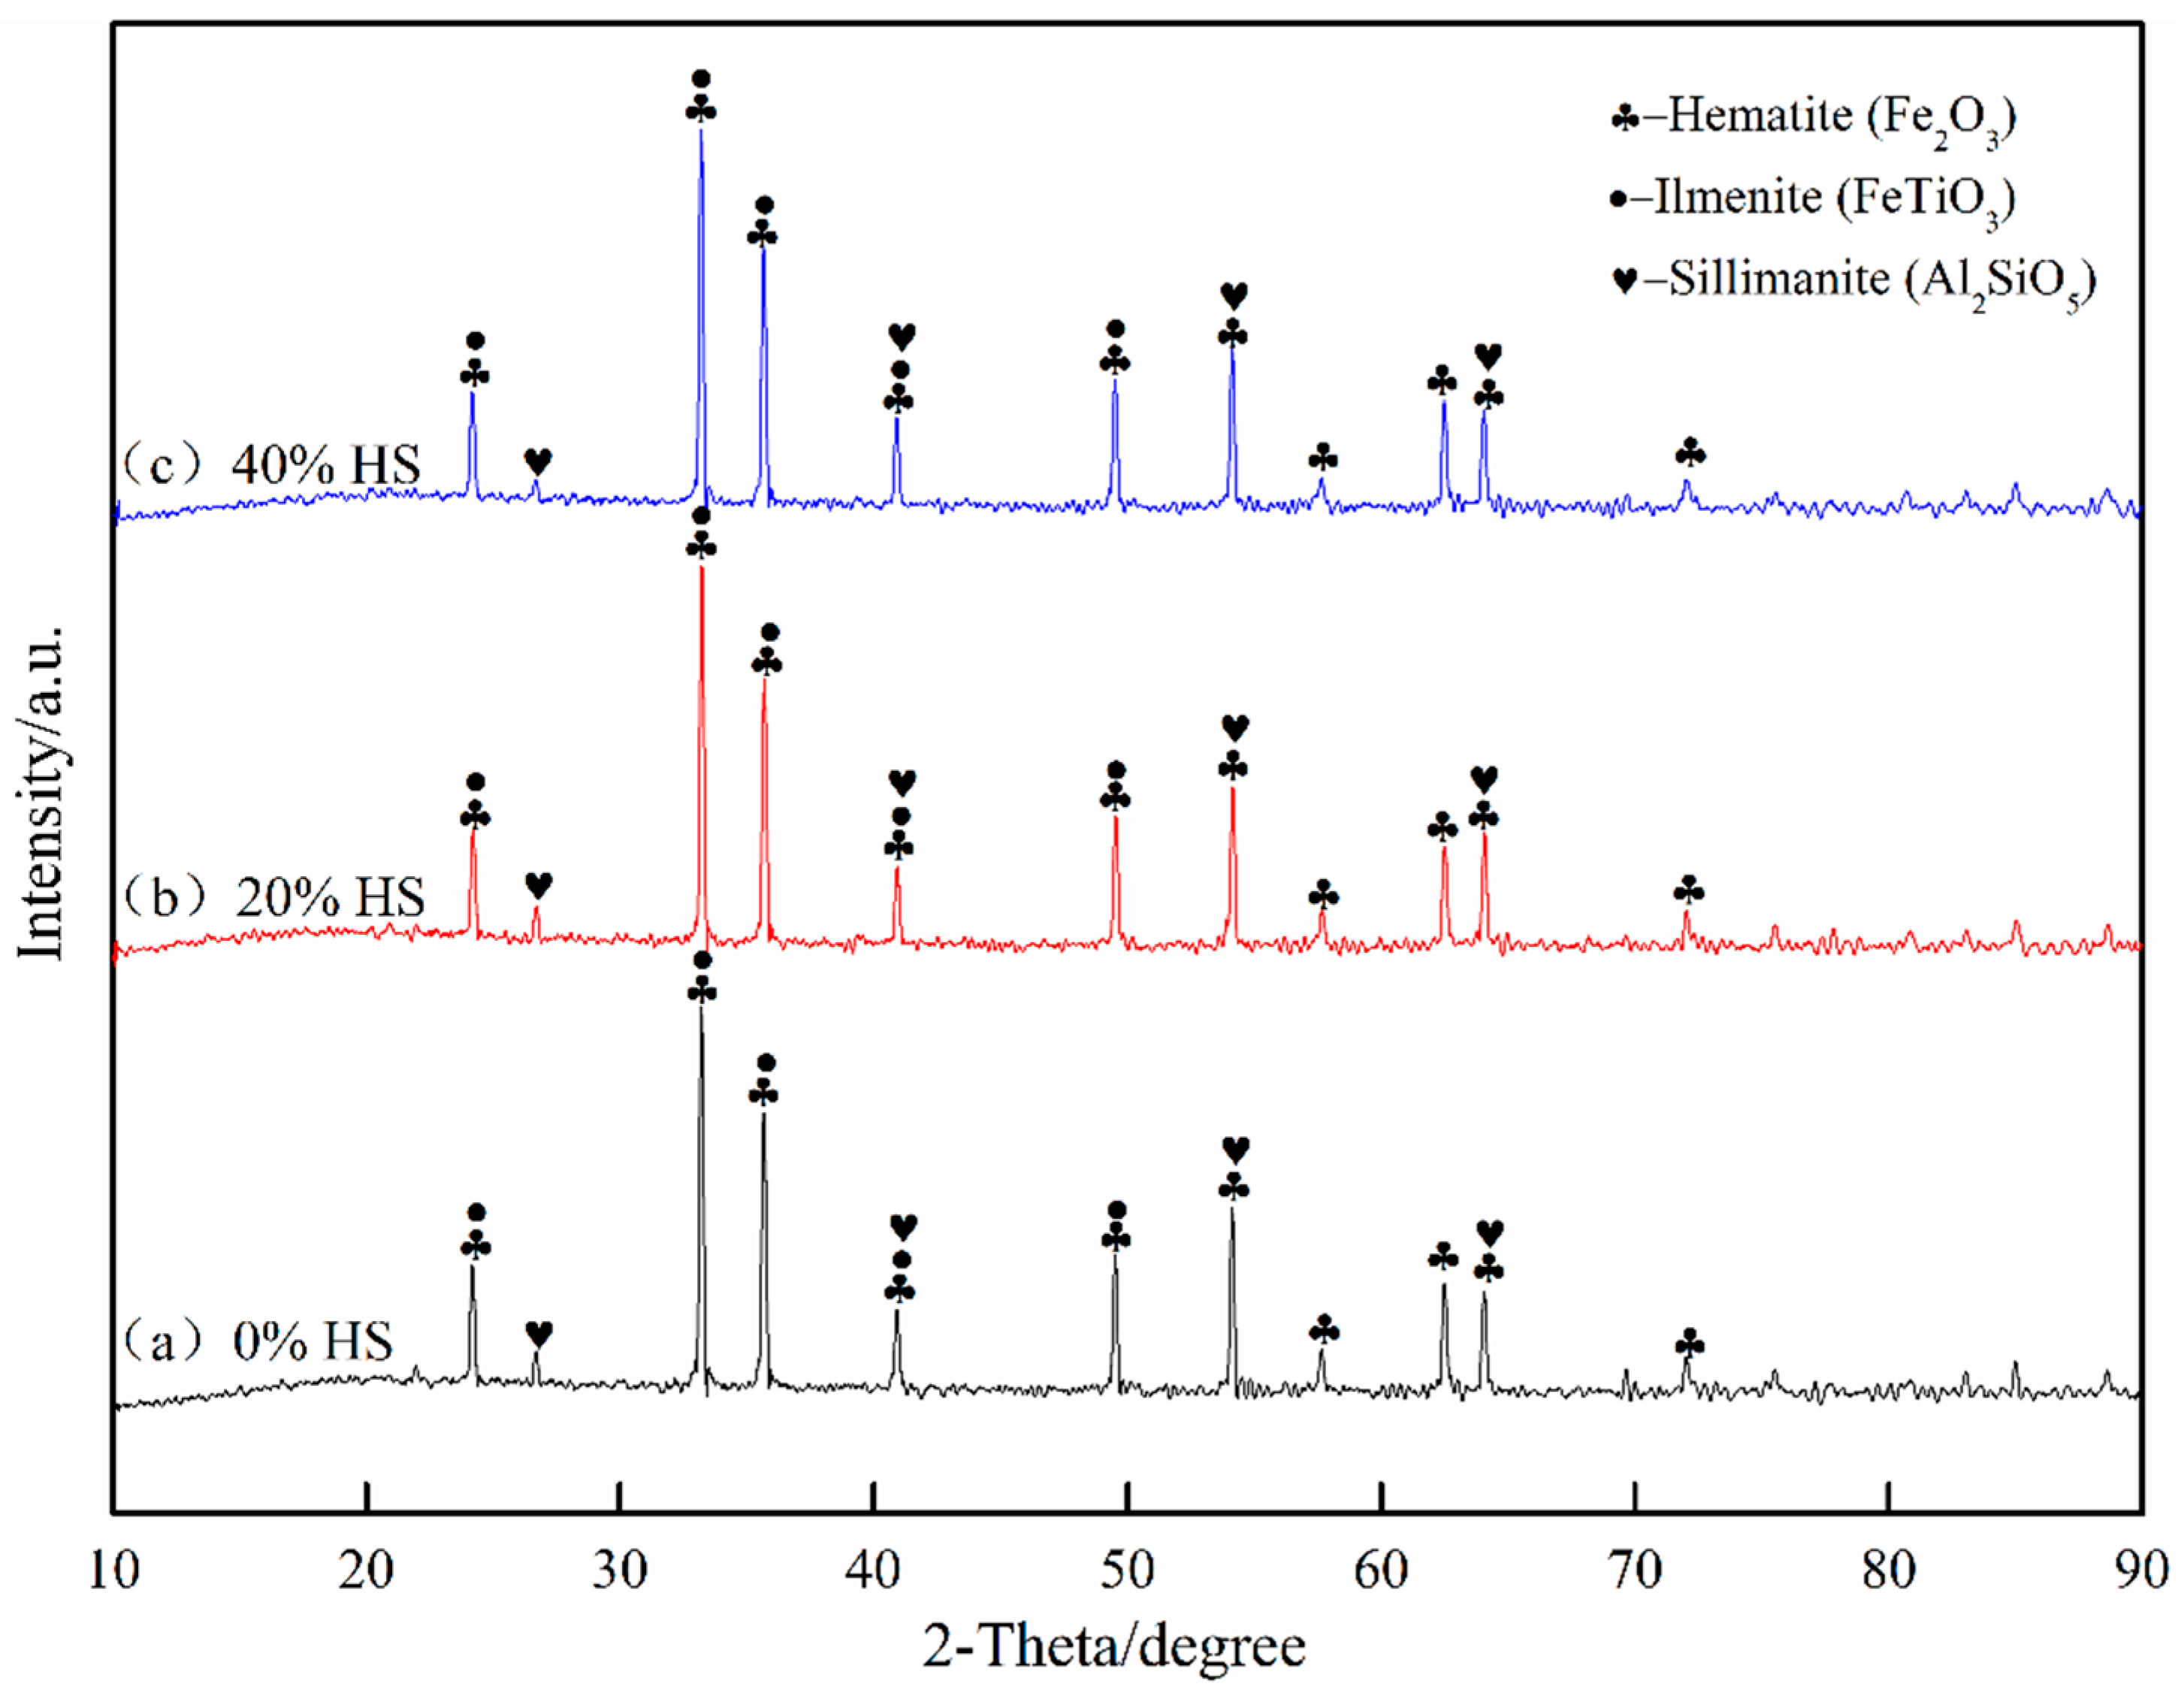
Figure 6 shows the analysis results of oxide pellets with 0%, 20%, and 40% sea sand ore added using XRD. The oxidized pellets were mainly composed of hematite (Fe2O3), ilmenite (FeTiO3), and silicate (Al2SiO5). Among the three types of oxidized pellets, the main existing forms of Fe were Fe2O3 and FeTiO3, the main existing forms of Ti were FeTiO3, and the silicate phase was mainly Al2SiO5.
3.2.2. Microstructure Analysis of Oxidized Pellets
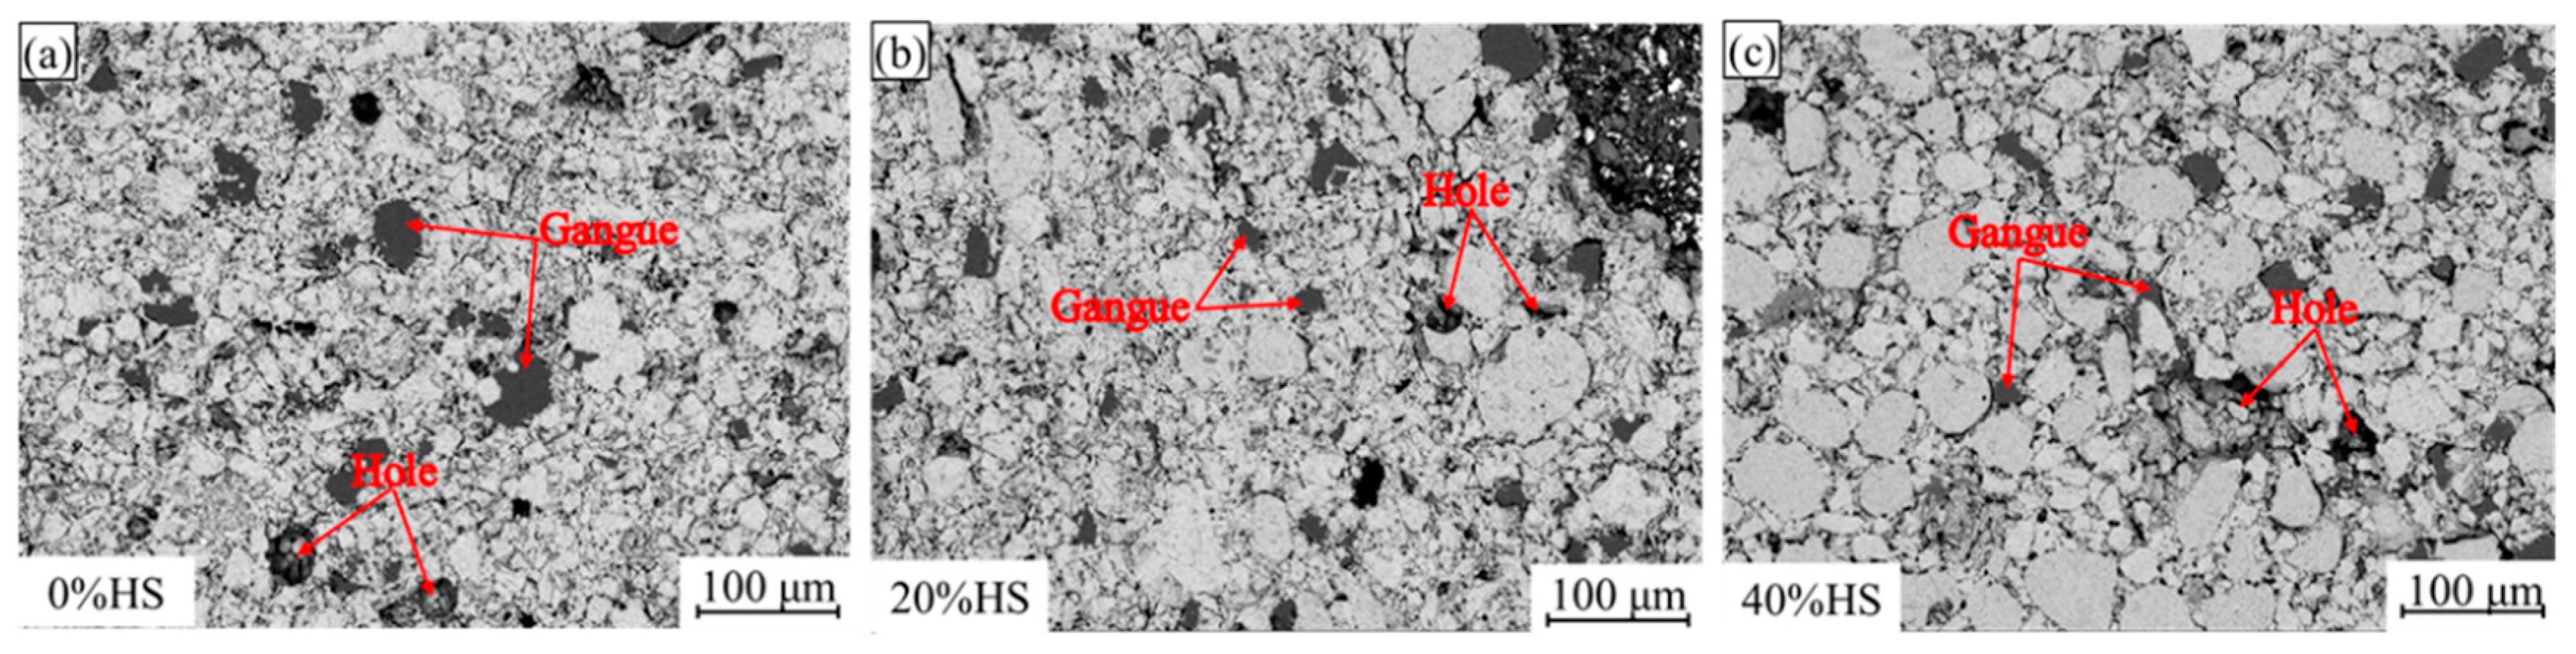
The compressive strength of pellets was mainly determined by the internal microstructure of pellets in the processes of oxidative roasting and consolidation. To further explore the change law of the compressive strength of sea sand ore pellets, the scanning electron microscopy-energy dispersive spectroscopy (SEM-EDS) was used to analyze the microscopic morphology of pellets, and the results are shown in Figure 7. As the amount of sea sand ore used increased, the coarser block particles inside the pellets gradually increased, the gaps between the particles became wider, and the holes became larger. When the amount of sea sand ore added was 20%, the particle size distribution in the pellets was relatively uniform, the holes were the smallest, and the compressive strength of the oxide pellets was the highest.
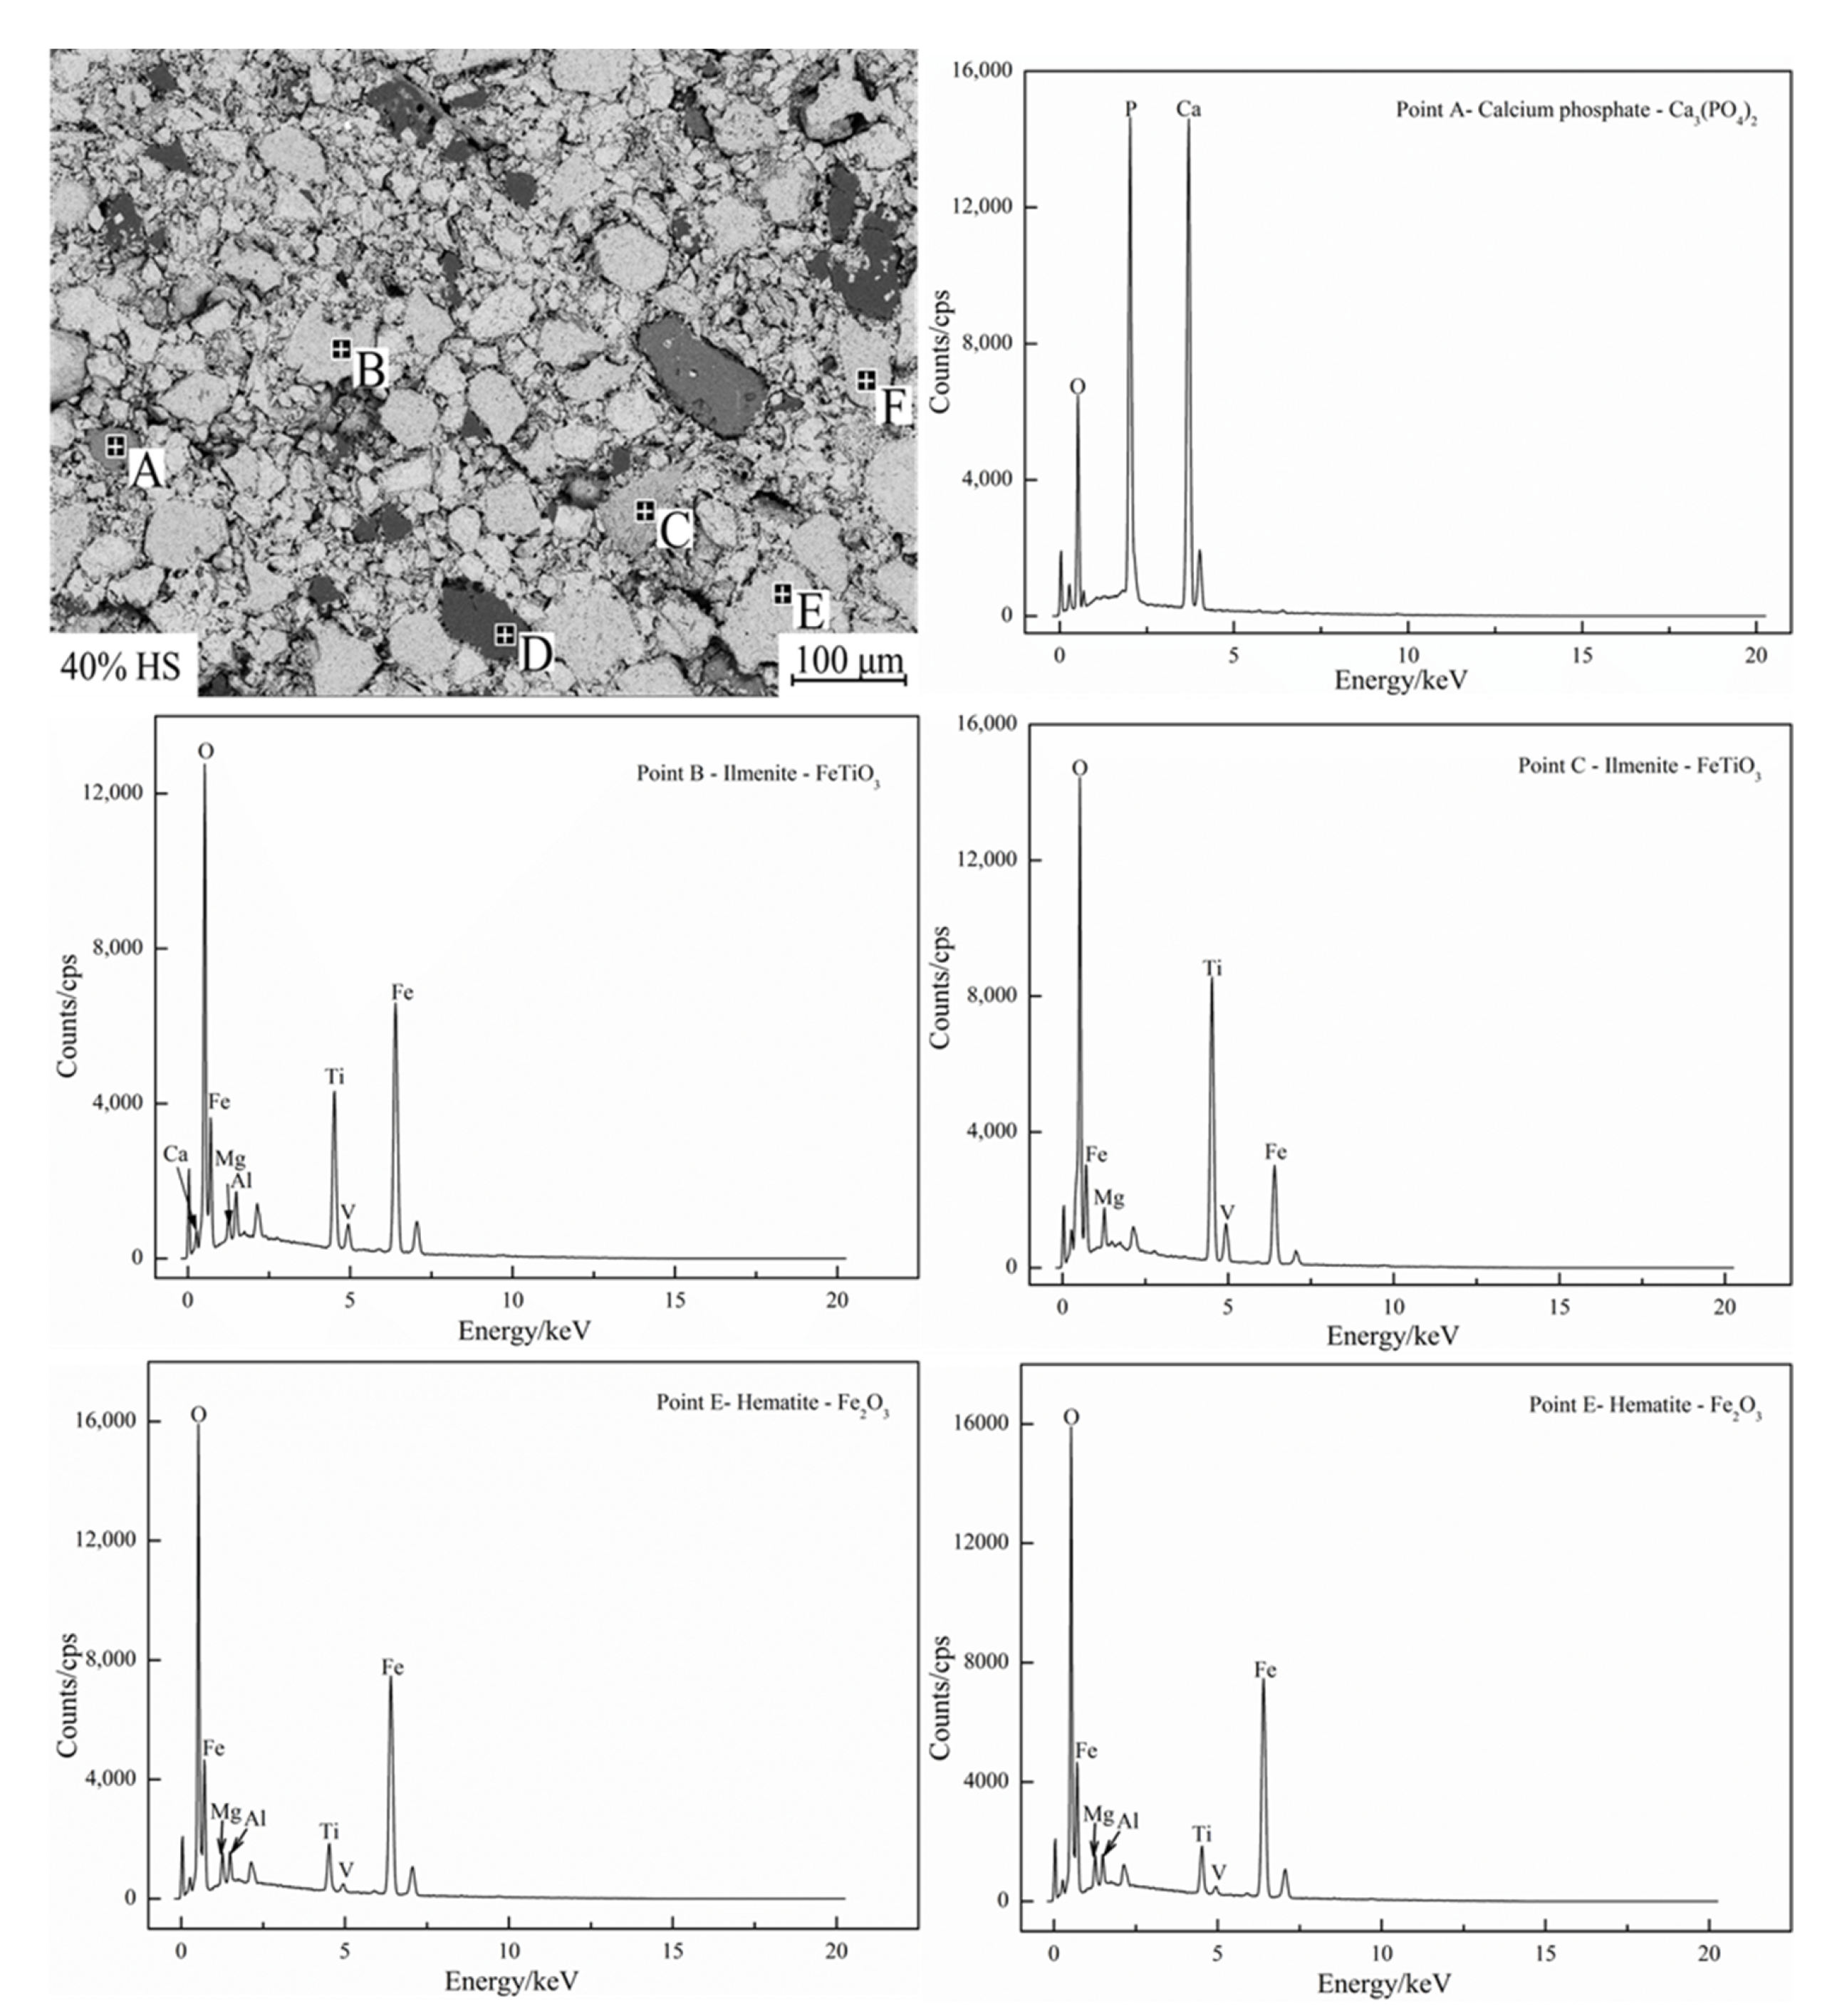
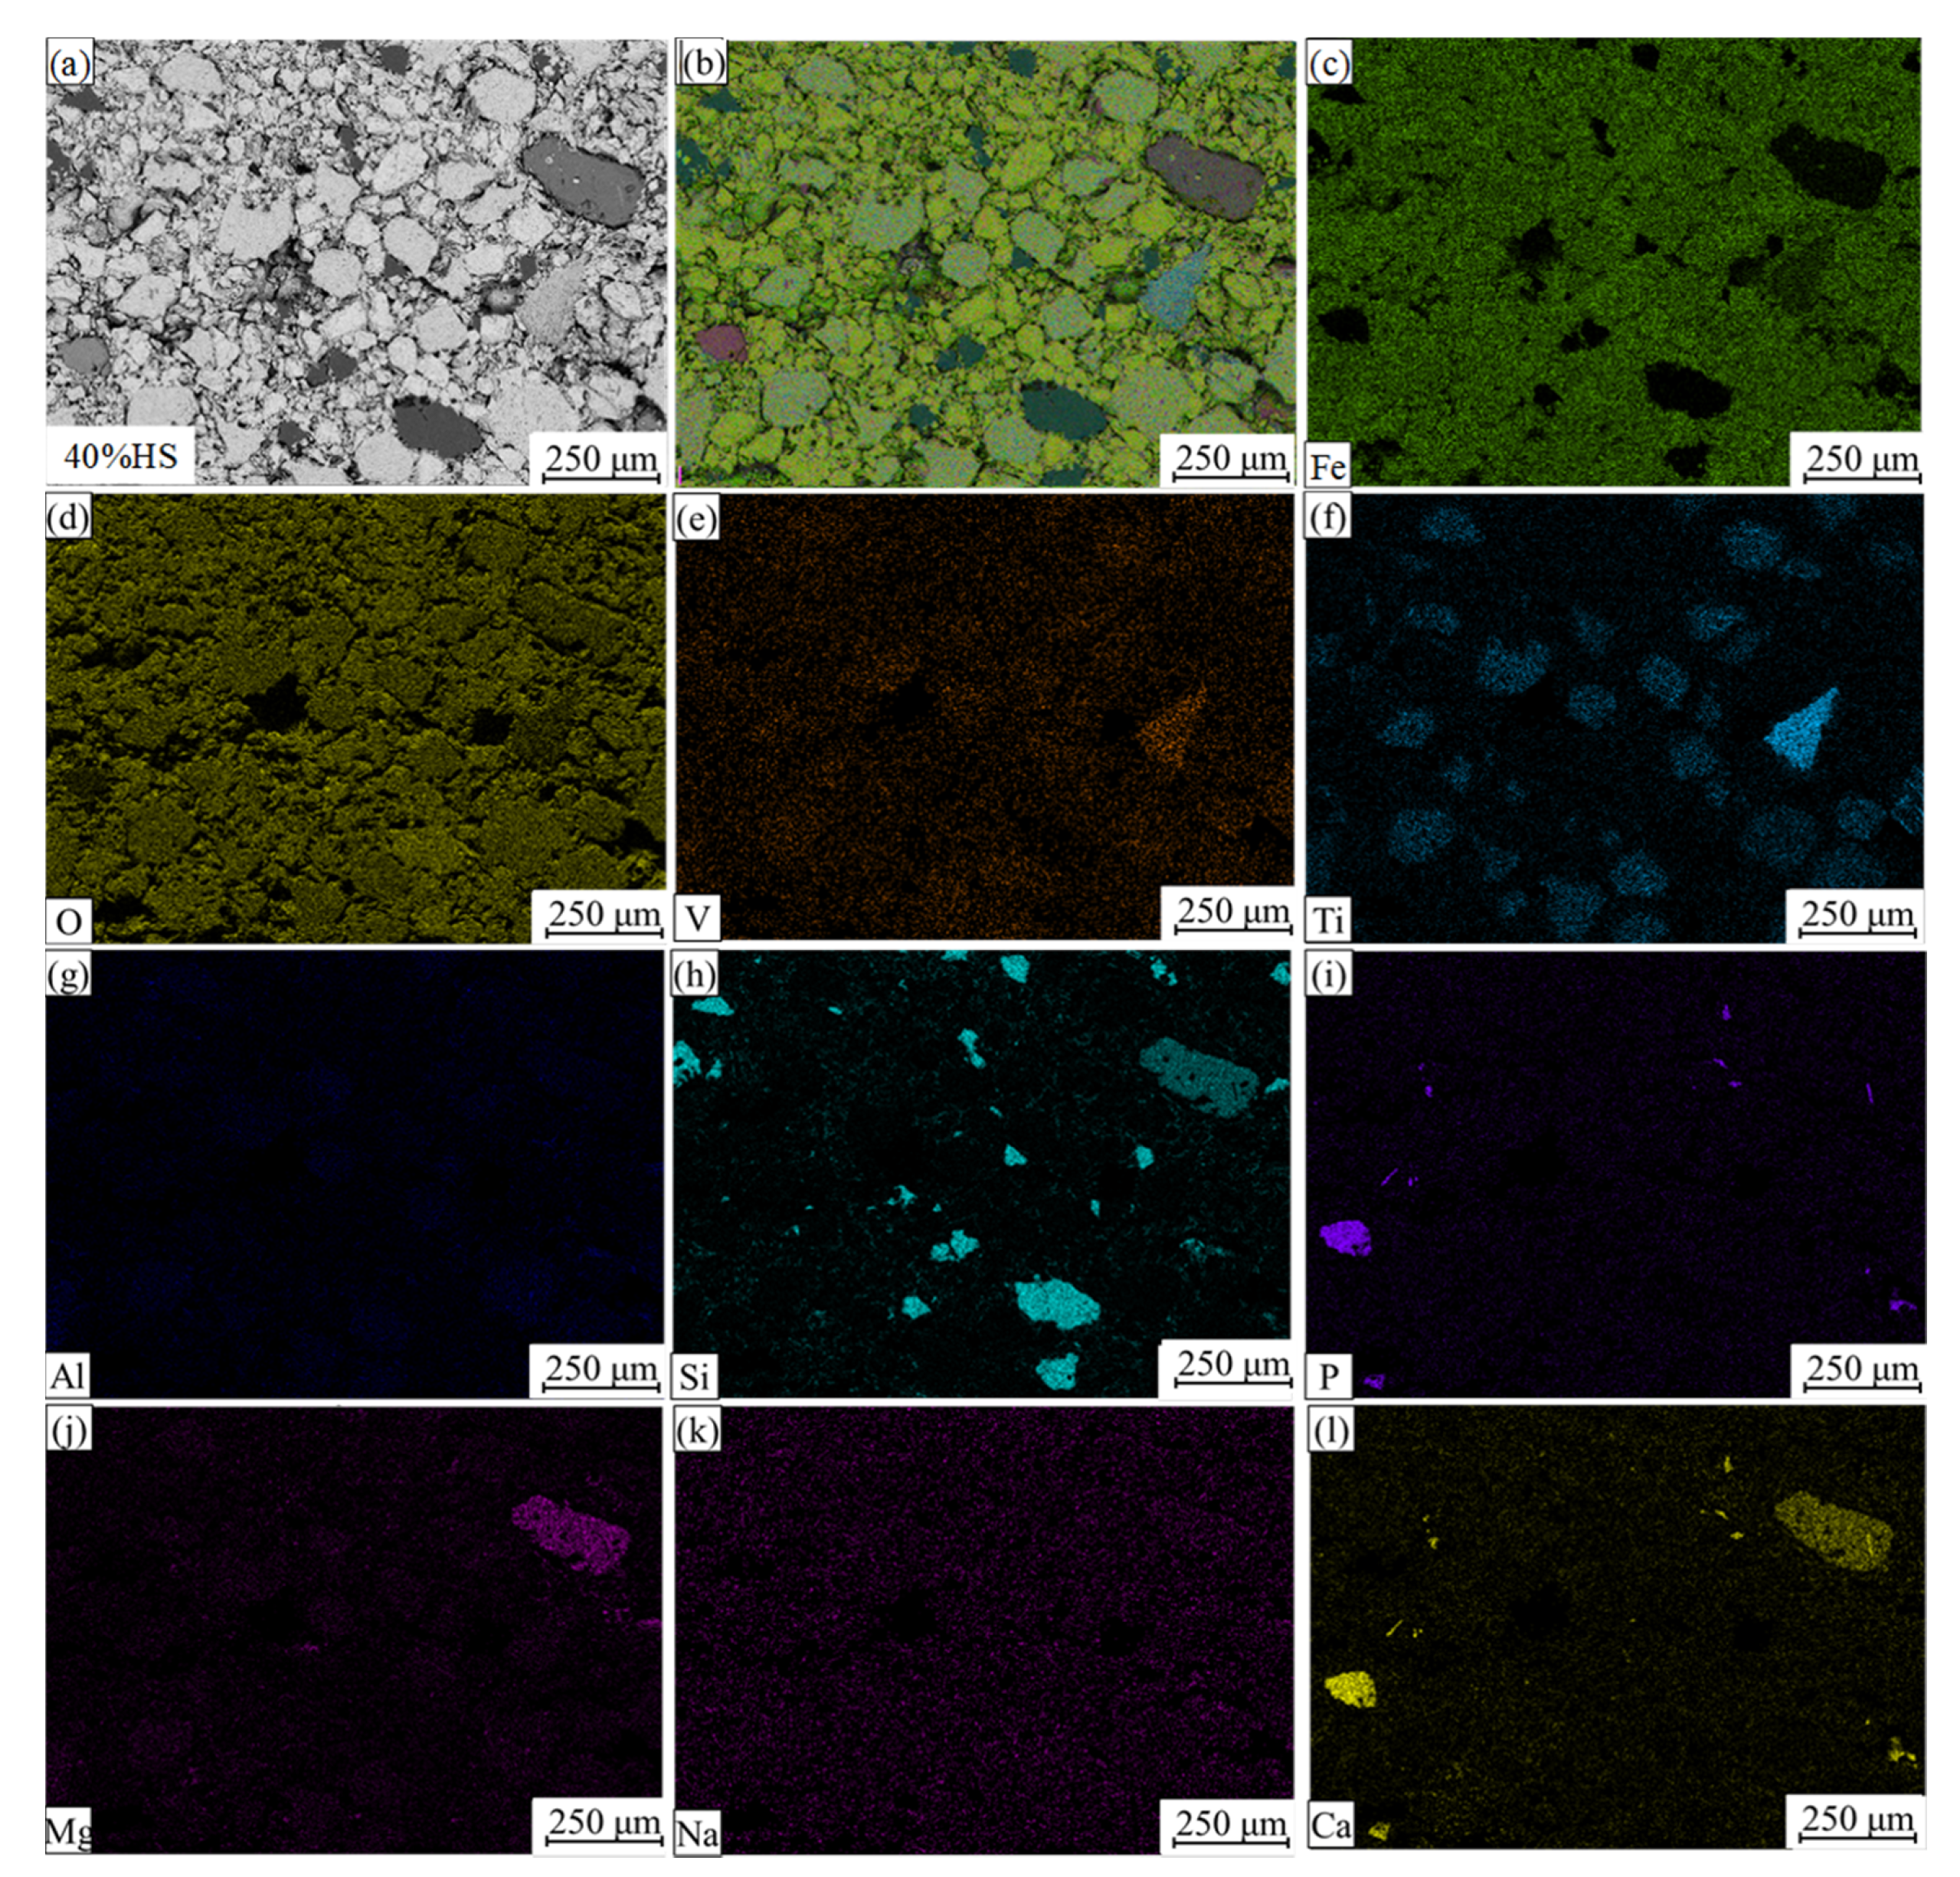
EDS and surface scanning were used to analyze the chemical composition of the internal mineral phases of oxidized pellets with the additive amount of 40% sea sand ore, and the results are shown in Figure 8 and Figure 9. Table 6 shows the compositions of the main phases in oxidized pellets with 40% sea sand ore detected by EDS (wt. %). Combined with SEM-EDS and surface scanning analysis, it can be seen that the oxidized pellets of sea sand ore were mainly composed of hematite, ilmenite, silica, and calcium phosphate phases. The light gray area A was mainly the slag phase, such as calcium phosphate. The light gray areas B and C were ilmenite phases containing a small number of elements, such as Mg and V. The black area D was gangue phases, such as SiO2. The white areas of E and F were mainly hematite phase and a small amount of solid solution oxides, such as Ti and V. It can be seen from Figure 9 that Ti was mainly distributed in the ilmenite phase, V was mainly distributed in the ilmenite phase and hematite phase, and the slag phase mainly contained Mg, Al, Si, Ca, P, and other elements.
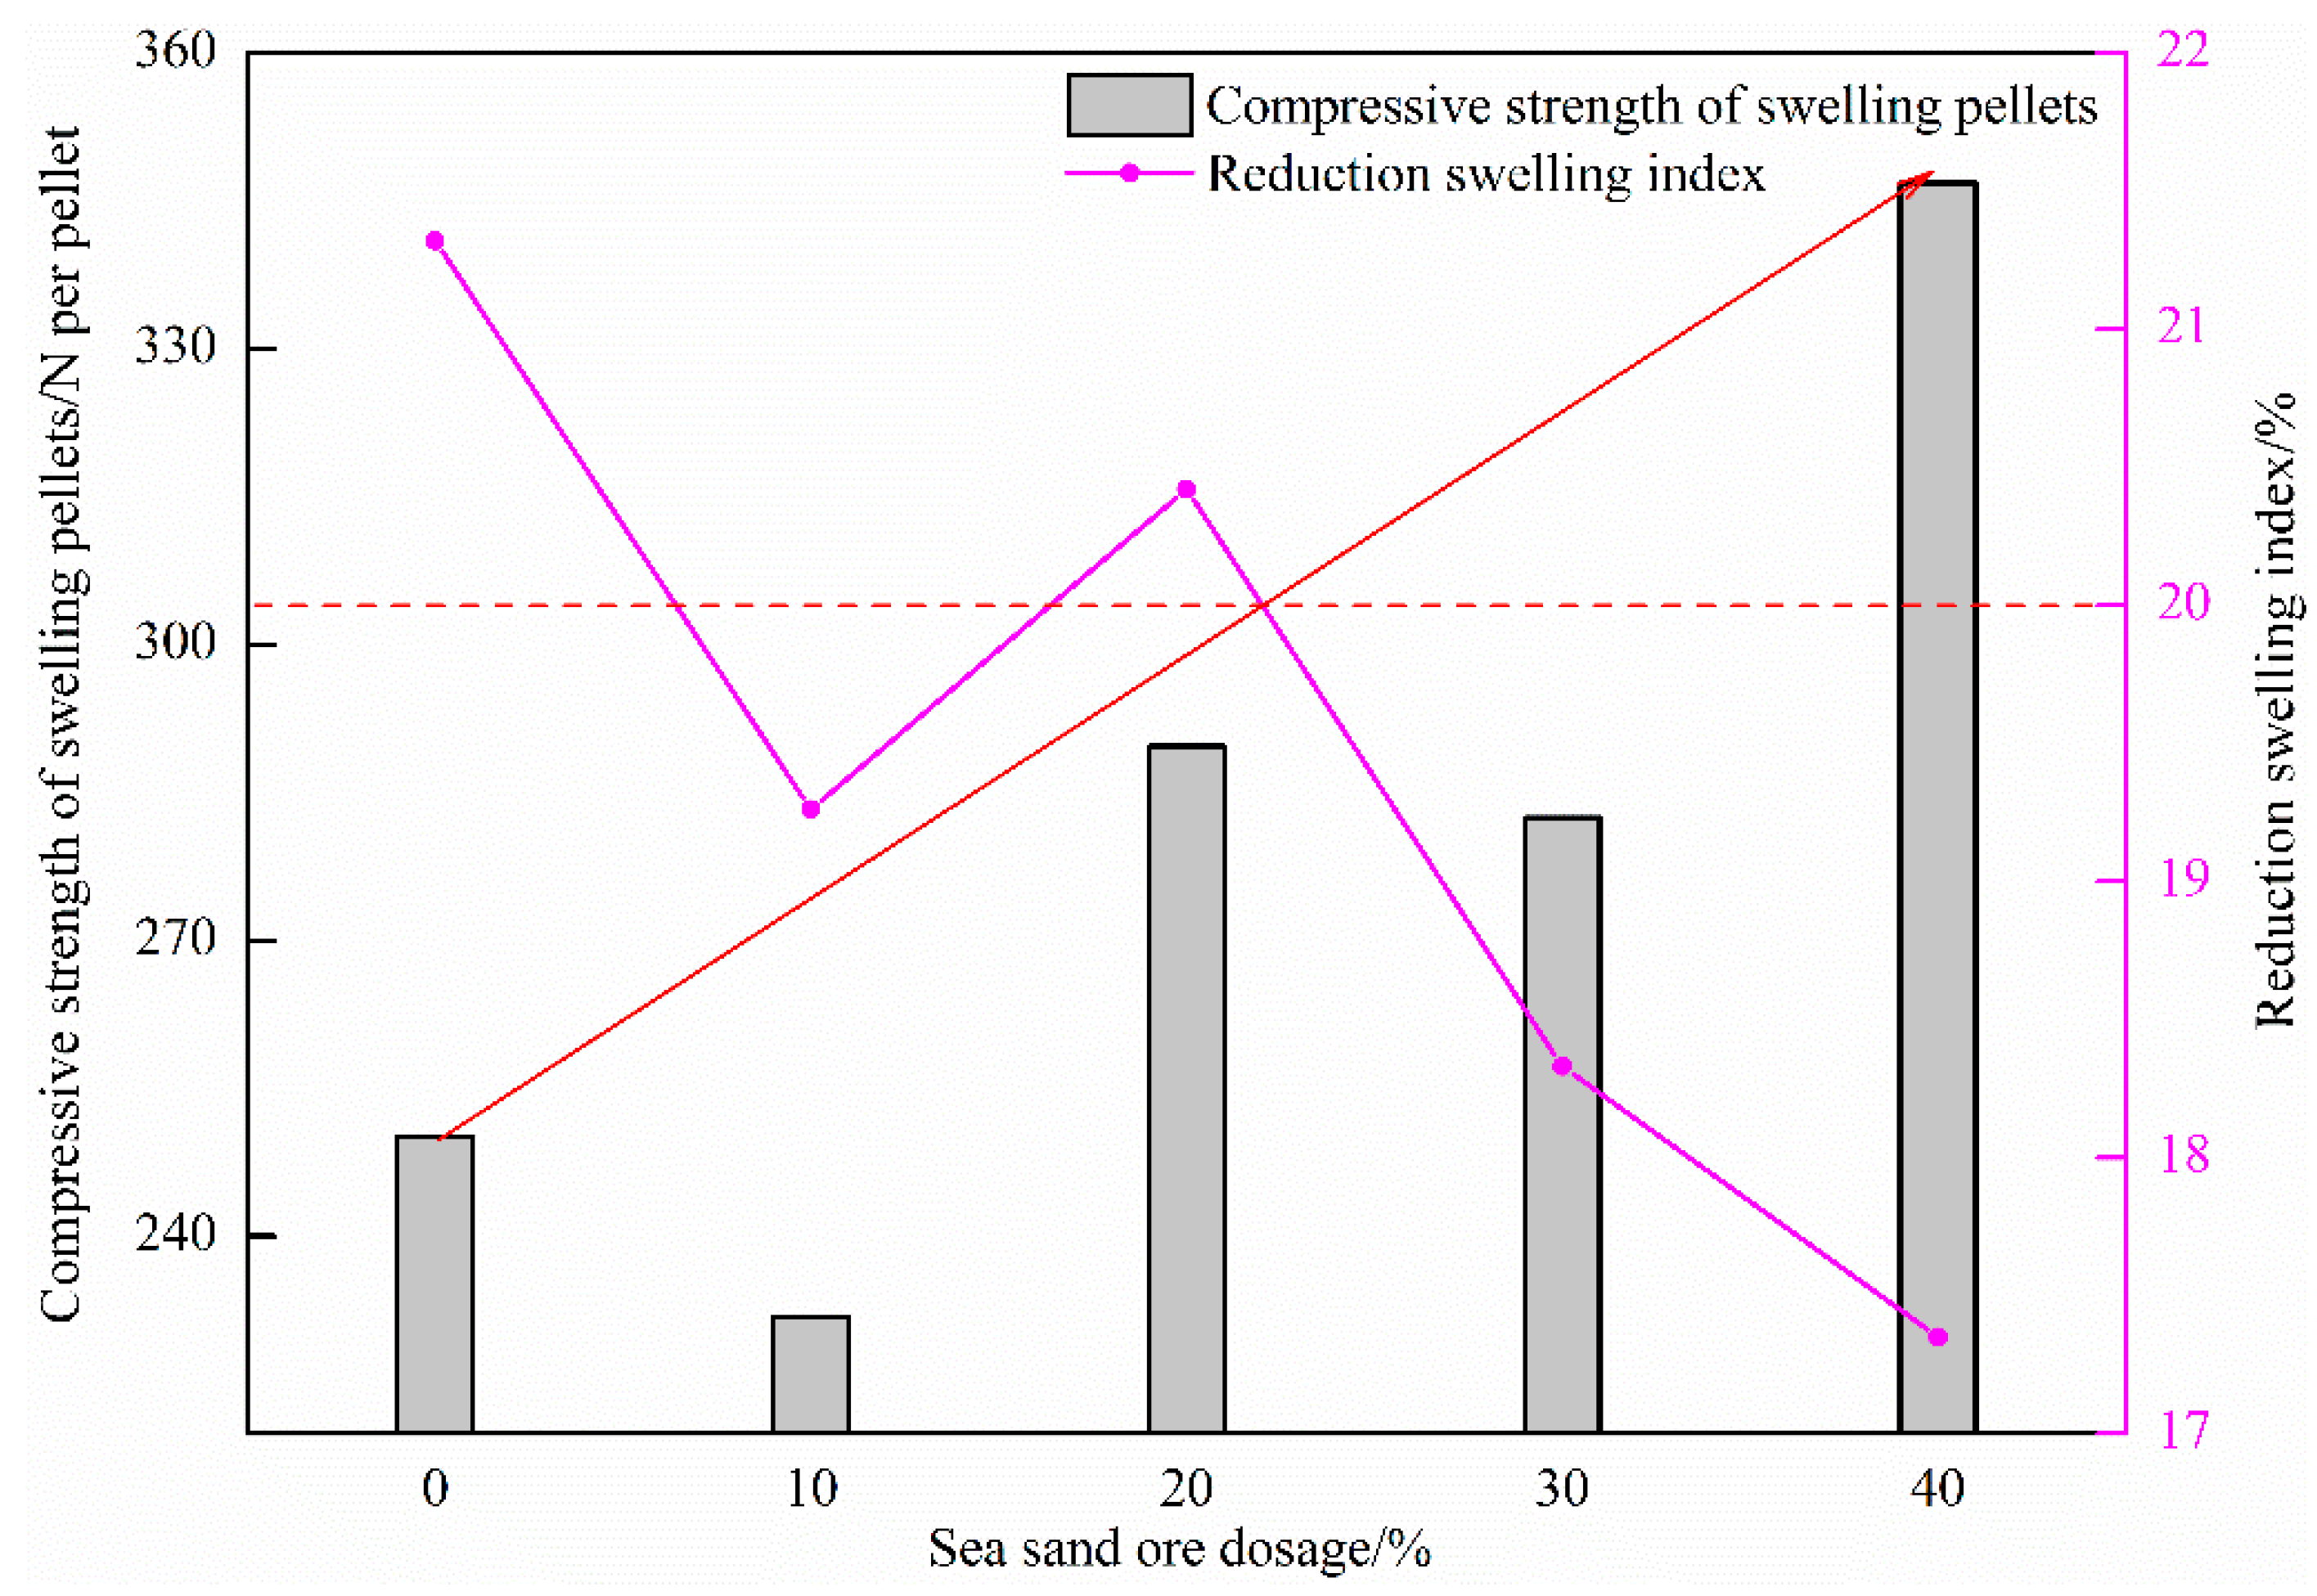
Figure 10 shows the influence of the amount of sea sand ore used on the reduction swelling index of oxidized pellets and the compressive strength of swelling pellets. It can be seen from the figure that with the increase of the amount of sea sand ore added, the reduction swelling index of the pellets generally showed a downward trend, and the compressive strength of the swelling pellets gradually increased. When the amount of sea sand ore added was 0%, the reduction swelling index of pellets was the highest, which was 21.32%. When the amount of sea sand ore added was 40%, the reduction swelling index of pellets was the lowest, which was 17.35%. The maximum compressive strength of the swelling pellet was 346.78 N/pellet.
The phases of the sea sand ore pellets after reduction swelling were analyzed by XRD. The results are shown in Figure 11. With the gradual increase in the amount of sea sand ore, the Ti-containing phases that were difficult to reduce increased, which hindered the phase transformation process of Fe2O3-Fe3O4 and reduced the reduction swelling rate. In addition, the pulverization happened after reduction swelling, and it was difficult to ensure the crystalline strength between pellet particles simply by relying on iron oxide recrystallization connection. However, as the amount of sea sand ore added increased, the reduction degree of pellets decreased, resulting in less phase transformation of pellets, but the phase of oxidized pellets was still maintained. Therefore, with the decrease of reduction swelling rate, the compressive strength of the pellets after swelling increased.
3.3. Effect of Sea Sand Ore Dosage on the Reduction Degree of Oxidized Pellets
3.3.1. Detection and Analysis of the Reduction Degree of Oxidized Pellets
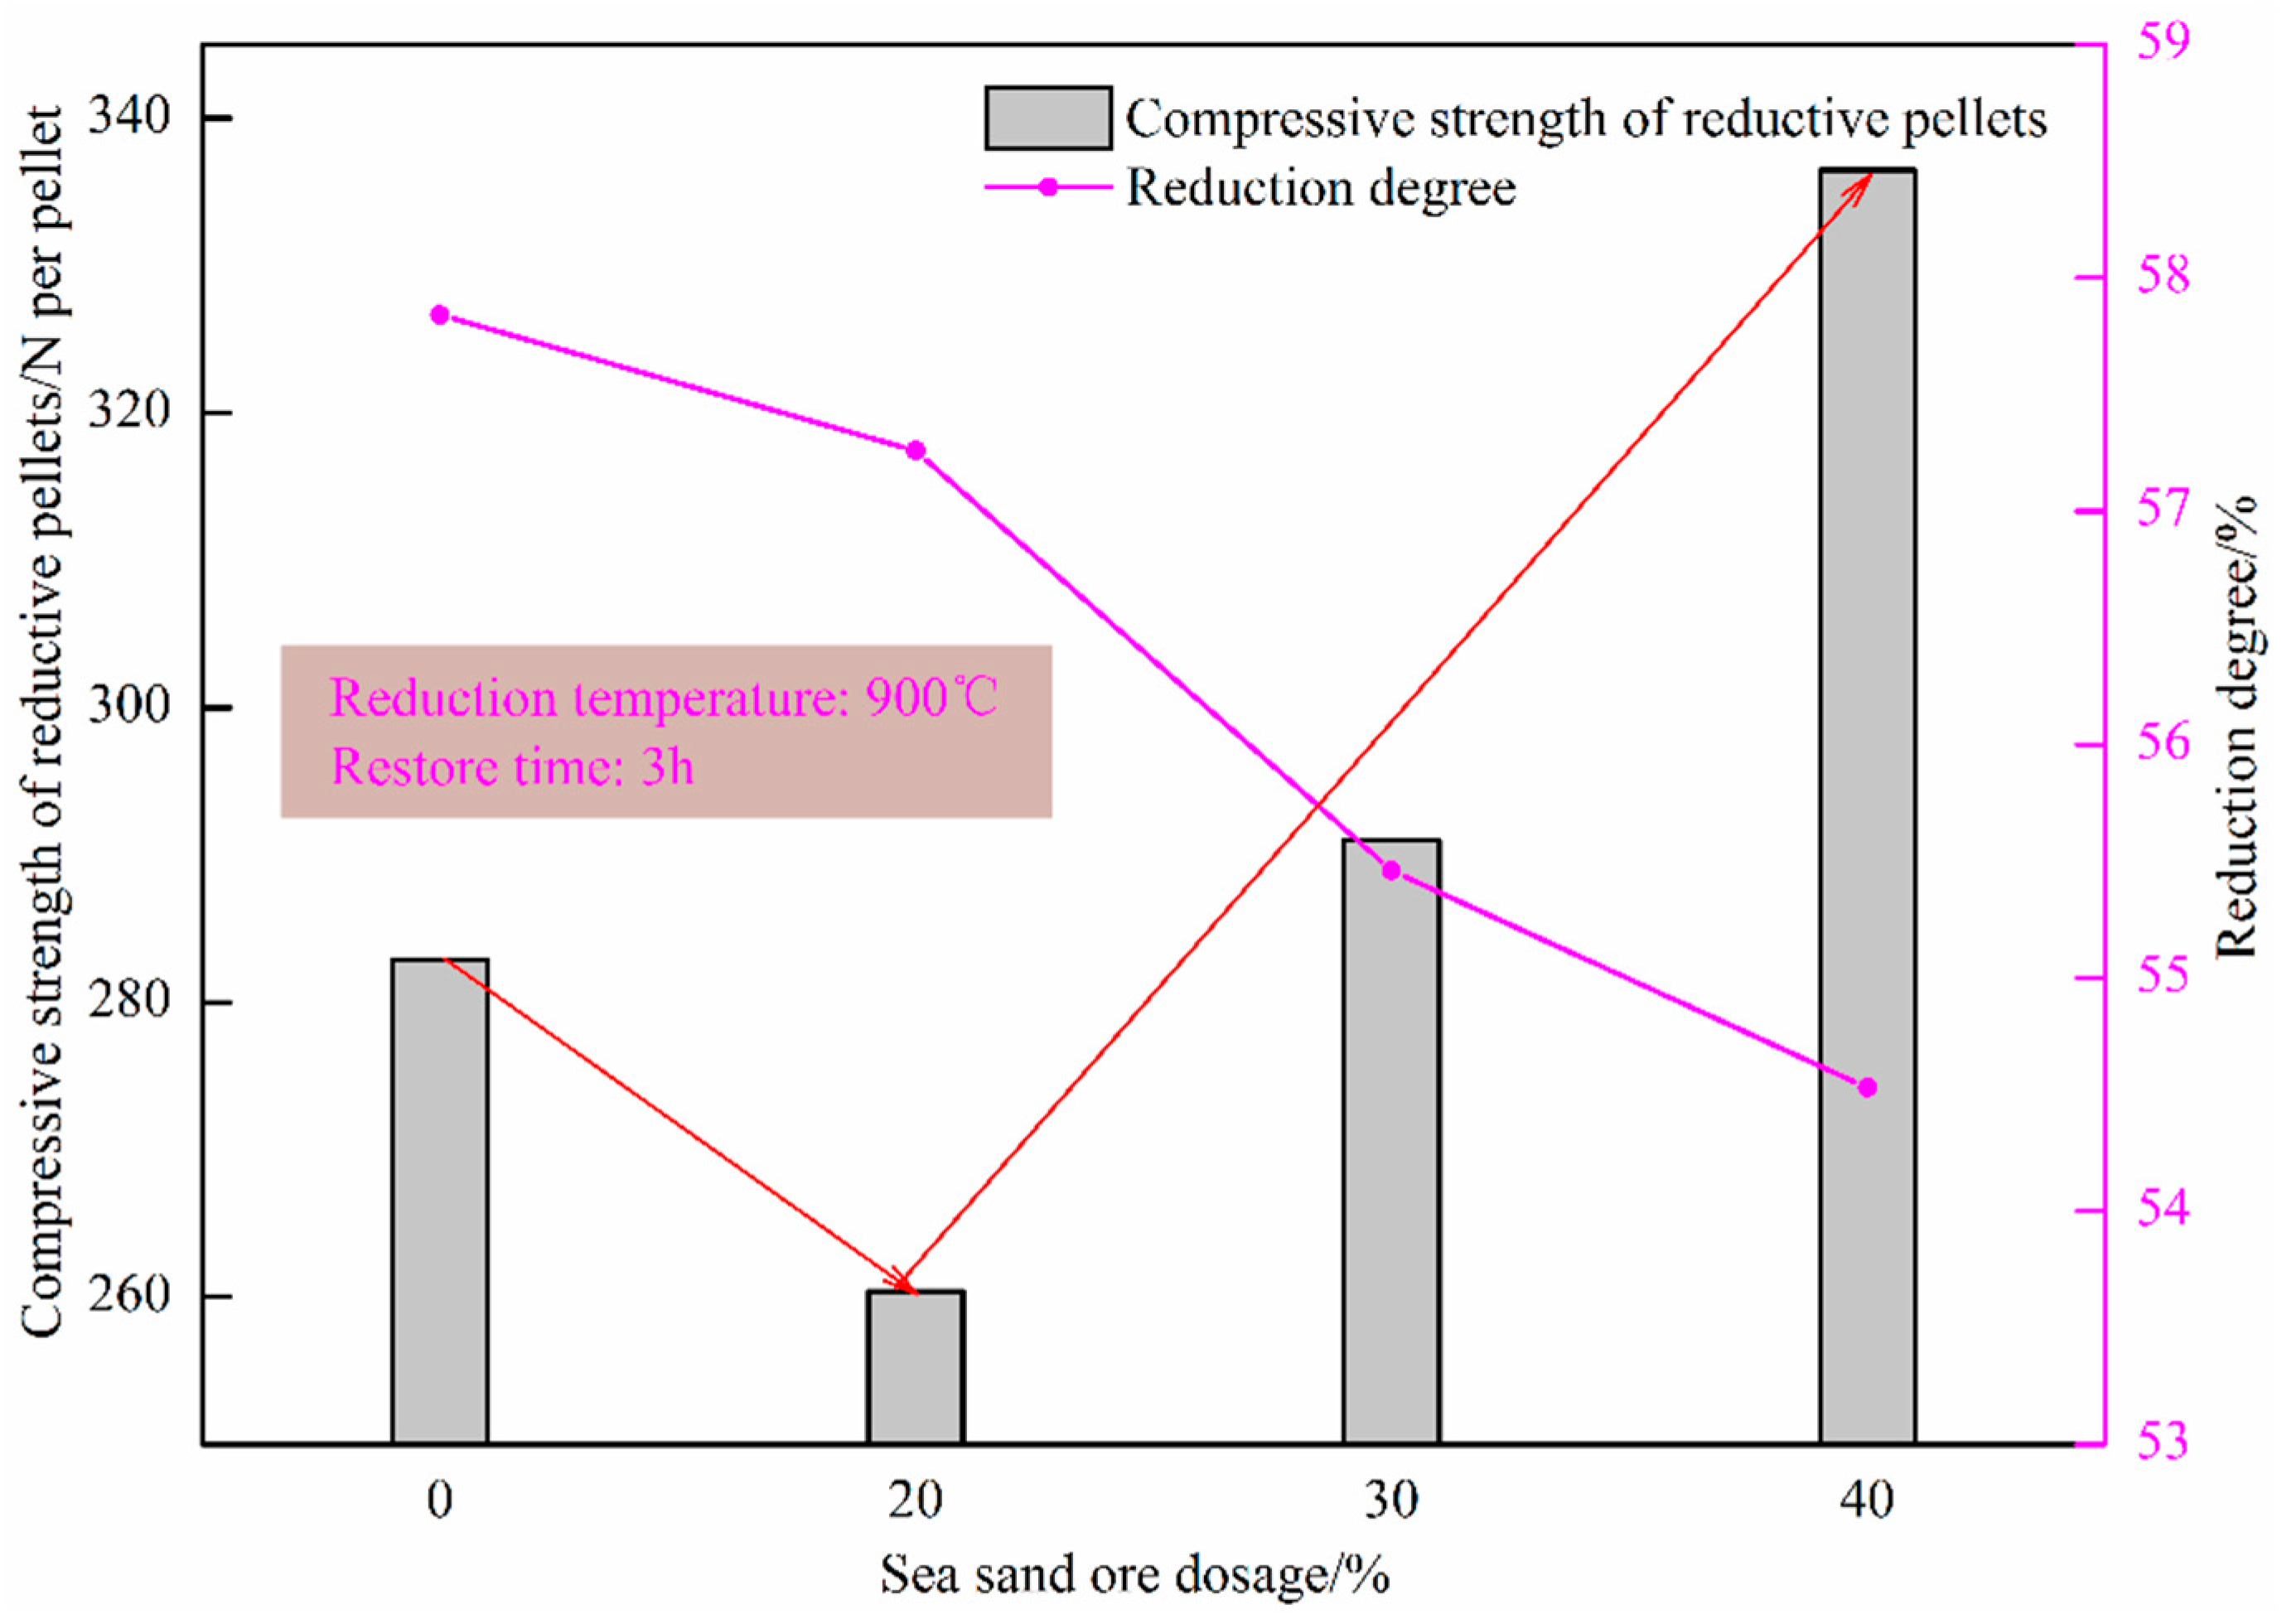
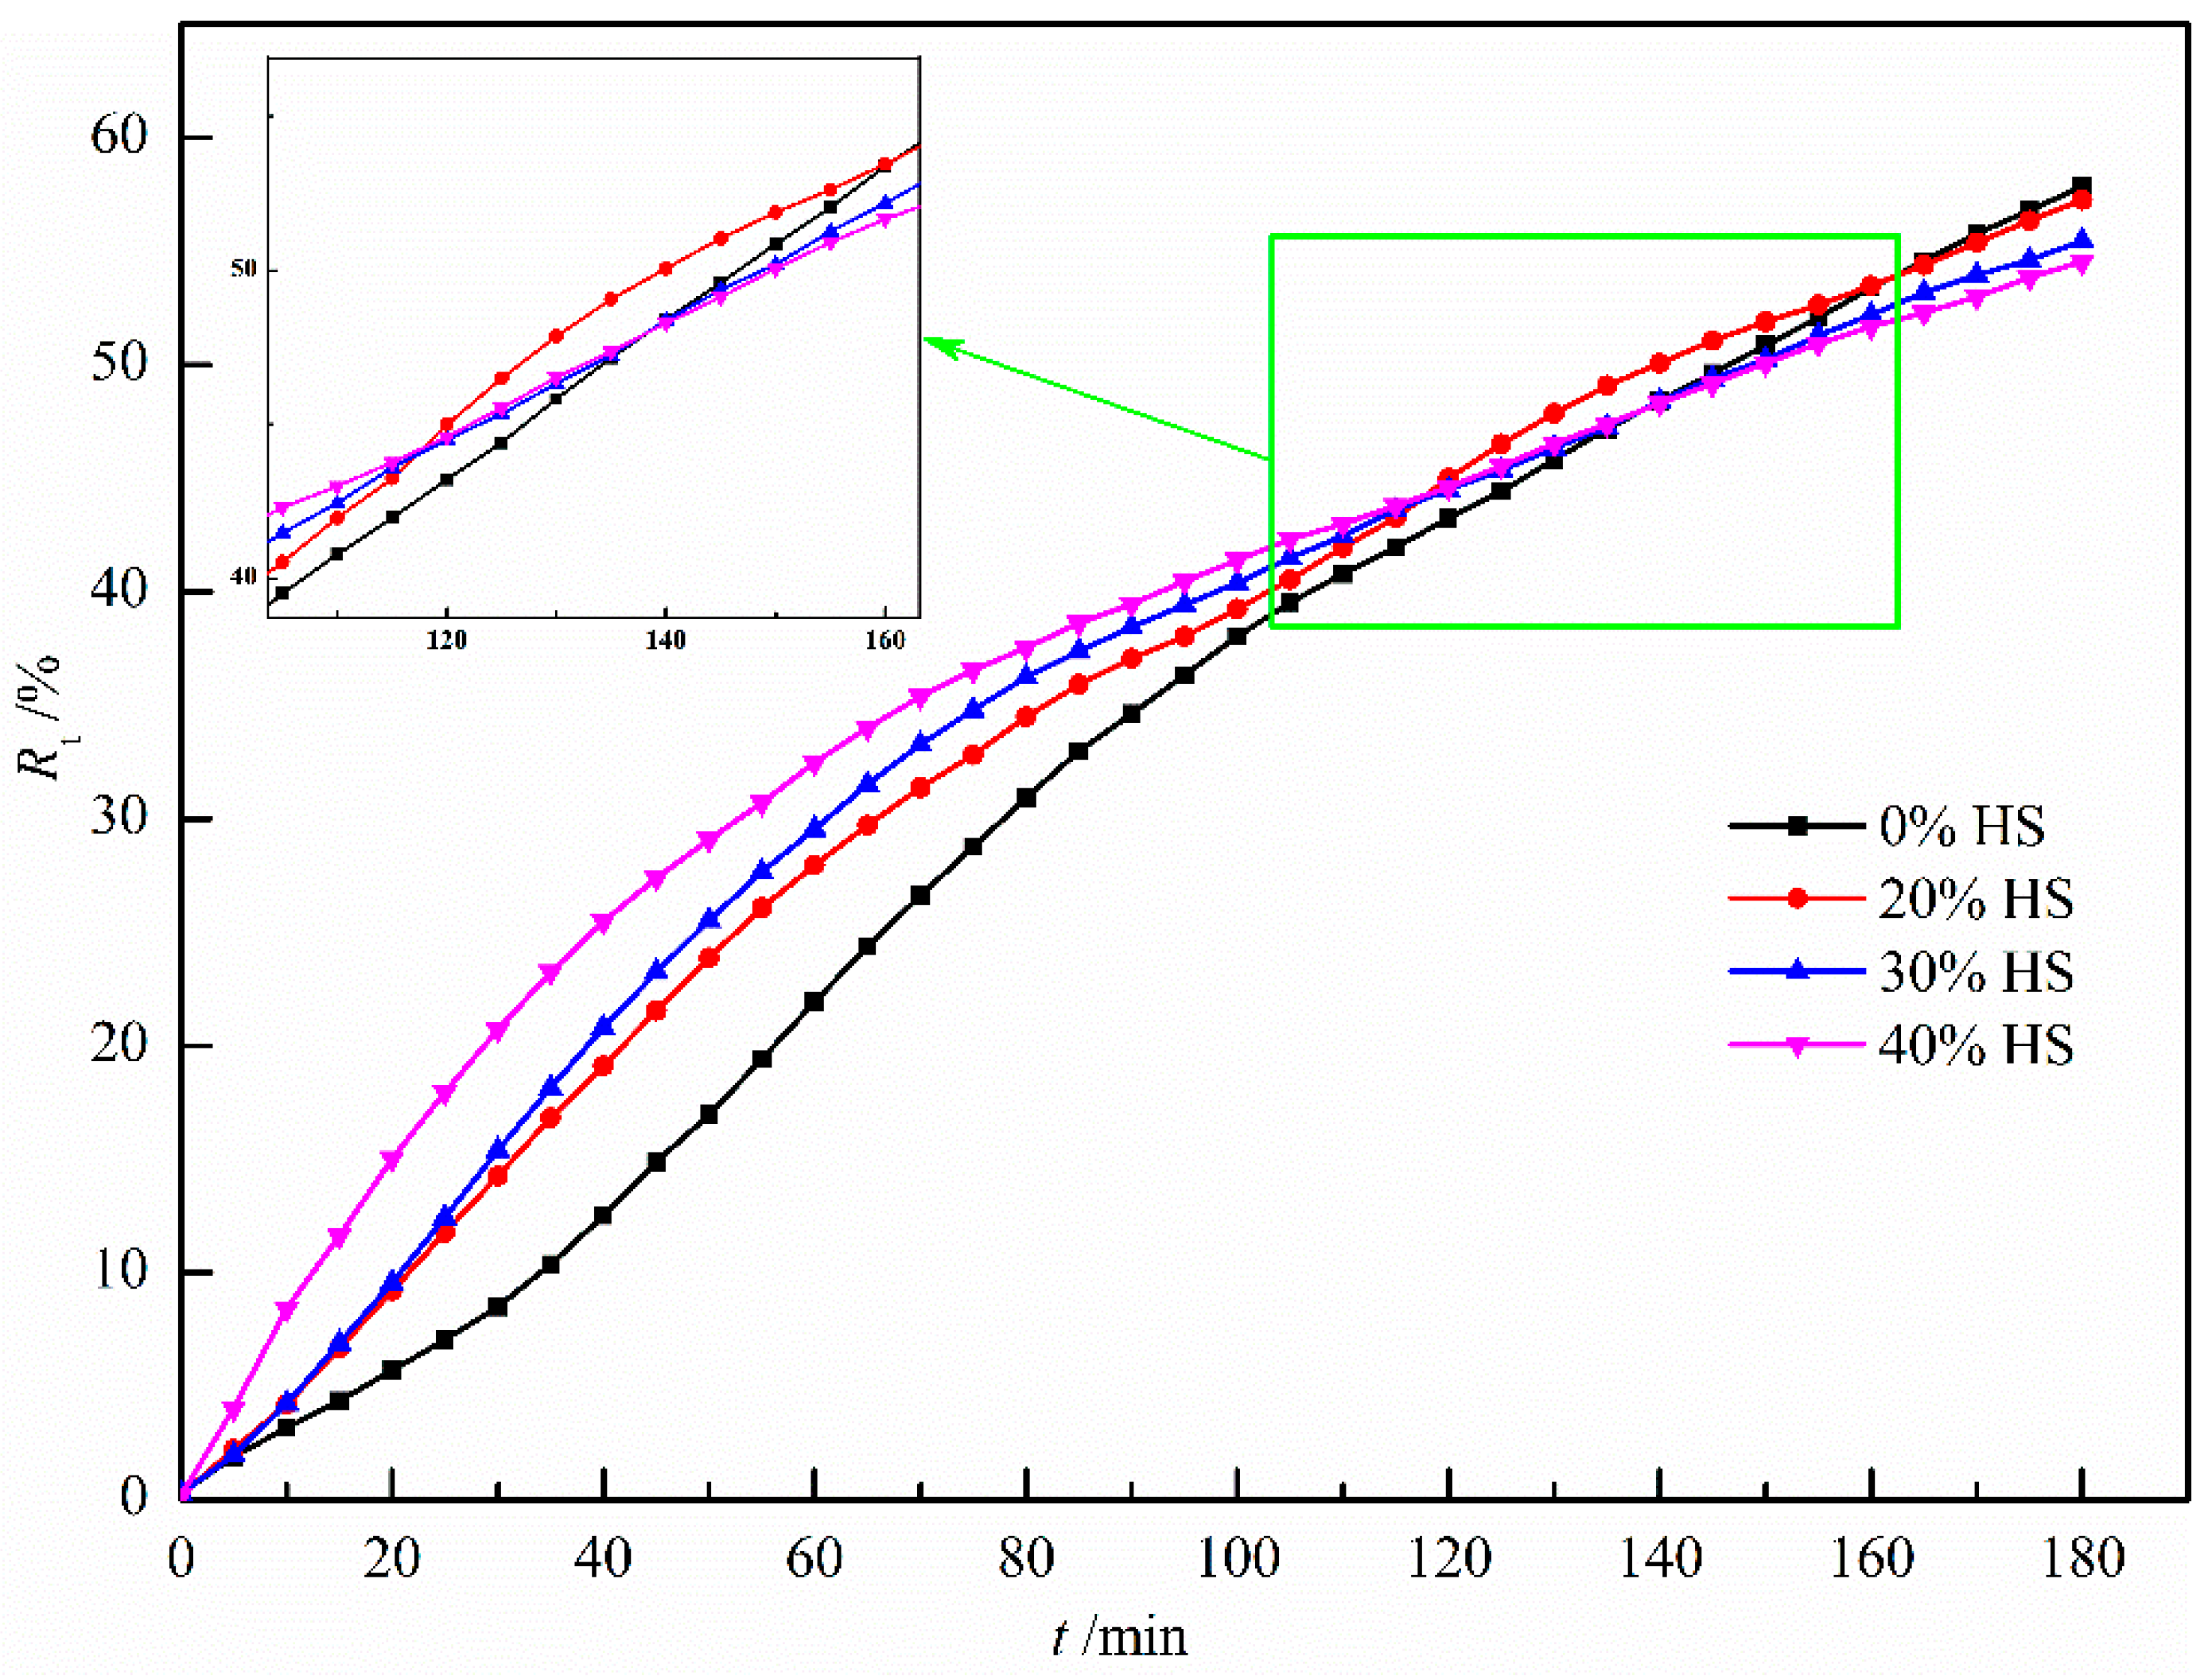
Figure 12 shows the effect of sea sand ore dosage on the reduction degree of oxidized pellets and the compressive strength of pellets after reduction. It can be seen from the figure that the reduction degree of the pellets gradually decreased with the increase in the amount of sea sand ore added. When the amount of sea sand ore added was 40%, the reduction degree of sea sand ore pellets was the lowest, only 54.53%, and the compressive strength of the reductive pellets was the largest, 336.50 N/pellet. The main reason was that the sea sand ore was vanadia–titanium ore and the pellets contained valuable elements such as Ti and V, which are difficult to reduce, resulting in a decrease in reduction degree and insufficient reduction of the pellets. Combining the analysis of the change curve of reduction degree with the extension of reduction time in Figure 13, it can be seen that in the initial stage of reduction, with the increase of the amount of sea sand ore added, the particles inside the pellets were uniformly distributed, which was beneficial to the diffusion of reducing gas. Therefore, the reduction rate of the pellets in the early stage was faster. When the reduction time was 120 min, with the increase of the amount of sea sand ore added, the reduction rate of pellets gradually decreased due to the influence of valuable elements, such as Ti and V, which were difficult to reduce.
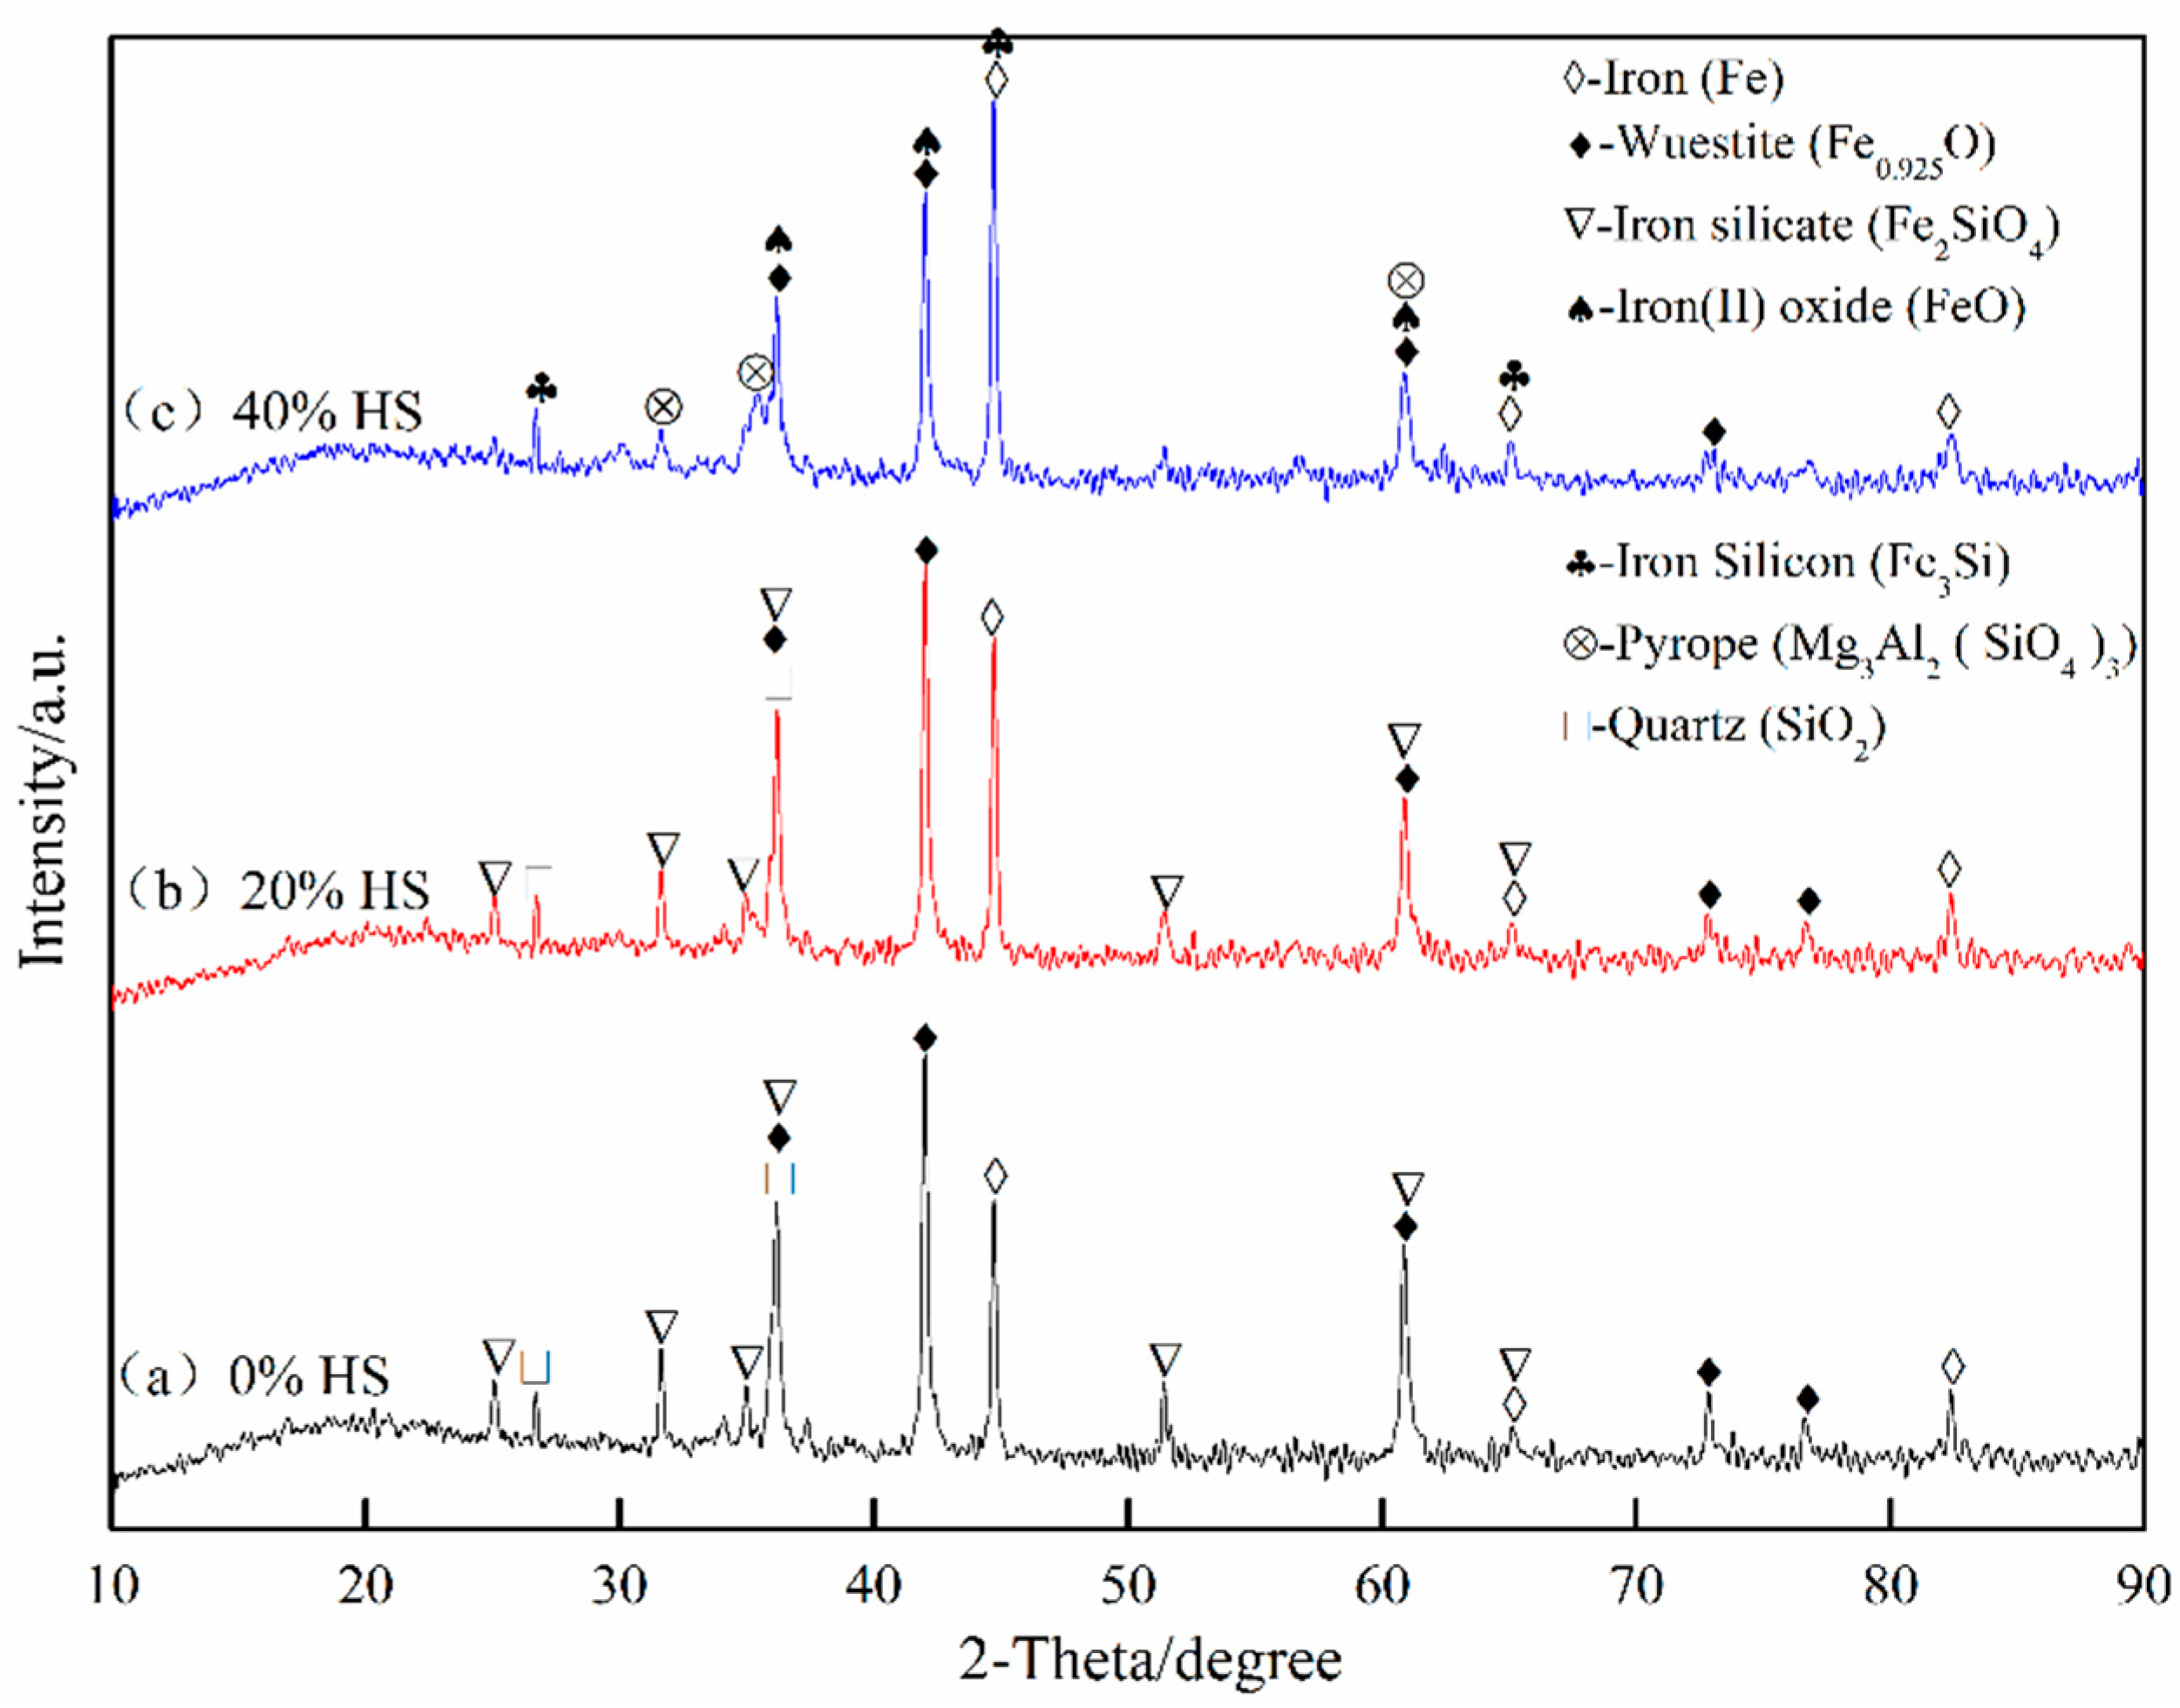
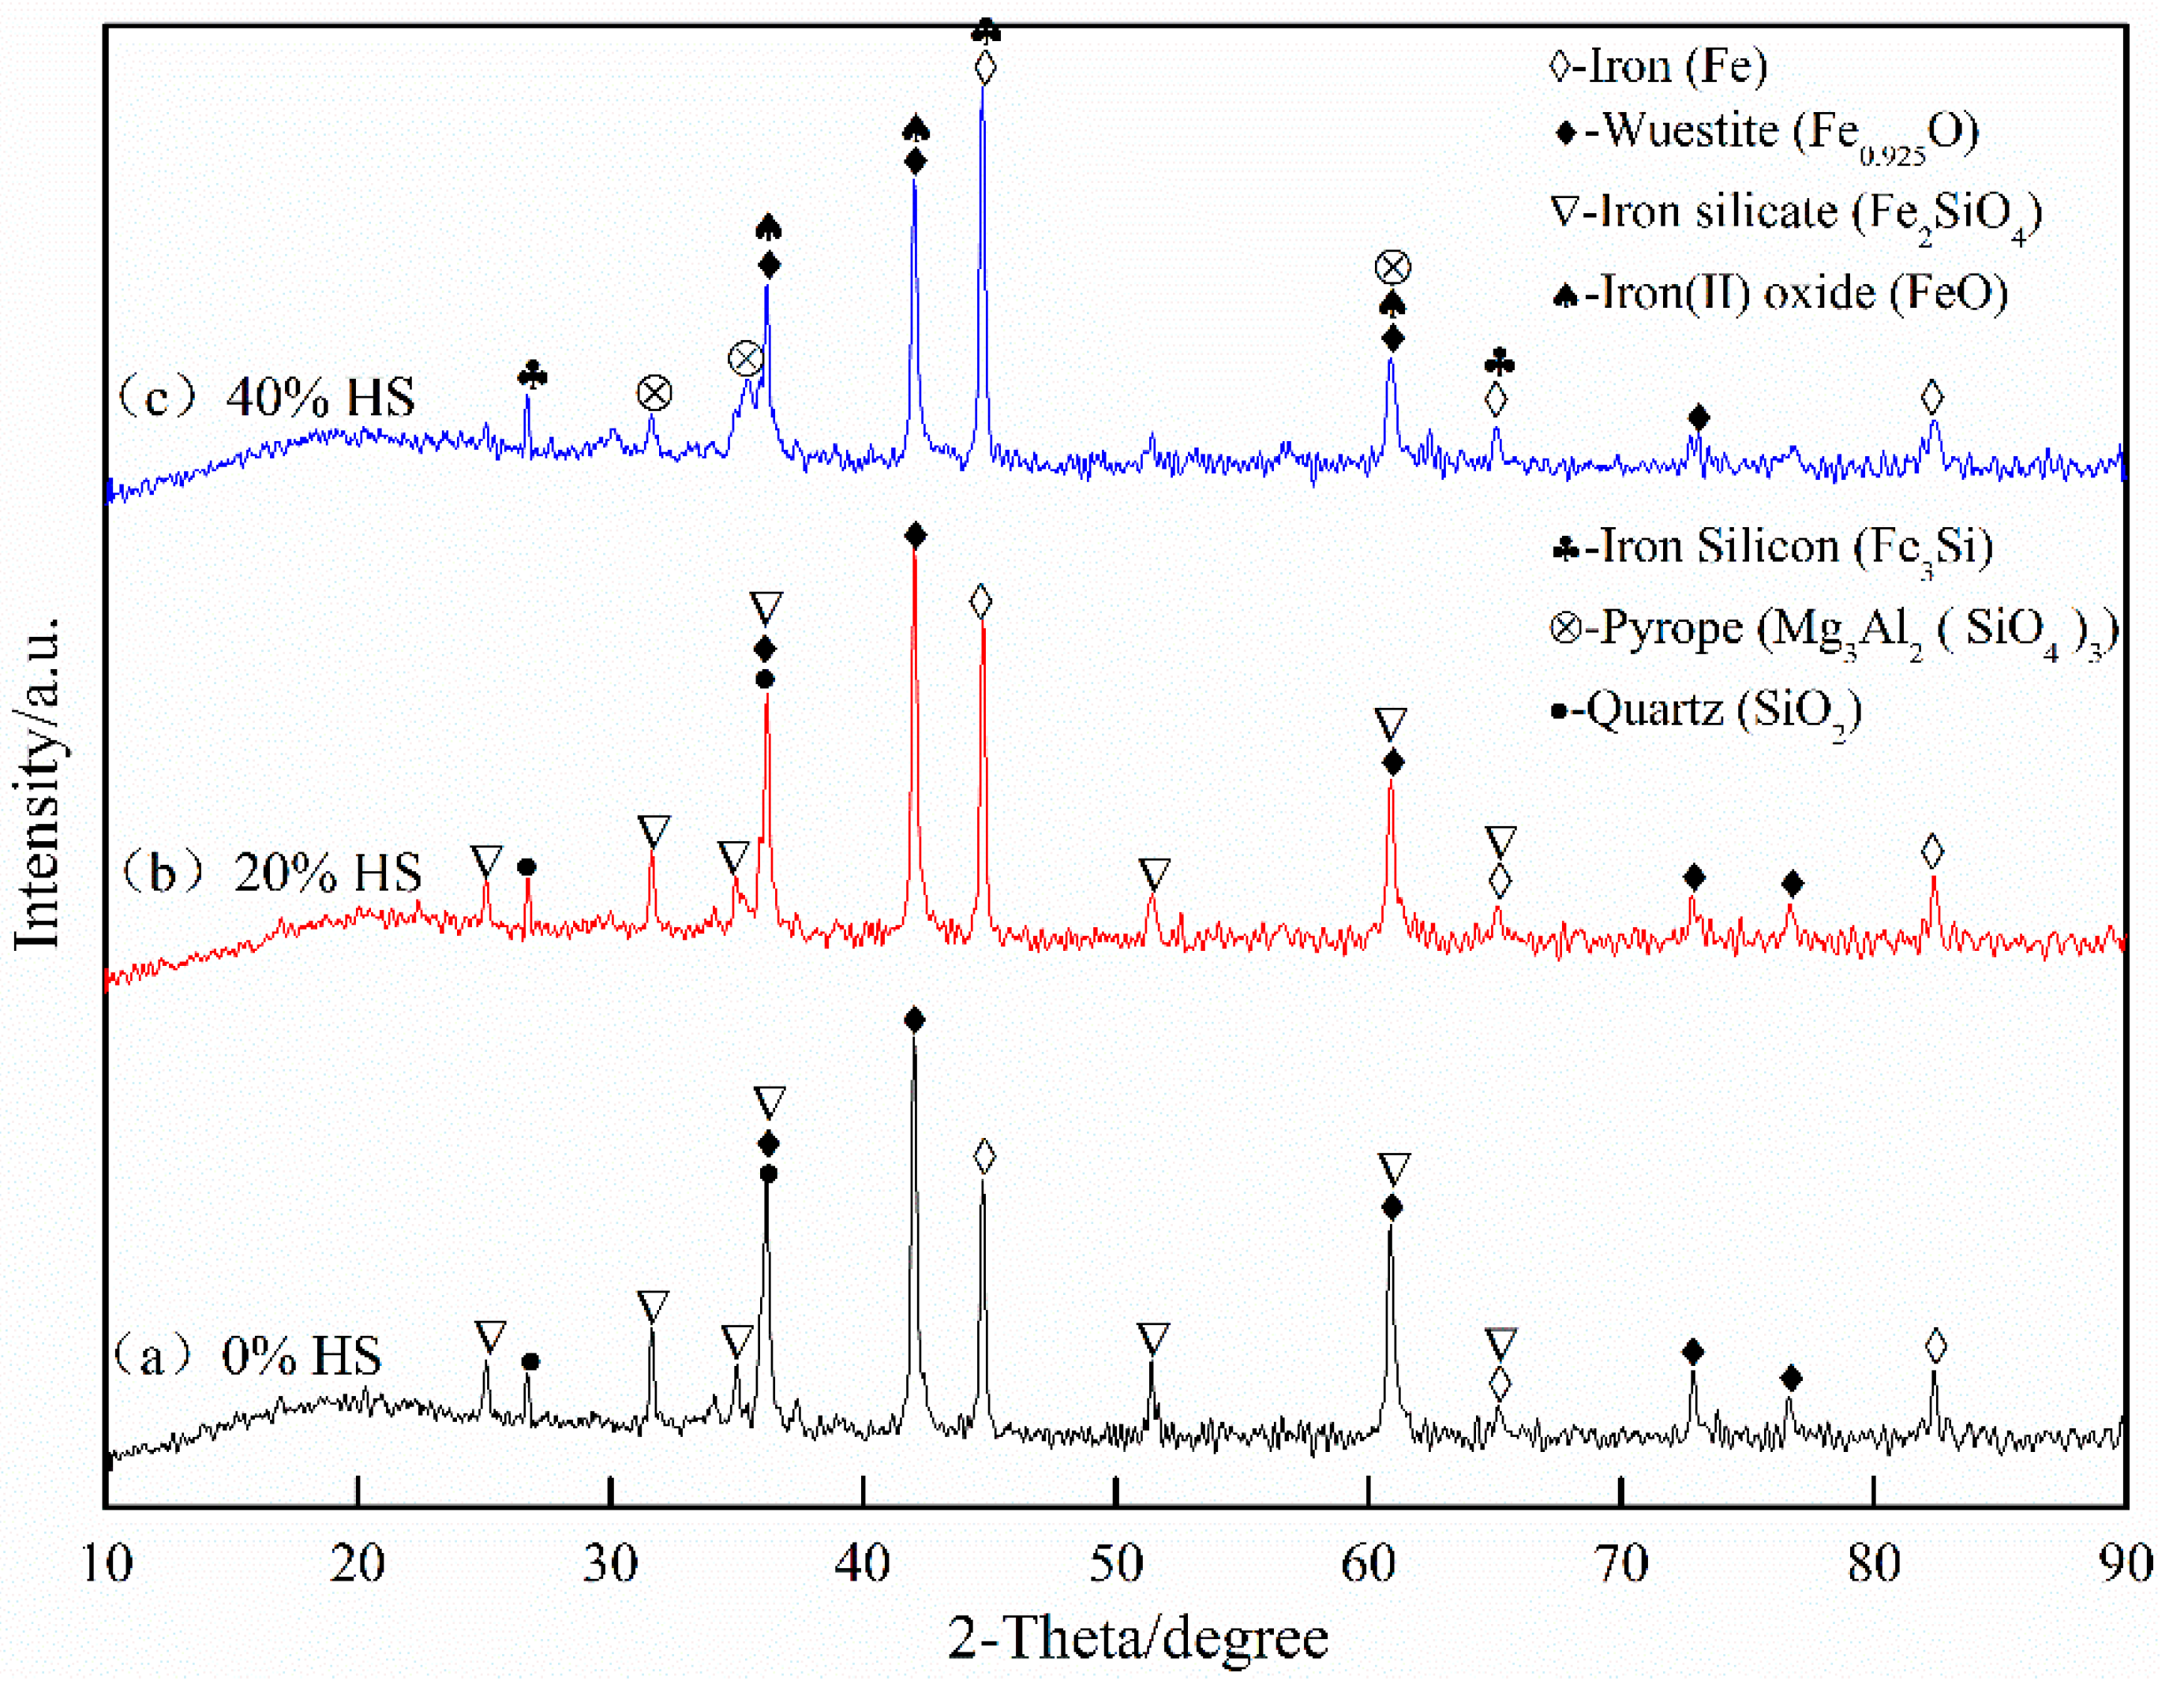
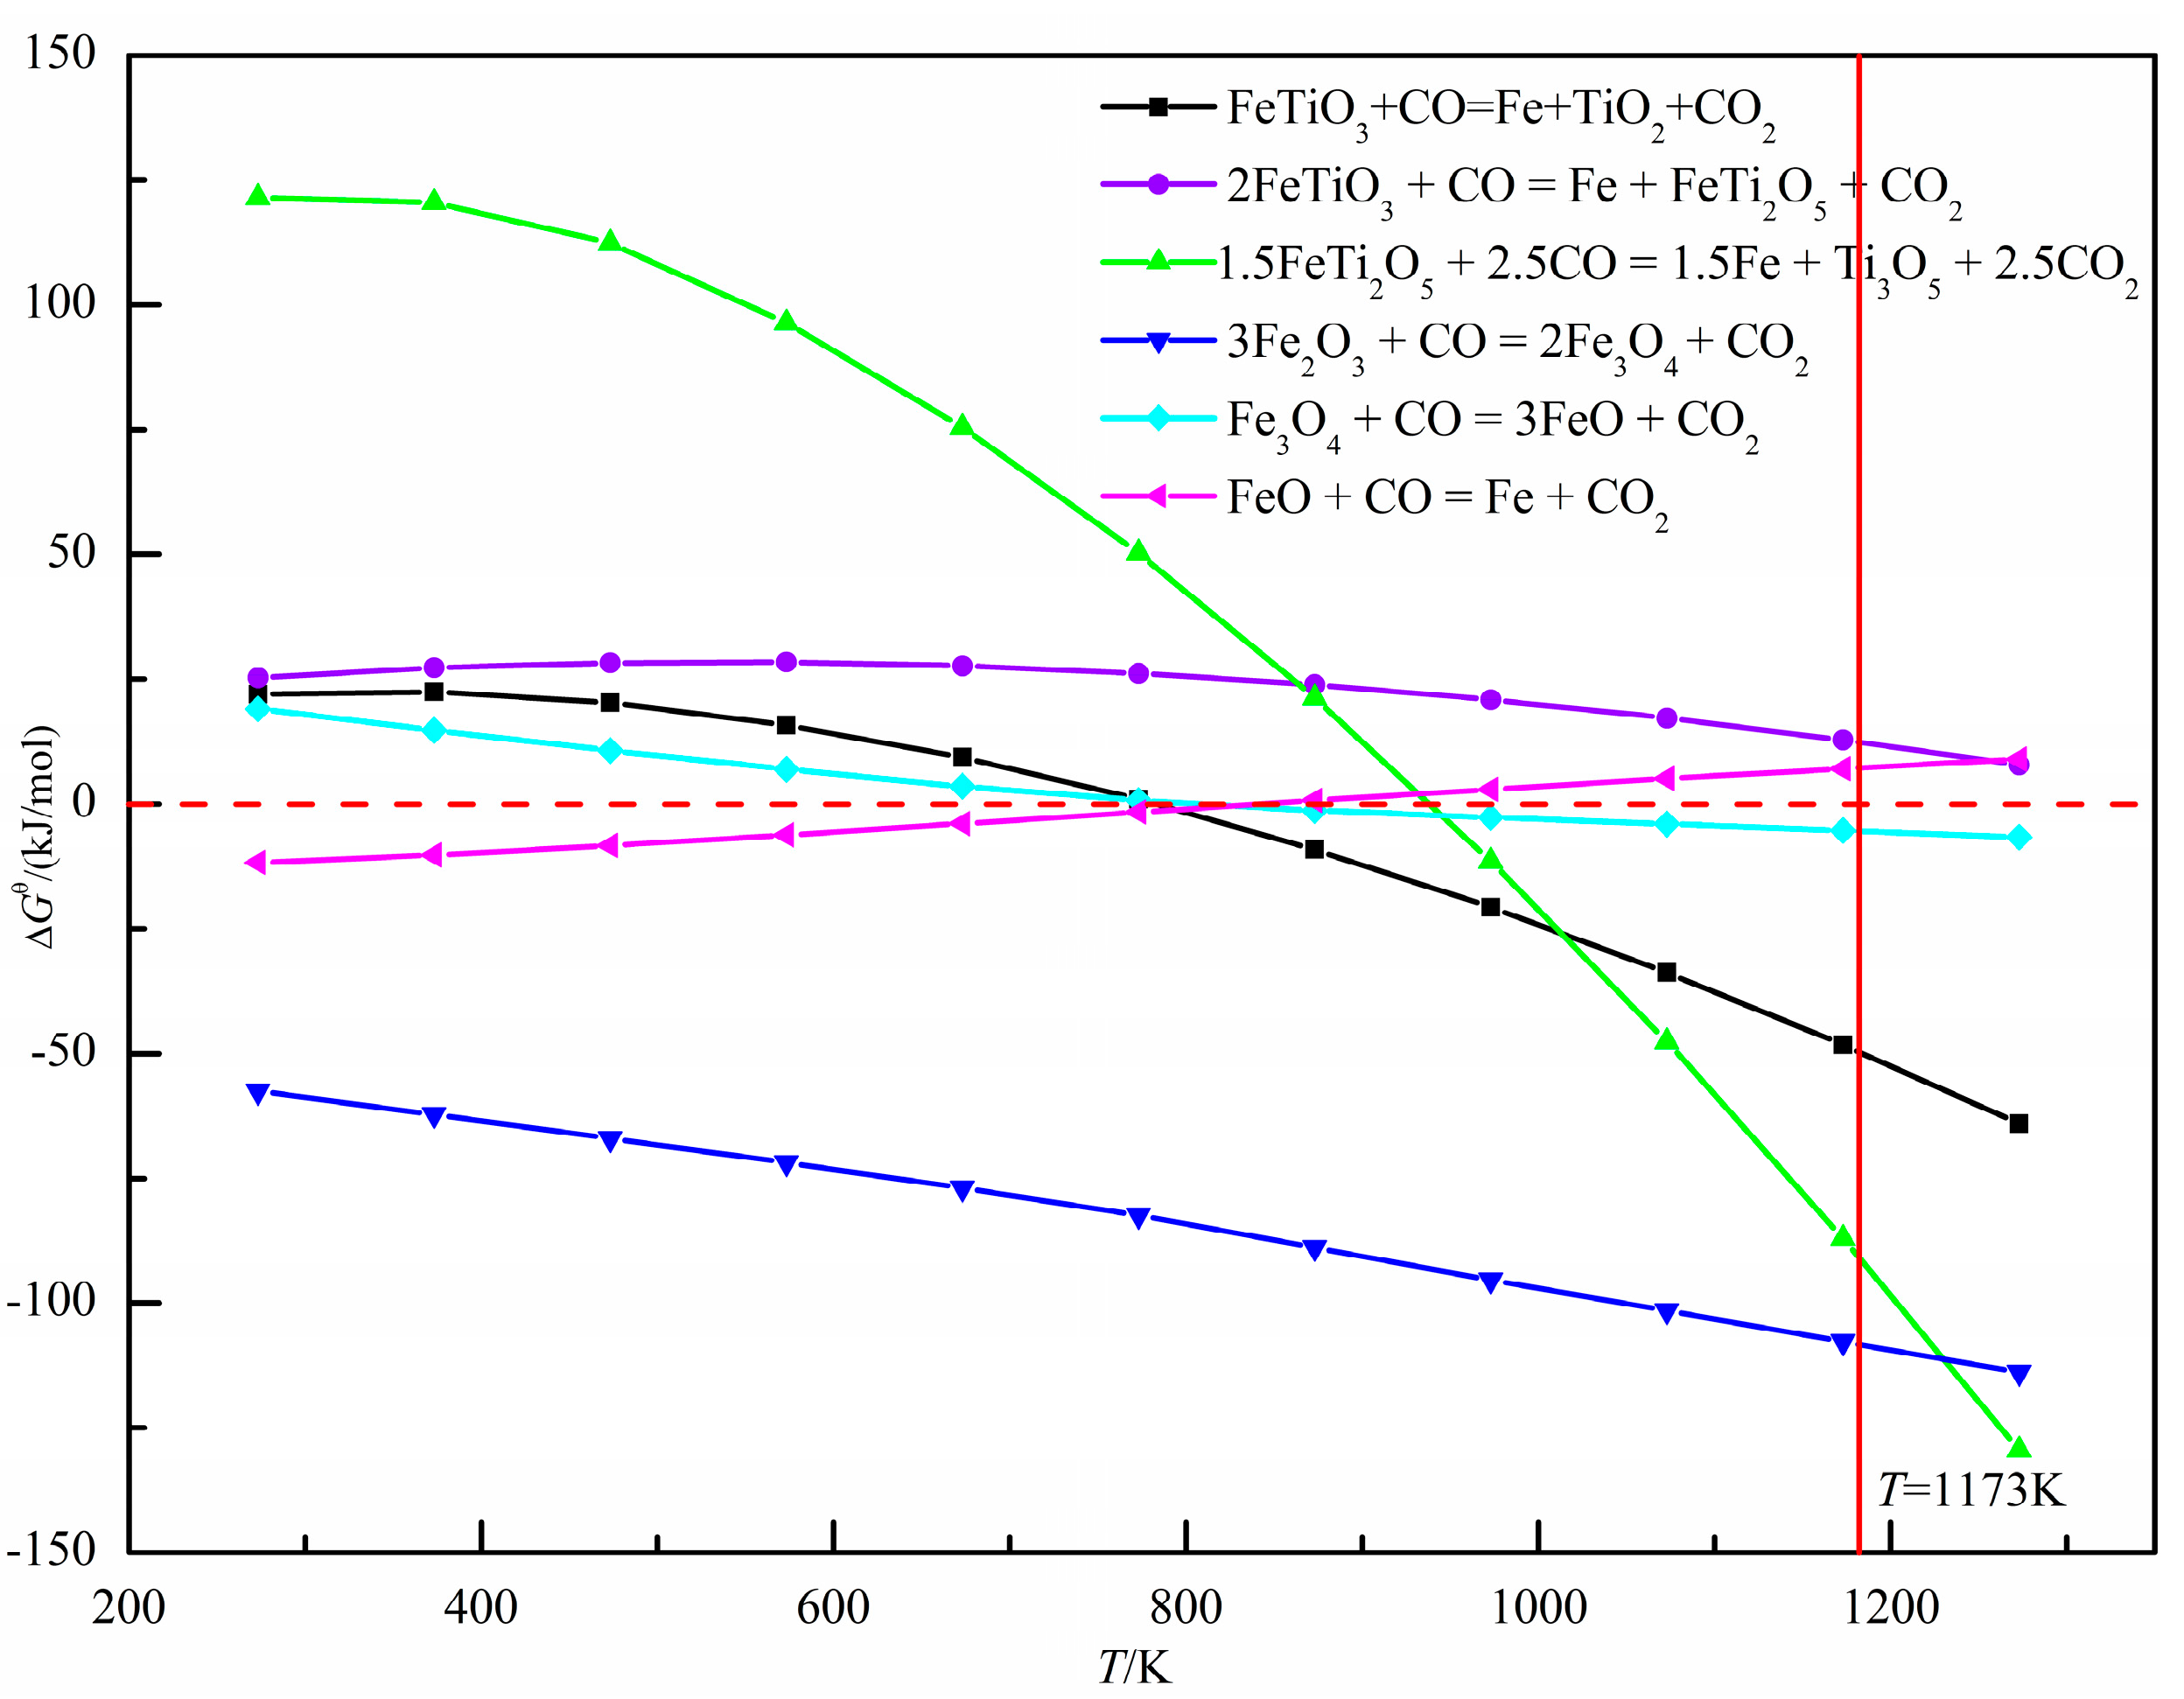
The XRD pattern of oxidized pellets reduced at 900 °C for 3 h is shown in Figure 14. The reductive phases of pellets were mainly metal iron (Fe), wüstite (Fe0.925O), quartz (SiO2), iron silicate (Fe2SiO4), and pyrope (Mg3Al2(SiO4)3). With the increase of the amount of sea sand ore added, the reduction degree decreased, and part of the iron oxide was reduced to iron oxide (FeO). According to the relationship between ΔGθ and T in the reduction process of oxidized pellets in Figure 15, the main reactions occurring in the reduction process of pellets are shown in Formulae (4)–(9):
FeTiO3 + CO = Fe + TiO2 + CO2
2FeTiO3 + CO = Fe + FeTi2O5 + CO2
1.5FeTi2O5 + 2.5CO = 1.5Fe + Ti3O5 + 2.5CO2
3Fe2O3 + CO = 2Fe3O4 + CO2
Fe3O4 + CO = 3FeO + CO2
FeO + CO = Fe + CO2
With the increase of sea sand ore, the FeTiO3 content in oxidized pellets increased, and the reduction of FeTiO3 was mainly according to Formulas (4)–(6). It can be observed from Figure 15 that when the reduction temperature was 1173 K, the occurrence of Reaction (5) was still difficult. Therefore, the reduction product of FeTiO3 was metallic iron, but not FeTi2O5. The reduction of hematite was mainly the process of reducing hematite to magnetite in accordance with Formula (7), reducing magnetite to ferrous oxide, Formula (8), and reducing the ferrous oxide to metallic iron, Formula (9). Therefore, with the increase of sea sand ore used, the FeTiO3 content in oxidized pellets increased, but the reduction of FeTiO3 in oxidized pellets was limited, so the reduction degree of pellets gradually decreased.
3.3.2. Microstructure Analysis of Oxidized Pellets after Reduction
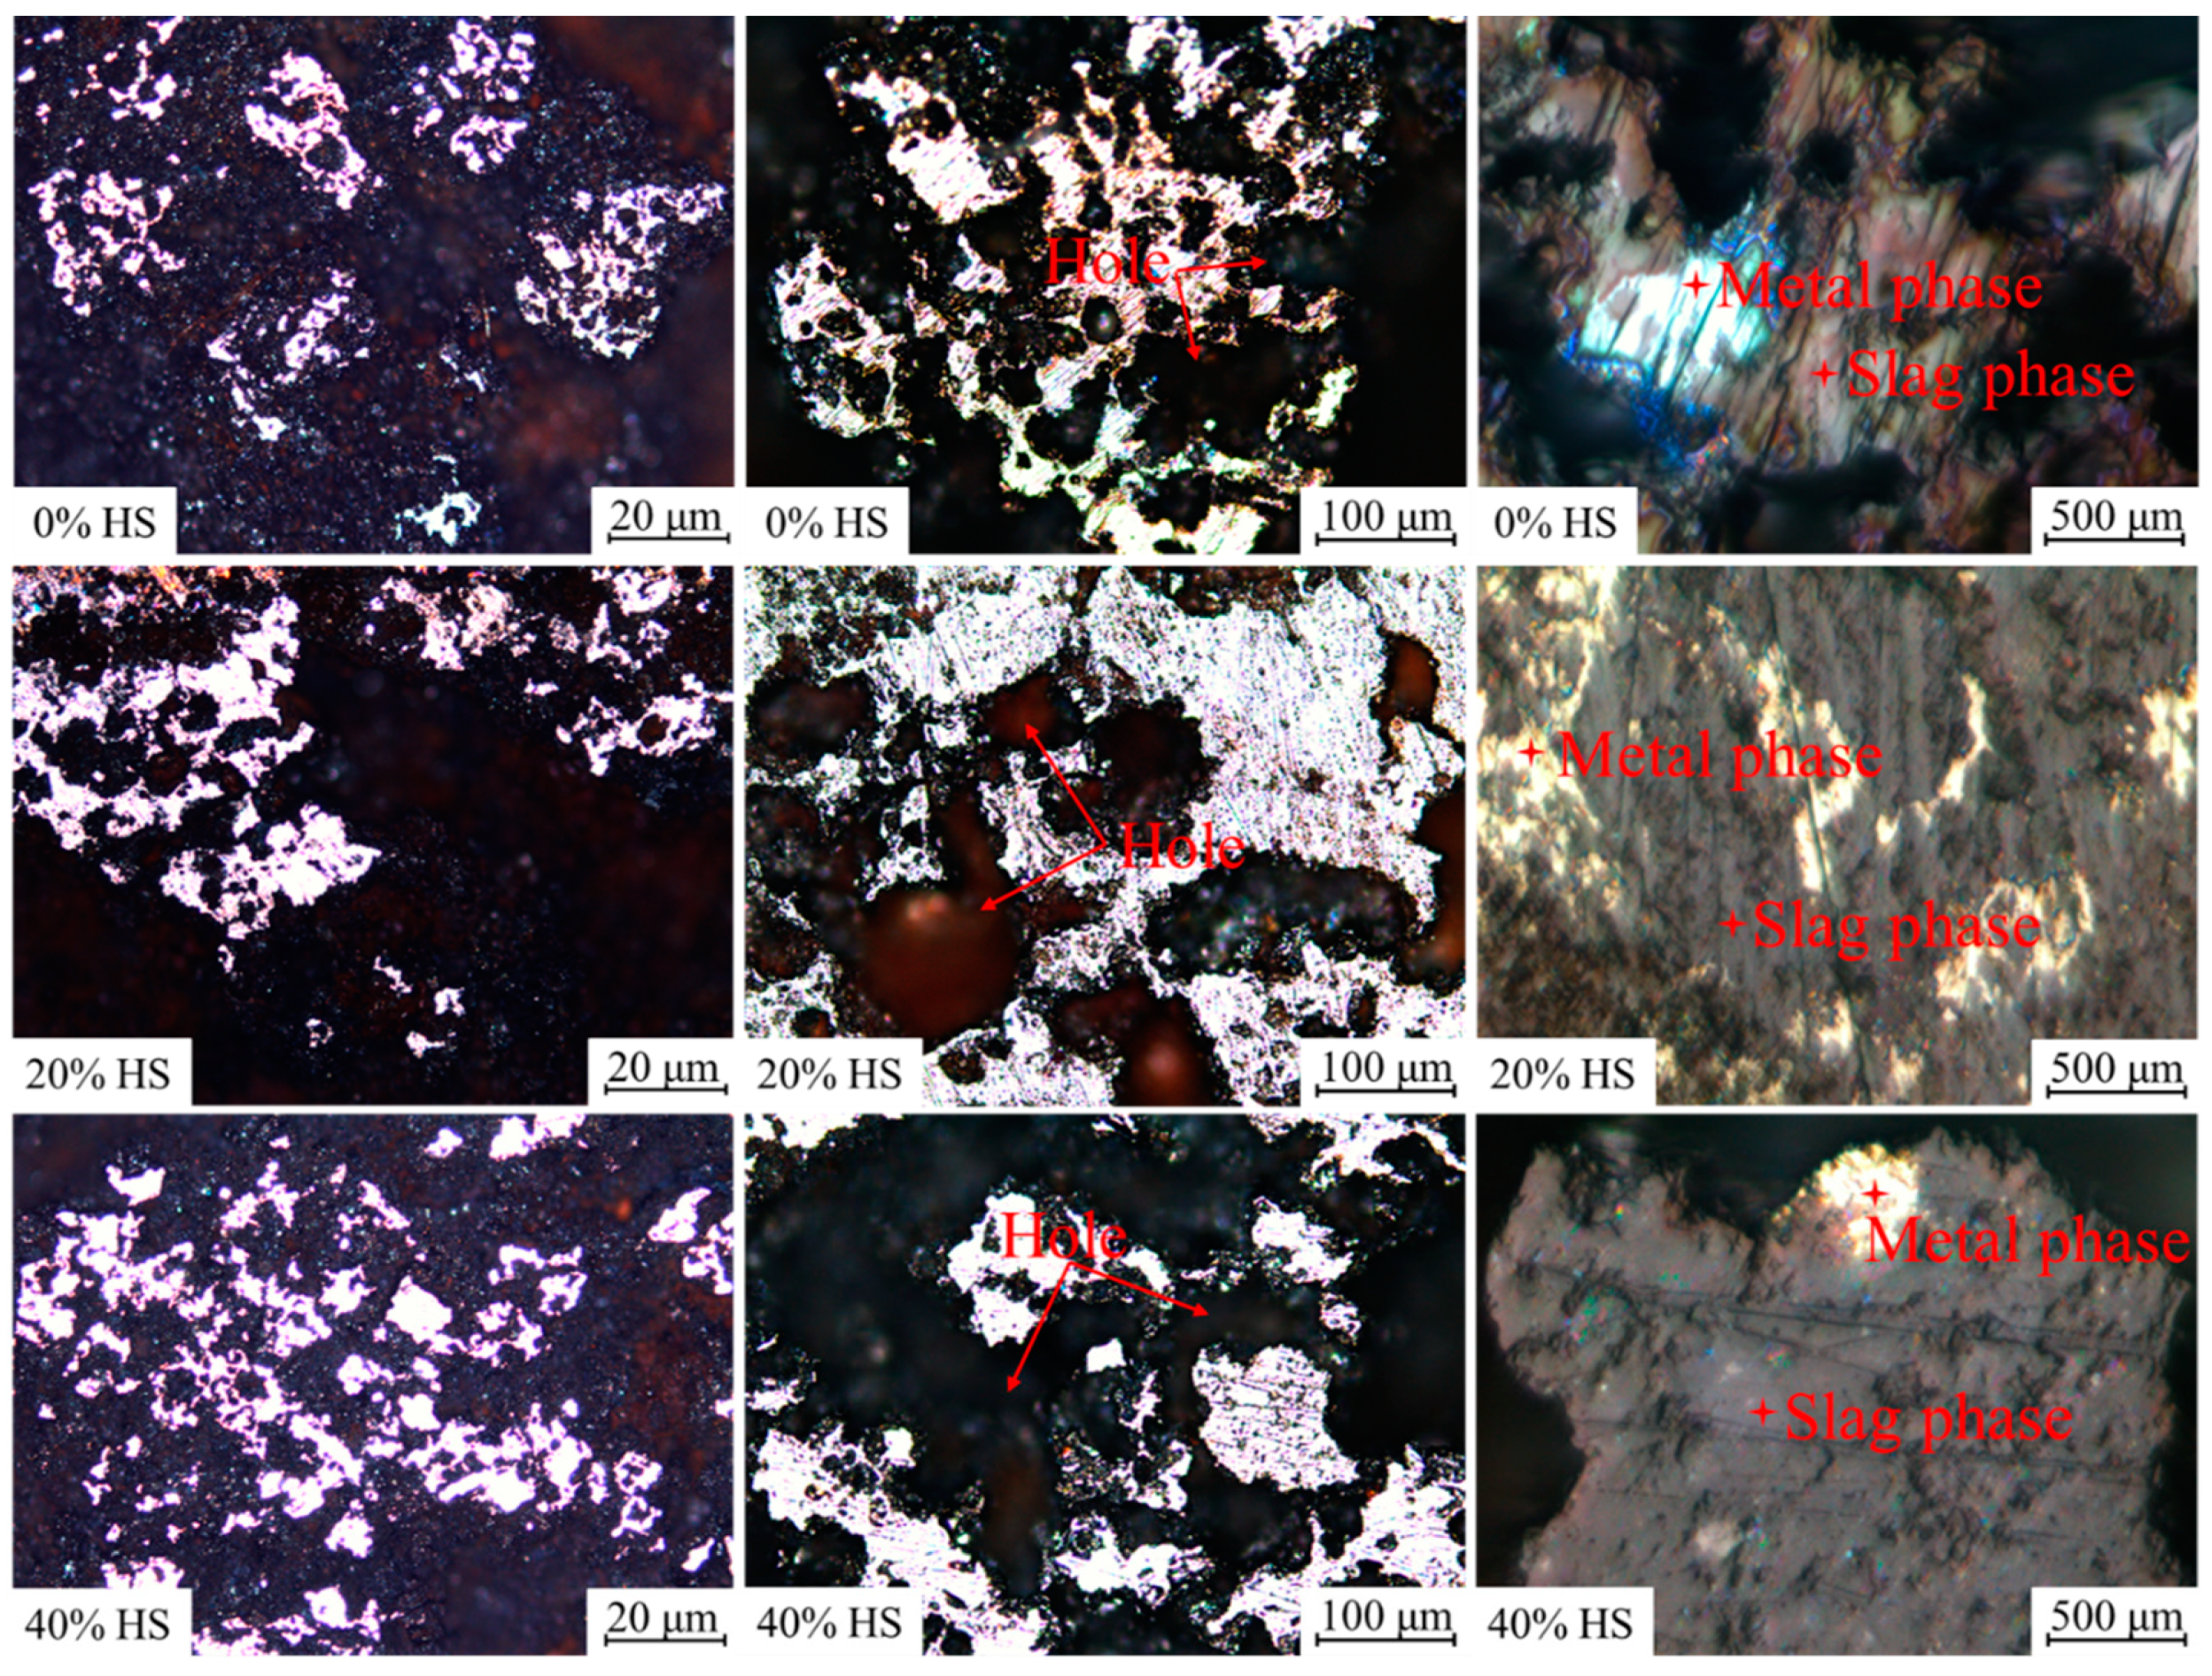
Figure 16 shows the microscopic morphology of oxidized pellets with different dosages of sea sand ore after reduction at 900 °C for 3 h. The reductive pellets were mainly composed of the metal phase and slag phase. Among them, the bright white part was the metal phase, and the dark gray part was mostly the slag phase. The reductive slag phase was mainly filled around the metal phase, so the separation of the metal and slag phases was initially realized. In addition, holes appeared in the pellet after reduction. As the amount of sea sand ore used increased, the metal phase of the reductive pellets gradually became smaller, the unreduced phase or the slag phase increased, and the compressive strength of the reductive pellets gradually increased. This indicated that with increasing sea sand ore dosage, the reduction rate of oxidized pellets gradually slowed down, and the difficulty of oxidized pellets reduction increased.
4. Conclusions
- (1)
- According to the research and analysis of New Zealand sea sand ore, the New Zealand sea sand ore is a vanadia–titania magnetite with 58.36% iron content, TiO2, and V2O5 content of 6.95% and 0.47%, respectively. The main phases of sea sand ore are composed of hematite, magnetite, and ilmenite spinel. The particles are relatively coarse, showing a relatively regular spherical shape, but the specific surface area is small, and the pellet-forming properties are poor.
- (2)
- The unground sea sand ore was prepared into oxidized pellets, and the water content of the green pellets did not change much, which was basically maintained at about 8%. With increasing the amount of unground sea sand ore used, the falling strength and compressive strength of the green pellets first decreased and then gradually increased.
- (3)
- As the amount of unground sea sand ore used increased, the reduction swelling index of the pellets showed a downward trend, while the compressive strength of the pellets gradually increased after reduction swelling. When the amount of sea sand ore used was 40%, the reduction swelling index of the pellets was the lowest, which was 17.35%, and the compressive strength of the pellets after reduction swelling was the highest, which was 346.78 N/pellet. According to the results of SEM-EDS, the phases of oxidized pellets were mainly hematite, ilmenite, silica, and calcium phosphate.
- (4)
- When the amount of unground sea sand ore used gradually increased, the reduction process of pellets was restricted, and the reduction index gradually decreased. By analyzing the phases and microscopic morphology of the reductive pellets, it can be found that the reductive phases of the sea sand ore pellets were mainly metallic iron, wüstite, silica, and silicate.
- (5)
- According to the ∆Gθ-T diagram of the reduction process of oxidized pellets with sea sand ore, as the amount of New Zealand sea sand ore used increased, the content of FeTiO3 in the oxidized pellets increased. When the reduction temperature was 1173 K, the reduction product of FeTiO3 was metallic iron, but not FeTi2O5. Therefore, the reduction of FeTiO3 in the oxidized pellets was limited, and the degree of reduction gradually decreased.
Author Contributions
Conceptualization, X.-x.X.; Methodology, H.Y.; Validation, X.-x.X. and H.Y.; Resources, X.-x.X.; Writing—Original draft preparation, Z.-x.X.; Writing—Review & Editing, Z.-x.X.; Supervision, G.-j.C. and X.-x.X.; Project Administration, G.-j.C. and X.-x.X.; Funding Acquisition, G.-j.C. and X.-x.X. All authors have read and agreed to the published version of the manuscript.
Funding
The authors are especially thankful to the National Natural Science Foundation of China (Grant No.51674084, 21908020 and U1908226) and Fundamental Research Funds for the Central Universities (Grant No. N182503035).
Conflicts of Interest
The authors declare no conflict of interest.
References
- Wang, Z.; Pinson, D.; Chew, S.; Rogers, H.; Monaghan, B.J.; Pownceby, M.I.; Webster, N.A.S.; Zhang, G. Behavior of New Zealand Ironsand During Iron Ore Sintering. Met. Mater. Trans. B 2016, 47, 330–343. [Google Scholar] [CrossRef]
- Wu, S.H. Reasonable Utilization Ways of V-Ti Bearing Beach Placer. Sinter. Pelletizing 2011, 36, 35–40. [Google Scholar]
- Xing, Z.X.; Cheng, G.J.; Gao, Z.X.; Yang, H.; Xue, X.X. Optimization of experimental conditions on preparation of oxidized pellets with New Zealand sea sand ore. Met. Res. Technol. 2020, 117, 411–421. [Google Scholar] [CrossRef]
- Xing, Z.X.; Cheng, G.J.; Yang, H.; Xue, X.X. Experimental Research on Preparation of Oxidized Pellets with High Proportion Sea Sand Mine. In Proceedings of the 12th CSM Steel Congress, Beijing, China, 14–16 October 2019; pp. 1–4. [Google Scholar]
- Hu, T.Y.; Sun, T.C.; Kou, J.; Geng, C.; Wang, X.P.; Chen, C. Recovering titanium and iron by co-reduction roasting of seaside titanomagnetite and blast furnace dust. Int. J. Min. Process. 2017, 165, 28–33. [Google Scholar] [CrossRef]
- Zhang, Y.P.; Zhang, J.L.; Wang, Z.Y.; Liu, Z.J.; Liu, X.L. Sintering characteristics of titanium sands after grinding and its influence mechanism on the quality of sinter. Chin. J. Eng. 2016, 38, 468–475. [Google Scholar]
- Xu, L.B.; Zhou, M.S.; Liu, J.; Han, S.F.; Li, Z.; Zhai, L.W.; Zhang, H. Sintering Characteristics of New Zealand’s Iron Sands. Min. Met. Eng. 2015, 35, 91–94. [Google Scholar]
- Wang, Z.D.; Shi, J.; Song, H.Q. Sintering experimental of proportioning of NewZealand iron ore concentrates in Panzhihua I & S Co. Sinter. Pelletizing 1999, 24, 19–21. [Google Scholar]
- Cai, X.F.; Tian, T.L. Study on sintering characteristics of malaysia sea sand iron ore. Sinter. Pelletizing 2013, 38, 6–8. [Google Scholar]
- Li, Z.Q.; Zhang, Y. Smelting process analysis of Vanadium titanium sea sand magnetite in New Zealand. Mod. Met. 2017, 45, 31–33. [Google Scholar]
- Liu, Y.R.; Zhang, J.L.; Wang, Z.Y.; Liu, Z.J.; Xing, X.D. Experimental research on the deep reduction--magnetic separation of ironsand. Chin. J. Eng. 2016, 38, 181–186. [Google Scholar]
- Wrigh, J.B. Iron-titanium oxides in Some New Zealand ironsands. N. Z. J. Geol. Geophys. 1964, 7, 424–444. [Google Scholar] [CrossRef]
- Wright, J.B. Heating experiments on New Zealand ironsands and the presence of pseudobrookite. N. Z. J. Geol. Geophys. 1967, 10, 659–665. [Google Scholar] [CrossRef] [Green Version]
- Wright, J.B.; Lovering, J.F. Electron-probe micro-analysis of the iron–titanium oxides in some New Zealand ironsands. Miner. Mag. 1965, 35, 604–621. [Google Scholar] [CrossRef]
- Xu, G.F. Practice to add New Zealand ironsand. Hebei Met. 2016, 5, 38–41. [Google Scholar]
- Lv, Q.; Wang, W.S.; Jin, Y.C.; Li, F.M.; Gao, F. Influence of New Zealand sea sand proportioning ratio on metallurgical properties of vanadium-titanium-bearing sinter of Cheng Steel. Iron Steel Vanadium Titan. 2010, 31, 80–83. [Google Scholar]
- Hu, B.S.; Liu, H.; Li, L.; Wang, Y.; Li, W.D. Influence of proportioning sea sand iron ore on sintering process. Sinter. Pelletizing 2006, 31, 16–20. [Google Scholar]
- Han, Z.J.; Liu, W.X.; Li, J.; Shang, Y.X.; Liu, W.H. Effects of Malaysia Sea Sand on Pelletizing Performance. Min. Met. Eng. 2015, 35, 114–116. [Google Scholar]
- Park, E.; Ostrovski, O. Reduction of titania–ferrous ore by carbon monoxide. ISIJ Int. 2003, 43, 1316–1325. [Google Scholar] [CrossRef]
- Park, E.; Ostrovski, O. Reduction of Titania–Ferrous Ore by Hydrogen. ISIJ Int. 2004, 44, 999–1005. [Google Scholar] [CrossRef] [Green Version]
- Park, E.; Ostrovski, O. Effects of Preoxidation of Titania–Ferrous Ore on the Ore Structure and Reduction Behavior. ISIJ Int. 2004, 44, 74–81. [Google Scholar] [CrossRef] [Green Version]
- Longbottom, R.J.; Ostrovski, O.; Park, E. Formation of Cementite from Titanomagnetite Ore. ISIJ Int. 2006, 46, 641–646. [Google Scholar] [CrossRef] [Green Version]
- Longbottom, R.J.; Monaghan, B.J.; Nightingale, S.A.; Mathieson, J.G. Strength and bonding in reduced ironsand–coal compacts. Ironmak. Steelmak. 2013, 40, 381–389. [Google Scholar] [CrossRef] [Green Version]
- Longbottom, R.J.; Monaghan, B.J.; Mathieson, J.G. Development of a Bonding Phase within Titanomagnetite-Coal Compacts. ISIJ Int. 2013, 53, 1152–1160. [Google Scholar] [CrossRef] [Green Version]
- Geng, C.; Sun, T.C.; Ma, Y.W.; Xu, C.Y.; Yang, H.F. Effects of embedding direct reduction followed by magnetic separation on recovering titanium and iron of beach titanomagnetite concentrate. J. Iron Steel Res. Int. 2017, 24, 156–164. [Google Scholar] [CrossRef]
- Zhao, Y.Q.; Sun, T.C.; Zhao, H.Y.; Chen, C.; Wang, X.P. Effect of reductant type on the embedding direct reduction of beach titanomagnetite concentrate. Int. J. Min. Met. Mater. 2019, 26, 152–159. [Google Scholar] [CrossRef]
Figure 1.
X-ray diffraction analysis pattern of experimental raw materials.

Figure 2.
The microscopic morphology of sea sand ore. (a) Original state; (b) 200×; (c) 500×

Figure 3.
Particle size distribution of experimental raw materials.

Figure 4.
Roasting system of green pellets.

Figure 5.
Compressive strength of oxidized pellets with different the dosage of sea sand ore.

Figure 6.
X-ray diffraction analysis of oxidized pellets with different the dosage of sea sand ore.

Figure 7.
SEM diagrams of oxidized pellets with different the dosage of sea sand ore.

Figure 8.
EDS graph of oxidized pellets with 40% sea sand ore.

Figure 9.
Element distributions of oxidized pellets with 40% sea sand ore. (a) Electronic image; (b) Layered image; (c) Fe; (d) O; (e) V; (f) Ti; (j) Al; (h) Si; (i) P; (j) Mg; (k) Na; (l) Ca.
Figure 9.
Element distributions of oxidized pellets with 40% sea sand ore. (a) Electronic image; (b) Layered image; (c) Fe; (d) O; (e) V; (f) Ti; (j) Al; (h) Si; (i) P; (j) Mg; (k) Na; (l) Ca.

Figure 10.
Effect of sea sand ore dosage on reduction swelling index of oxidized pellets and compressive strength of swelling pellets.
Figure 10.
Effect of sea sand ore dosage on reduction swelling index of oxidized pellets and compressive strength of swelling pellets.

Figure 11.
XRD pattern of oxidized pellets after reduction swelling with different the dosage of sea sand ore.
Figure 11.
XRD pattern of oxidized pellets after reduction swelling with different the dosage of sea sand ore.

Figure 12.
Effect of sea sand ore dosage on the reduction degree of oxidized pellets and compressive strength of reductive pellets.
Figure 12.
Effect of sea sand ore dosage on the reduction degree of oxidized pellets and compressive strength of reductive pellets.

Figure 13.
The degree of reduction at different reduced time.

Figure 14.
X-ray diffraction analysis of oxidized pellets with sea sand ore reduced at 900 °C for 3 h.
Figure 14.
X-ray diffraction analysis of oxidized pellets with sea sand ore reduced at 900 °C for 3 h.

Figure 15.
Relationship between ΔGθ and T in the reduction process of oxidized pellets with sea sand ore.
Figure 15.
Relationship between ΔGθ and T in the reduction process of oxidized pellets with sea sand ore.

Figure 16.
The microscopic morphology of oxidized pellets reduced at 900 °C for 3 h.


Table 1.
Chemical composition of experimental raw materials (mass/%).
| Compositions | TFe | FeO | SiO2 | CaO | MgO | Al2O3 | TiO2 | V2O5 |
|---|---|---|---|---|---|---|---|---|
| Sea sand ore | 58.36 | 28.23 | 3.27 | 1.15 | 2.88 | 3.33 | 6.95 | 0.47 |
| SJY | 65.29 | 17.99 | 6.72 | 0.22 | 0.42 | 0.42 | 0.12 | 0.03 |
| GOK | 68.32 | 27.04 | 4.27 | 0.13 | 0.3 | 0.32 | - | - |
Table 2.
Chemical compositions of bentonite (mass/%).
| Compositions | SiO2 | CaO | MgO | Al2O3 | Na2O | K2O |
|---|---|---|---|---|---|---|
| Content | 44.88 | 4.08 | 2.88 | 12.88 | 4.18 | 1.03 |
Table 3.
Size properties of experimental raw materials.
| Raw Materials | Specific Surface Area, m2/g | −0.074 mm, % |
|---|---|---|
| HS | 0.3 | 0.62 |
| SJY | 70.2 | 77.79 |
| GOK | 3.2 | 93.09 |
Table 4.
Ingredient scheme and composition of green pellets (mass/%).
| Number | Sea Sand Ore | SJY | GOK | Bentonite | Pelletizing Time | TFe | FeO |
|---|---|---|---|---|---|---|---|
| C0 | 0 | 50 | 50 | 1.5 | 30 | 66.81 | 22.52 |
| C1 | 10 | 50 | 40 | 1.5 | 30 | 66.74 | 22.98 |
| C2 | 20 | 50 | 30 | 1.5 | 30 | 64.81 | 22.75 |
| C3 | 30 | 50 | 20 | 1.5 | 30 | 63.82 | 22.87 |
| C4 | 40 | 50 | 10 | 1.5 | 30 | 62.82 | 22.99 |
Table 5.
Performance of green pellets with different the dosage of sea sand ore.
| Number | Sea Sand Ore, % | Bentonite, % | TFe, % | FeO, % | GPDS, No. | GPCS, N | GPM, % |
|---|---|---|---|---|---|---|---|
| C0 | 0 | 1.5 | 66.81 | 22.52 | 13 | 12 | 9.37 |
| C1 | 10 | 1.5 | 65.81 | 22.63 | 10 | 10 | 7.30 |
| C2 | 20 | 1.5 | 64.81 | 22.75 | 8 | 9 | 7.37 |
| C3 | 30 | 1.5 | 63.82 | 22.87 | 21 | 8 | 7.83 |
| C4 | 40 | 1.5 | 62.82 | 22.99 | 32 | 11 | 8.23 |
Note: GPDS, No.: Green pellet drop strength, No.; GPCS, N: Compressive strength of green pellet, N; GPM, %: Green pellet moisture, %.
Table 6.
Compositions of main phases in oxidized pellets with 40% sea sand ore detected by EDS (wt. %).
Table 6.
Compositions of main phases in oxidized pellets with 40% sea sand ore detected by EDS (wt. %).
| Point | O | Fe | Ti | V | Mg | Al | Si | Ca | P |
|---|---|---|---|---|---|---|---|---|---|
| A | 34.54 | 0.82 | / | / | 0.06 | 0.02 | / | 42.32 | 19.81 |
| B | 25.41 | 56.58 | 14.43 | 0.61 | 1.17 | 1.65 | 0.12 | 0.03 | / |
| C | 41.59 | 25.83 | 30.53 | 0.46 | 1.58 | / | / | / | / |
| D | 43.77 | 0.59 | / | / | / | / | 55.64 | / | / |
| E | 24.88 | 65.83 | 5.69 | 0.34 | 1.73 | 1.53 | / | / | / |
| F | 29.05 | 60.51 | 5.13 | 0.38 | 2.30 | 2.62 | / | / | / |
/—no or trace amount.
Publisher’s Note: MDPI stays neutral with regard to jurisdictional claims in published maps and institutional affiliations. |
© 2021 by the authors. Licensee MDPI, Basel, Switzerland. This article is an open access article distributed under the terms and conditions of the Creative Commons Attribution (CC BY) license (http://creativecommons.org/licenses/by/4.0/).
Share and Cite
MDPI and ACS Style
Cheng, G.-j.; Xing, Z.-x.; Yang, H.; Xue, X.-x. Effects of High Proportion Unground Sea Sand Ore on the Preparation Process and Reduction Performance of Oxidized Pellets. Minerals 2021, 11, 87. https://doi.org/10.3390/min11010087
AMA Style
Cheng G-j, Xing Z-x, Yang H, Xue X-x. Effects of High Proportion Unground Sea Sand Ore on the Preparation Process and Reduction Performance of Oxidized Pellets. Minerals. 2021; 11(1):87. https://doi.org/10.3390/min11010087
Chicago/Turabian StyleCheng, Gong-jin, Zhen-xing Xing, He Yang, and Xiang-xin Xue. 2021. "Effects of High Proportion Unground Sea Sand Ore on the Preparation Process and Reduction Performance of Oxidized Pellets" Minerals 11, no. 1: 87. https://doi.org/10.3390/min11010087
Note that from the first issue of 2016, this journal uses article numbers instead of page numbers. See further details here.