Litter Size of Sheep (Ovis aries): Inbreeding Depression and Homozygous Regions


Key Laboratory of Animal Genetics, Breeding and Reproduction of Ministry of Agriculture and Rural Affairs, Institute of Animal Science, Chinese Academy of Agricultural Sciences, Beijing 100193, China
*
Author to whom correspondence should be addressed.
Genes 2021, 12(1), 109; https://doi.org/10.3390/genes12010109
Submission received: 31 December 2020
/
Revised: 14 January 2021
/
Accepted: 15 January 2021
/
Published: 18 January 2021
(This article belongs to the Section Animal Genetics and Genomics)
Abstract
:Ovine litter size (LS) is an important trait showing variability within breeds. It remains largely unknown whether inbreeding depression on LS exists based on genomic homozygous regions, and whether the homozygous regions resulted from inbreeding are significantly associated with LS in sheep. We here reanalyze a set of single nucleotide polymorphism (SNP) chip of six breeds to characterize the patterns of runs of homozygosity (ROH), to evaluate inbreeding levels and inbreeding depressions on LS, and to identify candidate homozygous regions responsible for LS. Consequently, unique ROH patterns were observed among six sheep populations. Inbreeding depression on LS was only found in Hu sheep, where a significant reduction of 0.016, 0.02, and 0.02 per 1% elevated inbreeding FROH4–8, FROH > 8 and the total inbreeding measure was observed, respectively. Nine significantly homozygous regions were found for LS in Hu sheep, where some promising genes for LS possibly via regulation of the development of oocytes (NGF, AKT1, and SYCP1), fertilization (SPAG17, MORC1, TDRD9, ZFYVE21, ADGRB3, and CKB), embryo implantation (PPP1R13B, INF2, and VANGL1) and development (DPPA2, DPPA4, CDCA4, CSDE1, and ADSSL1), and reproductive health (NRG3, BAG5, CKB, and XRCC3) were identified. These results from the present study would provide insights into the genetic management and complementary understandings of LS in sheep.
1. Introduction
Litter size (LS), defined as the number of lambs born per ewe lambing, is of zoological and economical importance given the roles in survival of species and supply of products in sheep. LS is various within sheep breeds. Importantly, individual LS also varies among different parities. For instance, LS of 1–6 was recorded for Finnsheep, 1–5 for Romanov, 1–4 for Wadi, and 1–3 for Hu, Icelandic, and Texel sheep [1]. One possible explanation for the variability is the presence of inbreeding [2].
Inbreeding means the mating of related individuals, which is unfavorable in livestock due to the accompanying decrease on productive performances [3]. Inbreeding always extends the runs of homozygosity (referred to as ROH, homozygous segments) at the DNA level. ROH has been proposed to be used to calculate genomic inbreeding coefficients [4]. This measure was prevalent to evaluate inbreeding due to the consensus that it was more accurate using genomics data than only incorporating pedigree information [5]. Controlling inbreeding and inbreeding depression is a general goal in the management of livestock. However, the fact was that most inbreeding and inbreeding depression were evaluated only using pedigrees in sheep [6,7]. Hence, it would be interesting and necessary to use genomic information to evaluate the inbreeding coefficient and its effects on LS in different sheep breeds.
When the inbreeding depression on LS exists, the question then is, which homozygous regions resulted from inbreeding are associated with LS? As is well-known, single nucleotide polymorphisms (SNPs) have been widely used to identify quantitative trait loci (QTLs) and candidate genes from a genome-wide landscape [8]. The ability of homozygous regions to expose deleterious variants makes them a potential agency used in association analyses [9], which would make the best of the massive SNP chip for previous genome-wide association study (GWAS) based on SNPs. Recently, a growing body of interest was poured into the application of ROH in association with phenotypes in livestock [10,11]. Although some major genes such as BMPR1B, GDF9, and BMP15 have been identified by GWAS or QTL mapping in some sheep populations [12], the relationship between genomic homozygous regions and LS remains largely unknown. Thereupon, genetic findings on homozygous regions related to inbreeding may provide complementary understandings and shed light on the mechanisms underlying LS in sheep.
Under the hypothesis that some homozygous regions, resulted from inbreeding and contributing to inbreeding depression on LS, may be significantly associated with LS, we reanalyzed a set of SNP chip from a previous GWAS to characterize the patterns of ROH, to evaluate inbreeding levels and inbreeding depressions on LS, and to identify candidate homozygous segments responsible for LS in six sheep breeds. These breeds excluding Texel are potential genetic resources to improve fecundity of other populations. These results would provide insights into genetic management and complementary understandings of LS in sheep.
2. Materials and Methods
2.1. Data
The data set used in this study were from a previous study [1] aiming at identifying candidate SNPs/genes for LS. Briefly, an Ovine Infinium HD BeadChip consisting of 606,006 SNPs was used for genotyping in six sheep breeds, of which based on the availability of both phenotype and genotype, we returned 314 unrelated ewes, including 100 Wadi, 77 Hu, 23 Icelandic, 37 Finnsheep, 38 Romanov and 39 Texel sheep. As for average litter size (ALS), the variability expressed as coefficients of variation (CV) within breeds is high (CV >15%, Table 1). According to the ALS (~82% with at least two lambing records) rank within the breeds as [1], each animal from two tails with extreme values was labelled with case (high-yield ewes) or control (low-yield ewes). Specifically, the cases included 77 Wadi (ALS ≥ 2), 62 Hu (ALS ≥ 2), 8 Icelandic (ALS > 2), 28 Finnsheep (ALS > 2.65), 29 Romanov (ALS > 2.65) and 28 Texel sheep (ALS ≥ 1.6), respectively. The controls contained 23 Wadi (ALS = 1), 15 Hu (ALS = 1), 15 Icelandic (ALS ≤ 1.75), 9 Finnsheep (ALS ≤ 2), 9 Romanov (ALS ≤ 1.8) and 11 Texel sheep (ALS < 1.3), respectively. Following the criteria of the original article, we performed quality control for each breed except a p-cutoff of 0.000001 for Hardy-Weinberg equilibrium considering the unique breed history. To explore the genetic relationships within each breed, pairwise identical by descent (IBD) was calculated, and principal component analysis (PCA) was performed using a pruning SNP data generated with the commend “indep-pairwise 50 5 0.2” in Plink 1.90 [13]. The R package ggplot2 (https://ggplot2-book.org/index.html) was used for PCA visualization.
2.2. ROH Calling and Inbreeding
For each breed, ROH was detected using Plink v1.90 [13] with an observational genotype-counting method. ROH was defined as a segment of (i) at least 1 Mb length, (ii) at least 100 consecutive homozygous SNPs, (iii) at least 1 SNP per 50 kb, (iv) at most 1 Mb of consecutive homozygous SNPs, and (v) at most one heterozygote and five missing calls.
In order to characterize the pattern of ROH within breeds, we calculated some descriptive statistics at individual level, including the number of ROH, and average and total length. We also calculated the genomic inbreeding coefficient FROH, which equaled to the proportion of total ROH length on autosome 2655.71 Mb used in the present study. To further describe the effects of inbreeding on prolificacy, we performed simple linear regressions using FROH as an explanatory variable and ALS as our dependent variable with the linear model ALS = β0 + β1FROH + ε where β0 was the intercept, β1 was the slope, and ε was the error. FROH was classified into three categories: (i) FROH1–4 based on ROH of 1–4 Mb, (ii) FROH4–8 based on ROH of 4–8 Mb, (iii) FROH > 8 based on ROH with length of >8 Mb. Given the limited sample size, the descriptive statistics and inbreeding depression were performed for all individuals, not separately for case and control groups within each breed.
2.3. Genome-Wide ROH Hotspots Association Analysis
To explore the association between consensus homozygous segments and LS, we focused on the overlapping and potentially matching segments covering at least 10 SNPs and shared by at least 2 animals within each breed (here referred to as ROH hotspots). For simplicity, Fisher exact test was employed respectively to perform genome-wide case-control analysis (the presence and absence of ROH hotspots versus LS viz. high-yield or low-yield), followed by a Bonferroni correction (p-value = 0.05/the number of ROH hotspots tested) to control the false positive rate. Candidate ROH hotspots were mapped to the reference genome Oar_v.4.0 using ANNOVAR [14]. Metascape [15] was used to perform functional analyses for genes of interest, accepting a significance with a threshold of 0.05. Fisher exact test was also implemented to investigate the relationship between ALS and the variations within candidate ROH hotspots corrected by Bonferroni method using Plink v1.90 [13].
3. Results
3.1. Quality Control and Population Structure
A total of 308 individuals passed the quality control, including 100 Wadi (77 cases vs. 23 controls), 71 Hu (58 cases vs. 13 controls), 23 Icelandic (8 cases vs. 15 controls), 37 Finnsheep (28 cases vs. 9 controls), 38 Romanov (29 cases vs. 9 controls), and 39 Texel sheep (28 cases vs. 11 controls). Significant differences of LS within each breed were shown in Table 1. The number of markers that remained for ROH detection was over 440,000 for each breed (Table 1). The results of PCA showed the presence of slight population stratification (Figure S1). We repeated the following analyses without the outlying animals and got very similar results. Thus, we did not rule them out considering the small simple size and low average pairwise IBD (Wadi, 0.004; Hu, 0.002; Icelandic, 0.028; Finnsheep, 0.018; Romanov, 0.069; and Texel, 0.035) (Figure S1).
3.2. Pattern of ROH and Inbreeding Level
ROH features were characterized by number, and total and average length (Table 2). The number of ROH of Hu and Wadi sheep is much lower than that of other breeds (Icelandic, Finnsheep, Romanov and Texel). For the total length of ROH, which is in line with individual inbreeding level, Icelandic has the maximum (306.98 Mb), followed by Texel (258.17 Mb), whereas Wadi possesses the minimum (84.97 Mb). However, for average ROH length Hu features the longest (4.89 Mb) and Romanov the shortest (2.91 Mb). Collectively, unique ROH patterns were observed among these six breeds.
We also estimated the inbreeding coefficients for each breed (Table S1 and Table 3, Figure 1a). The extreme values (max 59.51% and min 0.10%) were in Hu population. Out of these ewes with FROH > 20% (22 animals), a large portion (16 animals, 73%) were Hu, followed by Wadi (four animals, 18%), Icelandic (one animal, 4.5%), and Finnsheep (one animal, 4.5%) (Figure 1). Among breeds, low inbreeding levels and a similar trend in line with total ROH length were observed. The regression analyses show that most effects are not significantly different from zero in the breeds excluding Hu sheep, and even the effect of FROH1–4 is favorable in Romanov sheep (Table 3). However, a reduction of 0.16, 0.02, and 0.02 for ALS occurs as a result of per 1% elevated FROH4–8, FROH > 8 and the total inbreeding measure in Hu sheep, respectively (Table 3). These data imply the presence of inbreeding and inbreeding depression on ALS in Hu sheep.
3.3. Genome-Wide ROH Hotspots Association Analysis
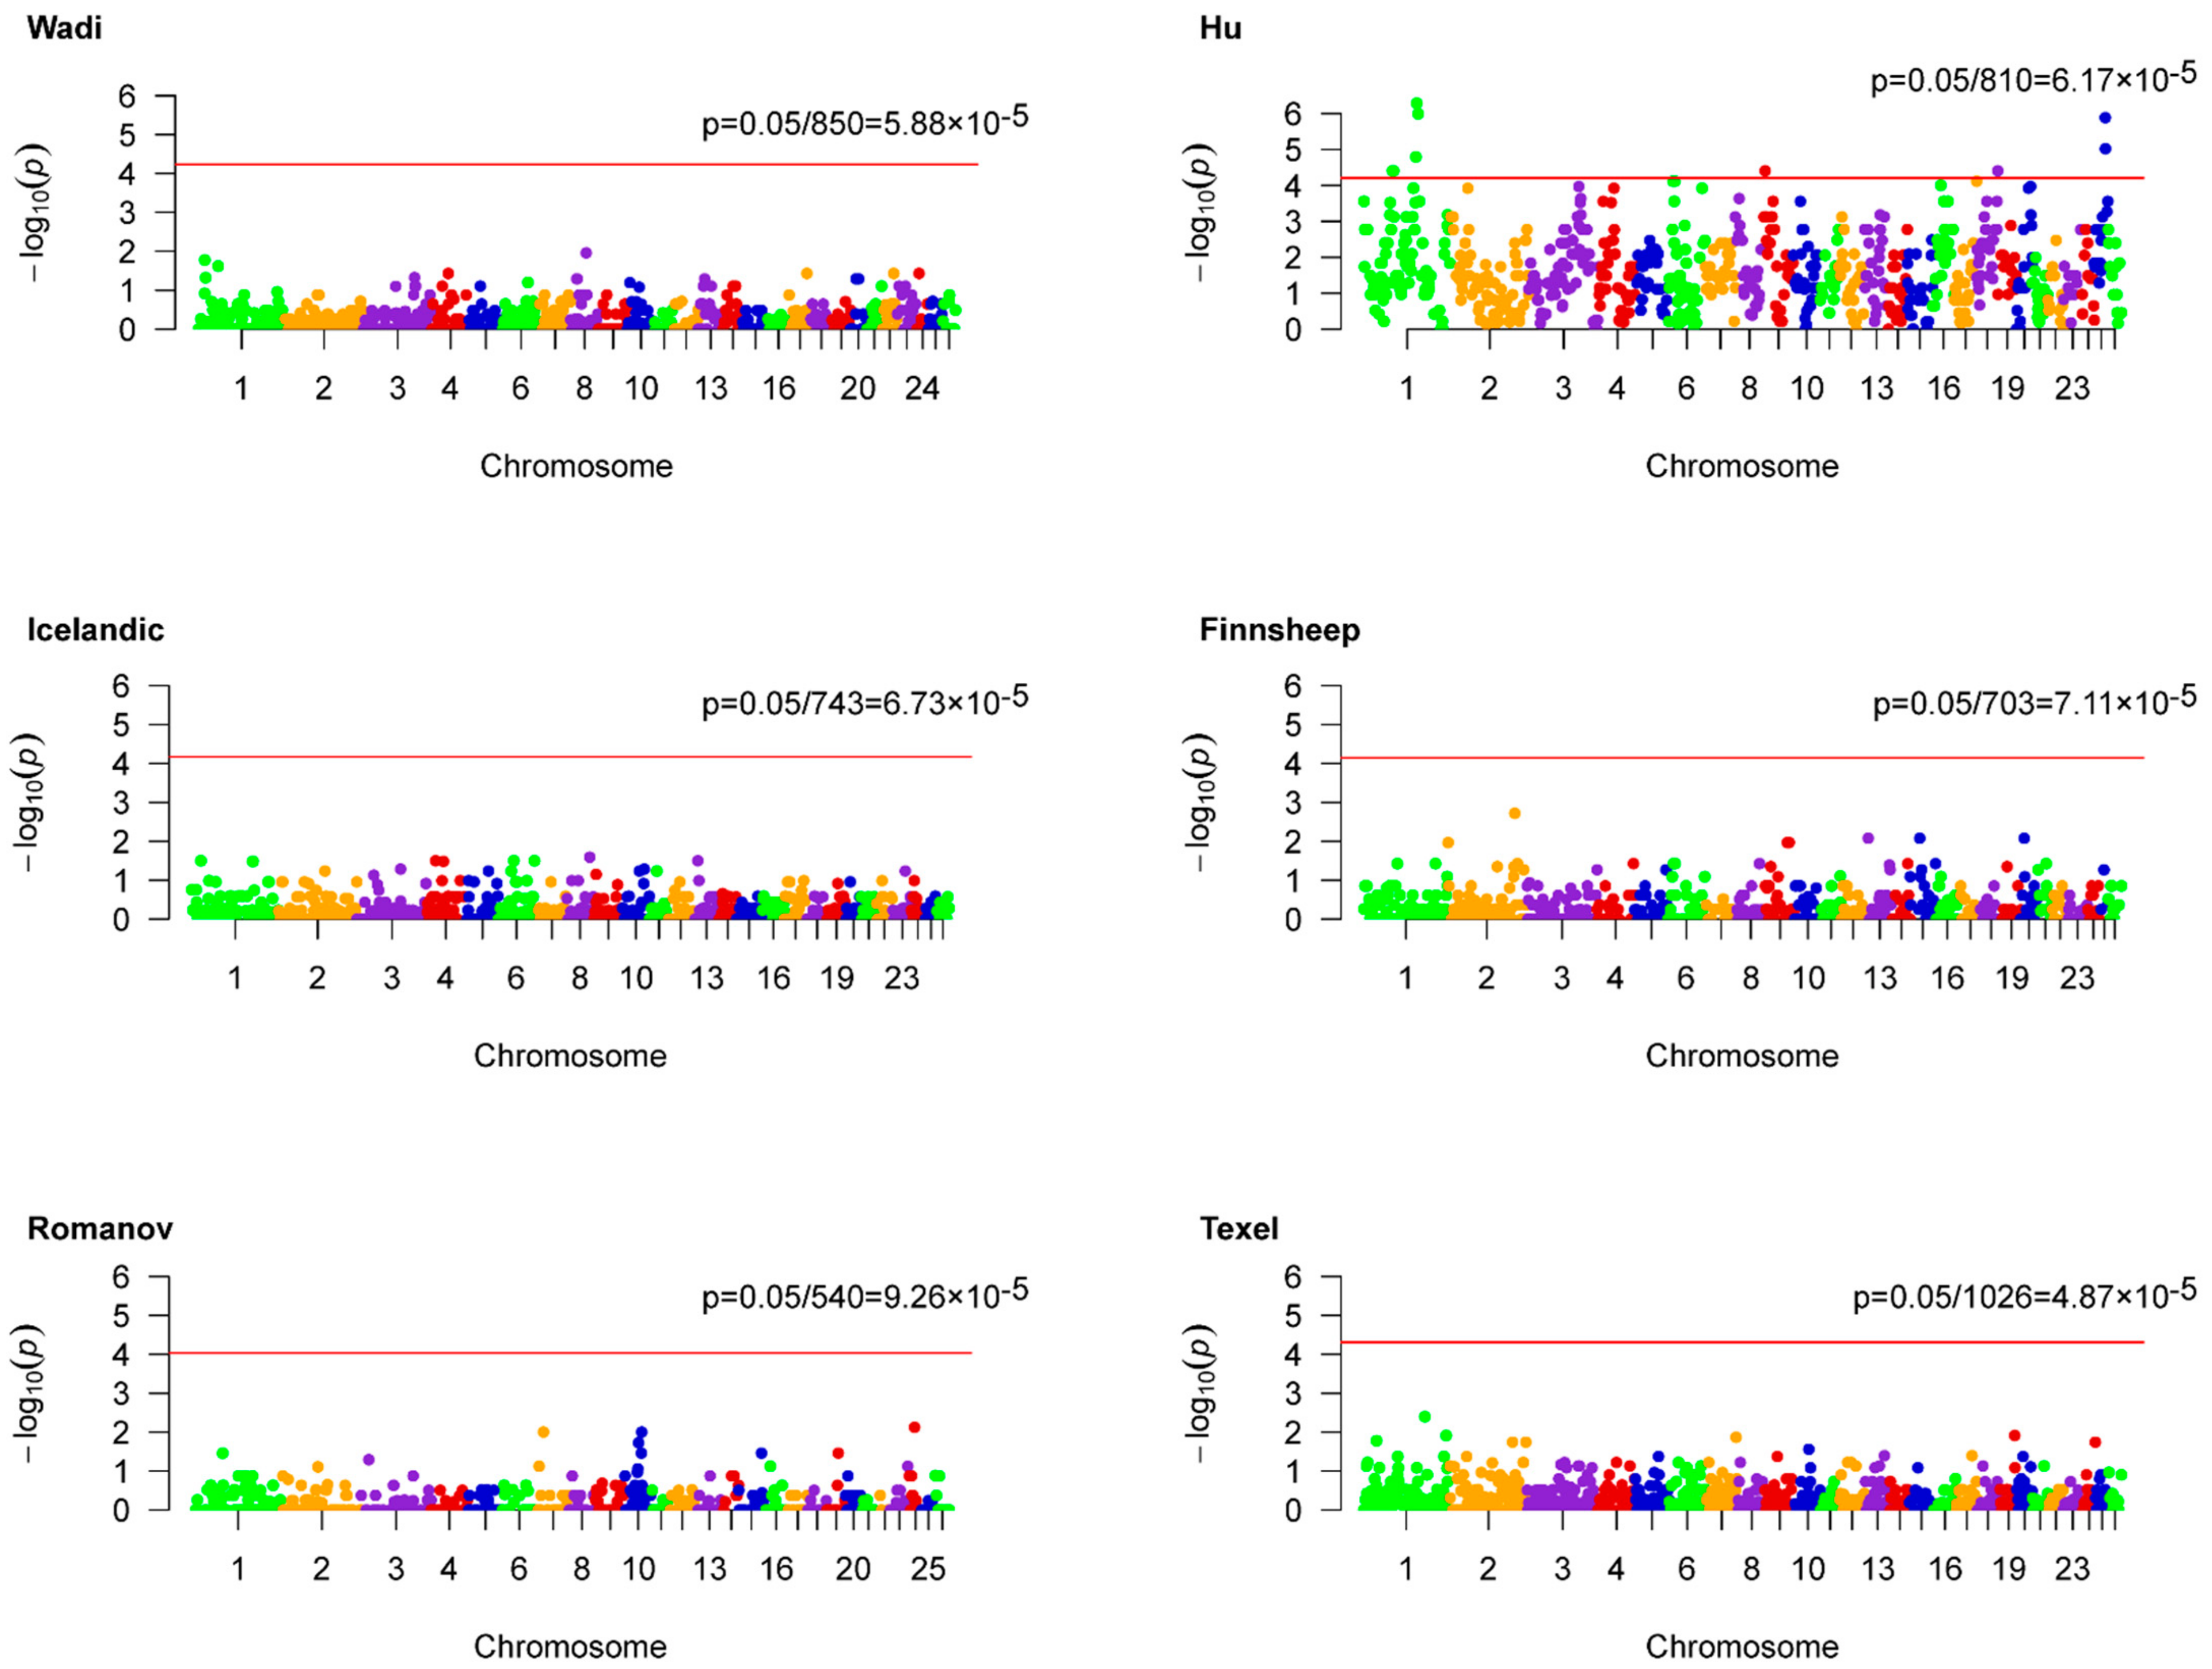
Genome-wide association analyses based on ROH hotspots were performed for each breed to identify homozygous regions linked to LS (Figure 2). Unfortunately, no outliers were statistically observed in five populations including Wadi, Icelandic, Finnsheep, Romanov, and Texel sheep. However, nine ROH hotspots were identified for Hu sheep according to a threshold of 6.17 × 10⁻⁵ (Table 4). Accordingly, a total of 56 genes were found partly or entirely on these regions (Table S2). These genes were functionally grouped into four pathways, including the PID PI3K PLC TRK pathway, apoptotic signaling pathway, response to calcium ion, and cellular process involved in reproduction in multicellular organism (Figure 3 and Table S3). The relevance of candidate genes on reproduction was determined by a literature search. Consequently, straightforward connections between LS and two candidate genes (PPP1R13B and NGF) have been reported [16,17]. Additionally, the potential reproductive roles of candidate genes in development of oocytes and sperm, zygotic transcriptional program, embryo implantation and development, and reproductive diseases were uncovered (Figure 4).
To investigate promising variations at above regions, Fisher exact tests were implemented to explore the relationship between SNPs and ALS. Manhattan plots for each ROH hotspots of interest were shown in Figure S2. Only one intergenic marker on S325 was statistically significant, which was in the proximity of DPPA4 and DPPA2 (Figure S2).
4. Discussion
4.1. ROH and Inbreeding
In this study, we characterized the patterns of homozygosity in six sheep breeds, including two Chinese breeds and four non-Chinese breeds. Unique ROH patterns were observed, which would be attributed to their population history and selective breeding. A low genomic inbreeding coefficient (0.065) of Finnsheep was evaluated in the present study, in line with an evaluation from a previous study (0.060) [18]. FROH of 0.093 was estimated for Hu sheep breed, which was larger than the previous value (0.048) using the same method [18]. One possible explanation for this discrepancy is different sample size and density of SNP chip. Interestingly, only the inbreeding level of Wadi sheep (0.032, equals to the average of 41 Chinese breeds) is lower compared with the global average (0.046) derived from 1910 animals in 97 populations [18]. For Wadi sheep, the low inbreeding means an effective genetic management. However, for other five breeds measures should be taken to control inbreeding.
Unfavorable effects of inbreeding on LS were observed in Hu sheep, which coincides with the inbreeding depressions of Danish and Czech populations based on pedigree [7,19]. It is important to note that Hu sheep take a large portion (16/22) of these ewes with a high inbreeding level (FROH > 0.2), of which the maxima is about 0.6. This coincides with the history of mother-son mating as long as at least 900 years in Hu sheep [20]. Specifically, short ROH (1–4 Mb) can represent ancient inbreeding, and the unfavorable effect of FROH1–4 on ALS was supported by the history of mother-son mating. On the other hand, the recent inbreeding resulted in long ROH (>8 Mb) and the significant decrease of ALS suggested recently ineffective genetic management in Hu sheep. The ancient and recent inbreeding highlighted the urgence of measures to maintain high fecundity and limit inbreeding in Hu sheep. However, these results are from a small herd and more animals are needed in future studies.
4.2. Candidate Genes Likely Functioning in Prolificacy
Significant homozygous regions were found for LS in Hu sheep rather than the others in the present study, which supported our hypothesis that some homozygous regions contributing to inbreeding depression on LS, may be significantly associated with LS. From the reproductive standpoint of ewes, LS is the outcome of a series of physiological processes, including the development of oocytes, fertilization, embryo implantation and development [21,22]. Hence, more or less effects of genes associated with these processes were expected on the ending of ovine delivery, supported (at least partly) by these candidate genes identified in Hu sheep. Although previous prolificacy genes did not emerge from the present study, some function-associated genes were identified (Figure 4).
Straightforward evidence was well-documented that PPP1R13B and NGF influenced LS. Loss of PPP1R13B, also known as p53, female mice decreased significantly embryonic implantation, pregnancy rate and LS via regulating leukaemia inhibitory factor, which was a cytokine critical for implantation [16,23]. In pigs, 17β-estradiol, one important reproductive hormone, was found to promote transcription of p53 [24]. Interestingly, the polymorphism of NGF, playing a role in augmenting folliculogenesis, has been reported to be associated with LS in both sheep and goats [17,25,26,27].
AKT1, one isoform of AKT (a serine/threonine kinase), has been extensively studied in reproductive processes through phosphoinositol 1,3 kinase/protein kinase B (PI3K/AKT) signaling, including follicular development and embryo implantation [28,29,30]. The roles of PI3K/AKT signaling in follicular development consist of (i) the initiation of primordial follicle growth via suppresses FOXO3 (a transcriptional factor keeping primordial follicle dormancy) actions, (ii) the regulation in granulosa cell differentiation of antral follicles via FSH (follicle-stimulating hormone), and (iii) the participation in oocyte maturation of preovulatory follicles [31,32,33]. In addition, SYCP1 is required for the formation of crossovers during meiotic prophase [34], indicating its role in the development of oocytes.
Embryo implantation and development is another important reproductive event influencing LS. Zygotic genome activation launches the expression of parental genomes, during which any wrongdoing may terminate embryo development [35]. DPPA2 and DPPA4 were involved in zygotic genome activation by regulating Dux and LINE-1 retrotransposons [36,37]. Protein inhibitor of activated STAT 4 (PIAS4) and histone methyltransferase SETDB1 could negatively modulate DPPA2 protein activity [35,38]. Late embryonic/perinatal death was also observed in Dppa4-deficient mice [39]. Furthermore, Cdca4 was identified as a target gene of miR-154 differently expressed between 2-cell and 4-cell mouse embryos [40]. The placenta is an organ linking baby and mom during pregnancy, on which proliferation, differentiation, and invasion of trophoblast cells are vital to healthy pregnancy. Both maternal and fetal phenotypes of placental insufficiency were observed in the Inf2-lacking mice [41], highlighting the essential roles of Inf2 during pregnancy. Vangl1, a principal component of Wnt/PCP signaling pathway, is required for embryonic stem cells (ESC) differentiation, early embryo development and embryo implantation [42,43]. Highly expressed in human ESC, CSDE1 was known as a central post-transcriptional regulator of ESC identity and neurogenesis [44]. ADSSL1 was identified as a candidate gene for fetal akinesia [45]. Collectively, these candidate genes play crucial roles in embryo implantation and development.
Health is an important reproductive content. Of interest, some candidates related to sperm and infertility were identified, containing MORC1 [46], TDRD9 [47], ZFYVE21 [48], ADGRB3 [49], SPAG17 [50,51], CKB [52], and WDR3 [53], which may have effects on sperm motility and fertilization. Additionally, we identified some candidate genes linked to reproductive diseases, such as NRG3 [54] and XRCC3 [55] for ovarian cancer, and BAG5 [56], CKB [57] and XRCC3 [55] for endometriosis. Taken together, these data indicate the importance of reproductive health in lambing.
5. Conclusions
The present study grounded on an SNP chip explored genome-wide homozygosity in six sheep flocks and pinpointed the presence of inbreeding depression for LS in Hu sheep. Additionally, based on genome-wide ROH hotspots associated analysis, this study identified some promising genes for LS possibly via regulation of the development of oocytes (NGF, AKT1, and SYCP1), fertilization (SPAG17, MORC1, TDRD9, ZFYVE21, ADGRB3, and CKB), embryo implantation (PPP1R13B, INF2, and VANGL1) and development (DPPA2, DPPA4, CDCA4, CSDE1, and ADSSL1), and reproductive health (NRG3, BAG5, CKB, and XRCC3). These results would provide insights into the genetic management and complementary understandings of LS in sheep.
Supplementary Materials
The following are available online at https://www.mdpi.com/2073-4425/12/1/109/s1, Figure S1: Principal component analysis of six breeds, Figure S2: Regional Manhattan plots of candidate ROH hotspots, Table S1: Inbreeding coefficients based on ROH of six sheep breeds, Table S2: Candidate genes from nine ROH hotspots, Table S3: Functional classes of candidate genes.
Author Contributions
Conceptualization, M.C. and R.D.; methodology, L.T.; software, X.H. and L.T.; validation, X.H., X.W. and L.T.; formal analysis, L.T.; investigation, L.T.; resources, M.C.; data curation, L.T.; writing—original draft preparation, L.T.; writing—review and editing, X.H., X.W. and R.D.; visualization, L.T.; supervision, M.C. and R.D.; project administration, M.C.; funding acquisition, M.C. and R.D. All authors have read and agreed to the published version of the manuscript.
Funding
This research was funded by the National Natural Science Foundation of China (31861143012), the Earmarked Fund for China Agriculture Research System (CARS-38), and the Agricultural Science and Technology Innovation Program of China (ASTIP-IAS13).
Institutional Review Board Statement
Not applicable.
Informed Consent Statement
Not applicable.
Data Availability Statement
Genotype and phenotype datasets were available at the following link: https://www.animalgenome.org/repository/pub/CAAS2018.0302/.
Acknowledgments
We would like to thank the authors of “Genome-wide association analyses highlight the potential for different genetic mechanisms for litter size among sheep breeds” (doi:10.3389/fgene.2018.00118) for sharing genotype and phenotype datasets.
Conflicts of Interest
The authors declare no conflict of interest.
References
- Xu, S.S.; Gao, L.; Xie, X.L.; Ren, Y.L.; Shen, Z.Q.; Wang, F.; Shen, M.; Eyϸórsdóttir, E.; Hallsson, J.H.; Kiseleva, T.; et al. Genome-wide association analyses highlight the potential for different genetic mechanisms for litter size among sheep breeds. Front. Genet. 2018, 9, 118. [Google Scholar] [CrossRef] [PubMed]
- Tao, L.; He, X.; Wang, F.; Zhong, Y.; Pan, L.; Wang, X.; Gan, S.; Di, R.; Chu, M. Luzhong mutton sheep: Inbreeding and selection signatures. J. Anim. Sci. Technol. 2020, 62, 777–789. [Google Scholar] [CrossRef]
- Howard, J.T.; Pryce, J.E.; Baes, C.; Maltecca, C. Inbreeding in the genomics era: Inbreeding, inbreeding depression, and management of genomic variability. J. Dairy Sci. 2017, 100, 6009–6024. [Google Scholar] [CrossRef] [PubMed]
- McQuillan, R.; Leutenegger, A.L.; Abdel-Rahman, R.; Franklin, C.S.; Pericic, M.; Barac-Lauc, L.; Smolej-Narancic, N.; Janicijevic, B.; Polasek, O.; Tenesa, A.; et al. Runs of homozygosity in European populations. Am. J. Hum. Genet. 2008, 83, 359–372. [Google Scholar] [CrossRef] [Green Version]
- Baes, C.F.; Makanjuola, B.O.; Miglior, F.; Marras, G.; Howard, J.T.; Fleming, A.; Maltecca, C. Symposium review: The genomic architecture of inbreeding: How homozygosity affects health and performance. J. Dairy Sci. 2019, 102, 2807–2817. [Google Scholar] [CrossRef]
- Drobik, W.; Martyniuk, E. Inbreeding and its impact on the prolific Polish Olkuska sheep population. Small Rumin. Res. 2016, 137, 28–33. [Google Scholar] [CrossRef]
- Vostry, L.; Milerski, M.; Schmidova, J.; Vostra-Vydrova, H. Genetic diversity and effect of inbreeding on litter size of the Romanov sheep. Small Rumin. Res. 2018, 168, 25–31. [Google Scholar] [CrossRef]
- Tam, V.; Patel, N.; Turcotte, M.; Bossé, Y.; Paré, G.; Meyre, D. Benefits and limitations of genome-wide association studies. Nat. Rev. Genet. 2019, 20, 467–484. [Google Scholar] [CrossRef]
- Peripolli, E.; Munari, D.; Silva, M.; Lima, A.; Irgang, R.; Baldi, F. Runs of homozygosity: Current knowledge and applications in livestock. Anim. Genet. 2017, 48, 255–271. [Google Scholar] [CrossRef]
- Grilz-Seger, G.; Druml, T.; Neuditschko, M.; Mesaric, M.; Cotman, M.; Brem, G. Analysis of ROH patterns in the Noriker horse breed reveals signatures of selection for coat color and body size. Anim. Genet. 2019, 50, 334–346. [Google Scholar] [CrossRef]
- Cesarani, A.; Gaspa, G.; Pauciullo, A.; Degano, L.; Vicario, D.; Macciotta, N.P.P. Genome-wide analysis of homozygosity regions in european simmental bulls. J. Anim. Breed Genet. 2021, 138, 69–79. [Google Scholar] [CrossRef] [PubMed]
- Abdoli, R.; Zamani, P.; Mirhoseini, S.Z.; Ghavi Hossein-Zadeh, N.; Nadri, S. A review on prolificacy genes in sheep. Reprod. Domest. Anim. 2016, 51, 631–637. [Google Scholar] [CrossRef] [PubMed]
- Purcell, S.; Neale, B.; Todd-Brown, K.; Thomas, L.; Ferreira, M.A.R.; Bender, D.; Maller, J.; Sklar, P.; de Bakker, P.I.W.; Daly, M.J.; et al. PLINK: A tool set for whole-genome association and population-based linkage analyses. Am. J. Hum. Genet. 2007, 81, 559–575. [Google Scholar] [CrossRef] [PubMed] [Green Version]
- Wang, K.; Li, M.Y.; Hakonarson, H. ANNOVAR: Functional annotation of genetic variants from high-throughput sequencing data. Nucleic Acids Res. 2010, 38, e164. [Google Scholar] [CrossRef] [PubMed]
- Zhou, Y.; Zhou, B.; Pache, L.; Chang, M.; Khodabakhshi, A.H.; Tanaseichuk, O.; Benner, C.; Chanda, S.K. Metascape provides a biologist-oriented resource for the analysis of systems-level datasets. Nat. Commun. 2019, 10, 1523. [Google Scholar] [CrossRef] [PubMed]
- Hu, W.; Feng, Z.; Teresky, A.K.; Levine, A.J. p53 regulates maternal reproduction through LIF. Nature 2007, 450, 721–724. [Google Scholar] [CrossRef]
- Yuan, Z.; Zhang, J.; Li, W.; Wang, W.; Li, F.; Yue, X. Association of polymorphisms in candidate genes with the litter size in two sheep breeds. Animals 2019, 9, 958. [Google Scholar] [CrossRef] [Green Version]
- Zhang, M.; Peng, W.F.; Hu, X.J.; Zhao, Y.X.; Lv, F.H.; Yang, J. Global genomic diversity and conservation priorities for domestic animals are associated with the economies of their regions of origin. Sci. Rep. 2018, 8, 11677. [Google Scholar] [CrossRef] [Green Version]
- Norberg, E.; Sørensen, A.C. Inbreeding trend and inbreeding depression in the Danish populations of Texel, Shropshire, and Oxford Down. J. Anim. Sci. 2007, 85, 299–304. [Google Scholar] [CrossRef]
- Liu, B. Animal Breeding; China Agriculture Press: Beijing, China, 2007; p. 146. [Google Scholar]
- Haresign, W. The physiological basis for variation in ovulation rate and litter size in sheep: A review. Livest Prod. Sci. 1985, 13, 3–20. [Google Scholar] [CrossRef]
- Hanrahan, J.; Quirke, J. Contribution of variation in ovulation rate and embryo survival to within breed variation in litter size. In Genetics of Reproduction in Sheep; Land, R.B., Robinson, D.W., Eds.; Garden City Press Ltd.: Letchworth Garden City, Hertfordshire, UK, 1984. [Google Scholar]
- Hu, W.; Feng, Z.; Atwal, G.S.; Levine, A.J. p53: A new player in reproduction. Cell Cycle 2008, 7, 848–852. [Google Scholar] [CrossRef] [PubMed]
- Tao, H.; Mei, S.; Zhang, X.; Peng, X.; Yang, J.; Zhu, L.; Zhou, J.; Wu, H.; Wang, L.; Hua, L.; et al. Transcription factor C/EBPβ and 17β-estradiol promote transcription of the porcine p53 gene. Int. J. Biochem. Cell Biol. 2014, 47, 76–82. [Google Scholar] [CrossRef] [PubMed]
- An, X.; Bai, L.; Hou, J.; Zhao, H.; Peng, J.; Song, Y.; Wang, J.; Cao, B. Molecular cloning, tissue expression and SNP analysis in the goat nerve growth factor gene. Mol. Biol. Rep. 2013, 40, 857–863. [Google Scholar] [CrossRef] [PubMed]
- Naicy, T.; Venkatachalapathy, R.T.; Aravindakshan, T.V.; Radhika, G.; Raghavan, K.C.; Mini, M.; Shyama, K. Nerve Growth Factor gene ovarian expression, polymorphism identification, and association with litter size in goats. Theriogenology 2016, 86, 2172–2178.e2173. [Google Scholar] [CrossRef]
- Naicy, T.; Venkatachalapathy, R.T.; Aravindakshan, T.V.; Raghavan, K.C.; Mini, M.; Shyama, K. Relative abundance of tissue mRNA and association of the single nucleotide polymorphism of the goat NGF gene with prolificacy. Anim. Reprod. Sci. 2016, 173, 42–48. [Google Scholar] [CrossRef]
- Fabi, F.; Asselin, E. Expression, activation, and role of AKT isoforms in the uterus. Reproduction 2014, 148, 85–95. [Google Scholar] [CrossRef] [Green Version]
- Artini, P.G.; Tatone, C.; Sperduti, S.; D’Aurora, M.; Franchi, S.; Di Emidio, G.; Ciriminna, R.; Vento, M.; Di Pietro, C.; Stuppia, L.; et al. Cumulus cells surrounding oocytes with high developmental competence exhibit down-regulation of phosphoinositol 1,3 kinase/protein kinase B (PI3K/AKT) signalling genes involved in proliferation and survival. Hum. Reprod. 2017, 32, 2474–2484. [Google Scholar] [CrossRef]
- Hall, S.E.; Upton, R.M.O.; McLaughlin, E.A.; Sutherland, J.M. Phosphoinositide 3-kinase/protein kinase B (PI3K/AKT) and Janus kinase/signal transducer and activator of transcription (JAK/STAT) follicular signalling is conserved in the mare ovary. Reprod. Fertil. Dev. 2018, 30, 624–633. [Google Scholar] [CrossRef]
- Zeleznik, A.J.; Saxena, D.; Little-Ihrig, L. Protein kinase B is obligatory for follicle-stimulating hormone-induced granulosa cell differentiation. Endocrinology 2003, 144, 3985–3994. [Google Scholar] [CrossRef] [Green Version]
- Kalous, J.; Solc, P.; Baran, V.; Kubelka, M.; Schultz, R.M.; Motlik, J. PKB/AKT is involved in resumption of meiosis in mouse oocytes. Biol. Cell 2006, 98, 111–123. [Google Scholar] [CrossRef]
- Hsueh, A.J.W.; Kawamura, K.; Cheng, Y.; Fauser, B.C.J.M. Intraovarian Control of Early Folliculogenesis. Endocr. Rev. 2015, 36, 1–24. [Google Scholar] [CrossRef] [PubMed] [Green Version]
- Gautier, A.; Goupil, A.S.; Le Gac, F.; Lareyre, J.J. A promoter fragment of the sycp1 gene is sufficient to drive transgene expression in male and female meiotic germ cells in zebrafish. Biol. Reprod. 2013, 89, 89. [Google Scholar] [CrossRef] [PubMed]
- Yan, Y.L.; Zhang, C.; Hao, J.; Wang, X.L.; Ming, J.; Mi, L.; Na, J.; Hu, X.; Wang, Y. DPPA2/4 and SUMO E3 ligase PIAS4 opposingly regulate zygotic transcriptional program. PLoS Biol. 2019, 17, e3000324. [Google Scholar] [CrossRef] [PubMed] [Green Version]
- De Iaco, A.; Coudray, A.; Duc, J.; Trono, D. DPPA2 and DPPA4 are necessary to establish a 2C-like state in mouse embryonic stem cells. EMBO Rep. 2019, 20, e47382. [Google Scholar] [CrossRef]
- Eckersley-Maslin, M.; Alda-Catalinas, C.; Blotenburg, M.; Kreibich, E.; Krueger, C.; Reik, W. Dppa2 and Dppa4 directly regulate the Dux-driven zygotic transcriptional program. Genes Dev. 2019, 33, 194–208. [Google Scholar] [CrossRef] [PubMed] [Green Version]
- Mochizuki, K.; Tando, Y.; Sekinaka, T.; Otsuka, K.; Hayashi, Y.; Kobayashi, H.; Kamio, A.; Ito-Matsuoka, Y.; Takehara, A.; Kono, T.; et al. SETDB1 is essential for mouse primordial germ cell fate determination by ensuring BMP signaling. Development 2018, 145, dev164160. [Google Scholar] [CrossRef] [PubMed] [Green Version]
- Madan, B.; Madan, V.; Weber, O.; Tropel, P.; Blum, C.; Kieffer, E.; Viville, S.; Fehling, H.J. The pluripotency-associated gene Dppa4 is dispensable for embryonic stem cell identity and germ cell development but essential for embryogenesis. Mol. Cell Biol. 2009, 29, 3186–3203. [Google Scholar] [CrossRef] [Green Version]
- Wang, P.; Cui, J.; Zhao, C.; Zhou, L.; Guo, X.; Shen, R.; Zhang, J.; Ling, X. Differential expression of microRNAs in 2-cell and 4-cell mouse embryos. Zygote 2014, 22, 455–461. [Google Scholar] [CrossRef]
- Lamm, K.Y.B.; Johnson, M.L.; Baker Phillips, J.; Muntifering, M.B.; James, J.M.; Jones, H.N.; Redline, R.W.; Rokas, A.; Muglia, L.J. Inverted formin 2 regulates intracellular trafficking, placentation, and pregnancy outcome. eLife 2018, 7, e31150. [Google Scholar] [CrossRef] [Green Version]
- Landeira, D.; Bagci, H.; Malinowski, A.R.; Brown, K.E.; Soza-Ried, J.; Feytout, A.; Webster, Z.; Ndjetehe, E.; Cantone, I.; Asenjo, H.G.; et al. Jarid2 coordinates nanog expression and PCP/Wnt signaling required for efficient ESC differentiation and early embryo development. Cell Rep. 2015, 12, 573–586. [Google Scholar] [CrossRef] [Green Version]
- Zhang, H.; Chen, X.; Zhao, Y.; Gao, R.; Geng, Y.; Ding, Y.; Liu, X.; Wang, Y.; He, J. The homologous genes Vangl1 and Vangl2 are required for embryo implantation in the uterus of mice during early pregnancy. Gene 2015, 555, 140–149. [Google Scholar] [CrossRef] [PubMed]
- Ju Lee, H.; Bartsch, D.; Xiao, C.; Guerrero, S.; Ahuja, G.; Schindler, C.; Moresco, J.J.; Yates, J.R., 3rd; Gebauer, F.; Bazzi, H.; et al. A post-transcriptional program coordinated by CSDE1 prevents intrinsic neural differentiation of human embryonic stem cells. Nat. Commun. 2017, 8, 1456. [Google Scholar] [CrossRef] [PubMed] [Green Version]
- Pergande, M.; Motameny, S.; Özdemir, Ö.; Kreutzer, M.; Wang, H.; Daimagüler, H.S.; Becker, K.; Karakaya, M.; Ehrhardt, H.; Elcioglu, N.; et al. The genomic and clinical landscape of fetal akinesia. Genet. Med. 2020, 22, 511–523. [Google Scholar] [CrossRef] [PubMed]
- Cheung, S.; Parrella, A.; Rosenwaks, Z.; Palermo, G.D. Genetic and epigenetic profiling of the infertile male. PLoS ONE 2019, 14, e0214275. [Google Scholar] [CrossRef] [PubMed] [Green Version]
- Arafat, M.; Har-Vardi, I.; Harlev, A.; Levitas, E.; Zeadna, A.; Abofoul-Azab, M.; Dyomin, V.; Sheffield, V.C.; Lunenfeld, E.; Huleihel, M.; et al. Mutation in TDRD9 causes non-obstructive azoospermia in infertile men. J. Med. Genet. 2017, 54, 633–639. [Google Scholar] [CrossRef]
- Zhao, W.; Quansah, E.; Yuan, M.; Gou, Q.; Mengal, K.; Li, P.; Wu, S.; Xu, C.; Yi, C.; Cai, X. Region-specific gene expression in the epididymis of Yak. Theriogenology 2019, 139, 132–146. [Google Scholar] [CrossRef]
- Rival, C.M.; Xu, W.; Shankman, L.S.; Morioka, S.; Arandjelovic, S.; Lee, C.S.; Wheeler, K.M.; Smith, R.P.; Haney, L.B.; Isakson, B.E.; et al. Phosphatidylserine on viable sperm and phagocytic machinery in oocytes regulate mammalian fertilization. Nat. Commun. 2019, 10, 4456. [Google Scholar] [CrossRef] [Green Version]
- Kazarian, E.; Son, H.; Sapao, P.; Li, W.; Zhang, Z.; Strauss, J.F.; Teves, M.E. SPAG17 is required for male germ cell differentiation and fertility. Int. J. Mol. Sci. 2018, 19, 1252. [Google Scholar] [CrossRef] [Green Version]
- Zhang, X.; Zhang, S.; Tang, Q.; Jiang, E.; Wang, K.; Lan, X.; Pan, C. Goat sperm associated antigen 17 protein gene (SPAG17): Small and large fragment genetic variation detection, association analysis, and mRNA expression in gonads. Genomics 2020, 112, 5115–5121. [Google Scholar] [CrossRef]
- Han, Y.; Peñagaricano, F. Unravelling the genomic architecture of bull fertility in Holstein cattle. BMC Genet. 2016, 17, 143. [Google Scholar] [CrossRef] [Green Version]
- Woods, L.C., III; Li, Y.; Ding, Y.; Liu, J.; Reading, B.J.; Fuller, S.A.; Song, J. DNA methylation profiles correlated to striped bass sperm fertility. BMC Genom. 2018, 19, 244. [Google Scholar] [CrossRef] [PubMed] [Green Version]
- Pinto, R.; Assis, J.; Nogueira, A.; Pereira, C.; Coelho, S.; Brandão, M.; Dias, J.; Alves, S.; Pereira, D.; Medeiros, R. Pharmacogenomics in epithelial ovarian cancer first-line treatment outcome: Validation of GWAS-associated NRG3 rs1649942 and BRE rs7572644 variants in an independent cohort. Pharm. J. 2019, 19, 25–32. [Google Scholar] [CrossRef] [PubMed]
- Monteiro, M.S.; Vilas Boas, D.B.; Gigliotti, C.B.; Salvadori, D.M. Association among XRCC1, XRCC3, and BLHX gene polymorphisms and chromosome instability in lymphocytes from patients with endometriosis and ovarian cancer. Genet. Mol. Res. 2014, 13, 636–648. [Google Scholar] [CrossRef] [PubMed]
- Mirza, Z.; Abdel-Dayem, U. Uncovering potential roles of differentially expressed genes, upstream regulators, and canonical pathways in endometriosis using an in silico genomics approach. Diagnostics 2020, 10, 416. [Google Scholar] [CrossRef] [PubMed]
- Chen, Q.; Zhang, A.; Yu, F.; Gao, J.; Liu, Y.; Yu, C.; Zhou, H.; Xu, C. Label-free proteomics uncovers energy metabolism and focal adhesion regulations responsive for endometrium receptivity. J. Proteome Res. 2015, 14, 1831–1842. [Google Scholar] [CrossRef]
Figure 1.
Inbreeding levels of six sheep breeds. Scatter plots of FROH against the number of runs of homozygosity (ROH) (a), and average litter size against FROH (b). ** denotes p-value < 0.01. The regression for Hu sheep is shown because it is the only breed with significant coefficients.
Figure 1.
Inbreeding levels of six sheep breeds. Scatter plots of FROH against the number of runs of homozygosity (ROH) (a), and average litter size against FROH (b). ** denotes p-value < 0.01. The regression for Hu sheep is shown because it is the only breed with significant coefficients.

Figure 2.
Genome-wide ROH hotspots associated studies for litter size in six sheep breeds. The red lines denote the thresholds used to extra outliers.
Figure 2.
Genome-wide ROH hotspots associated studies for litter size in six sheep breeds. The red lines denote the thresholds used to extra outliers.

Figure 3.
Function annotation of candidate genes. A total of 26 child-terms were returned which were summarized into four parent-terms (Table S3).
Figure 3.
Function annotation of candidate genes. A total of 26 child-terms were returned which were summarized into four parent-terms (Table S3).

Figure 4.
Some possible biological processes, by which candidate genes influence litter size in sheep. The underlined genes in red have been reported to be associated with litter size.
Figure 4.
Some possible biological processes, by which candidate genes influence litter size in sheep. The underlined genes in red have been reported to be associated with litter size.


Table 1.
Genotypes and phenotypes of six sheep breeds.
| Breed | SNP for ROH Calling | Average Litter Size (Mean ± SD) † | CV (%) | ||
|---|---|---|---|---|---|
| Case | Control | Total | |||
| Wadi | 512,178 | 2.28 ± 0.50 A (n = 77) | 1.87 ± 0.10 B (n = 28) | 1.99 ± 0.65 (n = 100) | 32.81 |
| Hu | 503,422 | 2.10 ± 0.24 A (n = 58) | 1.00 ± 0.00 B (n = 13) | 1.90 ± 0.47 (n = 71) | 24.87 |
| Icelandic | 443,125 | 2.29 ± 0.19 A (n = 8) | 1.66 ± 0.10 B (n = 15) | 1.88 ± 0.33 (n = 23) | 17.83 |
| Finnsheep | 492,165 | 3.11 ± 0.45 A (n = 28) | 1.66 ± 0.33 B (n = 9) | 2.76 ± 0.76 (n = 37) | 27.55 |
| Romanov | 465,794 | 2.97 ± 0.29 A (n = 29) | 1.53 ± 0.25 B (n = 9) | 2.63 ± 0.68 (n = 38) | 25.90 |
| Texel | 475,999 | 1.87 ± 0.35 A (n = 28) | 1.15 ± 0.10 B (n = 11) | 1.66 ± 0.45 (n = 39) | 26.86 |
† For each breed, different letters denote highly significant difference (p < 0.01) using the Wilcoxon rank sum test with continuity correction. The sample sizes were in brackets. Ranked by the average litter size, each animal from two tails with extreme values was labelled with case (high-yield ewes) or control (low-yield ewes).
Table 2.
Runs of homozygosity (ROH) feature of six sheep breeds.
| ROH Feature | Breed † | |||||
|---|---|---|---|---|---|---|
| Hu | Wadi | Icelandic | Finnsheep | Romanov | Texel | |
| Number | ||||||
| Average | 29.86 C | 21.26 C | 81.96 A | 45.38 B | 43.71 B | 85.03 A |
| SD | 20.90 | 11.05 | 29.07 | 15.76 | 9.01 | 14.42 |
| Maximum | 82 | 67 | 125 | 91 | 60 | 125 |
| Total length (Mb) | ||||||
| Average | 247.9 C | 84.97 C | 306.98 A | 173.51 B | 128.15 B | 258.17 A |
| SD | 388.94 | 140.37 | 175.46 | 131.91 | 41.40 | 47.75 |
| Maximum | 1580.38 | 733.08 | 916.21 | 541.73 | 223.37 | 384.18 |
| Average length (Mb) | ||||||
| Average | 4.89 B | 3.01 B | 3.58 A | 3.48 A | 2.91 A | 3.06 A |
| SD | 5.42 | 2.64 | 1.17 | 1.36 | 0.59 | 0.41 |
| Maximum | 22.26 | 14.37 | 7.33 | 7.06 | 4.32 | 3.97 |
† For each ROH feature, breeds with different letters denote highly significant difference (p < 0.01, Kruskal-Wallis test) with multiple comparisons using the Wilcoxon rank sum test.
Table 3.
Estimates of inbreeding depression for average litter size, expressed as the change in expected phenotype per 1% increase inbreeding.
Table 3.
Estimates of inbreeding depression for average litter size, expressed as the change in expected phenotype per 1% increase inbreeding.
| FROH | Estimate ± SE | |||||
|---|---|---|---|---|---|---|
| Wadi | Hu | Icelandic | Finnsheep | Romanov | Texel | |
| FROH1–4 | 0.12 ± 0.16 | −0.22 ± 0.13 | −0.03 ± 0.04 | −0.20 ± 0.20 | 0.35 ± 0.23 | −0.02 ± 0.08 |
| FROH4–8 | −0.15 ± 0.14 | −0.16 ** ± 0.05 | −0.01 ± 0.05 | −0.08 ± 0.12 | −0.06 ± 0.19 | −0.11 ± 0.10 |
| FROH > 8 | −0.01 ± 0.01 | −0.02 ** ± 0.00 | 0.01 ± 0.01 | −0.01 ± 0.03 | −0.11 ± 0.11 | 0.04 ± 0.06 |
| All | −0.01 ± 0.01 | −0.02 ** ± 0.00 | 0.00 ± 0.01 | −0.02 ± 0.03 | −0.02 ± 0.07 | 0.00 ± 0.04 |
** denotes p < 0.01. The values without ** were not significant (p > 0.05).
Table 4.
Nine ROH hotspots significantly linked to litter size in Hu sheep.
| ROH Hotspot | Region † | Length (kb) | N_SNP | N_Gene | p-Value |
|---|---|---|---|---|---|
| S32 | 1:167605062-167736007 | 130.946 | 24 | 0 | 5.14 × 10⁻⁷ |
| S325 | 1:171893678-173273898 | 1380.221 | 269 | 5 | 1.01 × 10⁻⁶ |
| S736 | 25:34831274-34920313 | 89.04 | 20 | 1 | 1.29 × 10⁻⁶ |
| S599 | 25:35553072-36870587 | 1317.516 | 275 | 2 | 9.48 × 10⁻⁶ |
| S125 | 1:164718392-165322668 | 604.277 | 107 | 1 | 1.60 × 10⁻⁵ |
| S414 | 18:66738545-68488609 | 1750.065 | 299 | 30 | 3.91 × 10⁻⁵ |
| S378 | 9:5081783-5791789 | 710.007 | 161 | 1 | 3.91 × 10⁻⁵ |
| S312 | 1:94177534-94744969 | 567.436 | 129 | 3 | 3.91 × 10⁻⁵ |
| S311 | 1:90921006-92192152 | 1271.147 | 227 | 13 | 3.91 × 10⁻⁵ |
† The region covering the bases form mth to nth at chromosome l was denoted as l:m-n. N_SNP and N_Gene are the number of single nucleotide polymorphisms (SNP) and gene located at ROH hotspots, respectively.
Publisher’s Note: MDPI stays neutral with regard to jurisdictional claims in published maps and institutional affiliations. |
© 2021 by the authors. Licensee MDPI, Basel, Switzerland. This article is an open access article distributed under the terms and conditions of the Creative Commons Attribution (CC BY) license (http://creativecommons.org/licenses/by/4.0/).
Share and Cite
MDPI and ACS Style
Tao, L.; He, X.; Wang, X.; Di, R.; Chu, M. Litter Size of Sheep (Ovis aries): Inbreeding Depression and Homozygous Regions. Genes 2021, 12, 109. https://doi.org/10.3390/genes12010109
AMA Style
Tao L, He X, Wang X, Di R, Chu M. Litter Size of Sheep (Ovis aries): Inbreeding Depression and Homozygous Regions. Genes. 2021; 12(1):109. https://doi.org/10.3390/genes12010109
Chicago/Turabian StyleTao, Lin, Xiaoyun He, Xiangyu Wang, Ran Di, and Mingxing Chu. 2021. "Litter Size of Sheep (Ovis aries): Inbreeding Depression and Homozygous Regions" Genes 12, no. 1: 109. https://doi.org/10.3390/genes12010109
Note that from the first issue of 2016, this journal uses article numbers instead of page numbers. See further details here.