Contribution of the CK2 Catalytic Isoforms α and α’ to the Glycolytic Phenotype of Tumor Cells

 , , , , ,
  , and
, and 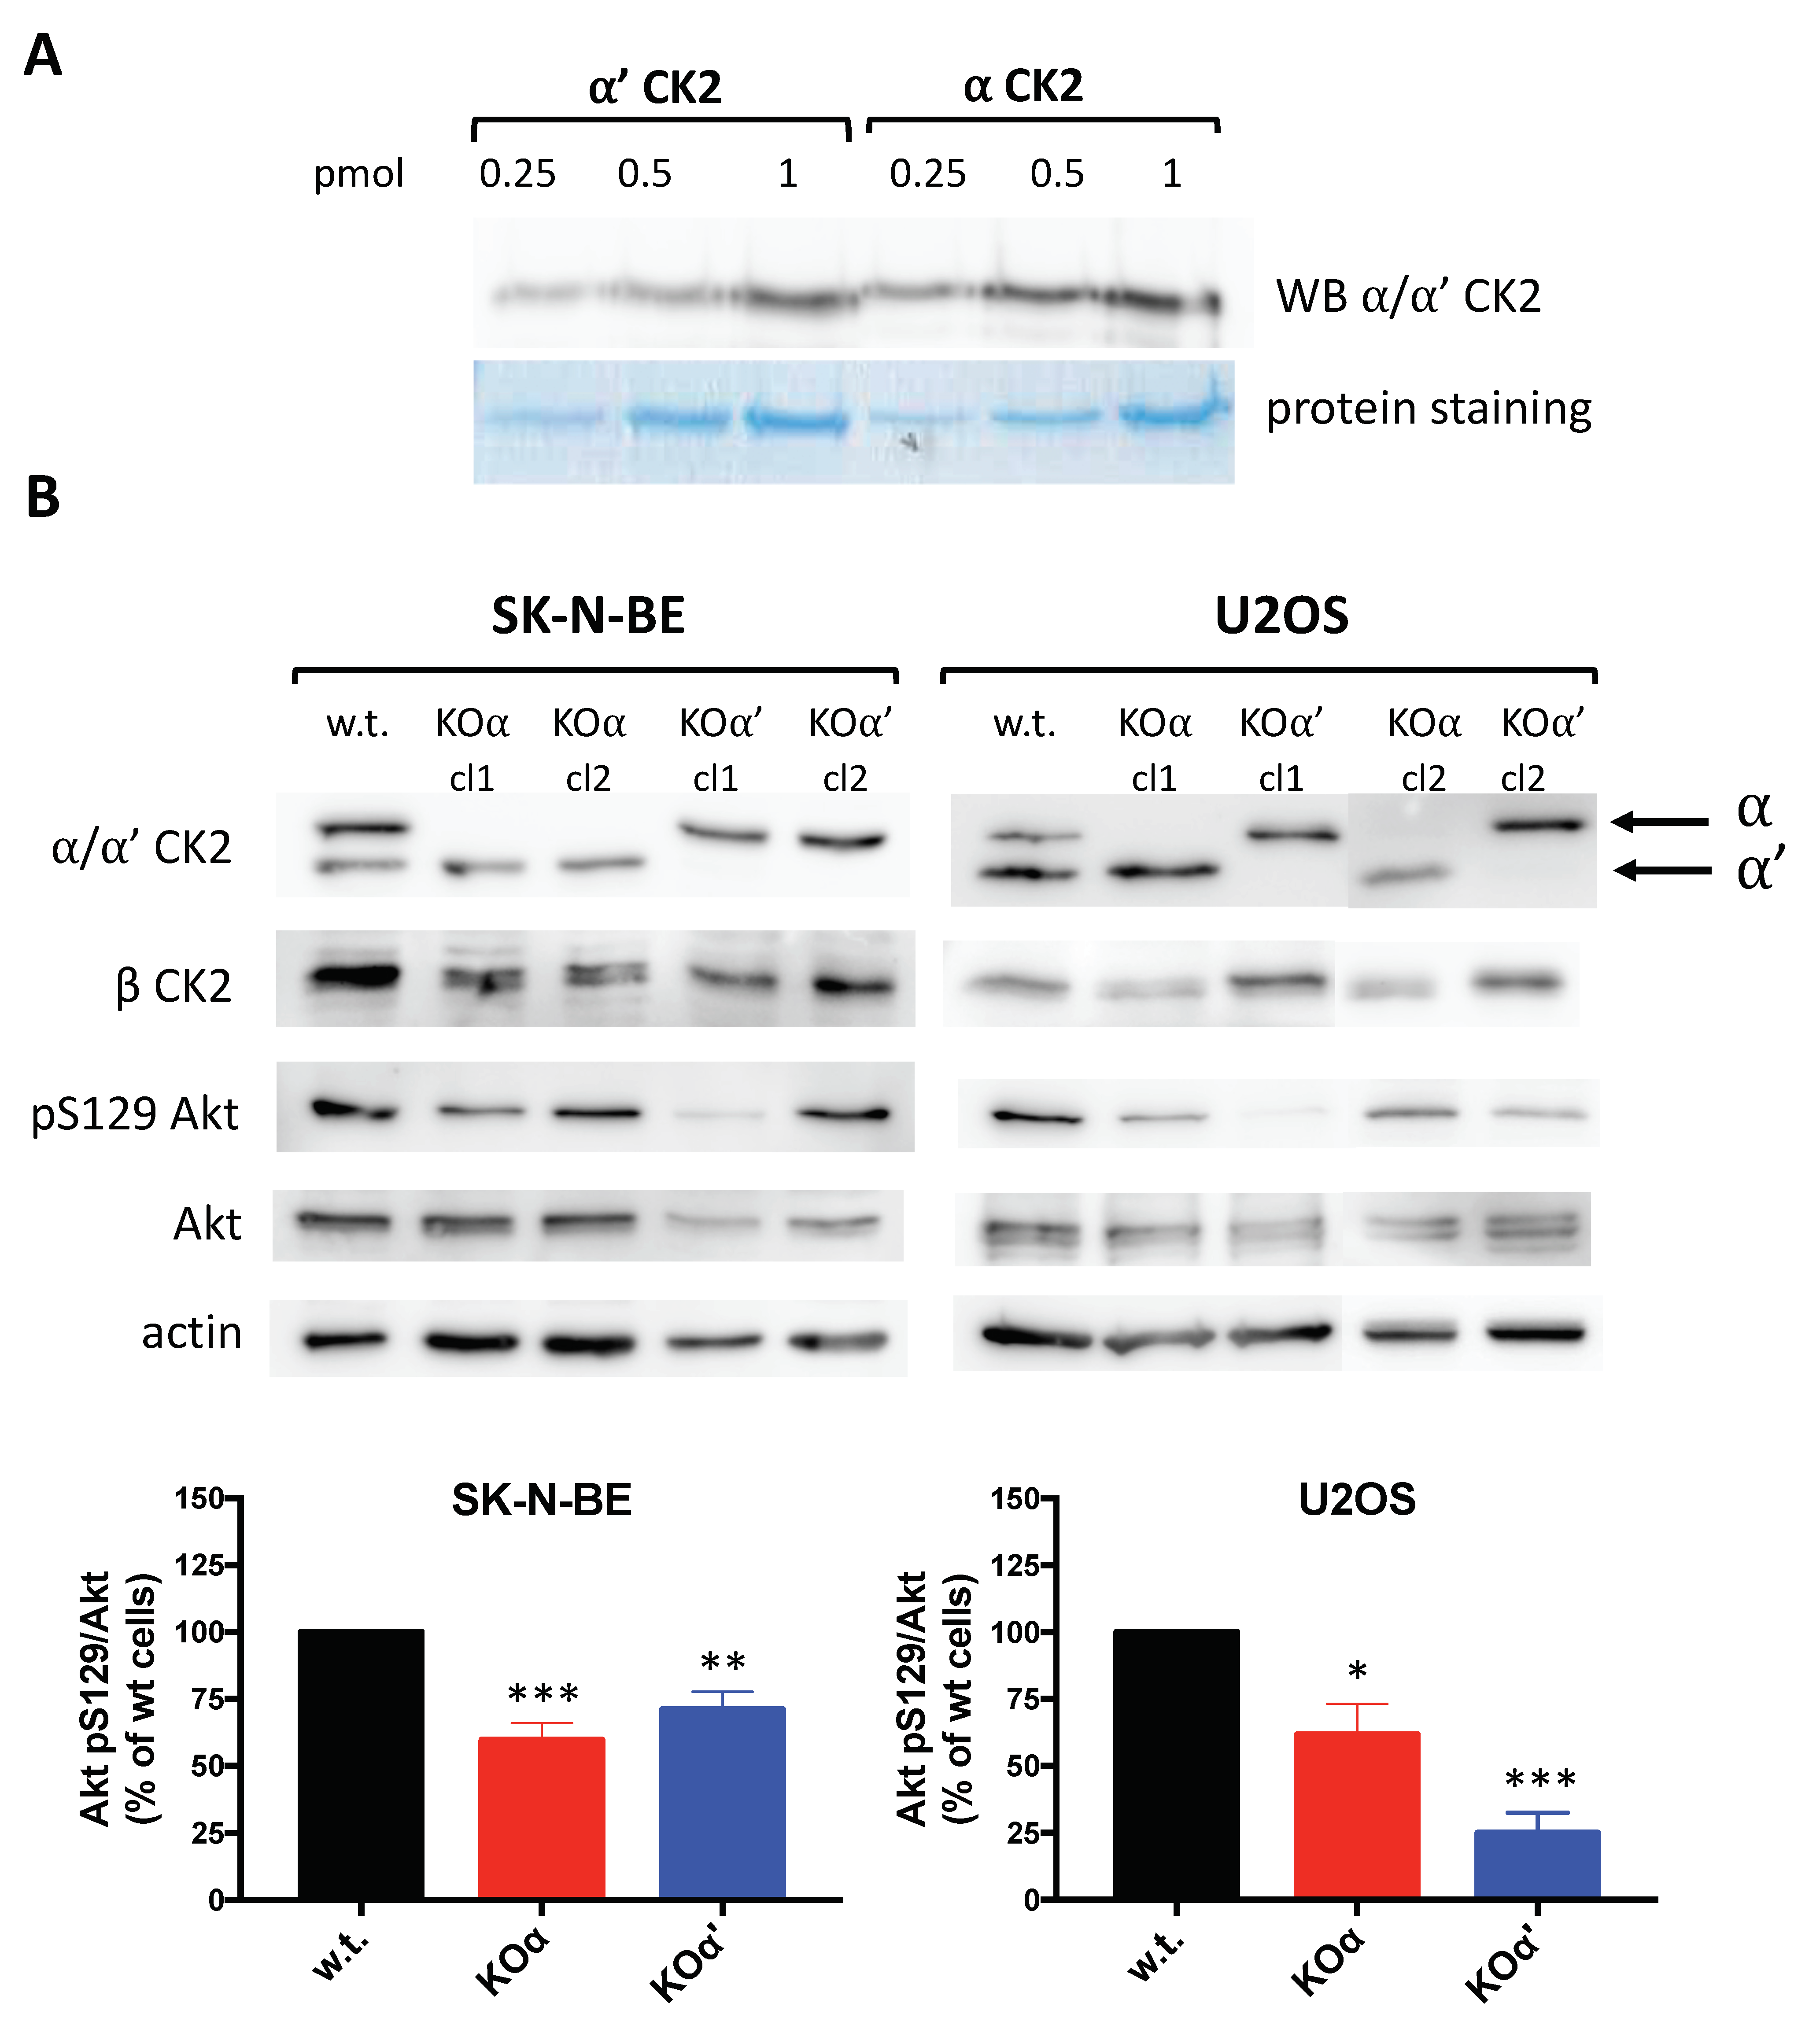
Abstract
:1. Introduction
2. Materials and Methods
2.1. Antibodies and Chemicals
2.2. Cell Culture
2.3. Generation of CK2-Knockout Cells by CRISPR-Cas9 Editing Tool
2.4. Cell Treatments and Lysis
2.5. Western Blotting Analysis and Titration of the CK2 Antibody Reactivity
2.6. Cell Growth Assay
2.7. Spheroid Formation Assay
2.8. Clonogenic Survival Assays
2.9. Wound-Healing Assays
2.10. Extracellular Lactate Concentration Analysis
2.11. Seahorse Glycolysis Stress Test
2.12. Cell Viability Assay
2.13. Statistical Analysis
3. Results
3.1. CK2 Profile in w.t. Cell Lines and KO Clones
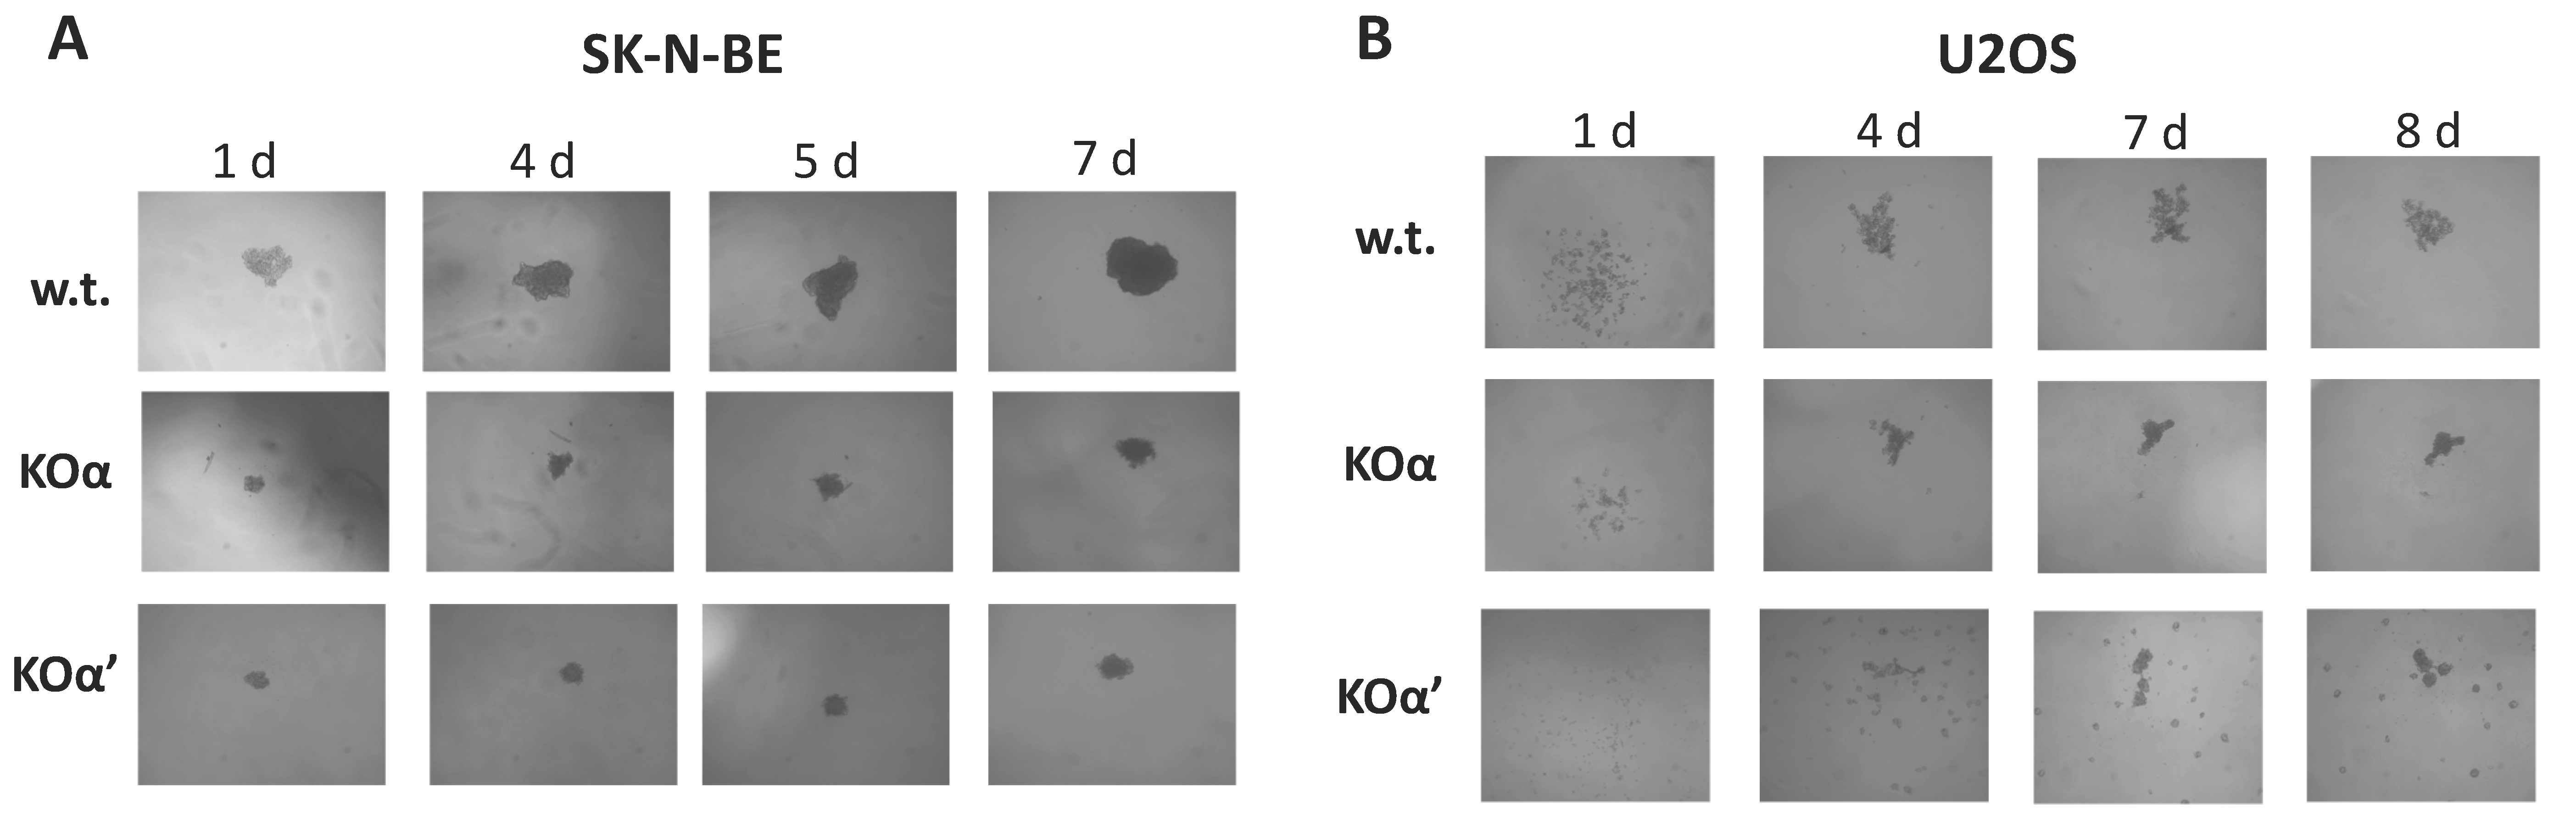
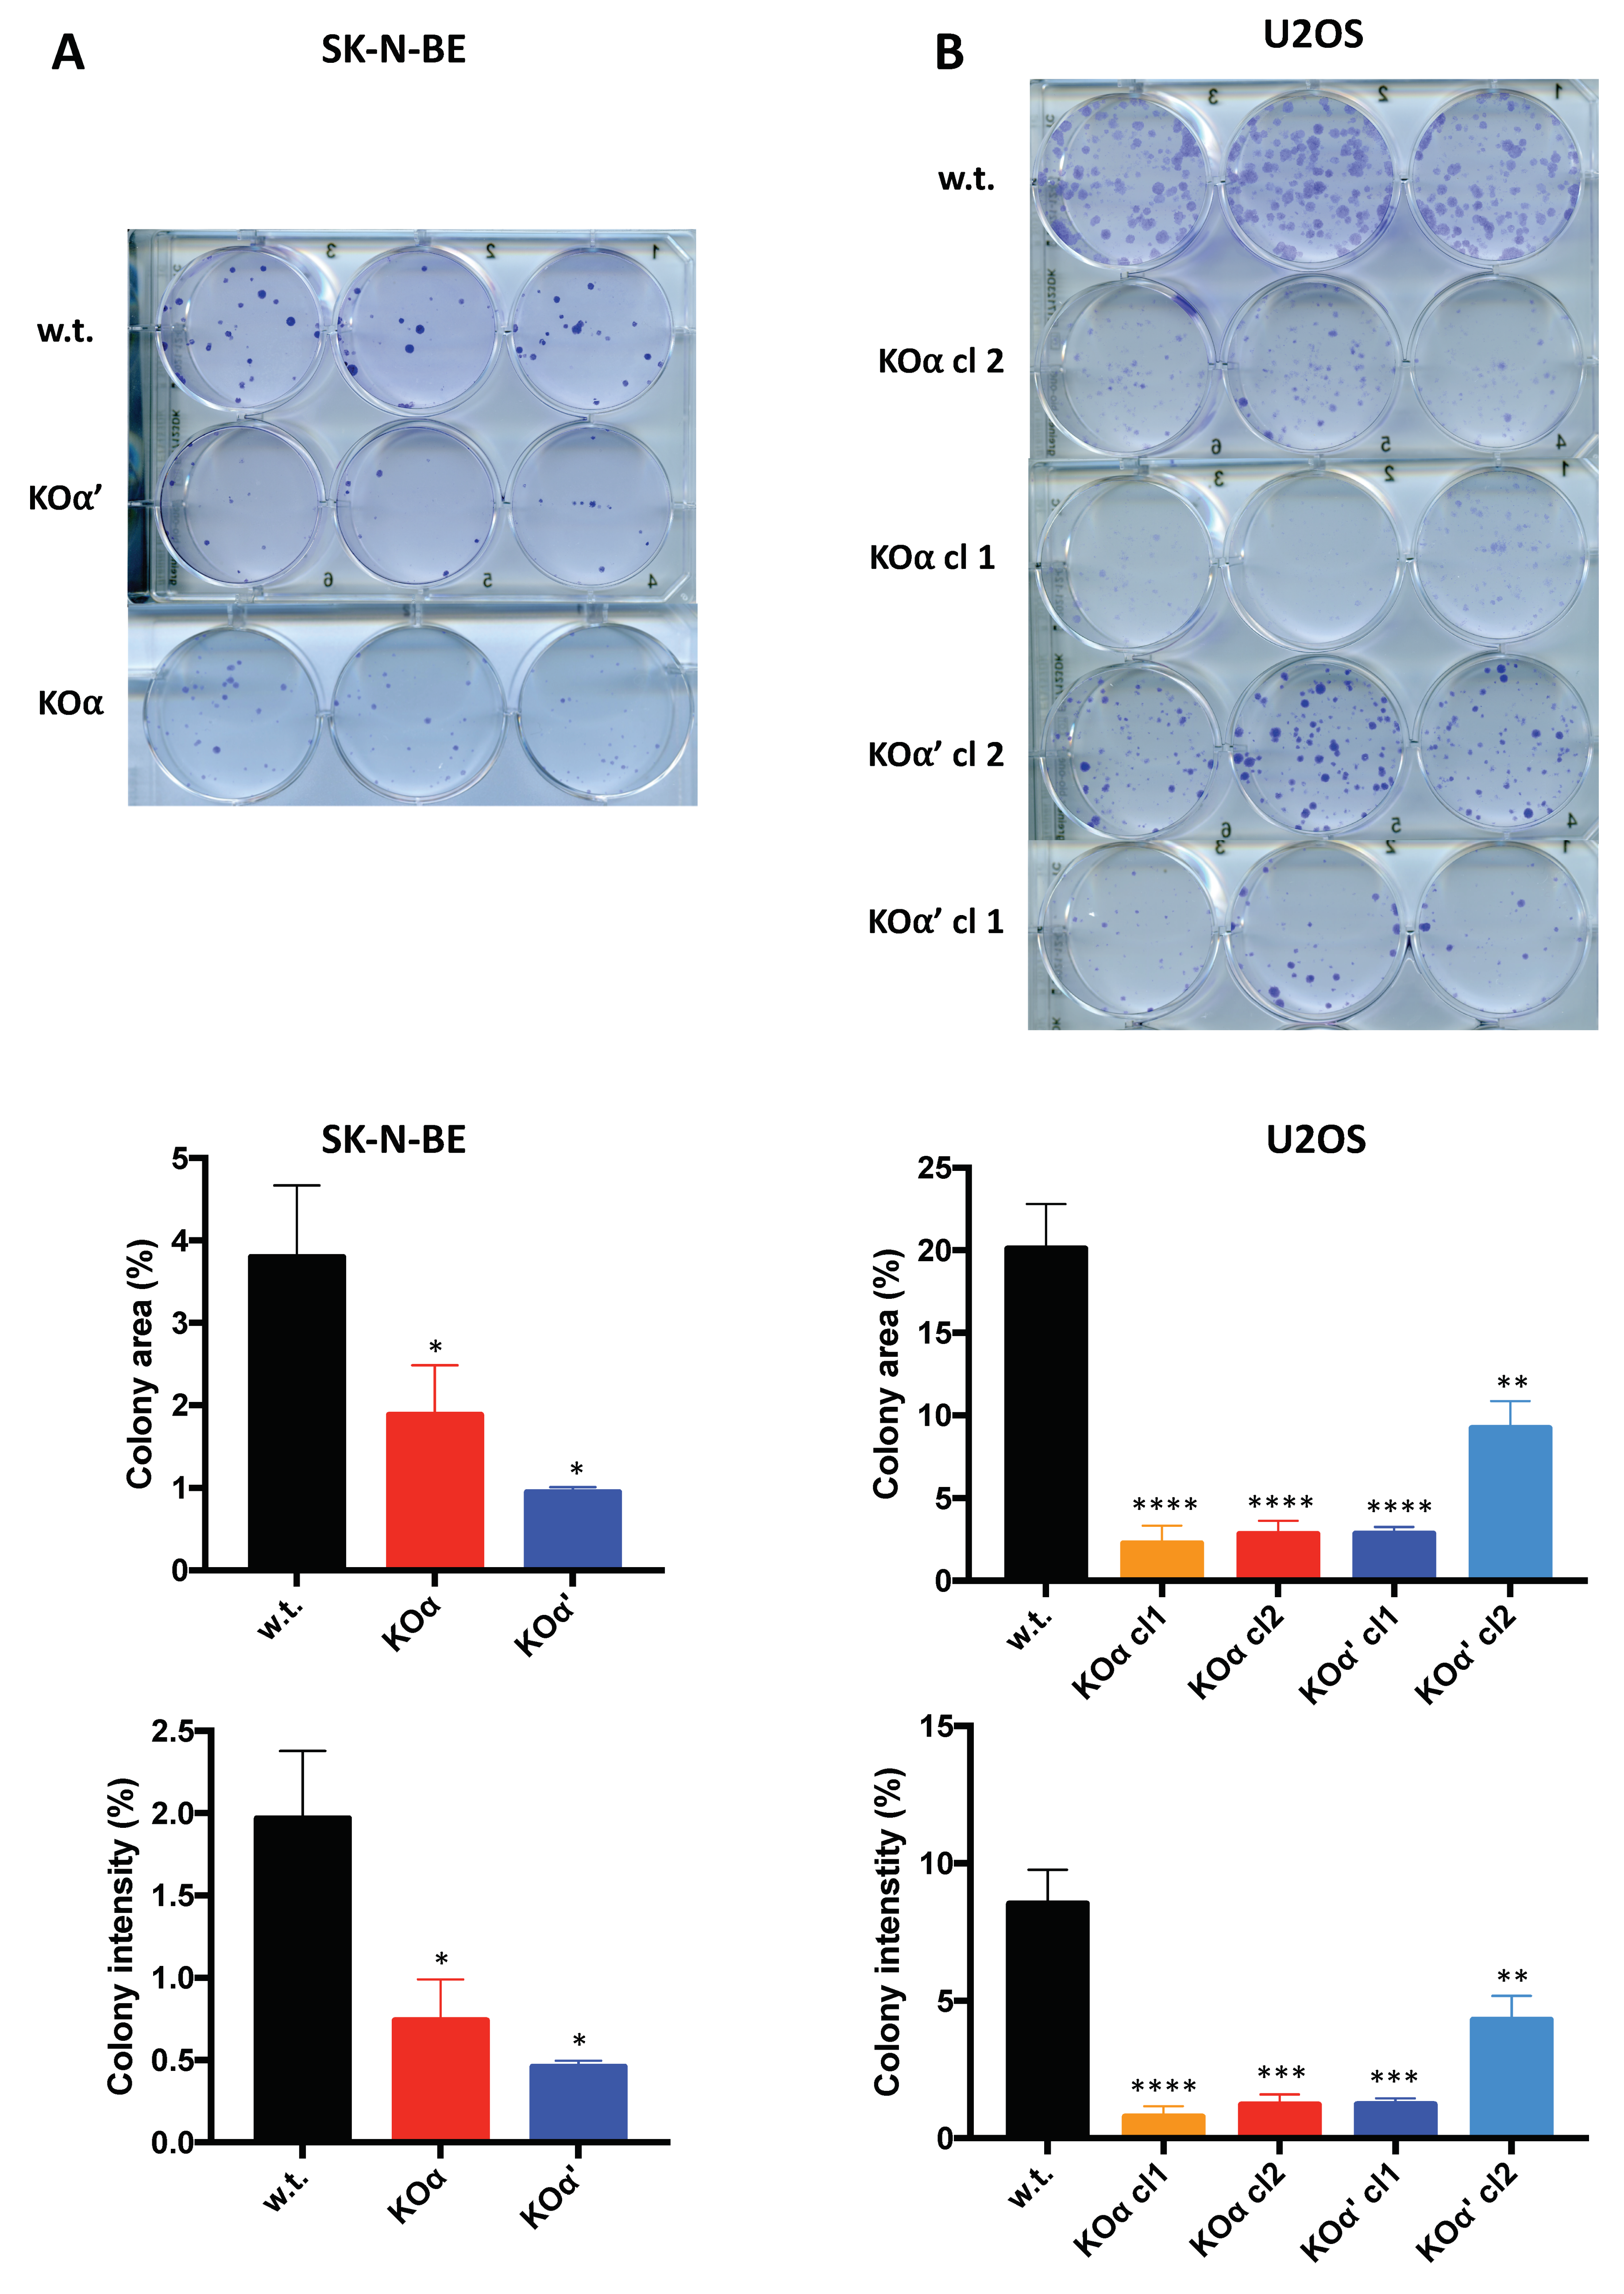
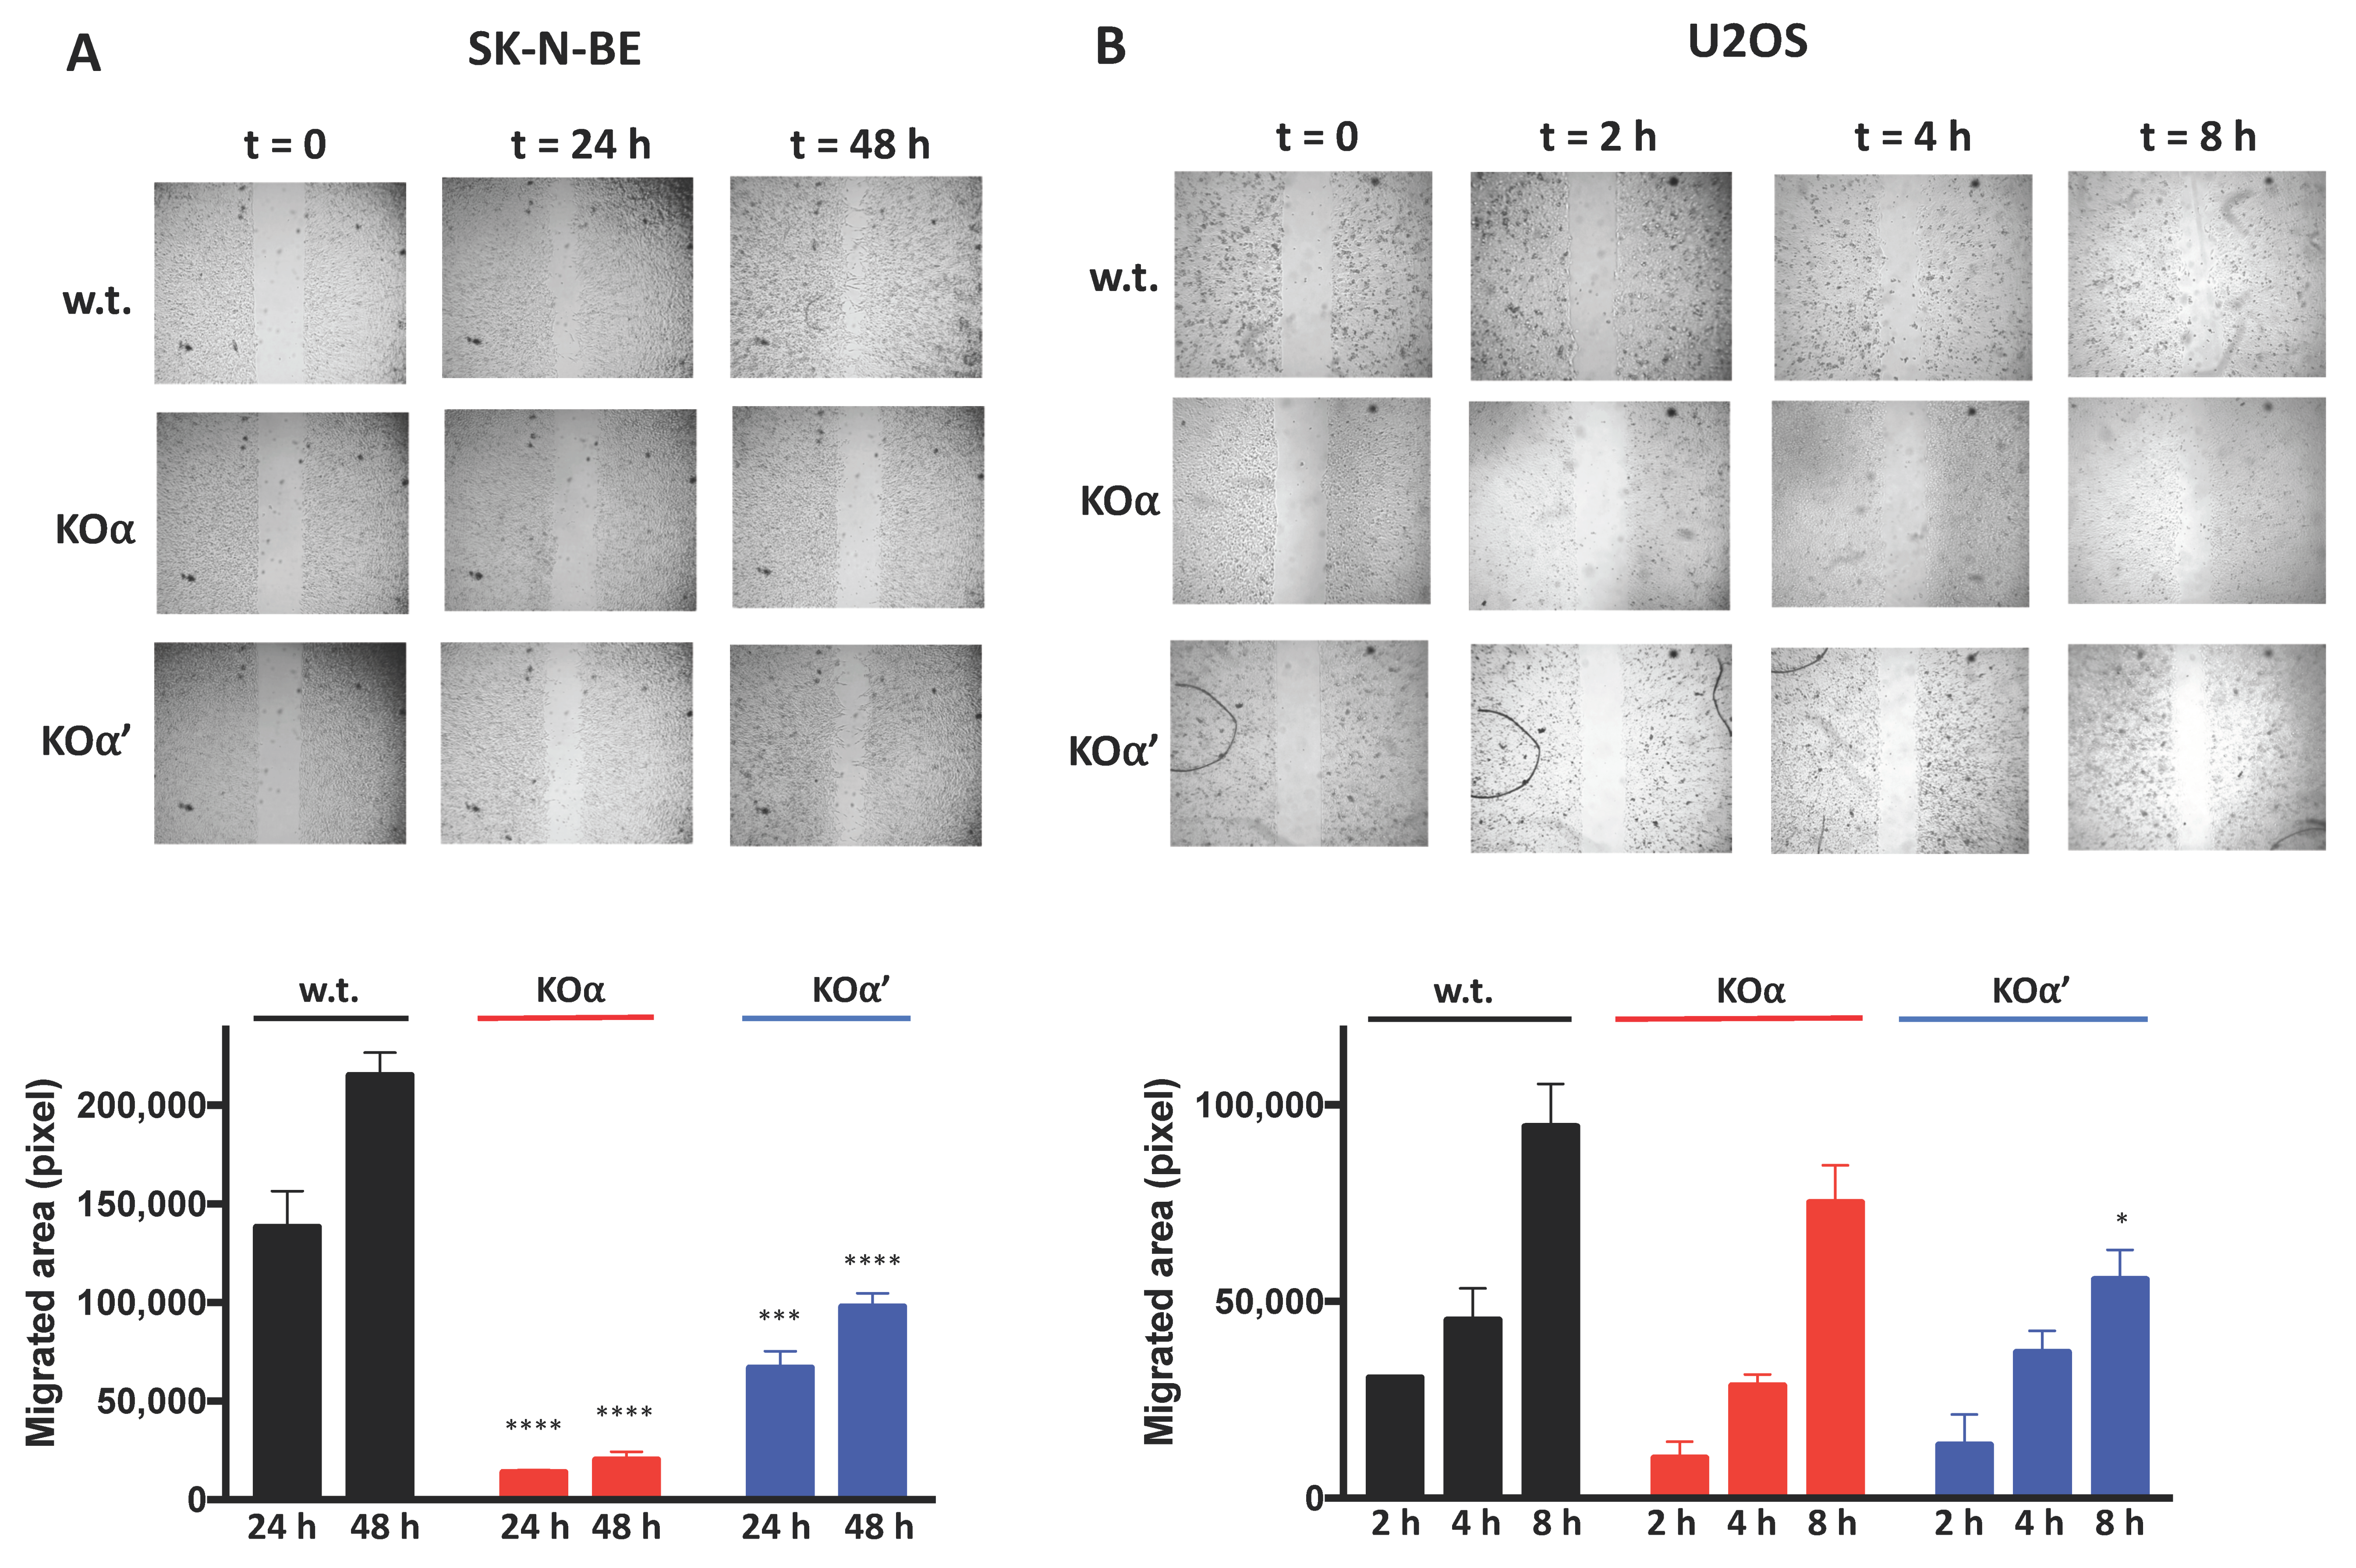
3.2. Deletion of an Individual CK2 Catalytic Subunit Reduces 3D Growth, Clonogenic Potential, and Motility
3.3. Effect of CK2 Targeting on Hypoxic Response and Glycolysis Enzymes
3.4. Extracellular Lactate Production
3.5. Analysis of the Extracellular Acidification Rate
4. Discussion
Supplementary Materials
Author Contributions
Funding
Institutional Review Board Statement
Informed Consent Statement
Data Availability Statement
Acknowledgments
Conflicts of Interest
References
- Hanahan, D.; Weinberg, R.A. Hallmarks of Cancer: The Next Generation. Cell 2011, 144, 646–674. [Google Scholar] [CrossRef] [PubMed] [Green Version]
- Ruzzene, M.; Pinna, L.A. Addiction to protein kinase CK2: A common denominator of diverse cancer cells? Biochim. Biophys. Acta Proteins Proteom. 2010, 1804, 499–504. [Google Scholar] [CrossRef] [PubMed]
- Ortega, C.E.; Seidner, Y.; Dominguez, I. Mining CK2 in Cancer. PLoS ONE 2014, 9, e115609. [Google Scholar] [CrossRef]
- Chua, M.M.J.; Lee, M.; Dominguez, I. Cancer-type dependent expression of CK2 transcripts. PLoS ONE 2017, 12, e0188854. [Google Scholar] [CrossRef] [Green Version]
- Litchfield, D.W. Protein kinase CK2: Structure, regulation and role in cellular decisions of life and death. Biochem. J. 2003, 369, 1–15. [Google Scholar] [CrossRef] [PubMed]
- Ahmad, K.A.; Wang, G.; Unger, G.; Slaton, J.; Ahmed, K. Protein Kinase CK2—A Key Suppressor of Apoptosis. Adv. Enzyme Regul. 2008, 48, 179–187. [Google Scholar] [CrossRef] [Green Version]
- Pinna, L.A. Protein kinase CK2: A challenge to canons. J. Cell Sci. 2002, 115, 3873–3878. [Google Scholar] [CrossRef] [Green Version]
- Filhol, O.; Giacosa, S.; Wallez, Y.; Cochet, C. Protein kinase CK2 in breast cancer: The CK2β regulatory subunit takes center stage in epithelial plasticity. Cell. Mol. Life Sci. 2015, 72, 3305–3322. [Google Scholar] [CrossRef]
- Deshiere, A.; Duchemin-Pelletier, E.; Spreux, E.; Ciais, D.; Combes, F.; Vandenbrouck, Y.; Couté, Y.; Mikaelian, I.; Giusiano, S.; Charpin, C.; et al. Unbalanced expression of CK2 kinase subunits is sufficient to drive epithelial-to-mesenchymal transition by Snail1 induction. Oncogene 2013, 32, 1373–1383. [Google Scholar] [CrossRef] [Green Version]
- Litchfield, D.W.; Bosc, D.G.; Canton, D.A.; Saulnier, R.B.; Vilk, G.; Zhang, C. Functional specialization of CK2 isoforms and characterization of isoform-specific binding partners. Mol. Cell. Biochem. 2001, 227, 21–29. [Google Scholar] [CrossRef]
- Turowec, J.P.; Vilk, G.; Gabriel, M.; Litchfield, D.W. Characterizing the convergence of protein kinase CK2 and caspase-3 reveals isoform-specific phosphorylation of caspase-3 by CK2α′: Implications for pathological roles of CK2 in promoting cancer cell survival. Oncotarget 2013, 4, 560–571. [Google Scholar] [CrossRef] [PubMed] [Green Version]
- Villamañan, L.; Alcaraz, E.; Pinna, L.A.; Ruzzene, M.; Itarte, E.; Arús, C.; Plana, M.; Candiota, A.P. Up-Regulation of the Alpha Prime Subunit of Protein Kinase CK2 as a Marker of Fast Proliferation in GL261 Cultured Cells. Pathol. Oncol. Res. 2019, 25, 1659–1663. [Google Scholar] [CrossRef] [PubMed]
- Al Quobaili, F.; Montenarh, M. CK2 and the regulation of the carbohydrate metabolism. Metab. Clin. Exp. 2012, 61, 1512–1517. [Google Scholar] [CrossRef] [PubMed]
- Zhang, X.; Yang, X.; Yang, C.; Li, P.; Yuan, W.; Deng, X.; Cheng, Y.; Li, P.; Yang, H.; Tao, J.; et al. Targeting protein kinase CK2 suppresses bladder cancer cell survival via the glucose metabolic pathway. Oncotarget 2016, 7, 87361–87372. [Google Scholar] [CrossRef] [PubMed] [Green Version]
- Yang, K.M.; Kim, K. Protein Kinase CK2 Modulation of Pyruvate Kinase M Isoforms Augments the Warburg Effect in Cancer Cells. J. Cell. Biochem. 2018, 119, 8501–8510. [Google Scholar] [CrossRef]
- Im, D.-K.; Cheong, H.; Lee, J.S.; Oh, M.-K.; Yang, K.M. Protein kinase CK2-dependent aerobic glycolysis-induced lactate dehydrogenase A enhances the migration and invasion of cancer cells. Sci. Rep. 2019, 9, 5337. [Google Scholar] [CrossRef] [Green Version]
- Di Maira, G.; Salvi, M.; Arrigoni, G.; Marin, O.; Sarno, S.; Brustolon, F.; Pinna, L.A.; Ruzzene, M. Protein kinase CK2 phosphorylates and upregulates Akt/PKB. Cell Death Differ. 2005, 12, 668–677. [Google Scholar] [CrossRef]
- Ponce, D.P.; Yefi, R.; Cabello, P.; Maturana, J.L.; Niechi, I.; Silva, E.; Galindo, M.; Antonelli, M.; Marcelain, K.; Armisén, R.; et al. CK2 functionally interacts with AKT/PKB to promote the β-catenin-dependent expression of survivin and enhance cell survival. Mol. Cell. Biochem. 2011, 356, 127–132. [Google Scholar] [CrossRef]
- Silva-Pavez, E.; Tapia, J.C. Protein Kinase CK2 in Cancer Energetics. Front. Oncol. 2020, 10, 893. [Google Scholar] [CrossRef]
- Borgo, C.; Milan, G.; Favaretto, F.; Stasi, F.; Fabris, R.; Salizzato, V.; Cesaro, L.; Belligoli, A.; Arianna, D.-D.; Foletto, M.; et al. CK2 modulates adipocyte insulin-signaling and is up-regulated in human obesity. Sci. Rep. 2017, 7, 1–15. [Google Scholar] [CrossRef] [Green Version]
- Guerra, B.; Issinger, O.-G. Role of Protein Kinase CK2 in Aberrant Lipid Metabolism in Cancer. Pharmaceuticals 2020, 13, 292. [Google Scholar] [CrossRef] [PubMed]
- Borgo, C.; Franchin, C.; Scalco, S.; Bosello-Travain, V.; Donella-Deana, A.; Arrigoni, G.; Salvi, M.; Pinna, L.A. Generation and Quantitative Proteomics Analysis of CK2α/α’(−/−) Cells. Sci. Rep. 2017, 7, 42409. [Google Scholar] [CrossRef] [PubMed] [Green Version]
- Zanin, S.; Borgo, C.; Girardi, C.; O’Brien, S.E.; Miyata, Y.; Pinna, L.A.; Donella-Deana, A.; Ruzzene, M. Effects of the CK2 Inhibitors CX-4945 and CX-5011 on Drug-Resistant Cells. PLoS ONE 2012, 7, e49193. [Google Scholar] [CrossRef] [PubMed] [Green Version]
- Ottaviani, D.; Marin, O.; Arrigoni, G.; Franchin, C.; Vilardell, J.; Sandre, M.; Li, W.; Parfitt, D.A.; Pinna, L.A.; E Cheetham, M.; et al. Protein kinase CK2 modulates HSJ1 function through phosphorylation of the UIM2 domain. Hum. Mol. Genet. 2017, 26, 611–623. [Google Scholar] [CrossRef] [PubMed] [Green Version]
- Sarno, S.; Ruzzene, M.; Frascella, P.; Pagano, M.A.; Meggio, F.; Zambon, A.; Mazzorana, M.; Di Maira, G.; Lucchini, V.; Pinna, L.A. Development and exploitation of CK2 inhibitors. Mol. Cell. Biochem. 2005, 274, 69–76. [Google Scholar] [CrossRef] [PubMed]
- Pampaloni, F.; Richa, R.; Ansari, N.; Stelzer, E.H.K. Live Spheroid Formation Recorded with Light Sheet-Based Fluorescence Microscopy. Adv. Struct. Saf. Stud. 2014, 1251, 43–57. [Google Scholar] [CrossRef]
- Guzmán, C.; Bagga, M.; Kaur, A.; Westermarck, J.; Abankwa, D. ColonyArea: An ImageJ Plugin to Automatically Quantify Colony Formation in Clonogenic Assays. PLoS ONE 2014, 9, e92444. [Google Scholar] [CrossRef]
- Venter, C.; Niesler, C.U. Rapid quantification of cellular proliferation and migration using ImageJ. Biotechniques 2019, 66, 99–102. [Google Scholar] [CrossRef] [Green Version]
- Masgras, I.; Ciscato, F.; Brunati, A.M.; Tibaldi, E.; Indraccolo, S.; Curtarello, M.; Chiara, F.; Cannino, G.; Papaleo, E.; Lambrughi, M.; et al. Absence of Neurofibromin Induces an Oncogenic Metabolic Switch via Mitochondrial ERK-Mediated Phosphorylation of the Chaperone TRAP1. Cell Rep. 2017, 18, 659–672. [Google Scholar] [CrossRef] [Green Version]
- Chou, T.-C. Drug Combination Studies and Their Synergy Quantification Using the Chou-Talalay Method. Cancer Res. 2010, 70, 440–446. [Google Scholar] [CrossRef] [Green Version]
- Salizzato, V.; Zanin, S.; Borgo, C.; Lidron, E.; Salvi, M.; Rizzuto, R.; Pallafacchina, G.; Donella-Deana, A. Protein kinase CK2 subunits exert specific and coordinated functions in skeletal muscle differentiation and fusogenic activity. FASEB J. 2019, 33, 10648–10667. [Google Scholar] [CrossRef] [PubMed]
- Lucido, C.T.; Miskimins, W.K.; Vermeer, P.D. Propranolol Promotes Glucose Dependence and Synergizes with Dichloroacetate for Anti-Cancer Activity in HNSCC. Cancers 2018, 10, 476. [Google Scholar] [CrossRef] [PubMed] [Green Version]
- Mottet, D.; Ruys, S.P.D.; Demazy, C.; Raes, M.; Michiels, C. Role for casein kinase 2 in the regulation of HIF-1 activity. Int. J. Cancer 2005, 117, 764–774. [Google Scholar] [CrossRef] [PubMed]
- Guerra, B.; Rasmussen, T.D.L.; Schnitzler, A.; Jensen, H.H.; Boldyreff, B.S.; Miyata, Y.; Marcussen, N.; Niefind, K.; Issinger, O.-G. Protein kinase CK2 inhibition is associated with the destabilization of HIF-1α in human cancer cells. Cancer Lett. 2015, 356, 751–761. [Google Scholar] [CrossRef]
- Ampofo, E.; Kietzmann, T.; Zimmer, A.; Jakupovic, M.; Montenarh, M.; Götz, C. Phosphorylation of the von Hippel–Lindau protein (VHL) by protein kinase CK2 reduces its protein stability and affects p53 and HIF-1α mediated transcription. Int. J. Biochem. Cell Biol. 2010, 42, 1729–1735. [Google Scholar] [CrossRef]
- Luo, W.; Hu, H.; Chang, R.; Zhong, J.; Knabel, M.; O’Meally, R.; Cole, R.N.; Pandey, A.; Semenza, G.L. Pyruvate Kinase M2 Is a PHD3-Stimulated Coactivator for Hypoxia-Inducible Factor 1. Cell 2011, 145, 732–744. [Google Scholar] [CrossRef] [Green Version]
- Lee, P.; Chandel, N.S.; Simon, M.C. Cellular adaptation to hypoxia through hypoxia inducible factors and beyond. Nat. Rev. Mol. Cell Biol. 2020, 21, 268–283. [Google Scholar] [CrossRef]
- Milkiewicz, M.; Pugh, C.W.; Egginton, S. Inhibition of endogenous HIF inactivation induces angiogenesis in ischaemic skeletal muscles of mice. J. Physiol. 2004, 560, 21–26. [Google Scholar] [CrossRef]
- Bosc, D.G.; Graham, K.C.; Saulnier, R.B.; Zhang, C.; Prober, D.; Gietz, R.D.; Litchfield, D.W. Identification and Characterization of CKIP-1, a Novel Pleckstrin Homology Domain-containing Protein That Interacts with Protein Kinase CK2. J. Biol. Chem. 2000, 275, 14295–14306. [Google Scholar] [CrossRef] [Green Version]
- Messenger, M.M.; Saulnier, R.B.; Gilchrist, A.D.; Diamond, P.; Gorbsky, G.J.; Litchfield, D.W. Interactions between Protein Kinase CK2 and Pin1. Evidence for Phosphorylation-Dependent Interactions. J. Biol. Chem. 2002, 277, 23054–23064. [Google Scholar] [CrossRef] [Green Version]
- Lettieri, A.; Borgo, C.; Zanieri, L.; D’Amore, C.; Oleari, R.; Paganoni, A.; Pinna, L.A.; Cariboni, A.; Salvi, M. Protein Kinase CK2 Subunits Differentially Perturb the Adhesion and Migration of GN11 Cells: A Model of Immature Migrating Neurons. Int. J. Mol. Sci. 2019, 20, 5951. [Google Scholar] [CrossRef] [PubMed] [Green Version]
- Franchin, C.; Borgo, C.; Cesaro, L.; Zaramella, S.; Vilardell, J.; Salvi, M.; Arrigoni, G.; Pinna, L.A. Re-evaluation of protein kinase CK2 pleiotropy: New insights provided by a phosphoproteomics analysis of CK2 knockout cells. Cell. Mol. Life Sci. 2018, 75, 2011–2026. [Google Scholar] [CrossRef] [PubMed]
- Martins, L.R.; Lúcio, P.; Melão, A.; Antunes, I.; A Cardoso, B.; Stansfield, R.; Bertilaccio, M.T.S.; Ghia, P.; Drygin, D.; Silva, M.G.; et al. Activity of the clinical-stage CK2-specific inhibitor CX-4945 against chronic lymphocytic leukemia. Leukemia 2013, 28, 179–182. [Google Scholar] [CrossRef] [PubMed]
- Perea, S.E.; Baladrón, I.; Valenzuelasilva, C.M.; Perera, Y. CIGB-300: A peptide-based drug that impairs the Protein Kinase CK2-mediated phosphorylation. Semin. Oncol. 2018, 45, 58–67. [Google Scholar] [CrossRef]
- D’Amore, C.; Borgo, C.; Sarno, S.; Salvi, M. Role of CK2 inhibitor CX-4945 in anti-cancer combination therapy—Potential clinical relevance. Cell. Oncol. 2020, 43, 1003–1016. [Google Scholar] [CrossRef]
- Cozza, G.; Girardi, C.; Ranchio, A.; Lolli, G.; Sarno, S.; Orzeszko, A.; Kazimierczuk, Z.; Battistutta, R.; Ruzzene, M.; Pinna, L.A. Cell-permeable dual inhibitors of protein kinases CK2 and PIM-1: Structural features and pharmacological potential. Cell. Mol. Life Sci. 2014, 71, 3173–3185. [Google Scholar] [CrossRef]
- Schneider, C.C.; Kartarius, S.; Montenarh, M.; Orzeszko, A.; Kazimierczuk, Z. Modified tetrahalogenated benzimidazoles with CK2 inhibitory activity are active against human prostate cancer cells LNCaP in vitro. Bioorganic Med. Chem. 2012, 20, 4390–4396. [Google Scholar] [CrossRef]
- Cozza, G.; Zanin, S.; Sarno, S.; Costa, E.; Girardi, C.; Ribaudo, G.; Salvi, M.; Zagotto, G.; Ruzzene, M.; Pinna, L.A. Design, validation and efficacy of bisubstrate inhibitors specifically affecting ecto-CK2 kinase activity. Biochem. J. 2015, 471, 415–430. [Google Scholar] [CrossRef]
- Prudent, R.; Sautel, C.F.; Cochet, C. Structure-based discovery of small molecules targeting different surfaces of protein-kinase CK2. Biochim. Biophys. Acta Proteins Proteom. 2010, 1804, 493–498. [Google Scholar] [CrossRef]
- Bollacke, A.; Nienberg, C.; Le Borgne, M.; Jose, J. Toward selective CK2alpha and CK2alpha’ inhibitors: Development of a novel whole-cell kinase assay by Autodisplay of catalytic CK2alpha’. J. Pharm. Biomed. Anal. 2016, 121, 253–260. [Google Scholar] [CrossRef]


Publisher’s Note: MDPI stays neutral with regard to jurisdictional claims in published maps and institutional affiliations. |
© 2021 by the authors. Licensee MDPI, Basel, Switzerland. This article is an open access article distributed under the terms and conditions of the Creative Commons Attribution (CC BY) license (http://creativecommons.org/licenses/by/4.0/).
Share and Cite
Zonta, F.; Borgo, C.; Quezada Meza, C.P.; Masgras, I.; Rasola, A.; Salvi, M.; Pinna, L.A.; Ruzzene, M. Contribution of the CK2 Catalytic Isoforms α and α’ to the Glycolytic Phenotype of Tumor Cells. Cells 2021, 10, 181. https://doi.org/10.3390/cells10010181
Zonta F, Borgo C, Quezada Meza CP, Masgras I, Rasola A, Salvi M, Pinna LA, Ruzzene M. Contribution of the CK2 Catalytic Isoforms α and α’ to the Glycolytic Phenotype of Tumor Cells. Cells. 2021; 10(1):181. https://doi.org/10.3390/cells10010181
Chicago/Turabian StyleZonta, Francesca, Christian Borgo, Camila Paz Quezada Meza, Ionica Masgras, Andrea Rasola, Mauro Salvi, Lorenzo A. Pinna, and Maria Ruzzene. 2021. "Contribution of the CK2 Catalytic Isoforms α and α’ to the Glycolytic Phenotype of Tumor Cells" Cells 10, no. 1: 181. https://doi.org/10.3390/cells10010181