1. Introduction
The evaluation of the problems associated with floods has typically been fundamentally approached from a hydrological perspective [
1,
2], although several points of view can be found in the scientific literature. However, in the field of flood risk management, apart from traditional methodological approaches based on the simulation of flood models [
3,
4], there are other perspectives based on multicriteria socioeconomic assessments [
5], statistical rainfall indicators [
6], or several different natural resilience strategies [
7,
8,
9,
10], for example.
Currently, the increasing effect of climate change on the phenomena associated with torrential rains is forcing a rethink in those methodologies and approaches in many places [
4,
11,
12]. One of the locations where this change has been particularly virulent is in Spanish Mediterranean basins. There, the appearance of the DANA phenomenon (Spanish acronym for
depresión aislada en niveles altos, meaning upper-level isolated atmospheric depression) has replaced the traditional flash floods associated with cold fall phenomena [
13]. Technically, it is a depression isolated at high levels, where a cold front clashes with warm air and produces heavy storms and torrential rains. In practice, DANA is a weather phenomenon quite similar to a cold drop, but its intensity and effects are proving to be much more devastating. Some researchers have already begun to warn Europe about the growing phenomenon of “medicanes” [
14,
15,
16]. These meteorological phenomena, named after the analogy in their effects with the usual hurricanes in the USA, are increasingly present every year in the Mediterranean due to climate change [
17].
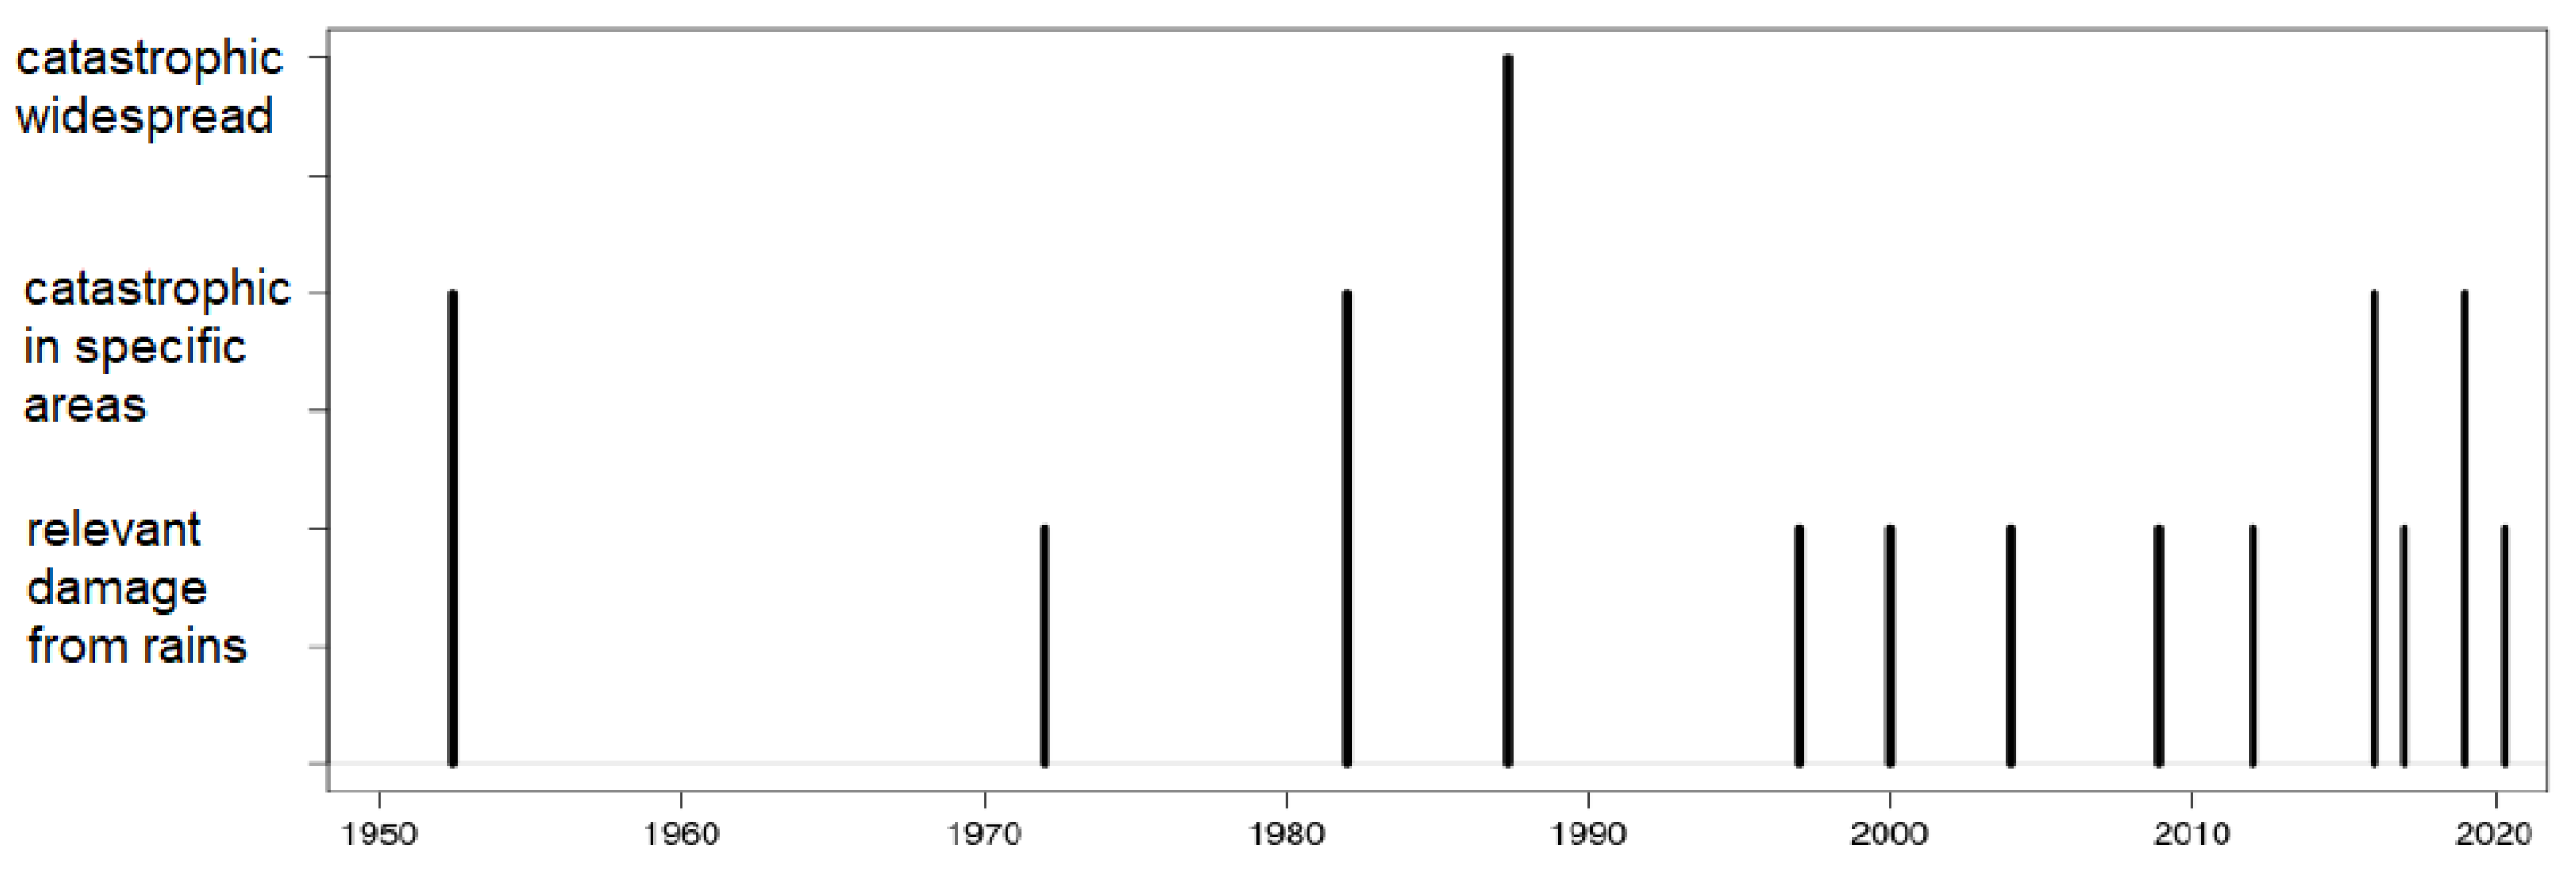
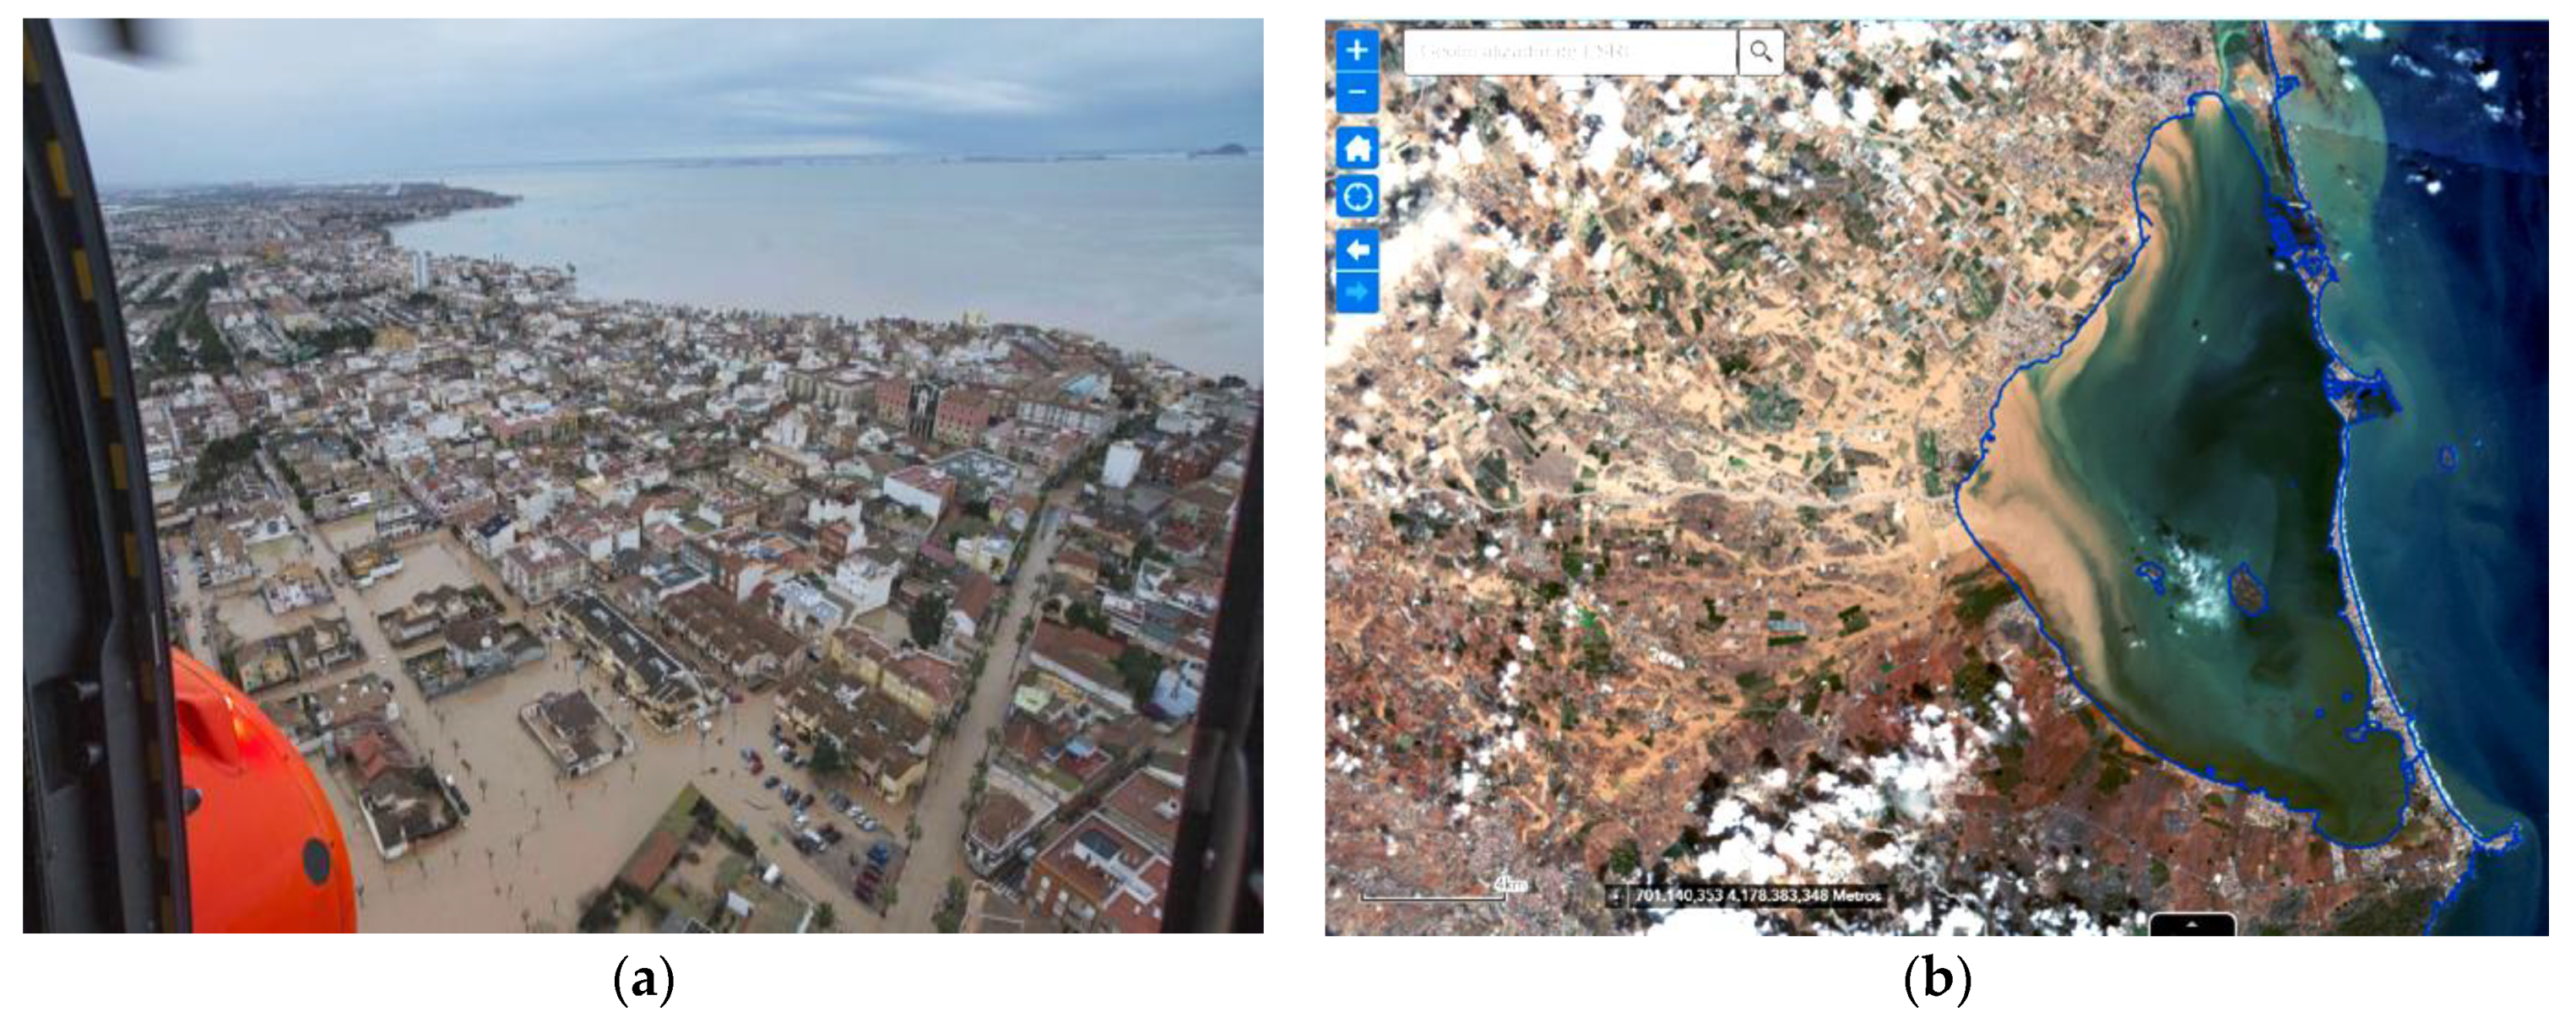
Mediterranean coastal areas have traditionally been characterized as being subject to frequent flooding, some of which are even quite relevant. However, during the last two decades, relevant flooding events and damage have increased exponentially (
Figure 1). This phenomenon, which occurs in most of the Mediterranean basins, is likely influenced by the effects of climate change, as some recent studies have begun to notice [
18,
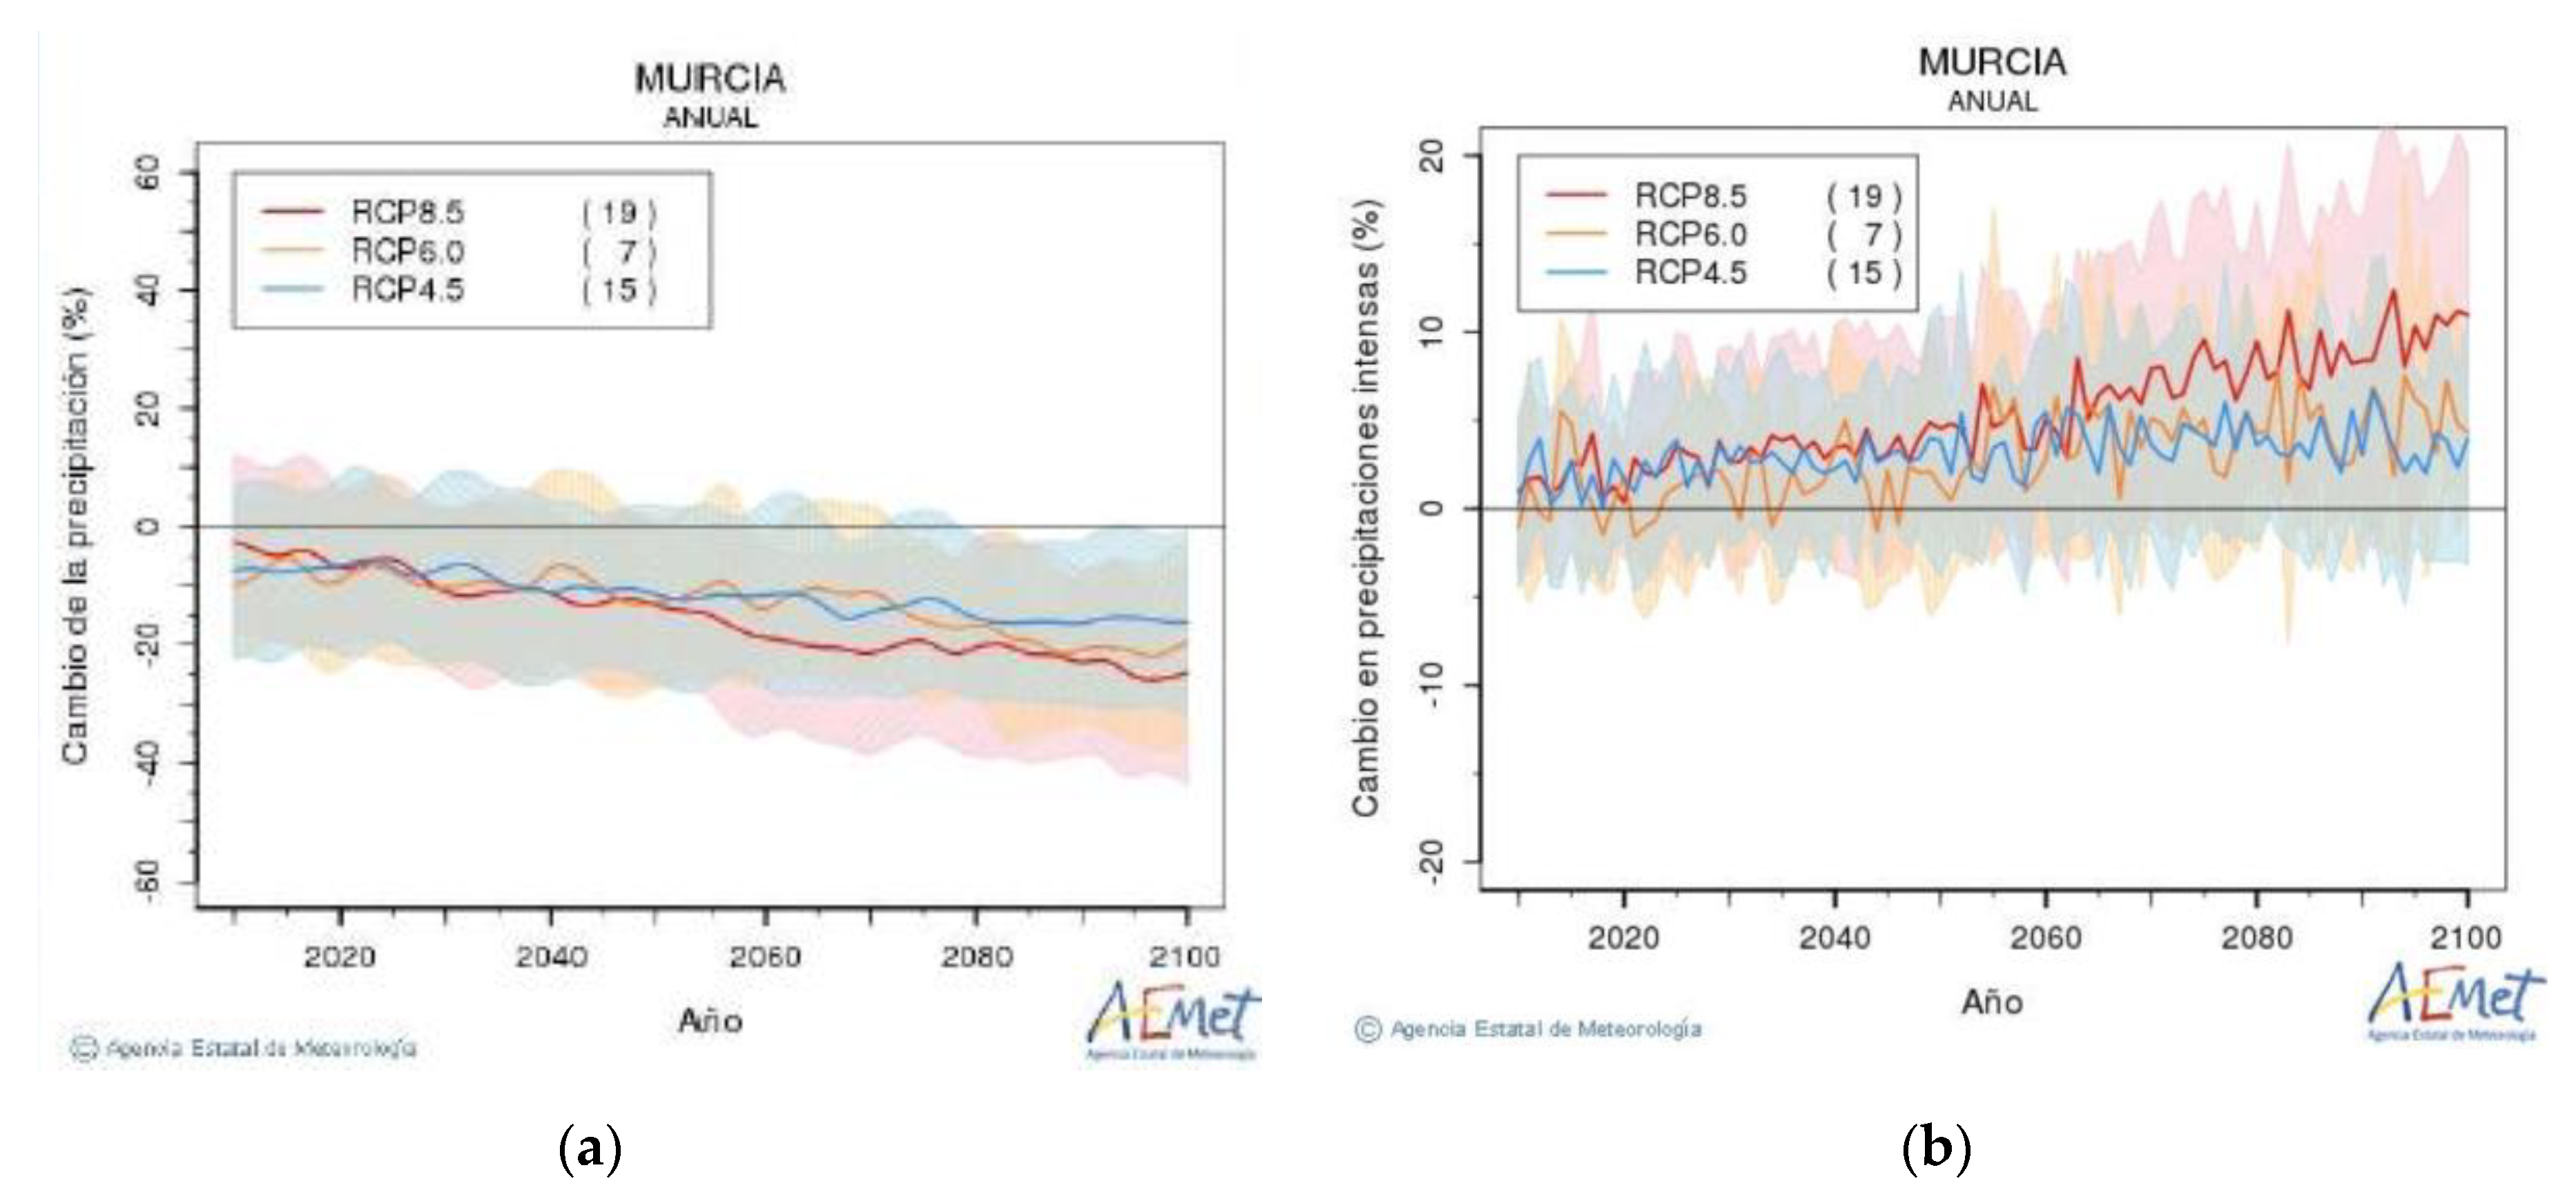
19]. In general, the existing predictions in the meteorological studies carried out in Mediterranean basins such as this one [
20,
21] show a global trend towards desertification in the area due to the annual loss of rainfall. This is in contrast to an increasing value of the maximum daily rains that denote an increasing trend of these extreme episodes (
Figure 2). However, these meteorological analyses, which are carried out by the administrations responsible for the matter and which also underline the statistical increases in frequency and intensity detected in rainfall for recent years, do not justify the increase in damage from catastrophic episodes that appeared in the historical series.
A common variable to all these Mediterranean basins is the intense anthropization process that these territories have undergone [
24,
25]. The Spanish Mediterranean coast is undoubtedly the European region in which activities such as tourism, agriculture, infrastructure expansion, etc., have experienced the greatest degree of growth in recent decades [
26]. Nevertheless, it has traditionally been difficult to analyze the extent to which phenomena such as diffuse anthropization processes are responsible for the increasing vulnerability to the flooding of an area. Complex phenomena, such as the effect of soil sealing due to the artificialization of the territory, the alteration of the natural hydrographic network of the basins due to changes in land use, or the impact of the barrier effect generated by linear transport infrastructures, have no wide-ranging methodological proposals in the current scientific literature. Several approaches for specific case studies can be found [
27,
28,
29], but comprehensive large-scale evaluation methods from a territorial point of view are still lacking.
In this context, this research proposes an analytical method based on the evaluation of GIS indicators using geostatistical and Normalized Difference Vegetation Index (NDVI) algorithms. This innovative approach enables the statistical and spatial correlation of the degree of territorial transformation derived from anthropic processes with the increasing vulnerability of a territory to floods. To assess its validity, the methodology is applied to the Campo de Cartagena case study, a large basin located in the southeast part of the Spanish Mediterranean coast that has been suffering from catastrophic floods in recent years.
2. Materials and Methods
2.1. Area of Study
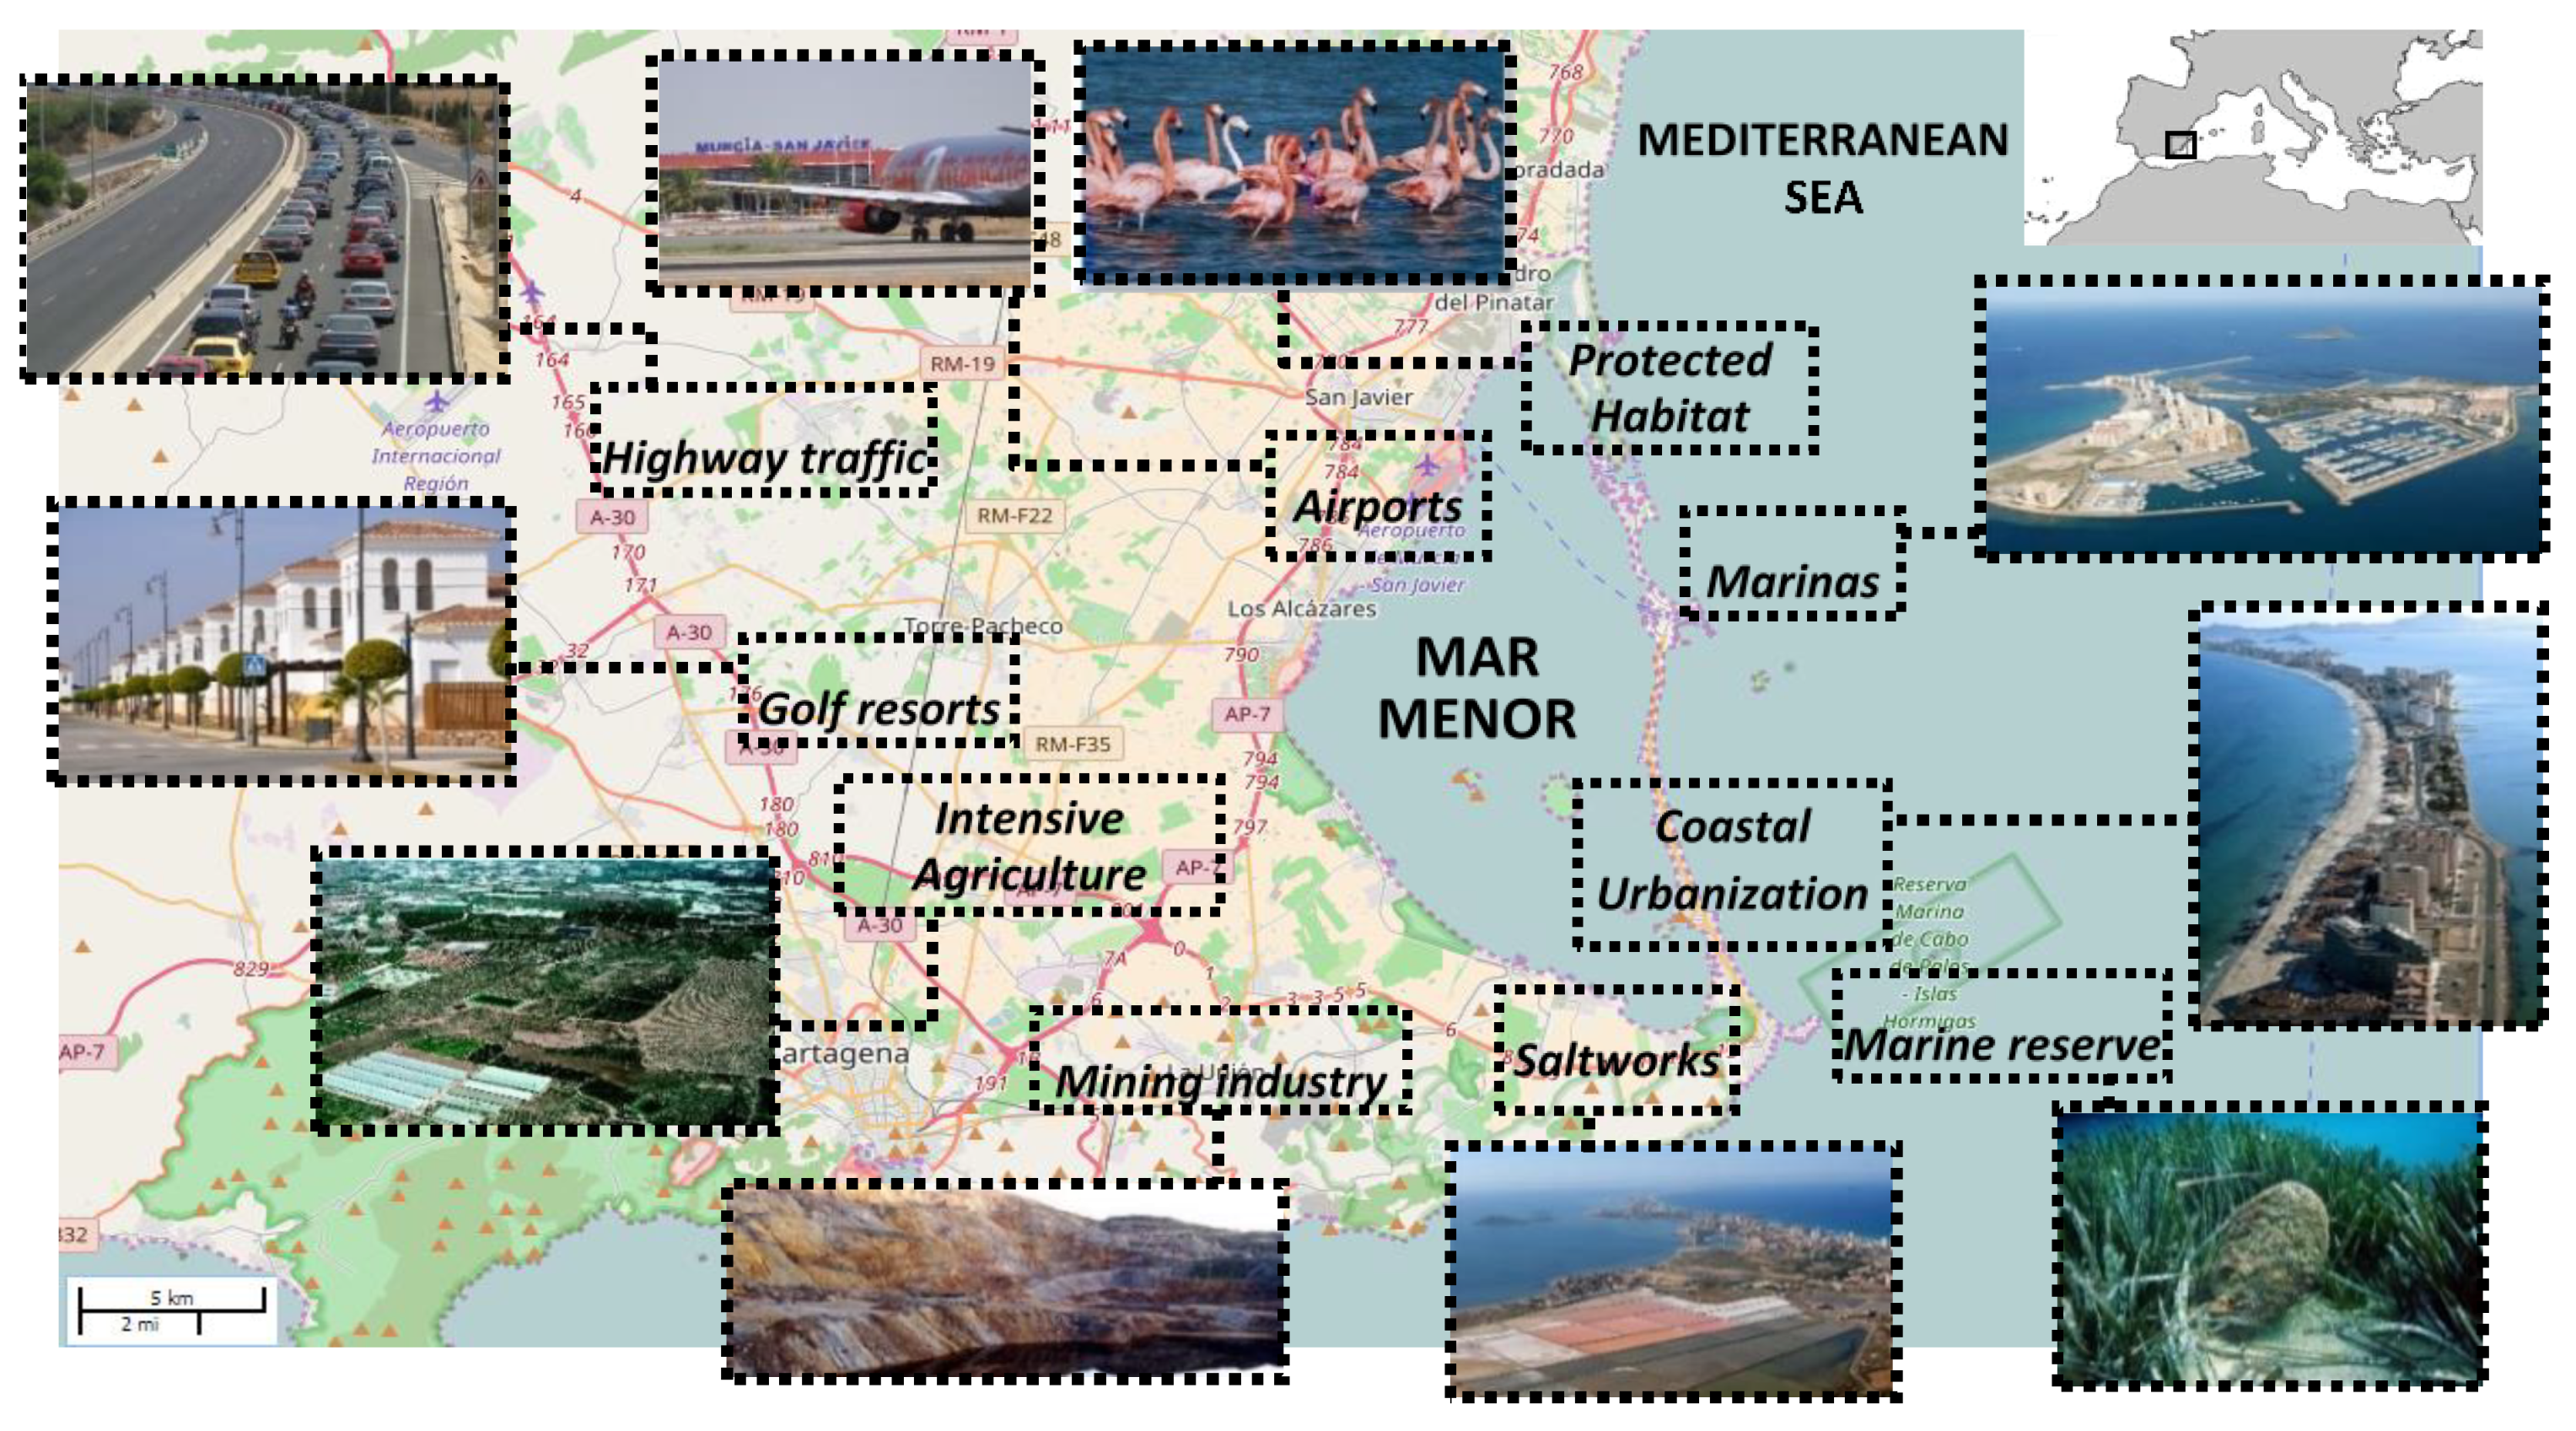
The study area is the Campo de Cartagena watershed. This basin is located in the Region of Murcia, a semiarid Mediterranean territory in Southeastern Spain. The area is characterized by scarce precipitation (<300 mm per year) that mainly occurs during storm events in autumn and winter. This traditional dryland agriculture territory has been extensively transformed from a relatively natural landscape to one of intense human activity in the last 60 years despite having an important environmental value [
30]. At present, we can find a varied catalogue of human activities and anthropic elements, such as high-density urban sprawl in coastal towns, isolated tourist resorts, intensive irrigated agriculture, important infrastructures such as highways, railways, ports or airports, etc. (
Figure 3). A coastal lagoon called Mar Menor is situated at the end of this large watershed, delimited by a group of mountains configuring an extensive plain of about 1440 km
2.
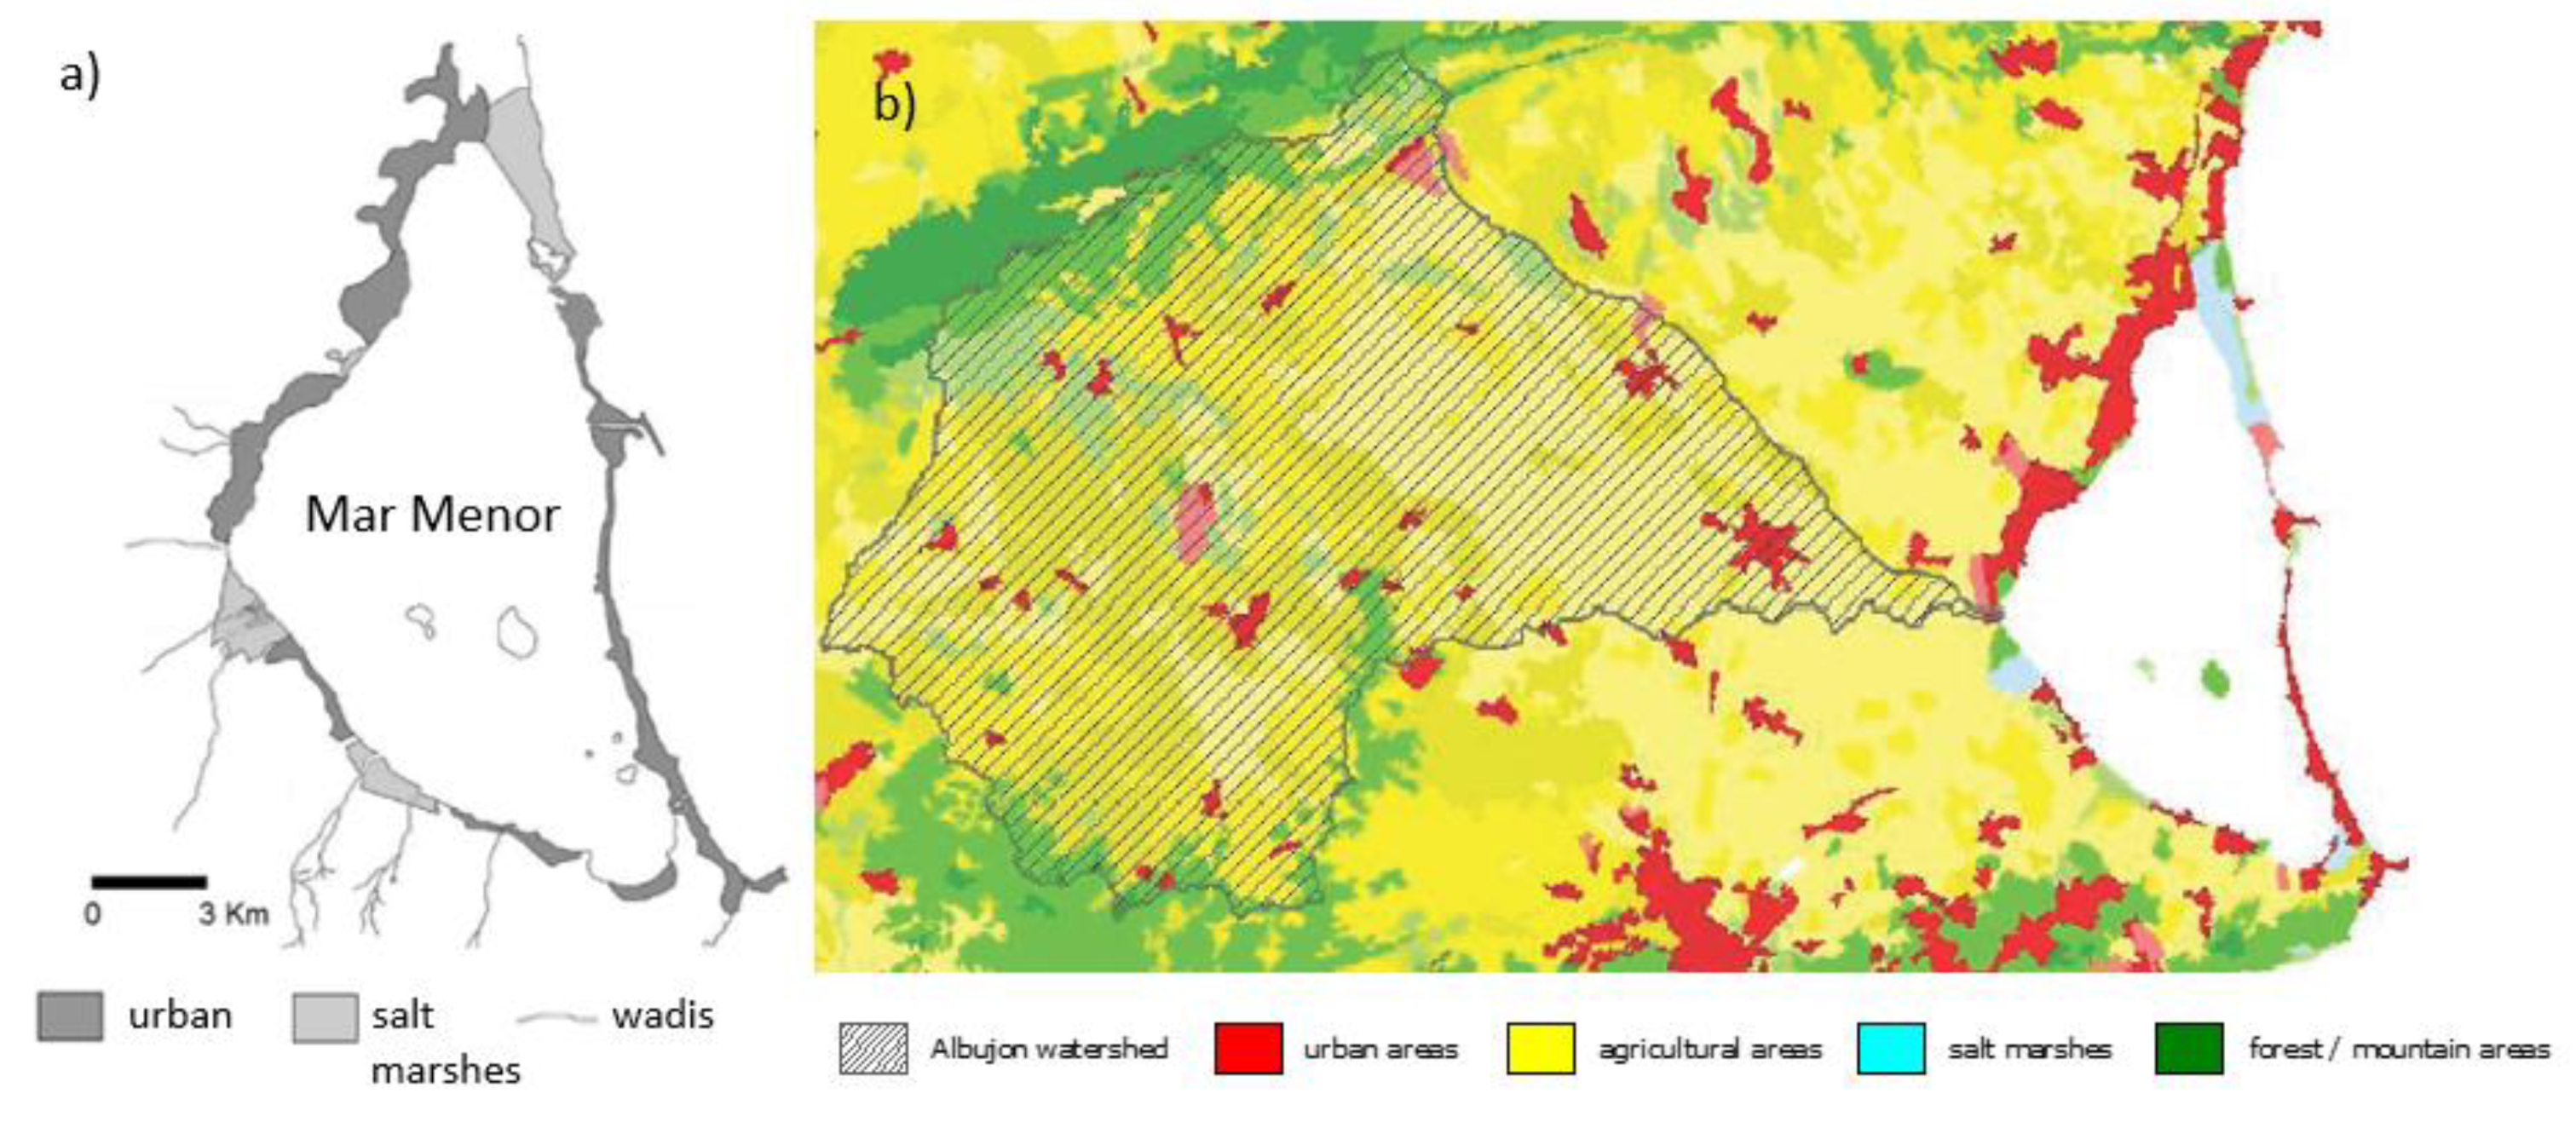
Freshwater that inputs into the lagoon were traditionally restricted to six main ephemeral watercourses called wadis. These wadis can reach lengths of over 50 km. The surface area of the watershed nourishing some of these wadis, such as the Albujon, even exceeds that of the Mar Menor lagoon itself (
Figure 4). These wide and shallow gullies are generally inactive but can carry great quantities of water and sediment during the traditional Mediterranean flood episodes in autumn. The torrential nature of the water supply is now aggravated by the impermeable soils and scarce vegetation cover of the watershed areas, going directly to the Mar Menor. As stated in
Figure 2, during the last two decades, damage from relevant flooding events has been catastrophic and has increased by 318% [
22]. Among them, the DANAs from 2016 and 2019 are especially serious (
Figure 5).
2.2. Methodological Overview
The process of analyzing the impact of diffuse territorial anthropization in increasing the vulnerability of a territory of floods caused by DANA is carried out in applied stages in the following framework.
In the first stage, an analysis of contrasting the expected results from the application of simulations following the models collected from the official regulations for a highly anthropized study area at the territorial level is initiated. In this case, simulations are carried out in the Mar Menor and Campo de Cartagena areas for different return periods using the national system of cartography of flooded areas by the Ministry of the Environment in Spain. The theoretical results obtained for the study area are contrasted with the results observed through an NDVI analysis of the latest relevant extreme events (in this case the DANAs of 2016, 2018, and 2019).
Second, in this case study, a relevant damage situation is examined, as an unexpected dissociation between the theoretical floodplain and those observed in the last events is detected. As a result, this situation is analyzed to determine what the implications of the anthropic territorial transformations are in the area. To accomplish this, a territorial analysis of the study area is performed, as executed in the previous subsection, to determine what the possible anthropic phenomena may be that are influenced by the global phenomenon of the territorial vulnerability to floods.
Third, based on this territorial analysis, a series of GIS indicators of anthropic phenomena and a GIS indicator of the damages derived from floods are elaborated. The first indicators must spatially represent the different levels of damage caused. The latter must be able to model, in a significant way, the spatiotemporal evolution of the anthropic phenomena estimated as more related to the problem of flooding in the chosen study area.
Fourth, and lastly, a geostatistical analysis is carried out to assess the spatial correlation of the evolution of the selected indicators of territorial anthropization to the generation of damages derived from floods. To accomplish this, we first calculate the global Moran’s I autocorrelation statistic to verify that the spatial distribution patterns obtained for the said correlation have statistical significance. The verification would show that we are facing a real phenomenon and not a random distribution without physical significance. Secondly, a bivariate analysis is performed using the Anselin Local Moran I statistic to assess numerically the individual correlation level of each of the different anthropization indicators with the damage indicator. Finally, we apply a hot spot analysis where spatial statistics indicate the behavior patterns of the spatial distribution of the previous statistic. We next describe in detail the methodological process of these stages.
2.3. Elaboration of GIS Indicators
Two georeferenced databases are implemented in this model to generate the indicators that serve as evaluation elements in the geostatistical analysis: (a) spatial values of the damage that occurred in the last three DANAs and (b) a spatiotemporal distribution of the most relevant GIS transformation indicators found in the bibliography.
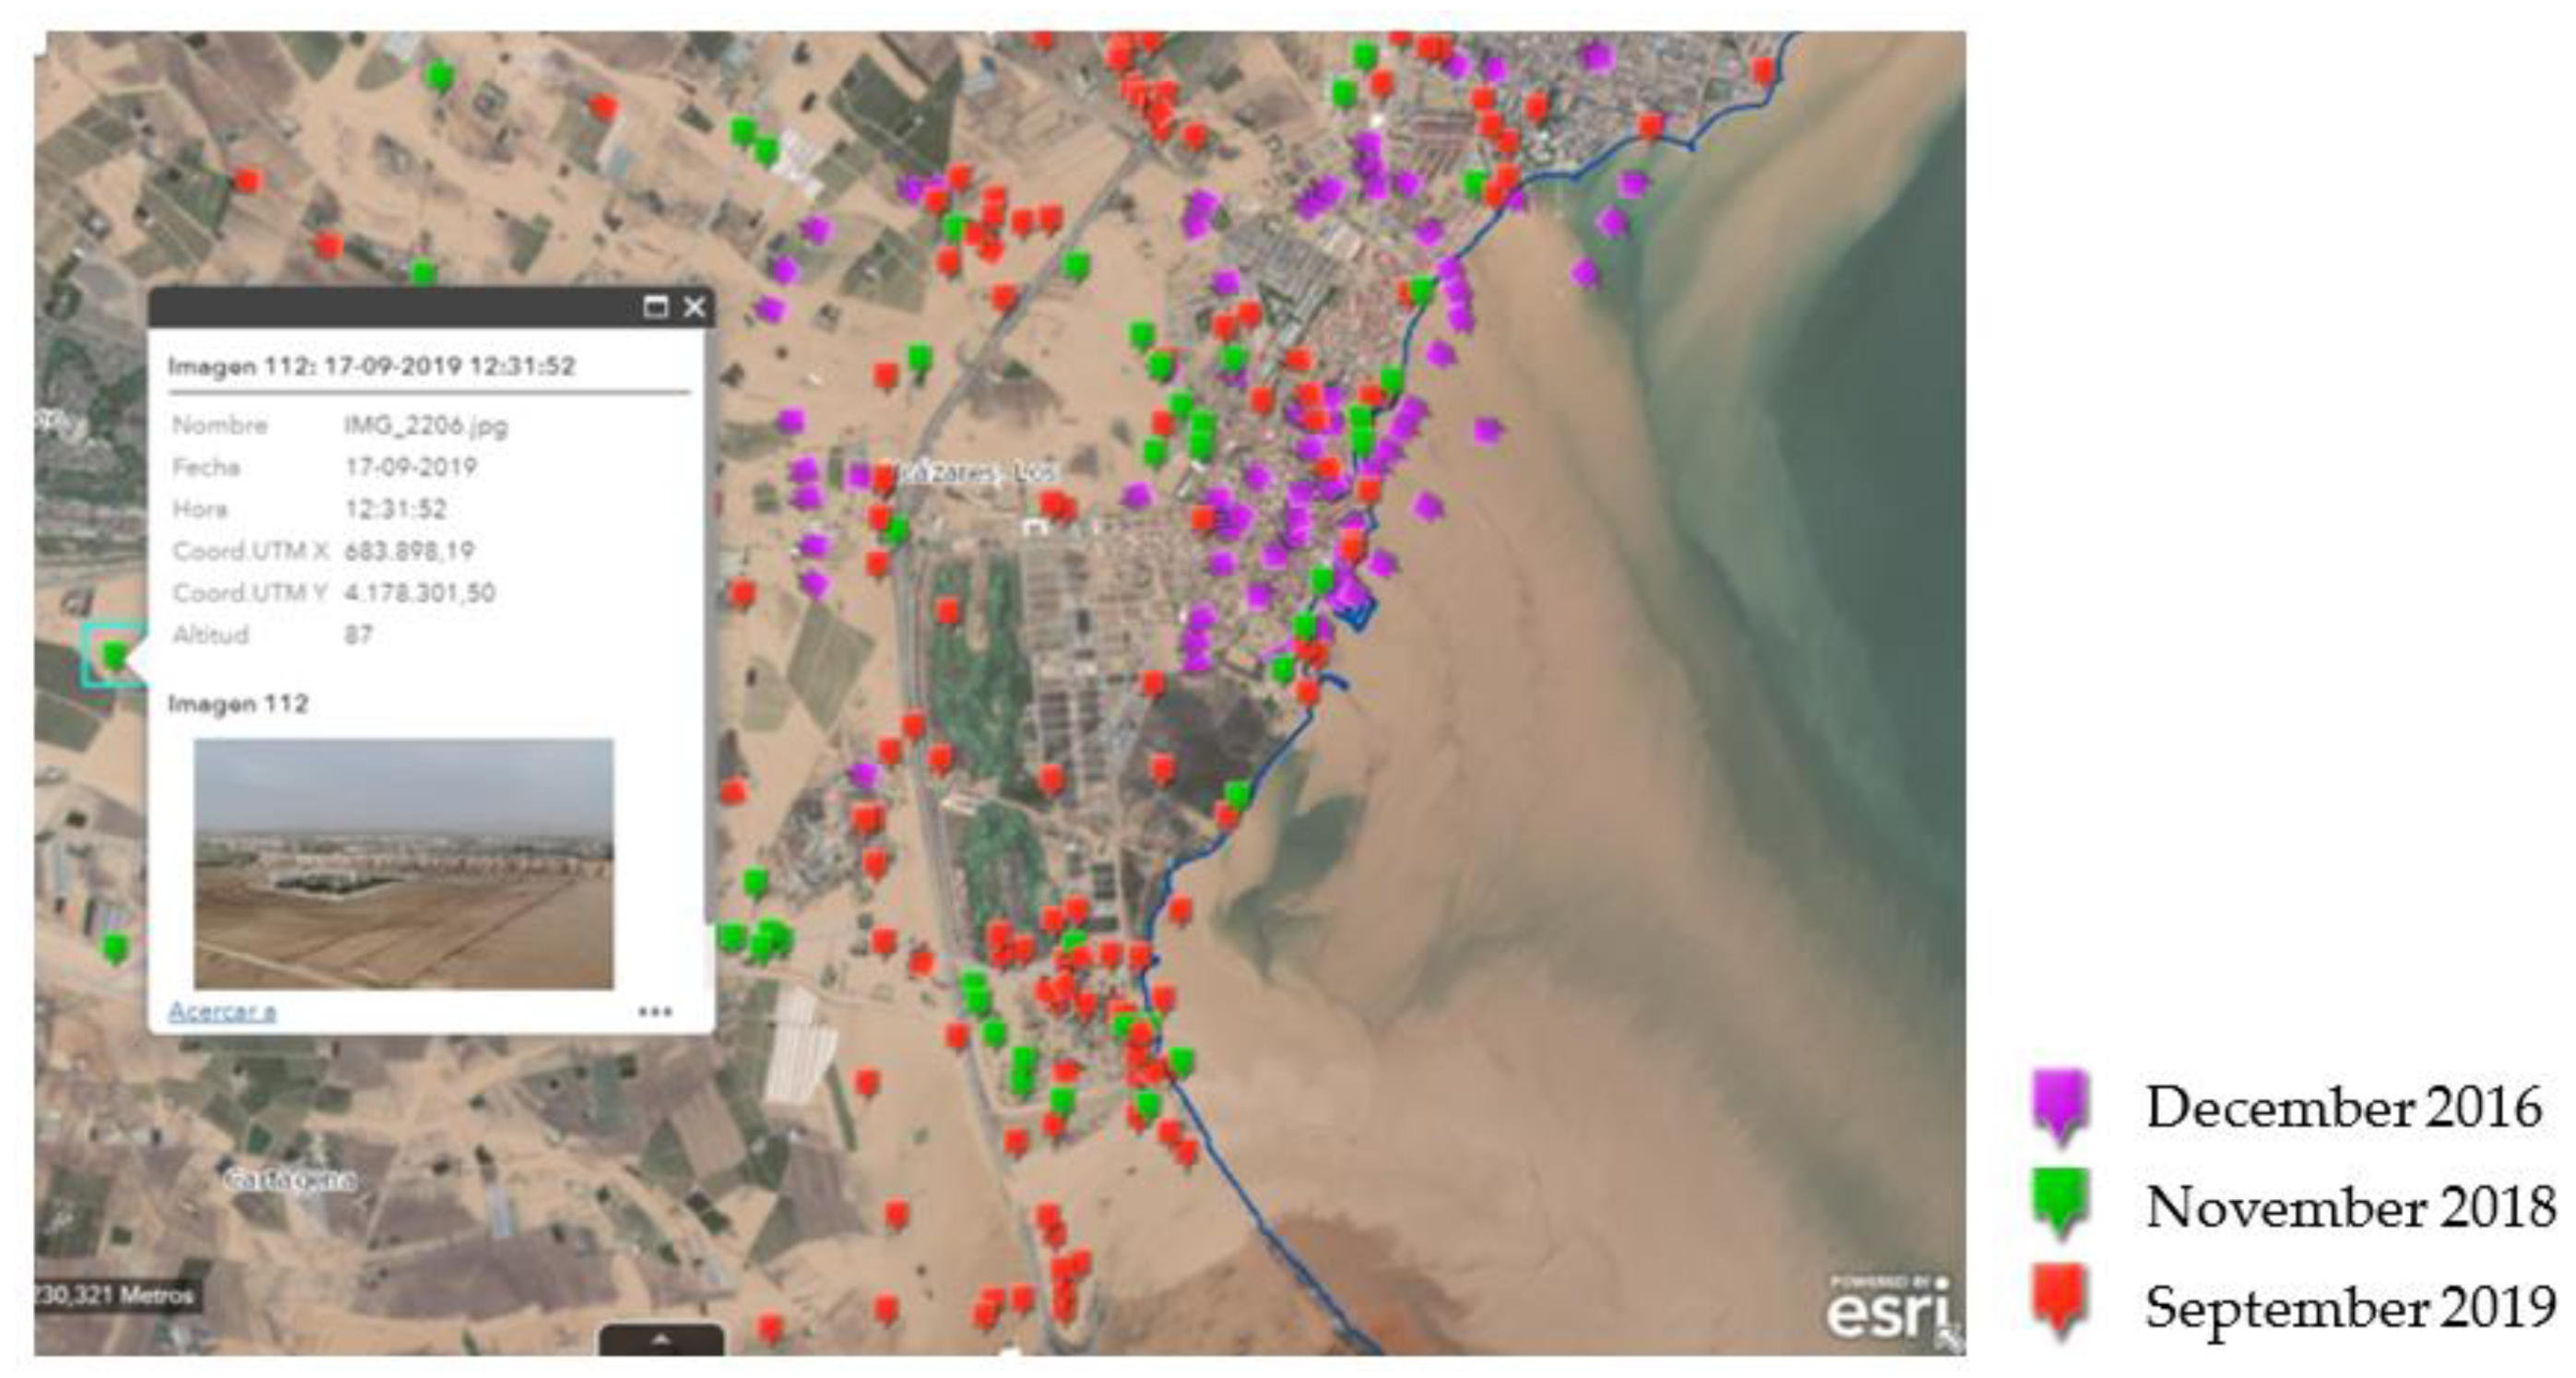
2.3.1. Spatial Damage Values Database
To analyze the spatial distribution of damage caused by DANAs, we created an index called the flood damage severity index (
). From the information provided by the emergency services from various local and regional administrations that are in charge of processing the damage files of those affected by the flooding events, we generated a spatial qualitative punctual database of damage (
Figure 6). These data were obtained on aggregate units such as tourist resorts, residential buildings, industrial estates, shopping centers, etc., in order to make georeferenced treatment possible whilst preserving the legal requirements of anonymity (technical details of the database configuration can be found in
Appendix A). To obtain a uniform sequence of discrete values, the alphanumeric data are classified into three categories based on the level of significance of the damage: minor, relevant, and catastrophic damage, following the criteria from
Table 1.
2.3.2. GIS Indicators of Anthropization
The phenomenon of anthropization is spatially evaluated using GIS indicators of territorial transformation. This spatial transformation generates subphenomena such as the “dam effect” and “soil sealing” or alterations in the orography of the land which, according to the bibliography consulted, may have important implications on the risk of flooding of a territory. By using historic GIS cartography, the evolution of various dimensionless indicators associated with these subphenomena is evaluated numerically over time. The indicators selected to evaluate the patterns of territorial transformation in the study area are detailed below:
Linear infrastructure density (
LID) index: Linear communication infrastructures are largely associated with the generation of “dam effects” during episodes of torrential rain that generate floods [
33,
34]. This index is calculated over time to show the importance of the impact produced by these infrastructures within the whole of the phenomenon of the anthropization of a territory. This dimensionless index evaluates the spatial presence of these infrastructures in each analysis spatial cell by taking the size and relevance of the linear infrastructure into consideration.
Li = length of existing linear infrastructures (m)
hi = weighting coefficient (highway = 1, normal road = 0.75, country road = 0.5)
Str = territorial surface in reference (m2)
Index of soil artificialization (
SA): The urbanization of the territory is, together with erosion, the main cause of the “sealing effect” of the soil [
35,
36]. This phenomenon notably reduces the soil’s ability to absorb rainwater. To analyze this phenomenon, the artificial transformation process of the territory is evaluated over the last decades by applying the CORINE Land Cover criteria [
37]. The indicator differentiates areas of low permeability (such as urban areas without green areas) from artificial areas with absorption capacity (such as golf resorts). This dimensionless index evaluates land artificial transformation in each analysis cell by taking the size of the linear infrastructure into consideration.
Ai = artificial surface area (m2)
hi = weighting coefficient (highly waterproof artificial surface = 1, medium waterproof artificial surface = 0.75, low waterproof artificial surface = 0.5)
Str = territorial surface in reference (m2)
Index of alteration of the terrain orography (
ATO): The transformations in the orography of the land are also a parameter strongly implicated in the flood risks of the territory [
38]. Apart from the cases mentioned in the two previous phenomena (infrastructural and building construction works), agricultural activity is the most common and relevant cause, in terms of the affected surface area, of these land alterations. In this section, aggressive transformations such as the replacement of trees or herbaceous crops by fruit and vegetable crops are differentiated from intermediate actions, such as relevant pending changes or elimination of the terraced structures of the crops, and minor ones, such as simple changes in the crop direction or land use without three-dimensional alteration of its orography.
Ai = orographically altered surface (m2)
hi = weighting coefficient (relevant orographic alterations = 1, intermediate alterations = 0.75, simple land use change = 0.5)
Str = territorial surface in reference (m2)
2.4. Computation of Indicators
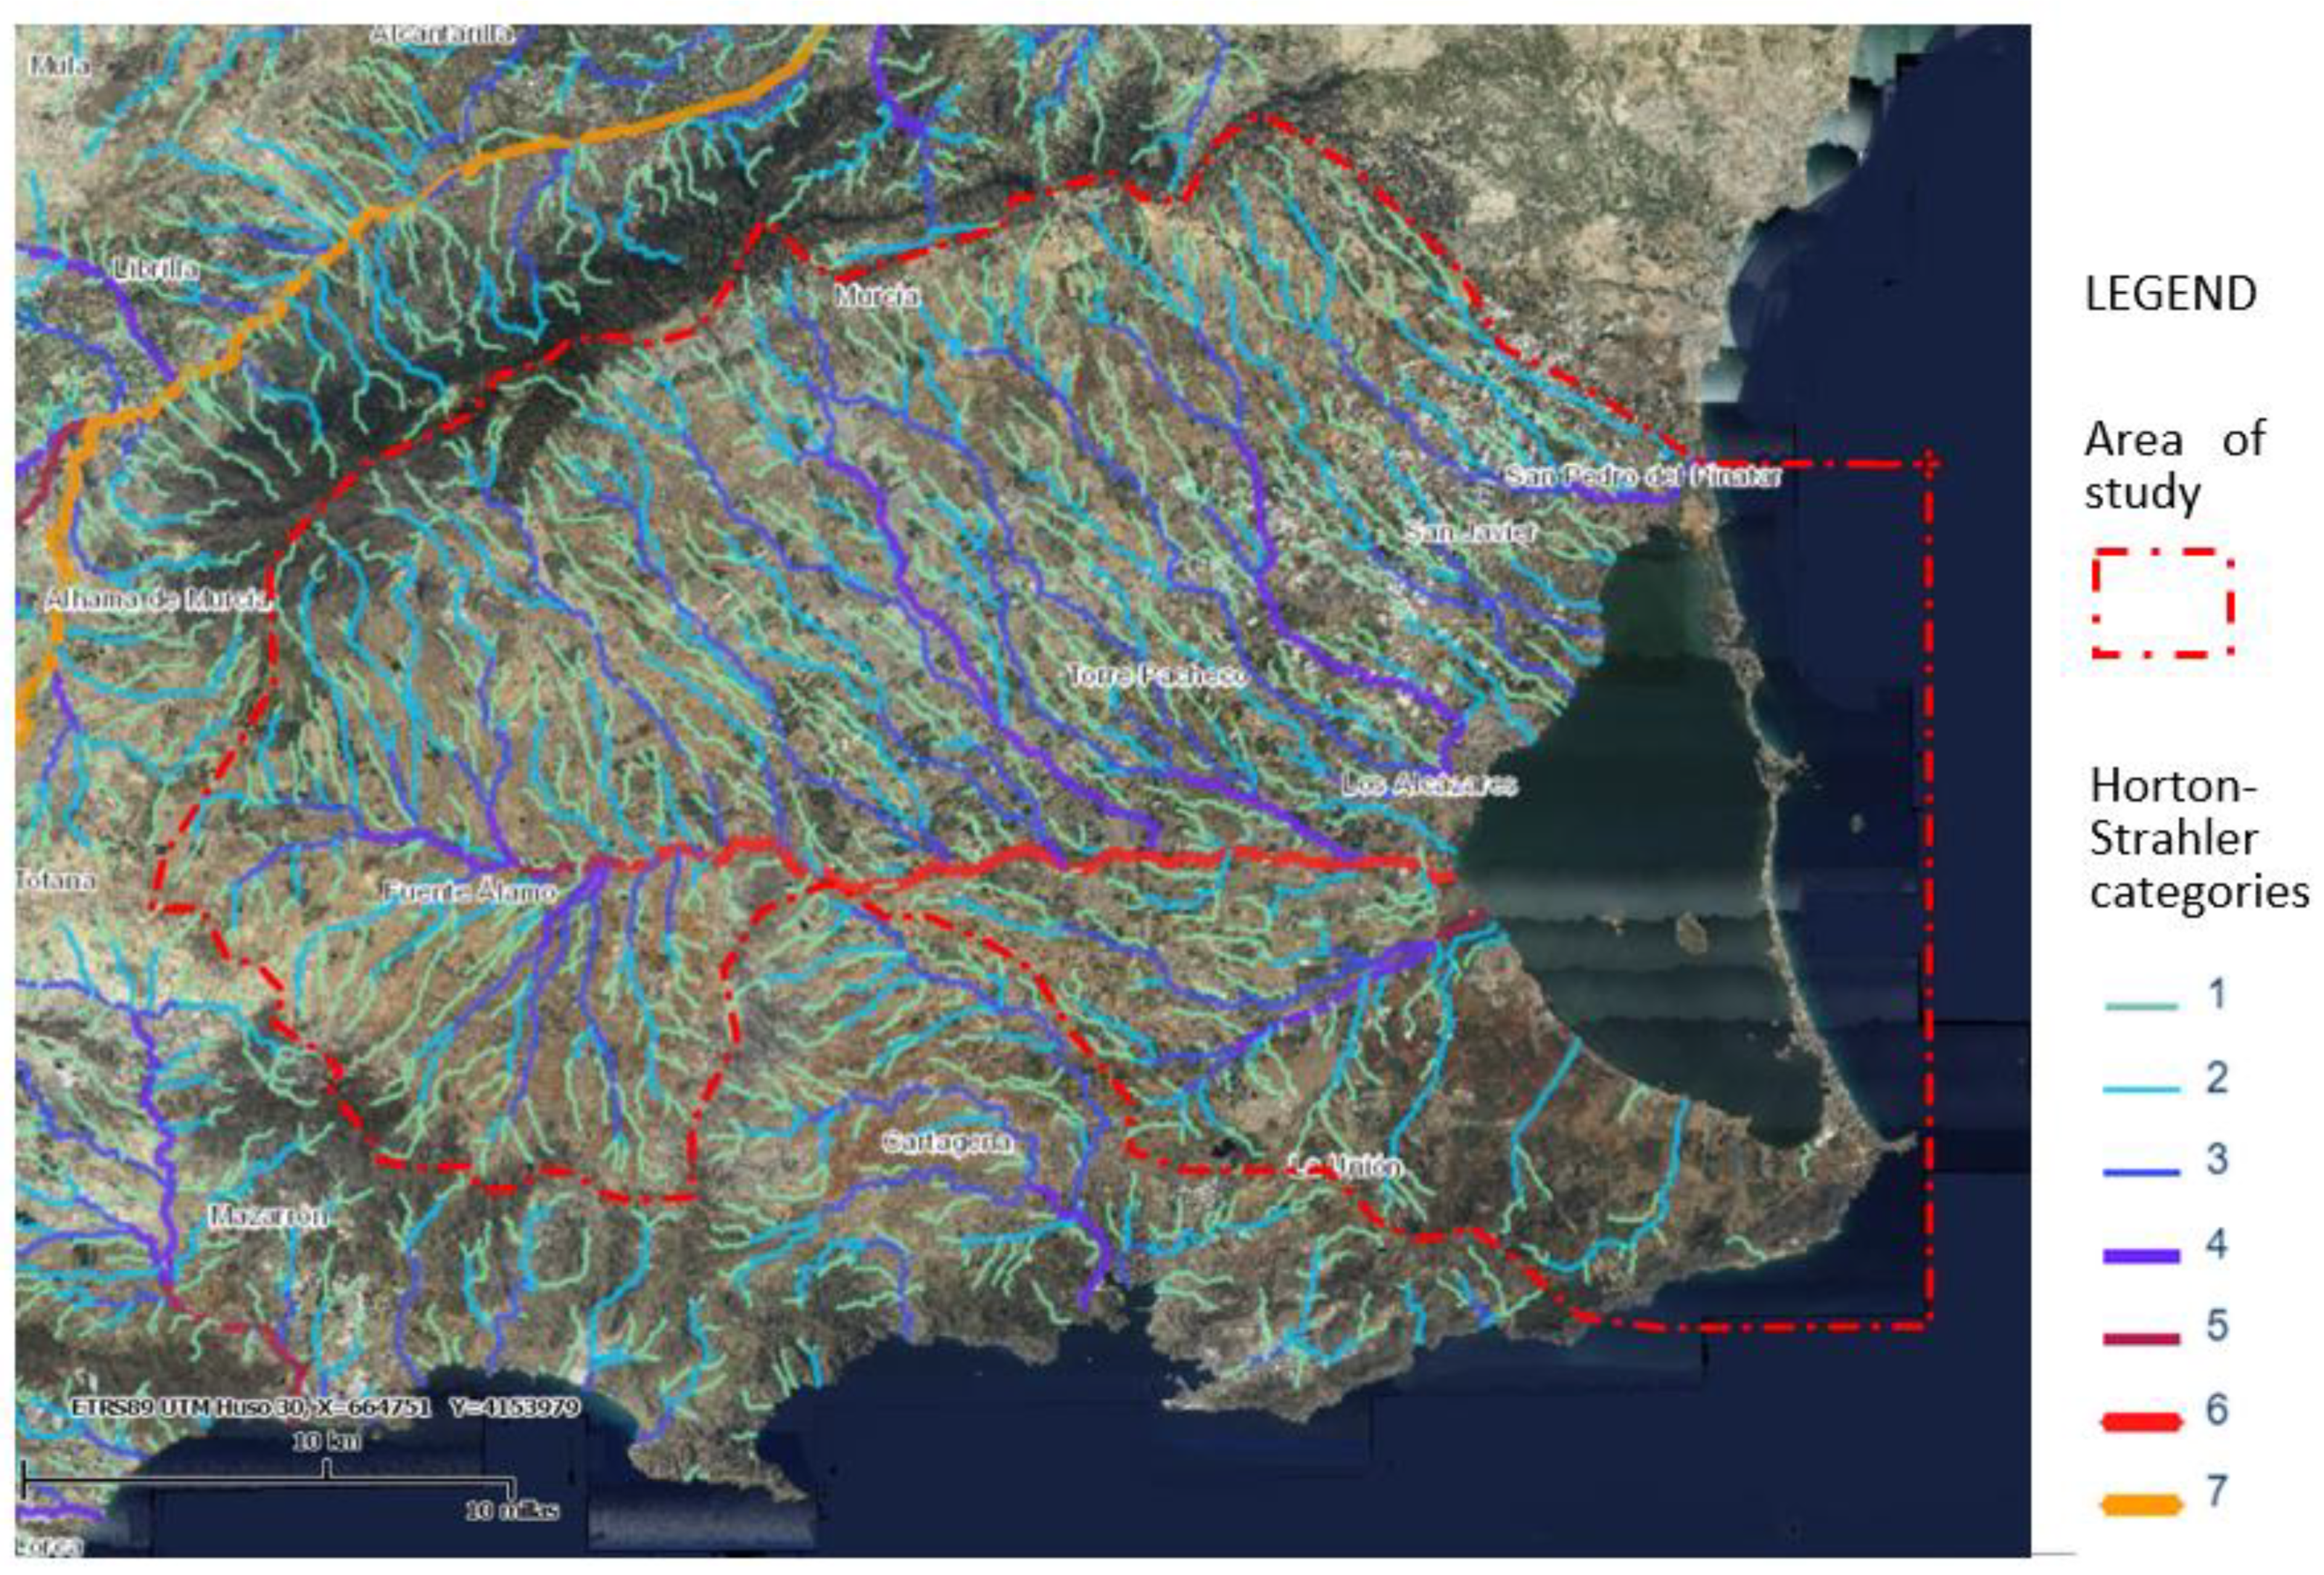
First, to determine the exact scope of the analysis, the current configuration at the official level of the structure of natural channels in the area was taken into account. Unregulated channels with a level greater than 3 according to the Horton–Strahler criteria [
39] were selected, in order to generate a representative model of the current hydromorphometric situation of the theoretical natural hydrographic network in the Campo de Cartagena area (
Figure 7).
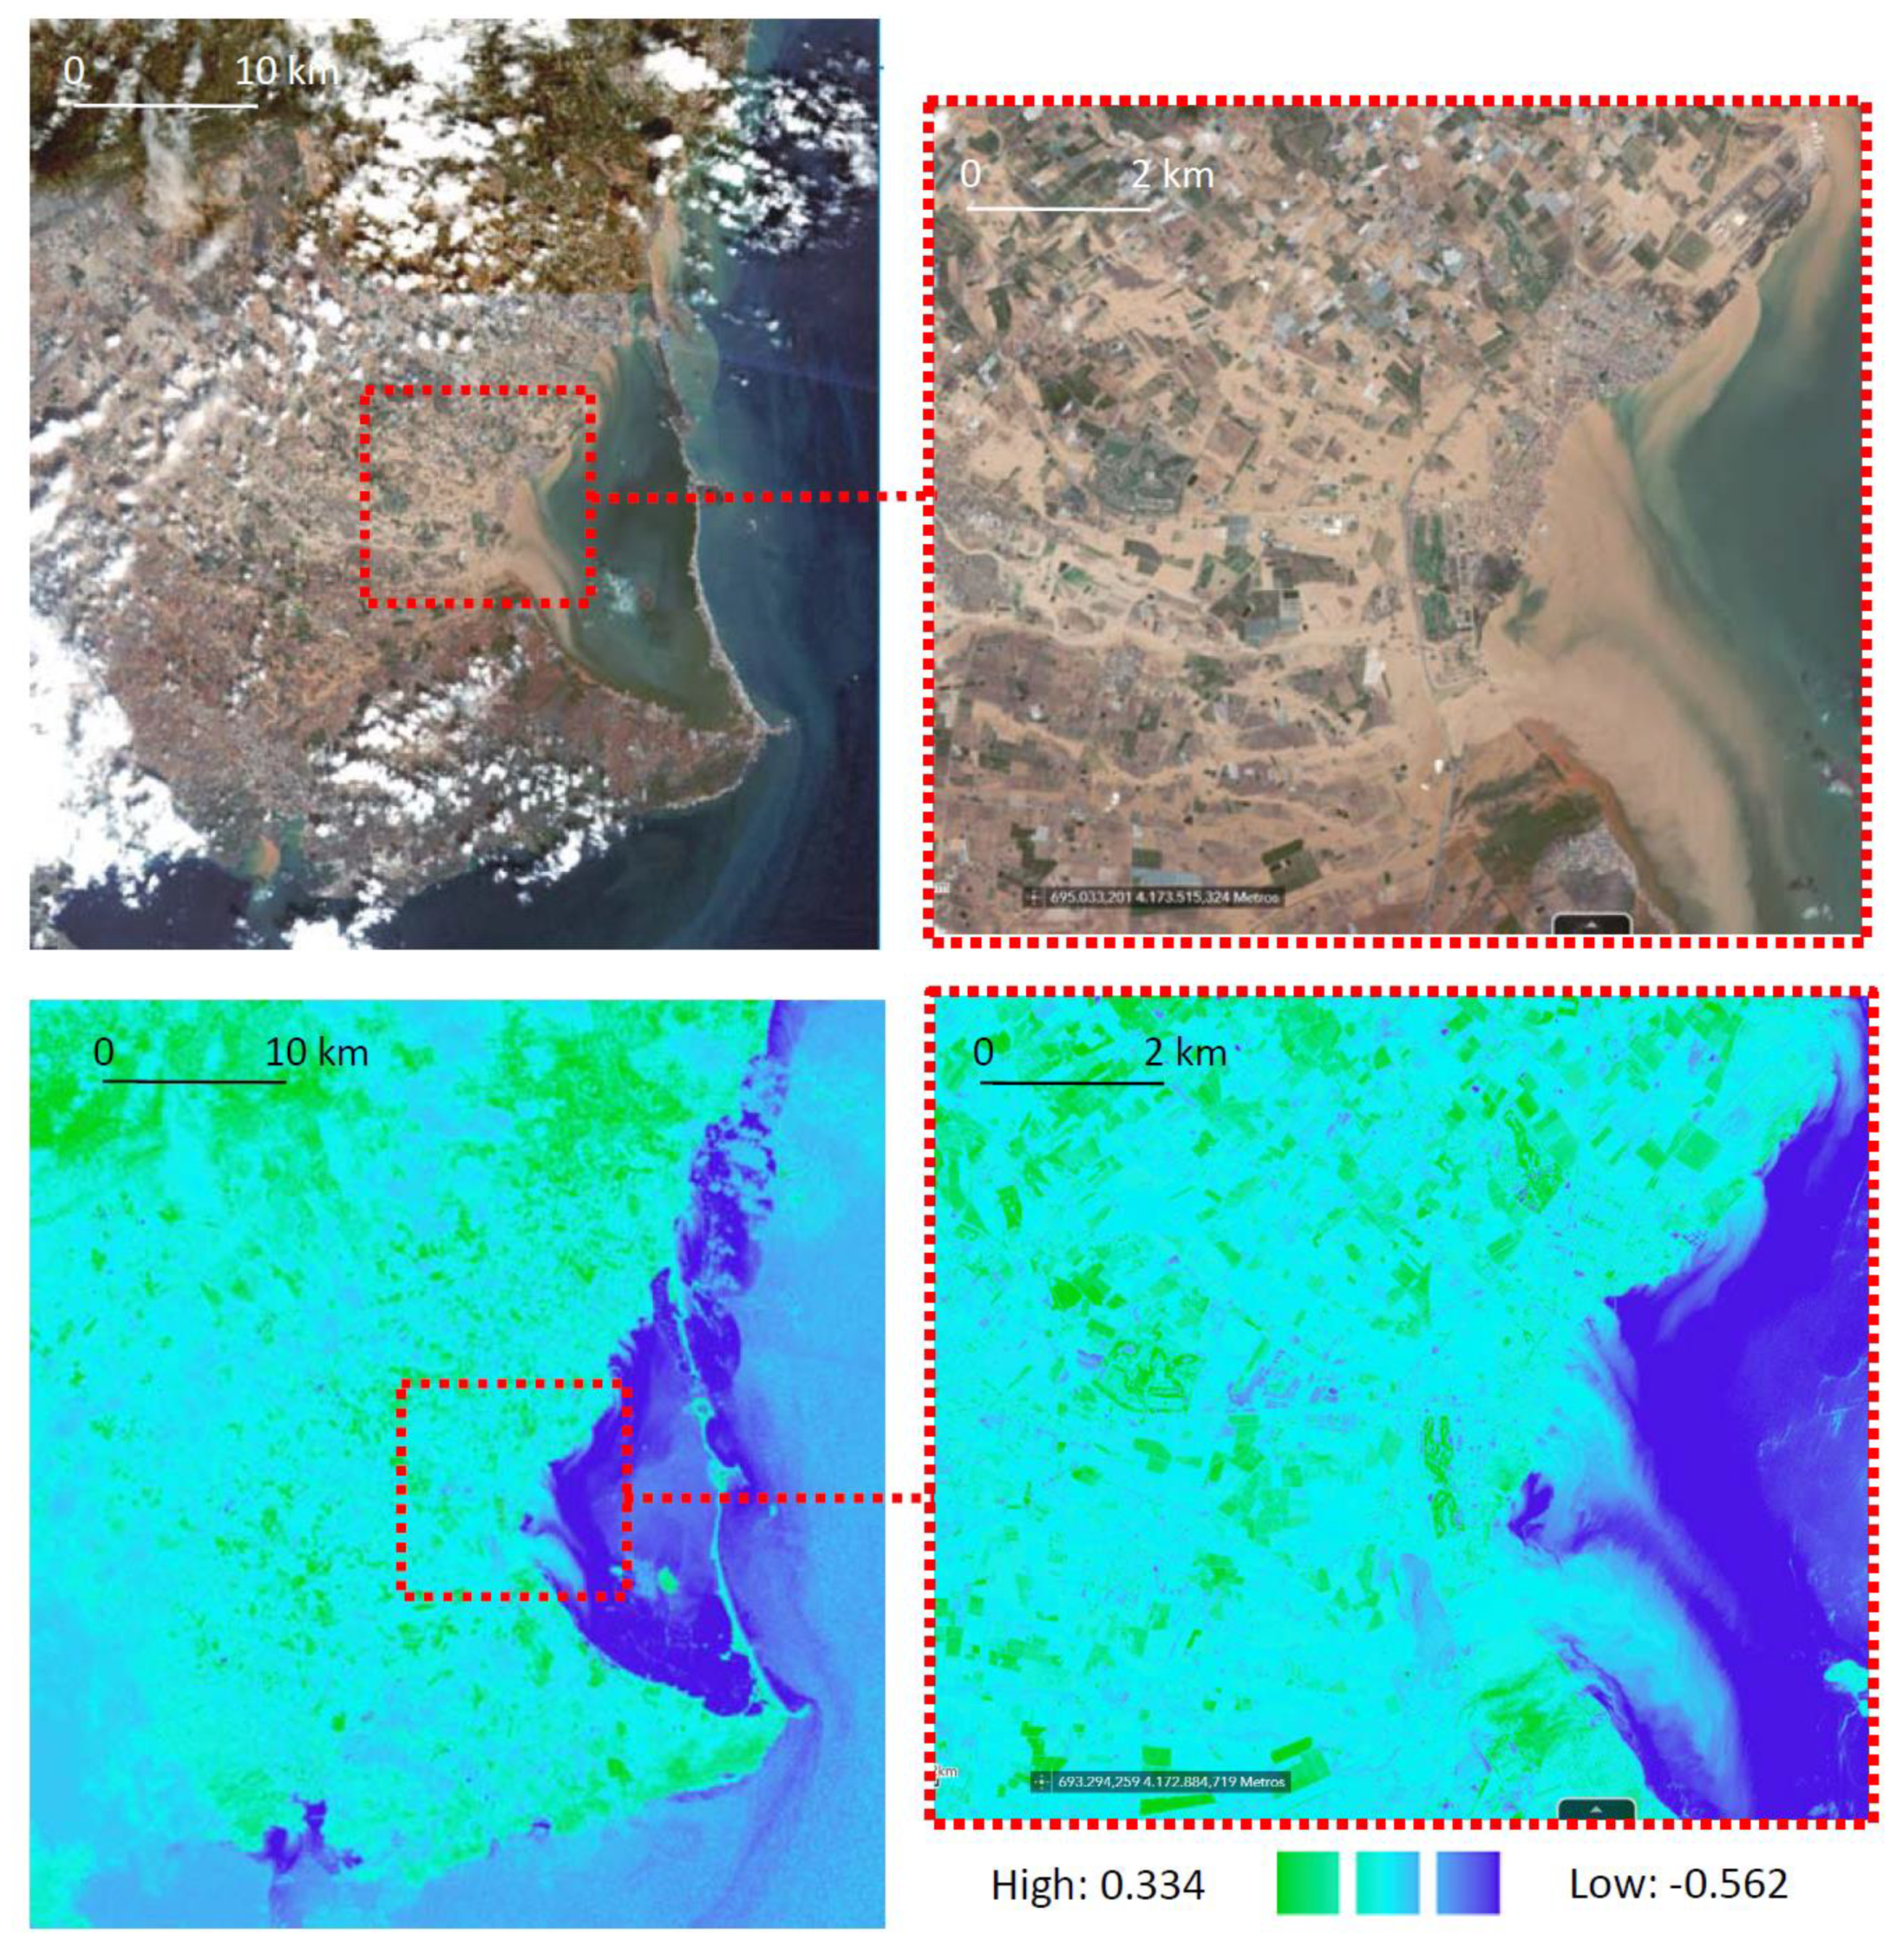
To contrast the distribution of the real floodplain produced by the latest DANA in comparison to the situation expected by the current theoretical models of the regulations, an
NDVI analysis was carried out to identify the changes in land cover during the DANA days. The Normalized Difference Vegetation Index (
NDVI) is a land cover analysis index used to estimate the quantity, quality, and development of vegetation based on the measurement of the radiation intensity of certain bands of the electromagnetic spectrum that vegetation emits or reflects. For the calculation of this vegetation index, the information found in the red and infrared bands of this electromagnetic spectrum was used. The calculation of the
NDVI was done using the following formula:
where
Red and
NIR stand for the spectral reflectance measurements acquired in the red (visible) and near-infrared regions, respectively. This method allows us to identify all the areas in which the rains have produced a flood plate on the surface of the basin regardless of whether or not damage has occurred in an area. In this way, the areas subject to runoff because of the rains were identified. The data were obtained through the Sentinel 2A and 2B satellites with an accuracy level of 10 m for the days in which the DANAs of the years 2016, 2018, and 2019 occurred.
Then, the GIS analysis was undertaken using a constructed 5 m
2 digital elevation model (DEM) of the Campo de Cartagena area to assess the statistical correlation between the anthropizing process of the territory from the case study and the increase in its vulnerability to flooding. Laser imaging detection and ranging (LiDAR) tools from the IMIDA LiDAR SDI [
32] are used to implement relevant elements such as urban areas, wadi orography, and the slopes of the agricultural crops in the DEM (
Figure 8).
Once the distributions at the spatial level of the flooding impact and territorial anthropization indices were generated, we evaluated the possible spatial correlation between them using geostatistical tools. For this, the territory needs to be “discretized” as a continuous element in 100 × 100 meter cells in order to numerically evaluate the spatial correlation between indicators with specific values on a continuous space. These cells were assigned values according to the results obtained in the
NDVI analysis and the GIS cartography database for the damage of the DANAs. On the other hand, anthropic values were obtained for the indicators of territorial transformation of historical GIS cartography for the years 1956, 1981, and 2016. The cartography detailed data are summarized in
Table 2.
2.5. Geostatistical Analysis
This analysis enables us to assess the extent to which the transformations made by human activity in the scope of action selected for the territory have influenced the current vulnerability to flooding. The spatial relationships were parameterized and assessed through the use of global Moran’s
I [
40] and Anselin Local Moran’s
I [
41] bivariate statistics; both are geoprocessing tools from GvSIG desktop 2.5.1 (AGS, Madrid, Spain) and ArcGIS 10.8 (Esri, Sacramento, CA, USA).
Bivariate global spatial autocorrelation allows us to assess the statistical correlation of a set of geolocated data obtained spatially and whether the autocorrelation is positive or negative. The bivariate global Moran’s
I statistic formula is given as
(9):
where
is the deviation of an attribute for feature
from its mean
,
is the spatial weight between feature
and
,
is equal to the total number of features, and
is the aggregate of all the spatial weights of (10):
The
-score for the statistic is computed as in (11):
where
and
can be calculated as follows:
The global spatial GIS autocorrelation returns the three following values: the Moran’s I Index, the z-score, and the p-value. Given a series of spatial distribution features and an associated attribute, the bivariate Global Moran’s I statistic indicates whether the pattern expressed is clustered, dispersed, or random and also its degree of statistical correlation with some kind of phenomena. When the z-score or p-value indicates a statistical significance, a positive Moran’s I index value indicates a trend toward clustering, while a negative Moran’s I index value indicates a trend toward dispersion. The z-score and p-value are measures of statistical significance that inform us whether or not to reject the null hypothesis. For this analysis, the null hypothesis states that the values associated with features do not have any statistical correlation.
From this information, we are able to develop, in a geolocated way, the hot and cold points in the mapping through the local indicators of spatial association (LISA) from Anselin [
41]. Each Anselin Local Moran’s
I statistic of spatial association
is given as:
where
is an attribute for feature
,
is the mean of the corresponding attribute,
is the spatial weight between feature
and
, and
is defined as follows:
with
n equating to the total number of features. The
-score for the statistic is computed as:
where
and
can be calculated as follows:
For this analysis, the null hypothesis states that the correlation values of two elements are randomly distributed. Thus, the higher (or lower) the z-score is, the stronger the intensity of the clustering of these values. A z-score near zero indicates no apparent clustering within the study area. A positive z-score indicates clustering of high values, whilst a negative z-score indicates clustering of low values. This numerical evaluation in implemented through GIS mapping of the study area of the watershed to distinguish configuration patterns of high–high clusters (high levels of anthropization associated with high levels of flooding damage), low–low clusters (low levels of anthropization associated with low levels of flooding damage), and spatial outliers, as in either high–low (high levels of anthropization associated with low levels of damage) or low–high (low levels of impact associated with high levels of damage).
Therefore, the bivariate statistical correlation analysis between the distribution of different GIS indicators helps us to spatially understand the extent to which the consequences of human anthropization affect the flooding vulnerability of this territory, as well as its patterns of behavior.
3. Results
Applying the methodological process described in the previous section, the following results are obtained.
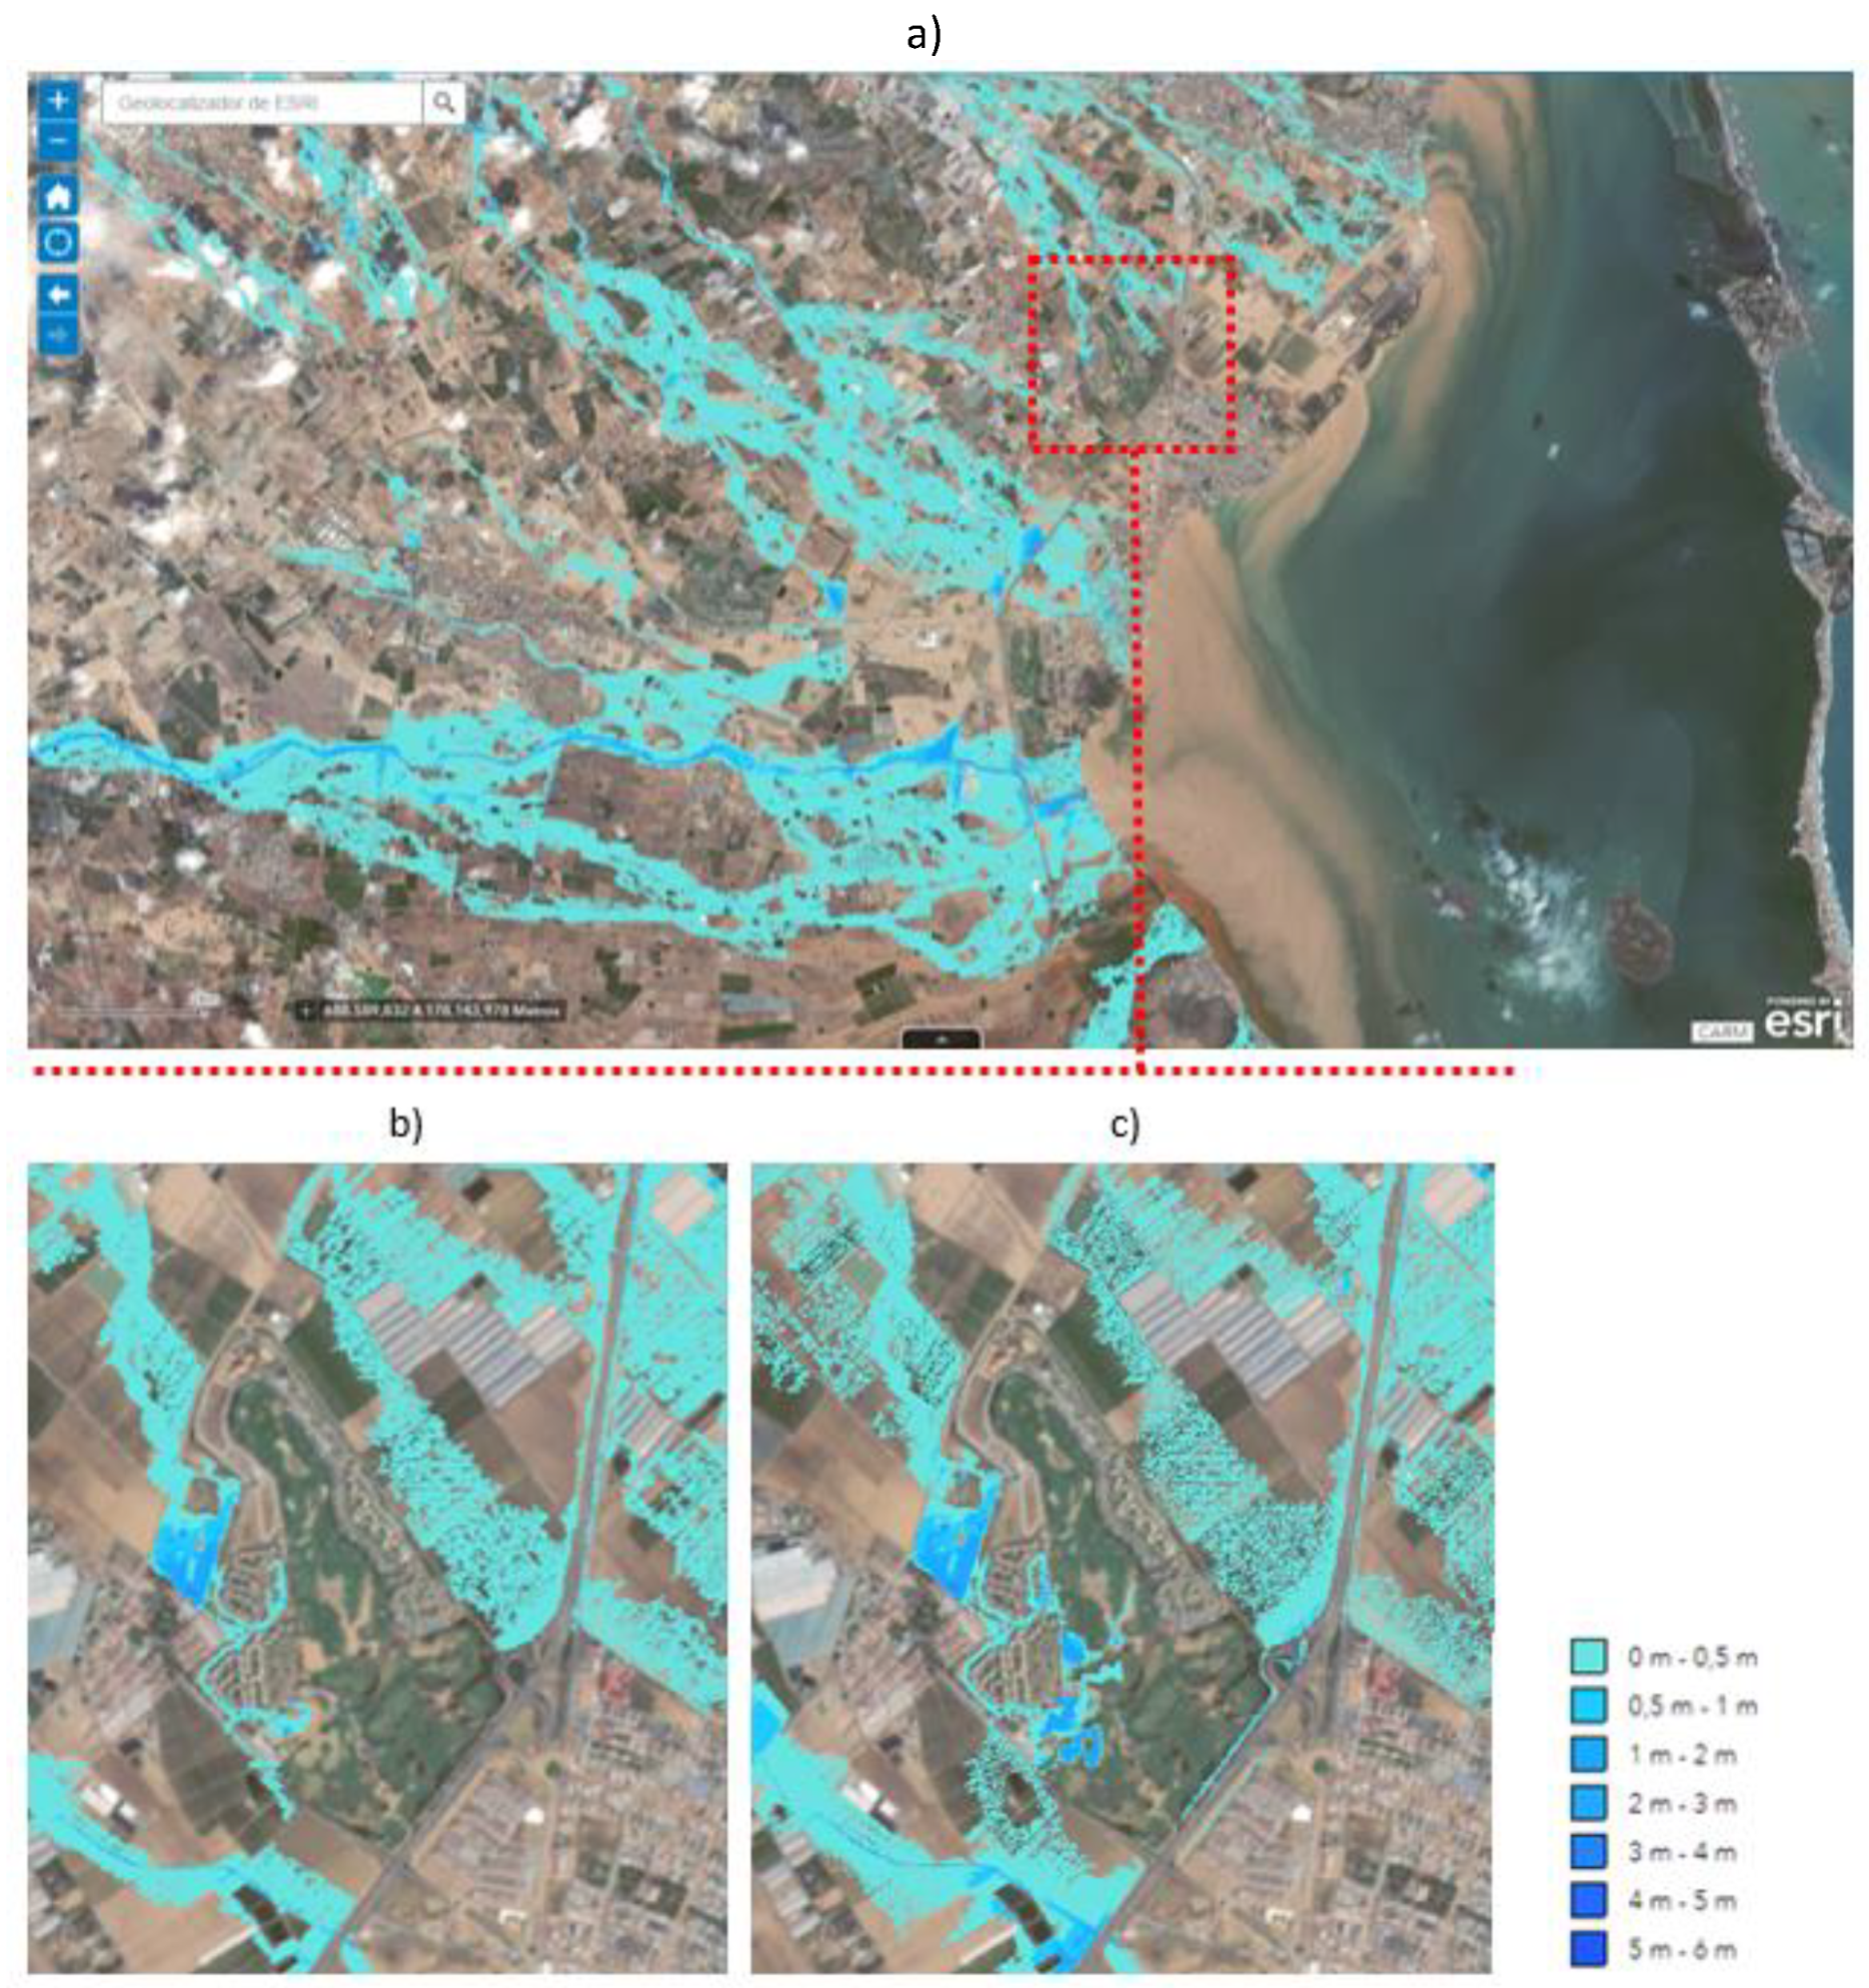
3.1. NDVI and Autocorrelation Analysis of Flooding Patterns
We first performed a
NDVI analysis of the DANA days in 2016, 2018, and 2019 (
Figure 9). The obtained spatial floodplain was then visually compared with the theoretical watershed model established by the criterion used in official flooding regulations in order to evaluate the extent to which the behavior of the theoretical watershed corresponds to the real situation of the watershed observed in the last DANAs (
Table 3). The level of autocorrelation of the spatial distribution of the effects of the last rains was measured. The values obtained from this analysis, evaluated through the global Moran’s I statistic, allow for the verification of whether the phenomenon of flooding in the study area follows significant behavior patterns (
Table 4). This ensures that it is not a random phenomenon at the statistical-spatial level.
The values obtained in the spatial distribution of the NDVI analysis clearly show two issues. The first one is that the spatial distribution of the phenomenon has a significant statistical autocorrelation level. The level of clustering of the three DANAs analyzed shows a pattern of behavior that identifies a clearly nonrandom phenomenon. It is therefore an issue that requires detailed study in order for us to understand its behavior, whose physical derivatives can be parameterized using GIS spatial patterns.
The second issue is that there is an important spatial discrepancy between the flow network observed through the
NDVI analysis in these DANAs and the expected theoretical flow network. The theoretical results of the Horton–Strahler suggest a strong downward divergence from the actual results observed in this watershed if we assimilate them to the return periods for the available statistical series assigned to the rainfall observed in the three DANAs studied (
Figure 10). As can be seen, the current existing theoretical model, based on the data provided by the competent administrations in the area, clearly underestimates the effects of the floodplain, even for very high return periods (T = 500 years).
The territorial transformation of an anthropic nature in the region therefore plays a relevant role in this mismatch between reality and the theoretical models. However, the phenomenon of territorial anthropization is a very wide and heterogeneous concept. Therefore, we explore which of its main guiding parameters at a spatial level present a higher level of statistical correlation with the existence of damage derived from the DANAs.
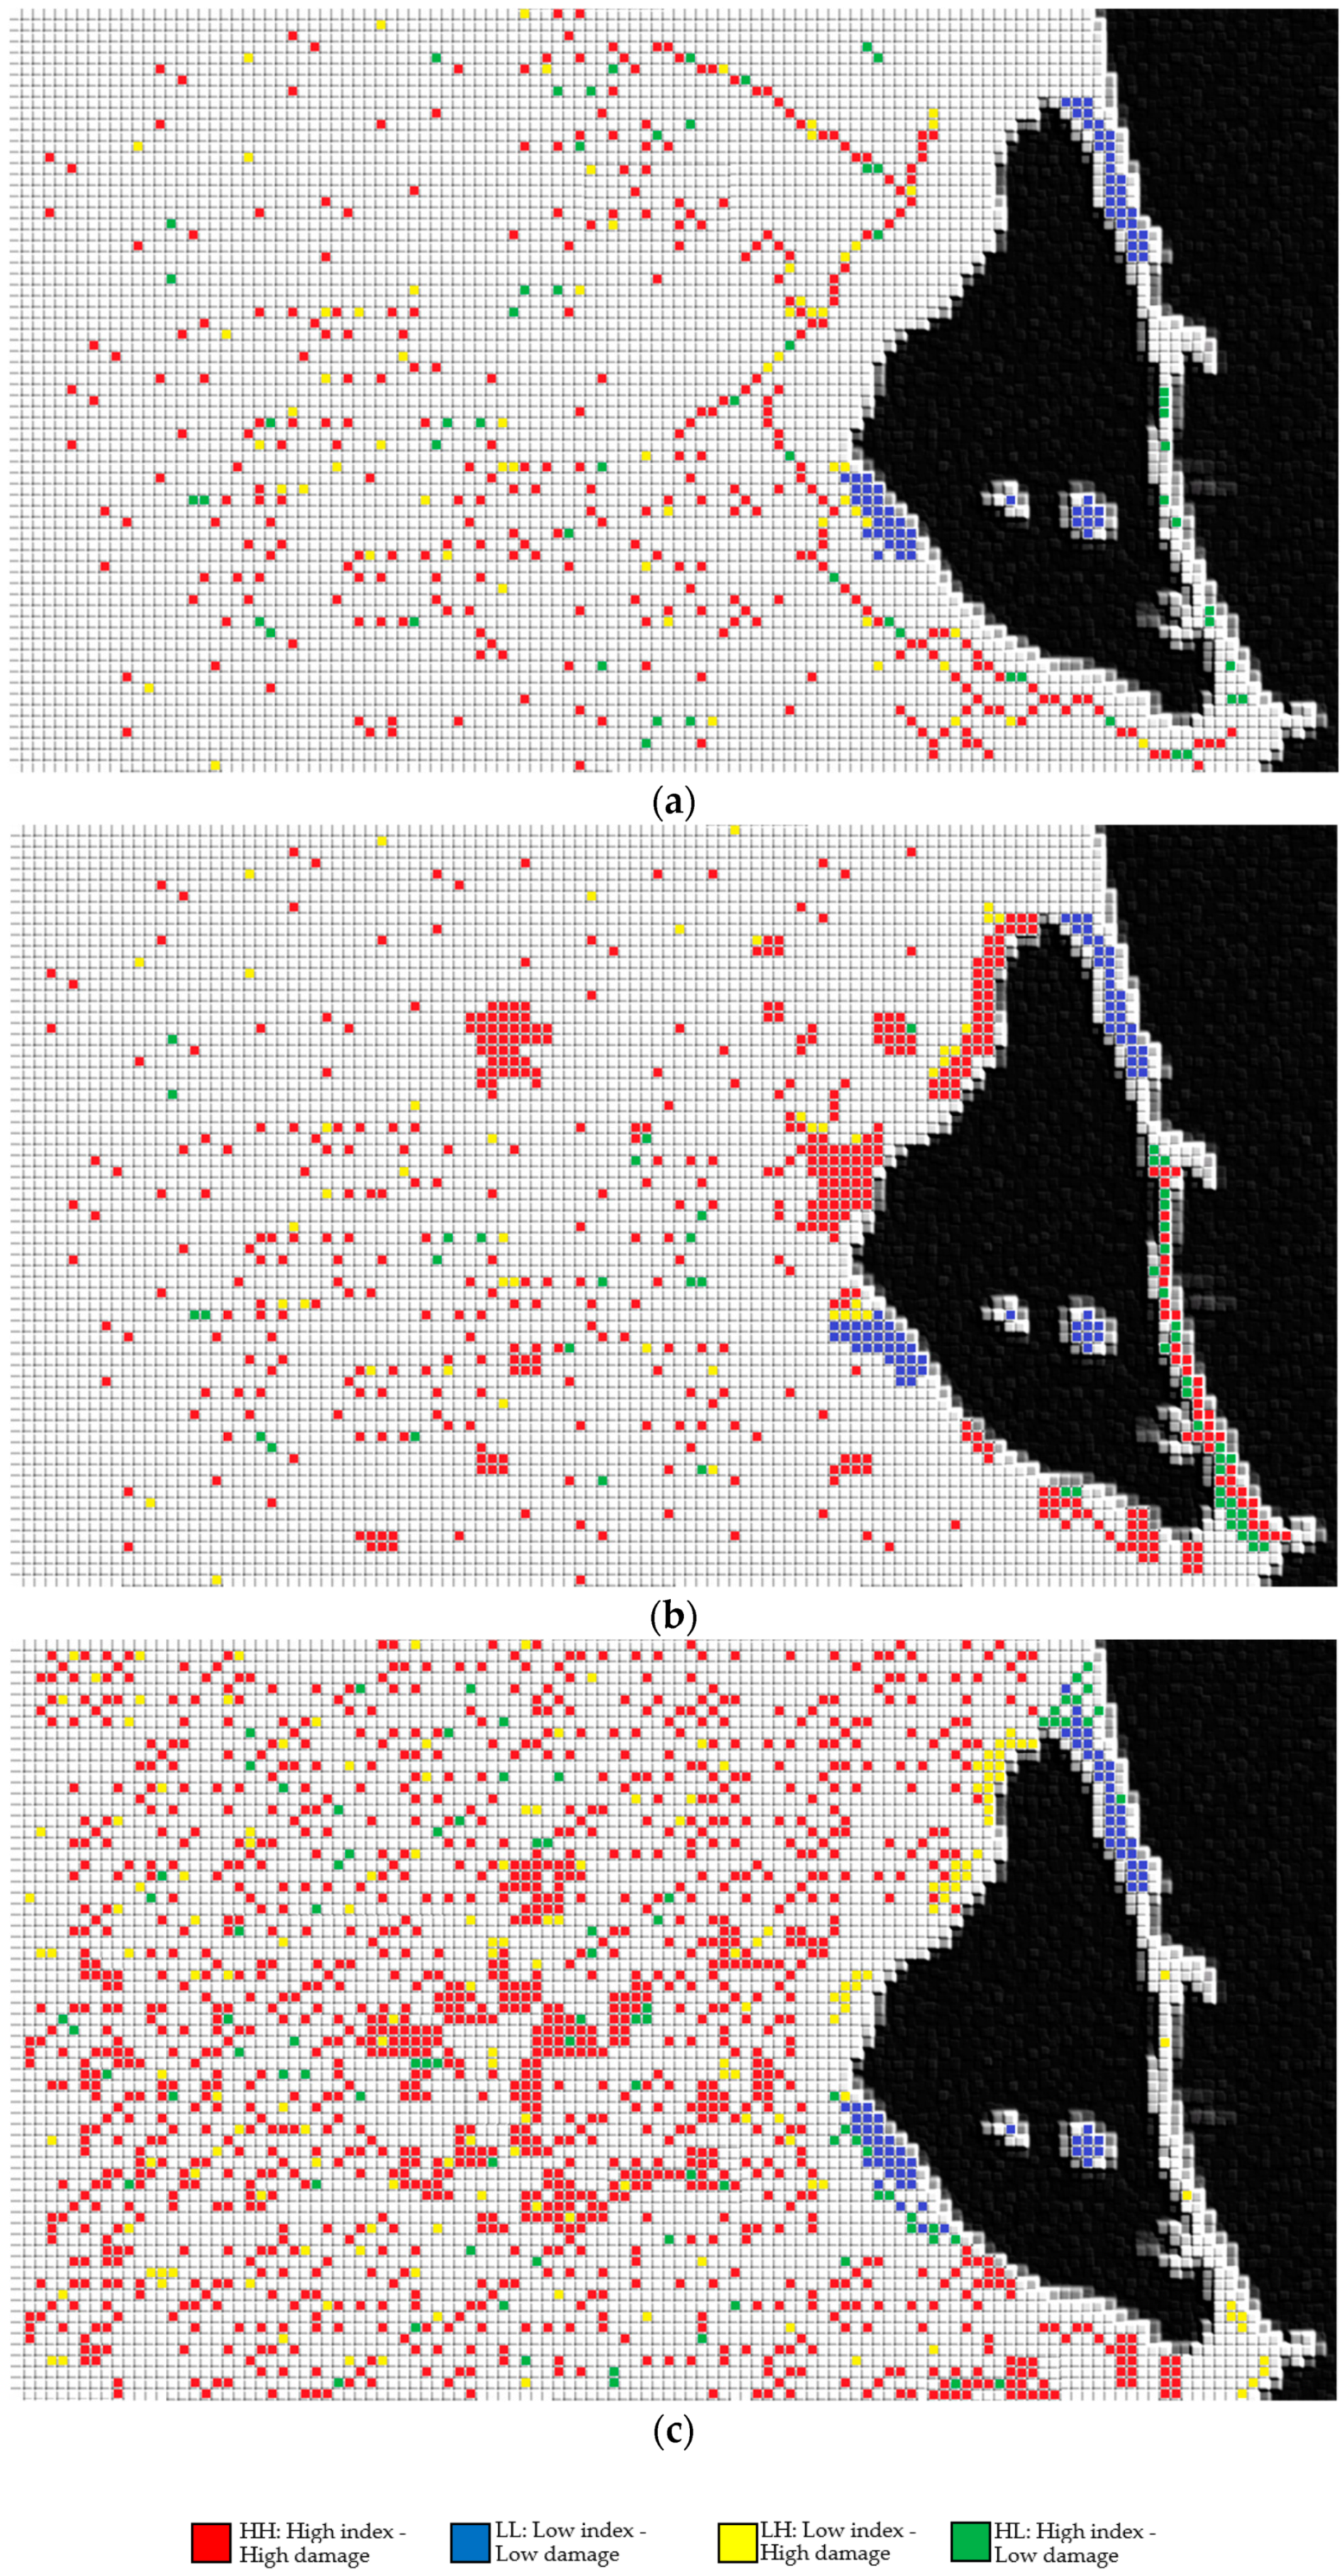
3.2. LISA and Hot-Spot Analysis
Once the existence of geostatistical patterns in the spatial distribution of the phenomenon had been verified, the level of numerical correlation between the different indicators of territorial anthropization and the spatial distribution of the damages derived from the latest DANA was studied. This evaluation was carried out by taking into account an evolutionary approach in the 1956–2016 timeframe to analyze the incidence of each of the indicators of territorial transformation in the global anthropization process. Subsequently, the level of statistical correlation of each of those anthropic subphenomena with the damage caused by floods was assessed. For this second analysis, we used the LISA statistic and a bivariate evaluation of hot and cold spots.
The analysis of bivariate spatial statistical correlation between the damage index
and the territorial anthropization indices is shown in
Table 5. As can be seen, the three anthropization indicators show a positive correlation with the damage indicator, with higher values being observed for the cases of agricultural and urban land transformations than for the execution of infrastructures.
When we delved deeper into the previous spatial analysis through an ordinary least squares (OLS) regression model of the relationship between the three levels of damage established and the three anthropization indicators, we obtained the results shown in
Table 6.
Finally, if we parameterize the values obtained to the numerical level in a two-dimensional LISA analysis of hot and cold spots from a spatial perspective, we can observe the clearly differentiated areas in the watershed, as shown in
Figure 11. The spatial values were discretized through a tessellation geoprocess with 100 × 100 m cells to facilitate the understanding of the HL large-scale territorial behavior patterns of the phenomenon (the value of a tile is assigned if an HL combination occupies more than 50% of its surface; in case none of the possible combinations exceeds 50%, no value is assigned).
If the density of points is observed, it can be verified that the phenomenon of territorial anthropization that generates a greater link with the damages of the DANA is the territorial transformation associated with the alteration of the orography or land use. The one that generates the least association of damages from floods is the transformation derived from the creation of transport infrastructures. On the other hand, it can be verified that in the three cases, the areas with a positive correlation (i.e., low level of damage correlating to low level of territorial transformation) mostly coincide, being located in areas such as natural parks or protected areas belonging to the Natura 2000 Network.
Regarding the behavior patterns of the geostatistical damage-indicator correlation, we observed three clearly differentiated patterns. In the first case, transport infrastructures in many cases present a certain linear pattern at the spatial level, which overlaps on many occasions with the proximity to some major highways. This denotes the existence of a certain dam effect in some areas. However, what is more complex to understand is the dispersed distribution in other areas, which is possibly a consequence of joint action with other variables from other indicators.
In the case of the so-called process of “artificialization” of the soil, we see how the highest level of geostatistical correlation between damages and territorial transformations tends to be concentrated in three urban settlements where the urban areas have undergone significant growth in recent decades. This more concentrated behavior pattern is likely related to the phenomenon of soil sealing, making areas vulnerable that were not previously vulnerable to flooding.
Finally, the distribution of the correlation of damages associated with the transformations from alterations of uses and the orography of the soil presents a very dispersed character. As indicated above, although it has the highest level of density—which confirms its importance in the global phenomenon—and some clustering points can be found, it is difficult to establish a clear pattern of behavior. Therefore, it is necessary to carry out a more detailed analysis through the use of subindices to better understand the phenomenon.
4. Discussion
The results show, at a general level, a new methodological option that may constitute an interesting alternative in the study of the risk of flooding. The analysis of the relationship between the anthropization of the territory and the increase in vulnerability to flooding is an unusual approach in the study of flood risk, which frequently tends to focus its evaluation mainly on hydrological variables rather than territorial ones.
The incorporation of flood risk into territorial management and urban planning regulations is a rather recent issue in most societies, even in developed countries. In the case of Europe, the authorities from member countries have been obliged by the European Directive 2007/60/CE [
43] since 2007 to prepare flood hazard maps and flood risk maps for the development of flood risk management plans. In most countries, such as Spain, this directive has been transposed into national regulations through models based mainly on hydrological analysis. These models, although they reproduce the orographic variables in a reliable way and provide very valuable information to planners and decision makers, may be insufficient in territories that are highly anthropized or have strong inertia of territorial diffuse anthropization, as in this case.
The framework presented here supposes an advance from the methodological point of view in this field of research. There are obviously certain limitations, such as the need to have extensive territorial georeferenced information both at a spatial and temporal level, which is not always available. Nevertheless, it can offer a very interesting alternative for a diagnosis in areas in which there are no clear solutions for channeling or generating clear regulated flooding flows.
Furthermore, this approach is more consistent from the point of view of sustainable development. It should be noted that in terms of flood-risk planning, there is generally a strong engineering tendency to try to establish corrective measures instead of placing more emphasis on accurately determining the origins of the problem. This means that sometimes the solutions that make it possible to alleviate the existing problems are established, but the growth trend of the issues that originate in these troubles stays inadequately controlled [
26].
At the specific level, the results obtained for this case study clarify issues that until now had remained unclear, but at the same time they raise new questions and debate. On one hand, we have the meteorological phenomenon of DANAs in coastal Mediterranean areas which, as indicated by various authors [
19], are increasing in frequency and intensity as a result of climate change. This issue, although belonging to another scientific discipline (meteorology), forces us to pay more attention to this problem from the point of view of territorial planning, since its effects on the territory will also be increasing [
38].
On the other hand, we have the question of how human activity influences the effects that these incremental DANAs will have on the territory. The consequences and damage observed in the last three DANAs, whose precipitation did not exceed the 100-year return period in the historical series (which in itself forces a rethink on the validity of these statistical series as a result of climate change), have even exceeded, in some cases, the flood effects expected by the administrations for situations close to 500 years of return period in this area. Therefore, the increased damage caused by these meteorological phenomena is partly explained by their increasing frequency and intensity, albeit not completely. As shown by the low levels of spatial autocorrelation of the
NDVI analysis of the flood plates of the latest DANAs and the Horton–Strahler theoretical model inferred from that which is currently established in the administrative regulations of the study area, the territorial transformations resulting from the intense processes of anthropization during the last decades are, in those cases, behind many of the problems of flooding of this kind of Mediterranean basins [
44].
One of the main characteristics of these basins at the territorial level, as observed in the case study, is their open nature with multiple natural channels and peri-urban environments in which numerous economic activities and land uses coexist (coastal tourism, agriculture, transport infrastructures, golf resorts, etc. [
45]). Unlike in inland basins or mountainous orography areas, this territorial configuration severely complicates the alternative of proposing hydrological regulation by means of large hydraulic infrastructures such as dams or large linear channel structures [
46,
47].
In this context, it is particularly important to know how to correctly plan the territory and make a correct diagnosis and forecast of these phenomena so as to minimize the devastating effects of these now inevitable meteorological phenomena. In this sense, a geostatistical analysis reveals itself as a very useful tool in determining the spatial behavior patterns of the effects of DANA in this territory. In cases such as the one studied here, in which the phenomenon of territorial anthropization generates dispersed effects, making it impossible to regulate floods simply through the specific development of infrastructures, it is essential to accurately diagnose the vulnerability of the territory both in its causes and in its foreseeable consequences.
In light of the results obtained through the geostatistical analysis, it is evident that the transformation of the territory in the region during the last decades has had a significant impact on increasing the vulnerability of the study area to floods. This is shown by the high levels of spatial autocorrelation given in the
NDVI analysis of the flood plates of the latest DANA and the patterns of transformation of the territory. The loss of the natural hydrographic network of the watershed has clearly increased the vulnerability to flooding with a distinct increase in the damage caused to populations, crops, and natural areas. However, as seen in other parts of the Mediterranean coast [
47], this correlation of cause–effect is not homogeneous.
To begin with, the two-dimensional geostatistical analysis of the indicator of the sealed effect generated by the urbanization of the territory and of the existence of damage after the DANA shows a clear positive correlation. However, that correlation is not spatially homogeneous; there are cases in which the indicator generates very serious damage compared to others in which the damage is only very slight.
We have the observed results of the indicator relating to the generation of linear communication infrastructures. In this case, despite the existence of a clear autocorrelation with the transformation patterns of the territory, the presence of damage is not systematically observed in all cases. Furthermore, it can be observed that the two-dimensional correlation levels of the LISA analysis only present positive values for medium or minor damage levels. However, this issue gives rise to new questions because, as other authors pointed out [
48], the increase in vulnerability associated with the dam effect that these infrastructures develop may be masked by their transversal drainage elements that are currently working well. Therefore, we could be facing cases in which some of these infrastructures are still acting as positive damage containment elements, but in the event where more intense rainfall events are encountered, these infrastructures may collapse in their response, with potentially catastrophic consequences.
Where a clear positive correlation can be seen is in the indicators associated with the orographic transformations of the land. These transformations, combined with the soil sealing effect, show the cases with the highest two-dimensional statistical correlation with the highest damage levels. This issue is a worrisome phenomenon for the future if we analyze the inertias of territorial transformation of the last decades. From the orographic point of view, the analysis of land use transformation at the agricultural level in the area over the last 40 years shows exponential growth (446%) of the land, which has changed from rainfed to irrigated [
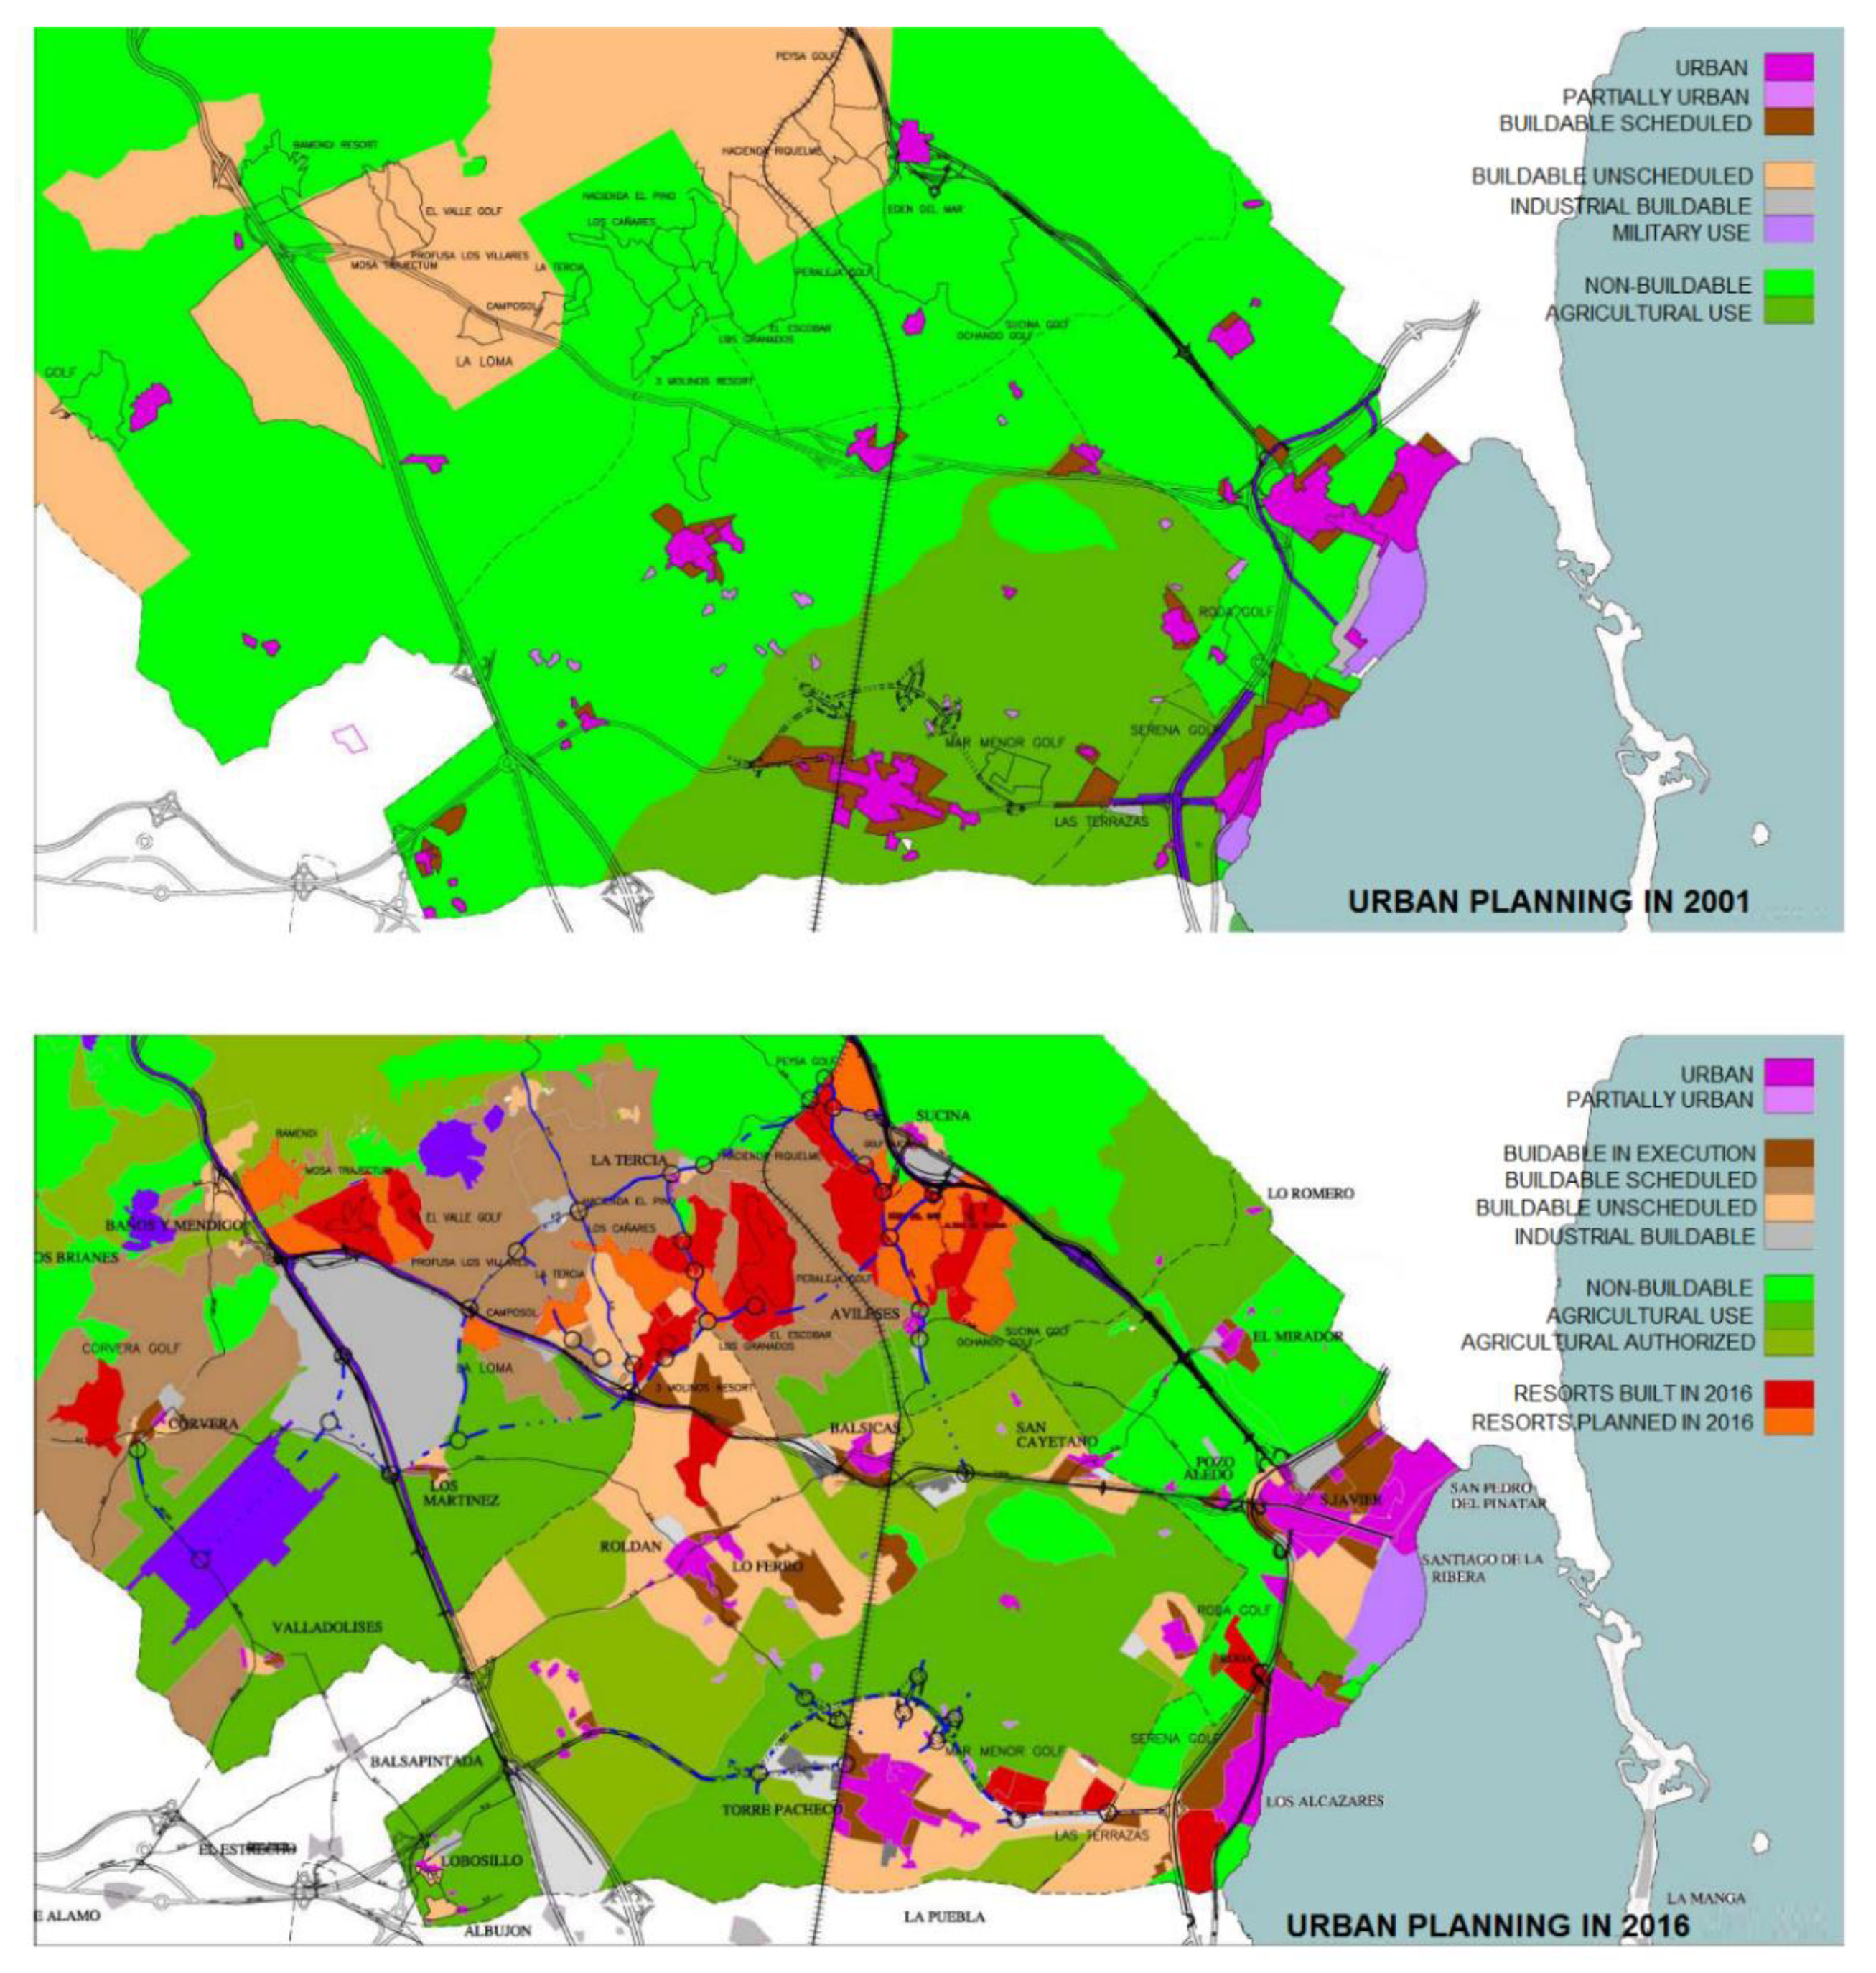
45]. This transformation has resulted in the substitution of trees and the usual terraced structures of the traditional crops of Mediterranean agriculture by ortho-fruit cultivated lands associated with intensive agriculture, sloping towards the lagoon. At the urbanization level, the behavior pattern is similar, although more recent in time. If we compare the urban situation of the year 2000 with that which is currently foreseen in recent urban planning (
Figure 12), the urban growth pattern can clearly generate an explosive cocktail in terms of flooding coupled with the previous parameter if the necessary forecasting and control parameters are not put into place. We are therefore facing an already serious problem, which, far from being solved, runs a serious risk of being increased in the future if corrective mechanisms are not implemented in the short term.
5. Conclusions
This study analyzed the phenomenon of the growing problem of flooding in the Mediterranean basins by the DANA meteorological phenomena, from a territorial perspective. The analysis carried out assessed the increase in vulnerability to flooding in these coastal areas, using an innovative methodological approach. The observed results show that, apart from the effects derived from climate change (which have accentuated the frequency and intensity of the traditional cold drops of the Mediterranean climate), there is an undeniable link between the anthropic action of human activity in the territory with this growing problem. To parameterize this link, geostatistical tools were employed to analyze an anthropized coastal watershed in Southeastern Spain that has been heavily hit by the DANA phenomenon in recent years. The levels of spatial correlation between the transformation of the territory and the damage detected in the latest DANAs of 2016, 2018, and 2019 in the area were numerically evaluated using models based on GIS-LiDAR indicators.
The proposed method shows a very interesting alternative for the diagnosis of problems of this nature in areas where the strong anthropization of the territory and the existence of a scattered orography do not easily allow for the channeling or lamination of flash-floods by means of large hydraulic regulation infrastructures. The results obtained for this case show how the main cause of the most serious damage derived from floods is associated with the loss of the traditional hydrographic network in the area due to the transformation of agricultural activity. This impact is strongly amplified in some cases by the sealing effect caused by the soil urbanization process in the area. The link with the damage of the floods due to the transformation of the territory derived from the possible dam effect caused by the large linear communication infrastructures was shown to be more heterogeneous, although without conclusive results. However, the latter is an issue to be studied in the future with a broader DANA statistical base, since it is possible that some infrastructures that are currently acting as a containment dam against rains could lead to catastrophic impacts on its transversal drainage elements, possibly leading to their collapse or their being overwhelmed by the meteorological event.


