Minimization of N2O Emission through Intermittent Aeration in a Sequencing Batch Reactor (SBR): Main Behavior and Mechanism

1
College of Environmental Sciences and Engineering, Peking University, Key Laboratory of Water and Sediment Sciences, Ministry of Education, Beijing 100871, China
2
College of Environmental Science and Technology, North China Electric Power University, Key Laboratory of Resources and Environmental Systems Optimization, Ministry of Education, Beijing 102206, China
*
Author to whom correspondence should be addressed.
Water 2021, 13(2), 210; https://doi.org/10.3390/w13020210
Submission received: 11 December 2020
/
Revised: 9 January 2021
/
Accepted: 14 January 2021
/
Published: 17 January 2021
(This article belongs to the Section Wastewater Treatment and Reuse)
Abstract
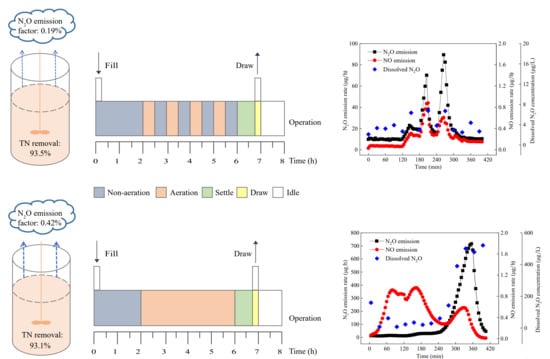
:To explore the main behavior and mechanism of minimizing nitrous oxide (N2O) emission through intermittent aeration during wastewater treatment, two lab-scale sequencing batch reactors operated at intermittently aerated mode (SBR1), and continuously aerated mode (SBR2) were established. Compared with SBR2, the intermittently aerated SBR1 reached not only a higher total nitrogen removal efficiency (averaged 93.5%) but also a lower N2O-emission factor (0.01–0.53% of influent ammonia), in which short-cut nitrification and denitrification were promoted. Moreover, less accumulation and consumption of polyhydroxyalkanoates, a potential endogenous carbon source promoting N2O emission, were observed in SBR1. Batch experiments revealed that nitrifier denitrification was the major pathway generating N2O while heterotrophic denitrification played as a sink of N2O, and SBR1 embraced a larger N2O-mitigating capability. Finally, quantitative polymerase chain reaction results suggested that the abundant complete ammonia oxidizer (comammox) elevated in the intermittently aerated environment played a potential role in avoiding N2O generation during wastewater treatment. This work provides an in-depth insight into the utilization of proper management of intermittent aeration to control N2O emission from wastewater treatment plants.
1. Introduction
Nitrous oxide (N2O) is considered to be the dominant contributor to the deterioration of the ozone layer [1,2] and act as a greenhouse gas (GHG) with a stable-state lifetime of 114 years and global warming potential 298 times greater than that of carbon dioxide (CO2) [3]. It is of great importance to identify anthropogenic sources of N2O for the purpose of emitting less GHG to the global atmosphere [4,5]. For the past years, wastewater treatment plants (WWTPs) have been demonstrated to contribute significantly to the total GHG emission [6] and make up for 3.2–10.2% of the anthropogenic source of N2O [7]. The N2O-emission factors (emitting amount of N2O-N divided by the nitrogen load) could achieve up to 95% and 14.6% for lab-scale and full-scale WWTPs, respectively [8]. Thus, efforts to minimizing N2O emission from WWTPs are receiving more attention from the globe [9].
For WWTPs, N2O is mainly produced in biological nitrogen removal (BNR) via nitrification and denitrification, including three main pathways: (1) nitrifier denitrification (ND)—the canonical ammonia-oxidizing bacteria (AOB) utilize nitrite as an alternative electron acceptor instead of oxygen (O2) to produce N2O as a byproduct under anoxic conditions or high nitrite concentrations [10,11]; (2) heterotrophic denitrification (HD)—the imbalanced activities of nitrogen-reducing enzymes in heterotrophic denitrifiers result in N2O accumulation during nitrate or nitrite reduction under very low carbon/nitrogen (C/N) ratios [12,13]; (3) hydroxylamine (NH2OH) oxidation—N2O generated as a side product through incomplete oxidation of NH2OH to nitrite by AOB [6]. Nevertheless, the relative contributions of the three pathways during the complicated BNR systems are still debatable, and especially new biochemical processes are still emerging. Recently, the newly discovered Nitrospira-like complete ammonia oxidizer (termed “comammox”) has been proved to be actively participating in ammonia oxidation in full-scale WWTPs, which challenged our traditional perspectives of nitrogen cycling [14,15,16]. However, to what extent the existence of comammox affecting N2O formation remains unclear in engineered systems [17], suggesting the significance of including the new emerging ammonia-oxidizing guilds to interpret the sources and mechanisms of N2O production.
Operational strategies and parameters of WWTPs have significant influences on N2O emission [18,19,20]. Commonly, all of the three pathways for N2O production are largely sensitive to O2 [21]. Previous studies have illustrated the significant effects of different aeration patterns on N2O emission in wastewater treatment. High N2O production could be triggered when the anoxic state is switched to the oxic state during anoxic/oxic (A/O) processes [22]. Long aeration time during the oxic state also promoted N2O generation considerably [4]. In contrast, the intermittent aeration (aeration phase followed by a short anoxic phase) was proved to be an efficient way the reduction of N2O emission while maintaining high nitrogen removal efficiencies during WWTPs. For instance, Ni et al. have indicated that increasing the cycle frequency of periodic aeration could minimize N2O production in a biofilm reactor [23]. Rodríguez-Caballero et al. have realized N2O mitigation in a full-scale WWTP without compromising nitrification performance [4]. A similar observation has also been obtained during the intermittent aeration in composting processes of cattle manure [21]. However, how the intermittent aeration mode would impact N2O emission in sequencing batch reactors (SBRs), one of the most widely employed wastewater treatment processes, is still unknown.
In this study, two lab-scale SBRs adopting contrast aeration strategies (continuous aeration vs. intermittent aeration) were established for comparisons of N2O production during nitrogen removal. Moreover, a series of batch experiments with detailed gas and chemical analysis were conducted to reveal the main sources and mechanisms for N2O production. Quantitative analysis of ammonia-oxidizing prokaryotes (AOPs), including comammox, canonical AOB and ammonia-oxidizing archaea (AOA), gained insights into evaluating their potential roles in the minimization of N2O emission from WWTPs. Our study provided crucial guidance to control GHG emission from WWTPs through proper management of intermittent aeration strategy.
2. Materials and Methods
2.1. Reactor Setup and Operation
Two laboratory-scale SBRs of the same size were used to achieve simultaneous nitrification and denitrification in the treatment of synthetic wastewater. Both sealed reactors were made of transparent polyvinyl methacrylate with a working column of 5 L and headspace of 1 L. The seeding sludge was taken from a full-scale municipal WWTP. The reactors were operated in an 8-h cycle under the anoxic and oxic stages sequentially at 25 ± 1 °C. One reactor (SBR1) was run with each cycle comprising of 2 h anoxic period and 4-h intermittent aeration (30 min of aeration and 30 min of non-aeration alternately), followed by 45-min settling, 15-min effluent withdrawal and 1 h idle period. The airflow rate of SBR1 was maintained at 180 mL/min. Another reactor (SBR2) was operated with each cycle consisting of 2 h anoxic period and 4-h continuous aeration with an airflow rate of 90 mL/min, followed by the same settling, withdrawal and idle periods as SBR1. Both reactors were regulated by a series of automatic time-sequencing controllers and stirred with mechanical mixing paddles at about 250 rpm. In the first 12 min of each cycle, 2.5 L synthetic wastewater was pumped into the SBRs from the top, which consisted of: 1.50 g/L NaHCO3, 1.01 g/L CH3COONa, 0.44 g/L KH2PO4, 0.19 g/L NH4Cl, 0.10 g/L MgSO4·7H2O, 0.10 g/L CaCl2 and 1.0 mL/L microelement solution [24,25]. As a result, the influent chemical oxygen demand (COD), ammonia (-N) and phosphate were approximately 300 mg/L, 50 mg/L and 10 mg/L, respectively. The hydraulic retention time (HRT) and sludge retention time (SRT) was maintained at 8 h and 20 d, respectively. After a period of operation, both SBRs maintained total nitrogen (TN) removal efficiency at over 80%, which meant that these two reactors reached stable nitrogen removal performances. The mixed liquid suspended solids (MLSS) of SBR1 and SBR2 were kept at approximately 1920 and 1740 mg/L during steady states, respectively. During the whole period, the influent and effluent -N, nitrite (-N), nitrate (-N) and TN were daily monitored to assess the nitrogen removal performances. After reaching stable nitrogen removal performances, off-gases emitted within one cycle from both reactors were daily collected into 50-L gasbags from the sampling pipe on the top, and the concentrations of N2O and nitric oxide (NO) were measured.
To further explore the nitrogen conversion process in the reactors, multiple important parameters were measured regularly in a typical cycle [25]. In brief, 30 mL mixed liquid was obtained at an interval of half an hour. After centrifugation, the supernatant was utilized to analyze -N, -N, -N and TN concentrations. The concentrated activated sludge on the bottom was used to analyze polyhydroxyalkanoates (PHAs, including poly-β-hydroxybutyrate (PHB) and polyhydroxy valerate (PHV)). Furthermore, released gases (N2O and NO) were monitored at regular times, and dissolved N2O in the mixed liquid was detected every 30 min according to the headspace method [26]. Both pH and dissolved oxygen (DO) were measured at a 5-min interval during the typical cycle.
2.2. Batch Experiments for N2O Generation Mechanisms
Batch experiments were performed to explore the relative contributions of ND and HD to N2O and NO emissions. After reaching the stable performances, 300 mL mixed liquid was, respectively, obtained from two reactors at the end of the anoxic phase. 20 mg/L -N was supplemented to determine N2O and NO emission rates from simultaneous ND and HD processes (experiment No. 1). Meanwhile, 10 mg/L allylthiourea (ATU) and 1 mg/L NaClO3 were supplemented with 20 mg/L -N to determine the gas emission rates from the HD only (experiment No. 2) [27]. For the gas emission rates solely from the ND, 300 mL mixed liquid was obtained from both reactors in the late oxic stage, with a 2 h aeration to further consume the residual organic carbon. Then, 20 mg/L -N and 20 mg/L -N were supplemented to determine the gas emission rates (experiment No.3). All the above experiments were conducted at 25 ± 1 °C in sealed bottles with specific pipes for aeration and sampling. Airflow rates were kept at 20 mL/min to simulate the DO concentrations during the typical cycle of reactors. The off-gas was continuously collected every half an hour to determine N2O and NO amounts until -N and -N in the sealed bottles were totally consumed.
In addition, batch experiments were also employed to investigate the effects of different electron acceptors (i.e., -N, -N and N2O) on gas emission rates. After achieving steady performances, 400 mL mixed liquid at the end of the anoxic phase was taken for each test. All the tests were carried out in sealed bottles at 25 ± 1 °C. In each sealed bottle, stock solutions of -N, -N or N2O were injected into the mixed liquid to gain initial concentrations of about 25, 30 and 50 mg N/L, respectively. 60 mL/min N2 was introduced to maintain the anoxic atmosphere. Bulk samples were taken at particular time intervals (3–5 min) to determine the concentrations of -N and -N in the mixed liquid and N2O/NO amounts in the off-gas.
2.3. Quantification of Comammox, AOB and AOA
The amoA genes of comammox, AOB and AOA formed distinct phylogenetic clades [14,15] and were thought of as ideal markers for quantifications [28]. Based on the above, the total DNA of activated sludge was extracted in duplicate from 2 mL mixed liquid by using FastDNA®SPIN kit for soil (MP Biomedicals, Solon, OH, USA) after stable performances were achieved for both reactors. To quantify the abundances of comammox, AOB and AOA amoA genes, DNA-based quantitative polymerase chain reaction (qPCR) amplification was performed using SuperReal PreMix Plus (SYBR Green, Tiangen Biotech Co. Ltd, Shanghai, China) in Applied Biosystems 7300 with corresponding primer sets (Supplementary Table S1). Detailed procedures of qPCR amplification were summarized in Supplementary Information. The dry weight of MLSS was used as the internal standard for normalization among different samples.
2.4. Analytical Methods
The concentrations of -N, -N, -N and TN were measured according to the standard methods employed by a discrete auto analyzer (AMS, Guidonia, Italy). Determinations of the PHAs, including PHB and PHV, were conducted using gas chromatography (GC) [29]. The N2O and NO concentrations were analyzed by a GC equipped with an electron capture detector and a NO-NO2-NOX analyzer as described in our previous research, respectively [13]. N2O and NO emission rates were calculated based on their concentrations and the gas flow [6]. The emission factors were calculated as their emission rates divided by the influent ammonia rates. The dissolved N2O was calculated from Henry’s Law.
3. Results and Discussion
3.1. Nitrogen Removal and N2O Emission in the Two SBRs
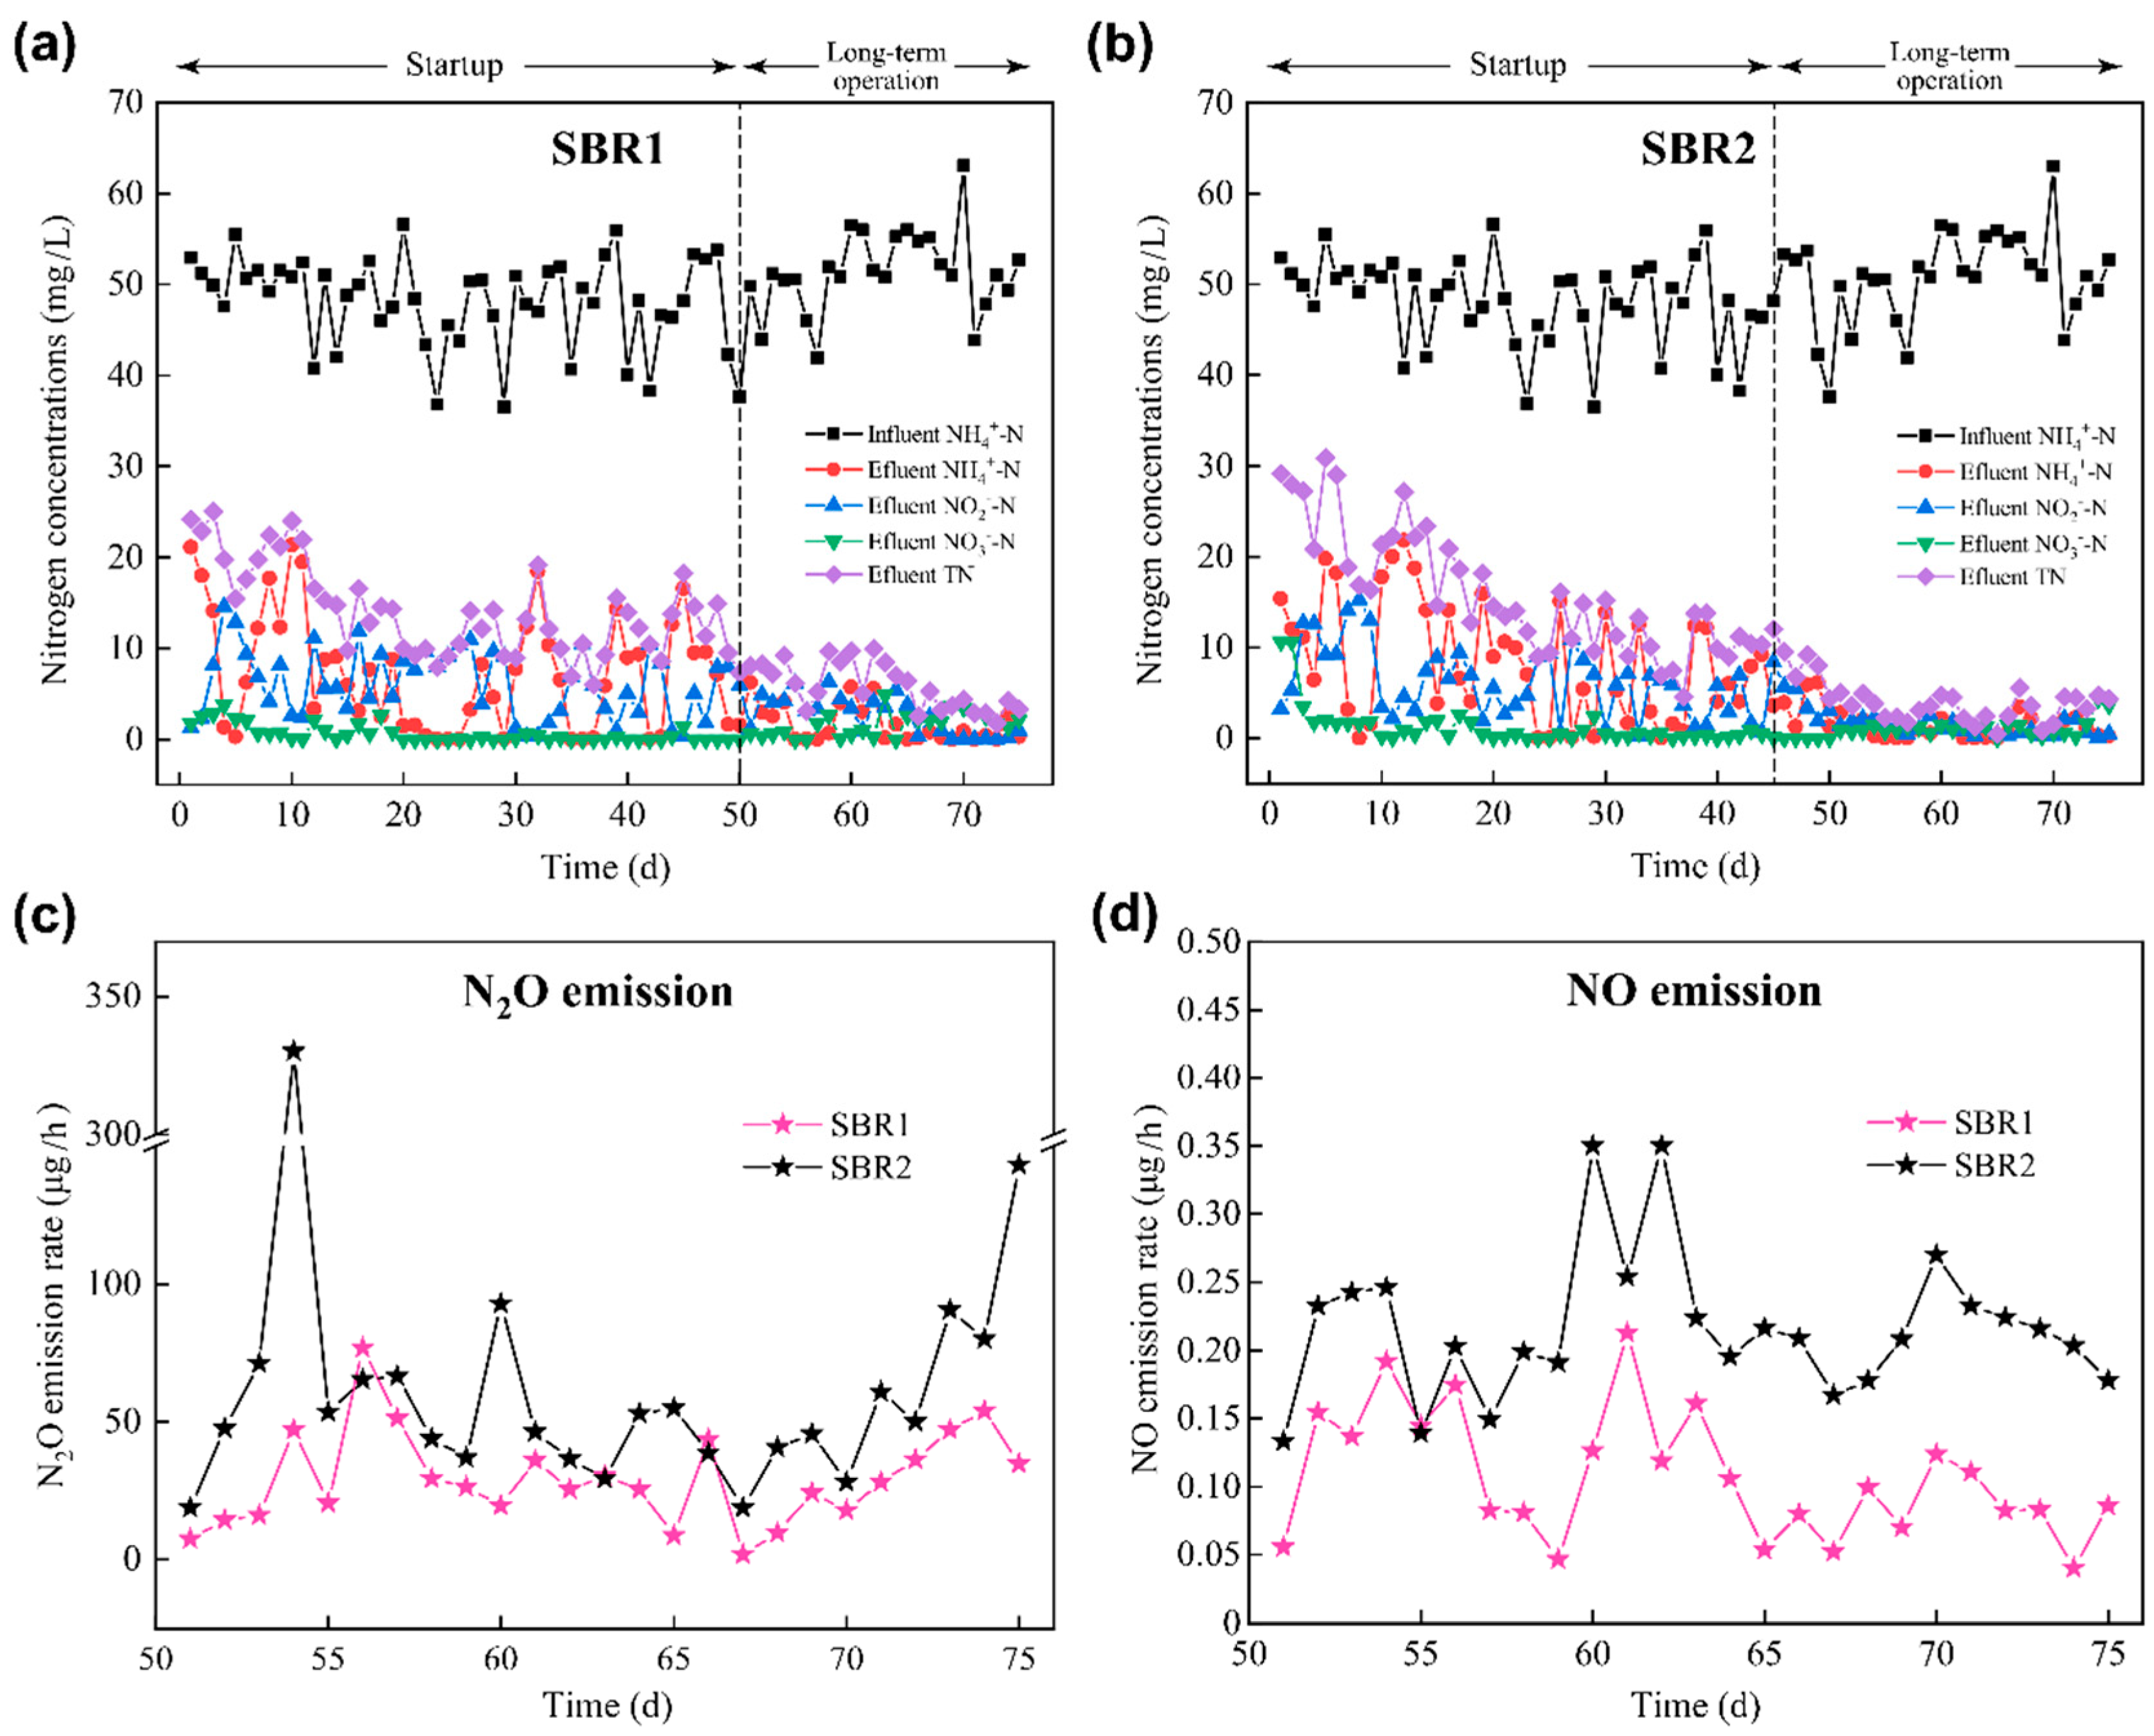
The variations of -N, -N, -N and TN concentrations during the startup and steady-state operation (75 days (d)) of both reactors are displayed in Figure 1.
Under the low C/N ratio of 6, TN-removal efficiency gradually increased to more than 80% during the first 50 d and 45 d for intermittently aerated SBR1 and continuously aerated SBR2, respectively, then kept a relatively steady condition (SBR1: 80.5–96.6%; SBR2: 81.2–99.3%). A longer startup period was acquired for the intermittently aerated SBR1 before reaching the stable state, which was likely due to that frequent anoxic/oxic transitions influenced the stability of nitrifying and denitrifying communities in reactors [30]. For both reactors, -N- and TN-removal efficiencies maintained high during the final 10 d of the steady period. The intermittent-aerated SBR1 exhibited a slightly better -N removal performance averaged at 99.0% than the continuously aerated SBR2 averaged at 97.5%. Both reactors realized a better TN-removal efficiency (SBR1: averaged 93.5%; SBR2: averaged 93.1%) than several previously analogous studies, such as 85.4% in a continuous plug-flow step feed process with alternating anoxic/aerobic conditions [31], 89.1% and 90.4% in two full-scale SBRs treating municipal wastewater [4,32], respectively. Moreover, -N (averaged 4.92 and 4.29 mg/L for SBR1 and SBR2, respectively) rather than -N (averaged 0.95 and 1.13 mg/L) was the major nitrifying products in both reactors, demonstrating that short-cut nitrification and denitrification (SCND) was successfully realized. It was worth noting that the SBR1 (4.22 mg/L on average) accumulated more -N than the SBR2 (3.05 mg/L on average), particularly after 20 d of the startup, suggesting that the frequent anoxic/oxic transitions facilitated the dominance of AOB over nitrite-oxidizing bacteria (NOB), resulting in more -N accumulation during the startup period [31,33].
The N2O and NO emissions from both reactors were daily-monitored for about one month after 50 d (Figure 1c,d). From the 50 to 75 d, the N2O (1.90–76.70 μg/h) and NO (0.04–0.21 μg/h) emission rates of intermittently aerated SBR1 mostly kept much lower than those (N2O: 18.67–330.09 μg/h; NO: 0.13–0.35 μg/h) of continuous-aerated SBR2. Significant differences were observed for N2O (paired-sample t-test, t = −3.177, p = 0.004) and NO (t = −9.817, p = 7.036 × 10⁻¹⁰) emission rates between these two systems. On average, the emission rates were 46.4% and 49.8% lower for N2O and NO under the intermittent aeration mode, which was generally consistent with previous studies obtained in other reactor types treating municipal wastewater [4], high ammonia wastewater [23] and composting cattle manure [21]. Notably, the average N2O-emission factor was calculated to be 0.19% (0.01–0.53%) and 0.42% (0.11–2.09%) for SBR1 and SBR2, suggesting the N2O-emission factor of the present intermittently aerated SBR was far lower than those (1.5–15.6%) of other intermittently aerated bioreactors treating various synthetic municipal wastewater, slaughterhouse wastewater and separated liquid fraction of anaerobically digested pig manure [4,34,35,36,37,38,39] (Table 1).
For NO, the average emission factor was 0.0007% (0.0003–0.0012%) for SBR1 and 0.0014% (0.0009–0.0022%) for SBR2, lower than those treating synthetic (0.003%), rural (0.006–0.032%) and industrial wastewater (0.09%) [13]. These results demonstrated the promising advantages of using SBR with intermittent aeration mode in wastewater treatment to simultaneously achieve excellent nitrogen removal and N2O/NO emission reduction. The wastewater with higher ammonia nitrogen load in those studies would promote nitrifier denitrification to generate N2O and thus have higher N2O emission than our study. Another reason may be that the wastewater in those studies may contain some refractory organic pollutants influencing the microbial nitrification and denitrification activity [13]. Compared with the continuous-aerated SBR, the intermittently aerated SBR experienced alternating aeration and non-aeration during the reaction phase, which could maintain the aeration duration for adequate nitrification and non-aeration duration for complete denitrification [40]. These may benefit both nitrogen removal performance and N2O mitigation in the intermittently aerated SBR.
3.2. Nitrogen Removal and N2O Emission in Typical Cycles of the SBRs
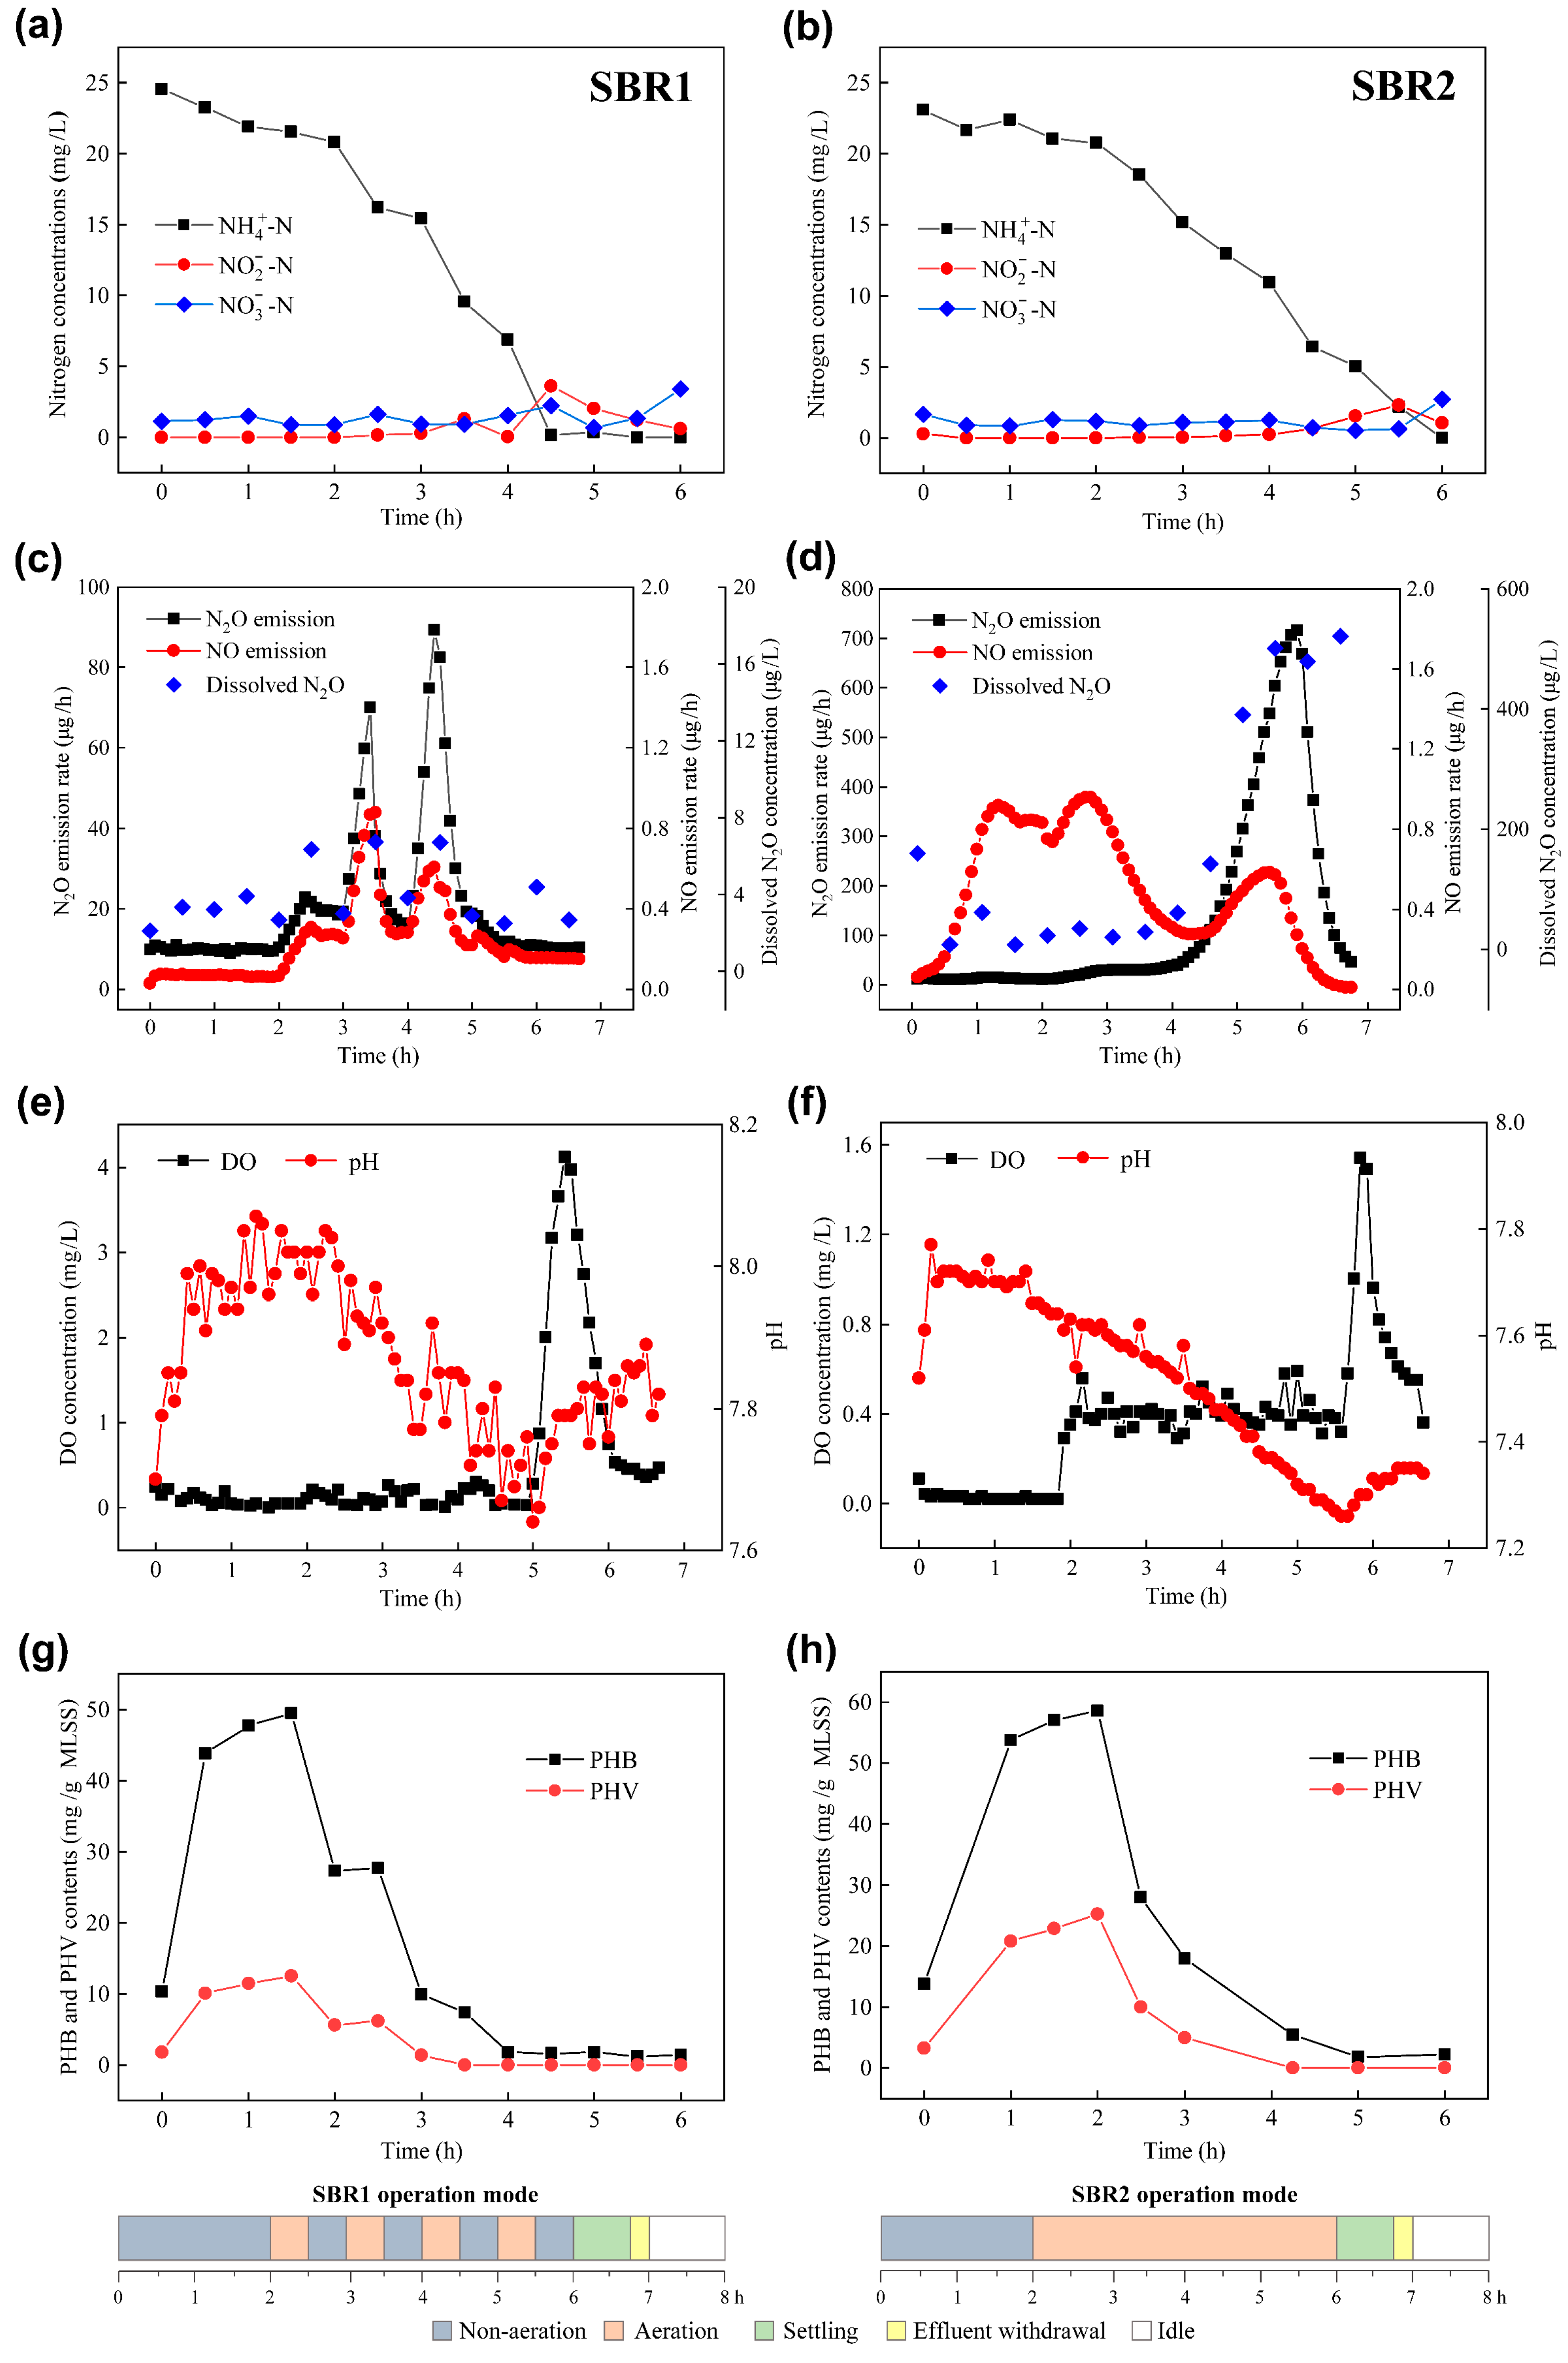
The variations of -N, -N, and -N concentrations during the typical cycle of both SBRs are shown in Figure 2a,b.
During the anoxic stage (0 to 2 h), the -N concentration decreased slightly to 20.80 and 20.77 mg/L from the initial 24.58 and 23.12 mg/L separately for SBR1 and SBR2. When getting into the oxic state, the -N concentration in SBR1 rapidly decreased to 0.14 mg/L at 4.5 h with an average removal rate of 27.31 mg/h (Figure 2a). The -N started to accumulate at 3.5 h, then achieved the highest level of 3.60 mg/L at 4.5 h and declined to 0.58 mg/L at the end, indicating that the SCND occurred. Meanwhile, the -N concentration achieved the highest level of 3.40 mg/L at 6 h due to nitrite oxidation by NOB when no -N was left after 4.5 h. During this typical cycle, the TN-removal efficiency reached 91.9%, demonstrating a remarkable nitrogen removal performance through the SCND. For SBR2, -N was totally depleted until 6 h with an average removal rate of 19.27 mg/h (Figure 2b). -N began to accumulate after 4.5 h, with a maximum concentration of 2.32 mg/L, while the -N reached the highest level of 2.69 mg/L at 6 h. Similar to the performance during the long-term operation (Figure 1), higher -N removal rate and -N accumulation was obtained in the typical cycle of SBR1 than SBR2, suggesting the dominance of AOB over NOB was realized more completely under the intermittent aeration than the continuous aeration [31,33]. This result was corresponding to the metabolic characteristics that the growth rate and metabolic activity of NOB would be inversely proportional to the anoxic disturbance duration [33,41], but the decay rate of AOB was much lower than that of NOB [42], which promoted the dominant growth of AOB over NOB during the alternating oxic and anoxic condition.
The variations of N2O and NO emission rates and dissolved N2O concentrations during the typical cycle are exhibited in Figure 2c,d. The variations of N2O and NO emissions and dissolved N2O were generally synchronous in SBR1, with all three peaks occurring at the end of each 30-min aeration period (at 2.5, 3.5 and 4.5 h) (Figure 2c). This indicated that the produced N2O could form a dissolved state in the receiving water. It was suspected that the AOB community associated with heterotrophic denitrifiers might govern the N2O/NO production and reduction simultaneously through the SCND during the intermittent aeration [43], thus resulting in the covariation of N2O/NO. The N2O emission rate achieved the highest level at 4.5 h when -N was totally removed with the maximum -N accumulation, while the NO emission rate achieved the highest level at 3.5 h when -N just started to accumulate. Higher -N accumulation in the cycle could slightly inhibit N2O reducing enzymes of denitrifiers and provide enough terminal electron acceptors for AOB, which would lead to a higher N2O emission rate [25]. For SBR2, the variations of N2O and NO emission rates were not synchronous (Figure 2d). The only peak of N2O emission rate occurred at the end of continuous aeration when -N was totally removed with -N accumulation, while the top two peaks of NO emission rate occurred at 1.25 h and 2.5 h. The heterotrophic truncated denitrifying bacteria, which lack one or more of denitrifying functional genes (e.g., norBC) for complete denitrification [44], might be one of the reasons for NO accumulation under enough carbon sources at the anoxic stage. The overexpression of -N reductase during transient anoxia could be one important reason for the production of NO [22]. During this typical cycle, much lower N2O/NO emission factors and dissolved N2O concentration were definitely obtained for SBR1 (0.11%/0.0013%) than SBR2 (0.77%/0.0029%) (Figure 2c,d), although higher -N accumulation was previously considered to promote N2O generation [8]. One reason may be that the intermittent aeration lowered the amount of N2O blow-off from the wastewater, and the remaining N2O in the wastewater would be then reduced by heterotrophic denitrifiers at the intermittently anoxic stage as denitrification could act as an important N2O sink during the biological nitrogen removal [45]. For another reason, it was shown that the DO concentration at the first 2.5 h of the oxic stage (2 to 4.5 h) of intermittently aerated SBR1 was kept below 0.40 mg/L (averaged 0.14 mg/L), which was much lower than that (ranging 0.29–0.65 mg/L with an average of 0.40 mg/L) of SBR2 (Figure 2e,f). In the meantime, the pH of SBR1 was decreasing from 8.0 to 7.7 but keeping higher than pH values (7.4–7.7) of SBR2 (Figure 2e,f). It was suggested that a little lower DO, and higher pH environment may usually be beneficial for the denitrification via -N routine, especially the N2O reductase activity [25,46], thus promoting the SCND efficiency and reducing N2O emission from intermittently aerated SBR1. In addition, fewer accumulations and consumptions of PHAs (i.e., PHB and PHV) as the endogenous carbon source were obtained for SBR1 than SBR2 (Figure 2g,h). The PHAs were usually produced by denitrifying polyphosphate accumulating organisms (DPAOs) or glycogen accumulating organisms (GAOs) in wastewater treatment [25]. However, it has been documented that DPAOs and GAOs could act as a potential inducer of N2O emission when PHAs were used as their internal carbon resources [47,48]. The observed lesser accumulations and consumptions of PHAs might be largely related to the minimization of N2O emission in the intermittently aerated SBR1.
3.3. Mechanisms of N2O Emission From Both Reactors
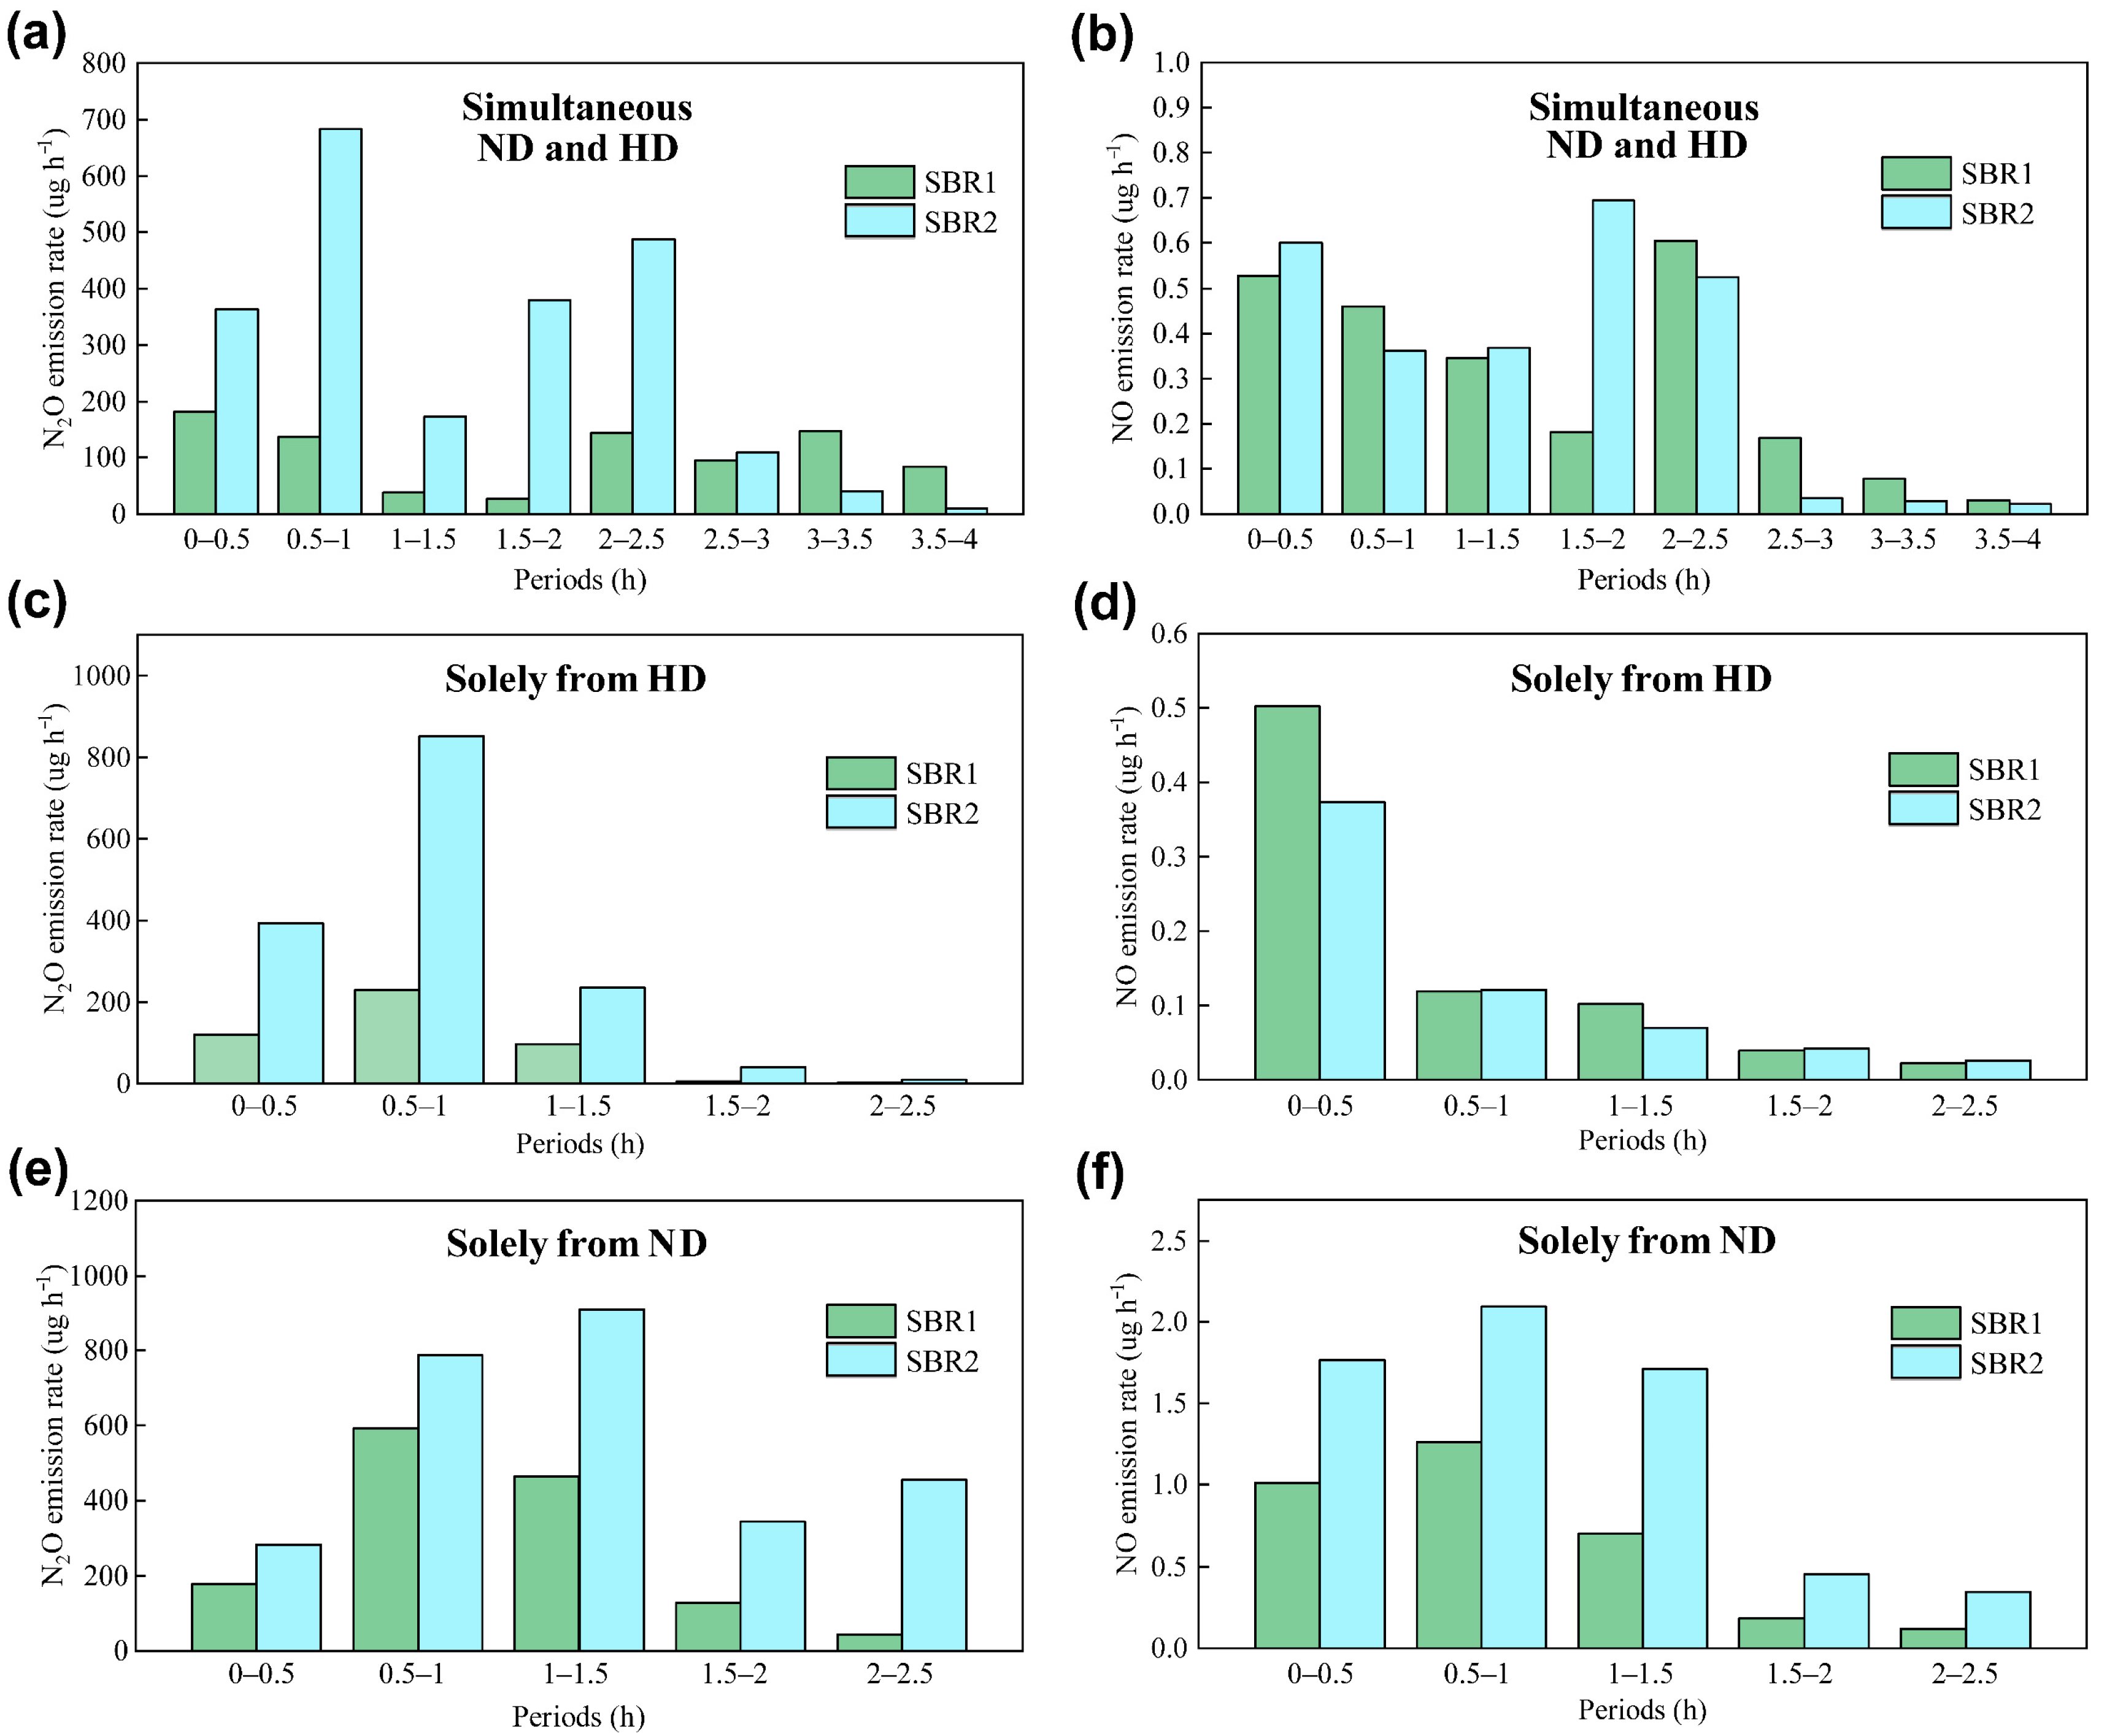
It was previously stated that N2O and NO emissions could be contributed by both HD and ND processes in anoxic conditions [49]. Batch experiments were conducted to further distinguish their respective contributions to gas emissions from both reactors. The results are shown in Figure 3 and Table 2.
First, the overall N2O emission rate (106.52 μg/h) from simultaneous ND and HD processes of SBR1 was much lower than that of SBR2 (280.83 μg/h), and similar results were gained for the N2O/NO emission factors. The N2O emission rates during each 30-min from 0 to 3 h in SBR1 were also lower than the corresponding values of SBR2 (Figure 3a). These indicated that the intermittent aeration decreased N2O/NO production from combined ND and HD processes. Notably, these values from the batch experiments were much higher than those from the stable conditions in the in situ reactors, which was attributed to the that the artificially supplemented higher concentration of -N could promote the ND but limit the HD through inhibiting N2O reductase [25]. The calculated overall -N oxidation rates (SBR1:3.16 mg/h; SBR2:1.62 mg/h) were larger than -N reduction rates (SBR1:0.75 mg/h; SBR2:1.45 mg/h), which well explained the -N accumulation in the typical cycle of both reactors and the higher accumulation in SBR1. Second, using the sludge with no external carbon, it was observed that the overall N2O/NO emission rates (281.02/0.41 μg/h) solely from the ND process in SBR1 were much lower than those (555.48/0.80 μg/h) of SBR2. Similar results were particularly obtained by comparing average gas emission rates during each half an hour (Figure 3e,f). Given that the AOB community was reported to be the major contributor to N2O generation through the ND process [50], the abundance of AOB in SBR1 was therefore predicted to be smaller than that of SBR2, possibly due to the lower DO concentration of intermittent aeration [6]. Third, the overall N2O emission rate (90.43 μg/h) solely from HD in SBR1 was also much lower than that (305.69 μg/h) of SBR2, as also illustrated by comparisons of average N2O emission rate from each 30 min (Figure 3c).
These demonstrated that the N2O reducing ability of heterotrophic denitrifiers in SBR1 sludge was far stronger than that of SBR2 sludge, particularly under the low DO environment, which was one of the most important reasons for N2O emission minimization under the intermittent aeration. Finally, comparing all the three batch experiments, we found that the ND process contributed most significantly to N2O/NO emissions in both SBRs, which was consistent with previous studies showing that greater proportions of N2O generation were caused by the ND process [51,52]. It was notable that the N2O/NO emission rates of the simultaneous ND and HD were definitely lower than those of the sole ND process for both reactors, which demonstrated that the HD process was a critical sink for N2O emission in the simultaneous nitrification and denitrification process. This was consistent with a recent study’s conclusion that denitrification can be an effective sink for N2O, potentially scavenging a proportion of N2O generated by -N oxidation or abiotic conversions [45], although some previous studies also found the HD dominated N2O emission [6]. Overall, the batch experiments showed that the ND process was the major pathway generating N2O, while HD played as a sink to consume N2O. Therefore, it was predicted that the intermittent aeration could inhibit the ND process and promote the HD process, both of which facilitated the effective minimization of N2O emission.
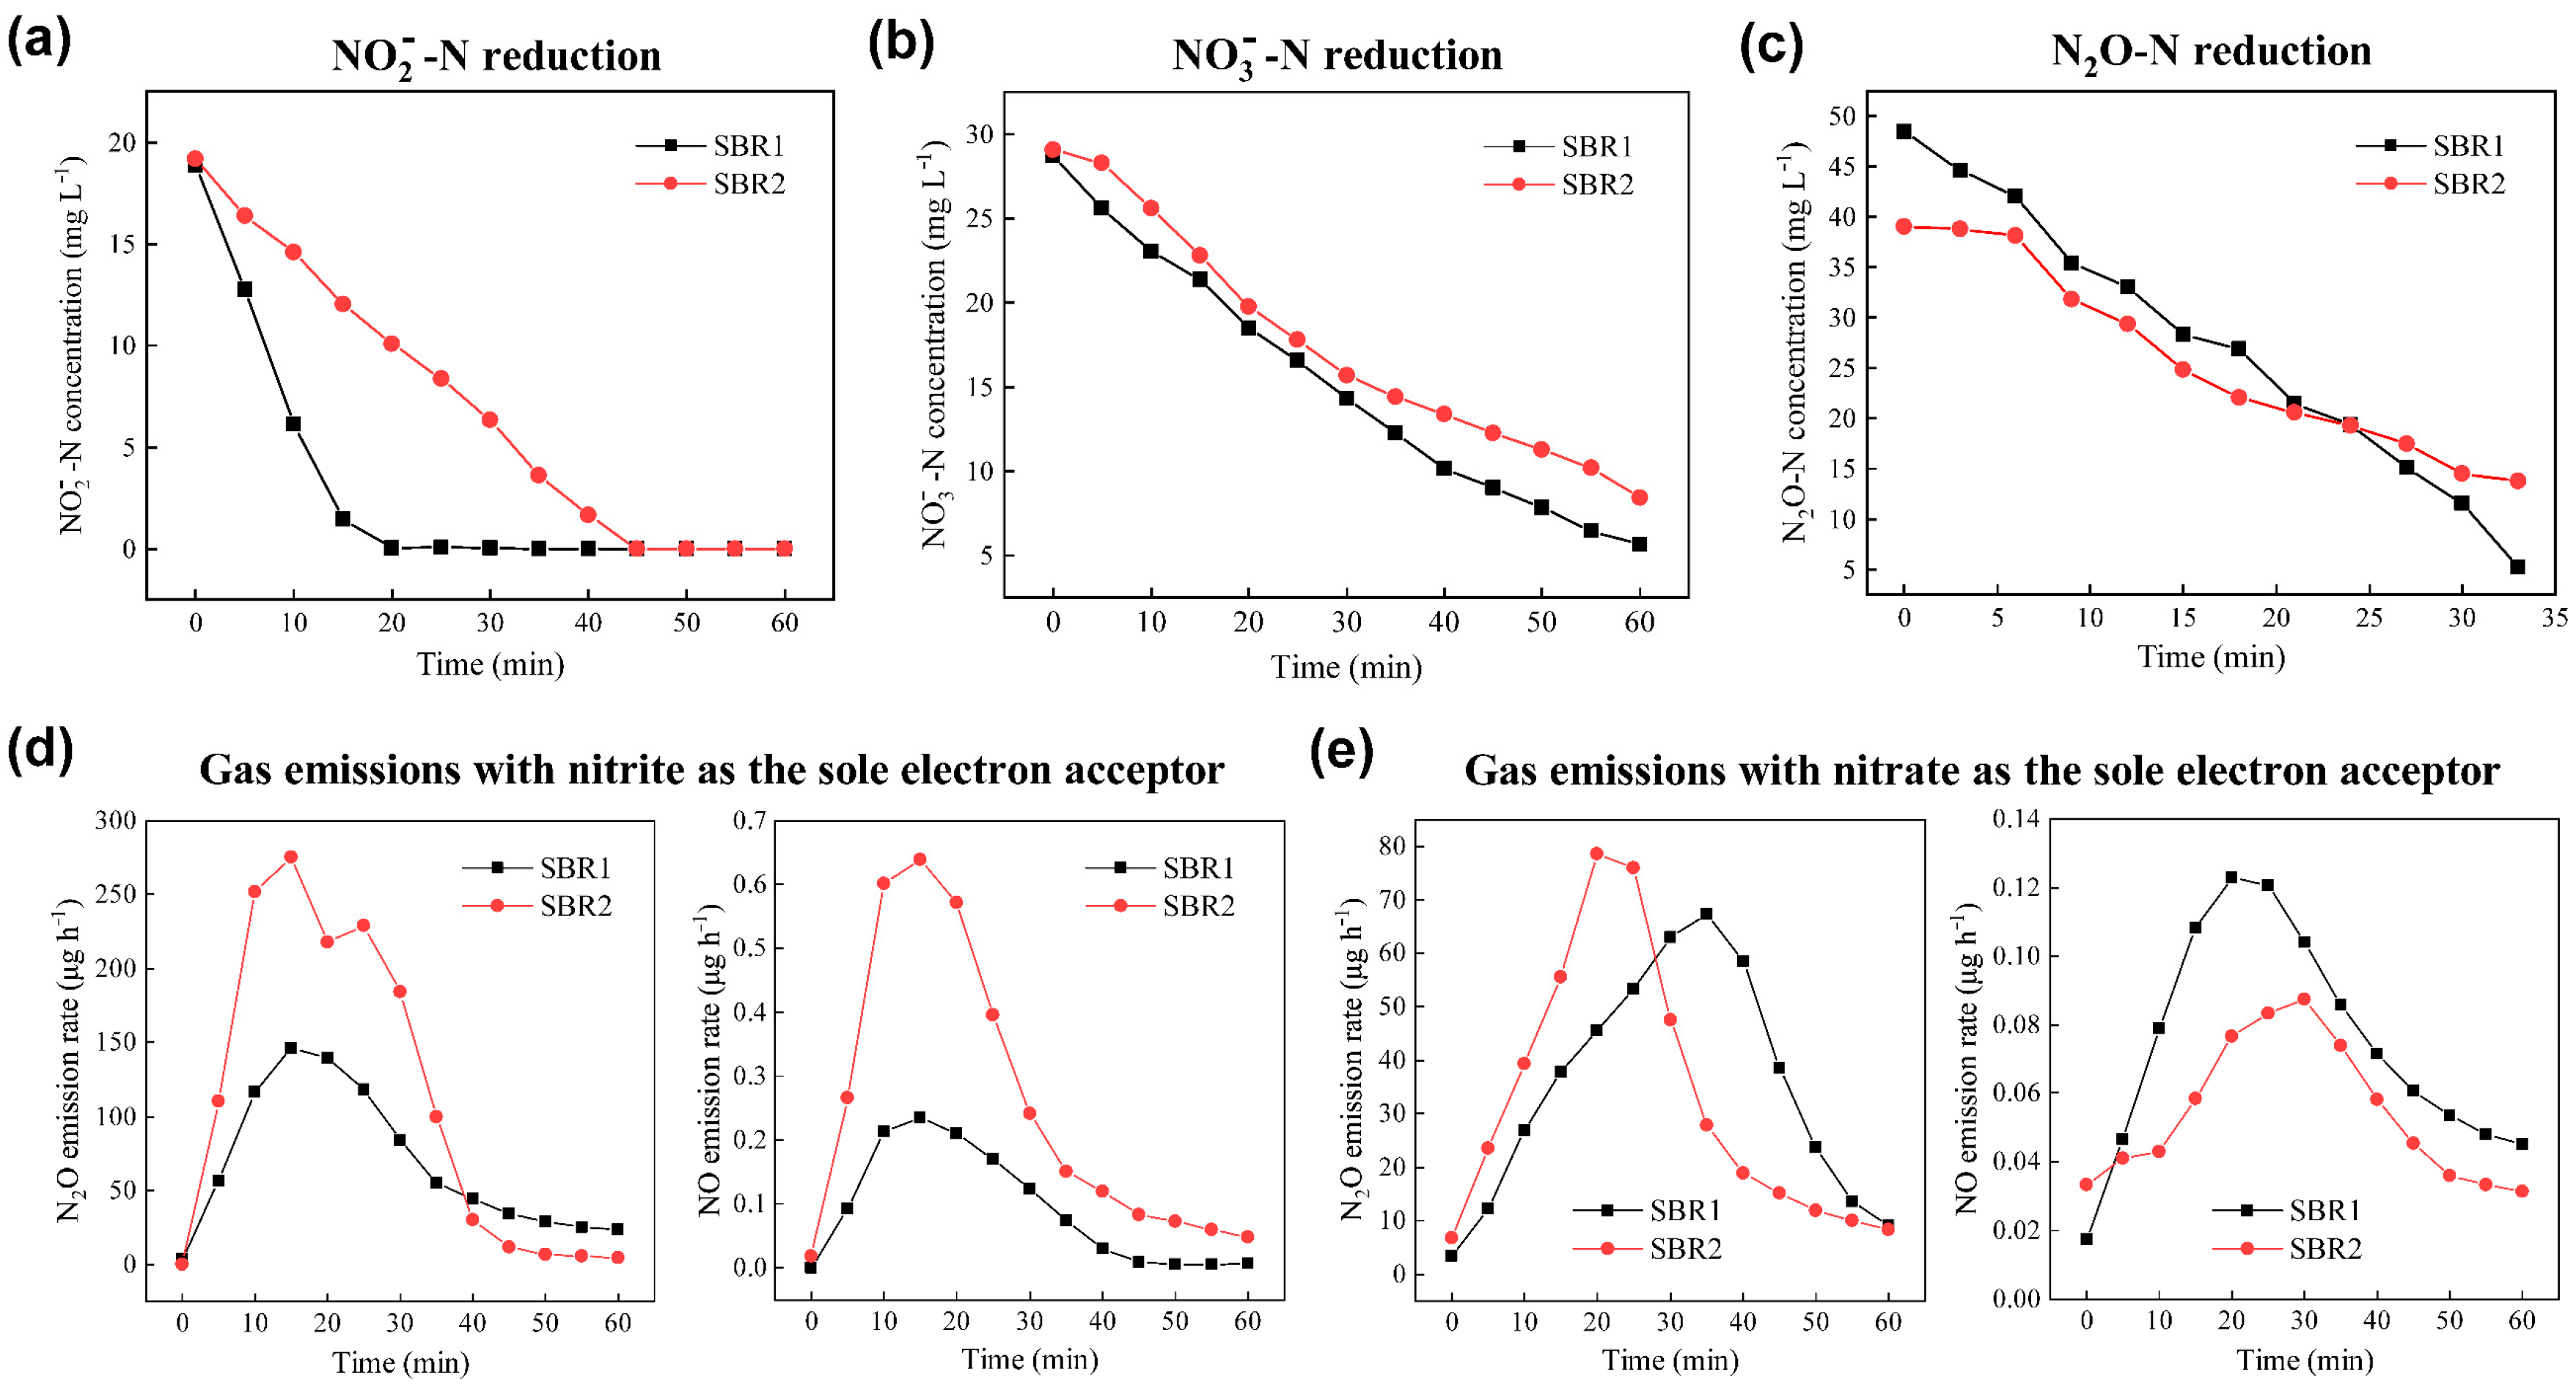
Further batch tests about the influences of different electron acceptors (i.e., -N, -N and N2O-N) on the N2O/NO emission rates during the denitrification were conducted (Figure 4). It was shown that the SBR1 experienced a higher nitrogen reduction rate (-N: 1.16 mg/min; -N: 0.38 mg/min; N2O-N: 1.31 mg/min) than the SBR2 (Figure 4a–c, indicating a stronger denitrifying activity during the intermittent aeration. The rate of N2O-N reduction was 1.53 and 1.13 times higher than that of -N and -N reduction, representing an overcapacity of N2O-N reduction step relative to other denitrification pathways (a measurement of N2O sink) [45]. These results supported the above hypothesis that the N2O sink capacity of the heterotrophic denitrifying communities could be improved through intermittent aeration. Furthermore, the maximum N2O/NO emission rates (SBR1:78.69/0.09 μg/h; SBR2:67.32/0.12 μg/h) with -N as the sole electron acceptor were much slower than those (SBR1:146.04/0.23 μg/h; SBR2:275.43/0.64 μg/h) when using -N as the sole electron acceptor (Figure 4d,e).
For both reactors, the calculated N2O/NO emission amounts (SBR1:71.84/0.098 μg; SBR2:118.84/0.270 μg) when using -N were also far larger than those (SBR1:37.19/0.078 μg; SBR2:34.30/0.056 μg) when using -N as the sole electron acceptor, even if the original -N concentrations were higher. This may be attributed to that the ND process contributed most largely to N2O/NO emissions. Comparisons of N2O/NO emission amounts with -N as the sole electron acceptor between both reactors also indicated that the ND process was significantly inhibited through the intermittent aeration. Therefore, we confirmed that the intermittent aeration could promote the HD process as a sink of N2O mainly produced by ammonia oxidation within the ND process. Given that N2O accumulation during WWTPs is a complicated biochemical process related to imbalanced activities of four different denitrification reductases, it is of great importance to evaluate the influences of environmental conditions on these enzymes. For N2O reductases, their overcapacities were reported to be universal in heterotrophic denitrifiers in a wide range of pH, temperature, C/N ratios and organic electron donors [45]. In addition, the overcapacity of N2O-N reduction was thought of as a physiological feature in denitrifiers rather than a genetic potential of the microbial community [45]. In this study, we found a larger N2O-N overcapacity in SBR1 than SBR2, resulting in N2O emission mitigation. Even though microbial communities could be easily subjected to frequent A/O shifts, the emitting N2O would be rapidly and readily consumed by N2O reducing organisms rather than being released to the atmosphere. Such observation may be considered in modeling efforts and used for developments of N2O emission minimization strategies in the future wastewater treatment.
3.4. Potential Roles of Comammox Bacteria in N2O Mitigation
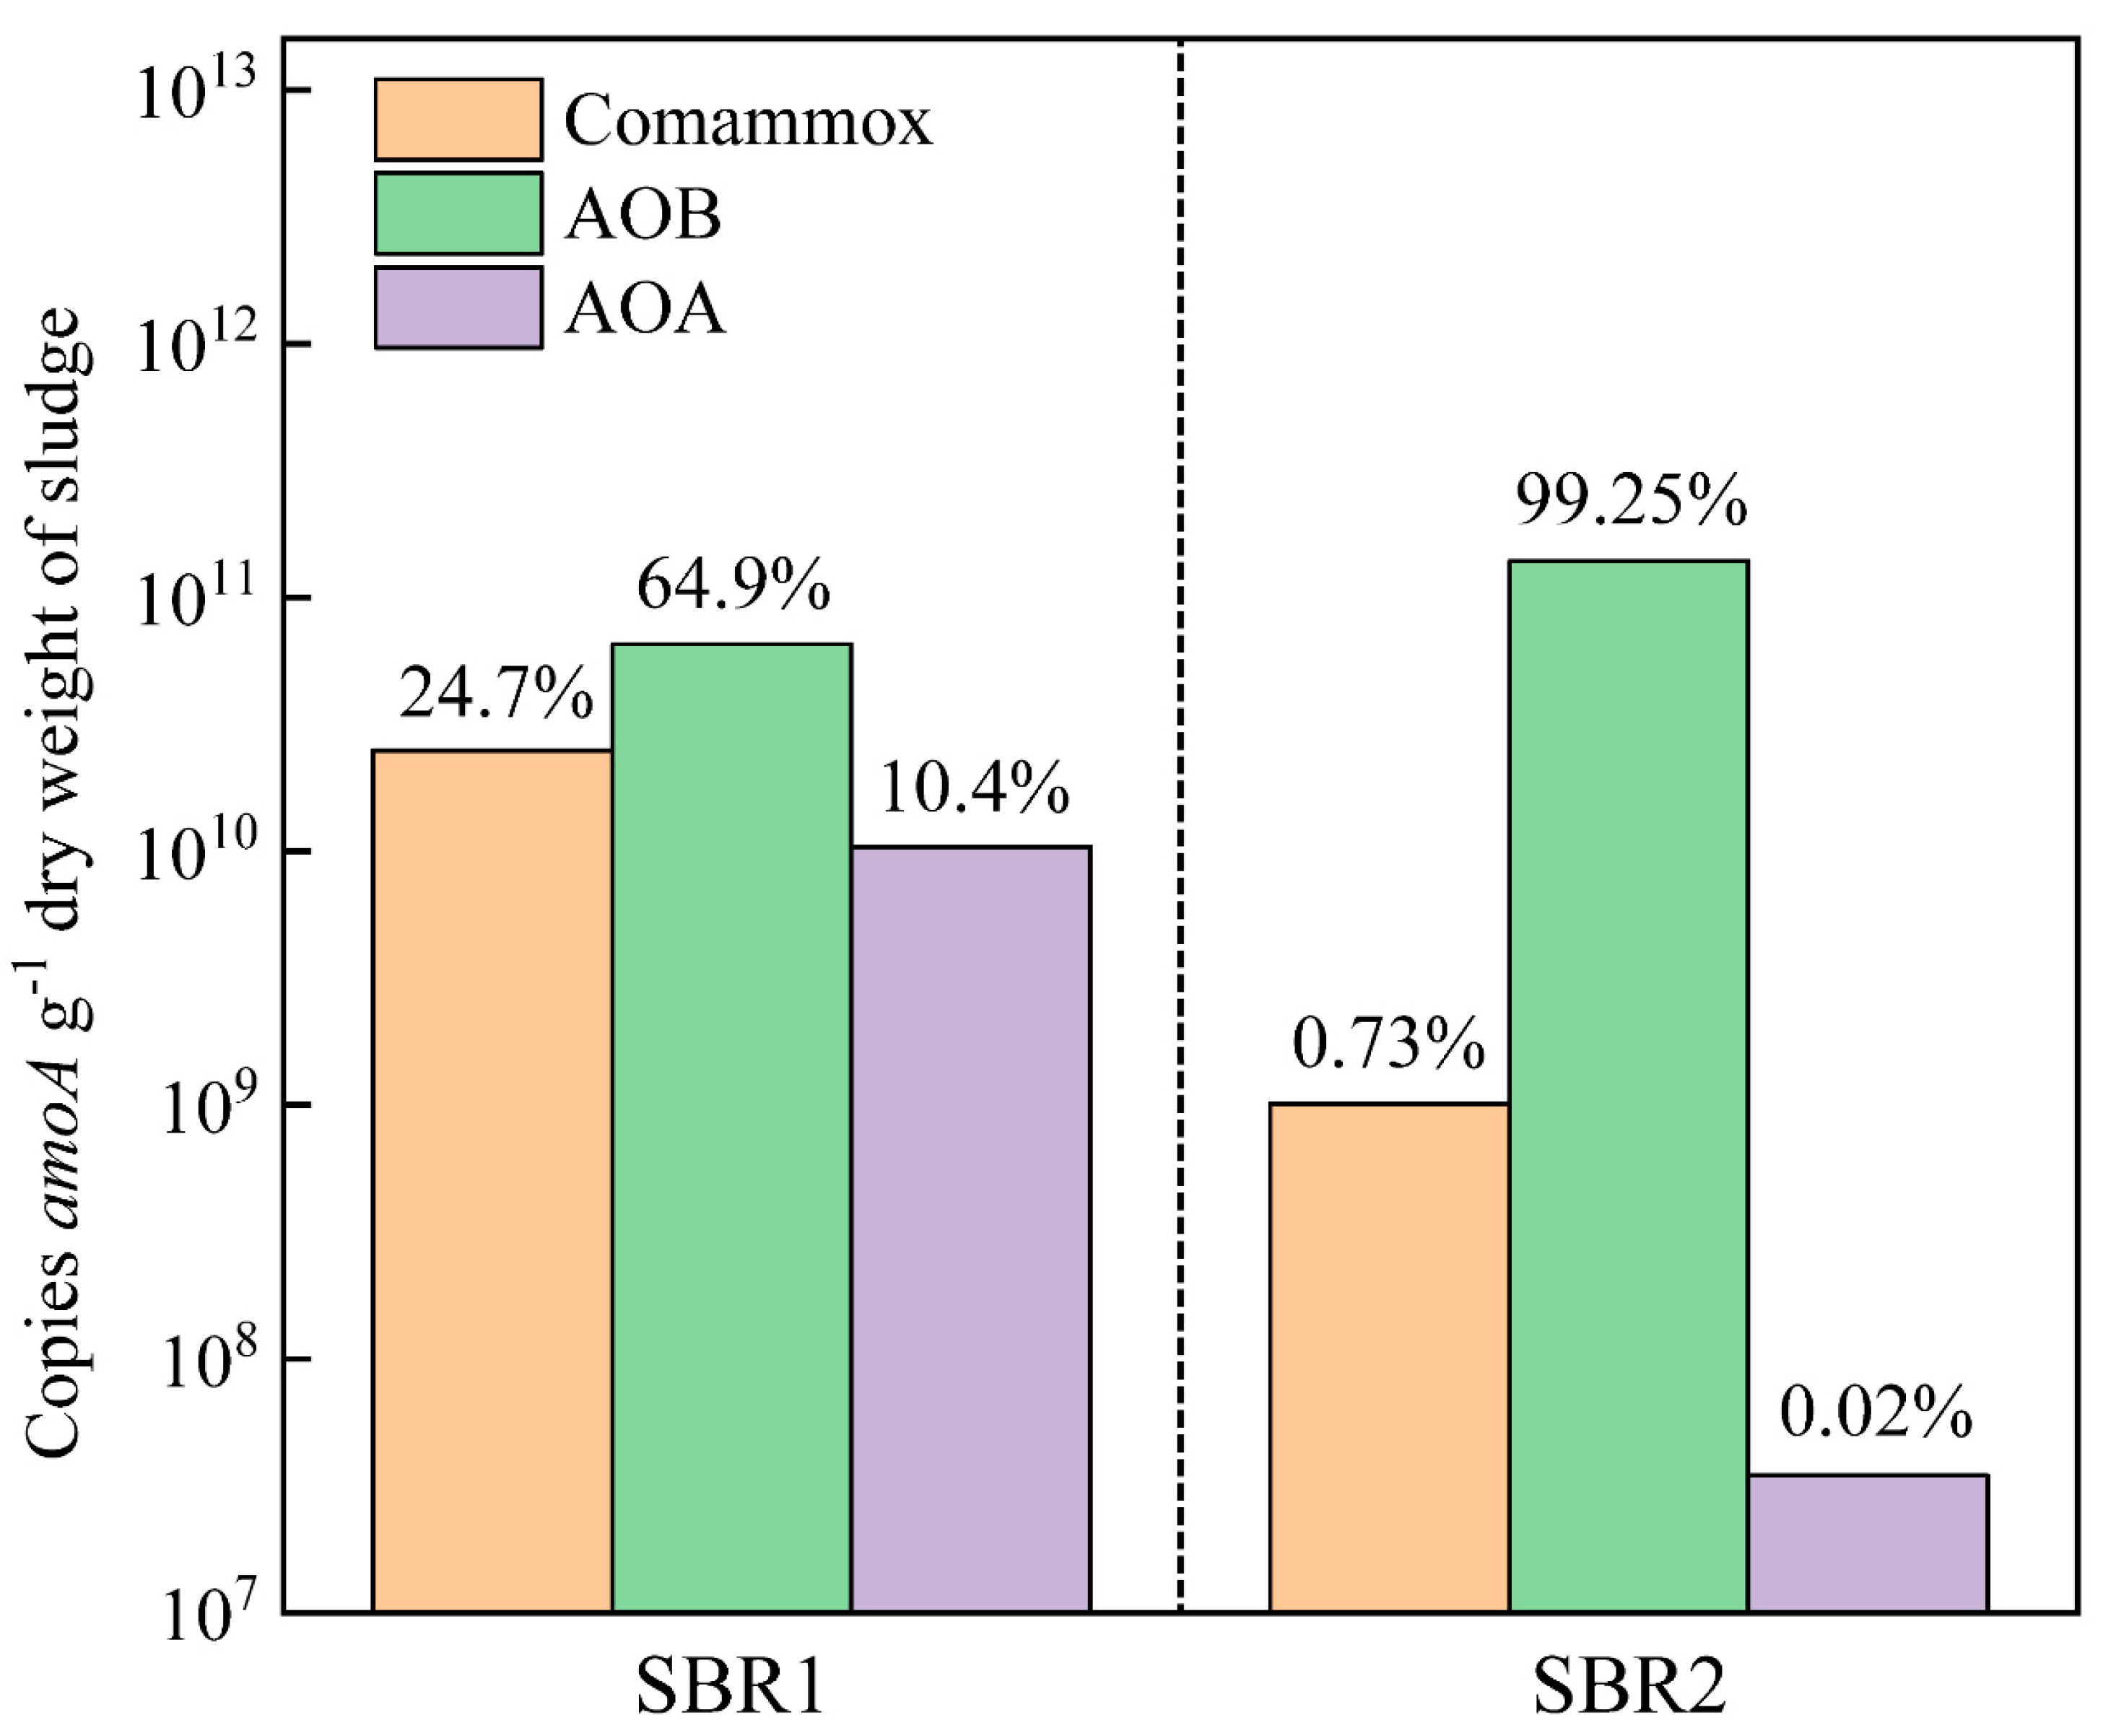
The recent discovery of comammox bacteria as the third aerobic ammonia oxidizer has upended our perceptions of nitrogen cycling globally [14,15]. We quantified the abundances of comammox, AOB and AOA in the activated sludge after the stable performances were achieved for both reactors (Figure 5).
Results showed that the abundance (2.5 × 10¹⁰ copies per gram dry weight) of comammox in SBR1 was 25-fold higher than that (1.0 × 10⁹ copies per gram dry weight) of SBR2, and the proportion (24.7%) of comammox in AOPs of SBR1 was about 35-fold larger than that (0.73%) of SBR2. The proportion (10.4%) of AOA in AOPs of SBR1 was also larger than that (0.02%) of SBR2 but quite lower than that of comammox. The abundance (6.6 × 10¹⁰ copies per gram dry weight) of AOB and its proportion (64.9%) in AOPs of SBR1 were dramatically lower than those (1.4 × 10¹¹ copies per gram dry weight, 99.25%) of SBR2. The dominance of AOB in the AOPs was consistent with that AOB contributed significantly to N2O generation through the ND process during WWTPs [50]. These results also indicated that intermittent aeration could be advantageous for the growth of comammox bacteria and detrimental for AOB proliferation. The observed lower DO conditions of intermittently aerated SBR1 could benefit comammox bacteria, as previous studies have revealed that comammox possessed the reductive tricarboxylic acid cycle and cytochrome bd-like oxidases in their genomes for microaerophilic adaptions [53,54]. Camejo et al. indeed enriched comammox from a low-DO (<0.5 mg/L) bioreactor inoculated with activated sludge [55]. More important, Liu et al. and Kits et al. have demonstrated that comammox bacteria lack NO reductases and emit much less N2O than AOB through the abiotic conversion of NH2OH during nitrification [56,57]. It was also likely that comammox bacteria could compete with AOB by oxidizing -N to -N completely within their own cells [14,15], then reduce the contribution of ND process to N2O emission mainly conducted by AOB who could utilize surrounding -N instead of O2 as the electron acceptor. Although more efforts are still urgently needed, such as batch experiments distinguishing their roles by use of differential inhibitors to cultivate, isotope tracer studies or transcriptomic analysis revealing their functions [58], it still provides a clue that comammox bacteria may play a potential role in the minimization of N2O emission during the intermittent aeration of WWTPs.
4. Conclusions
In summary, the intermittently aerated SBR achieved better nitrogen removal efficiency associated with much lower N2O-emission factors (0.01–0.53% of influent ammonia load) than the continuously aerated SBR. PHAs as the potential inducers of N2O emission were accumulated and consumed lesser in the intermittently aerated SBR. Nitrifier denitrification was the main routine contributing to N2O emissions, while heterotrophic denitrification as the critical sink of N2O was promoted in the intermittently aerated SBR. The high proportion of comammox bacteria highlighted their potential role in the N2O minimization. This work is of significance to understand adopting an intermittent aeration strategy for mitigating N2O emission in wastewater treatment.
Supplementary Materials
The following are available online at https://www.mdpi.com/2073-4441/13/2/210/s1.
Author Contributions
Conceptualization, T.L. and S.L.; methodology, M.Z.; investigation, T.L., S.H. and Z.T.; writing—original draft preparation, T.L. and S.L.; writing—review and editing, T.L., M.Z. and S.L. All authors have read and agreed to the published version of the manuscript.
Funding
This research was funded by the National Natural Science Foundation of China, grant number 41701278, Fundamental Research Funds for the Central Universities, grant number 2019MS041, Shanghai Committee of Science and Technology, grant number 19DZ1204302, and China Postdoctoral Science Foundation, grand number 2019M660333.
Institutional Review Board Statement
Not applicable.
Informed Consent Statement
Not applicable.
Data Availability Statement
The data presented in this study are available on request from the corresponding author.
Acknowledgments
The authors thank the National Natural Science Foundation of China, Fundamental Research Funds for the Central Universities, Shanghai Committee of Science and Technology, and China Postdoctoral Science Foundation for the fundings.
Conflicts of Interest
The authors declare no conflict of interest.
References
- Ravishankara, A.R.; Daniel, J.S.; Portmann, R.W. Nitrous Oxide (N2O): The Dominant Ozone-Depleting Substance Emitted in the 21st Century. Science 2009, 326, 123–125. [Google Scholar] [CrossRef] [Green Version]
- Abbasi, T.; Abbasi, T.; Luithui, C.; Abbasi, S.A. Modelling Methane and Nitrous Oxide Emissions from Rice Paddy Wetlands in India Using Artificial Neural Networks (ANNs). Water 2019, 11, 2169. [Google Scholar] [CrossRef] [Green Version]
- Solomon, S.; Qin, D.; Manning, M.; Chen, Z.; Marquis, M.; Averyt, K.B.; Tignor, M.; Miller, H.L. Climate change 2007 Contribution of Working Group I to the Fourth Assessment Report of the Intergovernmental Panel on Climate Change; IPCC: Cambridge, UK; New York, NY, USA, 2007; p. 996. [Google Scholar]
- Rodriguez-Caballero, A.; Aymerich, I.; Marqués, R.; Poch, M.; Pijuan, M. Minimizing N2O emissions and carbon footprint on a full-scale activated sludge sequencing batch reactor. Water Res. 2015, 71, 1–10. [Google Scholar] [CrossRef]
- Akella, C.; Bhallamudi, S.M. Managing Municipal Wastewater Treatment to Control Nitrous Oxide Emissions from Tidal Rivers. Water 2019, 11, 1255. [Google Scholar] [CrossRef] [Green Version]
- Wunderlin, P.; Mohn, J.; Joss, A.; Emmenegger, L.; Siegrist, H. Mechanisms of N2O production in biological wastewater treatment under nitrifying and denitrifying conditions. Water Res. 2012, 46, 1027–1037. [Google Scholar] [CrossRef]
- Desloover, J.; E Vlaeminck, S.; Clauwaert, P.; Verstraete, W.; Boon, N. Strategies to mitigate N2O emissions from biological nitrogen removal systems. Curr. Opin. Biotechnol. 2012, 23, 474–482. [Google Scholar] [CrossRef] [PubMed]
- Kampschreur, M.J.; Temmink, H.; Kleerebezem, R.; Jetten, M.S.; Van Loosdrecht, M.C. Nitrous oxide emission during wastewater treatment. Water Res. 2009, 43, 4093–4103. [Google Scholar] [CrossRef] [PubMed]
- Chen, H.; Zeng, L.; Wang, D.; Zhou, Y.; Yang, X. Recent advances in nitrous oxide production and mitigation in wastewater treatment. Water Res. 2020, 184, 116168. [Google Scholar] [CrossRef] [PubMed]
- Lu, H.; Chandran, K. Factors promoting emissions of nitrous oxide and nitric oxide from denitrifying sequencing batch reactors operated with methanol and ethanol as electron donors. Biotechnol. Bioeng. 2010, 106, 390–398. [Google Scholar] [CrossRef]
- Liu, D.-H.; Zhong, J.; Zheng, X.-L.; Fan, C.; Yu, J.; Zhong, W. N2O Fluxes and Rates of Nitrification and Denitrification at the Sediment–Water Interface in Taihu Lake, China. Water 2018, 10, 911. [Google Scholar] [CrossRef] [Green Version]
- Zheng, M.; Tian, Y.; Liu, T.; Ma, T.; Li, L.; Li, C.; Ahmad, M.; Chen, Q.; Ni, J. Minimization of nitrous oxide emission in a pilot-scale oxidation ditch: Generation, spatial variation and microbial interpretation. Bioresour. Technol. 2015, 179, 510–517. [Google Scholar] [CrossRef] [PubMed]
- Zheng, M.; Zhou, N.; Liu, S.; Dang, C.; Liu, Y.; He, S.; Zhao, Y.; Liu, W.; Wanga, X. N2O and NO emission from a biological aerated filter treating coking wastewater: Main source and microbial community. J. Clean. Prod. 2019, 213, 365–374. [Google Scholar] [CrossRef]
- Daims, H.; Lebedeva, E.V.; Pjevac, P.; Han, P.; Herbold, C.; Albertsen, M.; Jehmlich, N.; Palatinszky, M.; Vierheilig, J.; Bulaev, A.; et al. Complete nitrification by Nitrospira bacteria. Nature 2015, 528, 504–509. [Google Scholar] [CrossRef] [PubMed]
- Van Kessel, M.A.H.J.; Speth, D.R.; Albertsen, M.; Nielsen, P.H.; Camp, H.J.M.O.D.; Kartal, B.; Jetten, M.S.M.; Lücker, S. Complete nitrification by a single microorganism. Nature 2015, 528, 555–559. [Google Scholar] [CrossRef] [PubMed] [Green Version]
- Zheng, M.; Wang, M.; Zhao, Z.; Zhou, N.; He, S.; Liu, S.; Wang, J.; Wanga, X. Transcriptional activity and diversity of comammox bacteria as a previously overlooked ammonia oxidizing prokaryote in full-scale wastewater treatment plants. Sci. Total Environ. 2019, 656, 717–722. [Google Scholar] [CrossRef]
- Daims, H.; Lücker, S.; Wagner, M. A New Perspective on Microbes Formerly Known as Nitrite-Oxidizing Bacteria. Trends Microbiol. 2016, 24, 699–712. [Google Scholar] [CrossRef]
- Su, Q.; Mark, J.M.; Domingo-Félez, C.; Kiil, A.S.; Thamdrup, B.; Jensen, M.M.; Smets, B.F. Low nitrous oxide production through nitrifier-denitrification in intermittent-feed high-rate nitritation reactors. Water Res. 2017, 123, 429–438. [Google Scholar] [CrossRef] [Green Version]
- Zheng, M.; Zhou, N.; He, S.; Chang, F.; Zhong, J.; Xu, S.; Wang, Z.; Liu, T. Nitrous oxide (N2O) emissions from a pilot-scale oxidation ditch under different COD/N ratios, aeration rates and two shock-load conditions. J. Environ. Manag. 2020, 111657, 111657. [Google Scholar] [CrossRef]
- Guo, N.; Zhang, J.; Wang, S.-G.; Tan, L.-R.; Luo, J.-N.; Tao, Z.-Y.; Wang, S.-G. Effects of the Food-to-Microorganism (F/M) Ratio on N2O Emissions in Aerobic Granular Sludge Sequencing Batch Airlift Reactors. Water 2017, 9, 477. [Google Scholar] [CrossRef] [Green Version]
- Tsutsui, H.; Fujiwara, T.; Matsukawa, K.; Funamizu, N. Nitrous oxide emission mechanisms during intermittently aerated composting of cattle manure. Bioresour. Technol. 2013, 141, 205–211. [Google Scholar] [CrossRef]
- Yu, R.; Kampschreur, M.J.; Van Loosdrecht, M.C.; Chandran, K. Mechanisms and Specific Directionality of Autotrophic Nitrous Oxide and Nitric Oxide Generation during Transient Anoxia. Environ. Sci. Technol. 2010, 44, 1313–1319. [Google Scholar] [CrossRef] [PubMed]
- Ni, B.-J.; Smets, B.F.; Yuan, Z.; I Nàcher, C.P. Model-based evaluation of the role of Anammox on nitric oxide and nitrous oxide productions in membrane aerated biofilm reactor. J. Membr. Sci. 2013, 446, 332–340. [Google Scholar] [CrossRef]
- Yao, S.; Ni, J.; Ma, T.; Li, C. Heterotrophic nitrification and aerobic denitrification at low temperature by a newly isolated bacterium, Acinetobacter sp. HA2. Bioresour. Technol. 2013, 139, 80–86. [Google Scholar] [CrossRef] [PubMed]
- Li, C.; Liu, S.; Ma, T.; Zheng, M.; Ni, J. Simultaneous nitrification, denitrification and phosphorus removal in a sequencing batch reactor (SBR) under low temperature. Chemosphere 2019, 229, 132–141. [Google Scholar] [CrossRef] [PubMed]
- Beaulieu, J.J.; Shuster, W.D.; Rebholz, J.A. Nitrous Oxide Emissions from a Large, Impounded River: The Ohio River. Environ. Sci. Technol. 2010, 44, 7527–7533. [Google Scholar] [CrossRef] [PubMed]
- Tallec, G.; Garnier, J.; Billen, G.; Gousailles, M. Nitrous oxide emissions from secondary activated sludge in nitrifying conditions of urban wastewater treatment plants: Effect of oxygenation level. Water Res. 2006, 40, 2972–2980. [Google Scholar] [CrossRef] [PubMed]
- Wang, M.; Huang, G.; Zhao, Z.; Dang, C.; Liu, W.; Zheng, M. Newly designed primer pair revealed dominant and diverse comammox amoA gene in full-scale wastewater treatment plants. Bioresour. Technol. 2018, 270, 580–587. [Google Scholar] [CrossRef]
- Zeng, R.J.; Lemaire, R.; Yuan, Z. Simultaneous nitrification, denitrification, and phosphorus removal in a lab-scale sequencing batch reactor. Biotechnol. Bioeng. 2003, 84, 170–178. [Google Scholar] [CrossRef]
- Liu, W.; Yang, Q.; Ma, B.; Li, J.; Ma, L.; Wang, S.; Li, J. Rapid Achievement of Nitritation Using Aerobic Starvation. Environ. Sci. Technol. 2017, 51, 4001–4008. [Google Scholar] [CrossRef]
- Ge, S.; Peng, Y.; Qiu, S.; Zhu, A.; Ren, N. Complete nitrogen removal from municipal wastewater via partial nitrification by appropriately alternating anoxic/aerobic conditions in a continuous plug-flow step feed process. Water Res. 2014, 55, 95–105. [Google Scholar] [CrossRef]
- Pan, M.; Chen, T.; Hu, Z.; Zhan, X. Assessment of nitrogen and phosphorus removal in an intermittently aerated sequencing batch reactor (IASBR) and a sequencing batch reactor (SBR). Water Sci. Technol. 2013, 68, 400–405. [Google Scholar] [CrossRef] [PubMed]
- Kornaros, M.; Dokianakis, S.N.; Lyberatos, G. Partial Nitrification/Denitrification Can Be Attributed to the Slow Response of Nitrite Oxidizing Bacteria to Periodic Anoxic Disturbances. Environ. Sci. Technol. 2010, 44, 7245–7253. [Google Scholar] [CrossRef] [PubMed]
- Zhang, M.; Lawlor, P.G.; Li, J.; Zhan, X. Characteristics of Nitrous Oxide (N2O) Emissions from Intermittently-Aerated Sequencing Batch Reactors Treating the Separated Liquid Fraction of Anaerobically Digested Pig Manure. Water Air Soil Pollut. 2011, 223, 1973–1981. [Google Scholar] [CrossRef]
- Zhang, F.; Li, P.; Chen, M.; Wu, J.; Zhu, N.; Wu, P.; Chiang, P.; Hu, Z. Effect of operational modes on nitrogen removal and nitrous oxide emission in the process of simultaneous nitrification and denitrification. Chem. Eng. J. 2015, 280, 549–557. [Google Scholar] [CrossRef]
- Kong, Q.; Zhang, J.; Miao, M.; Tian, L.; Guo, N.; Liang, S. Partial nitrification and nitrous oxide emission in an intermittently aerated sequencing batch biofilm reactor. Chem. Eng. J. 2013, 217, 435–441. [Google Scholar] [CrossRef]
- Sun, Y.; Wang, H.; Wu, G.; Guan, Y. Nitrogen removal and nitrous oxide emission from a step-feeding multiple anoxic and aerobic process. Environ. Technol. 2017, 39, 814–823. [Google Scholar] [CrossRef] [PubMed]
- Wang, H.; Guan, Y.; Pan, M.; Wu, G. Aerobic N2O emission for activated sludge acclimated under different aeration rates in the multiple anoxic and aerobic process. J. Environ. Sci. 2016, 43, 70–79. [Google Scholar] [CrossRef]
- Pan, M.; Wen, X.; Wu, G.; Zhang, M.; Zhan, X. Characteristics of nitrous oxide (N2O) emission from intermittently aerated sequencing batch reactors (IASBRs) treating slaughterhouse wastewater at low temperature. Biochem. Eng. J. 2014, 86, 62–68. [Google Scholar] [CrossRef]
- Sun, Y.; Guan, Y.; Pan, M.; Zhan, X.; Hu, Z.; Wu, G. Enhanced biological nitrogen removal and N2O emission characteristics of the intermittent aeration activated sludge process. Rev. Environ. Sci. Biotechnol. 2017, 16, 761–780. [Google Scholar] [CrossRef]
- Cruz-Bournazou, M.N.; Hooshiar, K.; Arellano-Garcia, H.; Wozny, G.; Lyberatos, G. Model based optimization of the intermittent aeration profile for SBRs under partial nitrification. Water Res. 2013, 47, 3399–3410. [Google Scholar] [CrossRef]
- Salem, S.; Moussa, M.; Van Loosdrecht, M.C. Determination of the decay rate of nitrifying bacteria. Biotechnol. Bioeng. 2006, 94, 252–262. [Google Scholar] [CrossRef] [PubMed]
- Schreiber, F.; Loeffler, B.; Polerecky, L.; Kuypers, M.M.M.; De Beer, D. Mechanisms of transient nitric oxide and nitrous oxide production in a complex biofilm. ISME J 2009, 3, 1301–1313. [Google Scholar] [CrossRef] [PubMed] [Green Version]
- Liu, S.; Chen, Q.; Ma, T.; Wang, M.; Ni, J. Genomic insights into metabolic potentials of two simultaneous aerobic denitrification and phosphorus removal bacteria, Achromobacter sp. GAD3 and Agrobacterium sp. LAD9. FEMS Microbiol. Ecol. 2018, 94, fiy020. [Google Scholar] [CrossRef] [PubMed]
- Conthe, M.; Lycus, P.; Arntzen, M.Ø.; Da Silva, A.R.; Frostegård, Å.; Bakken, L.R.; Kleerebezem, R.; Van Loosdrecht, M.C. Denitrification as an N2O sink. Water Res. 2019, 151, 381–387. [Google Scholar] [CrossRef]
- Yang, S.; Yang, F. Nitrogen removal via short-cut simultaneous nitrification and denitrification in an intermittently aerated moving bed membrane bioreactor. J. Hazard. Mater. 2011, 195, 318–323. [Google Scholar] [CrossRef]
- Ribera-Guardia, A.; Marques, R.; Arangio, C.; Carvalheira, M.; Oehmen, A.; Pijuan, M. Distinctive denitrifying capabilities lead to differences in N2O production by denitrifying polyphosphate accumulating organisms and denitrifying glycogen accumulating organisms. Bioresour. Technol. 2016, 219, 106–113. [Google Scholar] [CrossRef] [Green Version]
- Zhou, Y.; Lim, M.; Harjono, S.; Ng, W.J. Nitrous oxide emission by denitrifying phosphorus removal culture using polyhydroxyalkanoates as carbon source. J. Environ. Sci. 2012, 24, 1616–1623. [Google Scholar] [CrossRef]
- Kampschreur, M.J.; Tan, N.C.G.; Kleerebezem, R.; Picioreanu, C.; Jetten, M.S.M.; Van Loosdrecht, M.C.M. Effect of Dynamic Process Conditions on Nitrogen Oxides Emission from a Nitrifying Culture. Environ. Sci. Technol. 2008, 42, 429–435. [Google Scholar] [CrossRef]
- Caranto, J.D.; Vilbert, A.C.; Lancaster, K.M. Nitrosomonas europaeacytochrome P460 is a direct link between nitrification and nitrous oxide emission. Proc. Natl. Acad. Sci. USA 2016, 113, 14704–14709. [Google Scholar] [CrossRef] [Green Version]
- Jia, W.; Liang, S.; Zhang, J.; Ngo, H.H.; Guo, W.; Yan, Y.; Zou, Y. Nitrous oxide emission in low-oxygen simultaneous nitrification and denitrification process: Sources and mechanisms. Bioresour. Technol. 2013, 136, 444–451. [Google Scholar] [CrossRef]
- Wrage-Mönnig, N.; Horn, M.A.; Well, R.; Müller, C.; Velthof, G.; Oenema, O. The role of nitrifier denitrification in the production of nitrous oxide revisited. Soil Biol. Biochem. 2018, 123, A3–A16. [Google Scholar] [CrossRef]
- E Lawson, C.; Lücker, S. Complete ammonia oxidation: An important control on nitrification in engineered ecosystems? Curr. Opin. Biotechnol. 2018, 50, 158–165. [Google Scholar] [CrossRef] [PubMed]
- Palomo, A.; Pedersen, A.G.; Fowler, S.J.; Dechesne, A.; Sicheritz-Pontén, T.; Smets, B.F. Comparative genomics sheds light on niche differentiation and the evolutionary history of comammox Nitrospira. ISME J. 2018, 12, 1779–1793. [Google Scholar] [CrossRef] [PubMed] [Green Version]
- Camejo, P.Y.; Domingo, J.S.; McMahon, K.D.; Noguera, D.R. Genome-Enabled Insights into the Ecophysiology of the Comammox Bacterium “Candidatus Nitrospira nitrosa”. mSystems 2017, 2, e00059-17. [Google Scholar] [CrossRef] [Green Version]
- Liu, S.; Han, P.; Hink, L.; Prosser, J.I.; Wagner, M.; Brüggemann, N. Abiotic Conversion of Extracellular NH2OH Contributes to N2O Emission during Ammonia Oxidation. Environ. Sci. Technol. 2017, 51, 13122–13132. [Google Scholar] [CrossRef] [Green Version]
- Kits, K.D.; Jung, M.-Y.; Vierheilig, J.; Pjevac, P.; Sedlacek, C.J.; Liu, S.; Herbold, C.; Stein, L.Y.; Richter, A.; Wissel, H.; et al. Low yield and abiotic origin of N2O formed by the complete nitrifier Nitrospira inopinata. Nat. Commun. 2019, 10, 1–12. [Google Scholar] [CrossRef]
- Liu, S.; Wang, H.; Chen, L.; Wang, J.; Zheng, M.; Liu, S.; Chen, Q.; Ni, J. Comammox Nitrospira within the Yangtze River continuum: Community, biogeography, and ecological drivers. ISME J. 2020, 14, 2488–2504. [Google Scholar] [CrossRef]
Figure 1.
Daily monitored nitrogen removal performances (a,b) and gas emissions (c,d) of both sequencing batch reactors (SBRs) during the startup and long-term operation period. The nitrous oxide (N2O) and nitric oxide (NO) generation rates were profiled since the 50 d after the startup.
Figure 1.
Daily monitored nitrogen removal performances (a,b) and gas emissions (c,d) of both sequencing batch reactors (SBRs) during the startup and long-term operation period. The nitrous oxide (N2O) and nitric oxide (NO) generation rates were profiled since the 50 d after the startup.

Figure 2.
Performance evaluations in a typical cycle of both SBRs: (a,b) variations of -N, -N and -N concentrations; (c,d) variations of N2O and NO emission rates, and dissolved N2O concentrations; (e,f) variations of dissolved oxygen (DO) and pH; (g,h) variations of polyhydroxyalkanoates (PHA, including poly-β-hydroxybutyrate (PHB) and polyhydroxy valerate (PHV)) contents.

Figure 3.
N2O and NO emission rates during each 30-min period of different biological processes in batch experiments: (a,b) from both ND and HD processes; (c,d) solely from the HD process; (e,f) solely from the ND process.
Figure 3.
N2O and NO emission rates during each 30-min period of different biological processes in batch experiments: (a,b) from both ND and HD processes; (c,d) solely from the HD process; (e,f) solely from the ND process.

Figure 4.
Nitrogen reduction (a–c) and N2O/NO emission rates (d,e) under different electron acceptors (-N, -N and N2O-N) utilized in batch experiments.
Figure 4.
Nitrogen reduction (a–c) and N2O/NO emission rates (d,e) under different electron acceptors (-N, -N and N2O-N) utilized in batch experiments.

Figure 5.
Abundances of amoA genes from comammox, ammonia-oxidizing bacteria (AOB) and ammonia-oxidizing archaea (AOA) in activated sludge samples of both SBRs. Percentages of comammox, AOB and AOA in ammonia-oxidizing prokaryotes (AOPs) were displayed above the corresponding columns.
Figure 5.
Abundances of amoA genes from comammox, ammonia-oxidizing bacteria (AOB) and ammonia-oxidizing archaea (AOA) in activated sludge samples of both SBRs. Percentages of comammox, AOB and AOA in ammonia-oxidizing prokaryotes (AOPs) were displayed above the corresponding columns.


Table 1.
N2O-emission factors in various intermittently aerated systems.
| Configurations | Wastewater Types | N2O Emission Factor | References |
|---|---|---|---|
| Intermittently aerated SBR | Separated liquid fraction of anaerobically digested pig manure | 15.6% | [34] |
| Intermittently aerated SBR | Synthetic wastewater simulating the separated liquid fraction of anaerobically digested pig manure with a higher 5-day biochemical oxygen demand (BOD5) concentration | 10.1% | [34] |
| Sequencing batch air-lift reactor (SBAR) with anoxic-aerobic modes | Synthetic wastewater simulating municipal wastewater | 7.0 ± 1.6% | [35] |
| Intermittently aerated full-scale activated sludge SBR | Domestic wastewater | 6.8% | [4] |
| Intermittently aerated sequencing batch biofilm reactor (SBBR) | Synthetic ammonia-rich wastewater | 1.5 ± 0.2% | [36] |
| Step-feeding multiple A/O SBR | Synthetic wastewater simulating municipal wastewater | 4.4% | [37] |
| One-feeding multiple A/O SBR | Synthetic wastewater simulating municipal wastewater | 4.7% | [37] |
| Multiple A/O SBR | Synthetic wastewater simulating municipal wastewater | 2.3–10.1% | [38] |
| Intermittently aerated SBR | Slaughterhouse wastewater | 5.7–11.0% | [39] |
| Intermittently aerated SBR | Synthetic wastewater simulating municipal wastewater | 0.01–0.53% (0.19% on average) | This study |
Table 2.
N2O and NO emission rates and factors of different biological processes in batch experiments.
Table 2.
N2O and NO emission rates and factors of different biological processes in batch experiments.
| Experiment No. | Seed Sludge | Conditions | SBR1 | SBR2 | ||
|---|---|---|---|---|---|---|
| N2O/NO Emission Rates (μg h−1) | N2O/NO Emission Factors (%) | N2O/NO Emission Rates (μg h−1) | N2O/NO Emission Factors (%) | |||
| 1 | Anoxic phase | +nitrite a | 106.52/0.30 | 2.79/0.0079 | 280.83/0.33 | 11.41/0.0134 |
| 2 | Anoxic phase | +nitrite/+inhibitors b | 90.43/0.10 | 1.98/0.0034 | 305.69/0.08 | 8.65/0.0036 |
| 3 | Aerobic phase | +ammonia/+nitrite c | 281.02/0.41 | 6.47/0.0151 | 555.48/0.80 | 13.45/0.0308 |
a simultaneous ND and HD processes. b Solely from the HD process. c Solely from the ND process.
Publisher’s Note: MDPI stays neutral with regard to jurisdictional claims in published maps and institutional affiliations. |
© 2021 by the authors. Licensee MDPI, Basel, Switzerland. This article is an open access article distributed under the terms and conditions of the Creative Commons Attribution (CC BY) license (http://creativecommons.org/licenses/by/4.0/).
Share and Cite
MDPI and ACS Style
Liu, T.; Liu, S.; He, S.; Tian, Z.; Zheng, M. Minimization of N2O Emission through Intermittent Aeration in a Sequencing Batch Reactor (SBR): Main Behavior and Mechanism. Water 2021, 13, 210. https://doi.org/10.3390/w13020210
AMA Style
Liu T, Liu S, He S, Tian Z, Zheng M. Minimization of N2O Emission through Intermittent Aeration in a Sequencing Batch Reactor (SBR): Main Behavior and Mechanism. Water. 2021; 13(2):210. https://doi.org/10.3390/w13020210
Chicago/Turabian StyleLiu, Tang, Shufeng Liu, Shishi He, Zhichao Tian, and Maosheng Zheng. 2021. "Minimization of N2O Emission through Intermittent Aeration in a Sequencing Batch Reactor (SBR): Main Behavior and Mechanism" Water 13, no. 2: 210. https://doi.org/10.3390/w13020210
Note that from the first issue of 2016, this journal uses article numbers instead of page numbers. See further details here.