Aquatic Ecosystem Health Assessment of Poyang Lake through Extension Evaluation Method

1
School of Environmental Science, Nanjing Xiaozhuang University, Nanjing 211171, China
2
Key Laboratory of Watershed Geographic Sciences, Nanjing Institute of Geography and Limnology, Chinese Academy of Sciences, Nanjing 210008, China
*
Authors to whom correspondence should be addressed.
Water 2021, 13(2), 211; https://doi.org/10.3390/w13020211
Submission received: 1 December 2020
/
Revised: 12 January 2021
/
Accepted: 13 January 2021
/
Published: 17 January 2021
(This article belongs to the Section Water Quality and Contamination)
Abstract
:Freshwater lakes encounter a series of problems, such as a decline in lake water quality, a sharp decrease in biodiversity, and ecological degradation. As such, lacustrine studies by highly skilled professionals and managers with water resources at home and abroad have focused on assessing the aquatic ecosystem health status of lakes. In this study, the health status of the aquatic ecosystem in the largest freshwater lake in China (Poyang Lake) was assessed, and its temporal and spatial characteristics were illustrated. The index contained three element layers, including hydrologic characteristics, trophic status, and aquatic organisms. The health status of the aquatic ecosystem was classified into three categories: ‘good’, ‘moderate’ (subhealthy), and ‘bad’. It was examined through extension evaluation method. Results showed ‘moderate’ health status, whereas remarkable seasonal and spatially variations. The annual changes in the health status were remarkably due to the influence of complex hydrological and hydrodynamic conditions. This study provides an overall understanding of the aquatic ecosystem evaluation in Poyang Lake. Such an understanding is vital for environmental conservation and identification of causes of the aquatic ecosystem degradation in Poyang Lake.
1. Introduction
Lakes, one of the aquatic ecosystems, are critical elements of Earth’s dynamic processes and essential to human economies and health [1]. However, because of human activities (e.g., increased pollution) and climate change, freshwater lakes have encountered a series of problems, such as decline of lake water quality and remarkable reduction in biodiversity and ecological degradation in recent years [2]. Such ecological deterioration poses a threat to the use of water resources, particularly drinking water supply and economic development [3,4]. Thus, the lake aquatic ecosystem health evaluation has been a focus of lacustrine studies among domestic and overseas researchers and water resource managers [5,6,7]. Since the 1980s, the health status of lake aquatic ecosystems have been explored through lacustrine studies by highly skilled professionals and managers with water resources at home and abroad. Several attempts have been made to assess them, such as in studies of Lake Chaohu [8], Baiyangdian Lake [9], Lake Erie [10], and Lake Poyang [11,12]. The structure and function of a lake ecosystem are greatly controlled by its hydrology, geology, land cover, and climate characteristics, but assessing its actual health status is quite difficult; thus, the relative ecosystem health status has been evaluated in some lake ecosystems, including Lake Chaohu [8] and Baiyangdian Lake [9]. In the assessment of the health of lake aquatic ecosystems, complexities and uncertainties are intrinsic problems [13]. This situation is especially true in large floodplain lakes, which are unique systems with periodic hydrological connections and whose ecological status is influenced not only by local agriculture and industries but also by water-level alterations with the seasons. Besides, large floodplain lakes might exhibit large temporal and spatial heterogeneity of aquatic ecosystem status. An extension evaluation method combined with fuzzy matter element theory and an extension set was used to solve contradictory problems (e.g., health assessment of lake aquatic ecosystems) from qualitative and quantitative points of view. With the development of the matter element concept [14], the extension evaluation method based on extension set has gradually been developed and had an increasingly wide use in many fields [15,16]. However, its application in the assessment of the health of lake aquatic ecosystems is seldom reported. Such evaluation could be effective and helpful for ecologists who handle the complexities and uncertainties of evaluating this parameter. Thus, extension evaluation method and variable weights should be explored in order to examine the health condition of lake aquatic ecological ecosystems.
Poyang Lake, the largest freshwater lake in China, is one of the two remaining lakes freely connected to the middle of Yangtze River [4]. However, it has experienced drastic hydrological changes, such as spring drought and lowest water level in winter, which both have given rise to considerable damage hydrologically, biologically, and ecologically to the region [17]. Spring drought has significant effects on fish, Poyang Lake waterbirds and wetlands [18,19]. These problems have caused a great concern to local governments and ecologists [4,20]. Various management strategies are being proposed and discussed to resolve the dryness of Poyang Lake and minimize the impacts on local socioeconomic development and ecological functions [21,22]. However, no systematic and comprehensive aquatic ecosystem assessment of Poyang Lake based on biological elements and supporting physicochemical and hydromorphological elements. Aquatic ecosystem health assessment provides a theoretical foundation for identifying the causations of ecological degradation and protecting the environment in Poyang Lake; it could help to the maintenance of a virtuous cycle of lake ecosystems. Therefore, temporal and spatial variation of the aquatic ecosystem health status in Poyang Lake should be assessed.
In this study, the aquatic ecosystem health status in Poyang Lake was assessed via an extension evaluation method. Firstly, this study proposed an index system and determined the assessment indicators thresholds for ecosystem health assessment on the basis of previous studies and the major characteristics of Poyang Lake. Secondly, this study applied the extension evaluation method to evaluate the health status of the aquatic ecosystem in Poyang Lake. The results could provide a new theoretical and technical approach for the assessment of the health status of the aquatic ecosystem in this Lake. The approach also could help protect the aquatic ecology and maintain the wetland security and its biodiversity. Overall, this study provided a theoretical foundation for understanding the status of the aquatic ecosystem in Poyang Lake and identifying the causes of its health degeneration, which is crucial for ecosystem health management in this lake. In addition, it also enhances the knowledge base underlying aquatic ecosystem health assessments of river-connected lakes worldwide.
2. Materials and Methods
2.1. Study Area
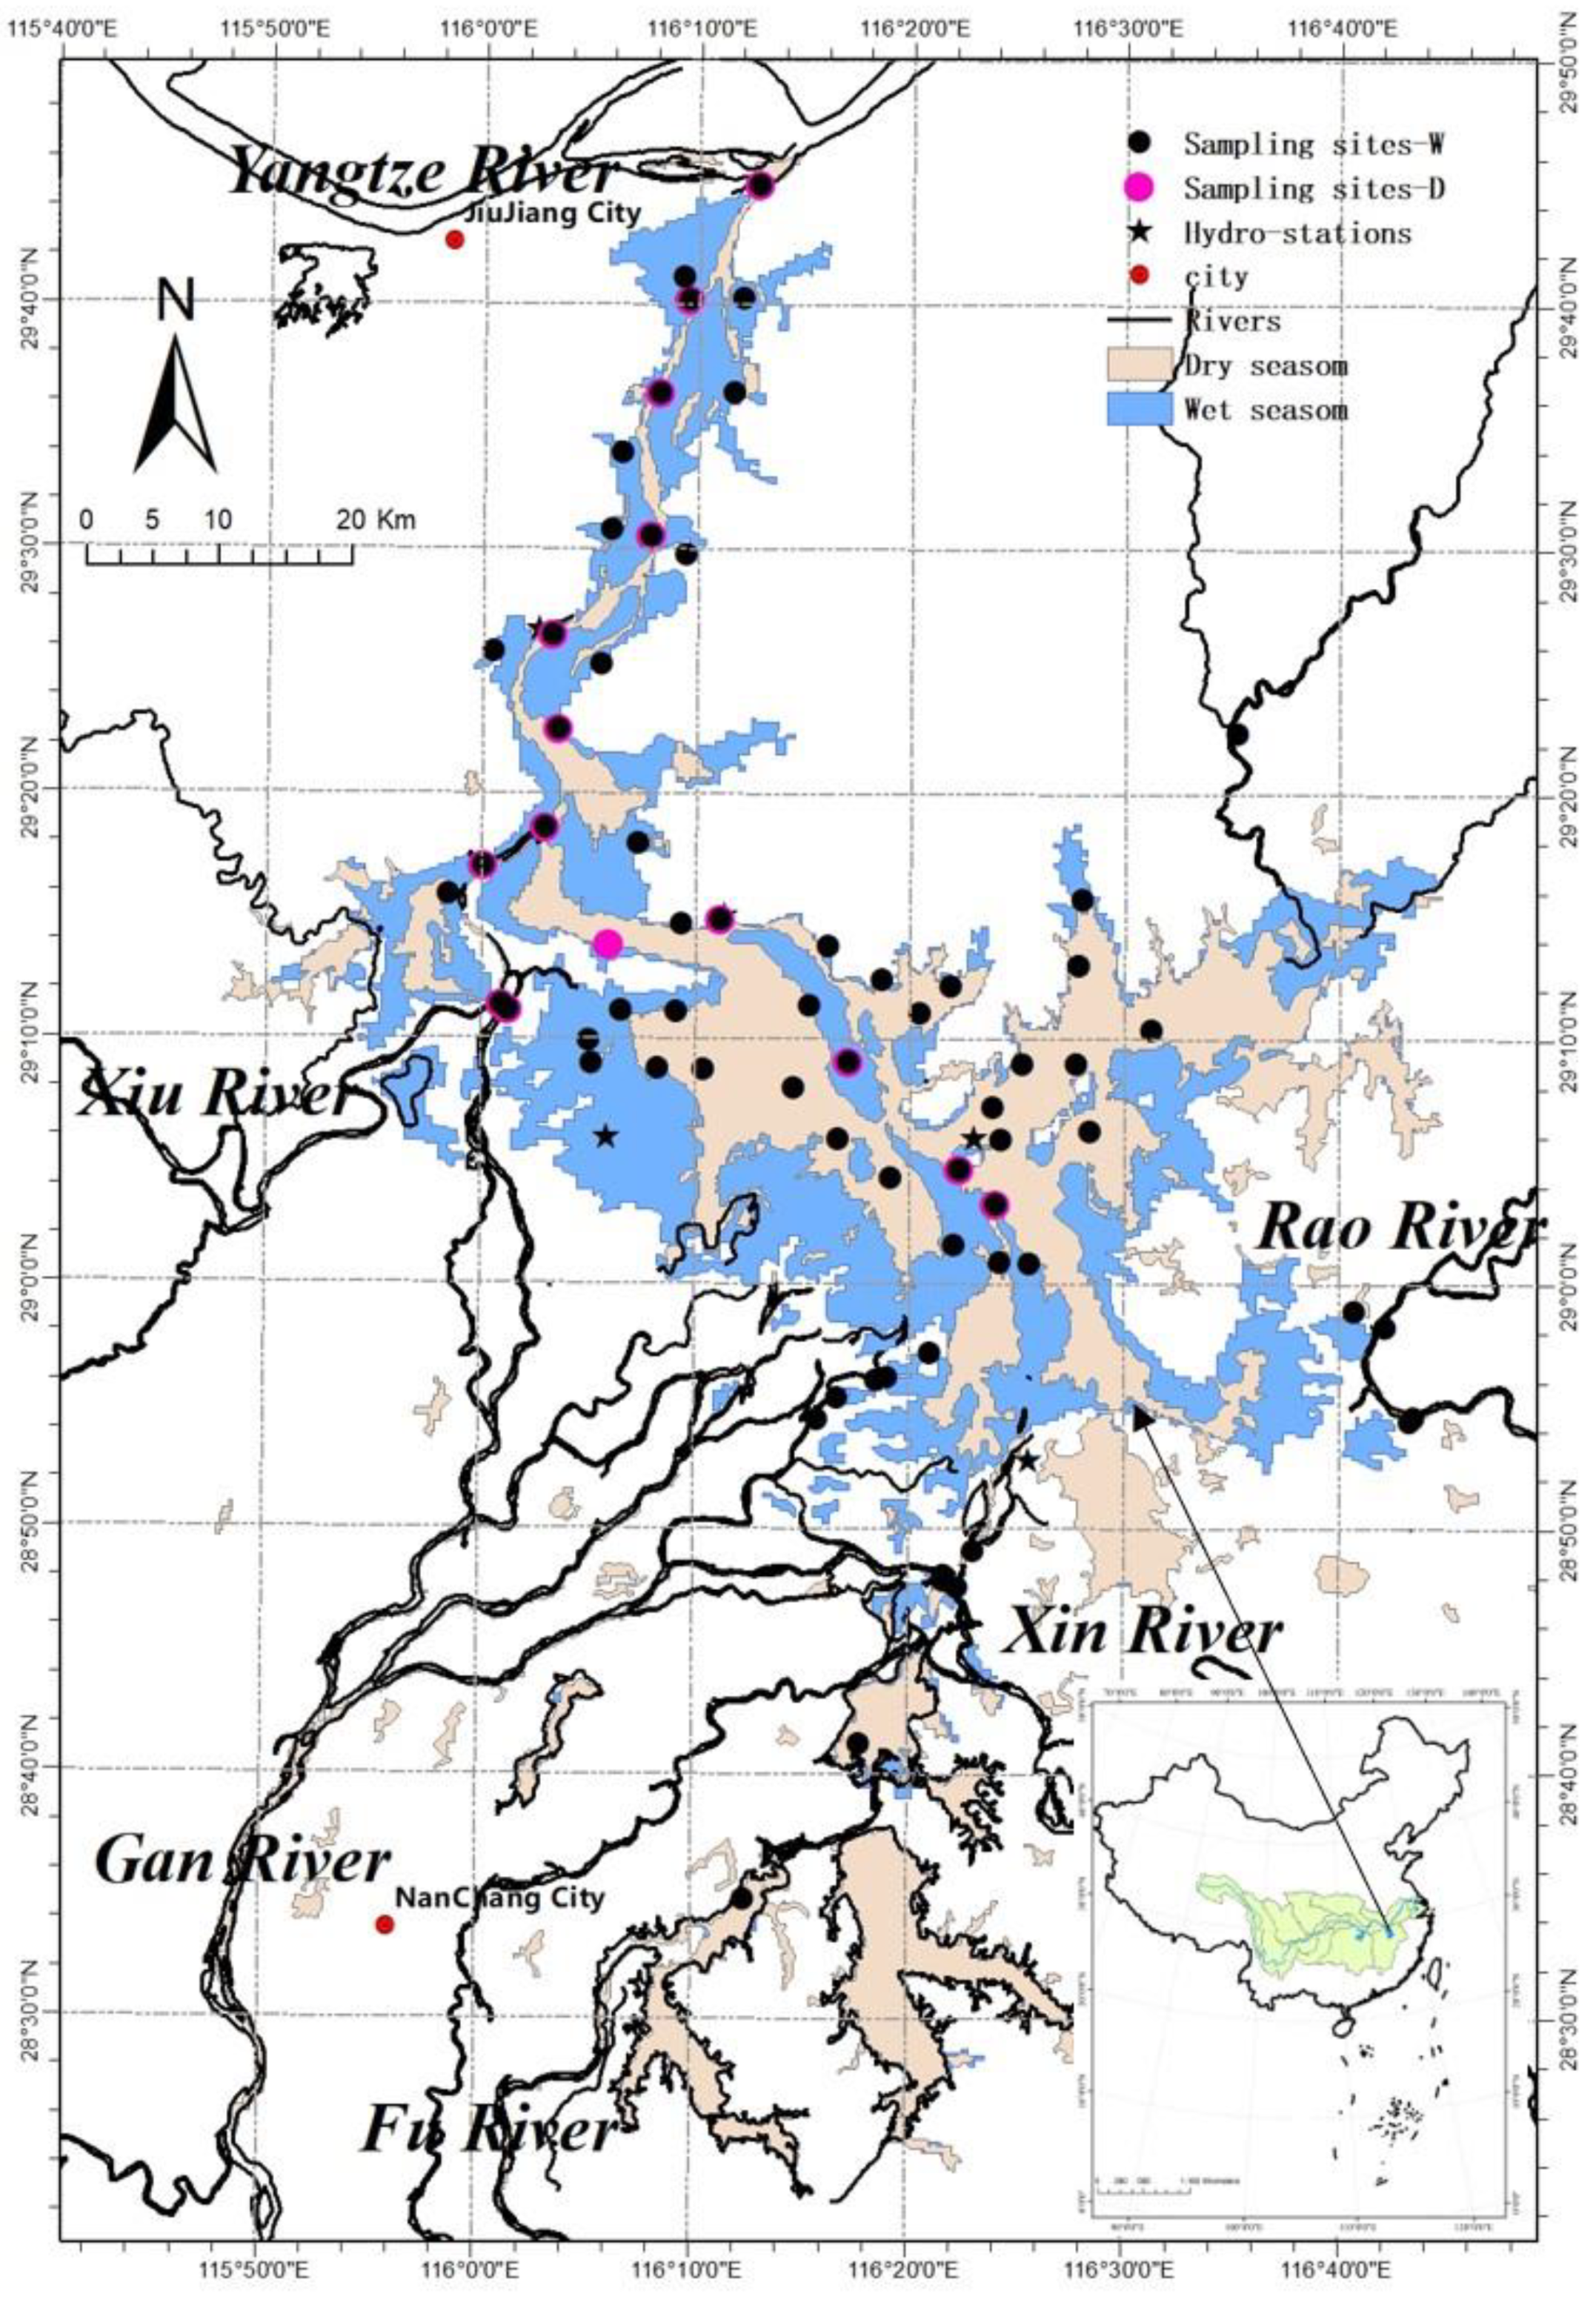
Poyang Lake (28°22′–29°45′ N, 115°47′–116°45′ E), the largest natural freshwater lake in China, is located downstream of the Yangtze River in Jiangxi Province and freely connected to the longest river in China, the Yangtze River [23] (Figure 1). The lake has a southeast monsoonal climate, with an annual mean air temperature of 16 °C–18 °C and an average annual precipitation of 1340–1780 mm. Poyang Lake is considered to be a vital resource not only for the local population but also the Yangtze valley and the whole world ecology. However, the sustainability of Poyang Lake is threatened by pollution, dredging and eutrophication according to reports. It has a watershed area of 162,000 km2 [23]. Considering that this lake is naturally connected to the Yangtze River in China, it has a series of complicated and unique hydrological and biochemical characteristics [24]. The surface area of Poyang Lake changes greatly with season. The lake surface area could be more than 4000 km2 in the wet season (summer), while in the comparatively dry season (winter), the lake surface elevation decreases and the lake area typically shrinks to less than 1000 km2 [25]. On average, Poyang Lake is 8 m deep and has significant variation. With rapid development, urbanization and global climate change, large amounts of pollutants are continuously discharged into the lake through rivers; thus, eutrophication becomes the most important pressing problem in Poyang Lake [26]. This phenomenon could seriously affect the ecological functioning and water quality of this lake, such as the existence of algal blooms, thereby causing a significant decline in biodiversity and ecological degradation [27].
2.2. Data Sources
The obtained data are summarized in Table 1. The biological and physicochemical data from October 2007 to October 2013 were gathered from the Lake Poyang Laboratory for Wetland Ecosystem Research (PLWER), while the data from 1999 were acquired from previous studies [28,29]. A total of 68 sites (Figure 1) only sites 1–15 were sampled in four seasons, while the others were sampled in the wet season. For each site, eight parameters were measured: total nitrogen (TN), Chlorophyll a (Chl-a), total phosphorus (TP), cyanobacterial biomass concentration (CB), chemical oxygen demand (CODMn), diatom biomass concentration (DB), macrozoobenthic density and Secchi disk depth (SD). The hydrological data from 1999, 2007, 2008, 2012, and 2013 were collected from Jiangxi Hydrological Bureau, including seven hydrological sites: Xingzi, Hukou, Duchang, Kangshan, Wucheng, Tangyin, and Boyang (Figure 1).
2.3. Aquatic Ecosystem Assessment Indicators and Thresholds
The aquatic ecosystem health of a lake should be assessed in terms of the status of biological elements and supporting physicochemical and hydromorphological elements [30]. Therefore, in accordance with references [7] and the major characteristics of Poyang lake, the index system for the aquatic ecosystem health assessment in Poyang Lake was established and the assessment indicator thresholds were determined. The index contained three element layers, namely hydrologic characteristics, trophic status, and aquatic organisms. The six indicators (Figure 2) were as follows: lowest water-level anomaly in the dry season (LWLa-D), mean water-level anomaly during the rising season (MWLa-R), trophic state index (TLI), ratio of CB to DB, diversity index of macrozoobenthos (DI) and biological index (BI). The calculation method for BI, DI and TLI was according to references [7,31]. LWLa-D was calculated by the lowest water level in the period of December–March, subtracting the lowest water level mean over multiple years during the dry season. MWLa-R equals the mean water level in April–May minus the mean water level over multiple years during the rising season. In accordance with [7], the assessment indicators thresholds (Table 2) were determined based on empirical method, frequency analysis, specification standards and so on. Thus, the health status of the aquatic ecosystem in Poyang lake was divided into three categories: ‘good’, ‘moderate (sub-healthy)’ and ‘poor’.
2.4. Extension Evaluation Method
2.4.1. Matter Elements
The concept of matter elements was described in detail in a previous study [14]. For conciseness and comprehensiveness, below presents simplified and relevant related notations.
Consider N as a site name and C as a character name related with a quantity V. Then is called a matter element. This expression indicates that site N has n characters C1, C2, …, Cn with the corresponding quantities V1, V2, …, Vn, respectively. Then, R is known as n-dimensional matter elements denoted by
2.4.2. Assessment Steps of Extension Evaluation Method
- (1)
- Verification of the assessed objects , criterion and maximum ranges of attributes
For the health status of the aquatic ecosystem, the intervals are generally a representative of quantities. The symbol should be used to denote the intervals, where and (i = 1,2, …n and j = 1,2, …m) are the lower and upper bounds of the attribute i for grade j, respectively. The maximum ranges of attributes are expressed as
This study aimed to classify Poyang Lake with for the attribute (i = 1, 2, …, n) with regard to the grade values of the health status of the ecosystem in terms of defined above. In view of matter element, the lake sampling site is written as
where p could be the name of water body where the sample was taken.
- (2)
- Computation of the extension weights with primary correlative function
The primary correlative function of point x to interval is defined as
where () and
If a larger value in corresponds to a higher grade, then
If a larger value in Ci corresponds to a lower grade, then
The weight for attribute is given by
- (3)
- Calculation the correlative degree
is computed using Equations (5) and (6). The evaluation grade for each object could be determined in accordance with the maximum correlative degree principle.
- (4)
- Determination of the evaluation grade
The evaluation grades and were determined using Equations (7) and (8).
If then the object Kx belongs to the standard level of the health of the aquatic ecosystem.
was determined to characterize the health status tendency of the aquatic ecosystem. The more positive the value is, the higher the tendency grade; the more negative the value is, the lower the tendency grade. If is 2 and is 2.4, is 0.4. Therefore, the accurate health status of the aquatic ecosystem of the site is 2.4, belonging to grade 2 with a tendency of grade 3. Grades 1, 2 and 3 represent ‘good’, ‘moderate’ and ‘bad’, respectively.
3. Results
3.1. Overall Health Status of Aquatic Ecosystem in the Lake
In accordance with the data and feature of Poyang Lake, the inter-annual average values of biological and physicochemical parameters of 15 sites in four seasons (January, April, July, and October) in 2013 were calculated for the entire Poyang Lake to gain a broadened understanding of the overall aquatic ecosystem health status.
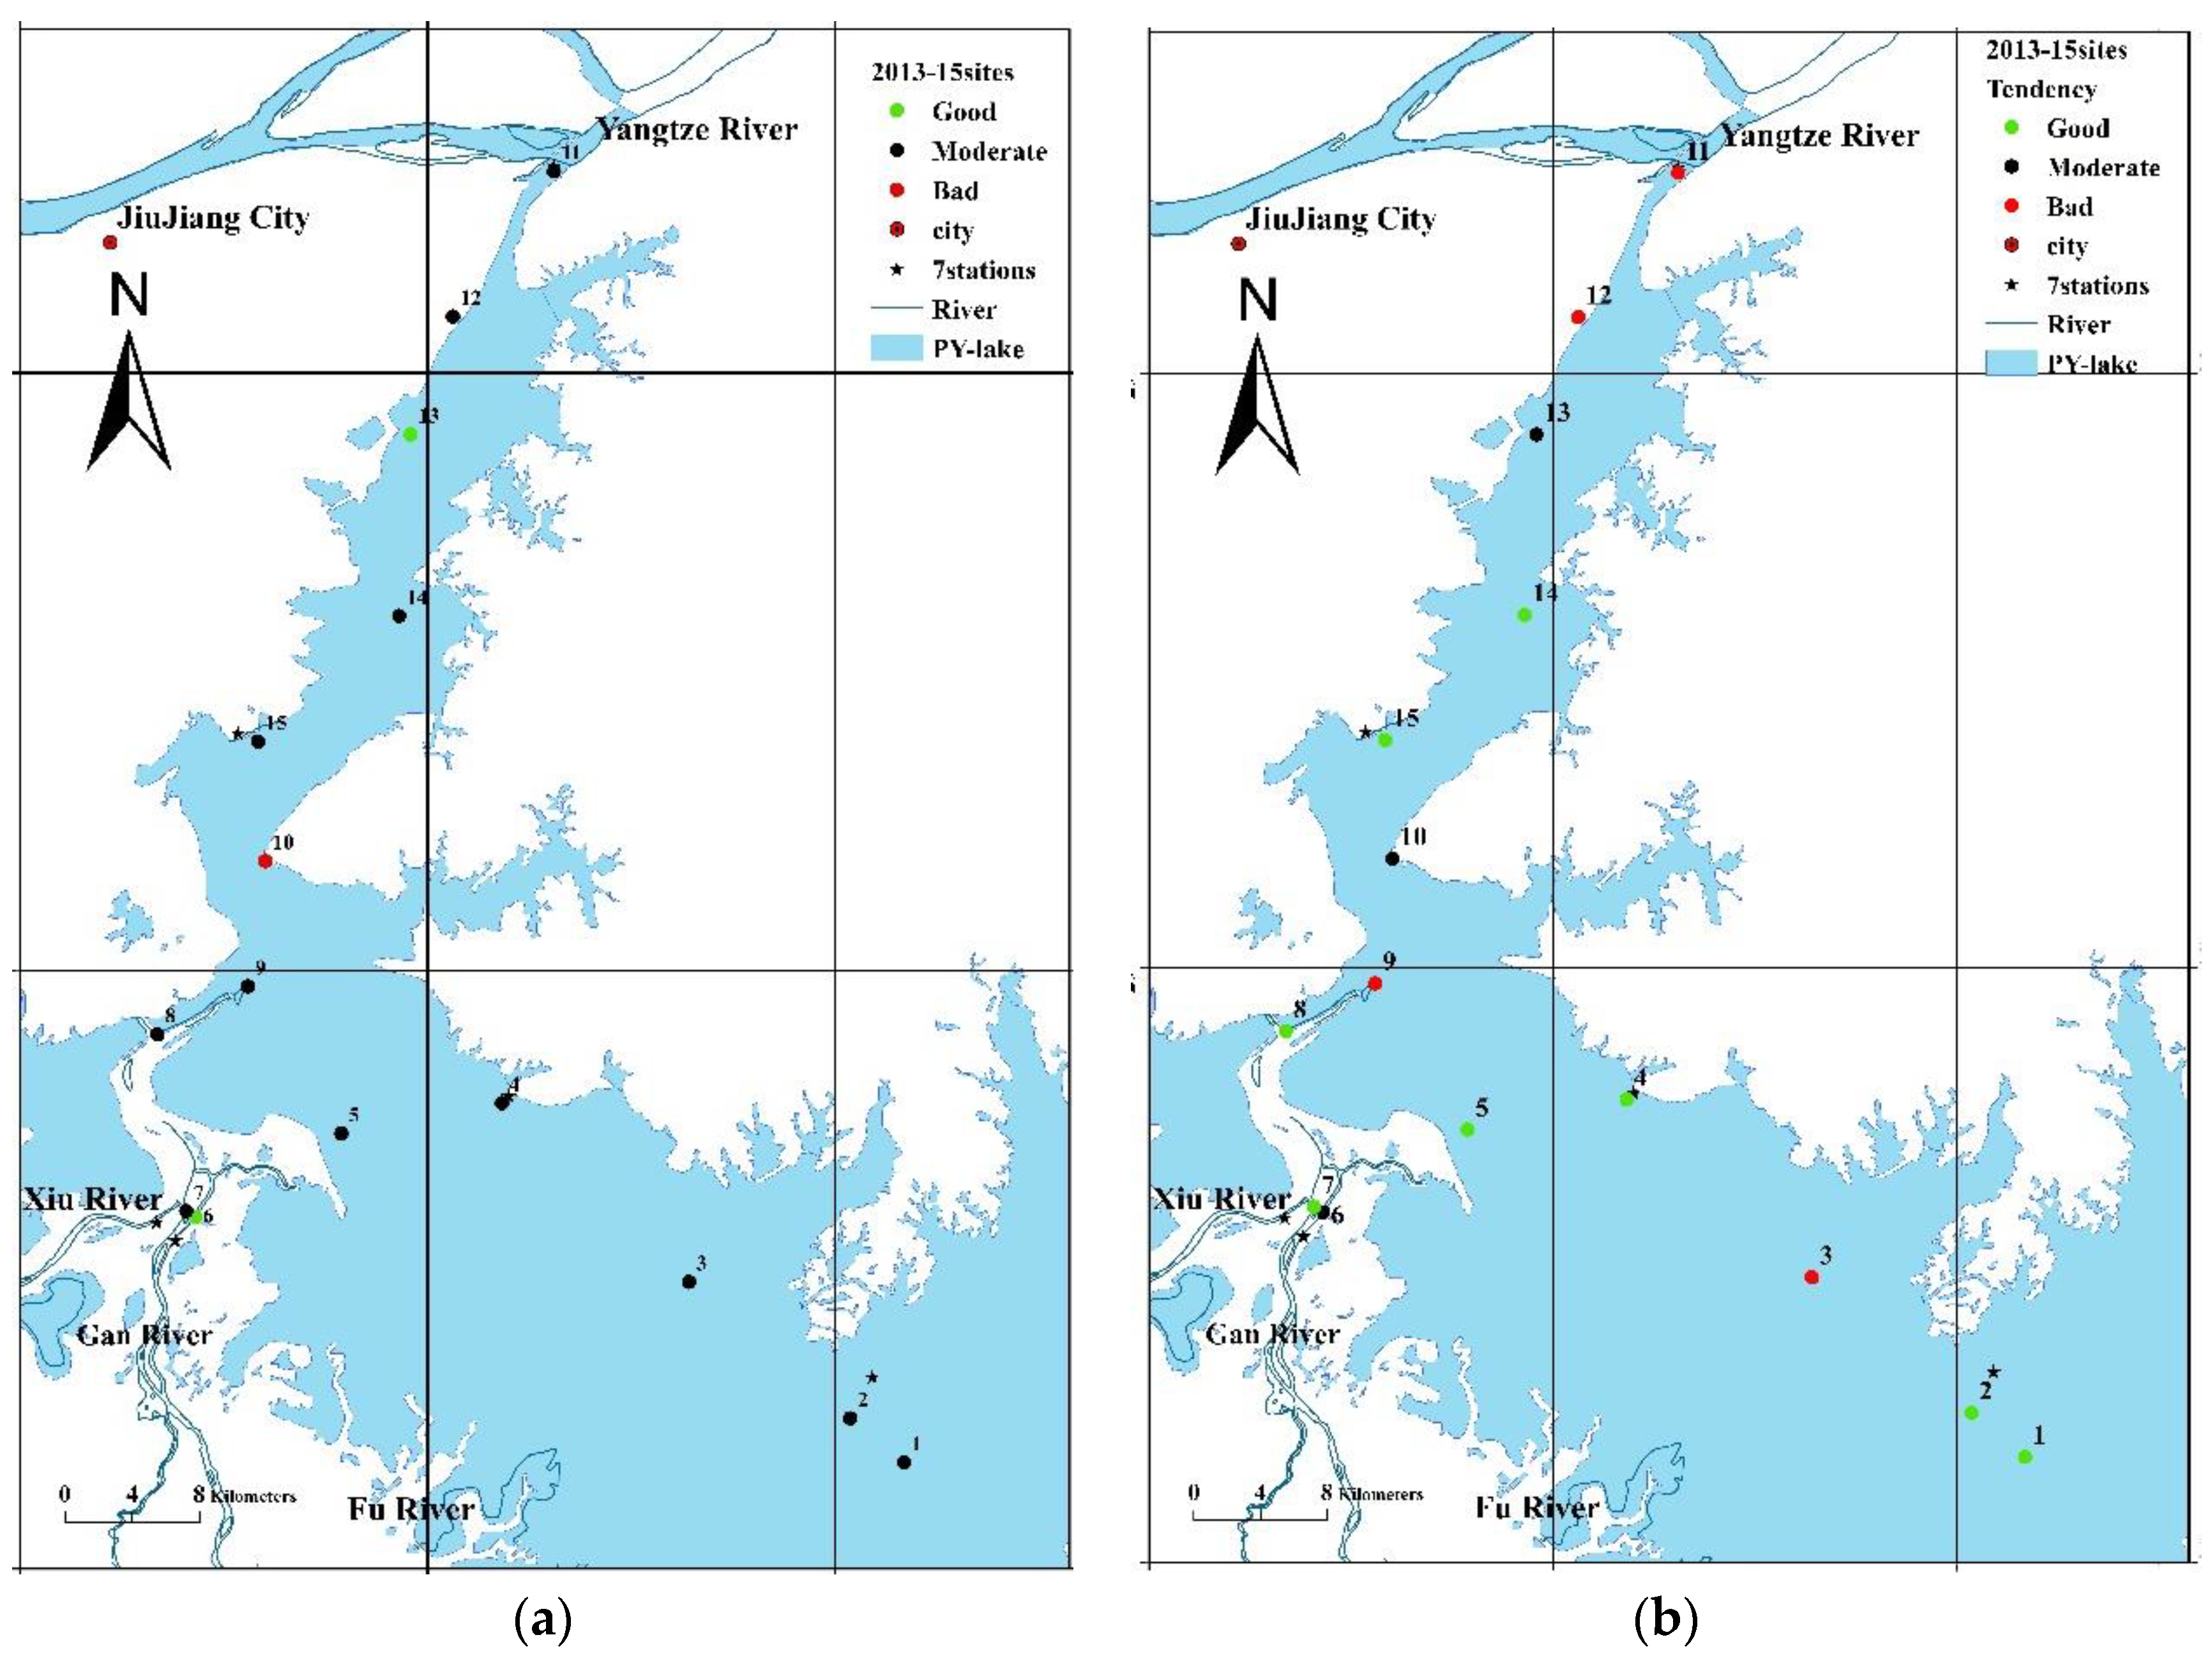
The overall health status of the aquatic ecosystem in Poyang Lake is shown in Figure 3 and Table 3 on the basis of the assessment indicators and thresholds of the aquatic ecosystem in Section 2.3 and the extension evaluation method in Section 2.4. In 2013, the majority of the 15 sample sites were in ‘moderate’ condition (80%), and the remaining sites were in ‘good’ (13.3%) and ‘bad’ (6.67%) conditions.
indicated that the tendency of the health status of the aquatic ecosystem in the 15 sites was ‘good’ (53.3%), ‘moderate’ (26.7%) and ‘bad’ (20%). In summary, the overall health status of the aquatic ecosystem in the lake aquatic ecosystem was ‘moderate’ and it had a tendency to be ‘good’. Spatially, narrow variations in overall health status of the aquatic ecosystem were observed among all 15 sampling sites, except for site 10 and site 13, etc. (Figure 3). The result was possibly owing to the original structure and function of lotic ecosystem in Lake Poyang. For example, Site 10 had unique hydrological characteristics because it was located in the narrowest zone of Poyang Lake. Site 13 had a lower velocity. In addition, site 3, 6, 9 and 11 are located in the junction of different mainstream and tributaries, so they are hydrolologically unstable. Therefore, we could see that the ecological status of Poyang Lake had been affected by many factors, for example abnormal water level fluctuation, velocity, eutrophication, and so on. The weights of TLI, DI and BI were higher than those of other indicators. The weight of TLI in the 15 sites was over 0.2. In some sites, it was more than 0.3 (Table 3). The TLI and indicators of macrozoobenthos were the major influencing factors of the health status of the aquatic ecosystem.
3.2. Temporal and Spatial Variations in the Health Status of the Aquatic Ecosystem
3.2.1. Temporal Succession (1999–2013)
In accordance with the available data of Poyang Lake, the temporal variations in the health of the aquatic ecosystem in 1999, 2007, 2008, 2012 and 2013 were assessed. The inter-annual average values of the biological and physicochemical parameters of 15 sites in four seasons (January, April, July and October) of 2012 and 2013, in October of 2007 and in June of 2008 were calculated to determine the temporal variations in the overall health status of the aquatic ecosystem in Poyang Lake. The data in 1999 were obtained from previous studies (Table 1).
The assessment results of the six indicators in 1999, 2007, 2008, 2012 and 2013 and the comprehensive assessment results of the indicators are shown in the Nightingale Rose diagram (Figure 3). The health status of the aquatic ecosystem was ‘bad’ in 1999 and 2007, ‘moderate’ in 2008 and ‘good’ in 2012 and 2013. The status of some indicators were the same during these years, whereas some other indicators totally differed. For example, DI was ‘moderate’ in these years and LWLa-D was ‘good’ in 2012 and 2013, ‘moderate’ in 2007 and 2008, ‘bad’ in 1999. According to , the tendencies of the health status in 2013 and 2008 were ‘good’ and ‘bad’, respectively. The health status in the remaining years was ‘moderate’. As shown in Figure 4, the assessment results of the indicators showed a suddenly change between 2007 and 2008. The distinct change may largely due to the different sampling season in the two years, respectively in October 2007 (retreating season) and June 2008 (wet season). In addition, the TLI in the wet season was lower than in the retreating season, which may be influenced by various factors (e.g., hydrological conditions). Moreover, compared with 2007 and 2008, the water level fluctuates greatly in the dry season, and the indicator LWLa-D showed a sudden change. Moreover, physicochemical elements, hydromorphological elements, and biological elements affect each other.
Though the evaluation results in different years were the same, the status of the six indicators varied considerably among different years (Figure 4). For example, the status in 1999 and 2007 was similarly ‘bad’. In 1999, CB/DB and LWLa-D were ‘good’ and ‘bad’, respectively, whereas the four other indices, namely MWLa-R, DI, BI, and TLI, were ‘moderate’. In 2007, MWLa-R and TLI were ‘bad’ but DI, BI, CB/DB and LWLa-D were ‘moderate’ and other indicators were different. In terms of weights (Table 4), TLI was high in all years, indicating that lake eutrophication was the primary factor, whereas the other indicators showed significant variations in different years. For example, DI exhibited high weights in 2012 and 2013, whereas MWLa-R and LWLa-D were high in 2007 and 1999, respectively.
3.2.2. Seasonal Variations
In view of Poyang Lake characterized by seasonal flood pulse and considerable alteration regarding of hydrodynamic conditions, water quality as well as aquatic species, seasonal evaluation of the aquatic ecosystem health status for 15 sites in 2013, namely dry season (January), rising season (April), wet season (July) and retreating season (October).
The health status of the aquatic ecosystem in four seasons, namely dry–rising–wet–retreating periods, in 2013 in Poyang Lake is presented in Figure 5. Seasonally, the health status was determined as ‘bad’ in dry and wet seasons. In more than half of the 15 sampling sites, the health status in dry season was worse than that in wet season. Conversely, the health status in rising and retreating seasons were ‘moderate’. The health status significantly varied with seasonal changes and showed the following order (worst to best): dry season (January) < wet season (July) < retreating season (October) and rising season (April). Seasonal variations of the aquatic ecosystem health status may largely due to water-level fluctuations at a seasonal scale. Wu et al. [32] also reported that WL (water level) affected the water quality in Lake Poyang by using water quality data from 1980 to 2018, especially at the seasonal scale.
Considering that Poyang Lake is characterized by seasonal flood pulse and considerable alteration in its hydrodynamic conditions, water quality and aquatic species, seasonal evaluation of the health status of the aquatic ecosystem for 15 sites in 2013 was conducted in the dry season (January), rising season (April), wet season (July) and retreating season (October).
The health status of the aquatic ecosystem in four seasons in 2013 in Poyang Lake is presented in Figure 5. The health status was determined as ‘bad’ in the dry and wet seasons. In more than half of the 15 sampling sites, the health status in the dry season was worse than that in the wet season. Conversely, the health status in the rising and retreating seasons were ‘moderate’. The health status significantly varied with seasonal changes and showed the following order (worst to best): dry season < wet season < retreating and rising seasons.
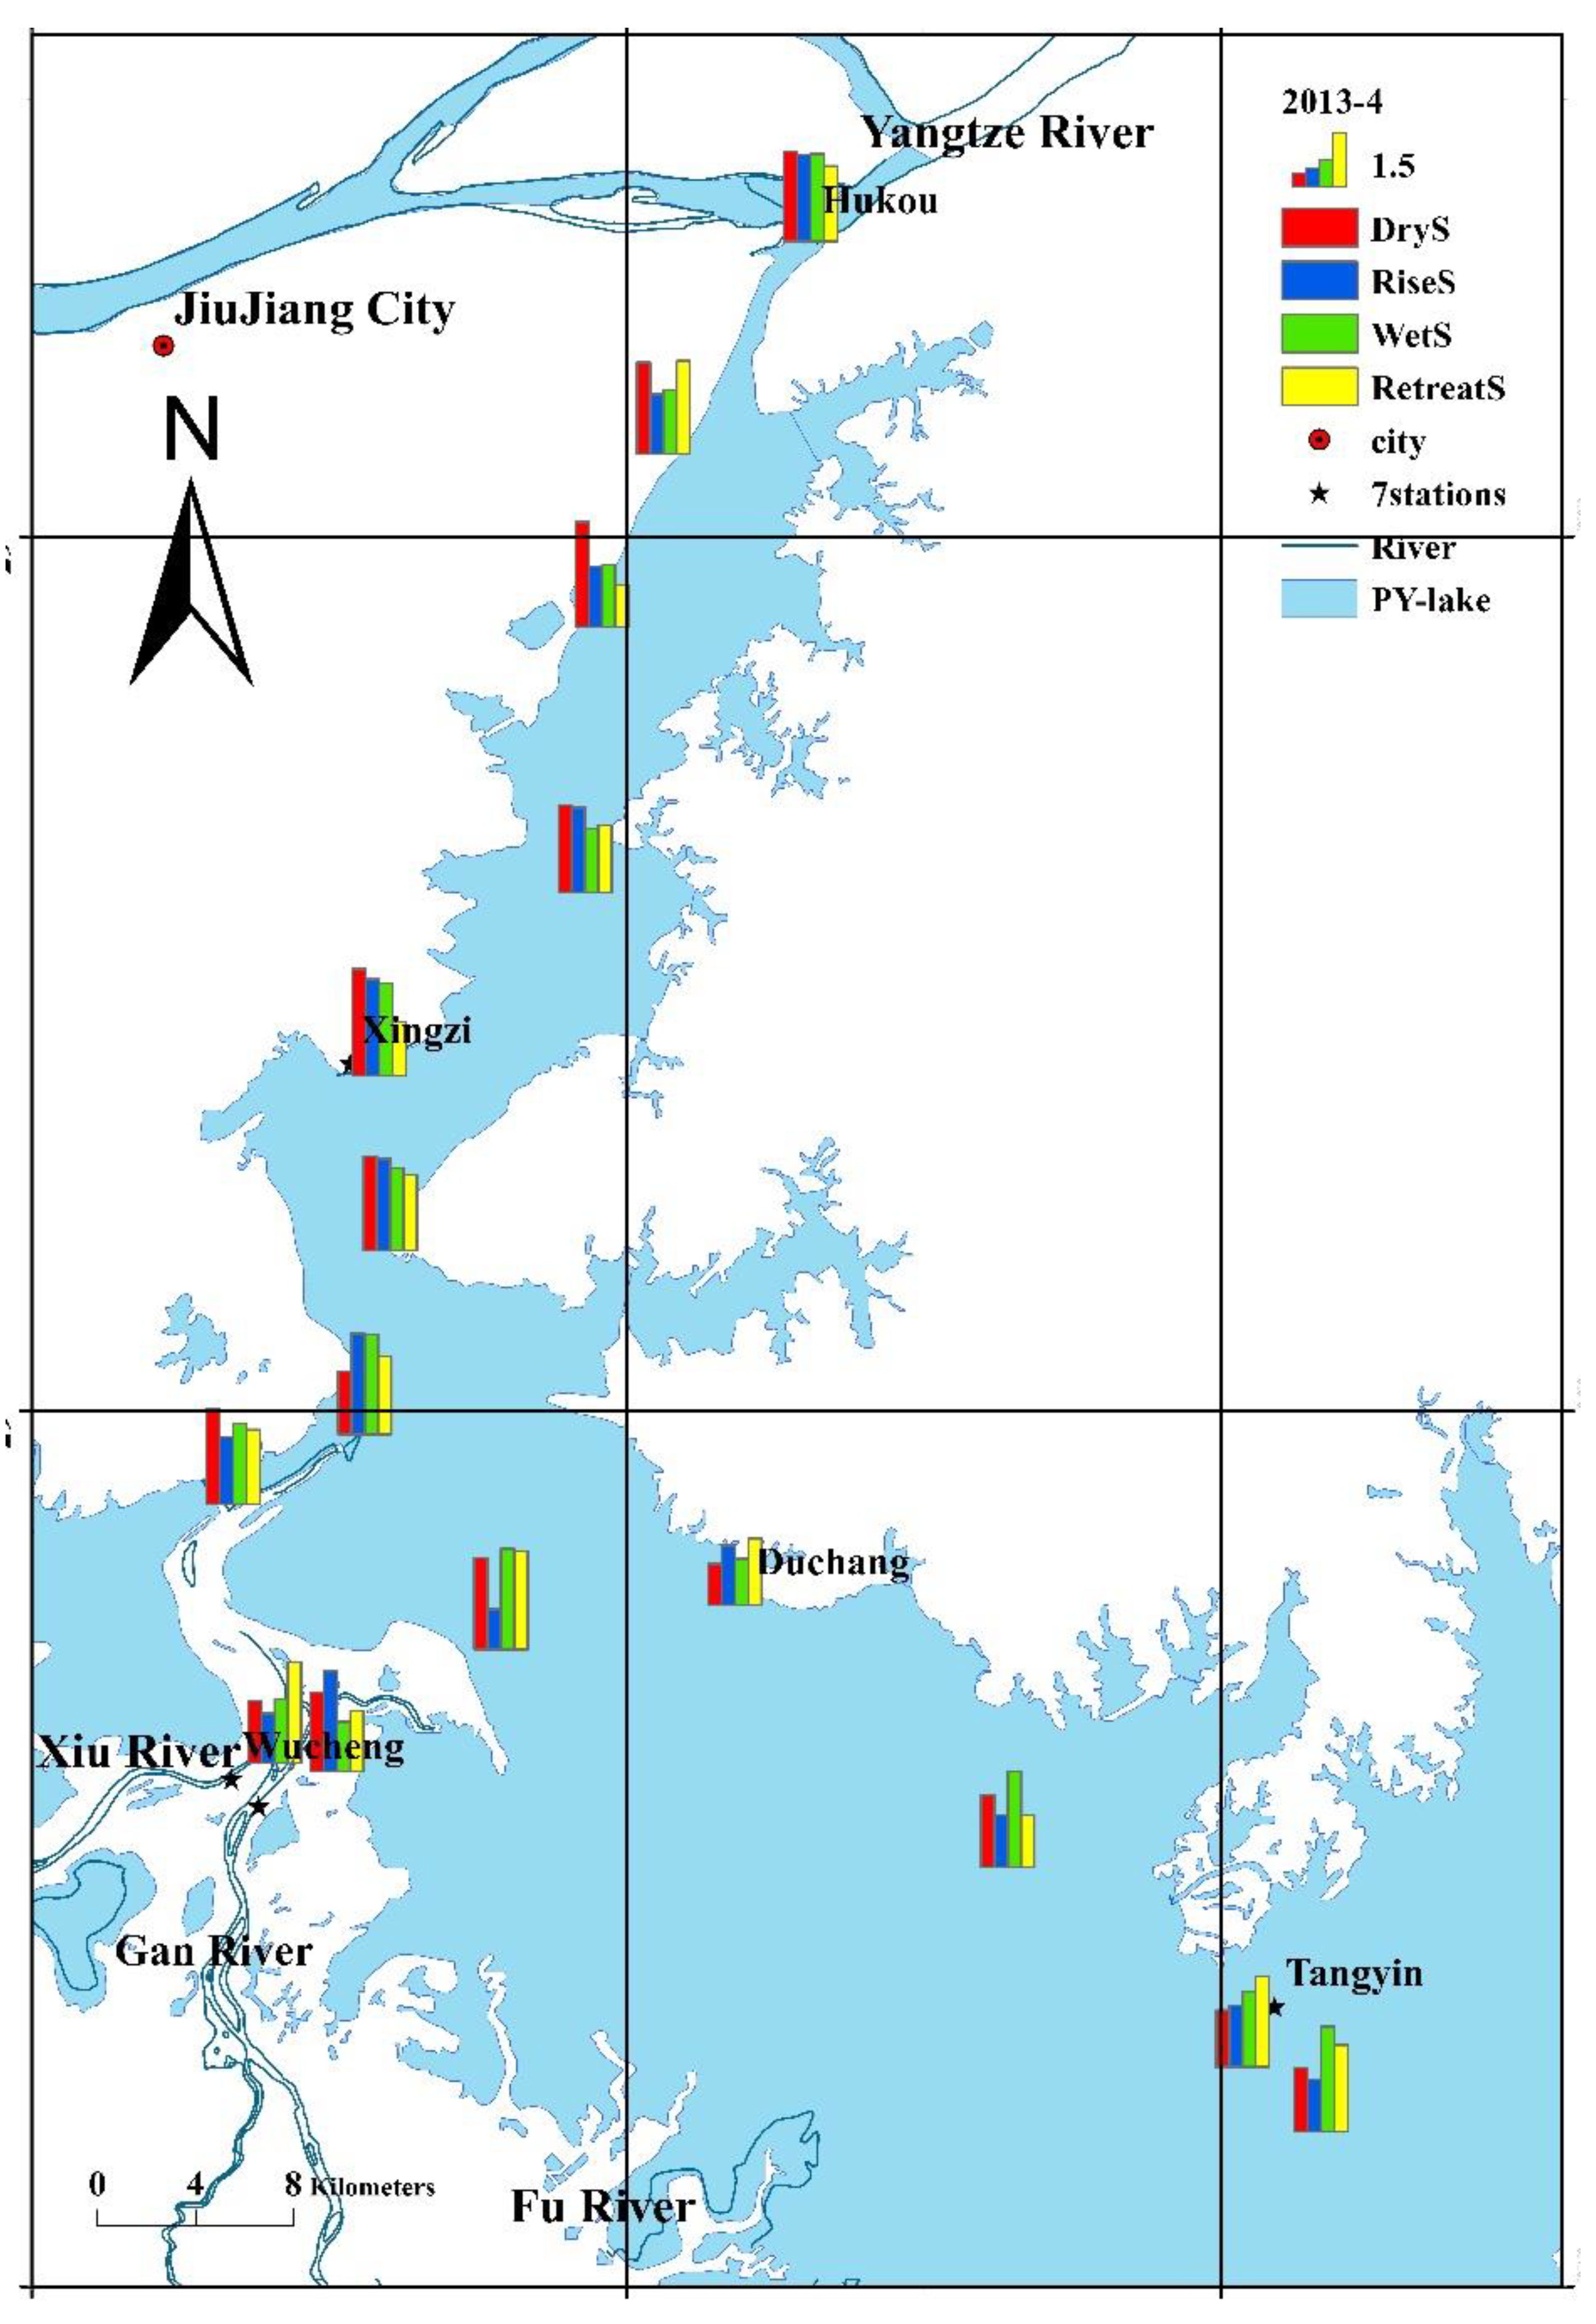
The assessment weights of the aquatic ecosystem in Poyang Lake in four seasons in 2013 are shown in Figure 6. Overall, the weights of TLI, DI and LWLa-D in all seasons were higher than those of the other indicators and they varied among different seasons. For instance, the weight of CB/DB was the highest in the wet season. Therefore, high temperature in wet season may be suitable for blue-green algal growth. In 2011, cyanobacteria broke out in Poyang Lake [33]. By contrast, the weight of BI in the wet season was the lowest, possibly because of seasonal water quality variations. The water quality in Poyang Lake was seasonally better in the wet season than in other seasons [34].
3.2.3. Spatial Variations
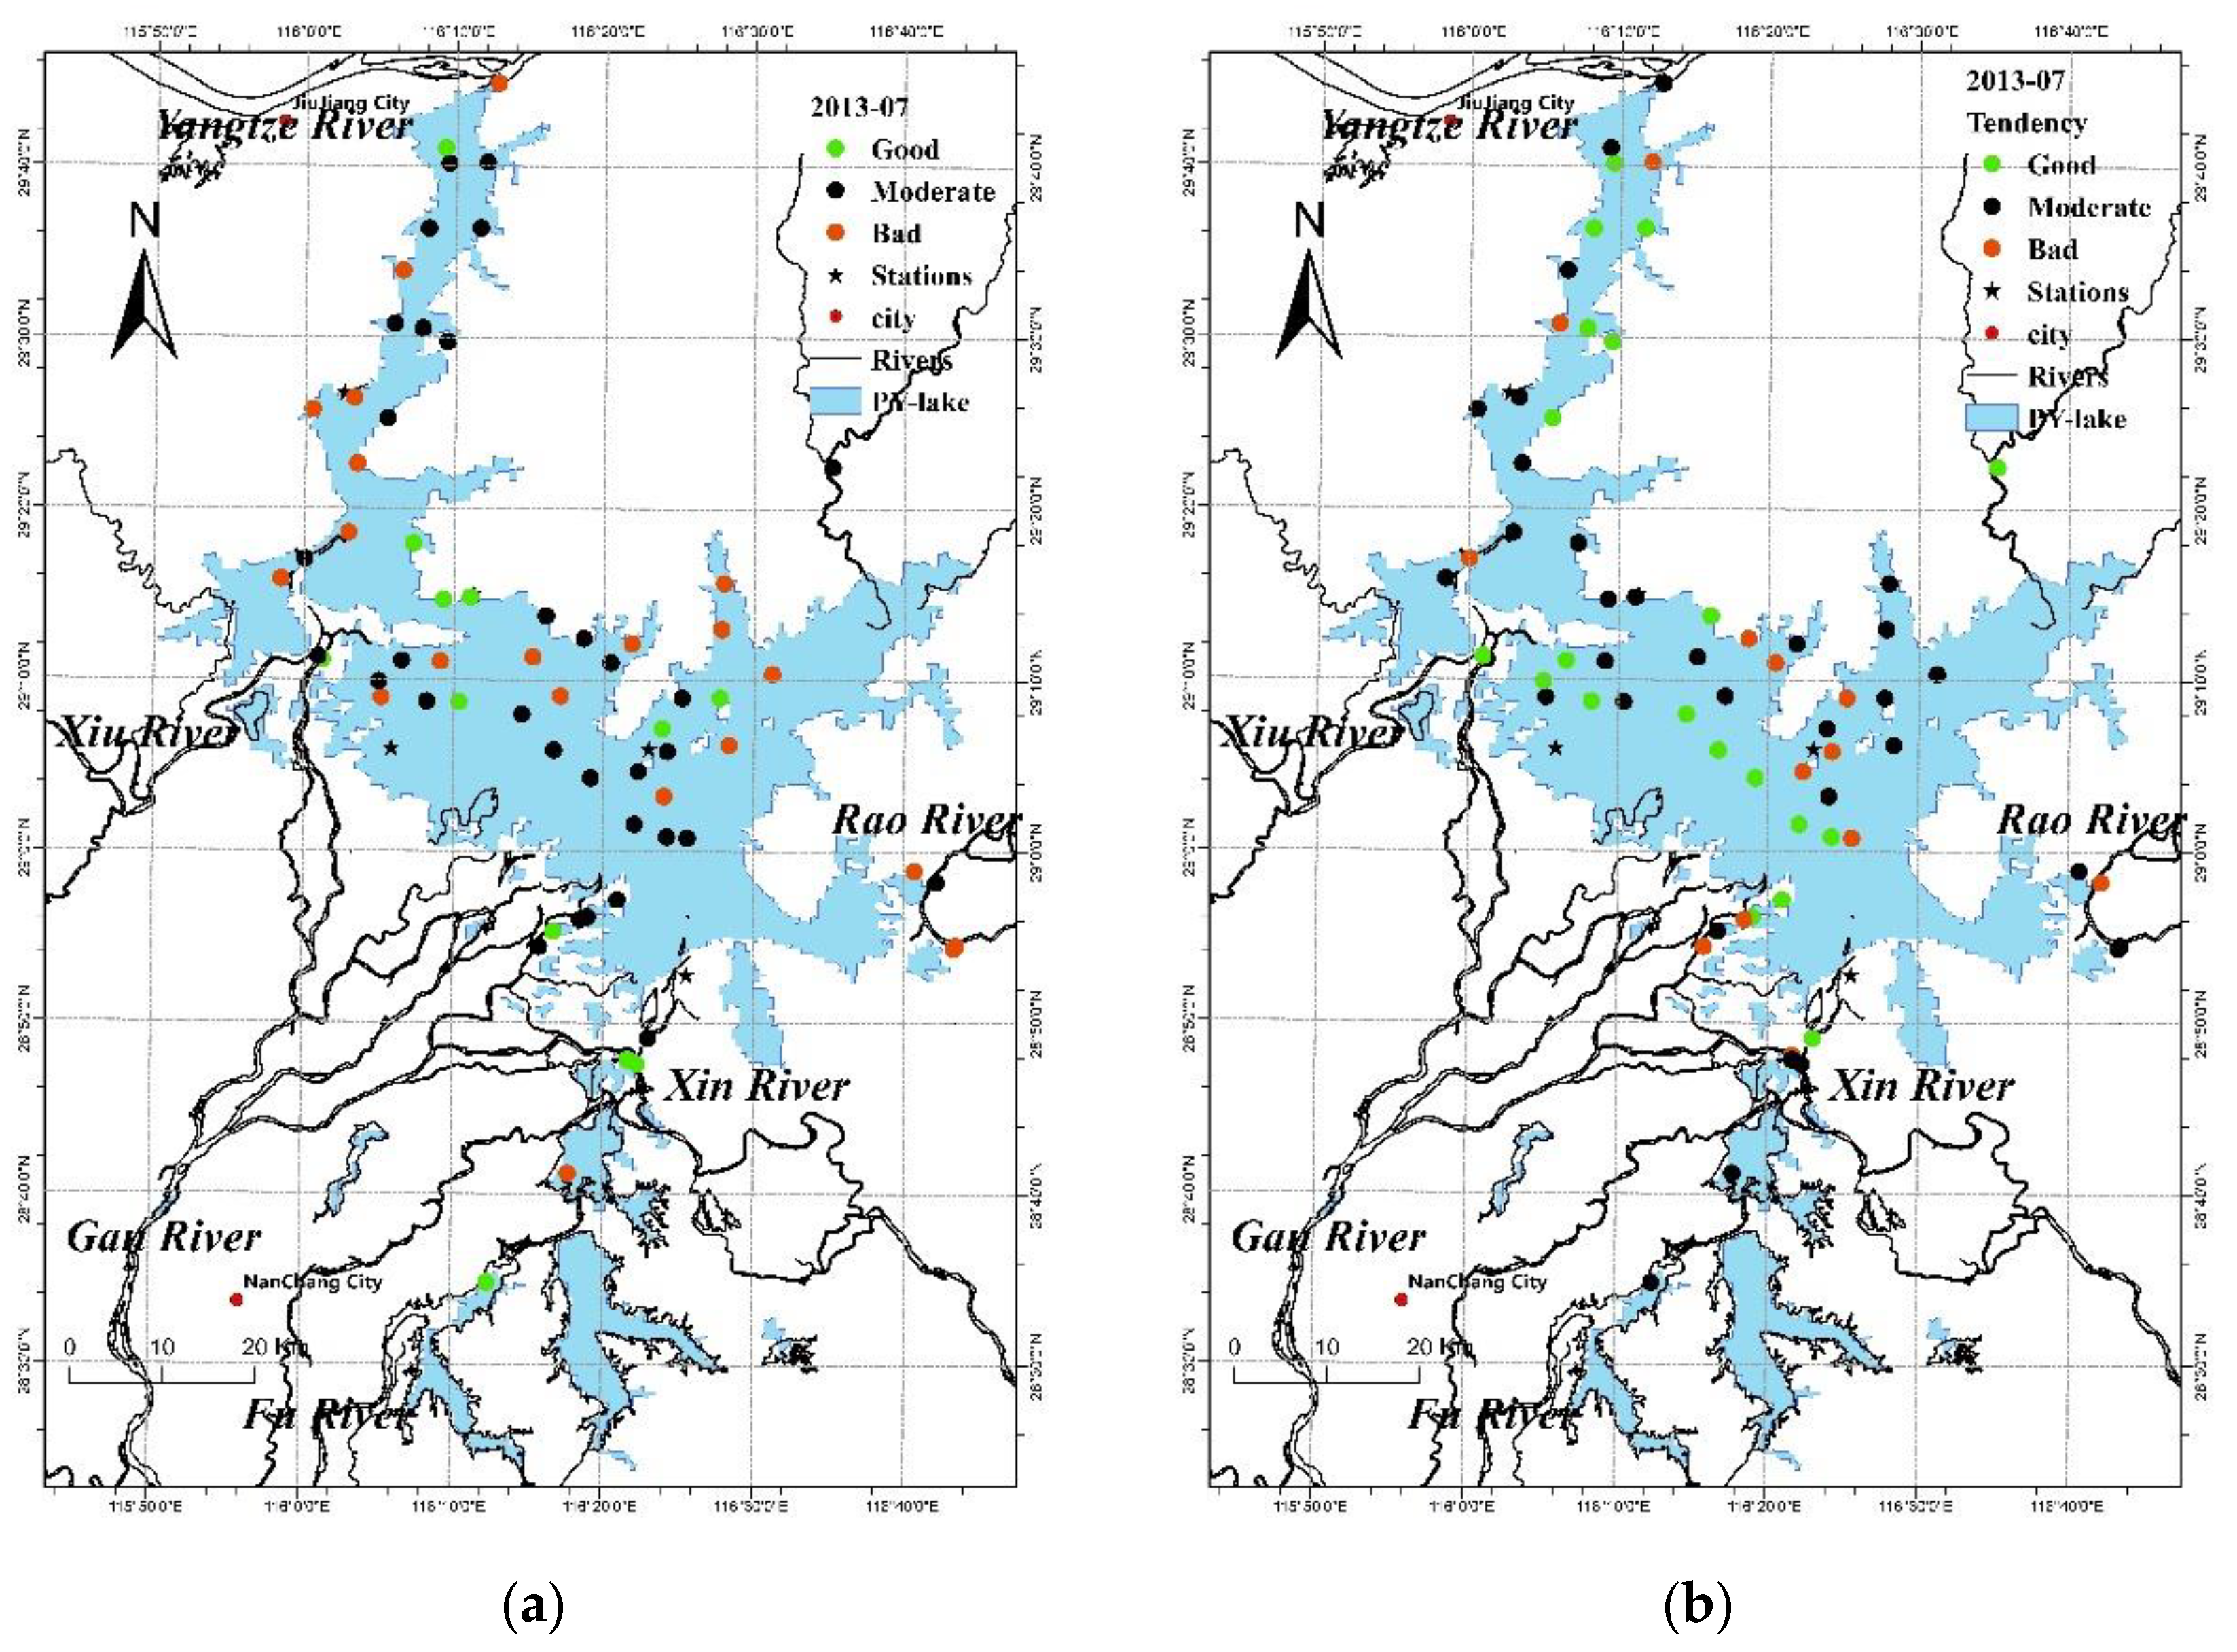
The spatial variations in the status of the aquatic ecosystem in Poyang Lake in July 2013 are shown in Figure 7. In particular, 20%, 50%, and 30% of the 68 sampling sites in July 2013 were classified as ‘good’, ‘moderate’, and ‘bad’, respectively. In accordance with , the tendencies of the aquatic ecosystem health status in the 68 sampling sites were ‘good’ (30%), ‘moderate’ (50%) and ‘bad’ (20%). As Figure 7 shows, the spatial distribution of aquatic ecosystem health status was not significant, a mixture of ‘good’, ‘moderate’ and ‘bad’. The assessment weights of the aquatic ecosystem in Poyang Lake in June 2013 are given in Figure 8. Overall, the weights of TLI, DI, BI and CB/DB of the entire lake were higher than those of the other indicators, and they varied among different regions. For instance, the weights of CB/DB of Lake Bay or some nearby lakes were higher than those of other regions.
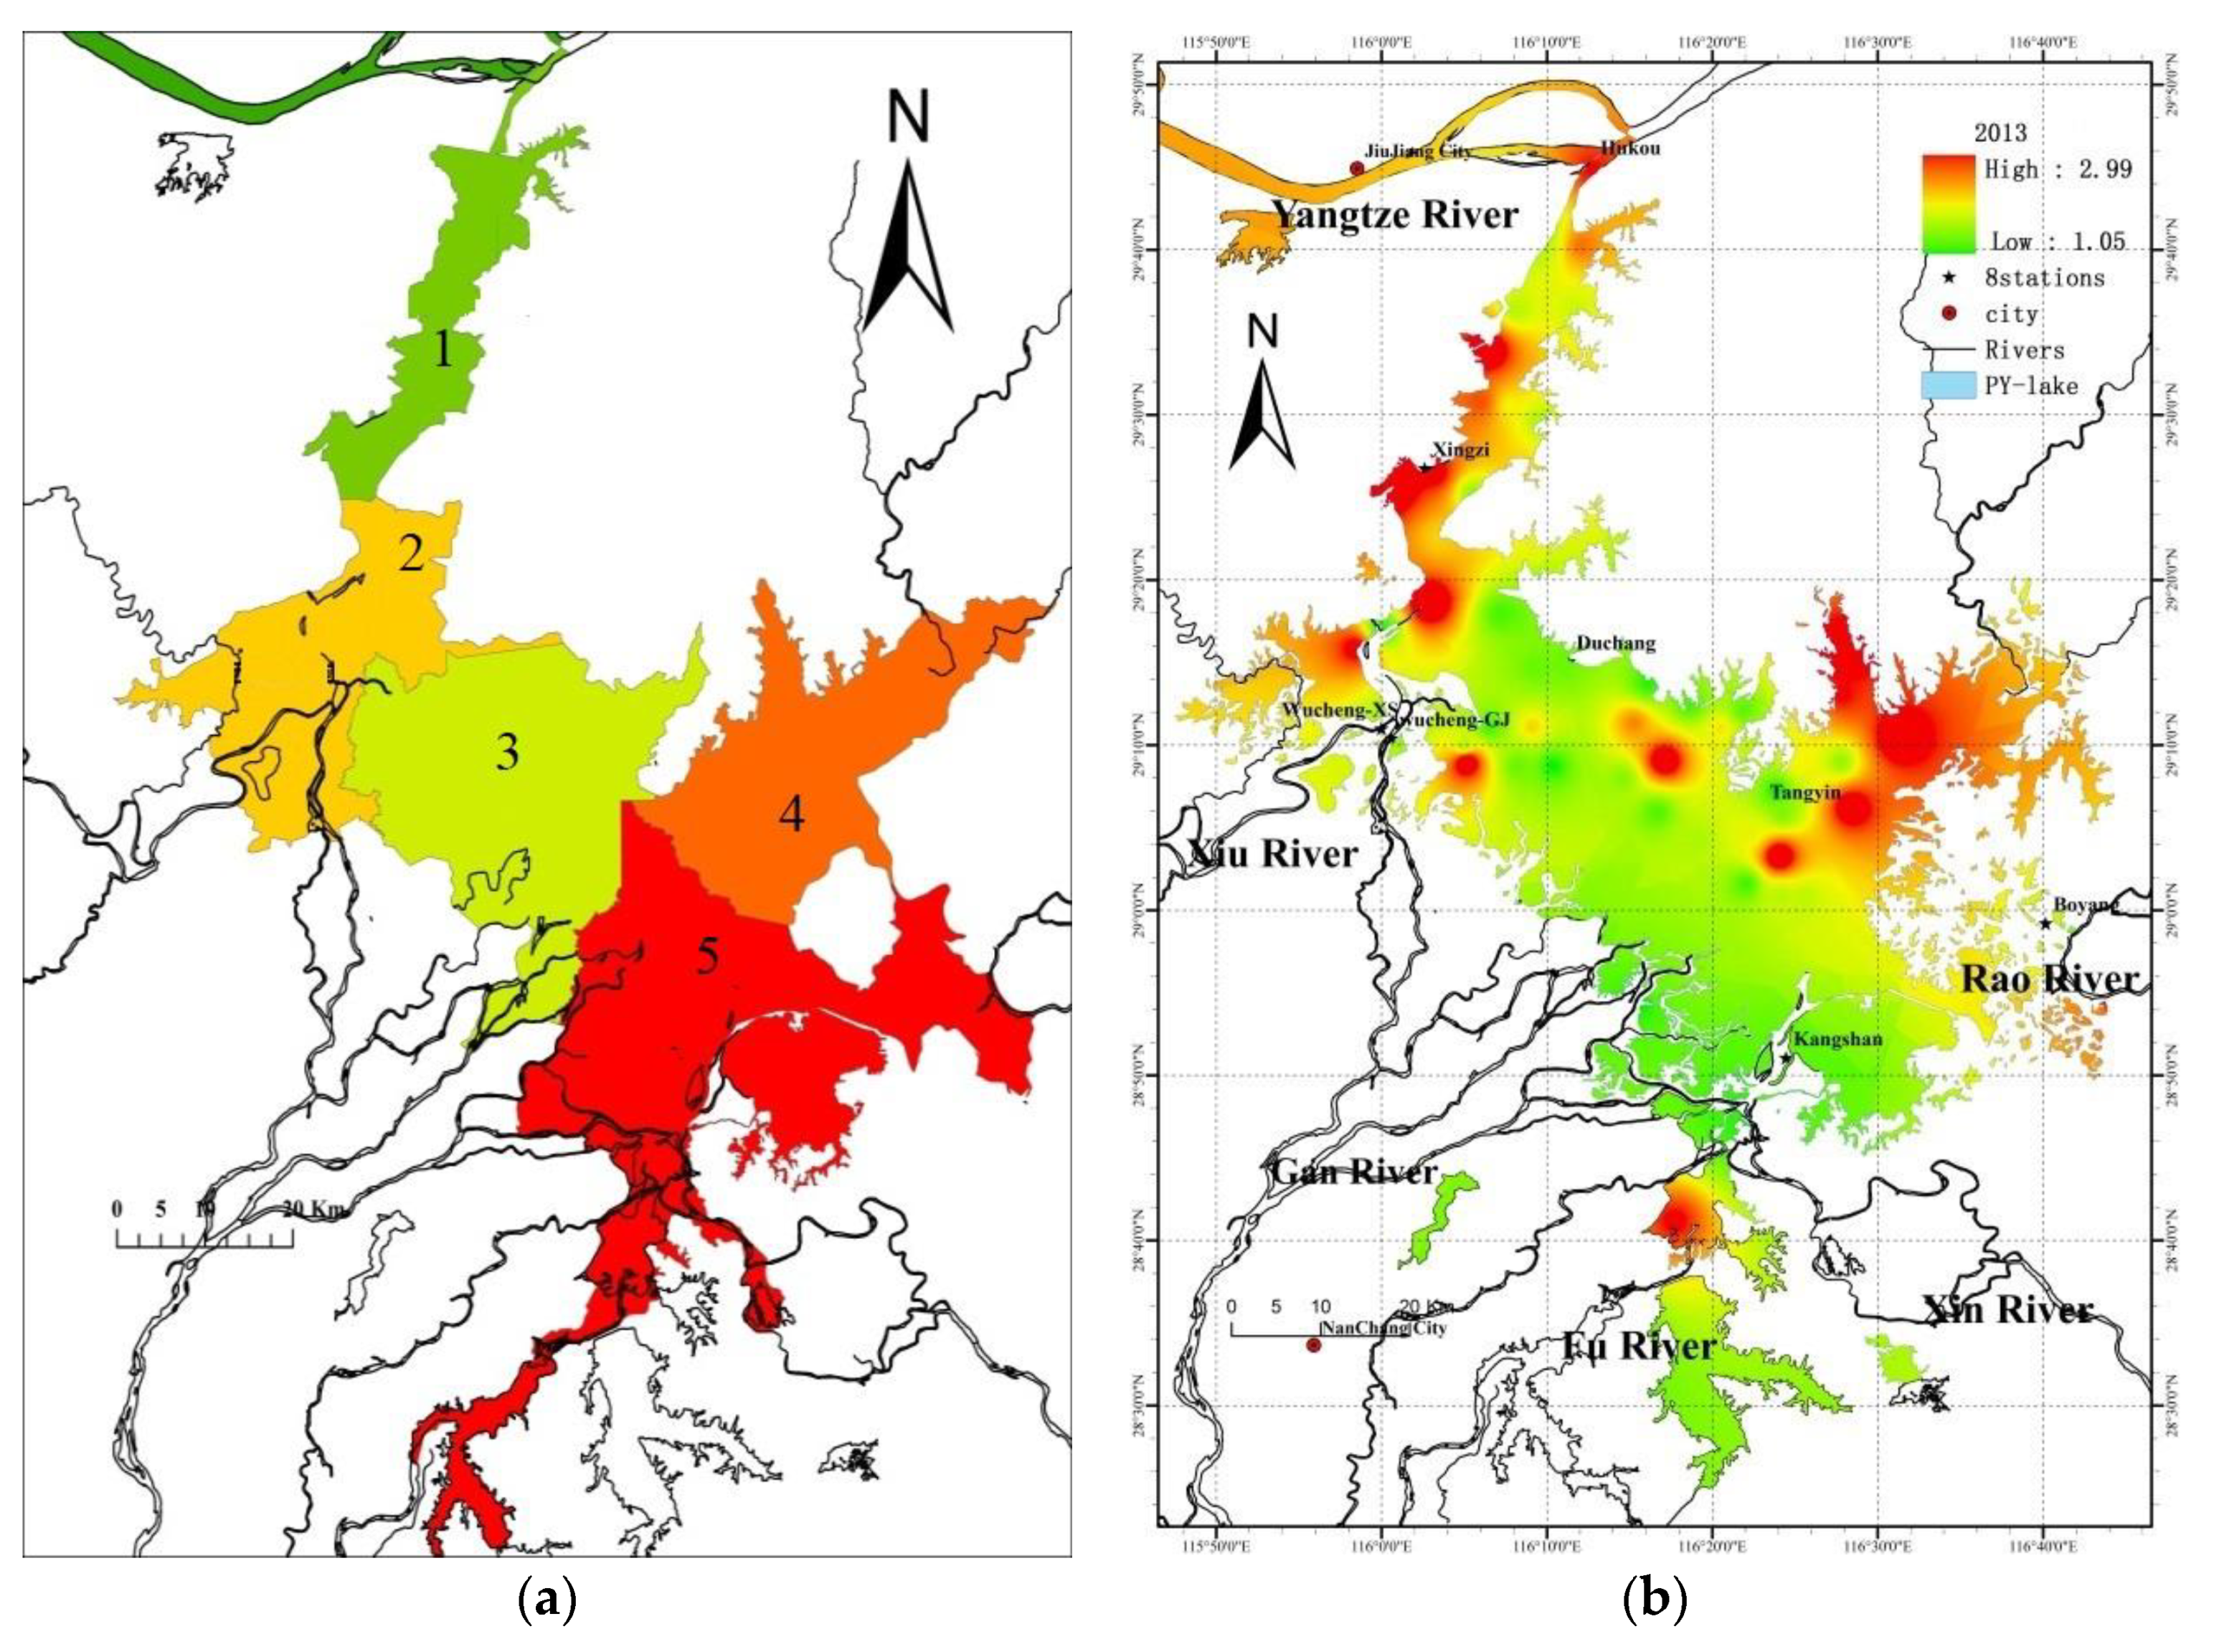
Many studies showed significant regional differences in hydrodynamic conditions, water quality, and aquatic species [19,35,36]. For example, big-sized aquatic plants are mainly found in a few branch areas of the lake over the rising season [7]. As such, the entire Poyang Lake was divided into the following five zones in accordance with their characteristics (e.g., topography, habitat conditions, and hydrodynamics) to determine the spatial variation in the health status of the aquatic ecosystem and the major contributors to such variations: the northern region connected to the Yangtze River, the eastern region, the northwestern region, the central lake and the southern region (Figure 9a). The results revealed that the hydrographic hydrodynamics significantly differed among these regions (Table 5). For instance, the northern region had a peak flow rate. The differences of Wusong elevation were very striking among the five regions. In addition, the main floodway is approximately from south to north and the elevation outside the main floodway rises in turn, resulting in ecological consequences. For example, wetland vegetation patterns within Poyang Lake depend on depth and duration of surface submersion and therefore occur in well-recognized elevation zones [37]. Thus, we deduced that characteristics of lake basin (topography, elevation, etc.), probably play an essential role in the spatial variations of aquatic ecosystem health status.
In accordance with , the result of the reverse distance interpolation in July 2013 is shown in Figure 9b. The regional distribution characteristics of the health status were not obvious, and all regions were a mixture of ‘good’, ‘moderate’ and ‘bad’. The regional distribution characteristics of the health status were not obvious and all regions were a mixture of ‘good’, ‘moderate’ and ‘bad’. By contrast, the health status of the aquatic ecosystem in the eastern and northern regions was worse than that in other regions. The status of the aquatic ecosystem in the central lake was better than that in other regions.
4. Discussion
4.1. Assessment Indicators
An appropriate indicator selection makes the assessment more objective and conformed to facts. Lake Poyang, as the largest freshwater lake naturally connected to Yangtze River in China, has a series of complicated and unique hydrological and biochemical characteristics. Therefore, this study assessed the health index of the aquatic ecosystem in this lake, including hydrologic characteristics, trophic status, and aquatic organisms. A complete set of indicators could provide a more comprehensive illustration on the health status of the aquatic ecosystem than single-species indicators [10]. CB/DB, LWLa-D and MWLa-R were appropriate and special for this study compared with the indicators in previous studies [11,12]. Several ecological indicators have been proposed to quantify the development status of aquatic ecosystems [7,38]. Phytoplankton biomass is one of the widely used indicators. The higher the phytoplankton biomass, the heavier the ecosystem status [39]. However, the phytoplankton biomass of Poyang Lake is lower than that of lakes with similar nutrient concentrations [40]. Therefore, phytoplankton biomass could not be used as an indicator of the health status of Poyang Lake. Alterations in phytoplankton biomass and species composition in a water body reflect a changing aquatic ecosystem [41,42]. Lotic phytoplankton is dominated by a typical fluvial species of Diatomophyceae, while lentic phytoplankton is dominated by a typical fluvial species of cyanobacteria [43]. Thus, establishing the ratio of CB to DB could support the identification of the health characteristics of the aquatic ecosystem in Poyang Lake. Hydromorphological pressures are becoming one of the main threats to the ecological integrity of global lake ecosystems and water-level fluctuations regulate the structure and function of natural lakes [44,45]. Considering the distinctive hydrological features of Lake Poyang, rarely used indicators, such as water level, were used to measure the hydromorphological characteristics. Poyang Lake has experienced drastic hydrological changes, such as spring drought and lowest water level in winter, and this change has caused major hydrological, biological, ecological, and economic consequences in this region [18,19,22,25]. As such, constructing LWLa-D and MWLa-R could help measure the hydromorphological characteristics and the ecological effects and determine the health characteristics of the aquatic ecosystem in Poyang Lake. However, optimization and adjustment of the index system are still needed. For example, data on vegetation and fish were unavailable. Thus, ecological indicators (e.g., migratory fish and vegetation) were not considered but future studies could break this restriction. In summary, compared with the previous assessments of Lake Poyang, this study comparatively used comprehensive indicators, including water level, nutrients, and some aquatic organisms. These indicators further manifested the aquatic ecosystem status in the lake but were not thoroughly considered in the published studies. The temporal and spatial variations in aquatic ecosystem health assessment of Lake Poyang were relatively consistent with previous research based on different indicators [11,12]. Our study considered biological elements and supporting physicochemical and hydromorphological elements and determined indicators thresholds. Hence, the results of our study, which was conducted at more comprehensive scale, form a more acceptable aquatic ecosystem health assessment of Lake Poyang.
4.2. Assessment Method
The extension evaluation method has three advantages. Firstly, it is superior to the coarse grade, with higher accuracy ensured. Thus, a finer grading of the health status of aquatic ecosystems was obtained. For example, in site 1 of the overall health status (line 1 of Table 3), the accurate grade of 1.72 not only revealed the exact health status but also provided valuable information on the recent trends of the health status to a certain degree. Thus, the precise grade values obtained through this approach are more justified than those from other measurement methods. Secondly, this method could effectively distinguish the major contributors to the health status of the aquatic ecosystem in Poyang Lake. For example, the weights of the six indicators in site 1 of the overall health status were 0.31, 0.10, 0.23, 0.14, 0.10 and 0.11. Therefore, TLI and DI were the critical influential indicators. The weights were different for every site in every season. Thus, this method is more reasonable for Poyang Lake, whose ecological environment showed marked spatial and temporal variations. Furthermore, this method is suitable for the attributive standard (e.g., health thresholds of the aquatic ecosystem) described by an interval and not a single numeric value. In many applications, the indicator thresholds of the health status of aquatic ecosystems are described by intervals. Therefore, a single health status grade is inadequate to describe the aquatic ecosystem status of a lake. Categorization based on intervals is more rational. For fuzzy and gray assessment methods, the value of the water quality standard is considered to be a single value [46]. The results of the present study were in agreement with those of previous studies based on various assessment methods [15]. Therefore, the extension evaluation method could be applied to the comprehensive evaluation of the health status of aquatic ecosystems in lakes.
4.3. Assessment Results
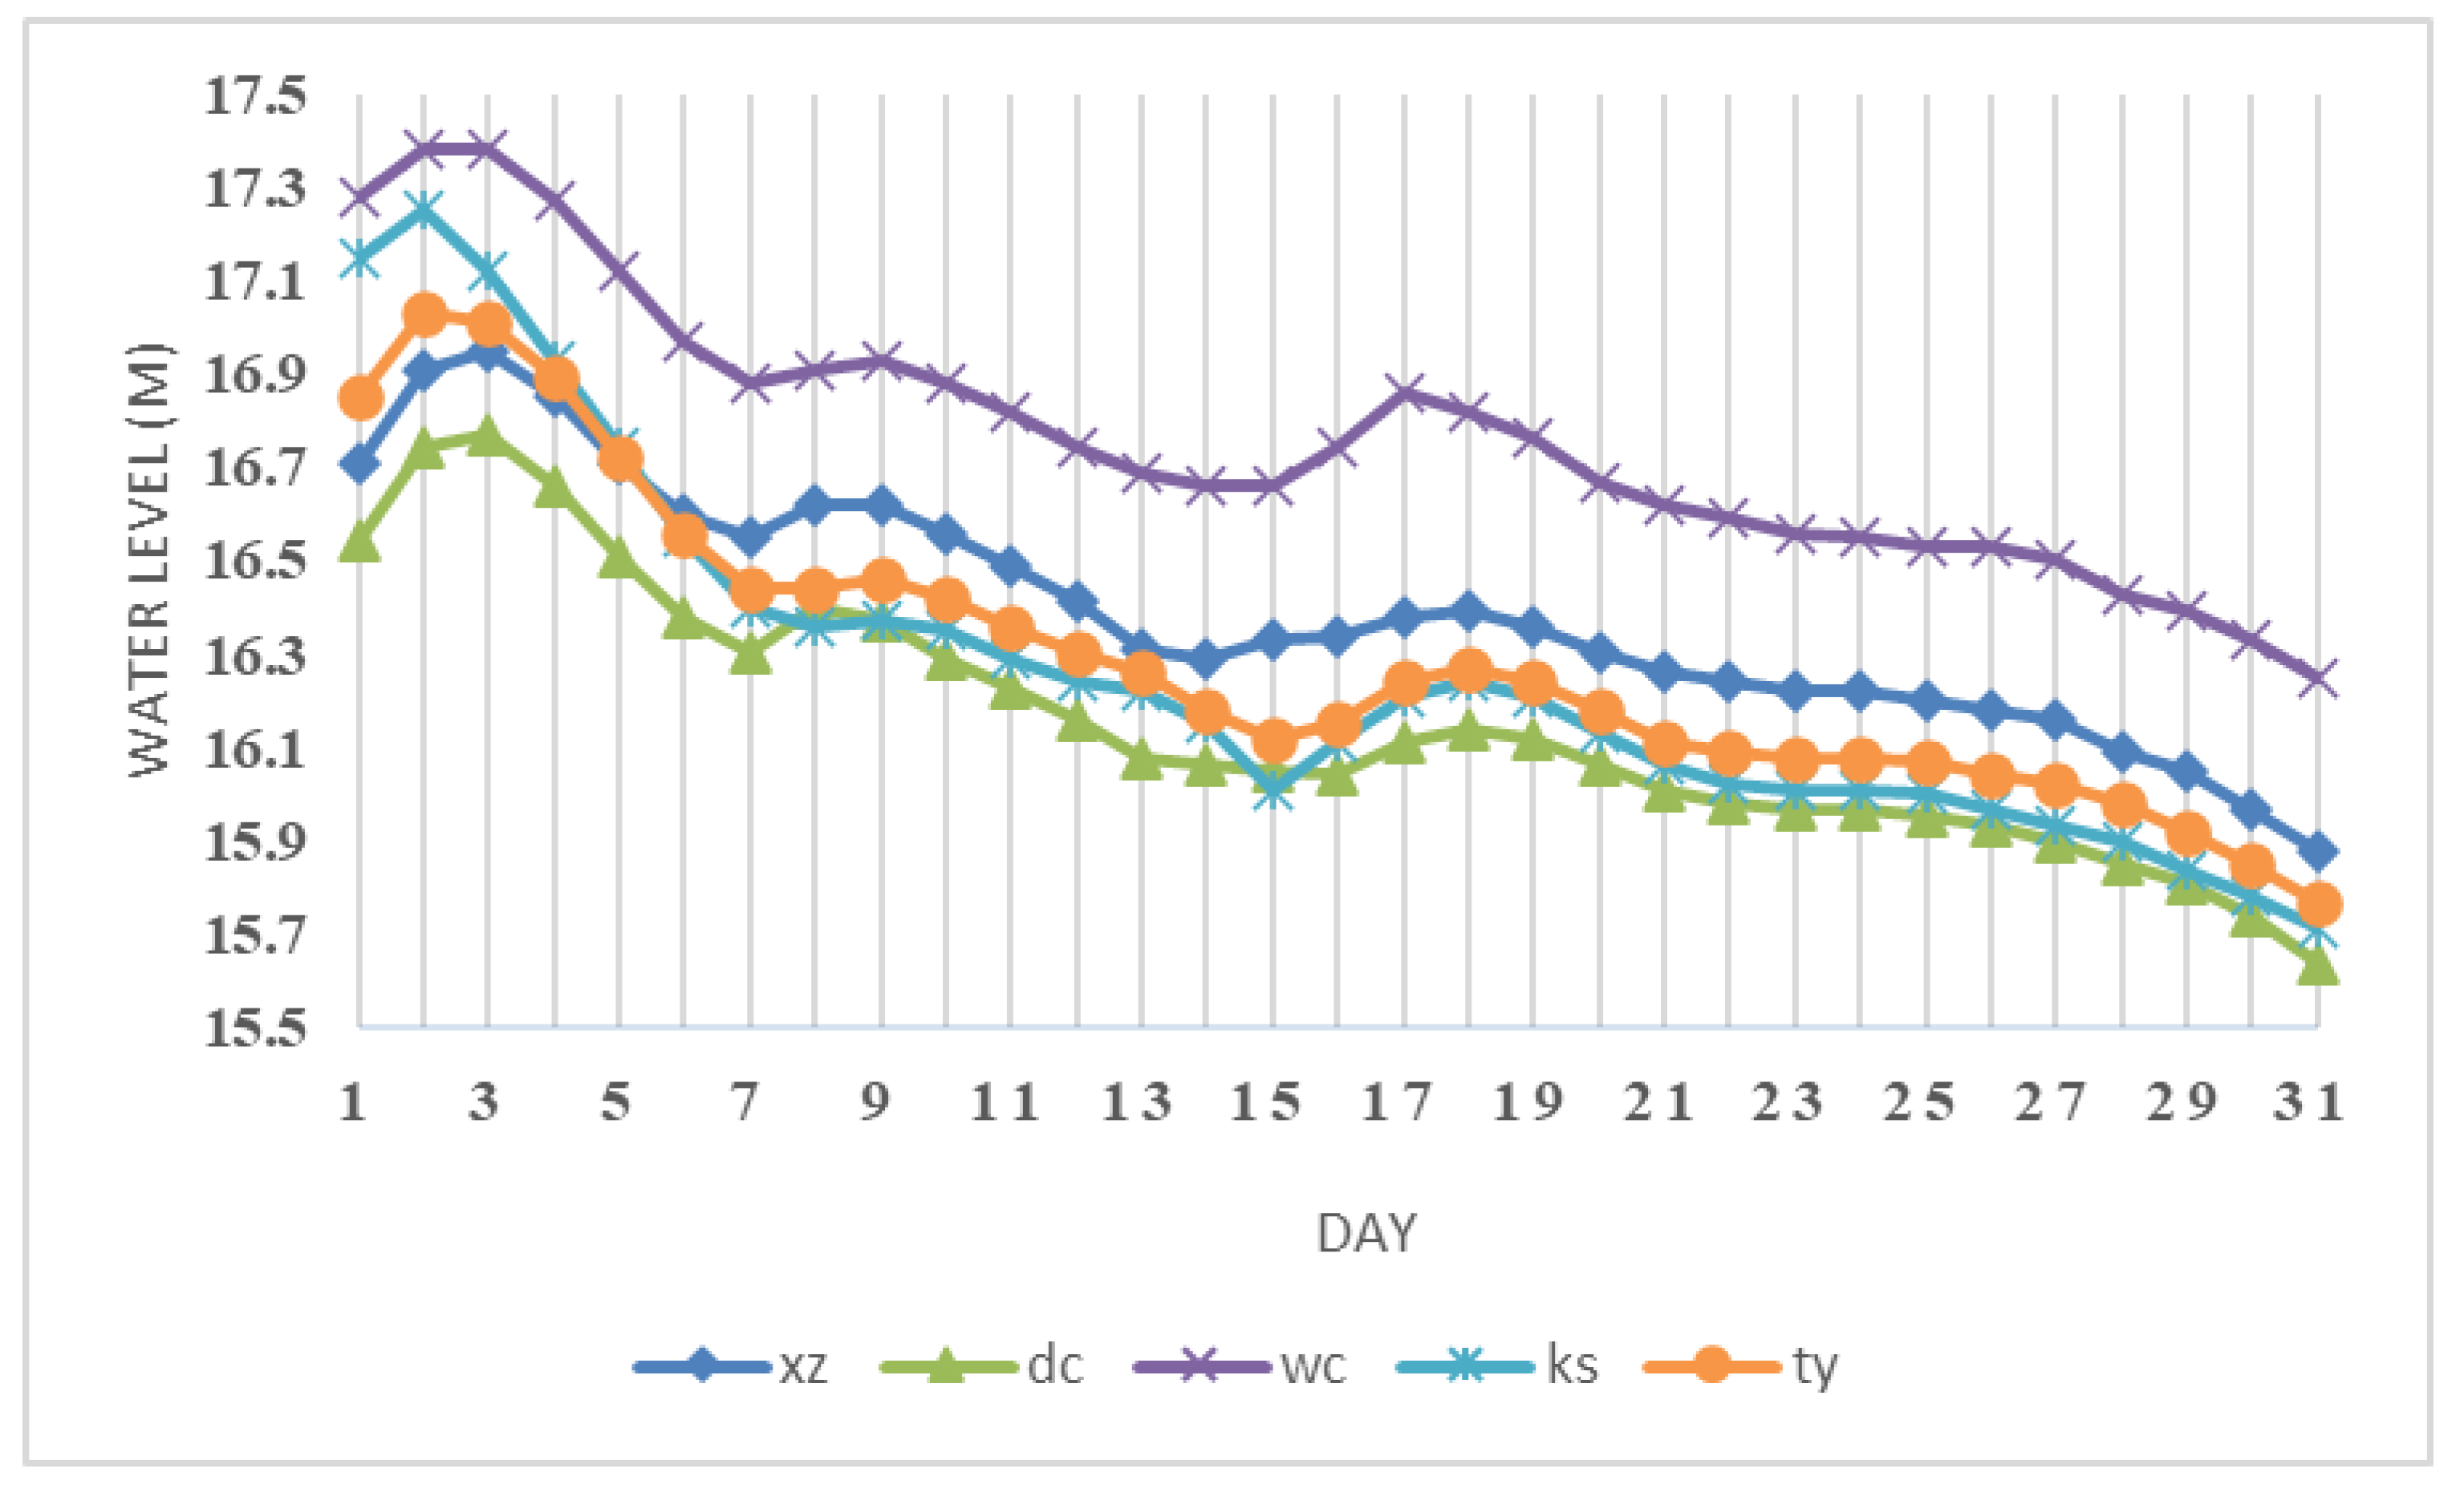
The study findings were in line with the conclusions summarized in previous studies [11,12]. The health status of Lake Poyang in the last few years has been ‘moderate’ or ‘good’ (Figure 3). TLI was the major influencing indicator (Table 3). Therefore, nutrient loadings should be reduced and eutrophication should be controlled to improve the health of the aquatic ecosystem in Poyang Lake. Furthermore, the findings showed the annual variability of health status indicators, such as extreme water level fluctuations, which have been seldom explored. The annual changes in the health status of the aquatic ecosystem in Poyang Lake were remarkable because of the influence of complex hydrological and hydrodynamic conditions. Therefore, the results indicated that the health status was in close relation with hydrological processes. Moreover, the evaluation results revealed that the health status of the aquatic ecosystem in Poyang Lake, a large floodplain lake, was comprehensively affected by many factors, not a single indicator, especially hydrographical features (elevation, water level fluctuations) and hydrodynamics (flow velocity). For example, the health status of the aquatic ecosystem in the boundary area between the eastern region and the southern region changed from good to bad in a few km (Figure 7). This may be due to the fact that the eastern region and the southern region differ significantly in flow velocity and elevation (Figure 9a). Furthermore, Poyang Lake undergoes dramatic intra-annual water level fluctuations and has been described as ‘‘flooding like the sea, drying like a thread” [47]. Thus, large-scale samplings were only in dry season, such as ‘‘July”. However, water levels in July 2013 showed marked daily variations (Figure 10). Sampling in wet season could often be quite fortuitous. Namely, samplings on July 6 and July 7 may be different. Therefore, the aquatic ecosystem health evaluation results based on monitored dataset in wet season should be interpreted with caution. In addition, compared with previous studies [11,12], this study attempted to assess the actual health status rather than the relative health status.
5. Conclusions
The assessment of the health status of the aquatic ecosystem in freshwater lakes at spatial and temporal scales has become a significant issue. This study assessed the health status of the aquatic ecosystem in Poyang Lake and illustrated its temporal and spatial characteristics through the extension method. The following conclusions could be summed up from this study. The index contained three element layers, including hydrologic characteristics, trophic status, and aquatic organisms. The six indicators were LWLa-D, MWLa-R, TLI, CB/DB, DI, and BI. The indicator thresholds were determined and the health status of the aquatic ecosystem was divided into three categories: ‘good’, ‘moderate’, and ‘bad’. The results showed that the health status of the aquatic ecosystem was mainly ‘moderate’, and remarkable seasonal and spatially differences in the health status were found. The spatial relative health status of the aquatic ecosystem from ‘good’ to ‘bad’ could be expressed as follows: the water area in central lakes was better than that in rivers and eastern regions. The temporal order of the relative health status of the aquatic ecosystem could be expressed as July (wet season or summer) being better than January (dry season or winter). The health status in April (rising season or spring) was similar to that in October (retreating season or autumn). The annual changes in the health status of the aquatic ecosystem in Poyang Lake were remarkable because of the influence of complex hydrological and hydrodynamic conditions. The results showed that lake eutrophication was the major influencing factor. Therefore, nutrient loadings should be reduced and eutrophication should be controlled to improve the health status of this lake. This study could serve as a theoretical foundation for recognizing the causes of health deterioration of the aquatic ecosystem of lakes and protecting the environment in Poyang Lake.
Author Contributions
Y.Z., H.Z., R.W. and G.Y. conceived and designed the research; Y.Z. and B.L. performed the experiments and analyzed the data; G.Y. and H.Z. collected Hydrological data; All authors contributed to writing the manuscript; Y.Z., B.L. and R.W. revised the manuscript. All authors have read and agreed to the published version of the manuscript.
Funding
This study was financially supported by the National Scientific Foundation of China (41701097 and 41801092).
Institutional Review Board Statement
Not applicable.
Informed Consent Statement
Not applicable.
Data Availability Statement
Data is contained within the article. Further data and materials requests should be addressed to [email protected]
Acknowledgments
The authors wish to thank Jiangxi Hydrological Bureau and the Lake Poyang Laboratory for Wetland Ecosystem Research for providing the data for this study.
Conflicts of Interest
The authors declare no conflict of interest.
References
- Hering, D.; Carvalho, L.; Argillier, C. Managing aquatic ecosystems and water resources under multiple stress—An introduction to the MARS project. Sci. Total Environ. 2015, 503, 10–21. [Google Scholar] [CrossRef] [PubMed]
- Jackson, M.C.; Loewen, C.J.G.; Vinebrooke, R.D.; Chimimba, C.T. Net effects of multiple stressors in freshwater ecosystems: A meta-analysis. Glob. Chang. Biol. 2016, 22, 180–189. [Google Scholar] [CrossRef] [PubMed]
- Zhao, Q.; Huang, G.; Qian, H. Ecological environment and sustainable development of Poyang Lake. Acta Pedol. Sinica 2007, 44, 318–326. [Google Scholar]
- Yang, G.S.; Ma, R.H.; Zhang, L.; Jiang, J.H.; Yao, S.H.; Zhang, M.; Zeng, H.A. Lake status, major problems and protection strategy in China. J. Lake Sci. 2010, 22, 799–810. (In Chinese) [Google Scholar]
- Rapport, D.J. Evaluating ecosystem health. J. School Health 1992, 1, 15–24. [Google Scholar] [CrossRef]
- Silow, E.A.; Mokry, A.V. Exergy as a Tool for Ecosystem Health Assessment. Entropy 2010, 12, 902–925. [Google Scholar] [CrossRef] [Green Version]
- Zhang, Y.H.; Yang, G.S.; Wan, R.R.; Zhu, H.Y. Research on Ecosystem Health Assessment Indices and Thresholds of a Large Yangtze-connected Lake, Poyang Lake. Appl. Ecol. Environ. Res. 2019, 17, 11701–11716. [Google Scholar] [CrossRef]
- Xu, F.L.; Tao, S.; Dawson, R.W.; Li, P.G.; Cao, J. Lake ecosystem health assessment: Indicators and methods. Water Res. 2001, 35, 3157–3167. [Google Scholar] [CrossRef]
- Xu, F.; Yang, Z.F.; Chen, B.; Zhao, Y.W. Ecosystem Health Assessment of Baiyangdian Lake Based on Thermodynamic Indicators. Procedia Environ. Sci. 2012, 13, 2402–2413. [Google Scholar] [CrossRef] [Green Version]
- Kane, D.D.; Gordon, S.I.; Munawar, M.; Charlton, M.N.; Culver, D.A. The Planktonic Index of Biotic Integrity (P-IBI): An approach for assessing lake ecosystem health. Ecol. Indic. 2009, 9, 1234–1247. [Google Scholar] [CrossRef]
- Zhang, Y.H.; Yang, G.S.; Li, B.; Cai, Y.J.; Chen, Y.W. Using eutrophication and ecological indicators to assess ecosystem condition in Poyang Lake a Yangtze connected lake. Aquat. Ecosyst. Health Manag. 2016, 19, 29–39. [Google Scholar] [CrossRef]
- Qi, L.Y.; Huang, J.C.; Huang, Q.; Gao, J.F.; Wang, S.G.; Guo, Y.Y. Assessing aquatic ecological health for Lake Poyang, China: Part II Index application. Water 2018, 10, 909. [Google Scholar] [CrossRef] [Green Version]
- Wong, H.; Hu, B.Q. Application of interval clustering approach to water quality evaluation. J. Hydrol. 2013, 491, 1–12. [Google Scholar] [CrossRef]
- Cai, W.; Lin, W.C. Extension Engineering Method; Science Press: Beijing, China, 1997. [Google Scholar]
- Wong, H.; Hu, B.Q. Application of improved extension evaluation method to water quality evaluation. J. Hydrol. 2014, 509, 539–548. [Google Scholar] [CrossRef]
- Hu, B. Application of extension assessment method. Shuili Xuebao 2000, 2, 66–70. (In Chinese) [Google Scholar]
- Liu, Y.B.; Wu, G.P.; Zhao, X.S. Recent declines in China’s largest freshwater lake: Trend or regime shift? Environ. Res. Lett. 2013, 8, 014010. [Google Scholar] [CrossRef]
- Wang, Y.Y.; Jia, Y.F.; Guan, L.; Cai, L.; Lei, G.C.; Li, W.; Liu, G.H. Optimising hydrological conditions to sustain wintering waterbird populations in Poyang Lake National Natural Reserve: Implications for dam operations. Freshwater Biol. 2013, 58, 2366–2379. [Google Scholar] [CrossRef]
- Hu, Z.P.; Ge, G.; Liu, C.; Chen, F.; Li, S. Structure of Poyang Lake Wetland Plants Ecosystem and Influence of Lake Water Level for the Structure. Resour. Environ. Yangtze Basin 2010, 19, 597–605. (In Chinese) [Google Scholar]
- Zhang, Q.; Ye, X.; Werner, A.D.; Li, Y.L.; Yao, J.; Li, X.H.; Xu, C.Y. An investigation of enhanced recessions in Poyang Lake: Comparison of Yangtze River and local catchment impacts. J. Hydrol. 2014, 517, 425–434. [Google Scholar] [CrossRef] [Green Version]
- Zhang, Q.; Li, L.; Wang, Y.; Werner, A.D.; Xin, P.; Jiang, T.; Barry, D.A. Has the Three-Gorges Dam made the Poyang Lake wetlands wetter and drier? Geophys. Res. Lett. 2012, 39, L20402. [Google Scholar] [CrossRef] [Green Version]
- Yang, G.; Zhang, Q.; Wan, R.; Lai, X.; Jiang, X.; Li, L.; Dai, H.; Lei, G.; Chen, J.; Lu, Y. Lake hydrology, water quality and ecology impacts of altered river-lake interactions: Advances in research on the middle Yangtze river. Hydrol. Res. 2016, 47 (Suppl. S1), 1–7. [Google Scholar] [CrossRef]
- Zhu, H.H.; Zhang, B. Poyang Lake, 1st ed.; Press of University of Science and Technology of China: Hefei, China, 1997. (In Chinese) [Google Scholar]
- Committee, C. Research on Poyang Lake; Shanghai Scientific & Technical Publishers: Shanghai, China, 1988. (In Chinese) [Google Scholar]
- Shankman, D.; Keim, B.D.; Song, J. Flood frequency in China’s Poyang Lake region: Trends and teleconnections. Int. J. Climatol. 2006, 26, 1255–1266. [Google Scholar] [CrossRef] [Green Version]
- Cheng, X.Y.; Li, S.J. An analysis on the evolvement processes of lake eutrophication and their characteristics of the typical lakes in the middle and lower reaches of Yangtze River. Chin. Sci. Bull. 2006, 51, 1603–1613. [Google Scholar] [CrossRef]
- Chen, G.J.; Zhou, W.B.; Li, M.T. Research on the Effect of Nitrogen and Phosphorus on the Phytoplankton Community in Poyang Lake. China Rural Water Hydropower 2013, 3, 48–61. (In Chinese) [Google Scholar]
- Committee, C. Atlas of Poyang Lake; Science Press: Beijing, China, 1993. (In Chinese) [Google Scholar]
- Xie, Q.M.; Li, C.C.; Peng, C.L. Primary Studies on Community Ecology of Floating Algae in Poyang Lake. Jiangxi Sci. 2000, 18, 162–166. (In Chinese) [Google Scholar]
- Mjelde, M.; Hellsten, S.; Ecke, F. A water level drawdown index for aquatic macrophytes in Nordic lakes. Hydrobiologia 2013, 704, 141–151. [Google Scholar] [CrossRef]
- Wang, M.C.; Liu, X.Q.; Zhang, J.H. Evaluate method and classification standard on lake eutrophication. Environ. Monit. China 2002, 18, 47–49. (In Chinese) [Google Scholar]
- Wu, Z.S.; Zhang, D.; Cai, Y.; Wang, X.; Zhang, L.; Chen, Y. Water quality assessment based on the water quality index method in Lake Poyang: The largest freshwater lake in China. Sci. Rep. 2017, 7, 17999. [Google Scholar] [CrossRef]
- Xu, C.P.; Li, S.C.; Chai, W.B.; Chen, Y.W. A newly recorded cyanobacterial species in water blooms occurred in Lake Poyang—Merismperdia convoluta Breb. Kützing. J. Lake Sci. 2012, 24, 643–646. (In Chinese) [Google Scholar]
- Li, B.; Yang, G.S.; Wan, R.R.; Zhang, L.; Zhang, Y.h.; Dai, X. Using fuzzy theory and variable weights for water quality evaluation in Poyang Lake, China. Chin. Geogr. Sci. 2017, 27, 39–51. [Google Scholar] [CrossRef] [Green Version]
- Zhang, L.; Chen, X.; Zhang, Y.; Chen, L.; Zhang, P. Spatial distribution of water quality and its impacting factor in the wet season of Poyang Lake using the hydro-geomorphological partitions. China Environ. Sci. 2014, 34, 2637–2645. [Google Scholar]
- Fan, F.P. The Study of Hydrodynamic Simulation of Poyang Lake Based on Delft3D Model; Jiangxi Normal University: Nanchang, China, 2010. (In Chinese) [Google Scholar]
- Wan, R.R.; Dai, X.; David, S. Vegetation Response to Hydrological Changes in Poyang Lake, China. Wetlands. 2019, 39, 99–112. [Google Scholar] [CrossRef]
- Xu, F.L. Exergy and structural exergy as ecological indicators for the development state of the Lake Chaohu ecosystem. Ecol. Model. 1997, 99, 41–49. [Google Scholar] [CrossRef]
- Xu, F.L.; Lam, K.C.; Zhao, Z.Y.; Zhan, W.; Chen, Y.D.; Tao, S. Marine coastal ecosystem health assessment: A case study of the Tolo Harbour, Hong Kong, China. Ecol. Model. 2004, 173, 355–370. [Google Scholar] [CrossRef]
- Wu, Z.; Cai, Y.; Liu, X.; Xu, C.P.; Chen, Y.; Zhang, L. Temporal and spatial variability of phytoplankton in Lake Poyang: The largest freshwater lake in China. J. Great Lakes Res. 2013, 39, 476–483. [Google Scholar] [CrossRef]
- Paerl, H.W.; Valdes, L.M.; Pinckney, J.L.; Piehler, M.F.; Dyble, J.; Moisander, P.H. Phytoplankton photopigments as indicators of estuarine and coastal eutrophication. BioScience 2003, 53, 953–964. [Google Scholar] [CrossRef] [Green Version]
- Bovo-Scomparin, V.M.; Train, S. Long-term variability of the phytoplankton community in an isolated floodplain lake of the Ivinhema River State Park, Brazil. Hydrobiologia 2008, 610, 331–344. [Google Scholar] [CrossRef]
- De Emiliani, M.O.G. Effects of water level fluctuations on phytoplankton in a river-floodplain lake system (Paraná River, Argentina). Hydrobiologia 1997, 357, 1–15. [Google Scholar] [CrossRef]
- Wantzen, K.; Rothhaupt, K.-O.; Mortl, M.; Cantonati, M.; Toth, L.G.; Fischer, P. Ecological effects of water-level fluctuations in lakes: An urgent issue. Hydrobiologia 2008, 613, 1–4. [Google Scholar] [CrossRef] [Green Version]
- Evitmova, V.V.; Donhoue, I. Water-level fluctuations regulate the structure and functioning of natural lakes. Freshwater Biol. 2016, 61, 251–264. [Google Scholar] [CrossRef]
- Zou, Z.H.; Yun, Y.; Sun, J.N. Entropy method for determination of weight of evaluating in fuzzy synthetic evaluation for water quality assessment indicators. J. Environ. Sci. 2006, 18, 1020–1023. [Google Scholar] [CrossRef]
- Dai, X.; Wan, R.R.; Yang, G.S. Non-stationary water-level fluctuation in China’s Poyang Lake and its interactions with Yangtze River. J. Geogr. Sci. 2015, 25, 274–288. [Google Scholar] [CrossRef] [Green Version]
Figure 1.
Location of Poyang Lake.

Figure 2.
The structure of the aquatic ecosystem health assessment index at Poyang Lake.

Figure 3.
Aquatic ecosystem health status (a) and tendency (b) of Poyang Lake in 2013.

Figure 4.
Individual indicator grade and comprehensive grade of the aquatic ecosystem health assessment in Poyang Lake from 1999 to 2013.
Figure 4.
Individual indicator grade and comprehensive grade of the aquatic ecosystem health assessment in Poyang Lake from 1999 to 2013.


Figure 5.
Aquatic ecosystem assessment results of Poyang Lake in four seasons in 2013.

Figure 6.
Aquatic ecosystem assessment weights of Poyang Lake in four seasons in 2013 (a): dry season, (b): rising season; (c): wet season; and (d): retreating season. TLI, trophic state index; DI, diversity index of macrozoobenthos; CB/DB, ratio of cyanobacterial biomass to diatom biomass; LWLa-D, lowest water level anomaly during dry season; BI, biotic index; MWLa-R, mean water-level anomaly during rising season).


Figure 7.
Health status (a) and tendency (b) of the aquatic ecosystem of Poyang Lake in July 2013.

Figure 8.
Assessment weights of the aquatic ecosystem in Poyang Lake in June 2013.

Figure 9.
Partition map of Poyang Lake (a) and assessment results of the aquatic ecosystem in Poyang Lake in July 2013 (b). 1. Northern region connected to Yangtze River, 2. Northwestern region, 3. Central lake, 4. Eastern region, 5. Southern region.
Figure 9.
Partition map of Poyang Lake (a) and assessment results of the aquatic ecosystem in Poyang Lake in July 2013 (b). 1. Northern region connected to Yangtze River, 2. Northwestern region, 3. Central lake, 4. Eastern region, 5. Southern region.

Figure 10.
Daily Water Level of five Stations of Poyang Lake in July 2013.


Table 1.
Summary of sampled variables and sites quantity in a specified month and year in Poyang Lake.
Table 1.
Summary of sampled variables and sites quantity in a specified month and year in Poyang Lake.
| Years | Months | Sites | Parameters |
|---|---|---|---|
| 1999 | More details seen in previous research [29] | Biological parameters (such as density of phytoplankton) | |
| 2007 and 2008 | October and June | 24 sites and 35 sites | Physical, biological and chemical parameters (TN, TP, CODmn, Chl-a, CB, DB, macrozoobenthic density and SD) |
| 2012 and 2013 | Quarterly (January, April, July and October) | 15 sites, 68 sites (July) | |
| 1999, 2007, 2008, 2012 and 2013 | From January to December, monthly | Seven sites | Water level |
TN: Total nitrogen; CODmn: Chemical oxygen demand; TP: Total phosphorus; Chl-a: chlorophyll a; CB: The biomass concentration of cyanobacteria; DB: The biomass concentration of diatom; SD: Secchi disk depth; Seven sites: Xingzi, Boyang, Wucheng, Hukou, Kangshan, Tangyin and Duchang.
Table 2.
Thresholds of indicators in Poyang Lake.
| Health Status/Indicators | CB/DB | DI | MWLa-R | BI | LWLa-D | TLI |
|---|---|---|---|---|---|---|
| Good | ≤0.4 | ≥2 | From −1.03 m to 1.05 m | 0–5.5 | From −0.76 m to 0.76 m | ≤40 |
| Moderate | 0.4–0.6 | 1–2 | From 1.05 m to 1.52 m and from −1.50 m to −1.03 m | 5.5–6.5 | From 0.76 m to 1.18 m and from −0.76 m to 1.18 m | 40–50 |
| Poor | 0–1 | 0–1 | From < −1.50 m to > 1.52 m | 6.5–10 | From <−1.18 m to > 1.18 m | ≥50 |
Table 3.
Aquatic ecosystem assessment results of Poyang Lake in 2013.
| Site | Weights | Grade | j*(p) | ||||||
|---|---|---|---|---|---|---|---|---|---|
| TLI | CB/DB | DI | BI | LWLa-D | MWLa-R | ||||
| 1 | 0.31 | 0.10 | 0.23 | 0.14 | 0.10 | 0.11 | 2 | 1.72 | −0.28 |
| 2 | 0.25 | 0.12 | 0.26 | 0.16 | 0.11 | 0.12 | 2 | 1.90 | −0.10 |
| 3 | 0.31 | 0.11 | 0.09 | 0.27 | 0.11 | 0.12 | 2 | 2.43 | 0.43 |
| 4 | 0.23 | 0.10 | 0.24 | 0.24 | 0.09 | 0.10 | 2 | 1.96 | −0.04 |
| 5 | 0.29 | 0.16 | 0.17 | 0.15 | 0.11 | 0.12 | 2 | 1.66 | −0.34 |
| 6 | 0.23 | 0.11 | 0.21 | 0.26 | 0.09 | 0.10 | 1 | 1.31 | 0.31 |
| 7 | 0.18 | 0.14 | 0.19 | 0.23 | 0.18 | 0.08 | 2 | 1.58 | −0.42 |
| 8 | 0.21 | 0.14 | 0.21 | 0.22 | 0.16 | 0.07 | 2 | 1.93 | −0.07 |
| 9 | 0.19 | 0.14 | 0.34 | 0.13 | 0.14 | 0.06 | 2 | 2.41 | 0.41 |
| 10 | 0.21 | 0.13 | 0.34 | 0.13 | 0.09 | 0.10 | 3 | 2.88 | −0.12 |
| 11 | 0.23 | 0.17 | 0.21 | 0.11 | 0.20 | 0.07 | 2 | 2.30 | 0.30 |
| 12 | 0.26 | 0.11 | 0.19 | 0.18 | 0.19 | 0.08 | 2 | 2.03 | 0.03 |
| 13 | 0.26 | 0.13 | 0.17 | 0.16 | 0.19 | 0.08 | 1 | 1.35 | 0.35 |
| 14 | 0.24 | 0.22 | 0.16 | 0.14 | 0.17 | 0.07 | 2 | 1.93 | −0.07 |
| 15 | 0.23 | 0.16 | 0.23 | 0.14 | 0.17 | 0.07 | 2 | 1.76 | −0.24 |
Table 4.
Assessment results of the aquatic ecosystem in Poyang Lake in recent years.
| Sites | Weights | Grade | j*(p) | ||||||
|---|---|---|---|---|---|---|---|---|---|
| TLI | CB/DB | DI | BI | LWLa-D | MWLa-R | ||||
| 2013 | 0.26 | 0.15 | 0.20 | 0.15 | 0.17 | 0.08 | 2 | 1.78 | −0.22 |
| 2012 | 0.23 | 0.14 | 0.22 | 0.18 | 0.12 | 0.11 | 1 | 1.39 | 0.39 |
| 2008 | 0.22 | 0.19 | 0.15 | 0.12 | 0.16 | 0.17 | 2 | 2.37 | 0.37 |
| 2007 | 0.21 | 0.06 | 0.18 | 0.13 | 0.12 | 0.30 | 3 | 2.54 | −0.46 |
| 1999 | 0.13 | 0.24 | 0.15 | 0.19 | 0.22 | 0.06 | 3 | 2.86 | −0.14 |
Table 5.
Geomorphological and hydrological characteristics of the different sections in Poyang Lake.
Table 5.
Geomorphological and hydrological characteristics of the different sections in Poyang Lake.
| Regions | Characteristics of Lake Surface and Depth | Flow Speed and Direction | Human Activities | Wusong Elevation (m) |
|---|---|---|---|---|
| Northern region connected to Yangtze River | Narrow waterway, deep | Faster velocity, northward flow | Sanding | −7~9.5 |
| Northwestern region | Semi-enclosed broad lake, relatively shallow | Uneven velocity, mixed flow direction | Complicated, sanding, high population density, fish farming, some inlets of river | 13~15 |
| Central lake | Broad lake, relatively shallow | Faster velocity, northward flow | Scarcely any affects | 9~13 |
| Eastern region | Lake Bay, depth of 1–3 m | Low flow rate | Substantial fish farming | 9~13 |
| Southern region | Washland and enclosed waters | Low flow rate or lentic lake | More inlets of river, serious pollution | 13~15 |
Publisher’s Note: MDPI stays neutral with regard to jurisdictional claims in published maps and institutional affiliations. |
© 2021 by the authors. Licensee MDPI, Basel, Switzerland. This article is an open access article distributed under the terms and conditions of the Creative Commons Attribution (CC BY) license (http://creativecommons.org/licenses/by/4.0/).
Share and Cite
MDPI and ACS Style
Zhang, Y.; Zhu, H.; Li, B.; Yang, G.; Wan, R. Aquatic Ecosystem Health Assessment of Poyang Lake through Extension Evaluation Method. Water 2021, 13, 211. https://doi.org/10.3390/w13020211
AMA Style
Zhang Y, Zhu H, Li B, Yang G, Wan R. Aquatic Ecosystem Health Assessment of Poyang Lake through Extension Evaluation Method. Water. 2021; 13(2):211. https://doi.org/10.3390/w13020211
Chicago/Turabian StyleZhang, Yanhui, Hongyun Zhu, Bing Li, Guishan Yang, and Rongrong Wan. 2021. "Aquatic Ecosystem Health Assessment of Poyang Lake through Extension Evaluation Method" Water 13, no. 2: 211. https://doi.org/10.3390/w13020211
Note that from the first issue of 2016, this journal uses article numbers instead of page numbers. See further details here.