Numerical Study on Seismic Response of Steel Storage Racks with Roller Type Isolator
by
 , , ,
, , ,
Oscar Álvarez
1 ,
,
Nelson Maureira
1,* ,
,
Eduardo Nuñez
1 ,
,
Frank Sanhueza
1 and
Ángel Roco-Videla
2,3 1
Departament of Civil Engineering, Universidad Católica de la Santísima Concepción, Concepción 4090541, Chile
2
Programa de Magíster en Ciencias Químico Biológicas, Facultad de Salud, Universidad Bernardo O’Higgins, Santiago 8370993, Chile
3
Facultad de Ingeniería, Universidad Autónoma de Chile, Providencia 7500912, Chile
*
Author to whom correspondence should be addressed.
Metals 2021, 11(1), 158; https://doi.org/10.3390/met11010158
Submission received: 28 December 2020
/
Revised: 9 January 2021
/
Accepted: 10 January 2021
/
Published: 16 January 2021
(This article belongs to the Special Issue Advances in Structural Steel Research)
Abstract
:This research evaluates the effectiveness of using a roller-type base isolation device with tensile strength in reducing the dynamic response of industrial steel storage racks. These were subjected to a seismic input acting separately in both directions of the structure. The seismic record obtained from the earthquake that occurred in Llolleo, Chile, on 3 March 1985, was used as input. This earthquake was scaled in the frequency domain, adjusting its response spectrum to coincide with the design spectrum required by NCh2745. In the calculations of this spectrum, the most hazardous seismic zone (zone 3) and soft soil (soil III) that amplifies the effect of the low frequencies of the earthquake were considered. These frequencies are the ones that have the most affect on flexible structures such as high racks and systems with base isolation. Numerical time-history analyses were performed in fixed base racks and base isolation racks. In both cases, the models include semi-rigid connections with capacity for plastic deformation and energy dissipation. Parametric analyses were carried out considering the most relevant variables, using an algorithm programmed in MATLAB software. The maximum relative displacement, maximum basal shear load, and maximum absolute floor acceleration were considered as responses of interest. The results showed the effectiveness of using the base isolation device by reducing the absolute accelerations between approximately 75% and 90%, compared to the same fixed rack at its base. This makes it possible to reduce the vulnerability of the stored load to overturn under the action of a severe earthquake.
1. Introduction
There are various solutions for storing products and merchandise throughout the production process, with industrial storage racks being an alternative commonly used today by industry worldwide, and the selective type rack being the most widely used of them [1]. The structural configuration of the pallet racks consists of the combination of orthogonal frame systems, running parallel to the aisles, and frames are braced in a perpendicular direction to the aisles [2]. The bracing is used perpendicularly for practical reasons because it can affect storage capacity [3].
Industrial storage racks are structures that support operating much greater loads than their own weight [4]. The elements used to design these structures are cold-formed thin-walled steel elements. The columns are manufactured from open sections with perforations at standard intervals so that the beam and diagonals of the lattice system can be connected in a modular way. The material commonly used is carbon steel according to ASTM-A36. The beams have a generally rectangular closed section, composed of two C-sections with stiffened wings with discontinuous welded joints between them in the longitudinal direction [5,6,7,8]. These structures are designed to be narrow perpendicular to the aisles, while they are longer in a parallel direction to them [3]. Industrial storage racks can reach heights that exceed 10 m with a high vertical load, reaching very large slendernesses —height/width ratio—[9]. All of the above leads to the racks being vulnerable to seismic action, as well as their content [10,11], being a risk for people who regularly walk near them [12].
In the last decade, research in relation to steel racks has focused on reducing design uncertainty by refining analysis methodologies and characterizing earthquake-resistant components and their connections [13,14,15,16]. It has been determined that the uncertainty in the designs is because racks, particularly tall and slender ones, are affected by global, local and distortionary instability, due to the slenderness of their elements [13]. These structures have a high probability of inelastic incursion in beam-column connections [14] and column-base connection [15]. Kwarteng et al. [16] performed characterization tests of the moment-rotation relationship in beam-column connections of racks in order to reduce uncertainties in the design of racks. They proposed a model of characteristic curves of the moment-rotation relationship for seismic analysis, which they applied numerically to a frame under different seismic actions.
An alternative to address the problems of rack instability in the face of seismic action is the use of seismic protection systems. In this sense, Gutelius et al. [17] developed a device designed to protect racks for storage of sensitive electronic equipment such as computers and servers. Later, Pellegrino et al. [18] patented a specific base isolation system for palletized industrial storage racks. This solution allows the rack to be isolated seismically only in the direction transverse to the aisle, with no effect in the longitudinal direction [19]. In such a device, the uplift resistance is provided through a vertical displacement restriction mechanism, which shows a composite of elastomer sheets working in compression. The elastomer also helps restore the undeformed position, existing friction dissipated due to sliding at the base and inelastic behavior of the elastomer [19].
Kilar et al. [20], evaluated the economic feasibility of implementing an elastomeric seismic isolation system in industrial storage racks. The cost of the isolation implementation turned out to be comparable with the cost of the repairs of structural elements, the halt to productive activity and losses of products in the face of the action of a severe earthquake. However, other aspects, such as workers and customers who transit in areas near the industrial storage racks’ safety, have not been evaluated. In Chile, research on industrial steel storage systems with seismic protection systems subjected to Chilean earthquakes is limited. Furthermore, the current standard NCh2369 [21] does not contemplate the implementation of these types of seismic protection systems in racks. NCh2745 “Analysis and design of buildings with basal insulation” [22] can only be considered as a reference, as it is not applicable to storage rack structures.
The effect of local instability on capacity of steel beams exposed to fire was conducted by Kodur et al. [23]. In this numerical study, the behavior of fire exposed steel beams taking into consideration temperature-induced instabilities was performed. The results show that shear capacity in steel beams can degrade higher than moment capacity. These considerations can be important when steel storage racks are used. Finally, the effect of nonuniform bending on the lateral torsional buckling of steel beams with slender cross-section at elevated temperatures was studied by Couto et al. [24]. In this research, the influence of fire in local buckling using a numerical model obtained a new factor for design procedure according to Eurocode 3.
In this research, the seismic behavior of base isolated racks is studied using a roller-type device with tensile strength [25,26]. This device is connected at the base of the structure by means of a flexible cable attached to a post-tensioned element inside the device, which gives it lateral stiffness. The device can dissipate energy due to work between rotation and friction on the ball joint of the isolation bearing. In addition, the rotation with respect to its support allows the uncoupling of the superstructure from the ground. The device is vertically very rigid, and its lateral stiffness is controlled by the tension of a post-tensioned element inside it. The evaluated device offers baseline isolation in both directions of analysis [25]. The main objective of this research is to evaluate the effectiveness of the use of base isolation in reducing seismic demand, through a numerical study of racks with both fixed and isolated bases subjected to Chilean earthquakes.
2. Numerical Model
In this research, the effect of implementing a base isolation with a roller-type device in reducing the seismic response of racks was evaluated using numerical time-history analysis in MATLAB version R2014b software (MathWorks, Inc., Naticks, MA, United States). As an external dynamic action, a Chilean seismic record was considered acting in both directions separately. Two types of structural models for racks with different support conditions were analyzed: fixed at the base and with base isolation; in both cases, the beam-column connections are considered semi-rigid. The Bouc–Wen differential equation [27] was used in its modeling, adjusting its parameters with available experimental results as considered by Bernuzzi and Simoncelli [28].
The formulation of the racks’ non-linear time-history analysis model considers second-order effects and non-linearity of the material by means of an elastic-plastic constitutive law concentrated on the connections, similar to that used by [28]. The model considered the Euler–Bernoulli stiffness matrix and consistent mass matrix—mass distributed throughout the element—of bar-like elements in beams and columns with 12 degrees of freedom per element. Additionally, the bracing was considered articulated at its two ends, presenting only axial stiffness. The gravitational live load corresponds to two pallets installed at each level, considering its dynamic behavior as a rectangular rigid body weighing 2 tonf. Said consideration allows taking into account the contribution of the translational inertia in both horizontal directions plus the rotational inertia in a vertical axis. These inertial properties were applied in the center of the diaphragm area considered at each load level of the rack. The non-linearity of the material and second-order effects such as P-delta plus large displacements were considered in the analyses by incorporating geometric stiffness matrices in columns and bracing elements. These were updated at each moment of the dynamic analysis considering the instantaneous axial load to which each element is subjected.
2.1. General Description of Numerical Model
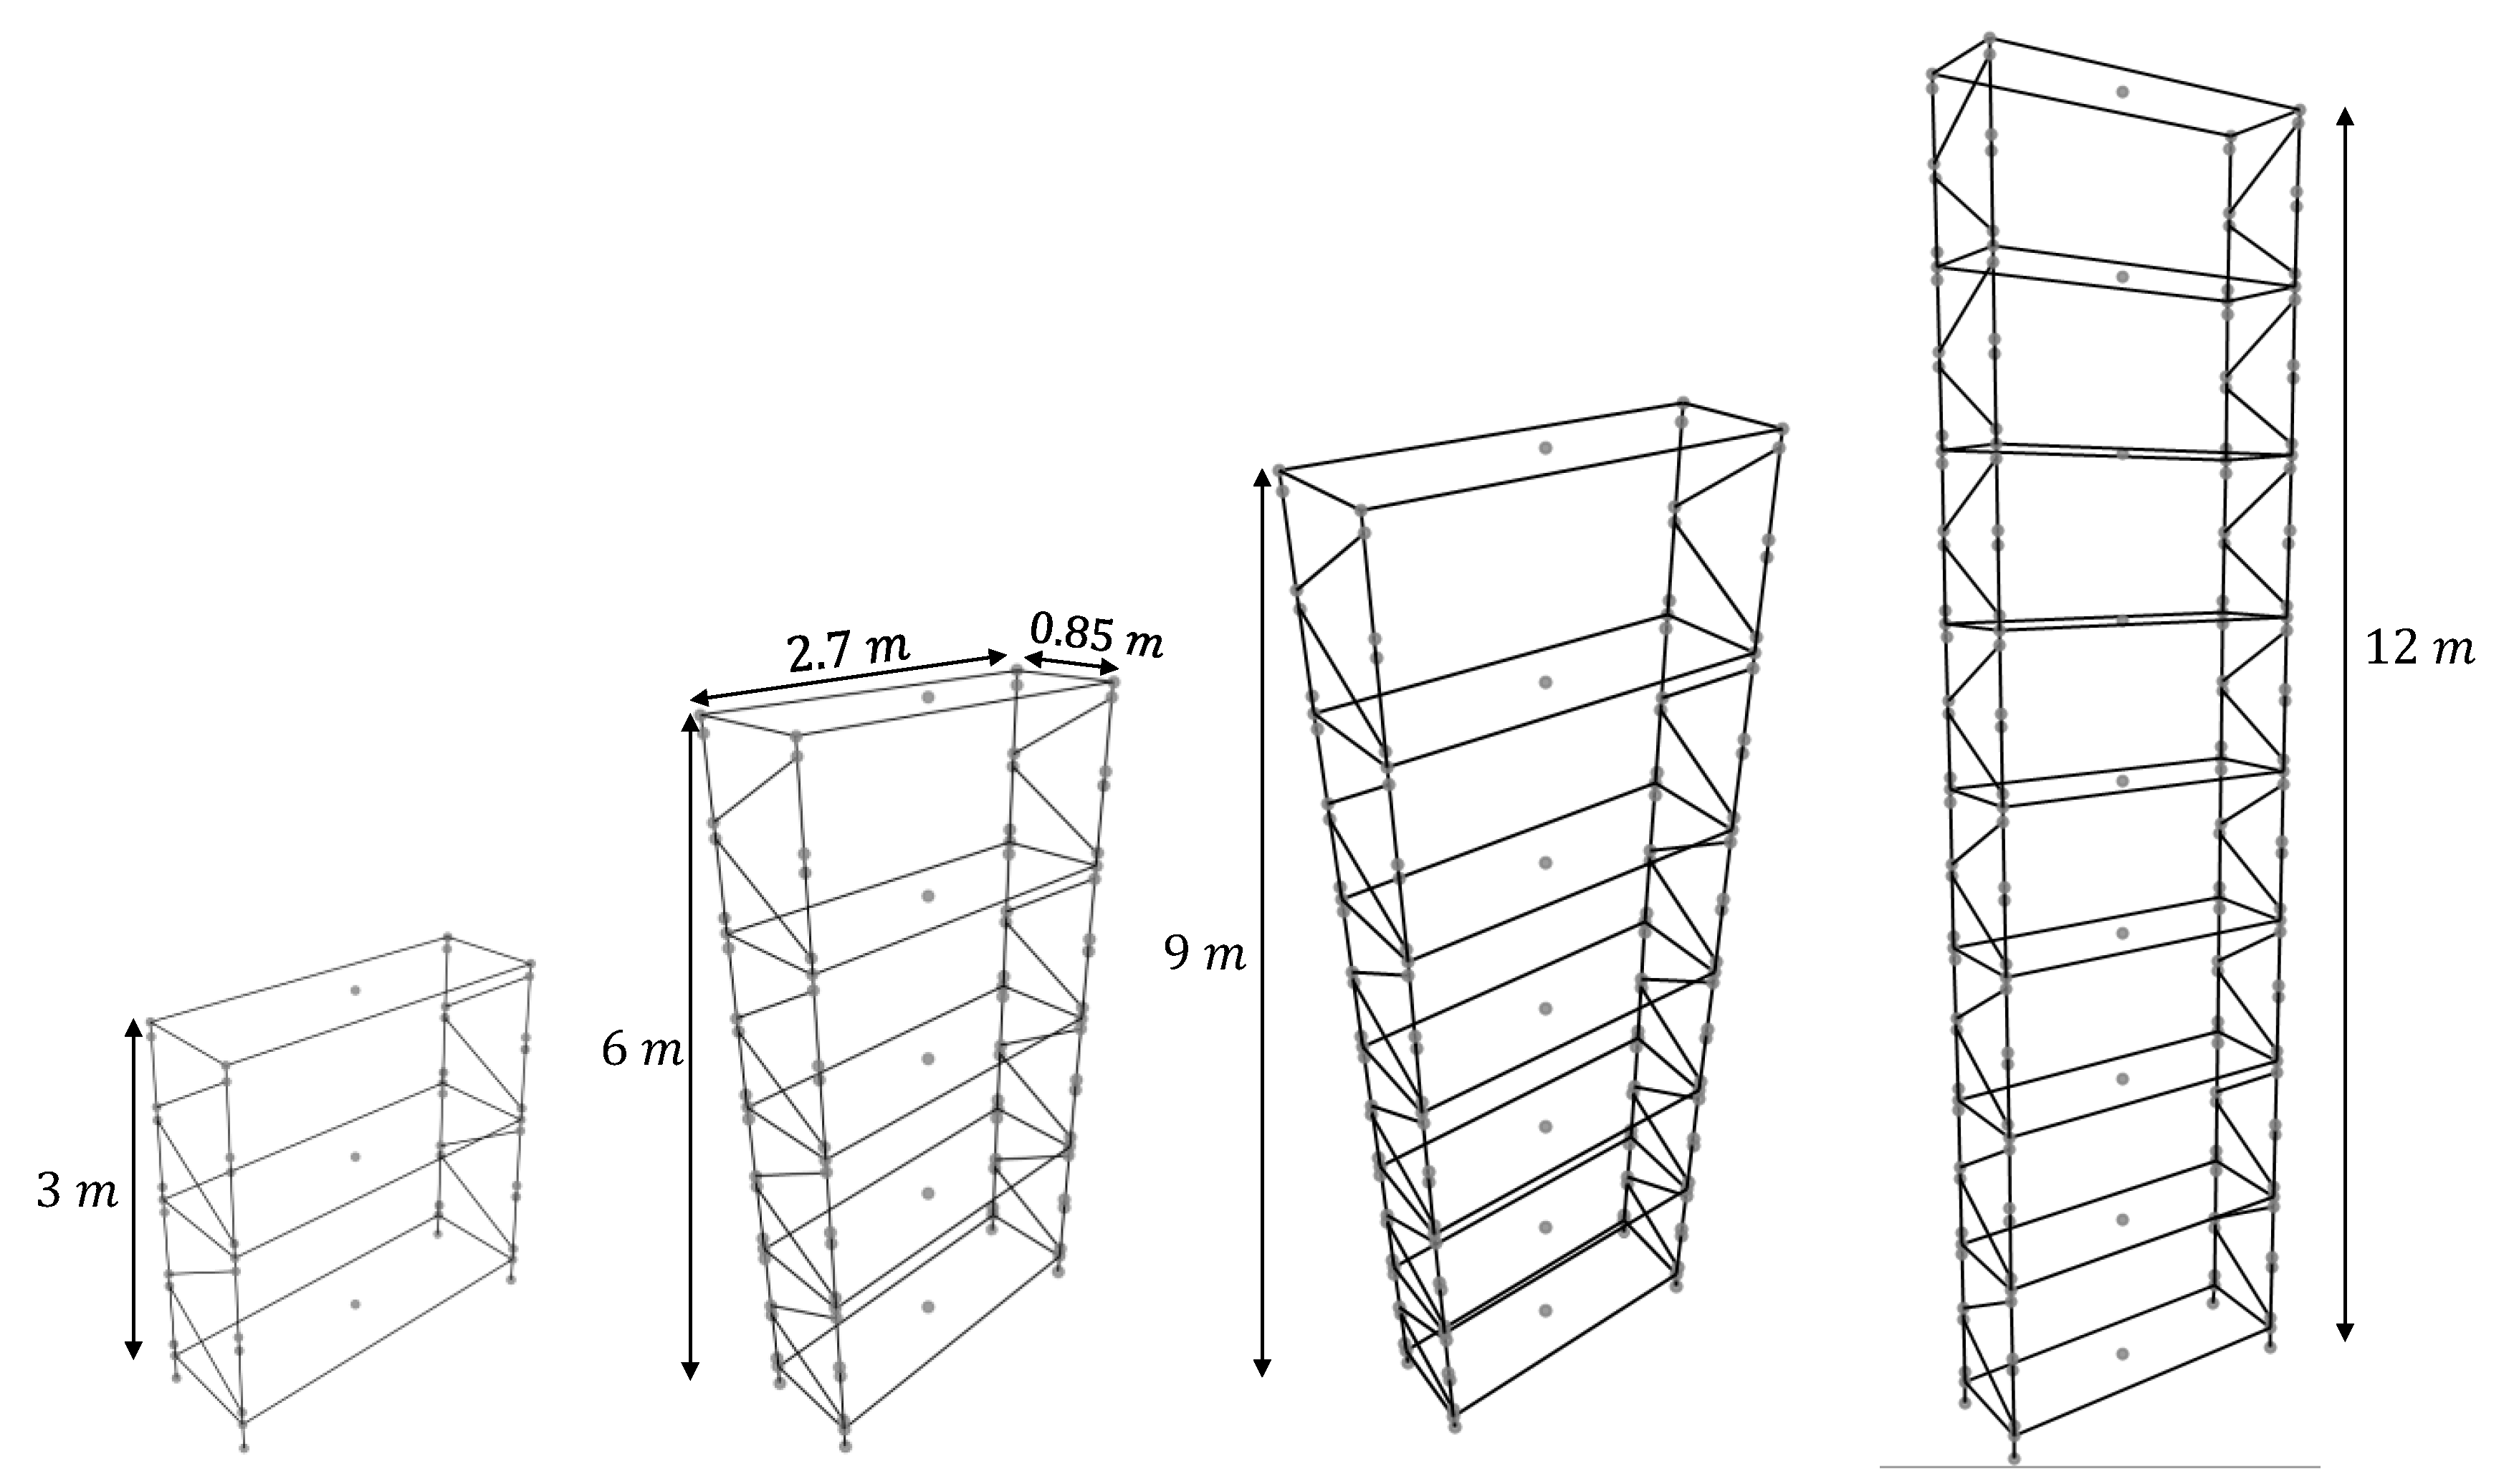
The rack models were designed with a height of 1.5 m between each load level, the width cross the aisles was 0.85 m, and the length parallel to the aisles was 2.7 m, all measured between the axes of structural elements. The columns considered have cross-section type Tx 100 × 105 × 3 mm, the longitudinal beams have cross-section type TC 125 × 50 × 2 mm, the cross-section type CA 45 × 22 × 2 mm and the bracing sections type C 58 × 22 × 2 mm. Details of this section can be obtained in [29]. Racks with 2, 4, 6 and 8 load levels (Np) were analyzed, shown in Figure 1. The internal damping of the structure was considered 3% of the critical damping, according to NCh2369 [21]. The ASTM A36 material was used in the numerical model because it is commonly used in Chile for steel storage racks.
Each of the racks shown above (Figure 1) was analyzed fixed at its base and with base isolation. For the latter, a base isolation device of the rolling type with tensile strength was considered [25]. For each of the racks with base isolation, five different isolation periods were considered: TI = 3, 3.5, 4, 4.5 and 5 s. To evaluate the effect of the dissipation capacity of the isolation device on the response of the rack, three friction coefficients were considered on the device’s ball joint (Figure 2 and Figure 3), where µ = 0.2, 0.4 and 0.6. The range for this parameter was chosen considering as a reference that the friction coefficient between steel-steel is µ = 0.4. Each rack with baseline isolation was analyzed considering all possible combinations between the three values of friction coefficient µ, and the five values of the isolation period TI mentioned above, with a total of 15 cases with baseline isolation per rack.
2.2. Description of Roller Type Isolator
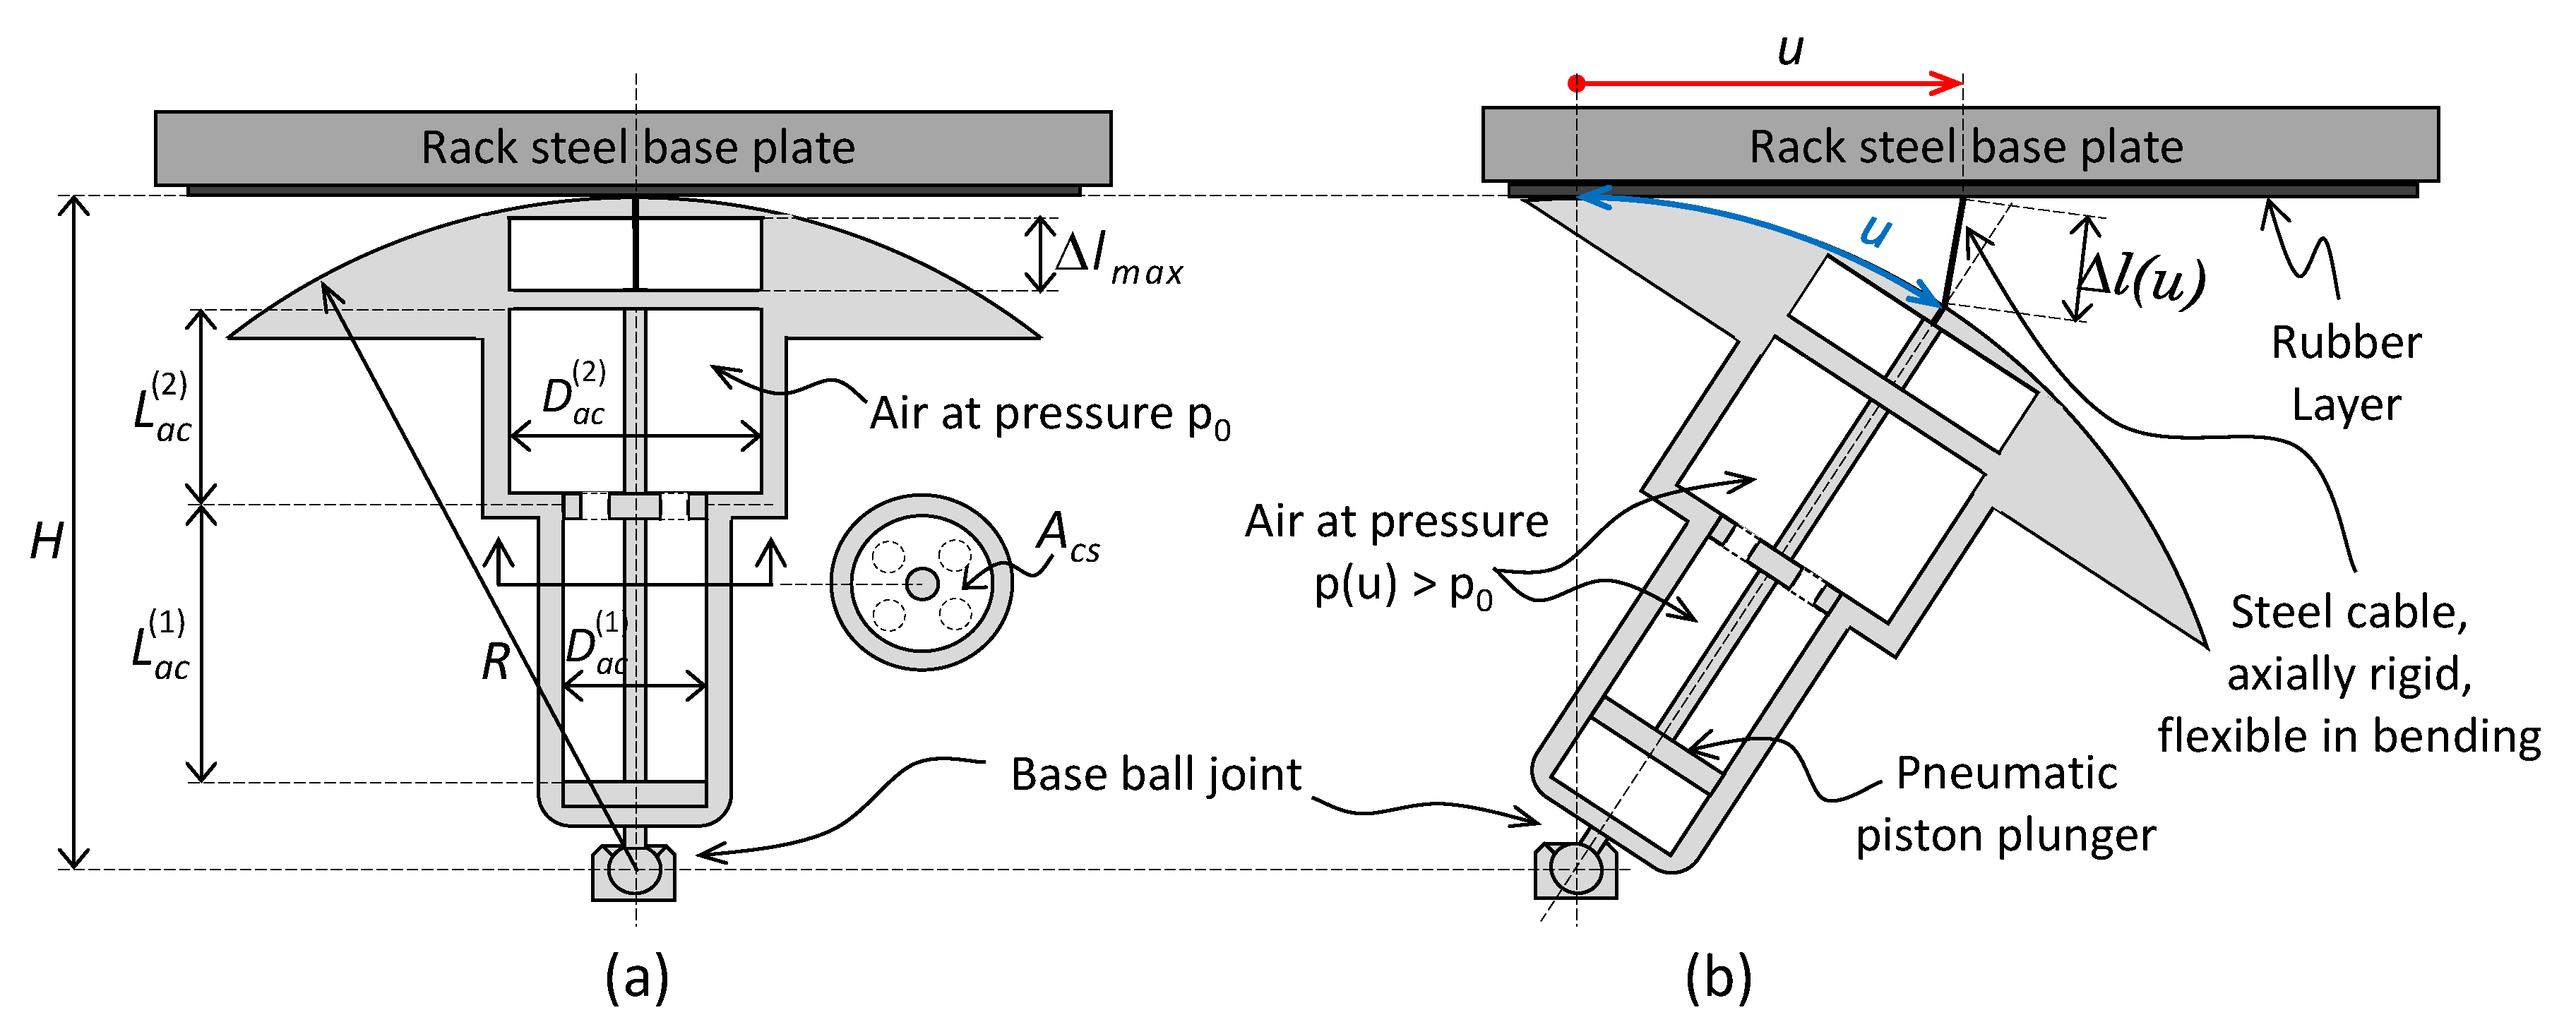
The device (Universidad Católica de la Santísima Concepción, Concepción, Chile) consists of a hinged base support that includes a ball joint connected to a central cylindrical body on which a head with a spherical surface is located. The ball joint in the basal bearing of the isolator restricts the movements in the three Cartesian axes but allows it to rotate in them. This makes the isolator allow the structure to move laterally in the two orthogonal directions of the plant or, in general, in any horizontal direction. Because the device is a rigid mechanism, the vertical displacement of the superstructure at the point of contact with the isolator is restricted. Therefore, the isolation device used can seismically isolate the structure in any horizontal direction, but it has no effect on isolating the vertical vibrations of the earthquake. On the isolator’s head, the base of the superstructure corresponding to the base plate in the rack columns is arranged by contact. Between the latter and the head of the isolator, an elastomer sheet facilitates the rolling of the rack on the device. It helps distribute the load transmitted in the contact between them. The isolator’s cylindrical body has a post-tensioned elastic element inside it that deforms due to the lateral displacement of the device. In this investigation, said element corresponds to a compressed air piston whose walls are the body of the isolator. The mobile shaft of said piston is connected to the base of the rack columns using an inextensible cable. This cable offers resistance to lateral displacement generating a stabilizing moment directly associated with the lateral stiffness of the isolator. The tension of said cable also reduces the probability of the rack lifting at its point of contact with the isolator. The friction in the ball joint of the basal support of the device allows energy dissipation due to the work between the rotation and the friction, which is proportional to the axial load transmitted by the structure. The device described above is shown schematically in Figure 2.
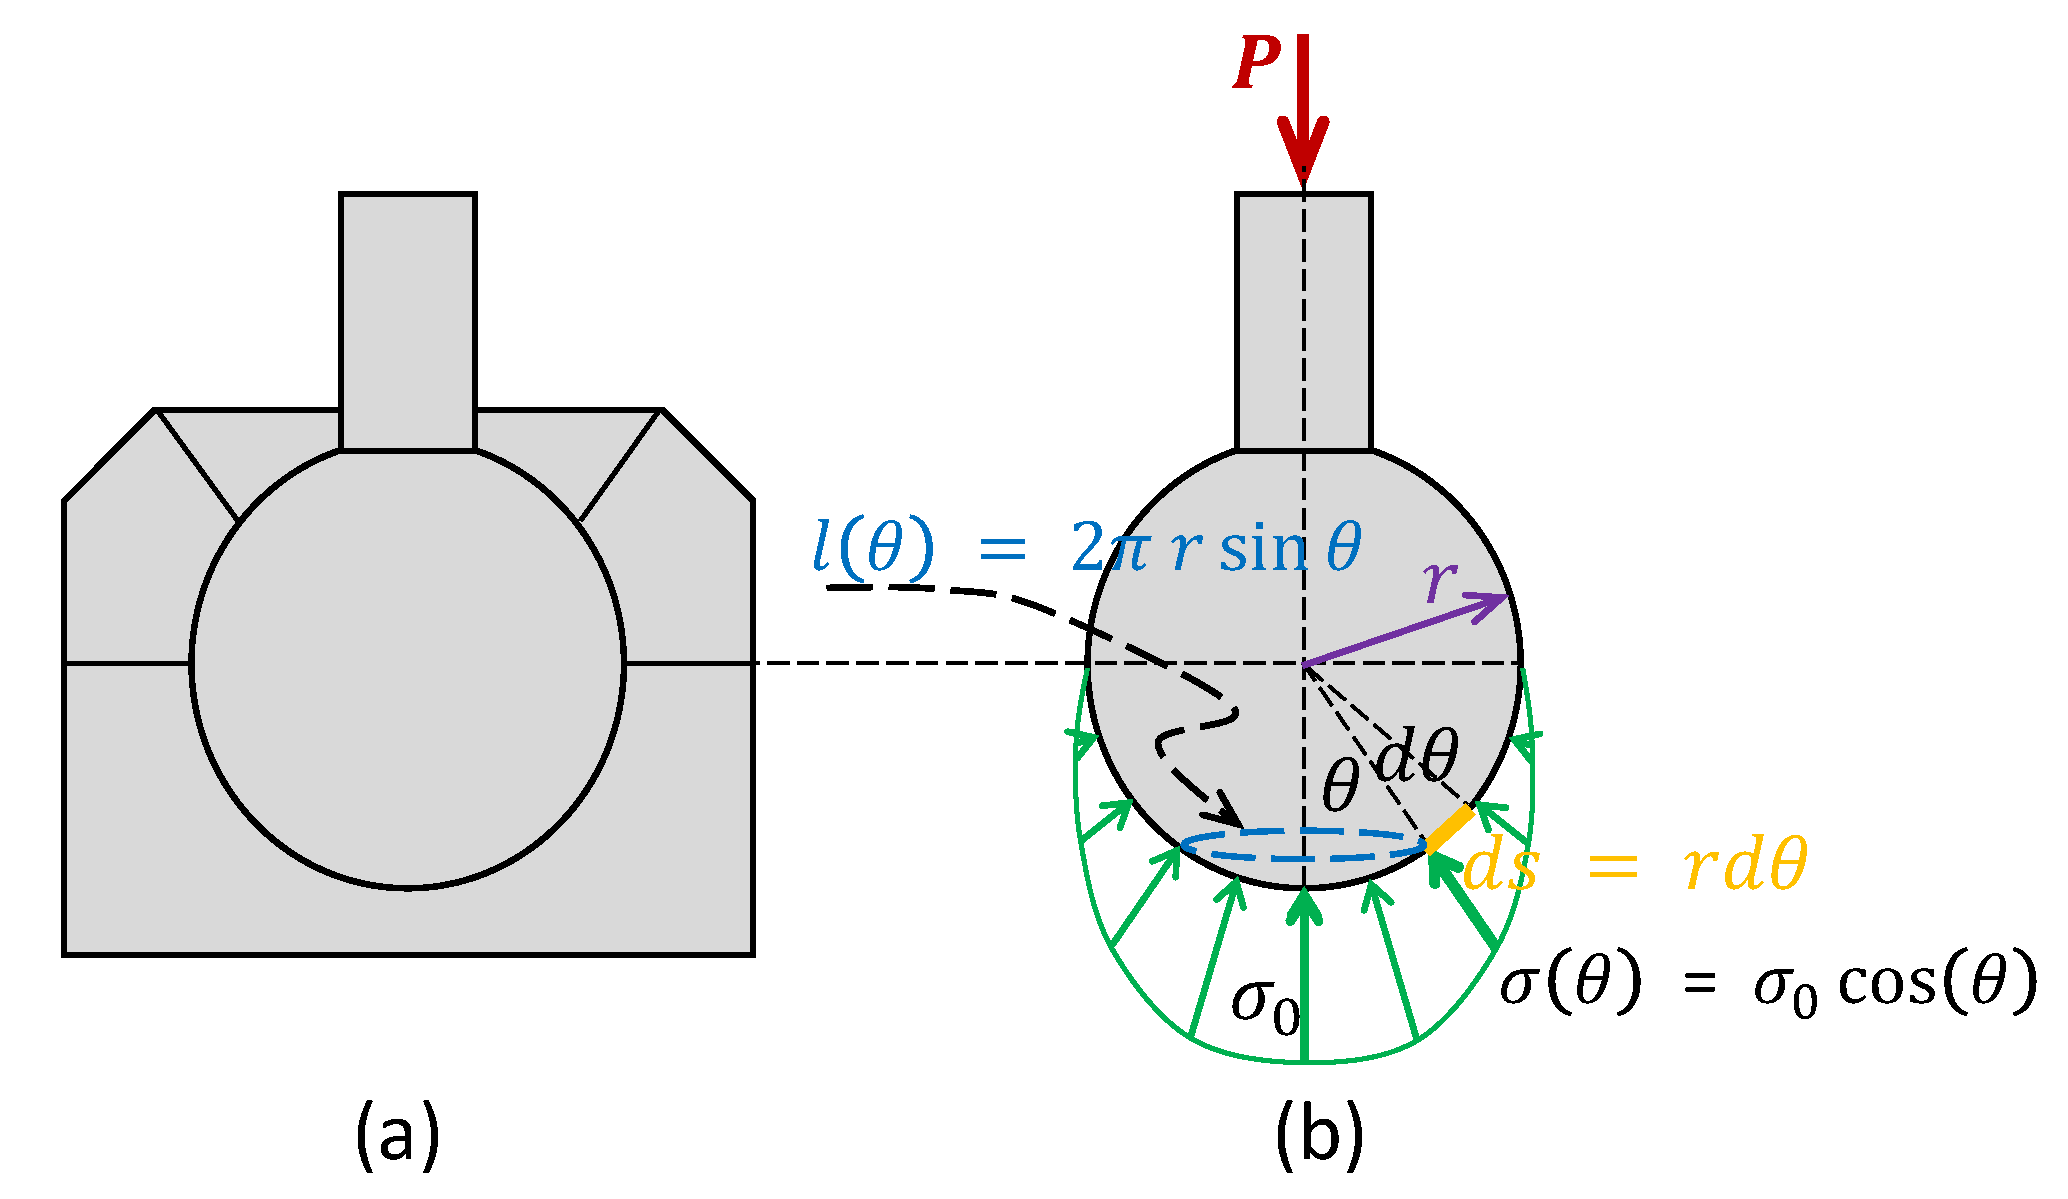
The diameter of the isolator ball joint was defined so the static pressure due to the self-weight of the superstructure remained constant regardless of the height of the rack. In this way, the higher the rack height, the greater the diameter of the ball joint considered at the isolator base. For calculating the static pressure exerted in the contact between the ball joint and its support, it was hypothesized that the pressure distribution in the contact zone is as shown in Figure 3.
The self-weight axial load acting on the isolator, P, is in equilibrium with the ball joint stresses (Figure 3b) so that:
Equation (1) makes it possible to determine the diameter d = 2r of the isolator’s basal ball joint as a function of the self-weight load, maintaining the maximum normal stress due to gravitational load, σ0. As a restriction, it was established for this stress that σ0 ≤ σadm = σy/SF, where σy = 31.0 MPa is the yield strength of Teflon at 23 °C [30] and SF is the safety factor. The latter was considered as SF = 2, taking into account that the maximum vertical seismic overload can at most equal the static load. The resistance to compression of the tension was considered as a reference in order that said material can be used in the coating of the support housing of the ball joint. However, the design of the ball joint and its support housing is not restricted to this material; other materials of equal or greater strength may be used.
Table 1 shows the diameters assigned to the ball joint, the weight product of the static load of each of the racks analyzed and the maximum stress σ0 (Figure 3b), considering a height between load levels equal to 1.5 m for calculating the rack height.
Moreover, there is a simulation matrix of 64 numerical models, four of them correspond to racks with a fixed base (4 different heights), while 60 correspond to models with an isolated base (4 heights × 5 periods of isolation × 3 friction coefficients). In this investigation, a formulation was used where the radius of curvature of the isolator surface is constant and equal to the height of the device (R = H in Figure 2). In this way, the weight or vertical load transmitted by the structure to the isolator does not interact with the device’s lateral stiffness, since it does not affect its lateral balance. Therefore, the lateral stiffness is defined only by the tension of the post-tensioned elastic element [25], corresponding to the compressed air piston that forms the body of the isolator (Figure 2).
Considering the approximation R = H, the elongation of the elastic element inside the isolator is defined by the following equation [25]:
Taking into account the consideration mentioned above (R = H), the reaction of the isolator against the superstructure, Fb, due to a displacement “u” with velocity and dissipation by friction in the ball joint of the basal support of the device is defined by:
where Rn is the normal reaction to the surface of the ball joint at the base of the isolator.
The first term on the right side of Equation (3) corresponds to the elastic response—or conservative force—and the second term is the inelastic response—or non-conservative force that produces the dissipation of energy. Considering that the shear at the base of a structure with base isolation is much less than its own weight, it can be inferred that the sum of the normal reactions, Rn, in all the isolators is approximately equal to the weight of the structure above the isolation level. Therefore, given isolator height H, and total weight structure W, the dissipation capacity of the isolation system as a whole is approximately proportional to the product d∙μ. This implies that, if in practice it is desirable to modify the dissipation capacity of the isolation system, the materiality of the surfaces in contact in the ball joint must be changed—change μ—, or the diameter of ball-joint d, or both.
The elastic element of the isolator, which is necessary to provide the tension T(u) that contributes to its stability and provides lateral stiffness, can be of multiple types as long as it meets certain basic requirements. These requirements are: (1) allow it to be pre-stressed to the required design stress T0; (2) it can withstand the elongation imposed by the maximum possible lateral displacement, in addition to the pre-tension elongation; and (3) its stiffness is not very high so that T(u) does not differ substantially from T0. The purpose of the latter is to avoid an excessive increase in the lateral stiffness of the isolator. Maureira-Carsalade et al. [25] propose a feasible alternative: using a compressed air piston as an elastic element (Figure 2).
In this investigation, it is assumed that the total length of the air chamber of the pneumatic piston that constitutes the elastic element of the isolator is ¾ of the total height of the device, that is, (Figure 2). This restriction is imposed to accommodate the maximum deformable length of the elastic element Δlmax, and the ball joint in the basal bearing.
Correct sizing of the lower air chambers of the isolator (Figure 2) and an adequate allocation of its initial pressure, p0, allow the three requirements described above to be met and provide the desired lateral stiffness to the isolator. Maureira-Carsalade et al. [25] describe the tension T(u) of the cable that connects the isolator to the base of the rack (Figure 2b) by means of the real gas law as T(u) = p(u)Acs, where Acs is the cross section of the lower air chamber. However, if the working pressure p(u) is less than or approximately equal to 2 MPa, the well-known ideal gas law—p1V1 = p2V2—allows obtaining a suitable approximation for the expression T(u), that is:
In this research, it was considered that the body of the isolator and, therefore, the pneumatic piston, is composed of two cylinders with different internal diameters in the air chamber (Figure 2). The lower cylinder where the piston plunger slides stores a volume that is variable depending on the lateral displacement u, whereas the upper cylinder stores a constant volume . In Equation (4) Δl(u) is given by Equation (1) and the length of the lower air chamber, , must not be less than the maximum value of Δl(u). In this case, so that the stiffness of the elastic element inside the insulator (pneumatic piston) is not very high, it is necessary to impose the condition:
So that T(u) given by Equation (4) does not differ substantially from T0. This is achieved when , which is why in this investigation it is considered that the body of the isolator is formed by two cylindrical chambers of greater diameter in the upper portion than in the lower portion. ( in Figure 2).
The initial stress T0 and the initial pressure p0 are related to each other through the cross-sectional area of the lower portion of the pneumatic piston (Acs in Figure 2). These parameters are in turn related to the isolation period TI, the height of the isolator H, the total mass of the superstructure mt, and the number of isolators nI, using Equation (6), adapted from [25]:
From Equation (6) it is possible to determine the diameter of the lower air chamber required () to obtain the desired isolation period TI, given the initial pressure and the other structural parameters.
Table 2 shows the initial pressures, p0, inside the pneumatic piston that causes the piston inside the isolator to provide the necessary lateral stiffness so that each rack analyzed has the desired isolation period. In the calculations, an inner diameter of the lower and upper air chambers was considered 90 mm y 120 mm, respectively.
The initial tension, T0, of the cable connecting the piston plunger to the rack base (Figure 2b), was determined for each rack and each isolation period, using Equation (6) with the data from Table 2. The calculated values are shown in Table 3 for each rack analyzed according to its number of load levels and TI isolation periods.
Taking into account that H = R, considering , and assuming , the relationship T(u) was determined using Equation (4). This result was used to determine the elastic response curve of an isolator, which is given by:
In order to compare the degree of lateral stiffening of the isolator with the increase in lateral displacement and to be able to compare these results for different heights of the isolator, the elastic response of Equation (7) was normalized by the initial lateral stiffness of the insulator, .
In Equation (8), the initial lateral stiffness of an isolator, , is given by:
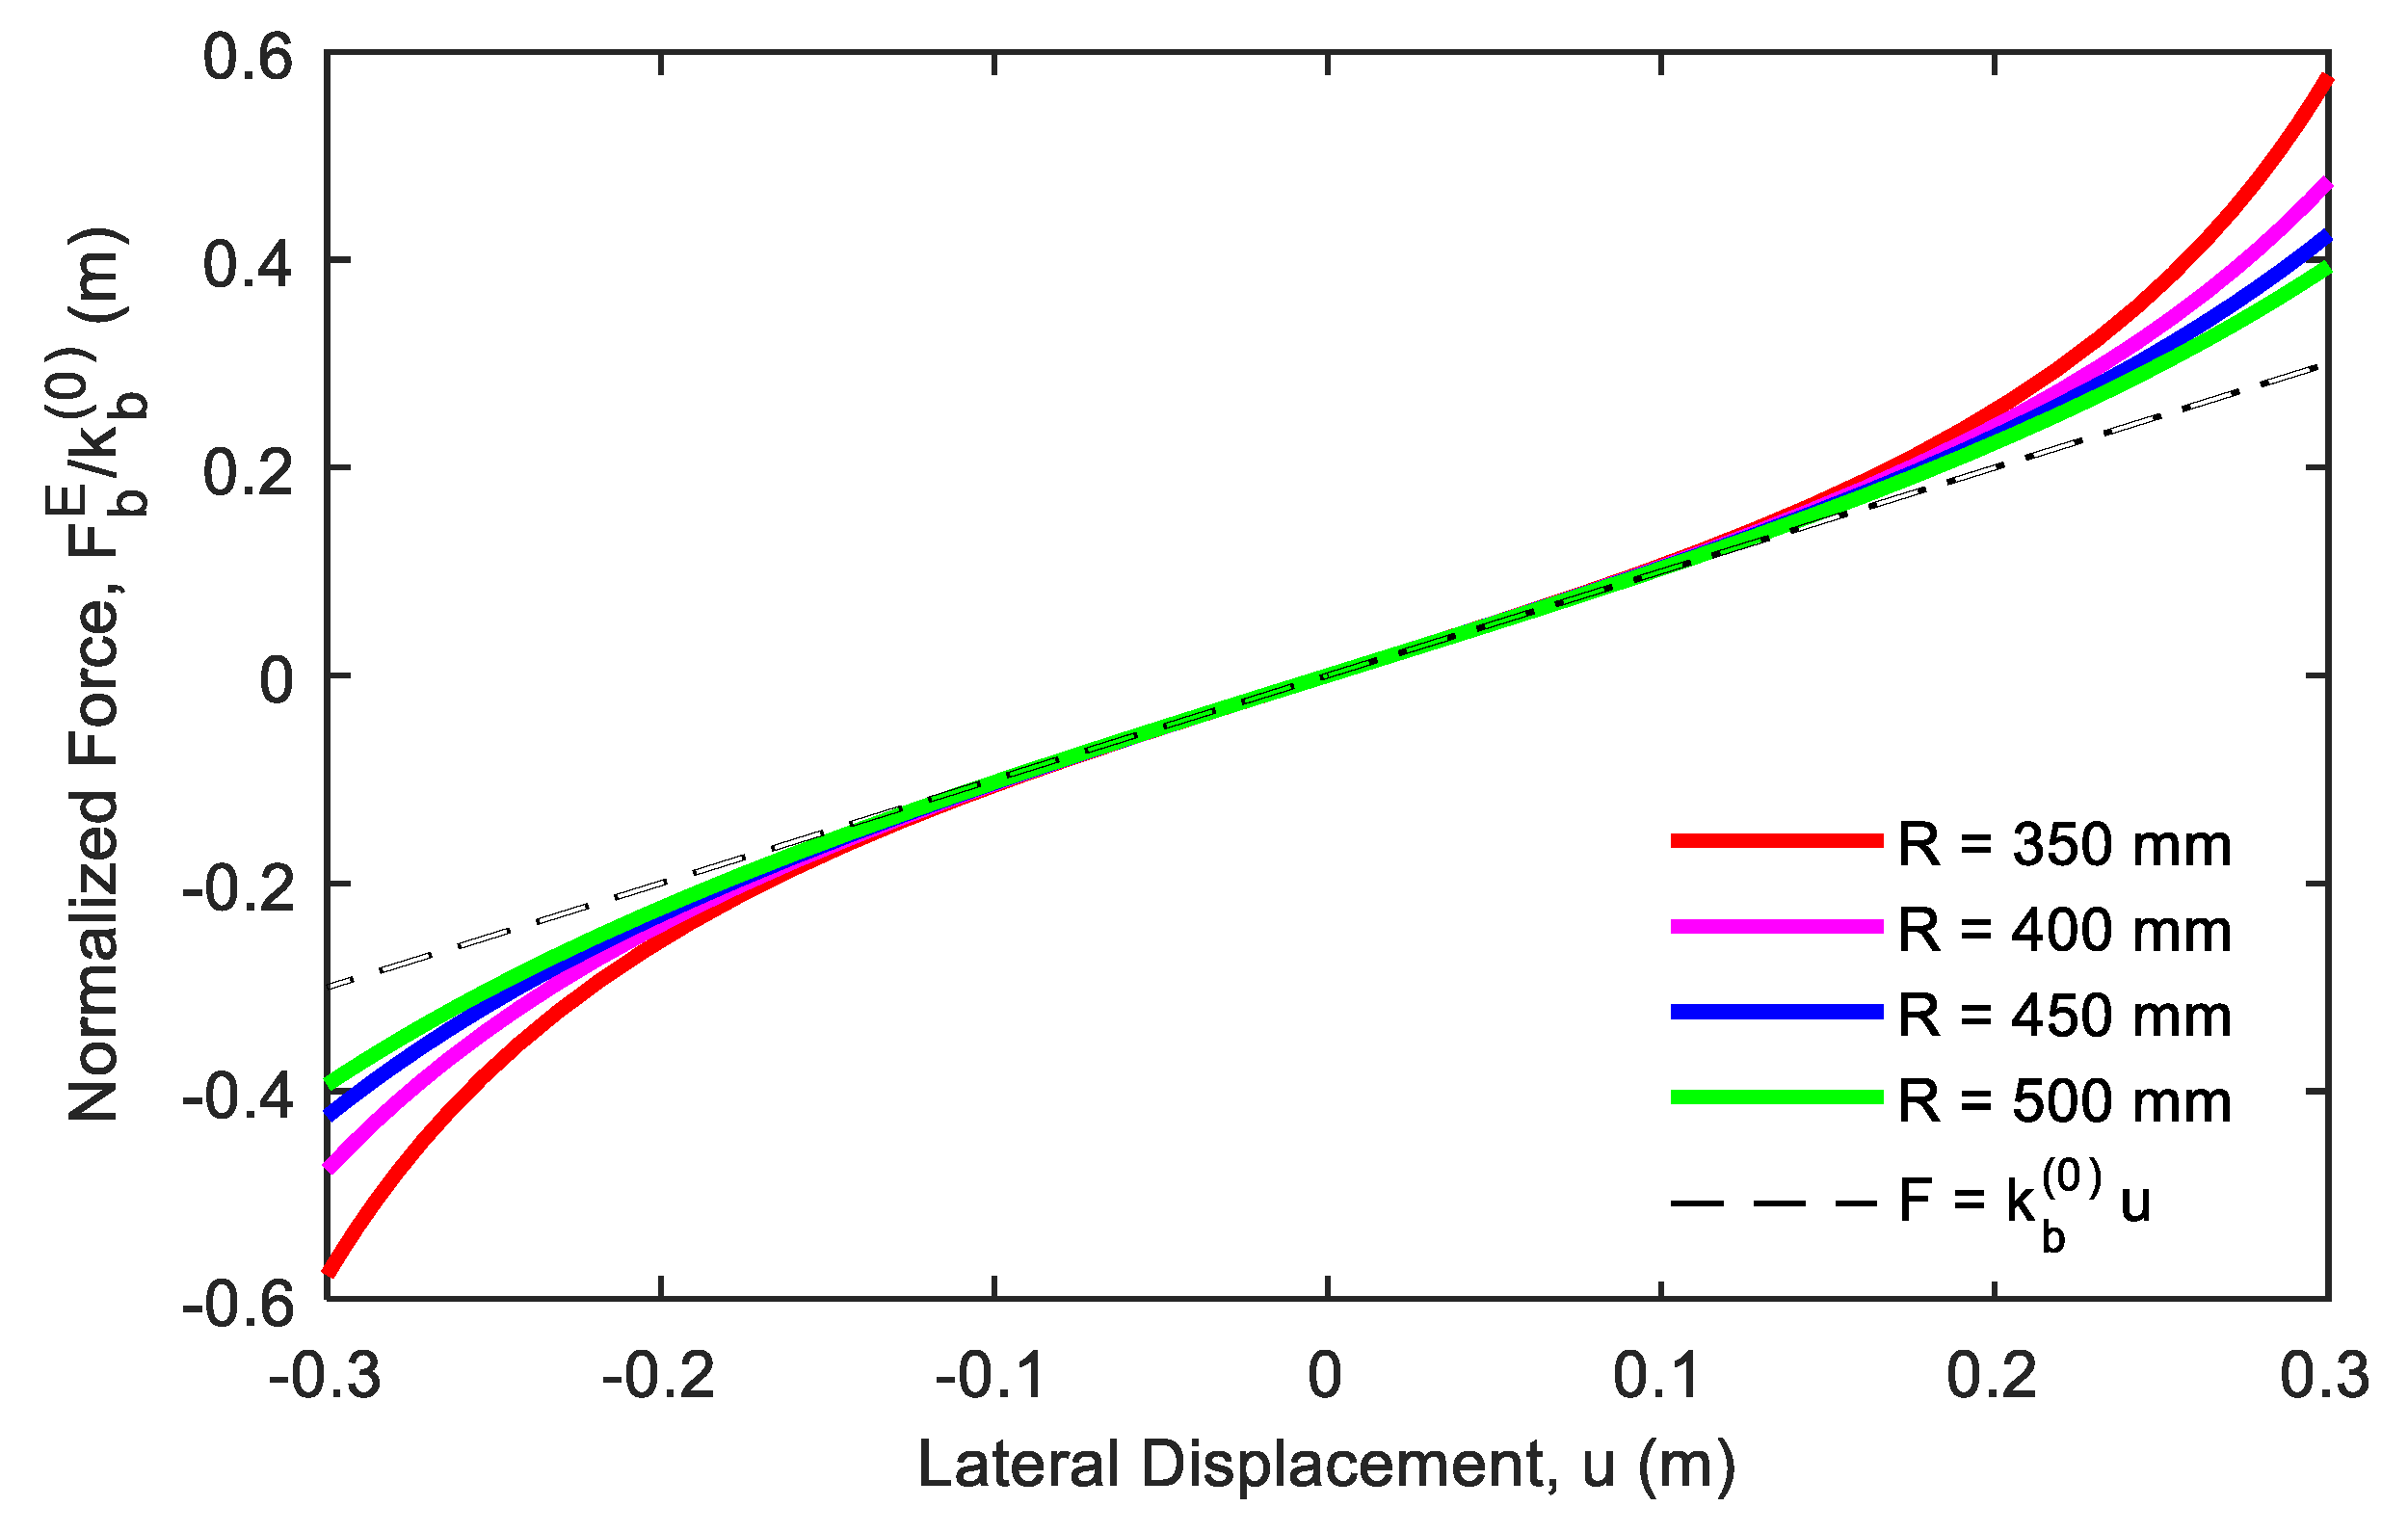
Figure 4 shows the normalized elastic response curves (Equation (8)) of the pneumatic piston isolator when subjected to a load-unload cycle with displacement amplitude umax = 300 mm. This displacement is the reference value established as the demand for the NCh2745 design displacement spectrum in seismic zone 3 and type of soil III, for a structure without mass eccentricity and considering an effective damping ratio of the isolation system equal to 10%.
Figure 4 shows that the smaller the ratio, , the more the slope of the elastic response of the isolator approaches the tangent at u = 0. As the lateral displacement u increases, the elastic lateral stiffness of the isolator increases. This increase in lateral stiffness is accentuated according to the radius of curvature R of the isolator head and, therefore, the greater its height since H = R (Figure 2). This increase in lateral stiffness can be considered an advantage from the point of view of safety since it restricts large displacements in the isolation level. However, it is also accompanied by an undesired consequence, since the higher the secant stiffness, the shorter the effective isolation period. The latter results in an increase in the basal shear load. It was considered a criterion to limit this effect that the secant stiffness for maximum displacement, , should not be greater than twice the tangent stiffness at the origin, . Thus, the effective isolation period is not less than times the isolation period calculated for small displacements. All the heights of the isolators whose elastic responses are shown in Figure 4 meet the previous criteria, but in the following calculations the isolator height H = 400 mm was chosen.
3. Nonlinear Analysis
Nonlinear analysis has been used in this research to determine the response of racks with and without base isolation, considering the inelastic characteristics of the studied models. Two types of inelastic behavior have been included in the models: geometric non-linearity due to large displacements and non-linearity of materials or plasticity. Both types of non-linearity are present both in the structure of the racks and in the isolation system.
3.1. Nonlinear Racks Modeling
Geometric nonlinearity was included in the rack employing the geometric stiffness matrix of a bar in three-dimensional space with 12 degrees of freedom [31]. This depends on the instantaneous axial load of the element and allows incorporating the effect of said load on the lateral and flexural stiffness of a bar—beam or column—due to large displacements. To incorporate this matrix in the numerical models, the static load due to the self-weight of the structure and of the pallets was initially considered, thus obtaining the internal axial stress of the structural elements. With this, the geometric stiffness matrix of the system was determined at the initial moment of the dynamic analysis, which was used to calculate the initial displacement conditions. During the dynamic analysis, the geometric stiffness matrix was updated at each instant, considering the axial load of each element at the time of calculation.
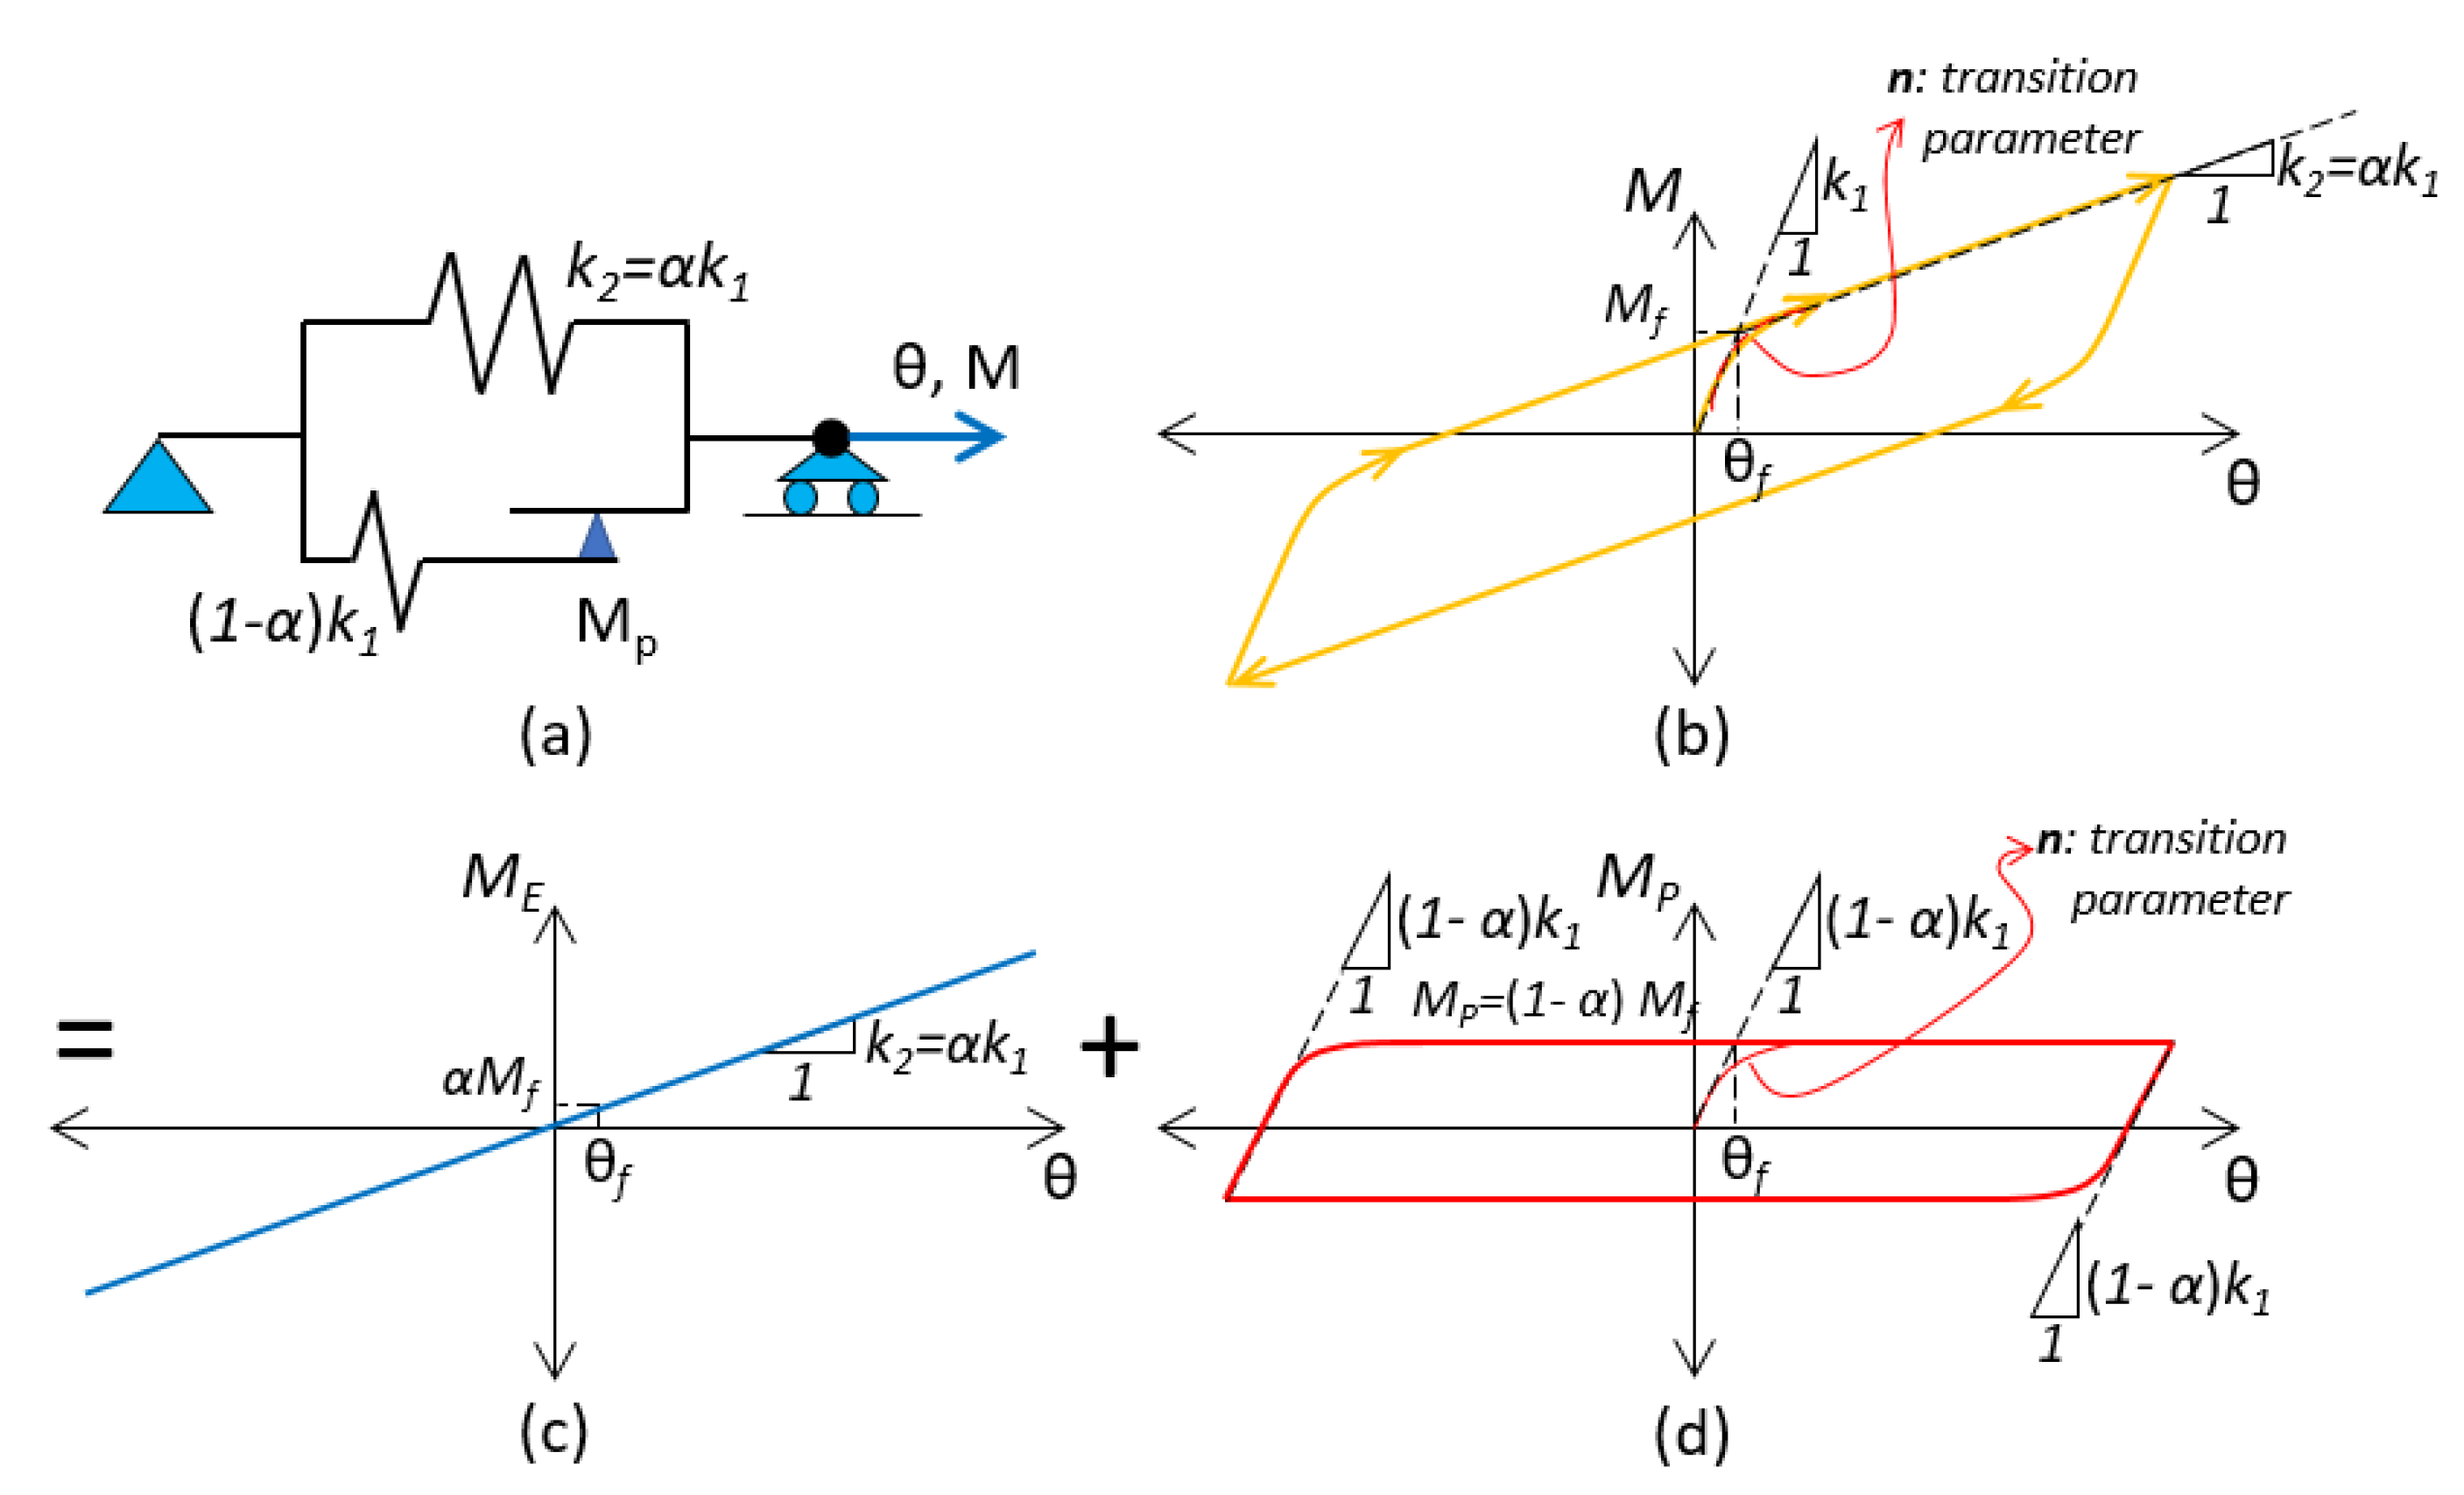
The non-linearity of the material was incorporated into the rack model in a concentrated way in the beam-column and column-base connections, implementing the Bouc–Wen bilinear model [25]. This model allows characterizing of the behavior of nonlinear systems of 1 degree of freedom with concentrated plasticity. There are many variants of the Bouc–Wen model, the one used in this case being the one that allows describing a hysterical bi-linear behavior (Figure 5). In the conceptual model of Figure 5a, the plastic behavior is characterized by a frictional element of capacity Mp in parallel with an elastic element of stiffness (1 − α)·k1, which works as long as the capacity of the frictional element is not equalized. This pair of in-series elements is in turn parallel to an elastic element of stiffness α∙k1, which works independently. The hysterical characteristic curve is shown in Figure 5b, in which a yield point (θf, Mp), is defined, in which the stiffness changes from k1 to k2 = α∙k1. This behavior is the sum of the behavior of the elastic branch (Figure 5c) where only the stiffness spring k2 = α∙k1 works, plus the plastic branch. In the latter, only the stiffness spring (1 − α)∙k1 works, as long as the stress is less than Mp = (1 − α)∙k1∙θf = (1 − α)∙Mf. Once this capacity is reached, all the displacement concentrates in the frictional element. The capacity being constant and equal to Mp, the displacement is concentrated in the frictional element (Figure 5d).
The variant of the Bouc–Wen differential equation that allows describing the hysterical behavior of Figure 5b is given by:
In this equation, the hysteretic variable z represents the degree of incursion in the plastic range (zone with stiffness k1 in Figure 5b). If −1 < z < 1, then MP < Mp = (1 − α)∙Mf (Figure 5d), if |z| = 1, then |MP| = (1 − α)∙Mf. According to the above, the expression that defines the total moment M (Figure 5b) is:
The parameter n of Equation (11) corresponds to a smooth transition constant between the elastic and the plastic branches (Figure 5b,d). Low values of n (1 ≤ n ≤ 4) lead to a gradual curved transition, while high values of n (n > 4) tend to a sharper transition. In this investigation n = 4 was used.
3.2. Seismic Input
The numerical analyses for the different models were subjected to a time-history analysis with a seismic record. The earthquake considered as external force was based on the N10E component of the Llolleo record of 3 March 1985, which has a peak ground acceleration (PGA) of 0.712∙g. This was one of the most severe seismic events to have occurred in central Chile, the most densely populated area. The seismic record used was downloaded from Chile’s national seismological network, RENADIC, www.terremotosuchile.cl. However, only the latest records occur and are available on this site. It is also possible to find it at [32].
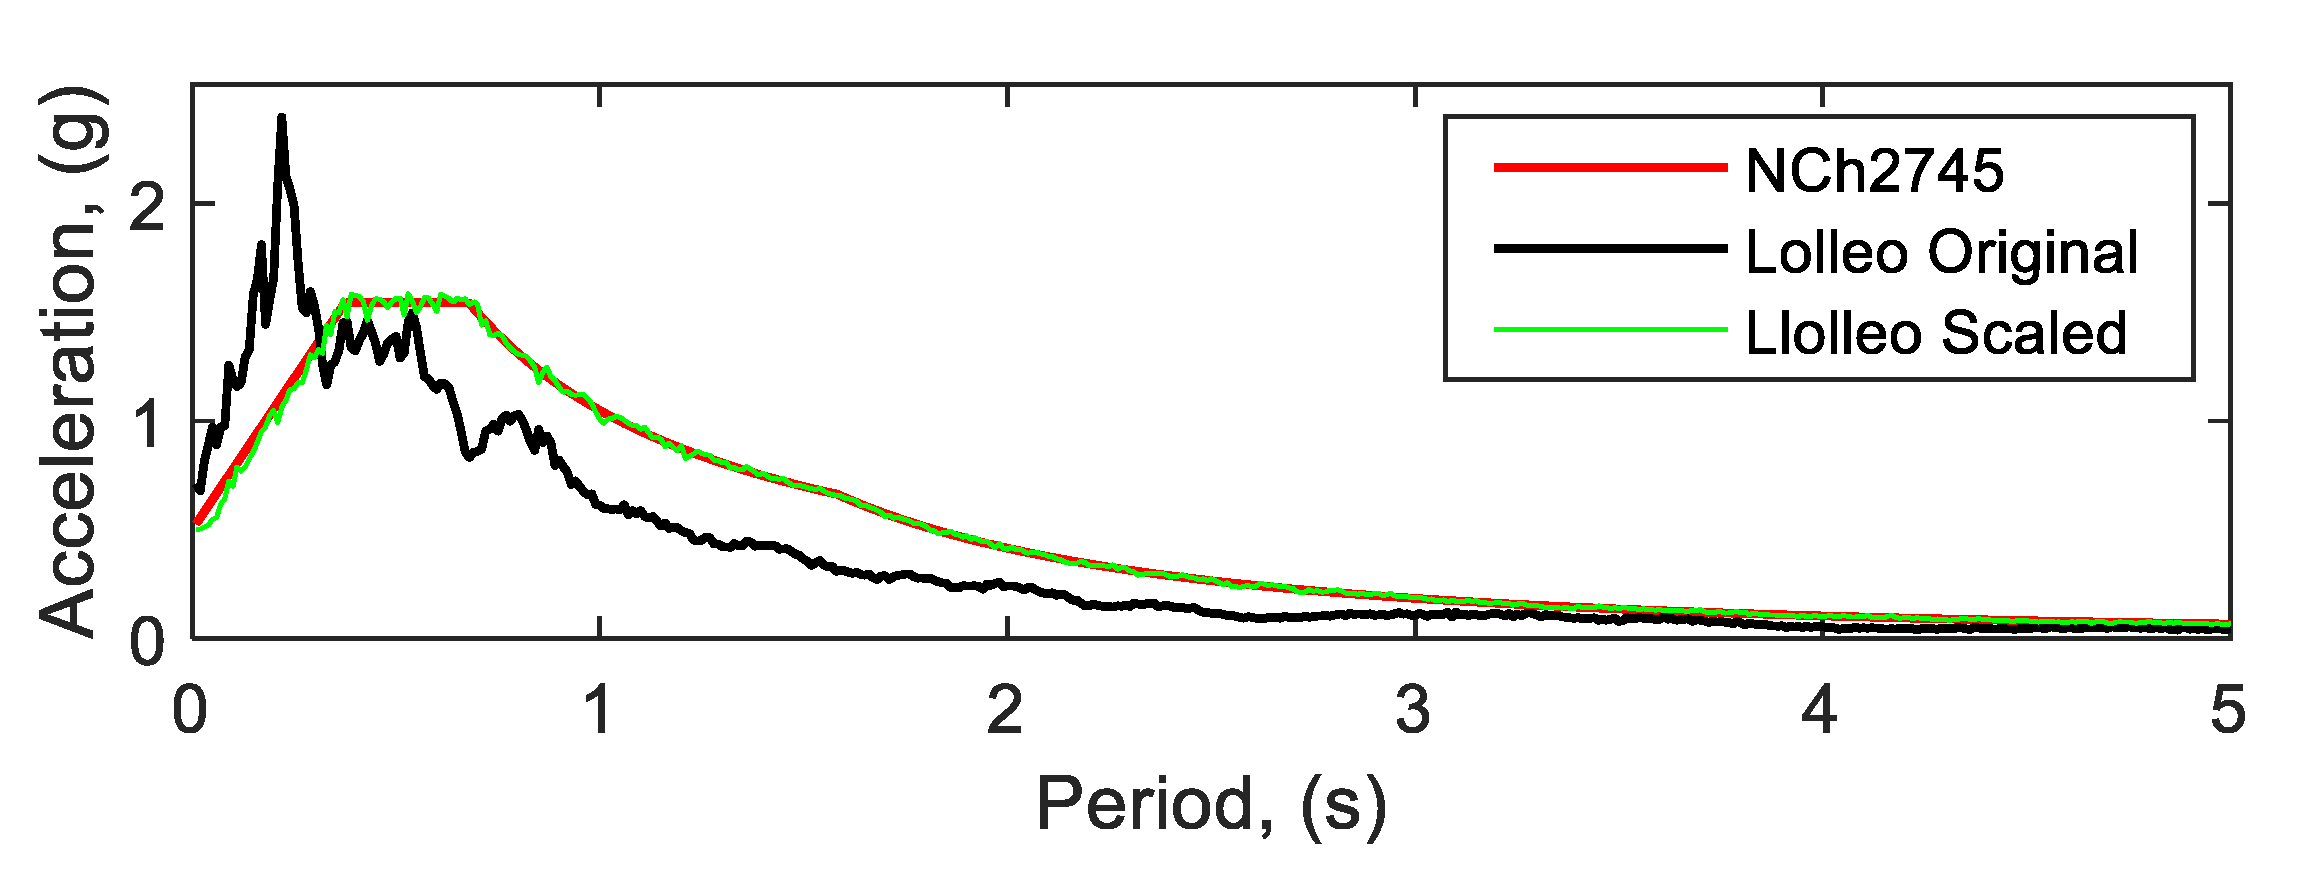
The Llolleo record was scaled in the frequency domain to make its response spectrum coincide with the design spectrum of the NCh2745 [22]. On escalation, seismic zone 3, type of soil III, building category B and 5% of critical damping were considered to define the design spectrum. As can be seen in Figure 6, for short periods the record exceeded the requirements of NCh2745. The latter is the most demanding standard in terms of spectral acceleration, particularly for long periods (over 1.5 s) as is usually the fundamental period for industrial storage racks [28]. The latter was what motivated the use of said regulation for the definition of the target spectrum to which the register used in the analyses was scaled.
The scaling of the seismic record is of the same type used by Bernuzzi and Simoncelli [28]. However, unlike them, who used 10 records scaled to a target spectrum according to the procedure of Gasparini and Vanmarke [33], in this research only one scaled record was used. The reason for the above is that the focus of this research is on the benefit of the use of basal isolation in reducing the seismic demand in industrial storage racks and not in the characterization of the seismic vulnerability of these.
The scaled seismic record was applied acting in both horizontal directions of the rack separately. Figure 6 shows the design spectrum of the NCh2745 and the response spectrum of the original and compatible seismic record scaled in the frequency domain. Figure 7 show original and scaled records as time series.
A seismic record adjusted in frequency domain to a target spectrum attempts to ensure that the analysis of linear structures meets the seismic demand of said spectrum. According to the definition of response spectrum [34], the spectral response of a viscous-elastic linear 1 degree of freedom structure is equal to a time-history analysis response using that scaled seismic record. The latter is not exactly correct in structure with either several degrees of freedom, non-linear behavior, or both. However, it is a good strategy since the spectral modal analysis is not applicable in non-linear structures. Therefore, the use of these types of frequency-scaled records provides valuable information for verification and design of these types of structures.
This scaling strategy requires the use of a horizontal component of an actual seismic record. Scaling preserves the frequency content of the reference record, scaling only its Fourier coefficients. If the register does not have some frequency ranges and therefore its Fourier coefficients are null, then scaling leads to scaled coefficients that are also null. In general, the Chilean seismic records of the subduction type of the Nazca and South American plates recorded in coastal areas—highest seismic risk zone—have a wide content of frequencies. Most of the frequency content is between 0.1 and 10 Hz; higher frequencies are also contained down to at least 200 Hz, but with much less involvement. Frequencies lower than 0.1 Hz are not adequately recorded by the measurement instruments usually used in seismological stations, so it is not reliable to consider them. Therefore, by scaling this type of record in frequency, the resulting signal can excite a wide spectrum of structures fundamental within the range of frequencies contained in earthquakes and that are adequately measured by the instruments used.
Considering the above, only one Chilean record, measured in a high-risk seismic zone and solid ground, was scaled to a single target spectrum, achieving a good fit regardless of their duration. The response spectrum of a 1 degree-of-freedom linear system subjected to the scaled register is virtually the same as the target spectrum (Figure 6). This is the reason for only using a seismic record in the dynamic analyses in this investigation. The relevance of the results shown is not present in the particular earthquake used, but in the normative demand, the multiple analysis cases and the novel roller-type isolation device.
4. Results and Discussion
The seismic performance of the entire set of racks analyzed was evaluated employing three responses of interest that allow all cases to be objectively compared. These responses were: average in levels and maximum in time for floor drift (drift); average in levels and maximum in time for absolute acceleration (üabs); and maximum in time for basal shear load relative to the seismic weight (Q0/Ps). The maximum values of üabs and Q0/Ps were obtained by imposing the seismic force perpendicularly to the direction of the aisles of racks. This is consistent with the fact that in this direction, the structure is more rigid due to stiffer braced axes that provide lateral resistance. The maximum drift was obtained by imposing the seismic force parallel to the direction of the aisles of racks since it is the most flexible direction of the structure where the resistant axes are flexible frames.
The average maximum floor drift (drift) was first calculated as the sum of the drift of each level in all time, and then the maximum value was calculated throughout the duration of the analysis. The basal shear load Q0 was divided by the seismic weight Ps to be able to compare this response in racks of different heights and weights. To determine the average maximum absolute floor acceleration üabs, the average value of the absolute floor accelerations was first determined for all levels, obtaining a single value for each analysis instance. Then, the maximum of said average acceleration was determined throughout the duration of the analysis in order to soften the maximum response obtained, eliminating specific peak values of very short duration, since the effect of absolute acceleration is reflected in practice in the overturning of stored pallets. However, acceleration peaks of very short duration fail to generate this effect, since, by rapidly reversing its direction, the pallet stabilizes again on the rack. This effect is shown graphically relative to the acceleration of gravity in Figure 11.
Table 4 shows the first three natural periods of the fixed racks in its analyzed base, depending on the number of levels. It is observed that the slenderer the structure is, it becomes more flexible, that is, its natural periods lengthen.
Figure 8, Figure 9 and Figure 10 show the three maximum target responses obtained for the base isolation racks considering different friction coefficients on the ball joint at the base of the isolator (μ), isolation periods (TI) and load levels. In order to verify the effectiveness of the use of the base isolation and show the decrease of the target responses, the corresponding maximum response of the fixed base rack is included.
In all the cases shown in Figure 8, Figure 9 and Figure 10, except one, the three maximum target responses of base isolated racks were found to be lower than those of the corresponding fixed rack at its base. The anomalous case corresponds to the 3-level rack with isolation period TI = 3 s, friction coefficient in the ball joint μ = 0.2 and its diameter d = 10 cm, according to Table 1.
Regarding the basal shear load, it is observed that the longer the isolation period TI, the response decreases consistently, independent of the value of the friction coefficient μ and the load levels of the rack. The effect of modifying the friction coefficient μ shows a clear trend, the higher it, the lower the basal shear load, regardless of the number of rack levels. However, the reduction in this response is greater in racks with higher load levels. As shown in Table 1, the more load levels the rack has, the greater the diameter d assigned to the ball joint of the base support of the isolators. According to the analysis of Equation (3) in Section 2.2, the energy dissipation provided by the isolation system as a whole is proportional to the product d∙μ. This explains why the maximum basal shear load in racks with base isolation is lower in racks with more load levels, for the same TI and μ values; because the greater the number of levels, the greater the diameter d of the ball joint at the base (Table 1).
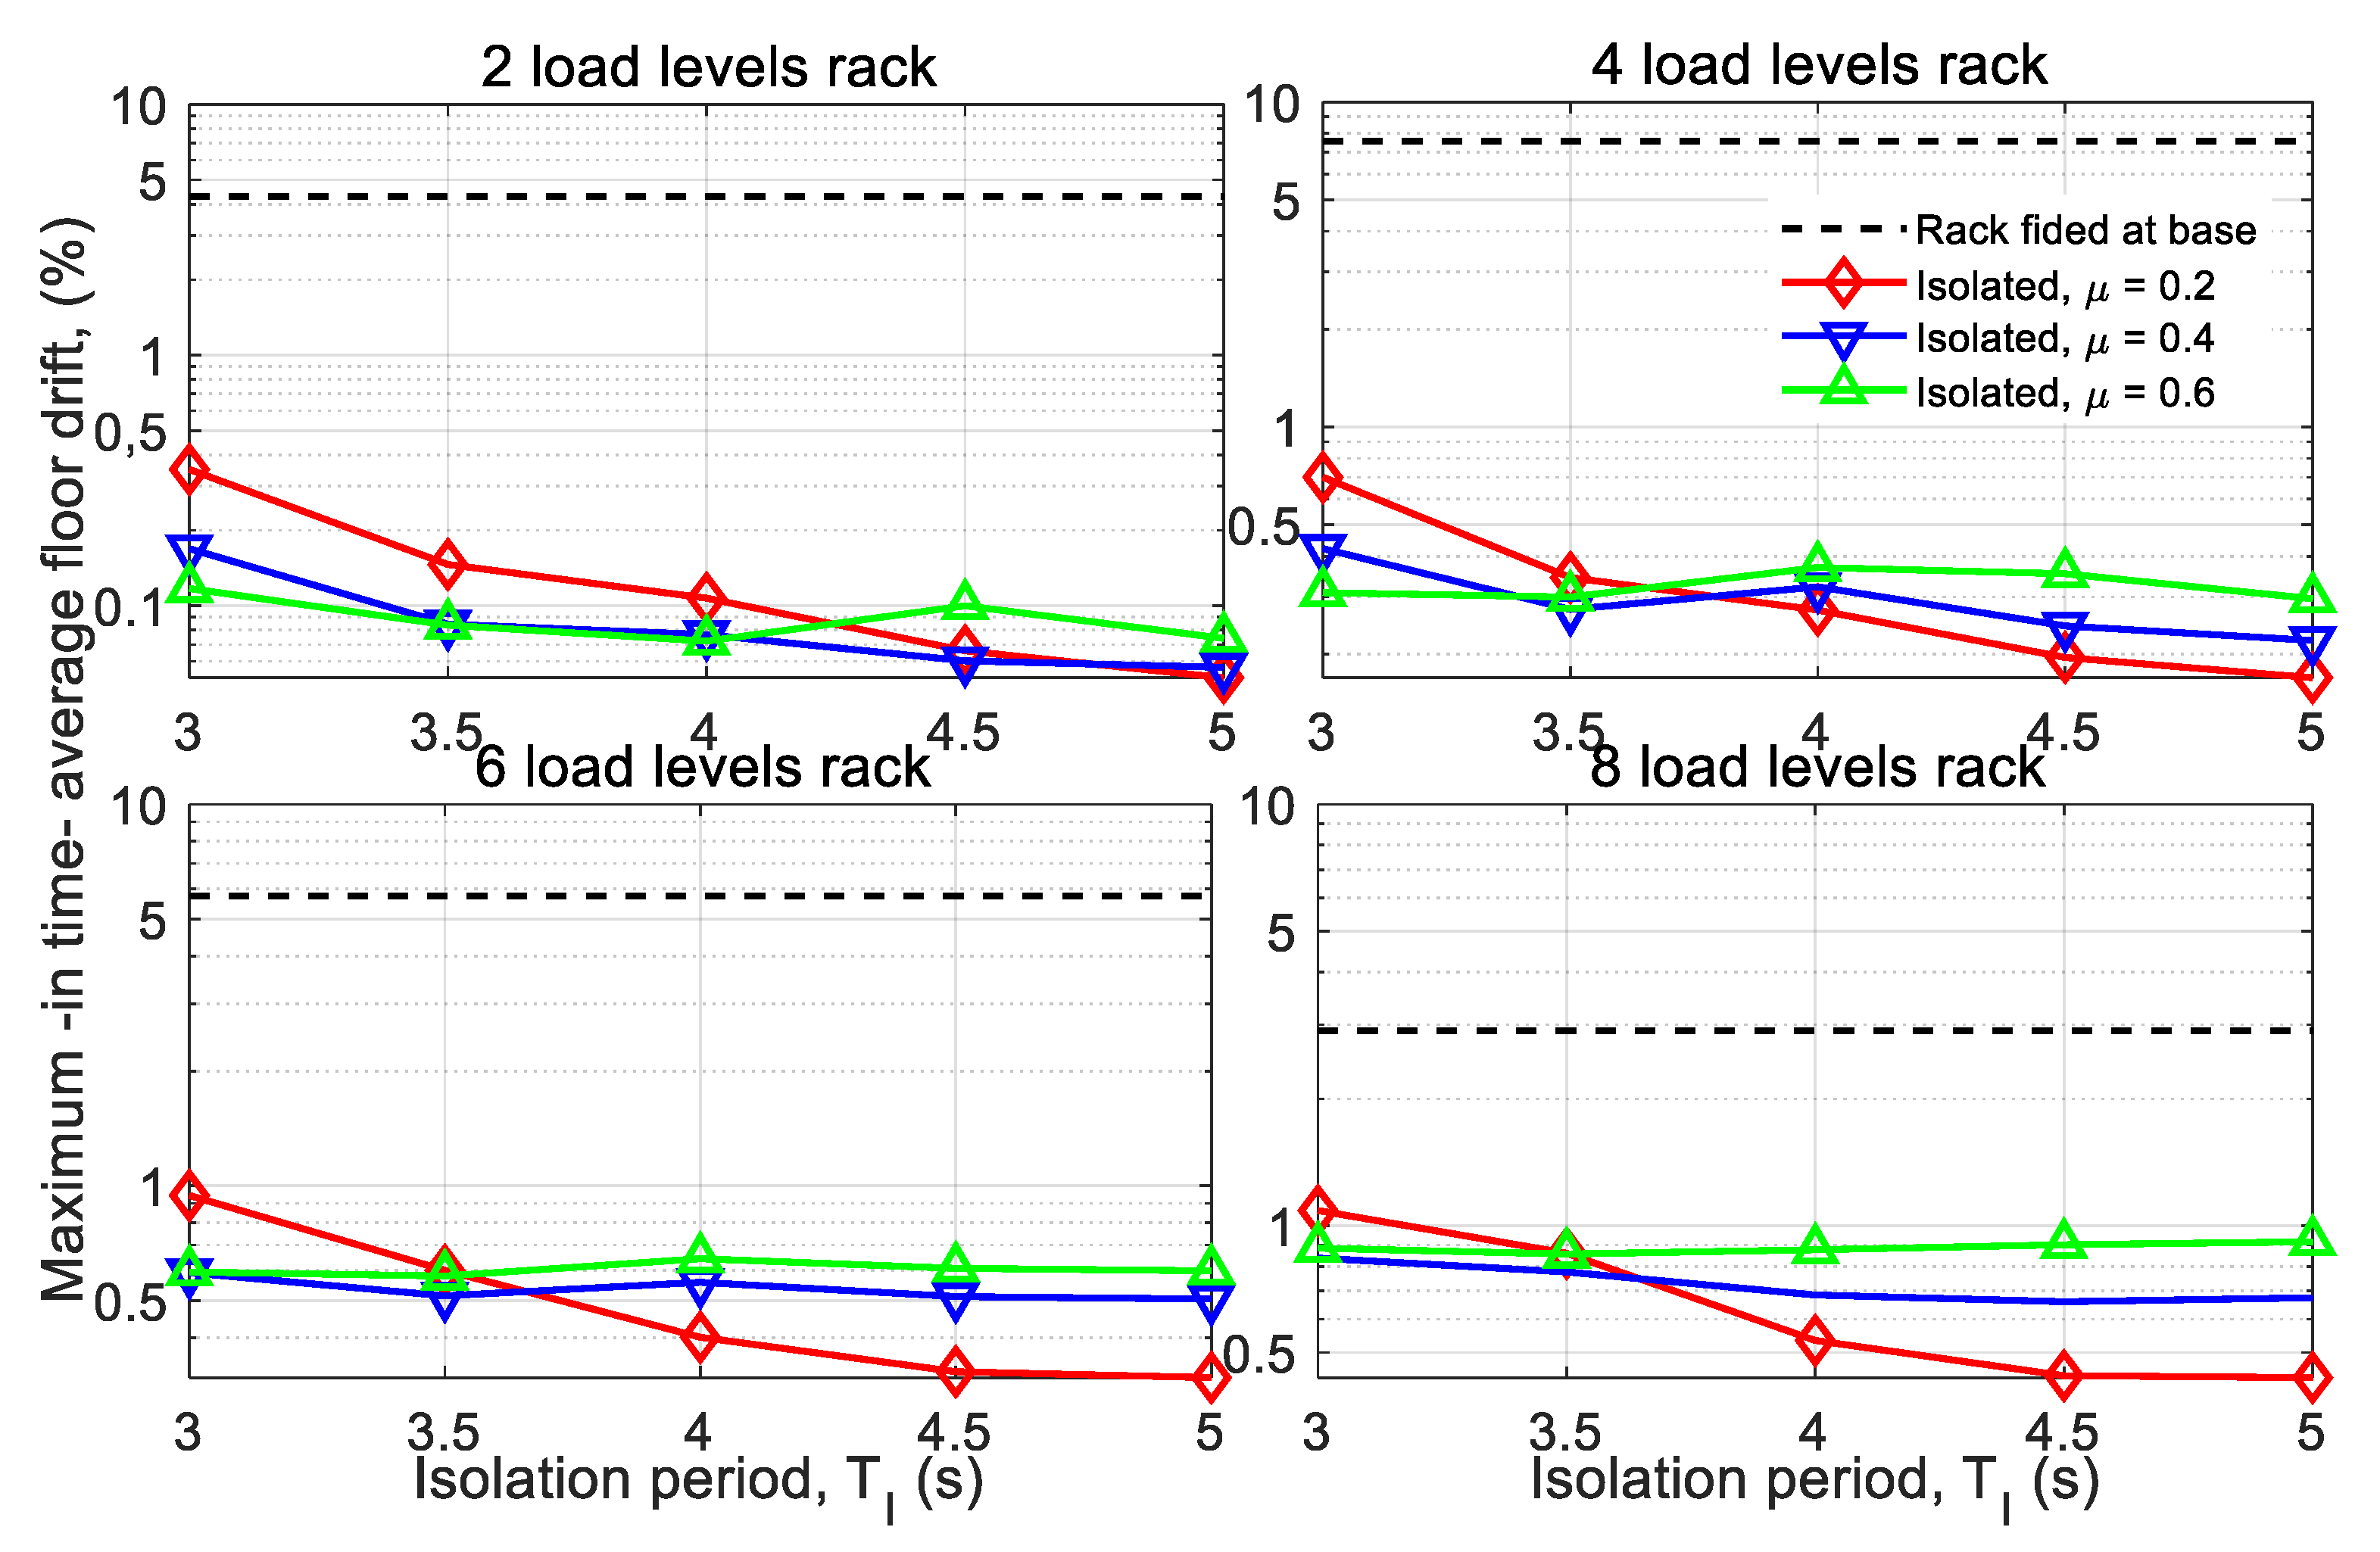
Unlike the maximum basal shear load that decreases when increasing the number of load levels in the racks, the drift increases in higher racks, as shown in Figure 9. This increase occurs because, in higher and heavier racks, less decoupling of the ground movement is achieved for the same period of isolation TI. Table 4 shows that the natural periods of the rack fixed at its base are longer when it has more load levels. The closer the period of isolation is to the fundamental period of the fixed rack at its base, the less the effect of the basal isolation in decoupling the movement of the structure from the ground. This phenomenon explains why the maximum drifts are larger in racks with more load levels with basal isolation of the same TI period and the same friction coefficient μ on the isolator ball joint. However, in all cases with base isolation, the maximum drift is below 1%, complying with the requirement of NCh2369, which establishes 1.5% as the desired limit.
It is observed in Figure 9 that the effect of the friction coefficient on the maximum drift response does not follow a single trend. The response curves for μ = 0.2, 0.4 and 0.6 intersect for TI isolation period values that differ depending on the number of rack levels. For low isolation periods, an increase in μ leads to a reduction in the maximum drift. On the other hand, for high TI values, the trend is the opposite. The TI value for which the trend is reversed is lower the more load levels the rack has. In general, either the higher the rack, the longer its isolation period TI, or both, the more convenient it is to have a lower value of the friction coefficient μ to reduce the rack’s maximum floor drift.
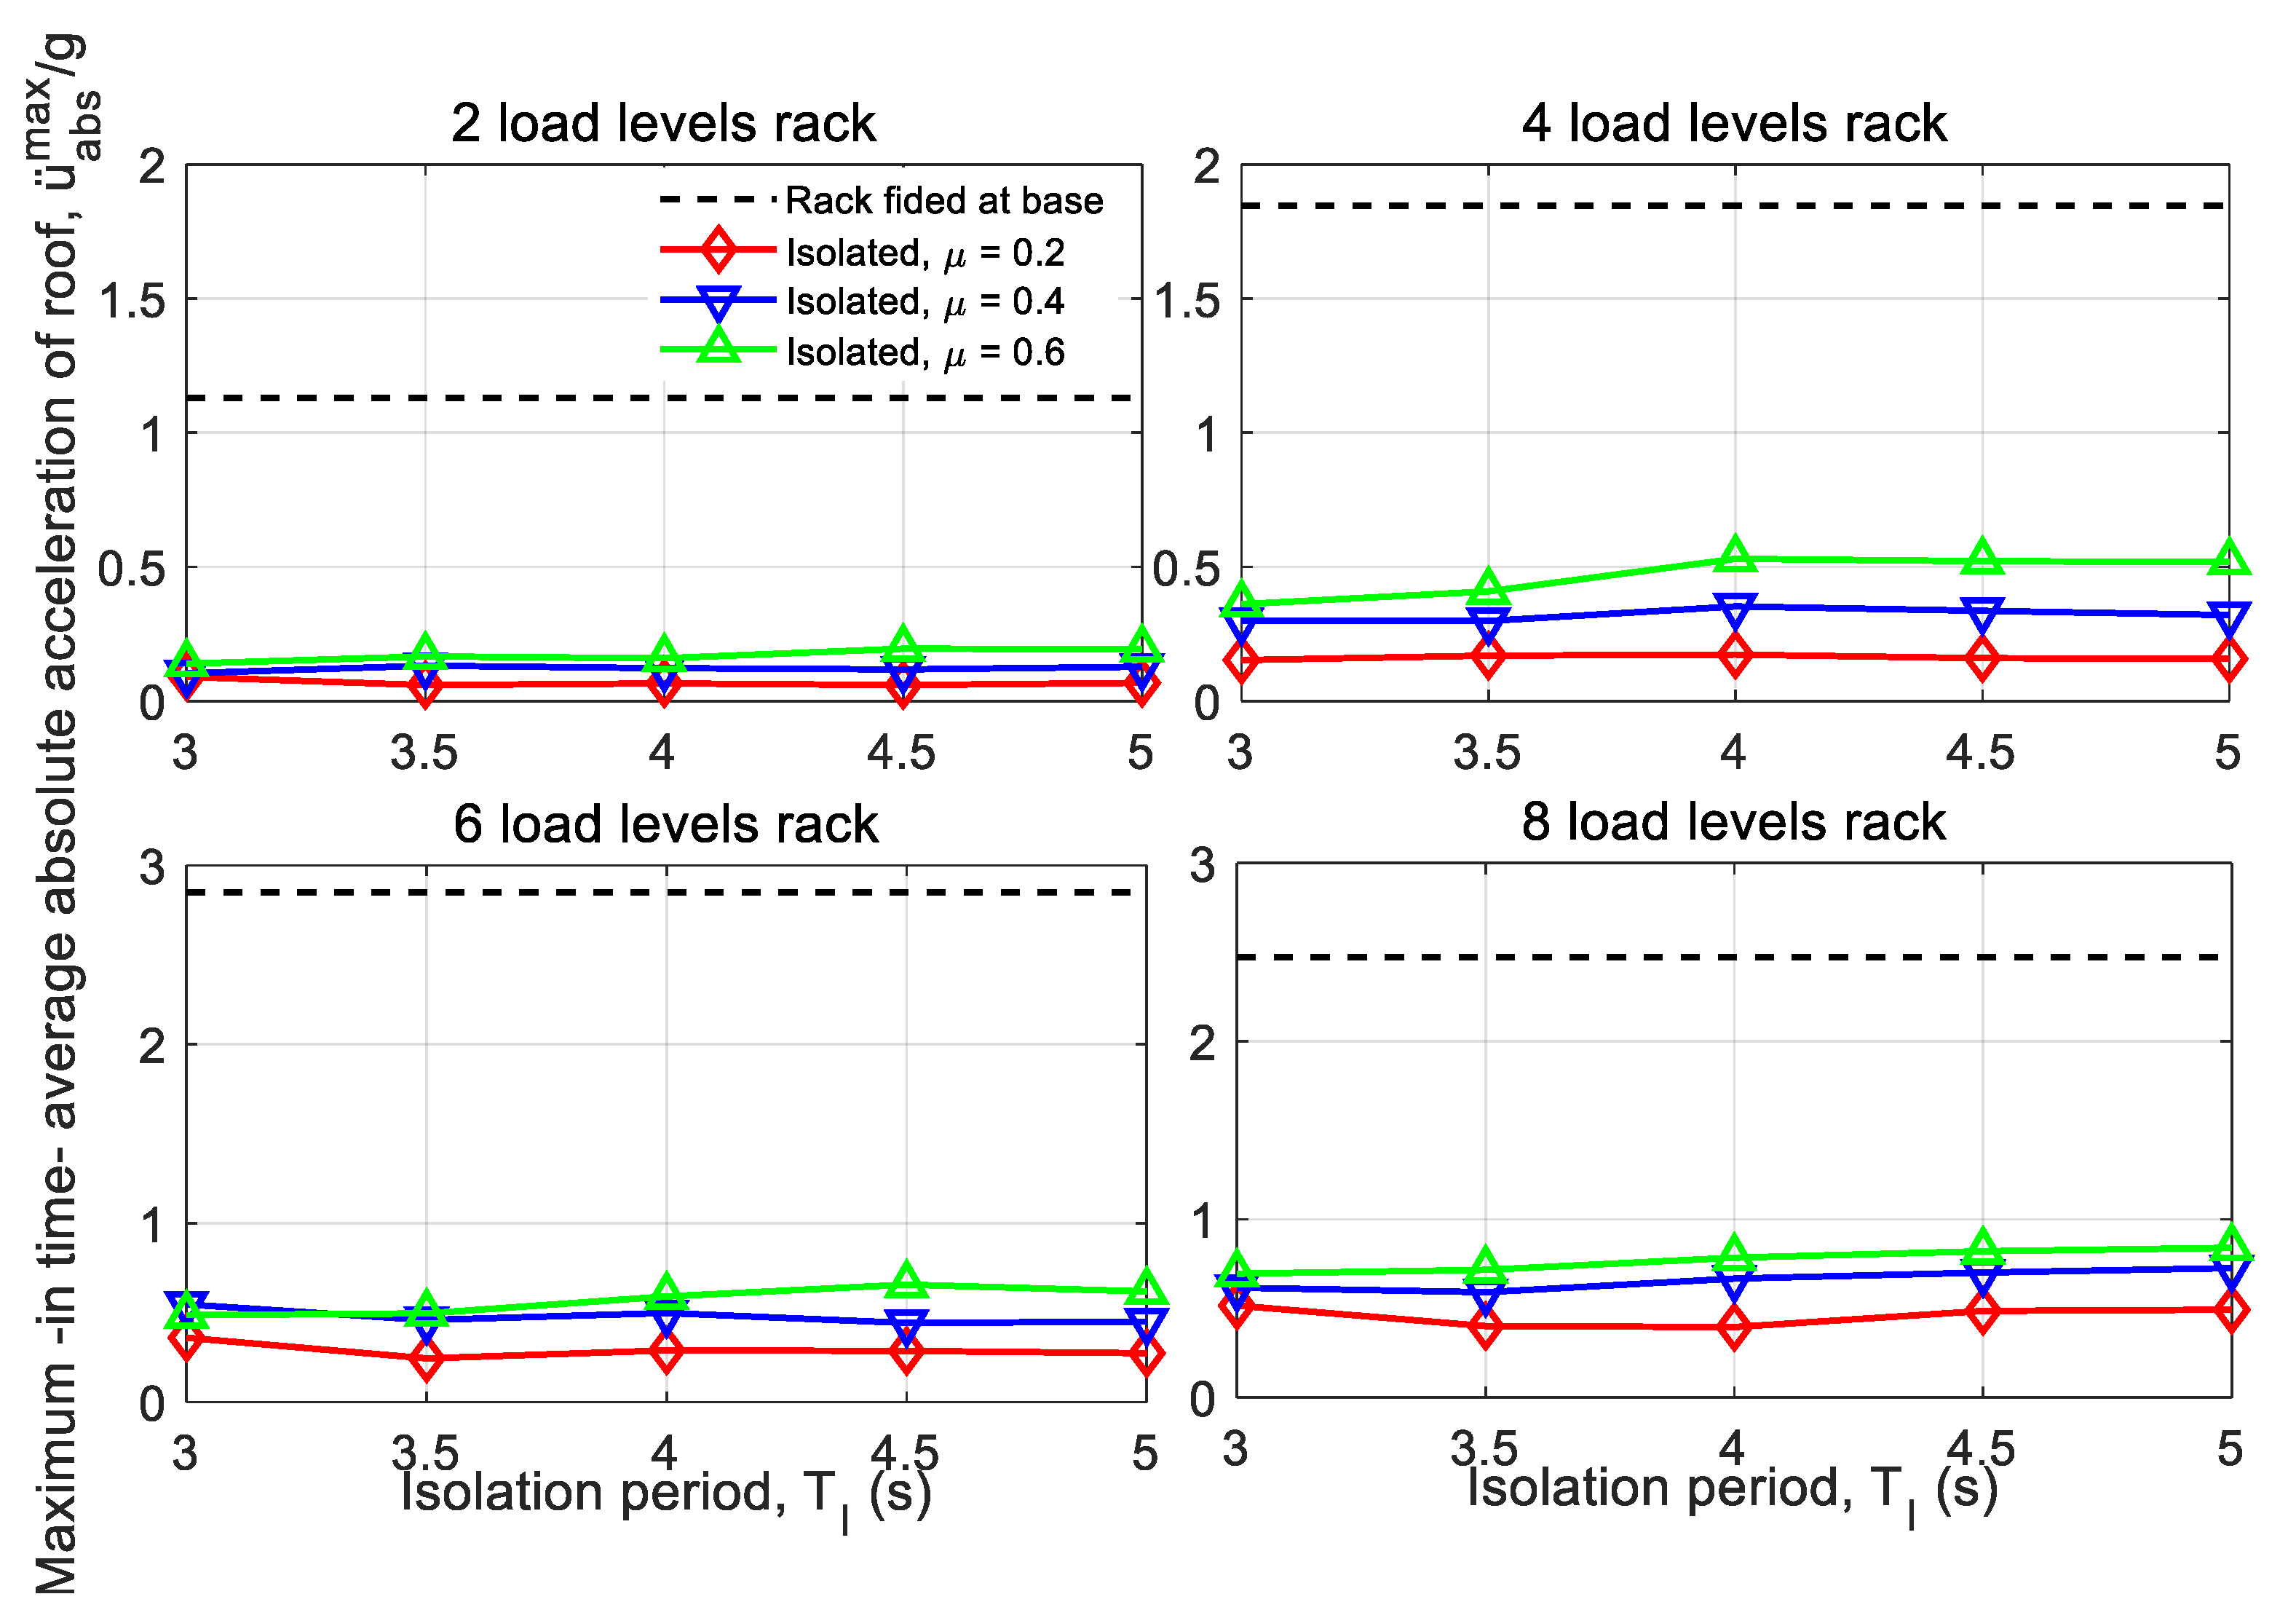
It can be seen from Figure 10 that all the racks with a fixed support at the base exceed the critical acceleration defined by Equation (12). This indicator suggests that in the racks with fixed basal supports analyzed, the stored pallets could overturn under the action of a severe earthquake that equals the most severe design expectations of NCh2745. With the implementation of base isolation and using the same criteria, in practically all analyzed structures, it is suggested that no pallet overturning would occur. An exception to the above is the 8-level rack with isolation periods TI = 4, 4.5 and 5 s and friction coefficient in the ball joint μ = 0.6, where the critical acceleration is slightly exceeded. This value is consistent, since the friction dissipation acts as a brake, increasing the absolute accelerations, although the basal shear load is reduced. However, this problem is solved by reducing the dissipation capacity in the isolation system by decreasing the friction coefficient μ or the diameter of the ball joint at the base of the isolation devices d.
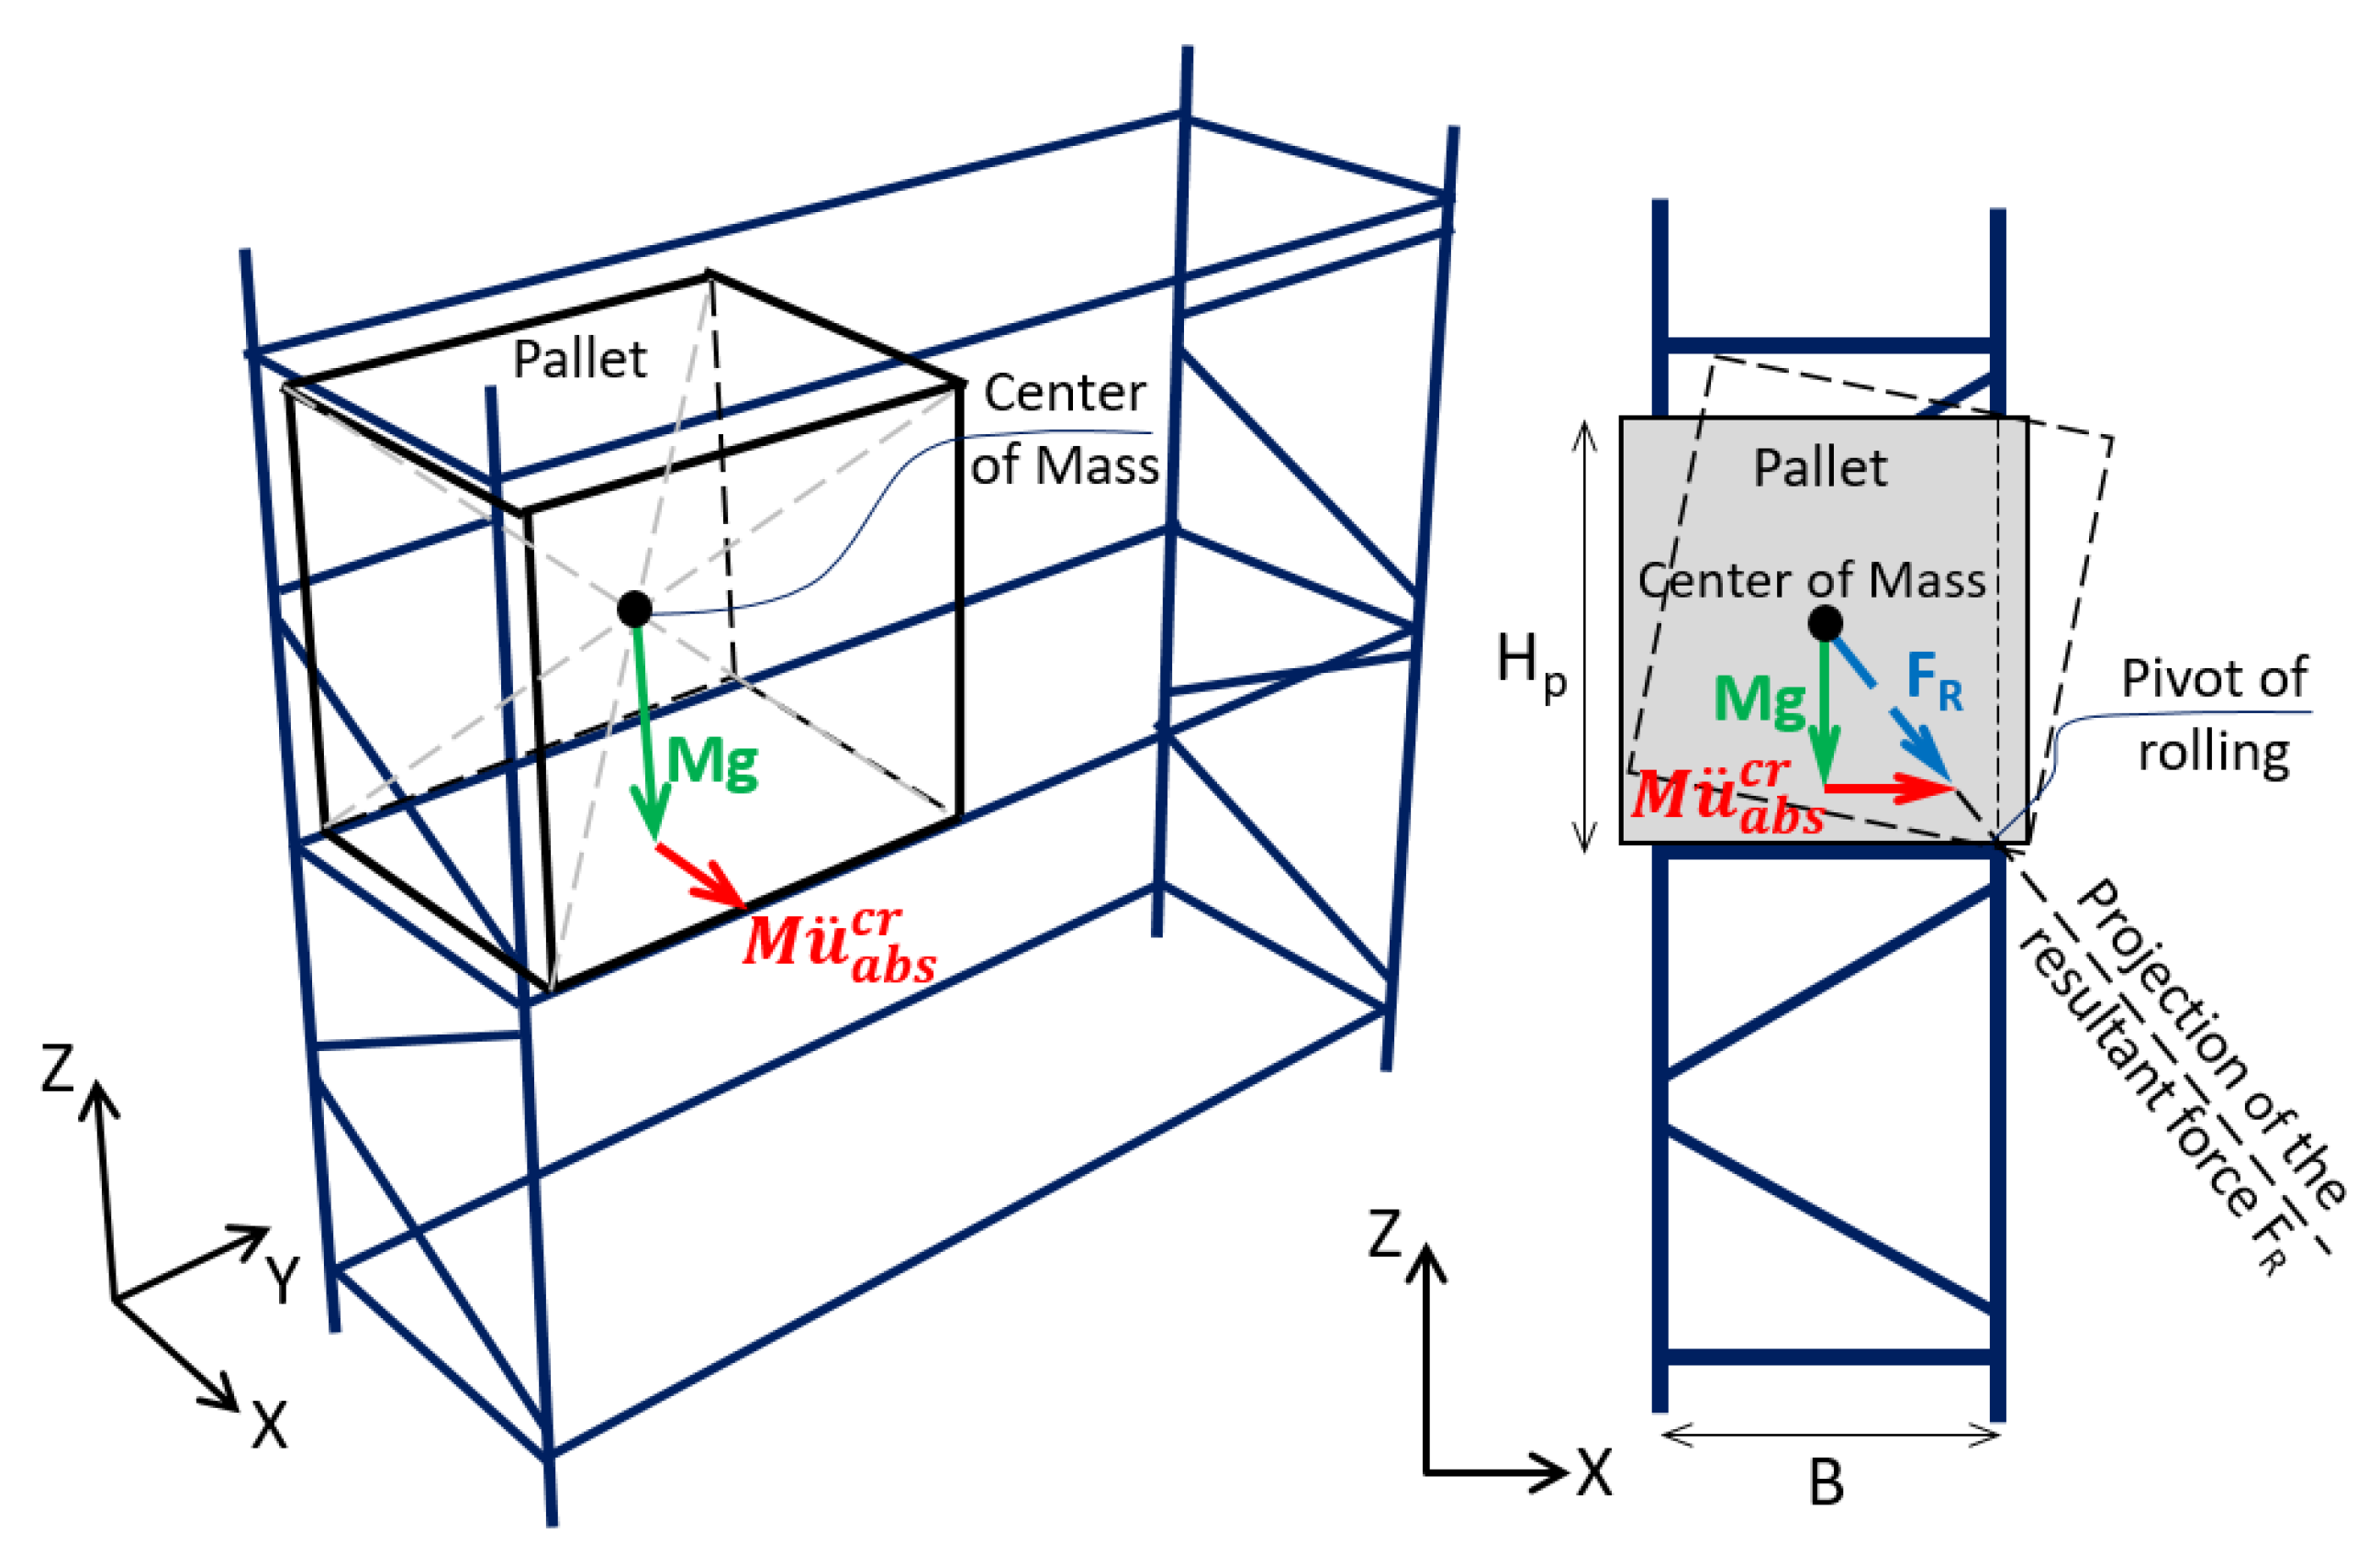
The maximum absolute acceleration was considered a response of interest since it is related to the overturning of the products stored in the rack. Figure 11 shows a diagram of the stored pallet, with height Hp = 1.35 m and width between support beams B = 0.85 m. This figure illustrates the horizontal acceleration condition considered critical for overturning effects. This condition is defined by the state in which the projection of the force resulting from the seismic action and the acceleration of gravity cuts the basal edge of the pallet (pivot rolling in Figure 11). This effect corresponds to an unstable equilibrium condition, since a horizontal acceleration greater than that illustrated in Figure 11 and defined analytically by Equation (12), will cause the stored pallet to overturn. In the illustrated condition, if the absolute horizontal acceleration is greater than 0.63∙g, the pallets will overturn.
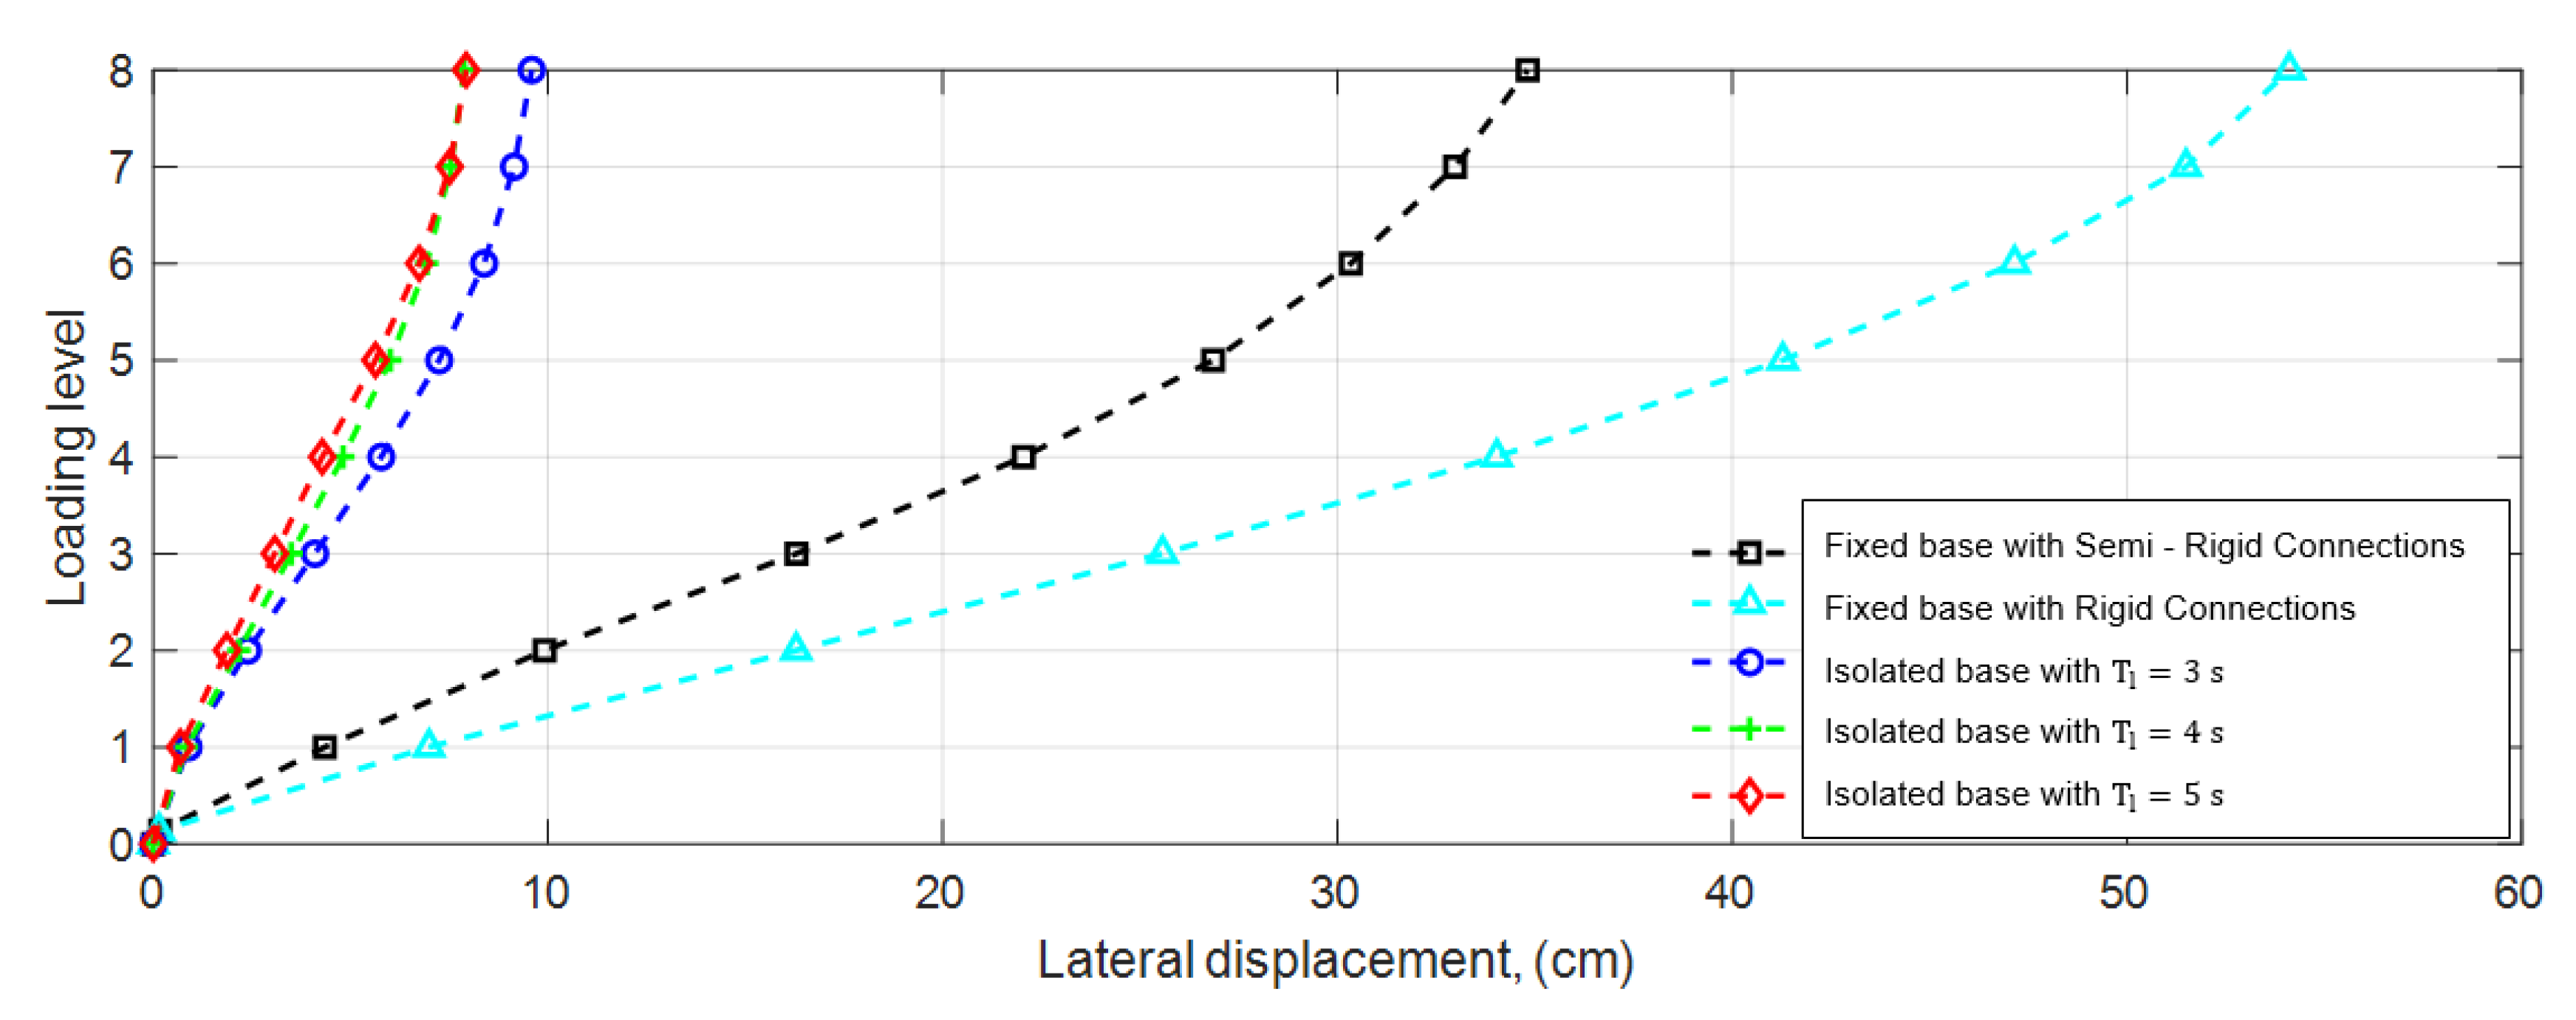
Figure 12 shows the maximum lateral displacement of each level considering 8-level racks with a friction coefficient in the ball joint at the base of the isolator µ = 0.4, corresponding to steel against steel. In the figure, results are superimposed for different conditions: (1) rack with a fixed support at the base and rigid connections, (2) rack with a fixed support at the base and semi-rigid connections and (3) racks with base isolation and period of isolation TI = 3, 4 and 5 s. It is observed that there is a reduction in the lateral displacements of the base isolated rack (models 3) with respect to the models (1) and (2) of racks fixed at its base. In storage level 8, a reduction of 46.2 cm is observed between rack (3) with TI = 5 s and rack (1); such reduction is 26.9 cm when compared to the rack (2). Furthermore, the lateral displacements in level 8 are 9.6 and 7.9 cm, for the racks with an isolation period of 3 and 5 s, respectively. The displacement of the racks with isolation periods of 4 s and 5 s are practically the same. It is inferred that the longer the period of isolation the structure will have a greater reduction in the target response of floor drift. It is also observed that the maximum floor displacements of the rack with semi-rigid connections are less than those of the rack with rigid connections. Although the former is more flexible than the latter, the energy dissipation capacity provided by the semi-rigid connections contributed to reducing lateral displacement, achieving better performance in terms of maximum drift.
Figure 13 shows the maximum displacement of the isolation level for racks with different load levels, friction coefficient on the ball joint at the base of the insulator (μ) and isolation period TI. It is observed that the greater the magnitude of μ, the maximum displacement in the base becomes less and less, due to the greater dissipation of energy. It is also observed that the less slender the structure—fewer load levels—the greater the maximum displacement achieved at the base, compared to more slender structures. This relation makes sense since the structure becomes more flexible as it is more slender, that is, its fundamental period increases, having a lower acceleration in the design spectrum (Figure 6).
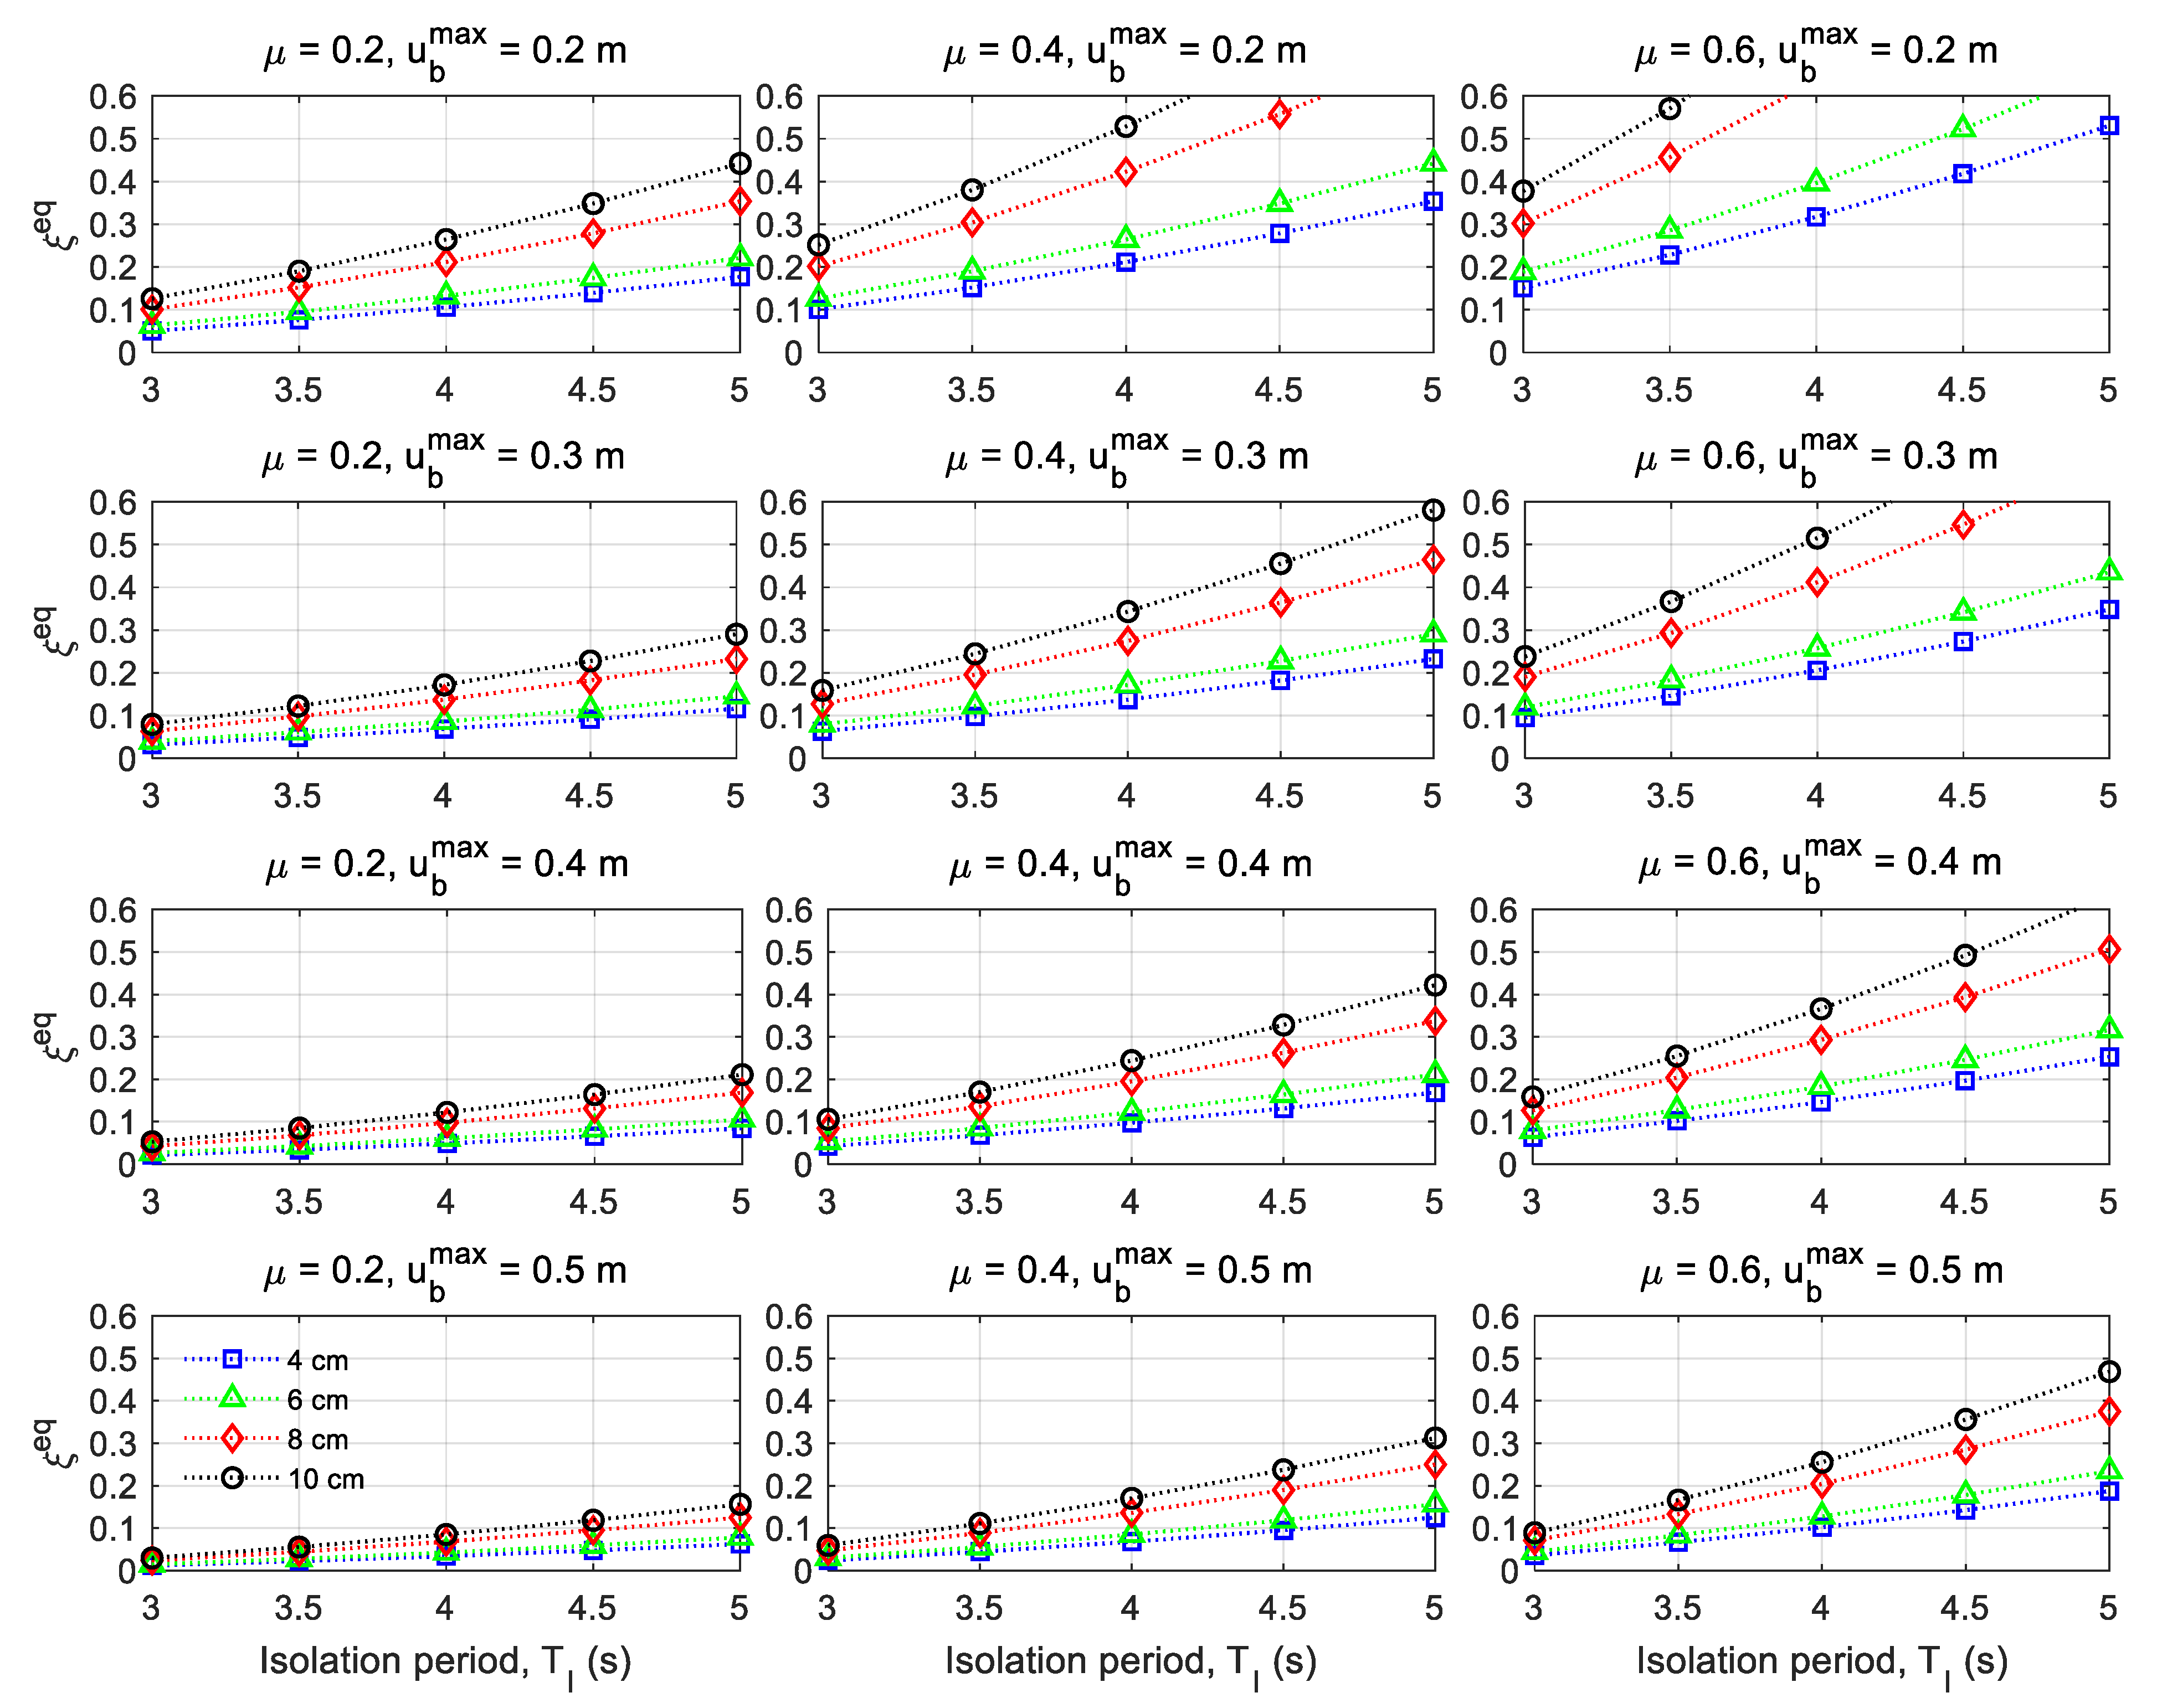
Figure 14 shows the equivalent damping ratio () of the isolation system considering different coefficients of friction in the ball joint at the base of the isolator μ = 0.2, 0.4 and 0.6. The calculation of was performed by matching the dissipated energy of two 1 degree of freedom systems, one of them being linear elastic and the other governed by Equation (3). Both are subjected to a harmonic basal displacement force of the type , where ωI = 2π/TI is the isolation frequency (rad/s). The energy dissipated by a linear dynamic system in an imposed displacement cycle is given by [25]:
For the case of the nonlinear dynamic system that uses the roller type isolator, is calculated with Equation (3), assuming Rn = mt∙g and performing the calculations, the following is obtained:
For the case of the linear dynamic system, we have that , so by performing the calculations we obtain:
Equating the dissipated energies and solving for we have:
For the calculation of , maximum displacements at the level of the isolation system = 20, 30, 40 and 50 cm were considered. In addition, the different isolator ball diameters are considered: d = 5, 7.5, 8.5 and 10 cm, which are related to racks with 2, 4, 6 and 8 load levels, respectively (Table 1). The results are shown in Figure 14.
Figure 14 explains why high maximum displacements at basal level () occur in some rack analysis cases. For example, ~ is obtained, considering μ = 0.2, TI = 3 s and a rack with 2 load levels (Figure 13a). This value is due to the fact that the equivalent damping is very low, 1.2% in this case, as shown in Figure 14. However, when the displacement is less than 30 cm, there is a greater . This is exemplified when μ = 0.2, a rack with 4 load levels and TI = 4, 4.5 and 5 s is considered, obtaining = 8.5, 11.4 and 14.5%, respectively (Figure 14).
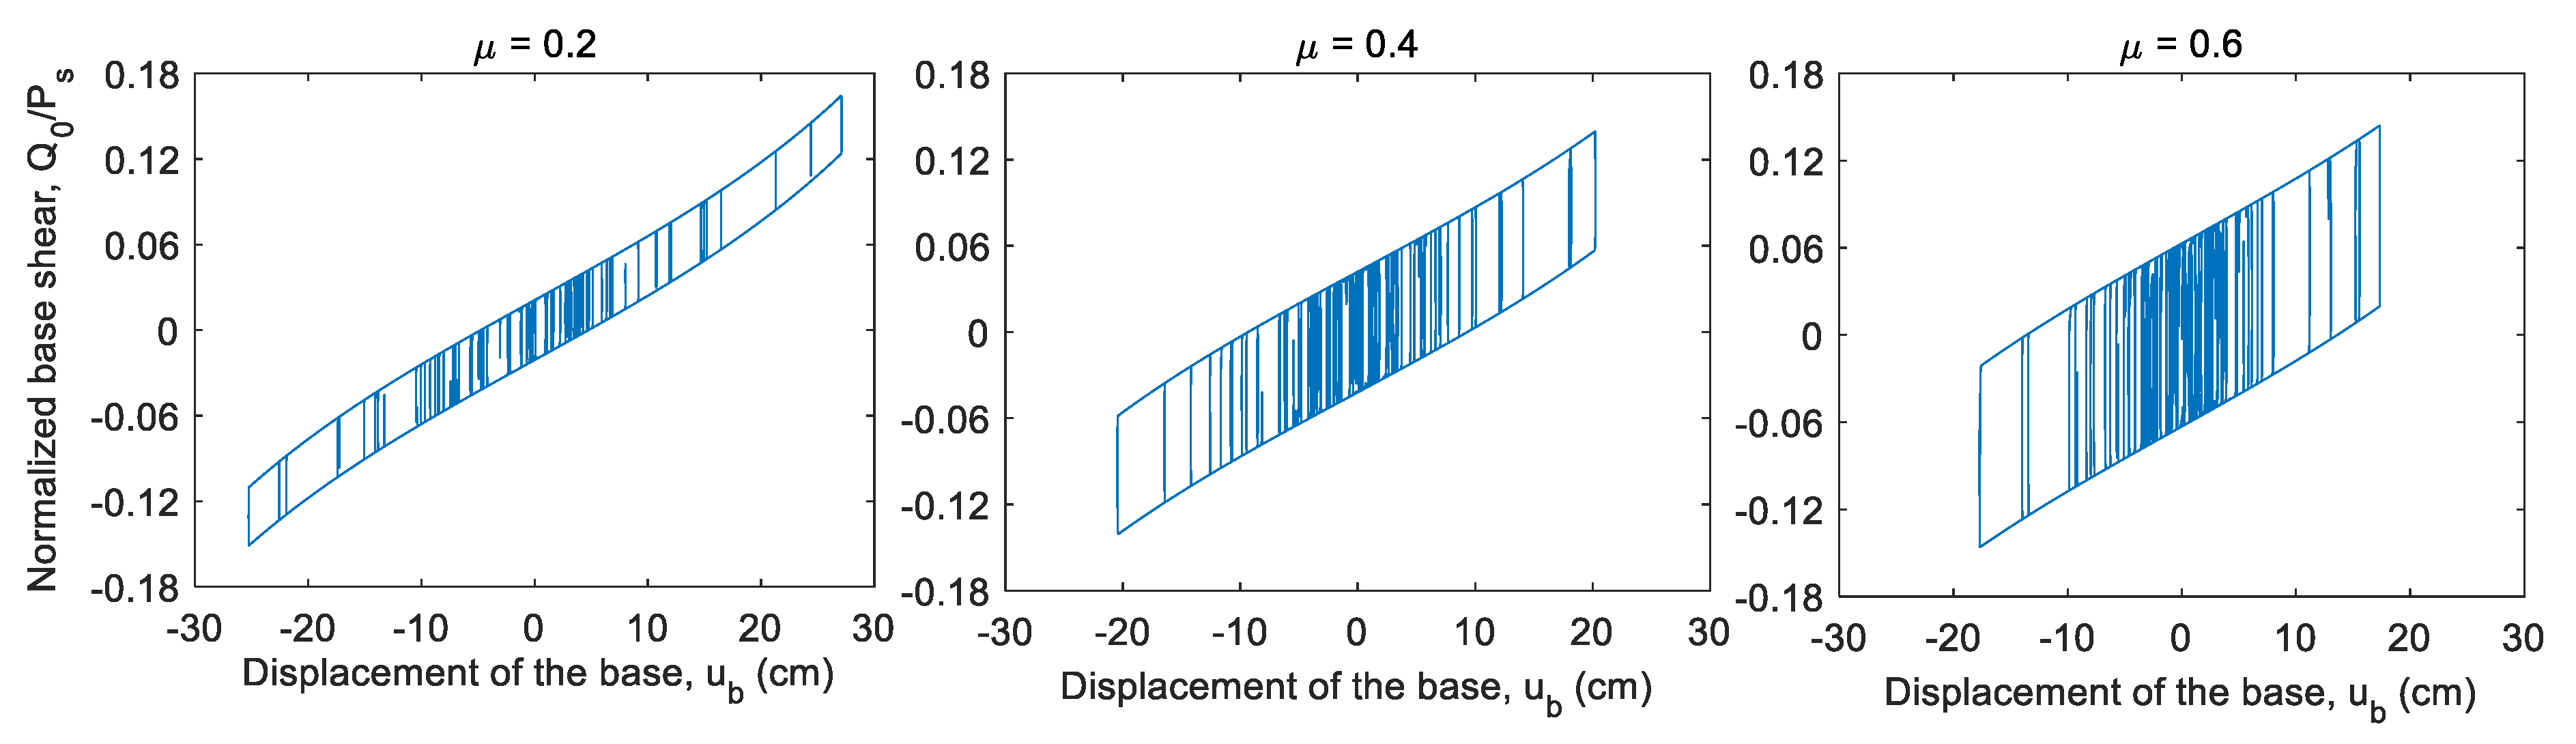
Figure 15 shows the hysterical cycle of the base isolation system in terms of normalized basal shear load versus the displacement of the center of the mass of the basal level. The results are shown with different coefficients of friction in the ball joint at the isolator base (μ) of a 6-level rack and isolation period TI = 4 s. It is observed that the greater the magnitude μ, the band of the hysterical cycle becomes wider, so there is a greater dissipation of energy; the same is observed in the equivalent damping ratio (Figure 14). The effectiveness of energy dissipation can be seen when the magnitudes of the maximum displacement of the isolation level (Figure 15) decrease with increasing μ for racks with the same number of levels.
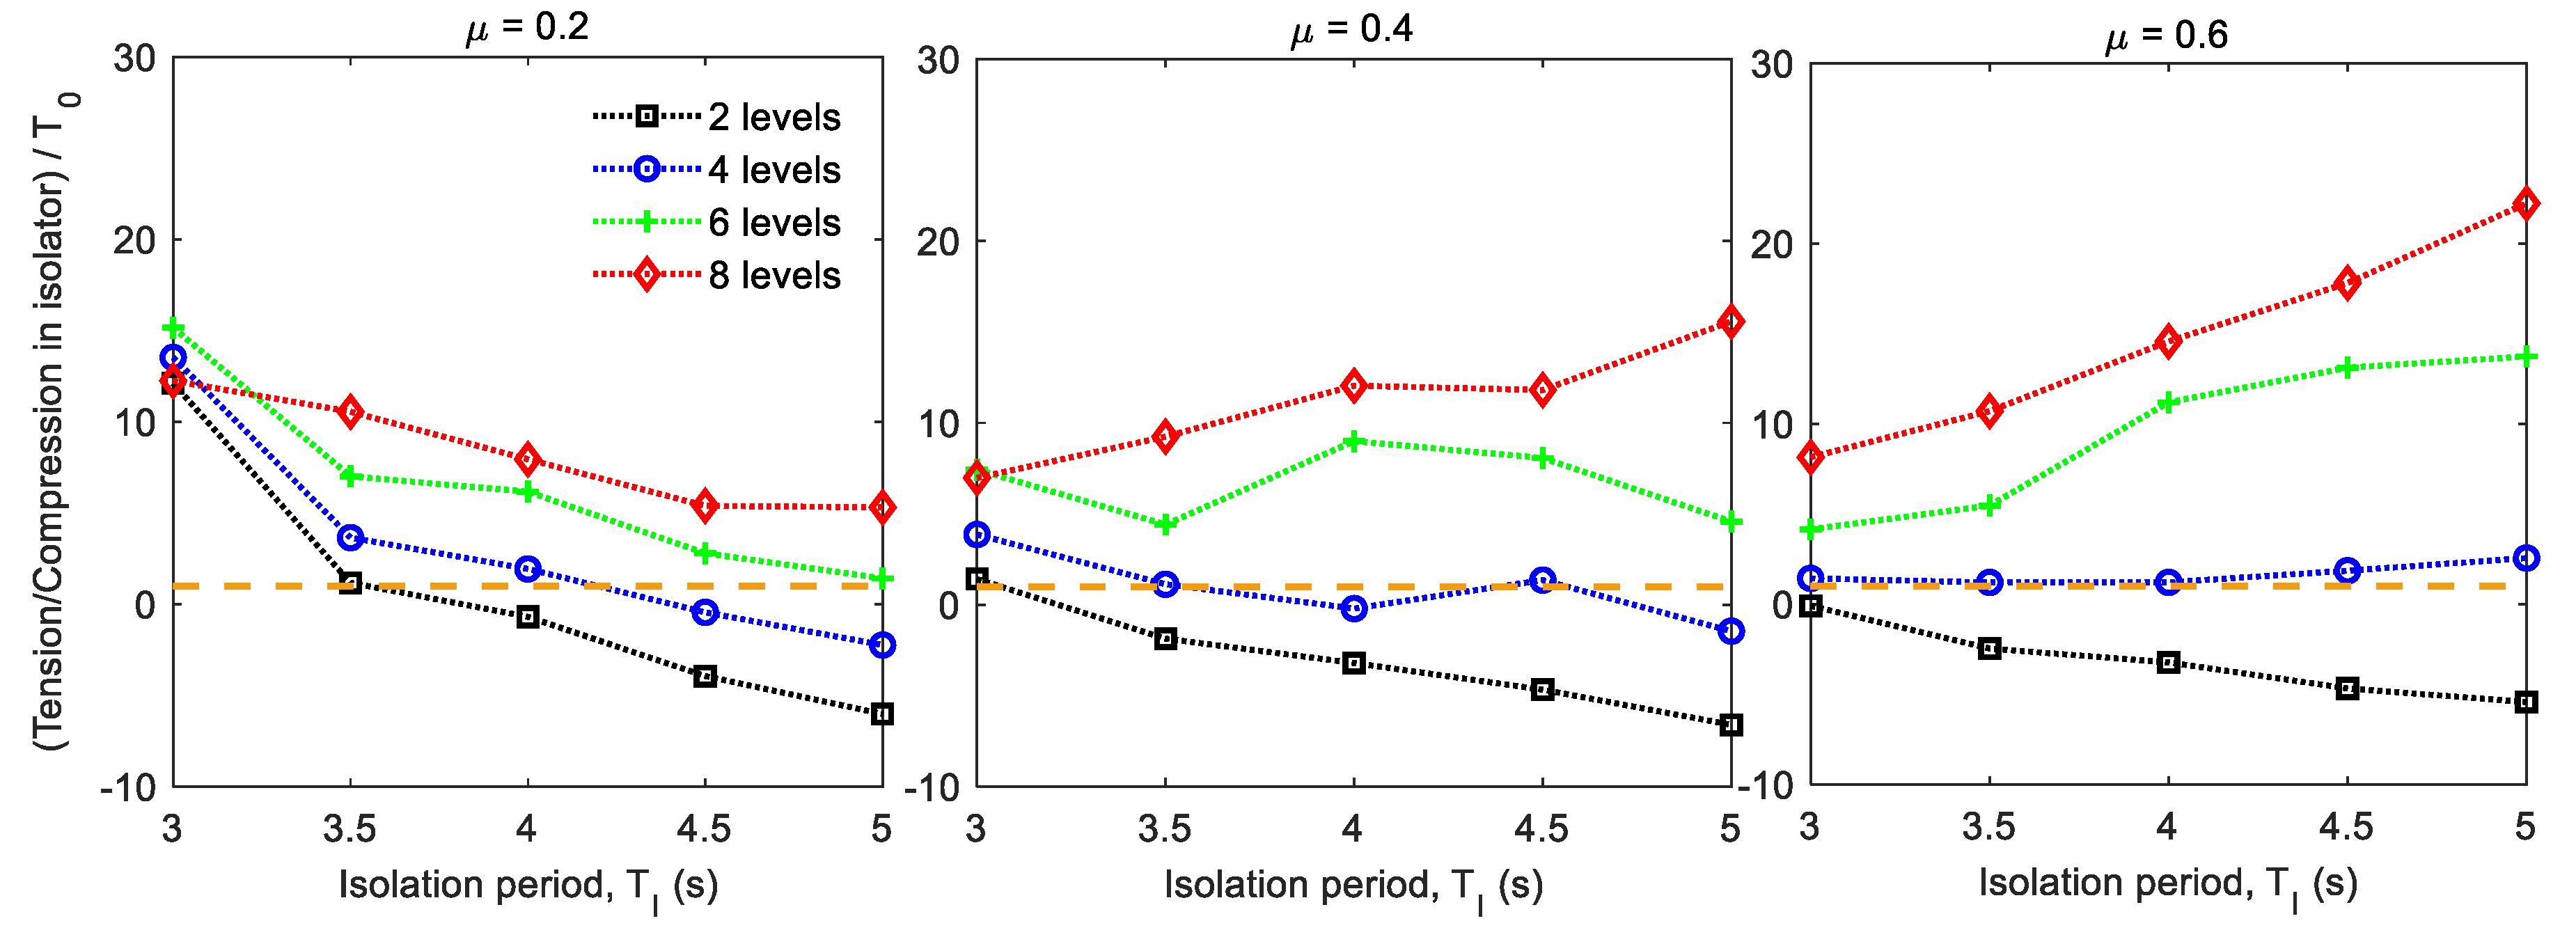
Figure 16 shows the ratio between the maximum axial load—tension—or minimum axial load—compression—on the isolators, and the initial tension of the cable (T0), considering the seismic input acting in cross the aisles direction of the rack. While in Figure 17, the seismic input is considered to be acting in the longitudinal direction. If the quotient is greater than 1 there is lifting in the isolator, otherwise, the isolator is compressed and works stably.
In many of the cases analyzed, the racks suffer uplift at the isolation interface when the seismic input acts in the transverse direction of the rack (Figure 16). The cases where lifting is foreseen are the racks with 6 and 8 load levels. In racks with 2 and 4 load levels, lifting can be avoided by considering adequate values for the isolation period and coefficient of friction in the ball joint.
From Figure 16 it can be seen that when considering a coefficient of friction in the ball joint at the base of the isolator μ = 0.2, a reduction in the tensile load on the isolators is achieved either by increasing the isolation period or by increasing the number of rack load levels. However, this trend is not maintained in the highest racks when considering μ = 0.4 and 0.6; in such cases, the slimmer the rack, the more traction on the insulators. From the above, it follows that increasing the frictional dissipation capacity of the insulation system is inefficient and even detrimental for slimmer racks with six or more levels.
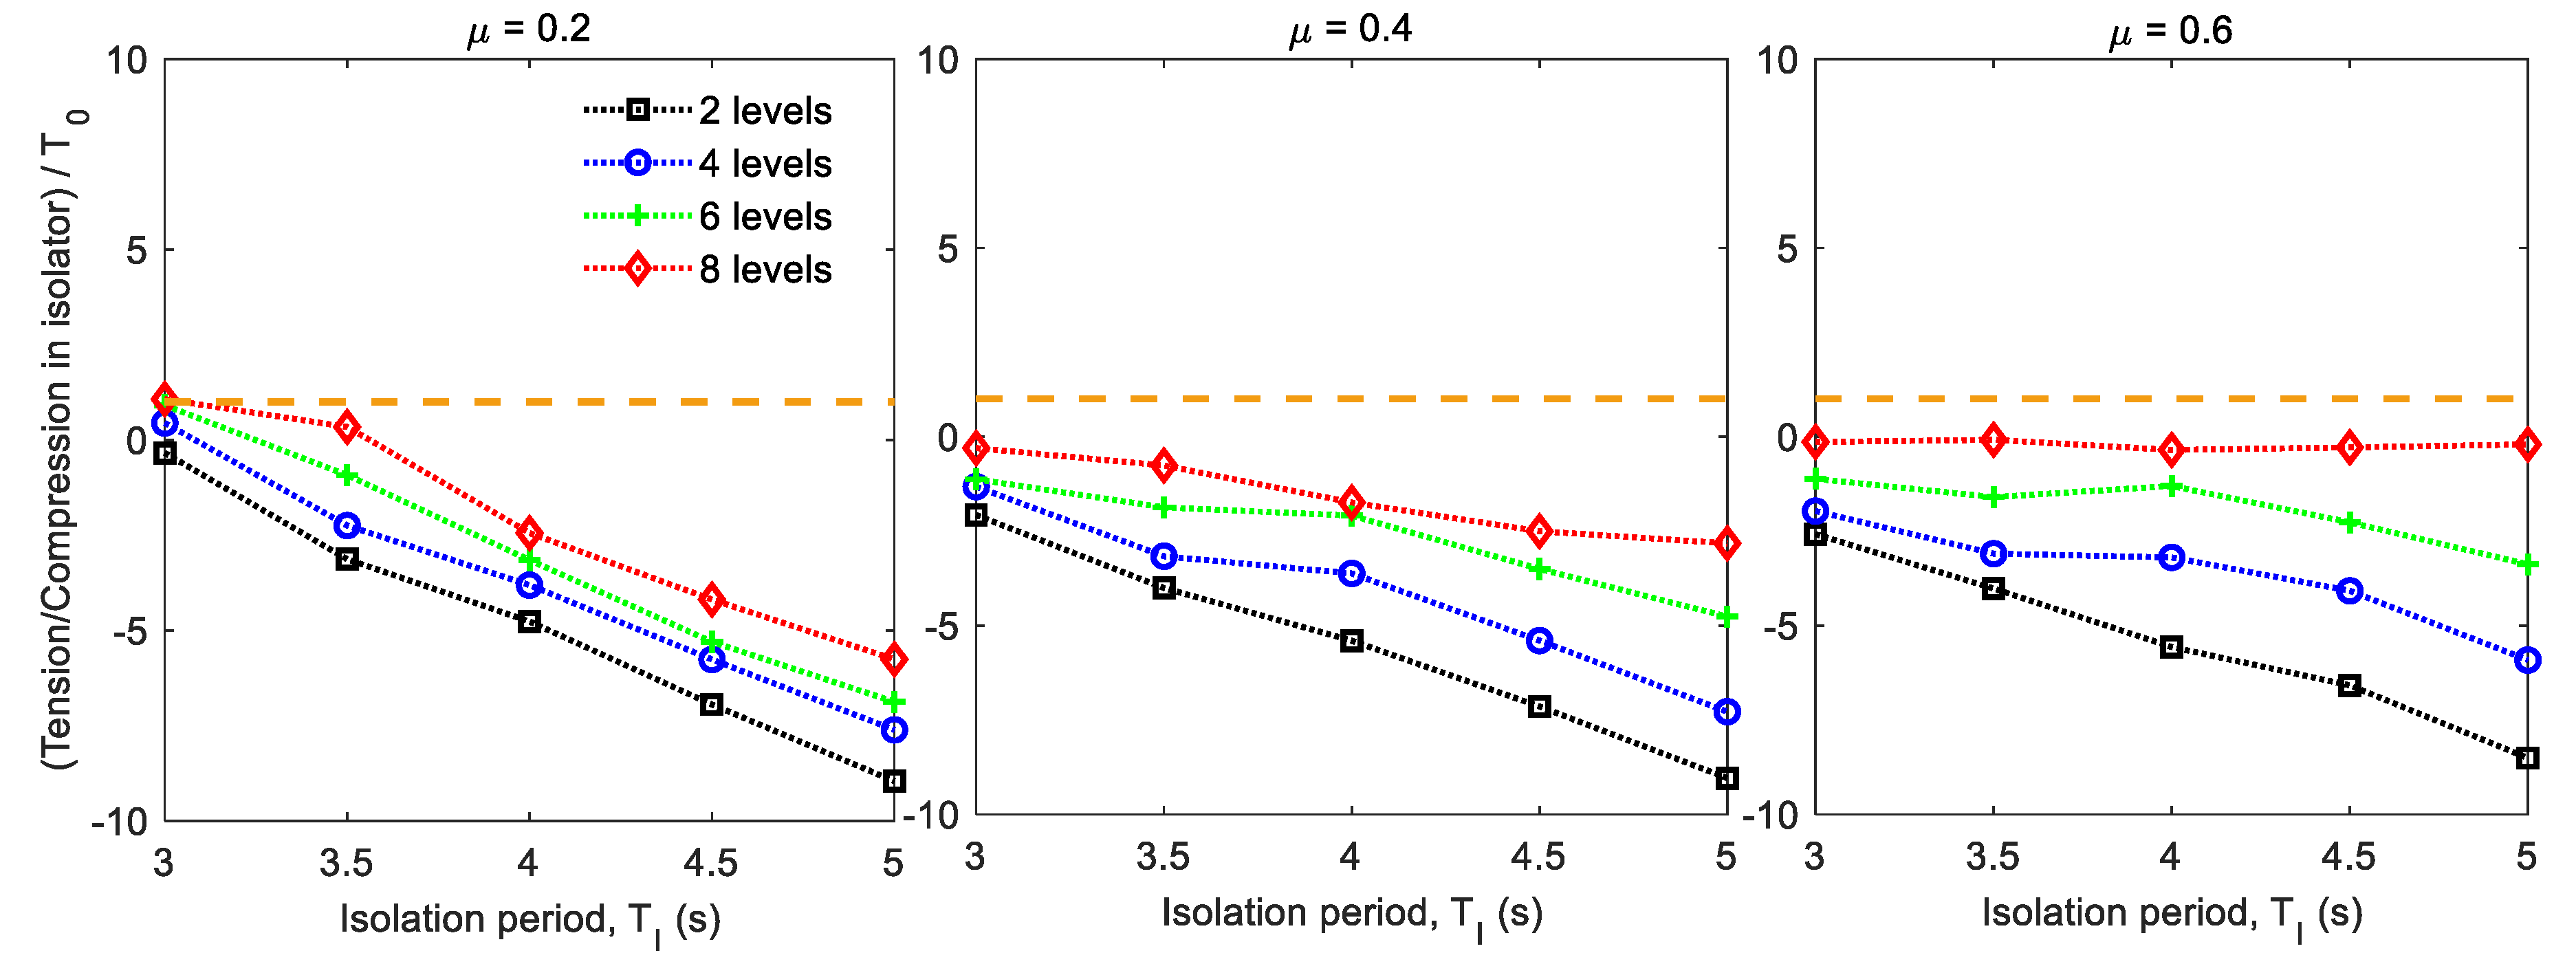
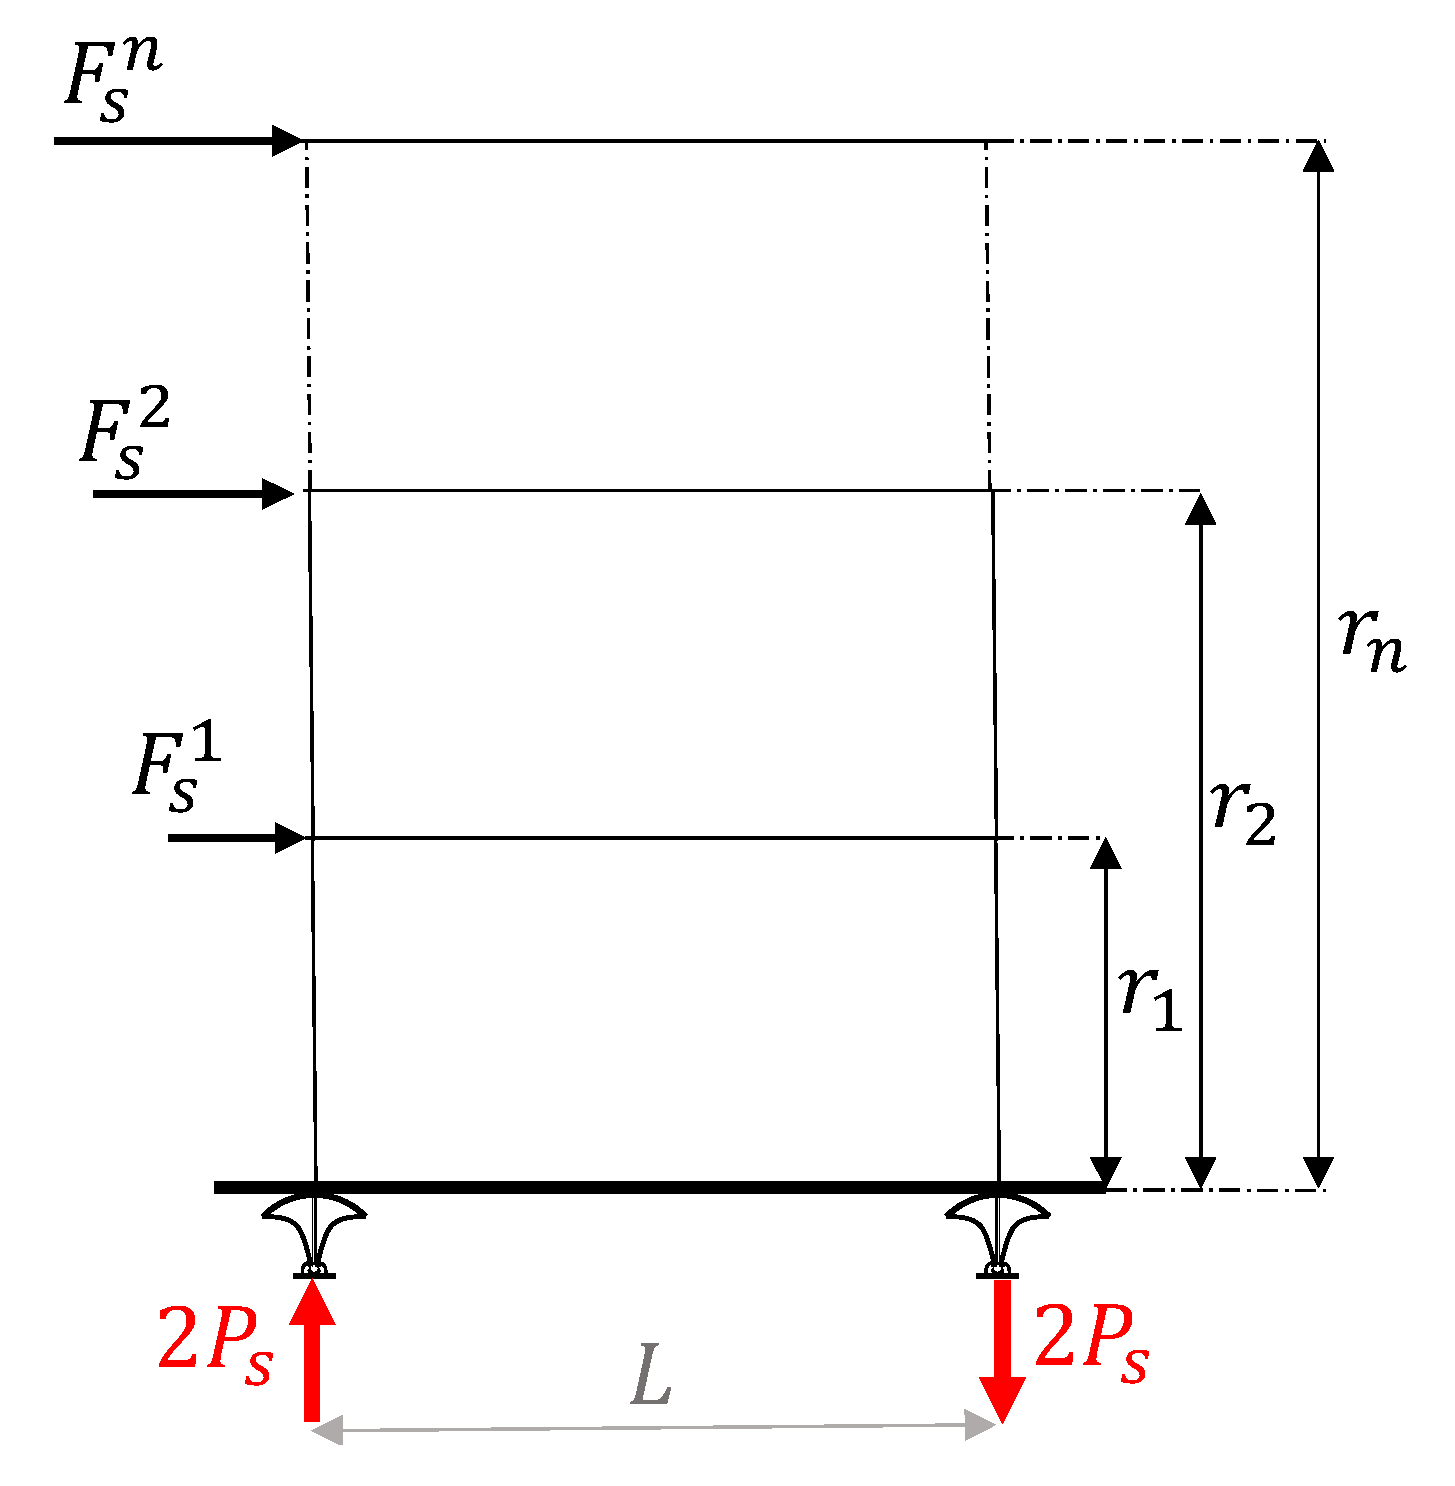
When considering the earthquake acting in the longitudinal direction, no uplift is observed in any isolator (Figure 17). This is due to greater separation between the compressed and tensile isolators by seismic load—2.7 m compared to 0.85 m when considering the earthquake transversely. In this way, the seismic turning moment can be resisted with much lower dynamic load induced on the isolators. This condition is exemplified in Figure 18 and the reactions are determined by Equation (17):
5. Summary
In this investigation, a numerical study of the seismic performance of rack-type storage structures with roller-type base isolation system was carried out. The seismic behavior was evaluated considering a Chilean earthquake scaled to match its response spectrum with the NCh2745 design spectrum in high seismic hazard and soft soil for foundation. The analyzed models consider the non-linear characteristics of the system. The effectiveness of the basal roller-type isolation device was evaluated in terms of maximum floor drift, maximum absolute acceleration, and maximum basal shear load. Finally, its comparison with racks without isolation was made. The roller-type isolation system allowed obtaining a reduction in absolute accelerations between approximately 75% and 90%, compared to the same fixed rack at its base. This makes it possible to reduce the vulnerability of the stored load to overturning under the action of a severe earthquake. The increase in the fundamental period of the rack structures by incorporating seismic isolation made it possible to reduce the basal shear load by approximately 80% and the drift values by even higher than 90% compared to fixed-base racks. It was determined that the energy dissipation capacity of the isolation system increases the greater the product between the magnitude of the friction coefficient in the ball joint at the base of the isolator and its diameter (μ∙d). However, the higher the structure, the more inefficient and even detrimental to increase said dissipation capacity is. Finally, no lifting forces were obtained when the earthquake was applied in the longitudinal direction of the structure in any isolator. However, when applied in the transverse direction, lifting is observed in the isolators in some cases, particularly in high racks with excess energy dissipation at the basal level and without such long periods of isolation.
Author Contributions
Conceptualization, N.M.; methodology, N.M.; software, O.Á.; validation, O.Á. and N.M.; formal analysis, O.Á.; investigation, N.M.; writing—original draft preparation, O.Á., N.M. and E.N.; writing—review and editing, E.N. and Á.R.-V.; visualization, N.M., Á.R.-V. and E.N.; supervision, N.M. and F.S.; project administration, N.M.; funding acquisition, N.M. All authors have read and agreed to the published version of the manuscript.
Funding
This research was supported by the FAA Fund of the Research Directorate of the Universidad Católica de la Santísima Concepción, Chile. The authors also acknowledge the project awarded “CONICYT FONDEF/CONCURSO IDeA I+D, FONDEF/CONICYT 2020 Folio ID19I10081”. The financing granted to the project entitled “Seismic protection of industrial storage racks through the implementation of a base isolation device with tensile strength”.
Institutional Review Board Statement
Not applicable.
Informed Consent Statement
Not applicable.
Data Availability Statement
Datais contained within the article.
Conflicts of Interest
The authors declare no conflict of interest.
Nomenclature
| Number of pallet load levels | |
| Isolation period. | |
| T0 | Initial stress of the elastic element inside the isolator, T0 > 0 in tension. |
| T(u) | Tension of the cable in series with the elastic element as a function of . |
| d | Ball diameter at the insulator basal patella (d = 2r, Figure 3b). |
| H | Isolator height (Figure 2a). |
| Rn | Normal reaction in the basal ball patella (Equation (3)), Rn > 0 in compression. |
| µ | Coefficient of friction between materials in contact in the basal ball joint. |
| Volume of the upper air chamber. | |
| Lower air chamber volume. | |
| Length of the compressed air chamber, and is the length of the upper and lower cylinder, respectively. | |
| Initial air chamber pressure. |
References
- Saravanan, M.; Marimuthu, V.; Prabha, P.; Surendran, M.; Palani, G. Seismic characterization of cold formed steel pallet racks. Earthquakes Struct. 2014, 7, 955–967. [Google Scholar] [CrossRef]
- Teh, L.H.; Hancock, G.J.; Clarke, M.J. Analysis and Design of Double-Sided High-Rise Steel Pallet Rack Frames. J. Struct. Eng. 2004, 130, 1011–1021. [Google Scholar] [CrossRef] [Green Version]
- Bernuzzi, C. European and United States approaches for steel storage pallet rack design: Part 1: Discussions and general comparisons. Thin-Walled Struct. 2015, 97, 308–320. [Google Scholar] [CrossRef]
- Kilar, V.; Petrovčič, S.; Koren, D.; Šilih, S. Seismic analysis of an asymmetric fixed base and base-isolated high-rack steel structure. Eng. Struct. 2011, 33, 3471–3482. [Google Scholar] [CrossRef]
- Freitas, A.M.S.; De Souza, F.T.; Freitas, M.S.D.R. Analysis and behavior of steel storage drive-in racks. Thin-Walled Struct. 2010, 48, 110–117. [Google Scholar] [CrossRef]
- Yin, L.; Tang, G.; Zhang, M.; Wang, B.; Feng, B. Monotonic and cyclic response of speed-lock connections with bolts in storage racks. Eng. Struct. 2016, 116, 40–55. [Google Scholar] [CrossRef]
- Yin, L.; Tang, G.; Li, Z.; Zhang, M.; Feng, B. Responses of cold-formed steel storage racks with spine bracings using speed-lock connections with bolts I: Static elastic-plastic pushover analysis. Thin-Walled Struct. 2018, 125, 51–62. [Google Scholar] [CrossRef]
- Nuñez, E.; Aguayo, C.; Herrera, R. Assessment of the Seismic Behavior of Selective Storage Racks Subjected to Chilean Earthquakes. Metals 2020, 10, 855. [Google Scholar] [CrossRef]
- Uma, S.R.; Beattie, G. Observed performance of industrial pallet rack storage systems in the Canterbury earthquakes. Bull. N. Z. Soc. Earthq. Eng. 2011, 44, 388–393. [Google Scholar] [CrossRef] [Green Version]
- Alhan, C.; Gavin, H.P. Reliability of base isolation for the protection of critical equipment from earthquake hazards. Eng. Struct. 2005, 27, 1435–1449. [Google Scholar] [CrossRef]
- Sideris, P.; Filiatrault, A.; Leclerc, M.; Tremblay, R. Experimental Investigation on the Seismic Behavior of Palletized Merchandise in Steel Storage Racks. Earthq. Spectra 2010, 26, 209–233. [Google Scholar] [CrossRef]
- FEMA-460 Seismic Considerations for Steel Storage Racks Located in Areas Accessible to the Public; National Institute of Building Sciences: Washington, DC, USA, 2005.
- Coutinho, G.E.N.R. Numerical Simulation of the Seismic Behavior of Steel Storage Pallet Racking Systems; Instituto Superior Técnico: Lisbon, Portugal, 2008. [Google Scholar]
- Bernuzzi, C.; Gabbianelli, G.; Gobetti, A.; Rosti, A.; Gabbianelli, G. Beam design for steel storage racks. J. Constr. Steel Res. 2016, 116, 156–172. [Google Scholar] [CrossRef]
- Baldassino, N.; Zandonini, R. Design by testing of industrial racks. Adv. Steel Constr. 2011, 7, 27–47. [Google Scholar] [CrossRef] [Green Version]
- Kwarteng, K.; Beale, R.; Godley, M.; Thomson, S. The Effects of Seismic Loading on Pallet Rack Semi-Rigid Joints. In Proceedings of the Eleventh International Conference on Computational Structures Technology, Dubrovnik, Croatia, 4–7 September 2012. [Google Scholar]
- Gutelius, J.B., Jr.; McIntosh, S.C.; Notohardjono, B.D. Computer Equipment Having an Earthquake Damage Protection Mechanism. U.S. Patent No. 6,059,251, 9 May 2000. [Google Scholar]
- Pellegrino, J.B.; Courtwright, J.A.; Michael, R. Storage Rack Vibration Isolators and Related Storage Racks. U.S. Patent No. 7,263,806, 4 September 2007. [Google Scholar]
- Michael, R.J.; Courtwright, J.A.; Ferro, E.B.; Filiatrault, A.; Higgins, P.S.; Wanitkorkul, A. Development of a new base isolation system for seismic isolation of steel pallet storage racks. In Proceedings of the 9th US National and 10th Canadian Conference on Earthquake Engineering (9USN10CEE), Toronto, ON, Canada, 25–29 July 2010; Volume 10. [Google Scholar]
- Kilar, V.; Petrovčič, S.; Koren, D.; Šilih, S. Cost viability of a base isolation system for the seismic protection of a steel high-rack structure. Int. J. Steel Struct. 2013, 13, 253–263. [Google Scholar] [CrossRef]
- INN. Diseño Sísmico de Estructuras e Instalaciones Industriales, NCh2369 Of. 2003; INN: Santiago, Chile, 2003. [Google Scholar]
- INN. Análisis y Diseño de Edificios con Aislación Sísmica. NCh2745 Of. 2013; INN: Santiago, Chile, 2013. [Google Scholar]
- Kodur, V.; Naser, M. Effect of local instability on capacity of steel beams exposed to fire. J. Constr. Steel Res. 2015, 111, 31–42. [Google Scholar] [CrossRef] [Green Version]
- Couto, C.; Maia, É.; Real, P.V.; Lopes, N. The effect of non-uniform bending on the lateral stability of steel beams with slender cross-section at elevated temperatures. Eng. Struct. 2018, 163, 153–166. [Google Scholar] [CrossRef]
- Maureira-Carsalade, N.; Pardo, E.; Oyarzo-Vera, C.; Roco, A. A roller type base isolation device with tensile strength. Eng. Struct. 2020, 221, 111003. [Google Scholar] [CrossRef]
- Maureira, N. Patent application Nº PCI/IB2018/059935, 2018; Instituto Nacional de Propiedad Intelectual—INAPI: Santiago, Chile, 2018; (Patent application in process). [Google Scholar]
- Ismail, M.; Ikhouane, F.; Rodellar, J. The Hysteresis Bouc-Wen Model, a Survey. Arch. Comput. Methods Eng. 2009, 16, 161–188. [Google Scholar] [CrossRef]
- Bernuzzi, C.; Simoncelli, M. Seismic Design of Grana Cheese Cold-Formed Steel Racks. Buildings 2020, 10, 246. [Google Scholar] [CrossRef]
- FORMAC. Catálogo General. FORMAC valor en Acero. 2020. Available online: http://www.formac.cl/adminsns/productos-recursos/manuales/ef63c77bc6a87cd7eaca602ff9f5fccb.pdf (accessed on 30 November 2020).
- Fluoroproducts, D. Teflon® ptfe Fluoropolymer Resin: Properties Handbook; DuPontTM Technical Report H-37051-3; DuPont Fluoroproducts: Wilmington, BC, USA, 1996. [Google Scholar]
- Marques, S.P.C. Análise não Linear Física e Geométrica de Pórticos Espaciais. 1990. Available online: http://hdl.handle.net/10183/1376 (accessed on 10 September 1990).
- Available online: https://www.strongmotioncenter.org/vdc/scripts/stnpage.plx?stations=1346 (accessed on 7 January 2020).
- Gasparini, D.A.; Vanmarke, E.H. Simulated Earthquake Motions Compatible with Prescribed Response Spectra; MIT Civil Engineering Research Report R76-4; Massachusetts Institute of Technology: Cambridge, MA, USA, 1973. [Google Scholar]
- Chopra, A.K. Dynamics of Structures, Theory and Applications to Earthquake Engineering, 4th ed.; Pearson Education Limited: London, UK, 2017. [Google Scholar]
Figure 1.
Basic structuring of each level of the racks analyzed.

Figure 2.
Scheme of the isolator used with a compressed air piston as an elastic element (a) static or undeformed equilibrium position, (b) deformed position with large lateral displacement.
Figure 2.
Scheme of the isolator used with a compressed air piston as an elastic element (a) static or undeformed equilibrium position, (b) deformed position with large lateral displacement.

Figure 3.
Pressure distribution in the ball joint of the isolator base. (a) Ball joint inside its bracket at the base of the isolator, (b) free-body diagram (F.B.D.) of the ball joint.
Figure 3.
Pressure distribution in the ball joint of the isolator base. (a) Ball joint inside its bracket at the base of the isolator, (b) free-body diagram (F.B.D.) of the ball joint.

Figure 4.
Elastic response of the isolator with compressed air piston.

Figure 5.
(a) Bouc–Wen bilinear conceptual model. (b) Hysteretic characteristic curve of the model, (c) linear elastic component of the model, (d) plastic component of the model.
Figure 5.
(a) Bouc–Wen bilinear conceptual model. (b) Hysteretic characteristic curve of the model, (c) linear elastic component of the model, (d) plastic component of the model.

Figure 6.
Design spectrum of NCh2745 for type soil III, seismic zone 3 and 5% critical damping. The response spectra of the original and scaled frequency domain recording are overlaid to fit the design spectrum.
Figure 6.
Design spectrum of NCh2745 for type soil III, seismic zone 3 and 5% critical damping. The response spectra of the original and scaled frequency domain recording are overlaid to fit the design spectrum.

Figure 7.
Llolleo seismic record of 3 March 1985, component N10E: (a) original record, (b) record scaled in frequency domain to fit with design spectrum of NCh2745.
Figure 7.
Llolleo seismic record of 3 March 1985, component N10E: (a) original record, (b) record scaled in frequency domain to fit with design spectrum of NCh2745.

Figure 8.
Maximum basal shear load in racks with base isolation with different load levels, friction coefficient (μ) and isolation period (). The black dotted line is the response for fixed base racks.
Figure 8.
Maximum basal shear load in racks with base isolation with different load levels, friction coefficient (μ) and isolation period (). The black dotted line is the response for fixed base racks.

Figure 9.
Maximum drift in racks with basal isolation with different load levels, friction coefficient (μ) and isolation period (). The black dotted line is the response for fixed base racks.
Figure 9.
Maximum drift in racks with basal isolation with different load levels, friction coefficient (μ) and isolation period (). The black dotted line is the response for fixed base racks.

Figure 10.
Maximum acceleration in racks with base isolation with different load levels, friction coefficient (μ) and isolation period (). The black dotted line is the response for fixed base racks.
Figure 10.
Maximum acceleration in racks with base isolation with different load levels, friction coefficient (μ) and isolation period (). The black dotted line is the response for fixed base racks.

Figure 11.
Explanatory illustration of the concept of critical absolute acceleration.

Figure 12.
Lateral displacement of the load levels of 8-level racks with fixed support at the base and with base isolation.
Figure 12.
Lateral displacement of the load levels of 8-level racks with fixed support at the base and with base isolation.

Figure 13.
Maximum displacement of the isolation level. (a) μ = 0.2, (b) μ = 0.4 y and (c) μ = 0.6.

Figure 14.
Equivalent damping ratio ( of the isolation system considering different friction coefficients on the insulator ball joint (μ) and maximum basal displacement ).
Figure 14.
Equivalent damping ratio ( of the isolation system considering different friction coefficients on the insulator ball joint (μ) and maximum basal displacement ).

Figure 15.
Hysteretic cycle of the isolation system of a rack with 6 levels and TI = 4 s.

Figure 16.
Ratio between the maximum axial load (traction > 0) or minimum axial load (compression < 0) on the isolator and the initial tension of the elastic element inside the insulator (T0). Orange segmented line (value 1) delimits the occurrence of the survey (points above said line). The seismic action is acting in cross the aisles direction of the rack.

Figure 17.
Ratio between the maximum axial load (traction > 0) or minimum axial load (compression < 0) on the isolator and the initial tension of the elastic element inside the insulator (T0). Orange segmented line refers to the value of 1. Input in the longitudinal direction of the rack.
Figure 17.
Ratio between the maximum axial load (traction > 0) or minimum axial load (compression < 0) on the isolator and the initial tension of the elastic element inside the insulator (T0). Orange segmented line refers to the value of 1. Input in the longitudinal direction of the rack.

Figure 18.
Scheme of tension/compression reactions on isolators due to seismic forces ().


Table 1.
Diameter of the balls in the isolator ball joint base support.
| Level | Total Height (m) | Weight (kN) | d (mm) | σo (MPa) |
|---|---|---|---|---|
| 2 | 3 | 41.1 | 50 | 7.85 |
| 4 | 6 | 82.9 | 70 | 8.07 |
| 6 | 9 | 124.6 | 85 | 8.24 |
| 8 | 12 | 166.4 | 100 | 7.95 |
Table 2.
Initial pressures inside the pneumatic piston (MPa) according to the rack levels and TI.
| Level | 2 | 4 | 6 | 8 | |
|---|---|---|---|---|---|
| TI | |||||
| 3.0 | 0.433 | 0.874 | 1.314 | 1.754 | |
| 3.5 | 0.318 | 0.642 | 0.965 | 1.289 | |
| 4.0 | 0.244 | 0.491 | 0.739 | 0.987 | |
| 4.5 | 0.193 | 0.388 | 0.584 | 0.780 | |
| 5.0 | 0.156 | 0.314 | 0.473 | 0.632 | |
Table 3.
Initial tension of the elastic element or cable that joins the isolator with the rack base, T0 (kN).
Table 3.
Initial tension of the elastic element or cable that joins the isolator with the rack base, T0 (kN).
| Level | 2 | 4 | 6 | 8 | |
|---|---|---|---|---|---|
| TI | |||||
| 3.0 | 2.76 | 5.56 | 8.36 | 11.16 | |
| 3.5 | 2.02 | 4.08 | 6.14 | 8.20 | |
| 4.0 | 1.55 | 3.13 | 4.70 | 6.28 | |
| 4.5 | 1.22 | 2.47 | 3.72 | 4.96 | |
| 5.0 | 0.99 | 2.00 | 3.01 | 4.02 | |
Table 4.
Natural periods of the fixed racks at their base analyzed, Tn (s).
| Mode (N°) | 2 Level | 4 Level | 6 Level | 8 Level |
|---|---|---|---|---|
| 1 | 0.329 | 0.640 | 0.956 | 1.276 |
| 2 | 0.137 | 0.304 | 0.562 | 0.858 |
| 3 | 0.097 | 0.199 | 0.305 | 0.413 |
Publisher’s Note: MDPI stays neutral with regard to jurisdictional claims in published maps and institutional affiliations. |
© 2021 by the authors. Licensee MDPI, Basel, Switzerland. This article is an open access article distributed under the terms and conditions of the Creative Commons Attribution (CC BY) license (http://creativecommons.org/licenses/by/4.0/).
Share and Cite
MDPI and ACS Style
Álvarez, O.; Maureira, N.; Nuñez, E.; Sanhueza, F.; Roco-Videla, Á. Numerical Study on Seismic Response of Steel Storage Racks with Roller Type Isolator. Metals 2021, 11, 158. https://doi.org/10.3390/met11010158
AMA Style
Álvarez O, Maureira N, Nuñez E, Sanhueza F, Roco-Videla Á. Numerical Study on Seismic Response of Steel Storage Racks with Roller Type Isolator. Metals. 2021; 11(1):158. https://doi.org/10.3390/met11010158
Chicago/Turabian StyleÁlvarez, Oscar, Nelson Maureira, Eduardo Nuñez, Frank Sanhueza, and Ángel Roco-Videla. 2021. "Numerical Study on Seismic Response of Steel Storage Racks with Roller Type Isolator" Metals 11, no. 1: 158. https://doi.org/10.3390/met11010158
Note that from the first issue of 2016, this journal uses article numbers instead of page numbers. See further details here.