Numerical Simulation of a Heavy Rainstorm in Northeast China Caused by the Residual Vortex of Typhoon 1909 (Lekima)

School of Atmospheric Sciences, Nanjing University, Nanjing 210023, China
*
Author to whom correspondence should be addressed.
Atmosphere 2021, 12(1), 120; https://doi.org/10.3390/atmos12010120
Submission received: 4 November 2020
/
Revised: 10 January 2021
/
Accepted: 12 January 2021
/
Published: 16 January 2021
(This article belongs to the Special Issue Thunderstorm Morphological Evolution and Forecasts of Thunderstorm System Rainfall)
Abstract
:From 14 to 17 August 2019, a heavy rainstorm occurred in Northeast China due to the combined influence of the residual vortex of typhoon 1909 (Lekima) and cold air intrusion. Based on the precipitation data of China Meteorological observation stations, surface and upper charts, HMW-8 satellite images, NCEP/NCAR 0.25° × 0.25° reanalysis data and WRF4.0 numerical prediction model are used to carry out numerical simulations. According to the weather situation and numerical simulation results, the cause of 1 h severe precipitation is thoroughly studied. Results show that: (1) According to the weather situation, the precipitation process can be divided into two stages. The first stage is from 1412 to 1612 August 2019, which is caused by the interaction between the residual vortex, the inverted trough of typhoon 1909 (Lekima) and the upper trough. The rain belt lies from northeast to southwest, and the rainfall center has typical meso-β-scale characteristics. At the second stage from 1612 to 1712 August 2019, the residual vortex of typhoon reaches Heilongjiang Province, at the same time, 500 hPa cold vortex falls to the south; (2) Based on the 1 h rainfall of automatic weather stations, it can be seen that there are three rainfall peaks from 00 UTC 14 to 12 UTC 17, which are 53.2 mm in the Middle East of Jilin Province, 38.2 mm in the south of 1610 Liaoning Province, and 21.3 mm in the east of 1707 Heilongjiang Province respectively. (3) Before the occurrence of 1 h heavy rainfall, the water vapor is concentrated in the middle and lower troposphere. The residual vortex trough of typhoon 1909 extends northward, converges with the southwest airflow at the edge of the subtropical high, and transports water vapor and energy to the northeast. The convective cloud clusters generated ahead of the trough move southeast, then merge into the mesoscale convective system in the inverted trough; (4) In the Bohai Bay and North Korea, there is a vortex-like zone composed of several convergence centers, and the convergence zone in typhoon-inverted trough meets with the trough in Central Jilin. There exist a rising area and a positive vorticity belt in the typhoon-inverted trough, and the center of heavy rain lies in front of the positive vorticity center. At the west of the inverted trough, there is a large center of positive vertical wind shear, and a small center in the east. The center of heavy rainfall is located on the line between the maximum and minimum centers, which is close to the right of the maximum center; (5) The high energy tongue is transported from the center of the typhoon to the northeast along the inverted trough of the typhoon, and the southwest airflow at the edge of the subtropical high. There is a zone titled downward from northwest to southeast that contains dry and cold air, where there is convective instability; (6) The strong precipitation area is located on the lee in the northwest of Changbai Mountain. There is a convergence area in the middle of the troposphere, and a strong divergence area in the upper troposphere, with remarkable topographic effect, and the west divergence column inclines on the east convergence column.
1. Introduction
Northeast China is located in the northernmost part of China. In summer, it is affected by the interaction of westerly zone weather systems, high latitude, subtropical and tropical weather systems, and affected by the influence of Northeast special terrain, which makes the summer rainstorm in Northeast China have the characteristics of suddenness, strong intensity, short duration and locality [1]. Since typhoons usually occur in tropical low latitude areas, few typhoons can directly affect Northeast China, so the previous case studies mainly focus on the places of middle and low latitudes. Typhoons and typhoon-inverted troughs are important weather systems causing rainstorms in Northeast China in the summer. Due to the limitation of observation data, numerical simulation is an important tool to study rainstorms in Northeast China. Many meteorologists have performed a lot of beneficial research on rainstorm related to typhoon and typhoon-inverted trough. Li et al. used the numerical study on impacts of the upper westerly trough on the extratropical transition process of typhoon Winnie (9714), they found that the extratropical transition process was sensitive to the intensity of the upper trough, which affected the process in terms of strong cold advection, positive vorticity advection and strong upper divergence ahead of the trough, which was conducive to the maintenance and development of tropical cyclones [2]. Shen et al. studied torrential rain caused by a residual vortex of typhoon Soudelor (1513), they found that the strong precipitation area mainly located on the left side of the shear vector between 200–850 hPa due to the interaction between landing typhoon and westerly belt system in middle and high latitudes [3]. By studying this case, Ye et al. found that the main mechanism of mesoscale convective activity is the combination of the convergence of low-level airflow strengthened by the uplift of terrain, and the middle-level divergent flow. The uplift of terrain strengthens the convergence of low-level airflow [4]. By the numerical simulation of torrential rain in the northeast of Huaihe basin, Wang et al. found that the persistent vertical wind shear provides kinetic energy for the development of the MCSs (mesoscale convective system), hence promoting the baroclinic development of convective systems, and the concentration of heavy rain at the specific location [5]. At the east side of the deep convective system, there was a downshear circulation, which accelerated the upper-level westerly and the low-level easterly, thus intensified the vertical wind shear of the upper and lower layers, the low-level convergence and upper-level divergence were intensified too, so the pumping effect from the upper levels to the lower levels was intensified correspondently [6]. Sun et al. found that two mesoscale convective cloud clusters developed in the typhoon-inverted trough were related directly to the severe heavy rainfall in Hebei province. The moisture transportation of southerly low-level jet (LLJ) was very important to the development of convection [7]. When analyzing the effects of vertical wind shear and storm motion on the asymmetric structure of precipitation, Chen et al. found that when the vertical wind shear (200–850 hPa) was greater than 7.5 m/s, it played a decisive role in the asymmetric distribution of precipitation on the left side of the downshear in the Northern Hemisphere [8]. From a numerical study of the severe heavy rainfall associated with typhoon 0505(Haitang), Yu et al. found that the topography of southern Zhejiang and northern Fujian enhanced the landing typhoon rainstorm and led to the uneven distribution of precipitation [9]. Wu and Lin thought that the terrain effect has a very important influence on the precipitation of tropical cyclones [10,11]. From the numerical simulation of rainfall and precipitation mechanism associated with typhoon Sinlaku(0216), Niu et al. found that the rainfall on the upwind slopes of the mountains increased and decreased on the downwind slopes due to the topographic effect [12].
In this paper, a heavy rainstorm that occurred in Northeast China between 14 and 17 August 2019 is studied, and during this period, the place experienced the joint influence of typhoon 1909’s residual vortex and cold air intrusion. The synoptic situation of this rainstorm is studied by using the surface and upper weather charts. The distribution characteristics of the rainstorm are analyzed by using the total rainfall, 1 h precipitation intensive observation data and satellite images, then the NCEP reanalysis data and WRF version 4.0 model are used for numerical simulation. Using the results, the dynamic conditions, water vapor conditions, vertical shear and other physical parameters were diagnosed and analyzed, and the influence of topography on the rainstorm was analyzed too.
2. Data and Numerical Simulation Description
2.1. Observational DataSets
Upper and surface weather charts, 1-h encrypted precipitation data of automatic meteorological stations in August 2019 were obtained from China Meteorological Data Network.
2.2. Satellite Cloud Image
1-h infrared HMW-8 satellite images were downloaded from the University of Kochi, Japan, the scope is: 20° S–70° N, 70–160° E, 0.05° × 0.05° horizontal resolution.
2.3. NCEP 0.25° × 0.25° Reanalysis Data
These NCEP FNL (Final) operational global analysis and forecast data are on 0.25-degree by 0.25-degree grids prepared operationally every 6 h. This product is from the Global Data Assimilation System (GDAS), which continuously collects observational data from the Global Telecommunications System (GTS), and other sources, for many analyses. The FNLs are made with the same model which NCEP uses in the Global Forecast System (GFS), but the FNLs are prepared about an hour or so after the GFS is initialized. The FNLs are delayed so that more observational data can be used. The GFS is run earlier in support of time-critical forecast needs, and uses the FNL from the previous 6 h cycle as part of its initialization. The analyses are available on the surface, at 26 mandatory (and other pressure) levels from 1000 millibars to 10 millibars, in the surface boundary layer and at some sigma layers, the tropopause and a few others. Parameters include surface pressure, sea level pressure, geopotential height, temperature, sea surface temperature, soil values, ice cover, relative humidity, u- and v- winds, vertical motion, vorticity and ozone.
2.4. WRF Simulations
The Advanced Research WRF (ARW) modeling system has been in development for the past eighteen years. The current release is Version 4.0, available since June 2018. The ARW is designed to be a flexible, state-of-the-art atmospheric simulation system that is portable and efficient on available parallel computing platforms. The ARW is suitable for use in a broad range of applications across scales ranging from meters to thousands of kilometers. Used in this study is performed by NCAR, which is publicly available at 0.25° × 0.25° reanalysis data. One-way nested-grids are employed (Figure 1). The centers of Domain1, Domain2 are at (45.0° N, 130.0° E), with their grid spacings of 9 and 3 km respectively. The grid sizes are 480 × 480 and 721 × 661 correspondingly. There are 33 layers in the vertical direction. The simple ice phase scheme and Kain–Fritsch cumulus parameterization scheme are used [13]. The integrations are performed for 84 h from 0000 UTC 14 to 1200 UTC 17 August 2019.
3. Results
3.1. Typhoon Track and Surface Precipitation
According to the typhoon information provided by the tropical cyclone data center of the China Meteorological Administration (http://www.typhoon.org.cn), and based on the moving path of typhoon 1909 (Lekima) (Figure 2a), which occurred in the Pacific Ocean east of the Philippines on 4 August 2019, at 1745 UTC 9, it landed on Wenling City, Zhejiang Province, and moved northward gradually, then passing through Zhejiang and Jiangsu Provinces. At about 0400 UTC 11, “Lekima” set sail from Lianyungang City, Jiangsu Province. At about 1250 UTC 11, it landed in Qingdao City, Shandong Province, and at that time, the maximum wind force near the center of the typhoon 1909 was 23 m/s. It moved into the Bohai Sea at 2100 UTC 11, and weakened to the tropical depression at 0000 UTC 13, then stopped numbering at 0600 UTC that day.
From 14 to 17 August 2019, affected by the northward movement of the residual circulation of typhoon 1909 (Lekima) and the cold air intrusion, a large range of rainstorms was suffered in Northeast China.
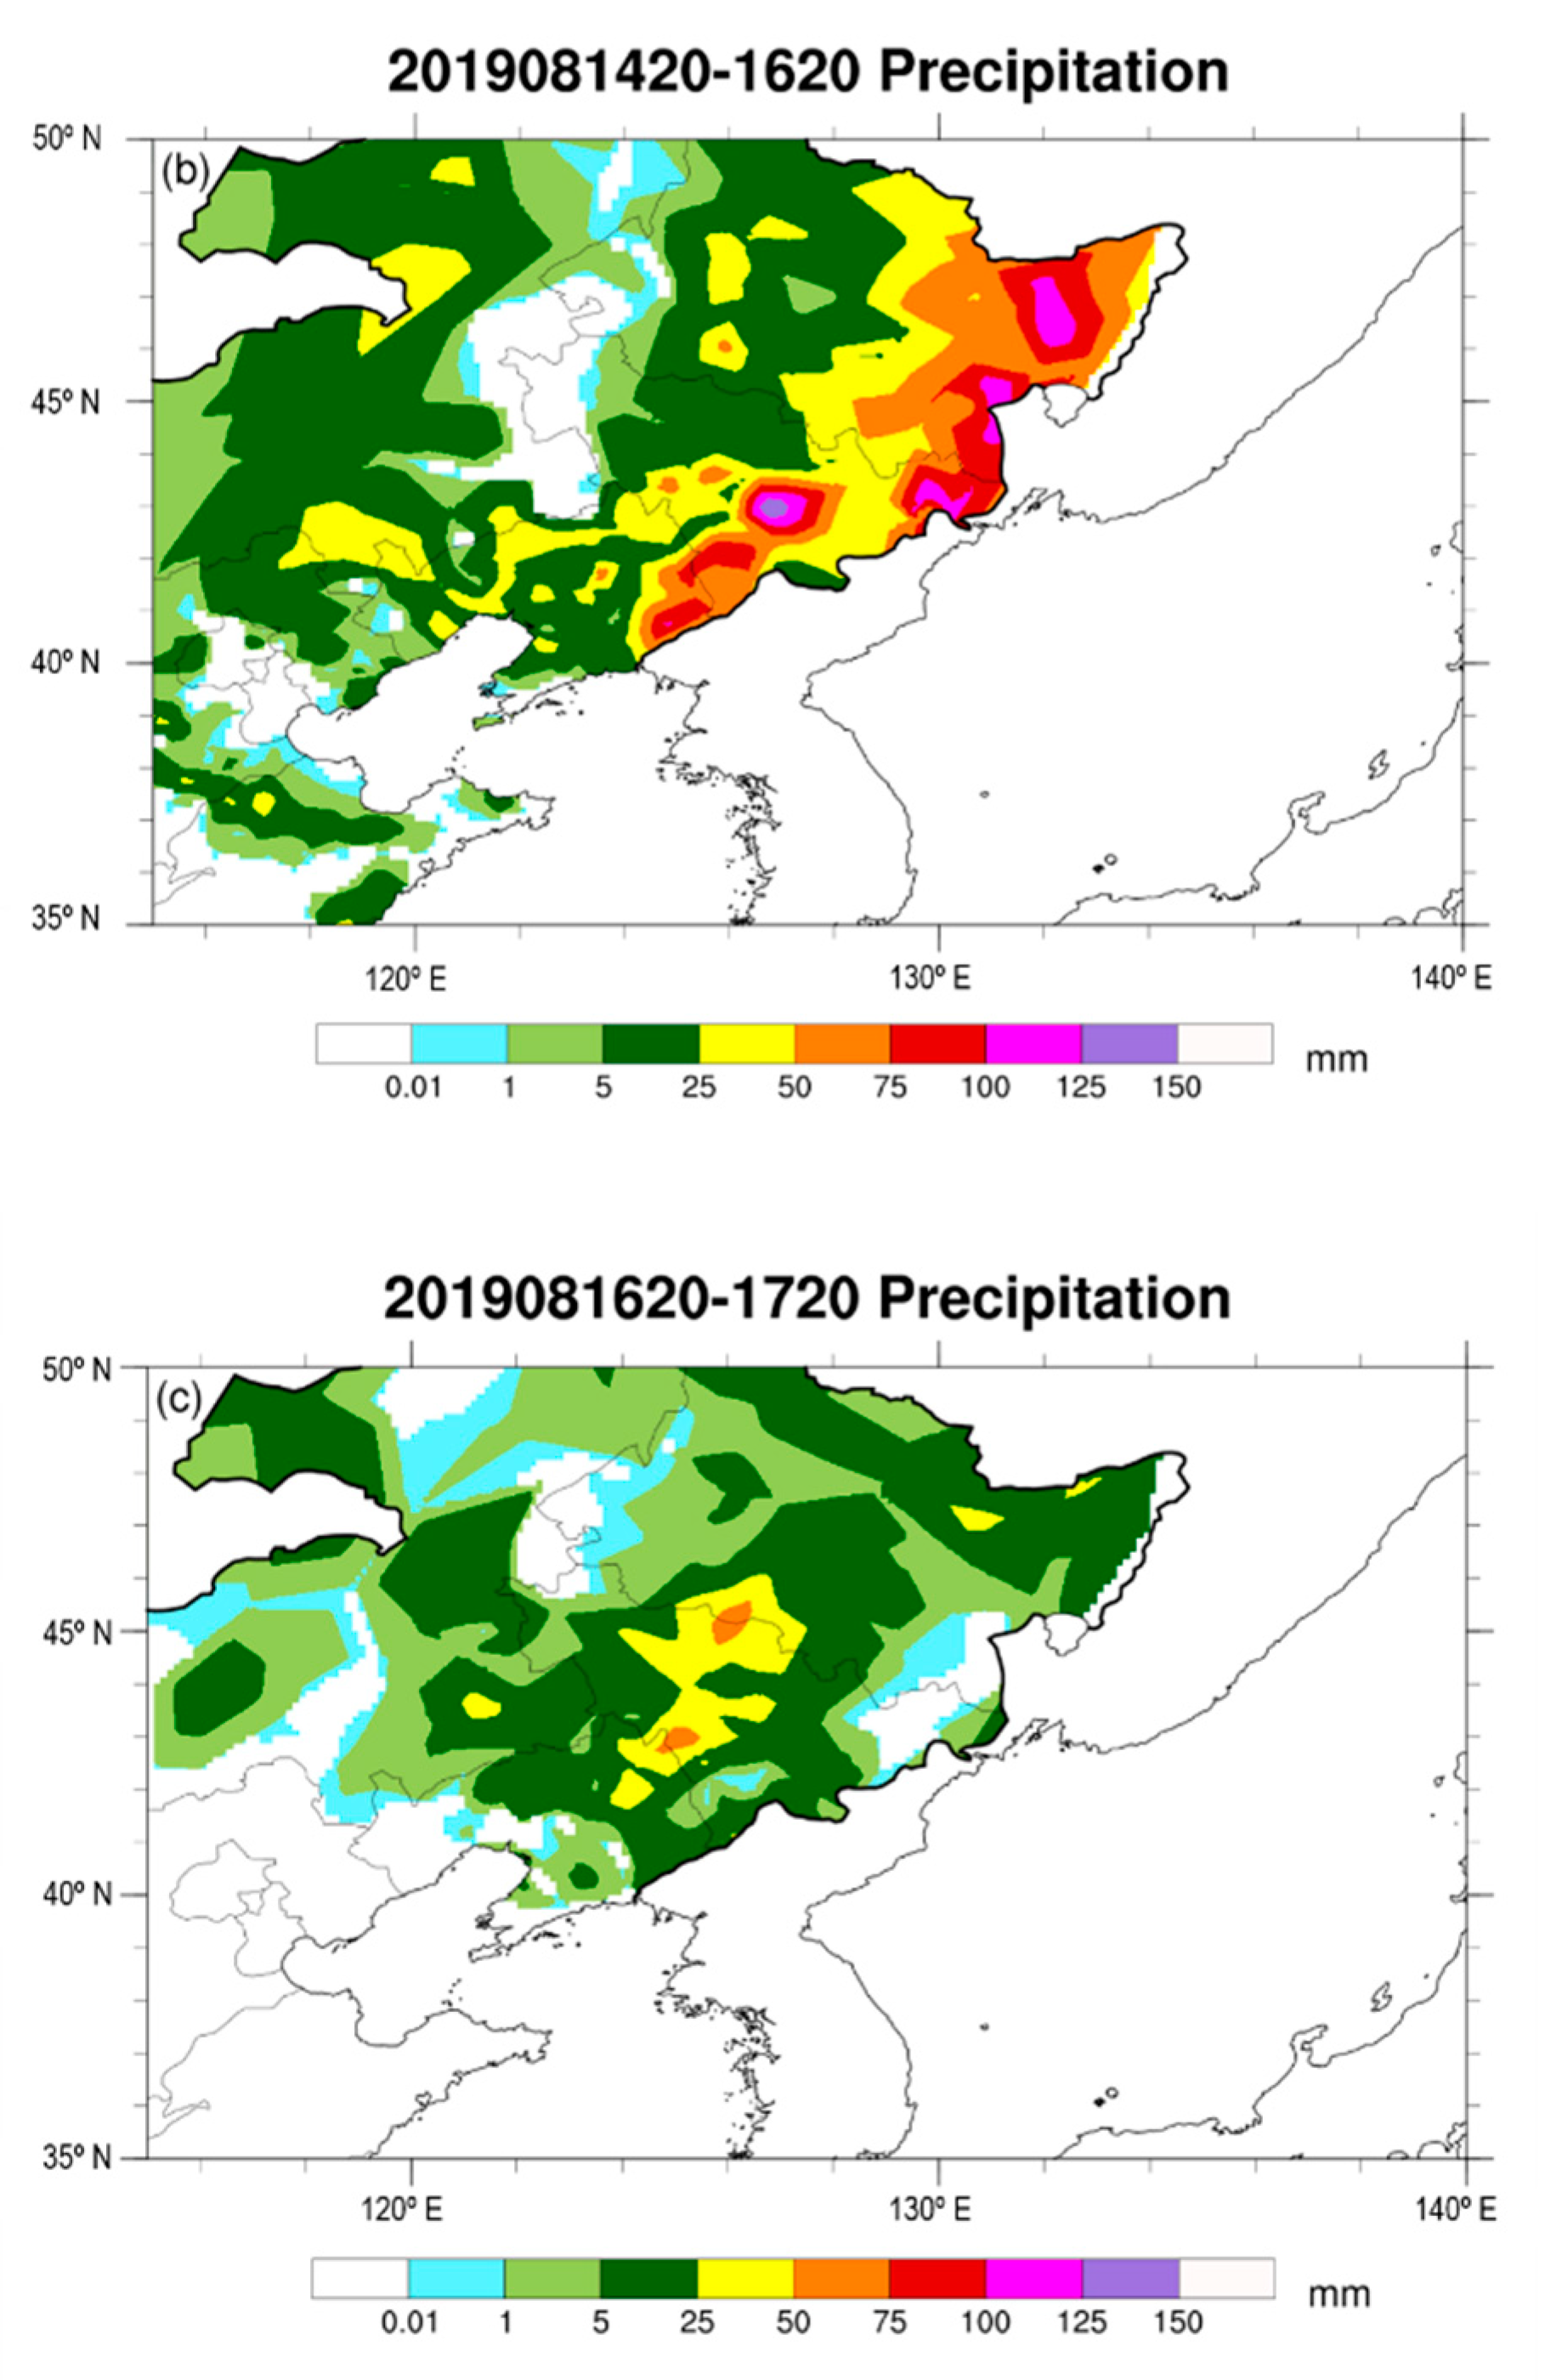
According to the synoptic situation, the precipitation process can be divided into two stages. The first stage is from 12 UTC 14 to 12 UTC 16, which is caused by the interaction between the residual vortex and the inverted trough of typhoon 1909, together with the cold air intrusion, and the rain belt extends from southwest to northeast (Figure 2b). The horizontal width of the rainband composed by the rainfall larger than 50 mm is about 100 km, and the length is about 600 km. The rainfall centers are embedded in many blocks, which are typical meso-β-scale characteristics. There are eleven stations whose rainfalls are greater than 100 mm, six stations in Heilongjiang Province, four stations in Jilin Province and one station in Liaoning Province separately. The rainstorm center 154.4 mm is located in Huadian, Jilin Province. The maximum 1 h rainfall is 53.2 mm, which occurs at the period of 19–20 UTC on 14 August. At the second stage, from 12 UTC 16 to 12 UTC 17, the residual vortex center of typhoon 1909 entered Heilongjiang Province. The precipitation was caused by the addition of residual circulation of typhoon 1910(Krosa) and the southeast movement of the upper cold vortex into Liaoning Province (Figure 2c). There are two rainfall centers, one located at the central junction of Liaoning and Jilin Provinces, and the other at the central junction of Jilin and Heilongjiang Provinces, distributed in blocks. The rainstorm center 71.0 mm is located at Liaoyuan, Jilin Province.
From the 1 h intensive precipitation of the automatic weather stations, it can be seen that there are three rainfall peaks during the period from 00 UTC 14 to 12 UTC 17, the first time is at 20 UTC 14, the precipitation is 53.2 mm, at the place of central and eastern Jilin Province (42.6° N, 126.5° E); the second time is at 10 UTC 16 the precipitation is 38.2 mm, at the place of southern Liaoning Province (40.3° N, 122.2° E); the third time is at 07 UTC 17, the precipitation is 21.3 mm, at the place of eastern Heilongjiang Province (47.00° N, 130.72° E).
3.2. Synoptic Situation Analysis
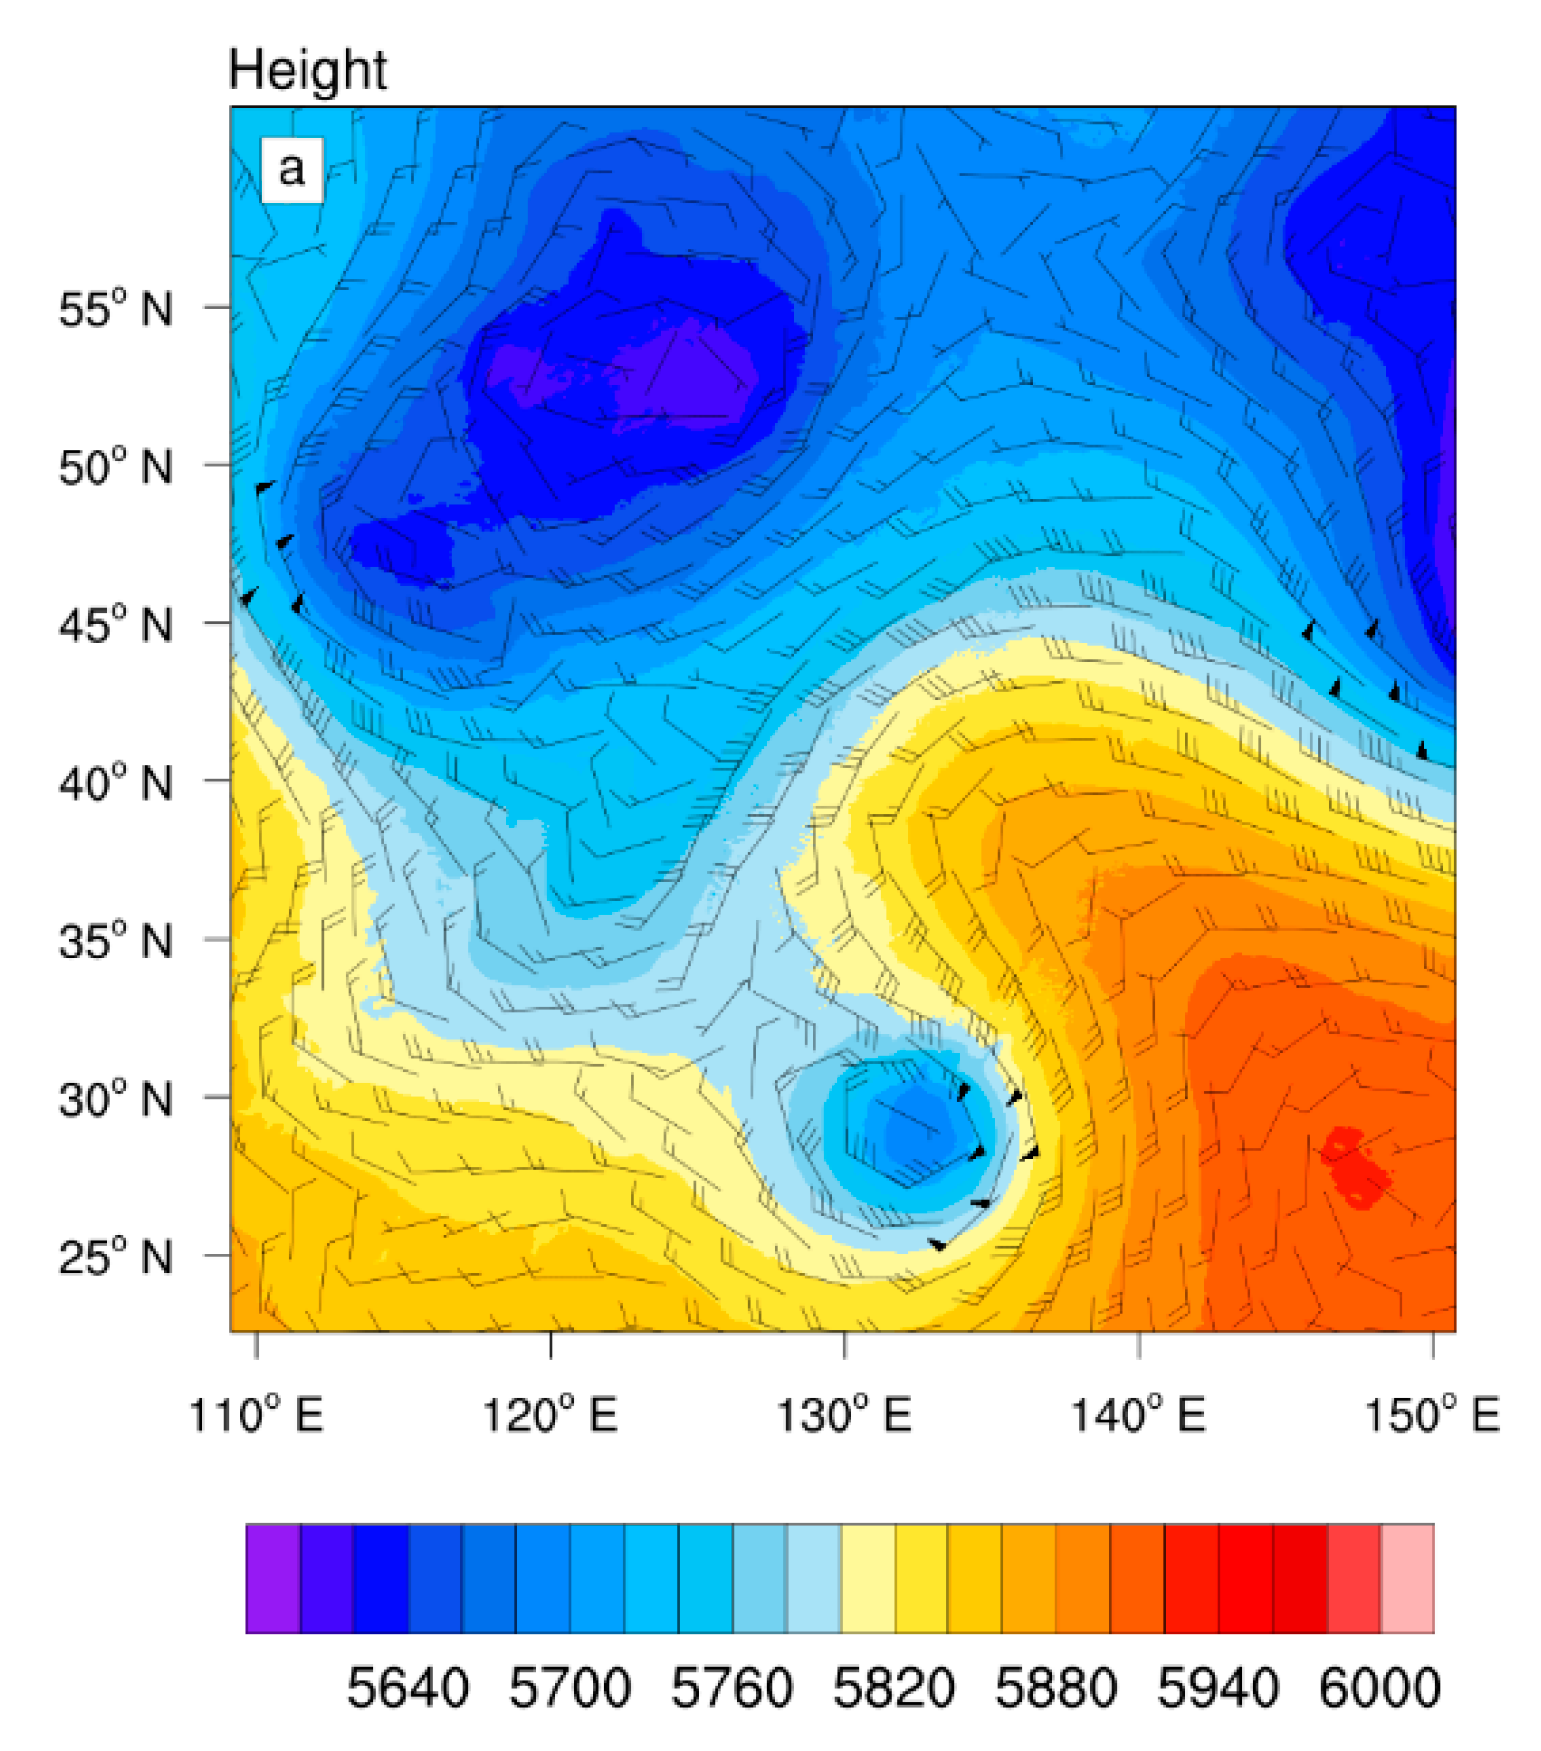
Figure 3a,b show the synoptic situation at 500 hPa at 1900 UTC on 14 August 2019, there are two cold vortices and one warm ridge locate in the middle and high latitudes of 110–150° E, the east (west) cold vortex is 5640 gpm, −18 °C (5600 gpm, −20 °C), which is in the Bering Sea (the Lake Baikal). The west cold vortex was split into two 5640 gpm centers, another small 5640 gpm center is separated to the southwest. As the transverse trough moves to the south and merges into the North China trough, the cold air behind the shallow trough continuously diffuses and moves toward the southeast. For the strong subtropical high, its 5880 gpm isoline reaches the sea of Japan and Sakhalin, which is a huge warm zone. Figure 3c shows, at 850 hPa, the position where the small trough in Heilongjiang and Jilin Provinces, intersect with the inverted trough of typhoon 1909 residual vortex is at the eastern junction of Liaoning and Jilin Provinces, where, at the sea level pressure field (Figure 3d), the residual vortex of typhoon 1909 (Lekima) is located, since the intrusion of cold air exists with the conflict of cold and warm air, so it is easy to trigger strong convective systems there. There are three times 20, 21 and 22 UTC 14 successively 1 h rainfall centers appeared at Huadian (42.59° N, 126.45° E), Jilin Province, they were 53.2 mm, 40.7 mm and 24.2 mm respectively, this indicated that the residual vortex of typhoon 1909 played a role in organizing and strengthening convective systems.
From Figure 4, the HMW-8 satellite image at 2000 UTC on 14 August 2019 shows that double arc-shaped rain belts appeared in Northeast China, and the south branch was over Changbai mountain, and the north one was between Wanda mountain and Sanjiang plain, separately. From the location of the weather systems, the south one is related to the residual vortex of typhoon 1909, and the north one is related to the airflow at the edge of the subtropical high.
From 1512 on, at 500 hPa, the cold vortex in Lake Baikal continues to descend southward and the transverse trough turns vertical. The 5640 gpm cold vortex was split into two parts and moved southward. The south one fell to the place of Hebei Province and the west part of Liaoning Province, meanwhile, the north one reached the junction of Mongolia and Inner Mongolia, and the cold vortex in the Bering Sea was stable, while the subtropical high weakened and retreated eastward, with a body decrease. Meanwhile, the contour line of 5800 gpm shrinks to the island of Japan, the northeast of China and the sea of Japan is a huge warm ridge. At 850 hPa, typhoon 1910 moved northward and entered the sea of Japan, guided by the residual vortex of typhoon 1909, its inverted trough moving through the border of Liaoning and Jilin Provinces, and entering into the central part of Heilongjiang and Jilin Provinces. At 1600, at 850 hPa, the residual vortex typhoon 1909 was located in Jilin Province, and due to the incorporation of typhoon 1910 circulation, the wind speed on both sides of the inverted trough of the residual vortex is strengthened, Nenjiang, Qiqihar, Harbin, and Changchun are at the west of the inverted trough, while Yanji, Yichun, and Linjiang are at the East. The precipitation centers of 6 h appear in Suifenhe River (44.2° N, 131.1° E, Heilongjiang Province), 41 mm, Jixi (45.2° N, 130.6° E, Heilongjiang Province), 41 mm. They all appear at the west of the surface inverted trough. At 1610, the second rainfall peak 38.2 mm occurred in Gaizhou (40.3° N, 122.2° E), at the south of Liaoning Province, near the Bohai Sea. Because the residual vortex of typhoon 1909 reaches Liaoning Province, as does the 5640 gpm cold vortex, they can interact with each other so as to trigger strong convective systems. At 850 hPa, the inverted trough of typhoon 1910 residual vortex is located in the eastern part of Heilongjiang Province. At 1700, at 500 hPa the 5640 gpm cold vortex merged with the residual vortex of typhoon 1910, at the junction of Heilongjiang and Jilin Provinces. At 850 hPa, the typhoon 1910 residual vortex reaches the east of the sea of Japan, where it merges with the denatured cold vortex and typhoon 1909 residual vortex to form into a vortex of 1320 gpm. The cold air enters in Heilongjiang and Jilin Provinces from the west, and the third 1 h rain peak appears in 1707, which is 21.3 mm in Huachuan(47.00° N, 130.43° E), Heilongjiang Province. At 1712, the upper trough at 500 hPa moved southeast, and then the residual vortex weakened and disappeared.
3.3. Analysis of Water Vapor Condition
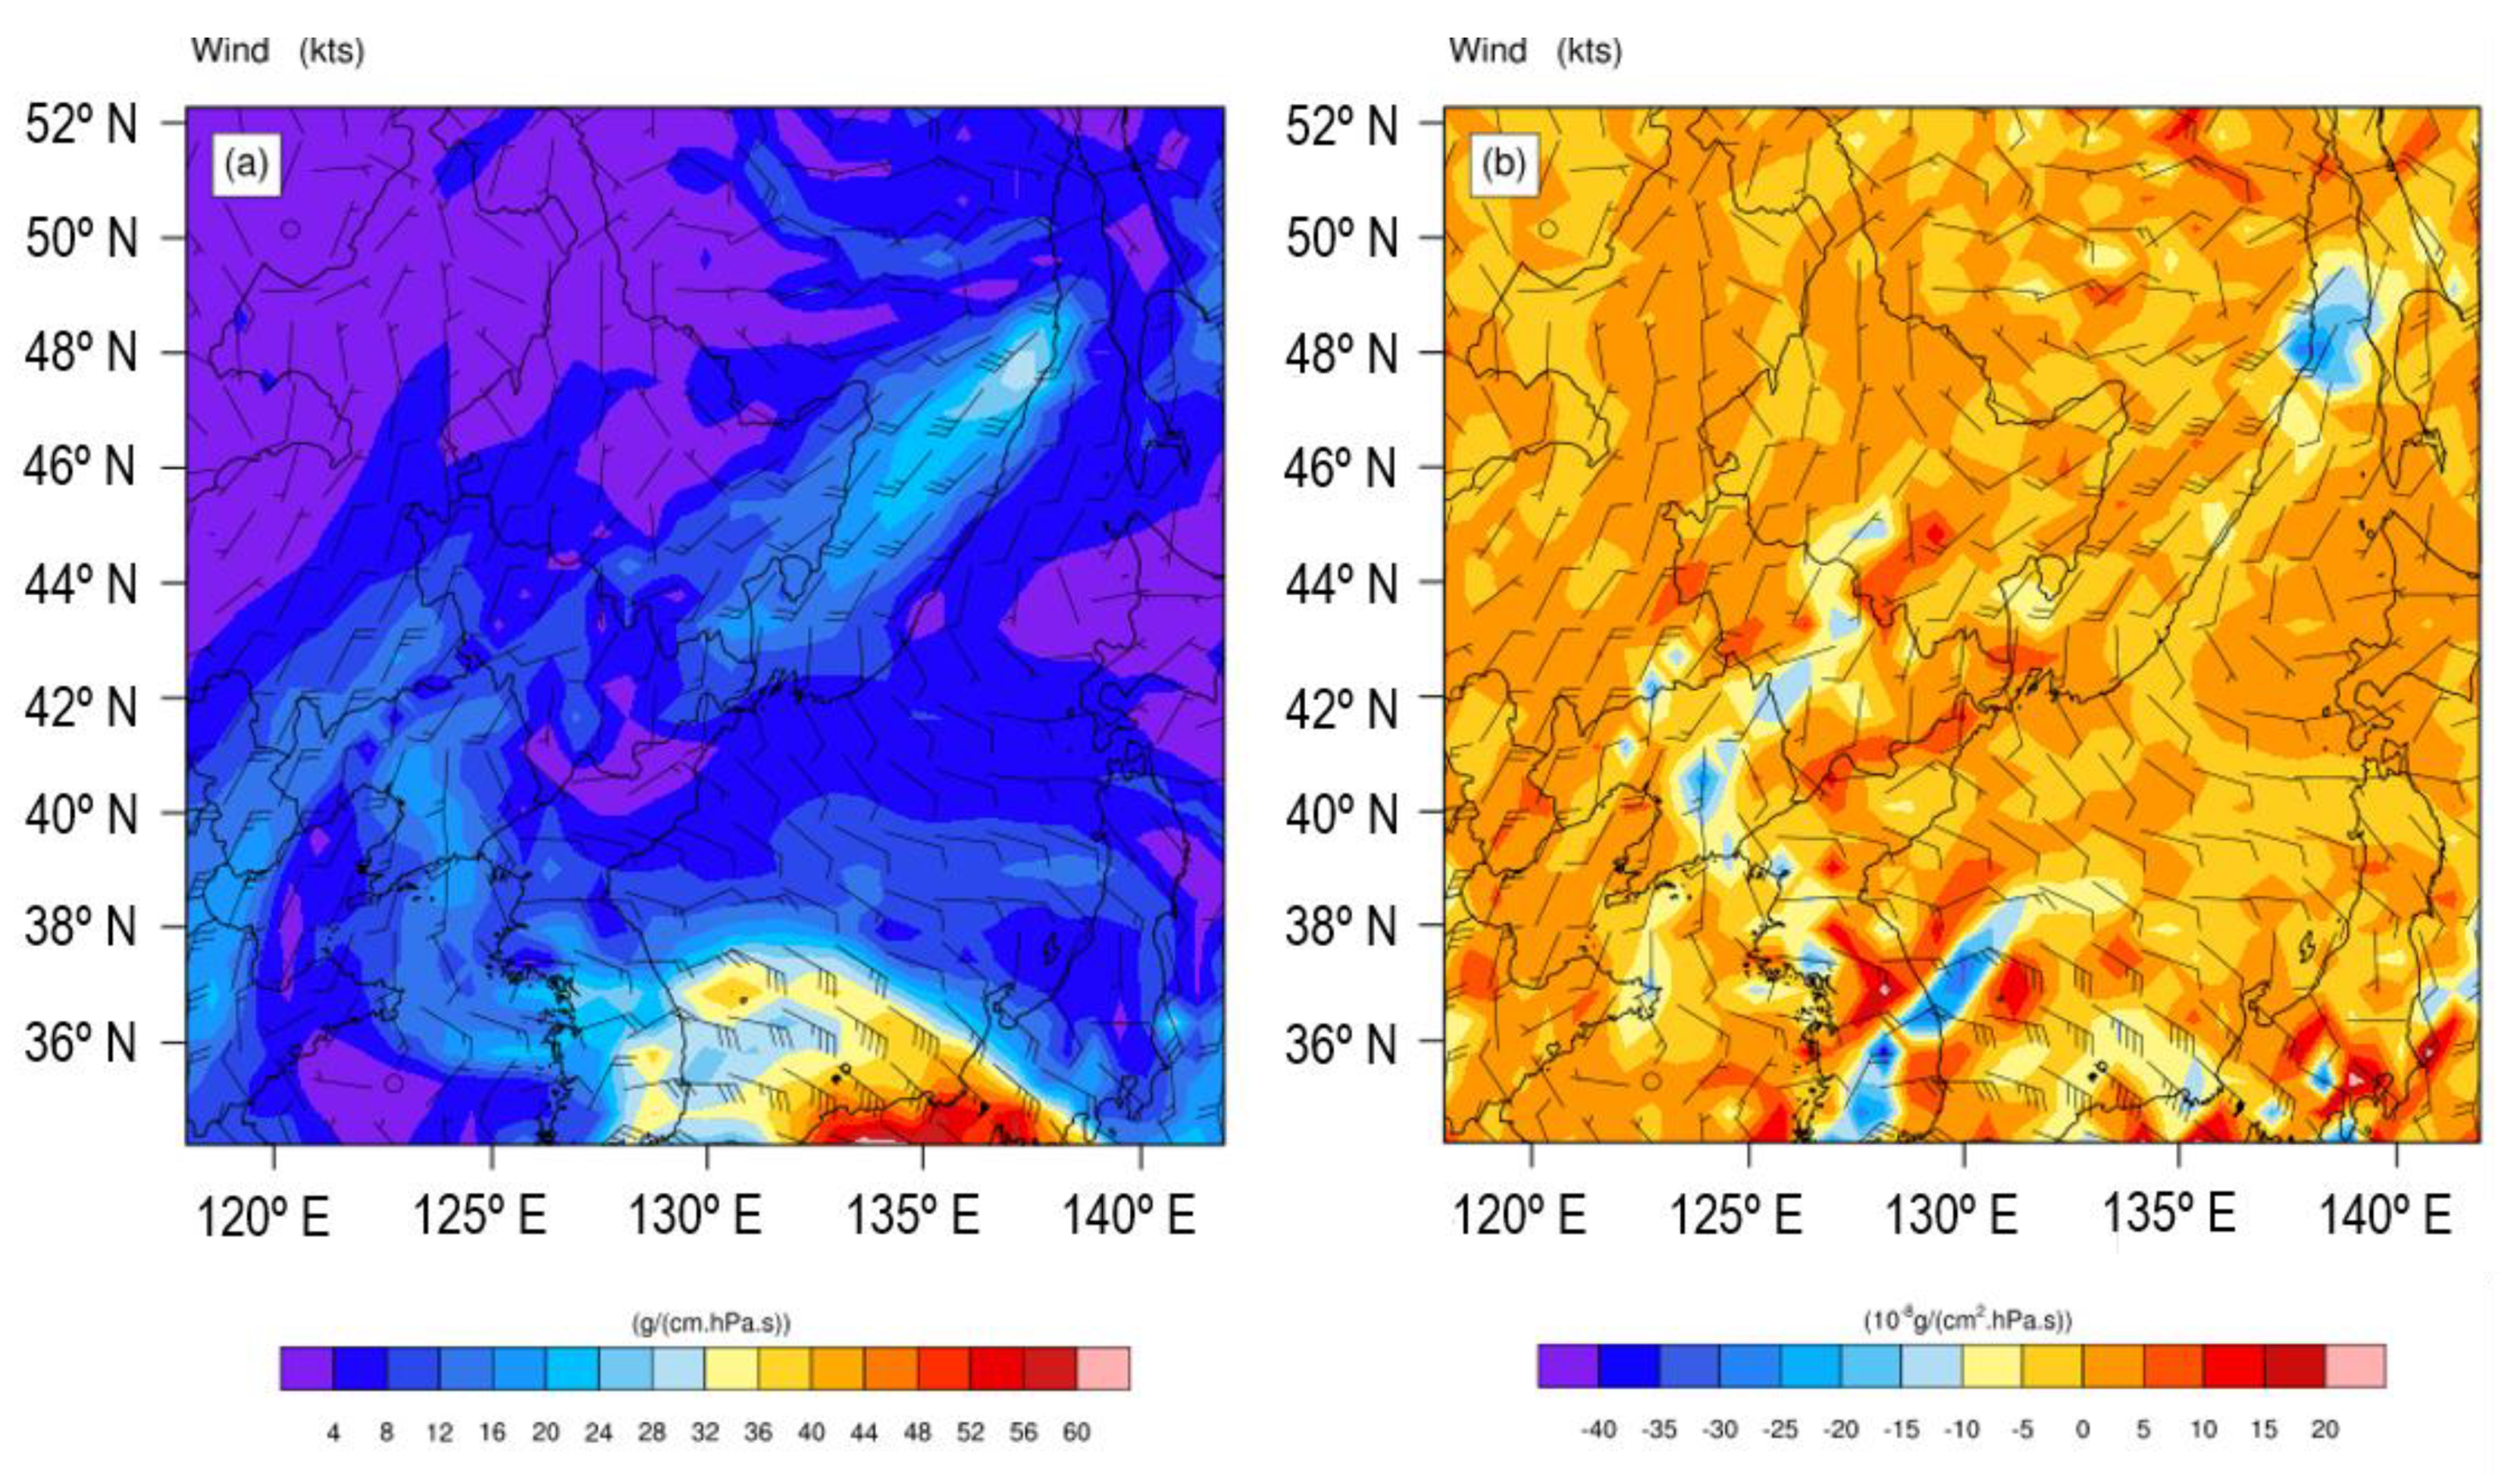
At 1412, the residual vortex of typhoon 1909 reaches the Yellow Sea about 150 km southeast of Liaodong Peninsula, and its inverted trough extends northward, and converges with the southwest airflow at the edge of the subtropical high, which transports water vapor and energy to the northeast, and the center of the severe tropical storm 1910 (Krosa) is close to the Kyushu Island of Japan, its outer cloud system is transported from Kyushu, South Korea and the North Yellow Sea to the southeast of Liaoning Province (where the residual vortex located), and water vapor is conveyed to the northeast. After 1412, there are many convergence centers along the inverted trough, and it is located in central Liaoning, Jilin and Heilongjiang Provinces. At 1419, at 850 hPa, Figure 5a shows that the water vapor starts from the center of typhoon 1910, and transports northward along the southerly airflow on the east side of the inverted trough, as does the convergence center of water vapor (Figure 5b). At 1419, the center was –21 × 10−8 g∙hPa−1∙cm−2∙s−1, at the junction of Liaoning and Jilin Provinces, at 1420, the central part −18 × 10−8 g∙hPa−1∙cm−2∙s−1 changed from massive to banded. At 1421, the −19 × 10−8 g∙hPa−1∙cm−2∙s−1, which is at the center of Jilin Province, is located at the center of the rainstorm. Therefore, the center of typhoon 1910 transports water vapor to the northwest along the inverted trough, and under the organization of the residual vortex of typhoon 1909, it provides abundant water vapor conditions for the generation of heavy rainfall. Consequently, the first time 1 h intensive precipitation peak of 53.2 mm occurred in Huachuan, central and Eastern Jilin Province.
At 1600, at 500 hPa, the split cold vortex (5640 gpm) reaches upper Hebei and Liaoning Provinces. At 1610, at 850 hPa, the residual vortex of typhoon 1909 arrives at the Middle East of Jilin Province, the 500 hPa cold vortex(5640 gpm) moves toward southeast, convective systems transport to the east of Liaoning Province, the transportation of water vapor is not sufficient, the west dry air intrudes to eastward, and converges with the wet air delivered from the east.
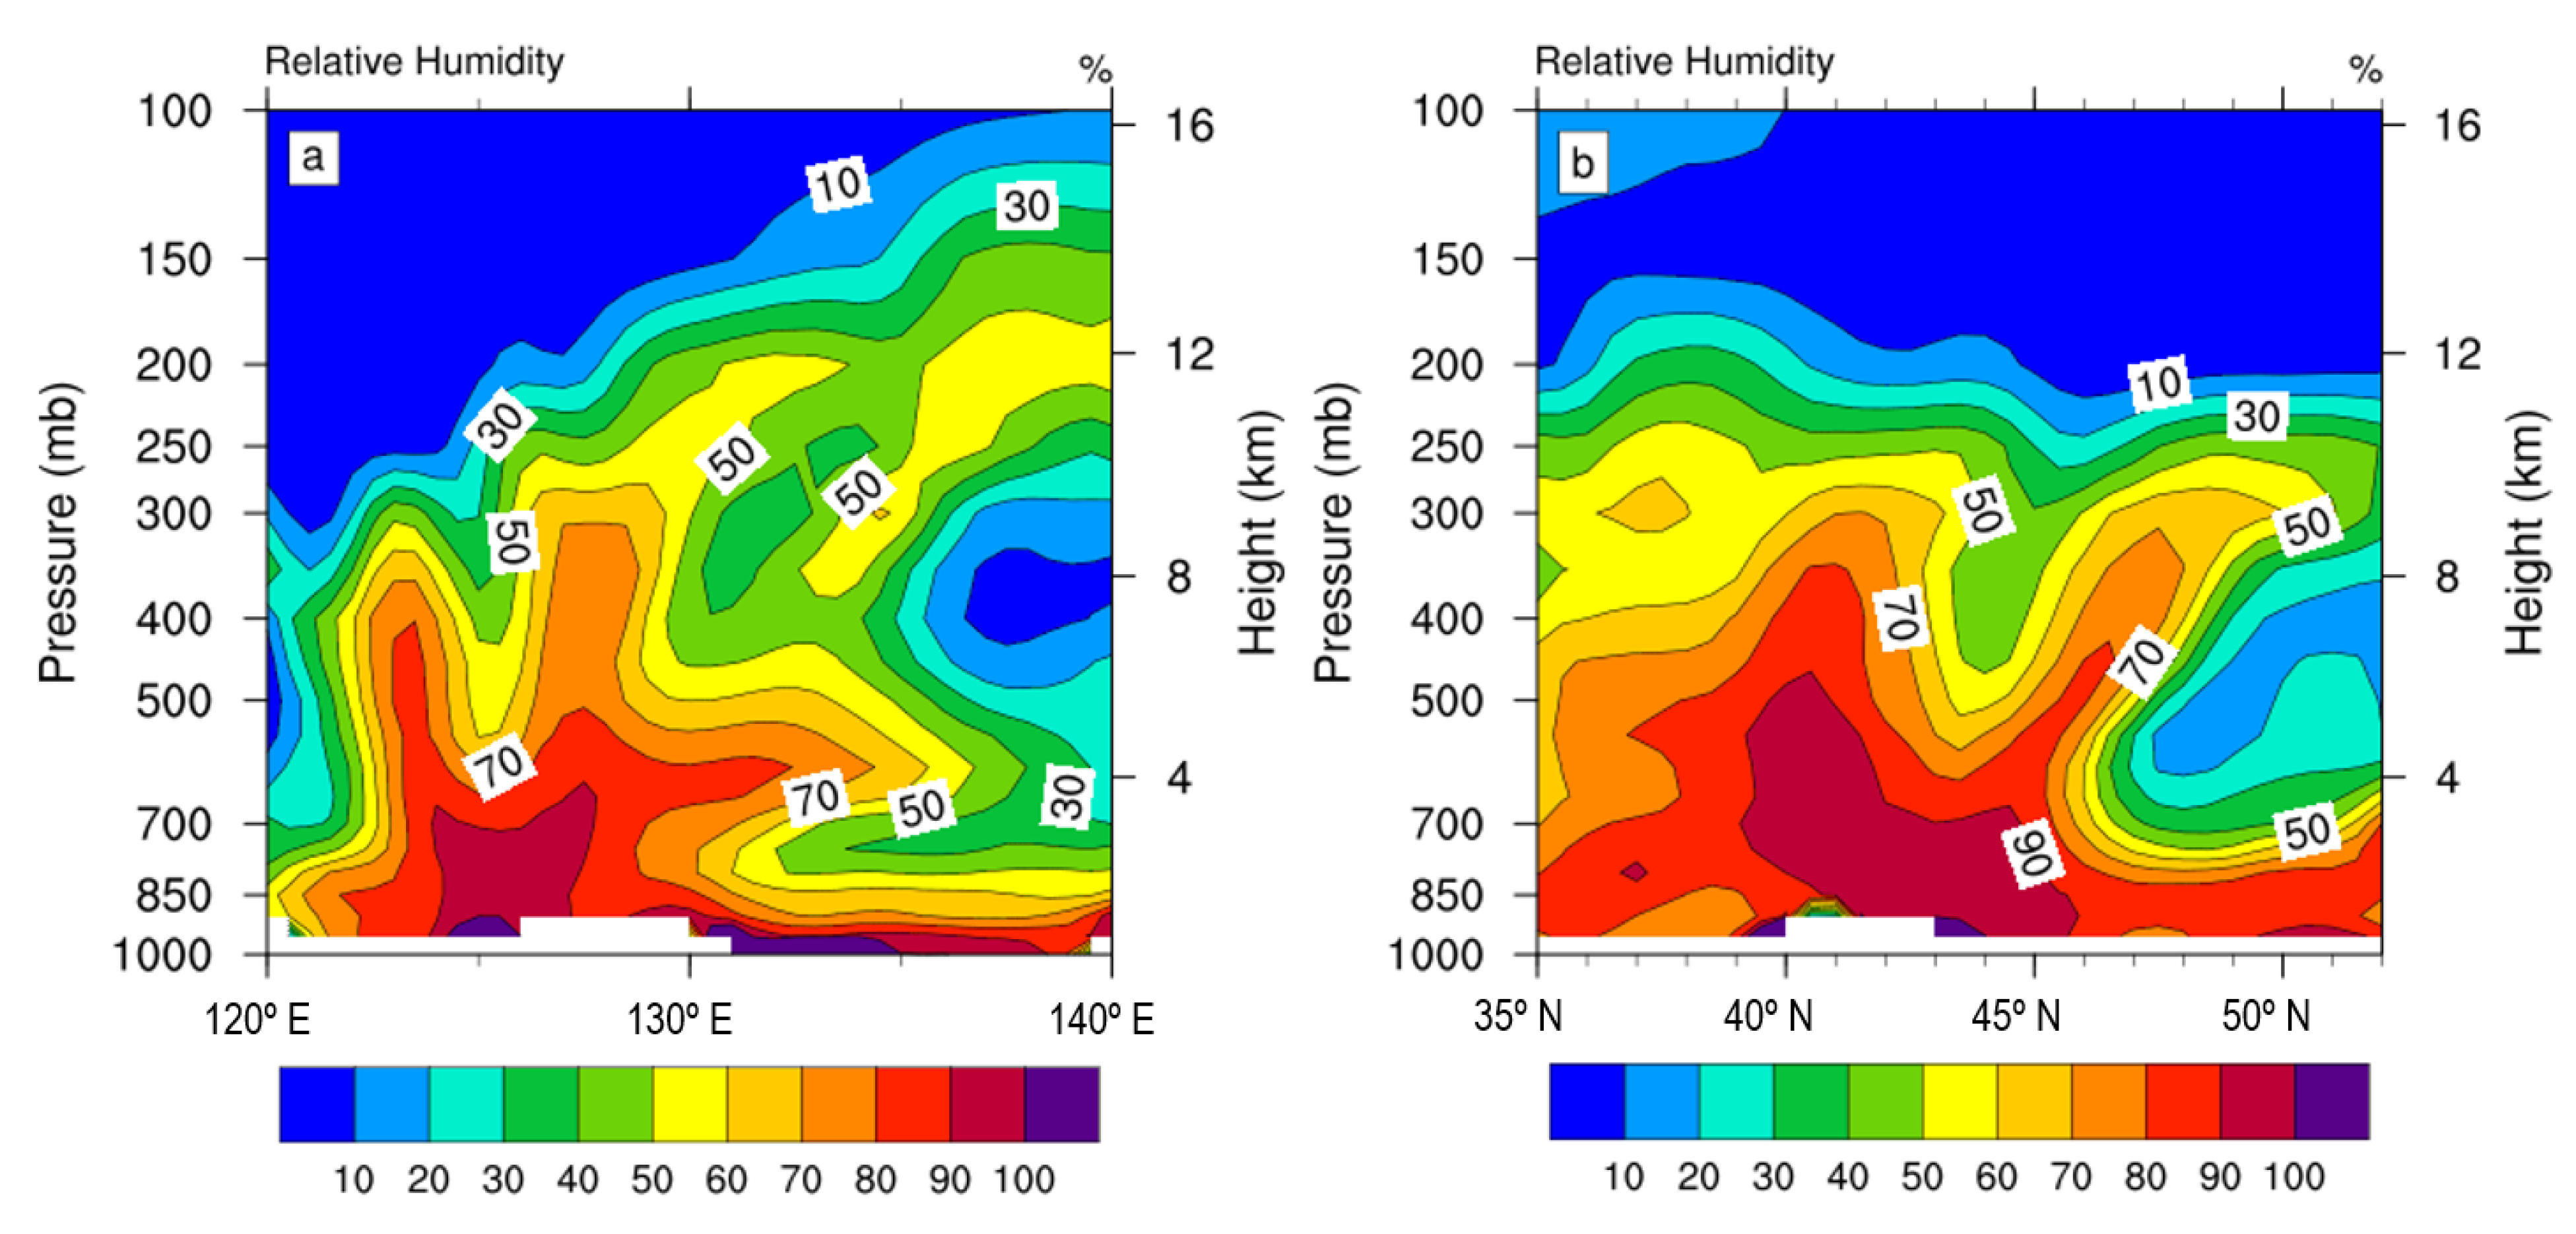
Figure 6a shows that on the vertical section of 42.5° N latitudinal relative humidity, there is an 80% vertical quasi-saturated water vapor column around 124° E that reaches 400 hPa. Meanwhile, because there is a dry area above 700 hPa to the west of 121° E, and a long and narrow relative dry column around 125° E is above 500 hPa, the humidity gradient on both sides of the vertical saturated water column is very large. As the relative dry column is placed on the lower saturated water vapor block around 125° E, it is favorable for the formation of convective instability. The 70% water vapor column between 126–129° E reaches 300 hPa. Additionally, there is a long and narrow east-west dry zone between 700–850 hPa to the east of 130° E. Therefore, the convection on the west side of the typhoon-inverted trough is more vigorous than that on the east side (i.e., near the west edge of the subtropical high). As a result, the precipitation on the west side of the typhoon-inverted trough is larger than that on the east side.
Figure 6b shows that, on the vertical profile of the meridional relative humidity along 126.5° E, the 70% water vapor columns near 39–42° N and 46–47° N both reach 300 hPa, the dry region of 300–850 hPa to the north around 46° N aloft tilted from north to south. The 90% saturated water vapor column between 39° N and 42° N reaches 520 hPa, the wet center relative between 42° N and 45° N with its humidity more than 90% is below 700 hPa, and there is a dry column less than 50% that reaches 500 hPa. Therefore, the upper layer is dry and the lower layer is wet, which is conducive to the formation of convective instability in the lower layer there. As a result, it is beneficial to increase precipitation in this area.
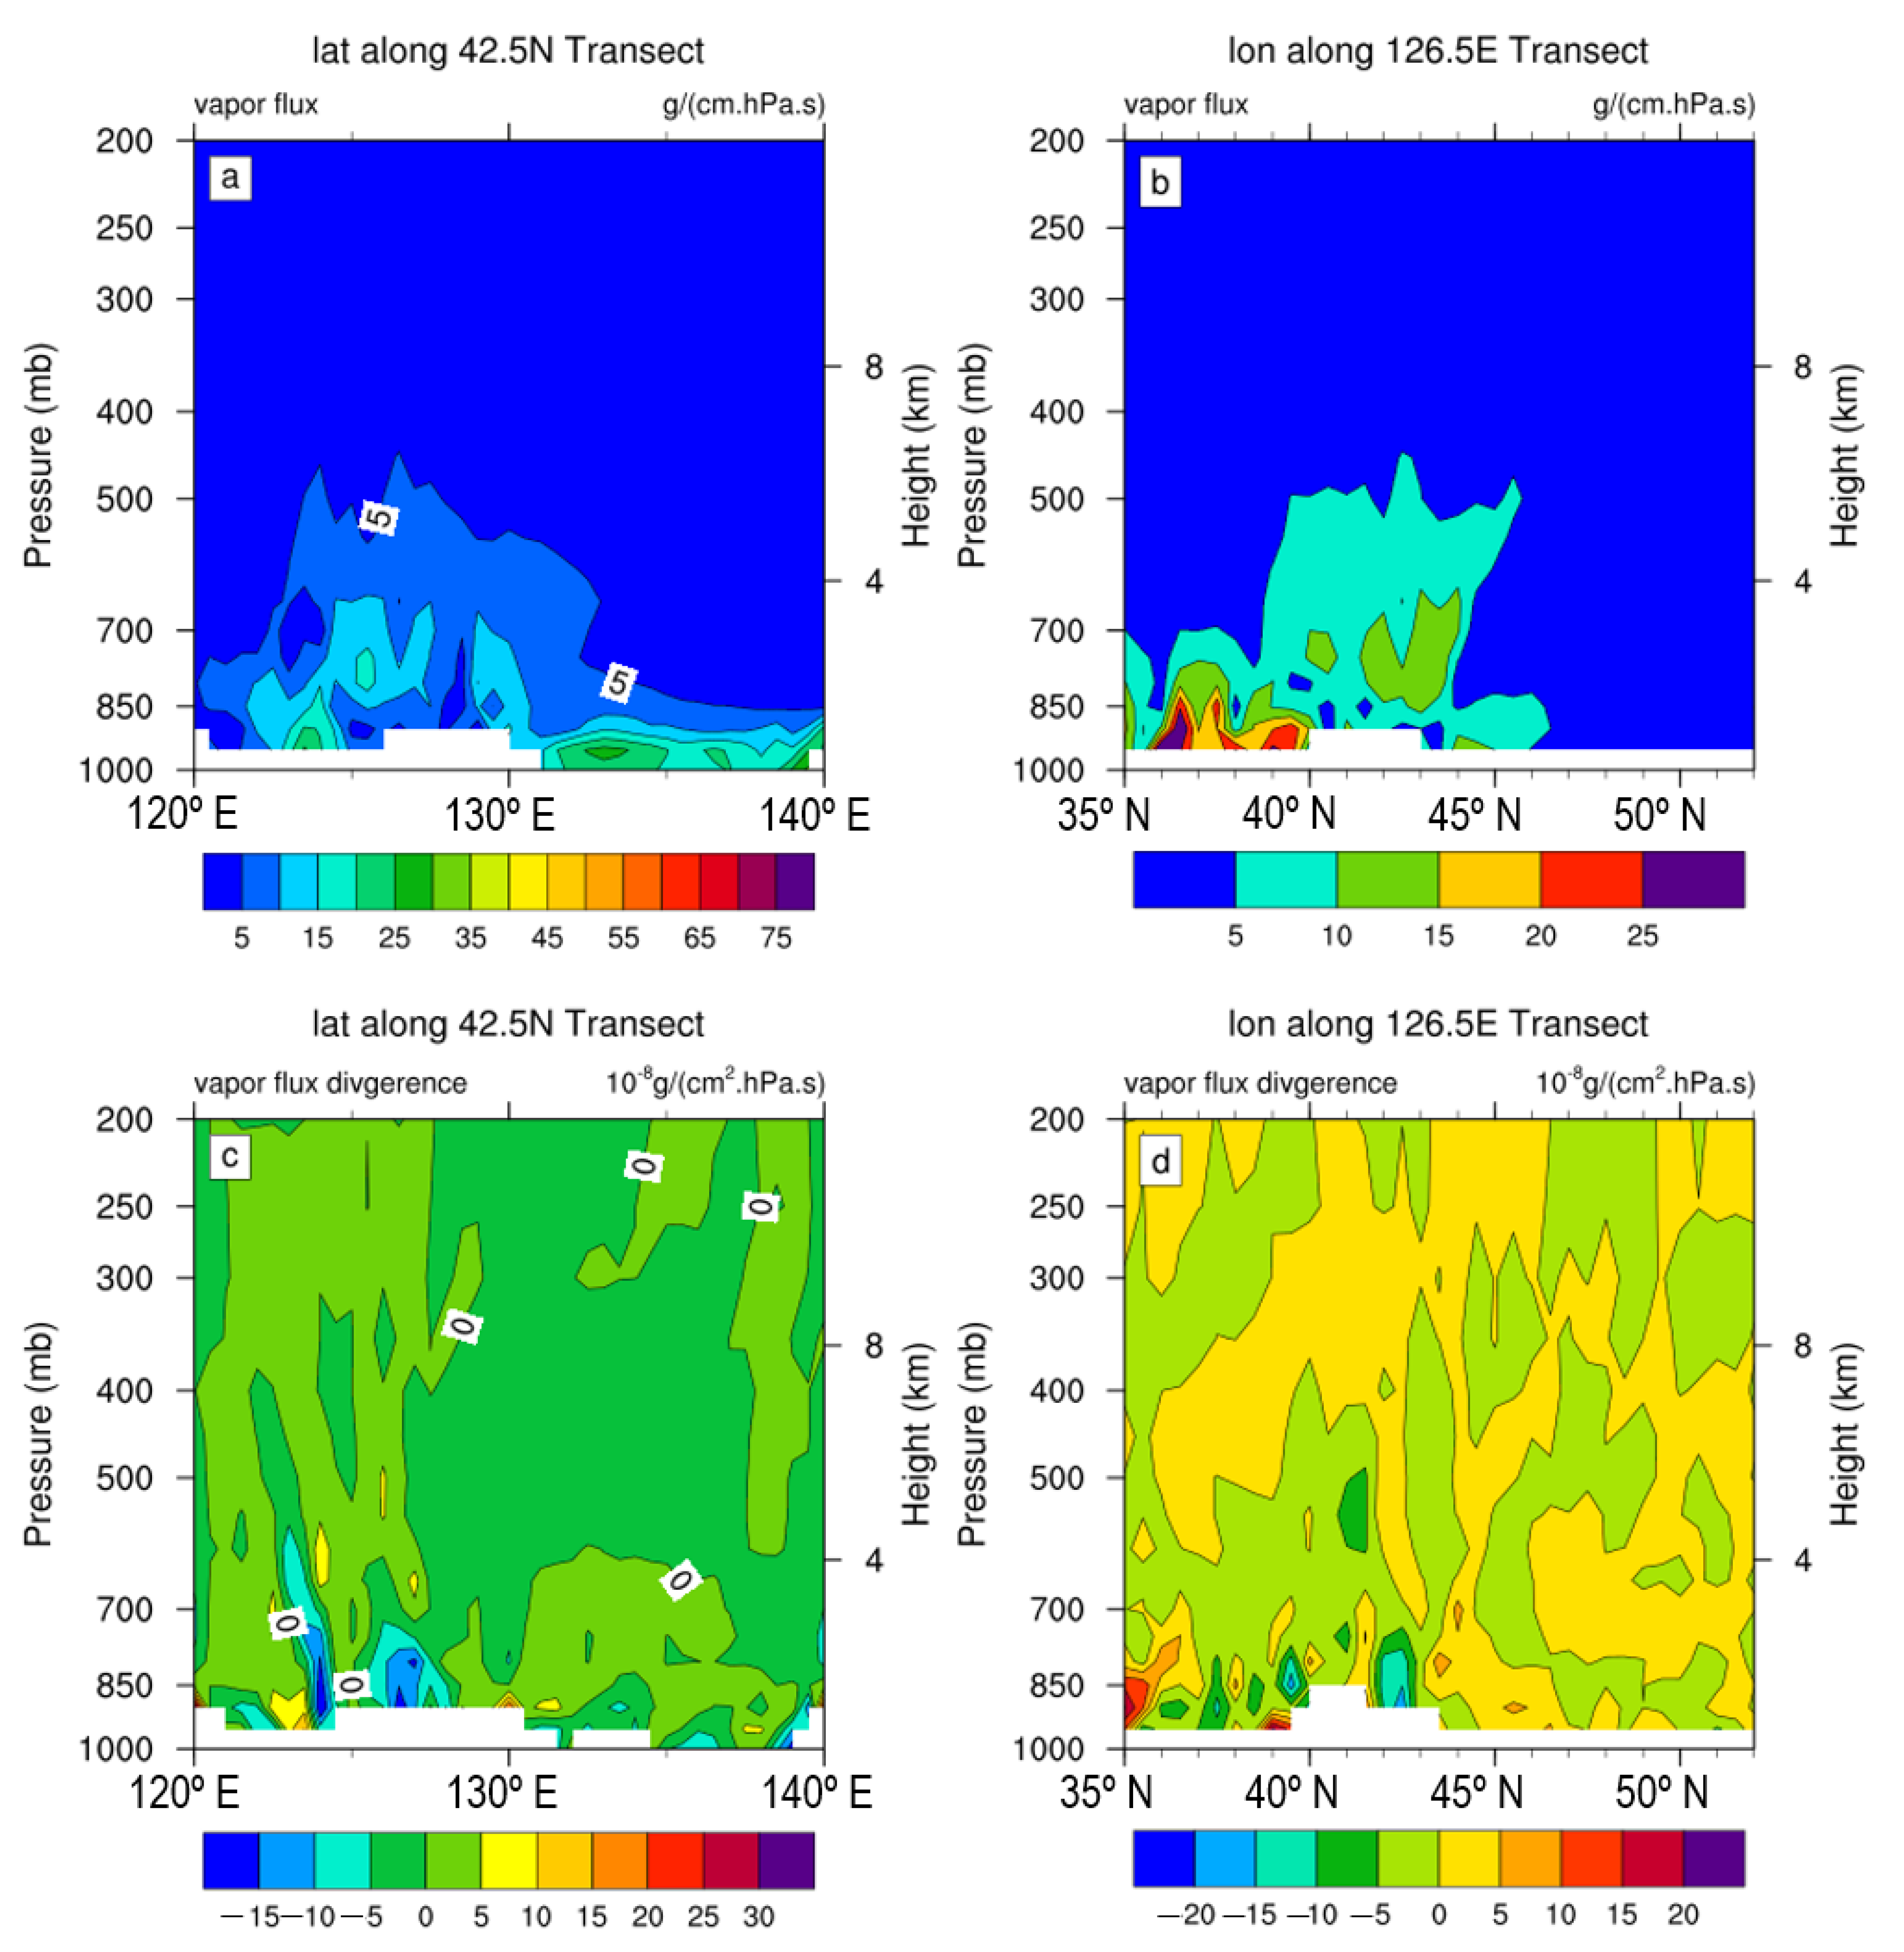
Figure 7a shows that, along the 42.5° N zonal vertical profile of water vapor flux, water vapor is mainly concentrated in the lower troposphere, below 850 hPa, and it is transported from east to west. Figure 7b shows that, on the vertical profile of water vapor flux along the meridional direction of 126.5° E, the water vapor is transported from south to north, concentrated in the south of 45° N, 35–40° N is larger, and it reaches 500 hPa among 40–45° N. Figure 7c shows that, along 42.5° N the zonal vertical profile of water vapor flux divergence, water vapor is concentrated in the lower troposphere below 600 hPa around 124° E, and below 700 hPa around 127° E. Figure 7d shows that, along the meridional direction of 126.5° E, several water vapor convergence centers were transported from south to north, there are two convergence centers of water vapor at 39–40° N and 42–43° N to the south of 45° N below 700 hPa respectively.
3.4. Dynamic Mechanism
After 1415, there is a belt, consisting of serval vortex convergence centers from Bohai Bay to North Korea, which extends northeast along the southwest jet at the east of the inverted trough on the west edge of the subtropical high. The typhoon-inverted trough and the upper trough converge in the middle of Jilin Province, which is the place of the rainstorm center. The convergence centers and the divergence centers match with each other, which is favorable for the formation of the vertical secondary circulations.
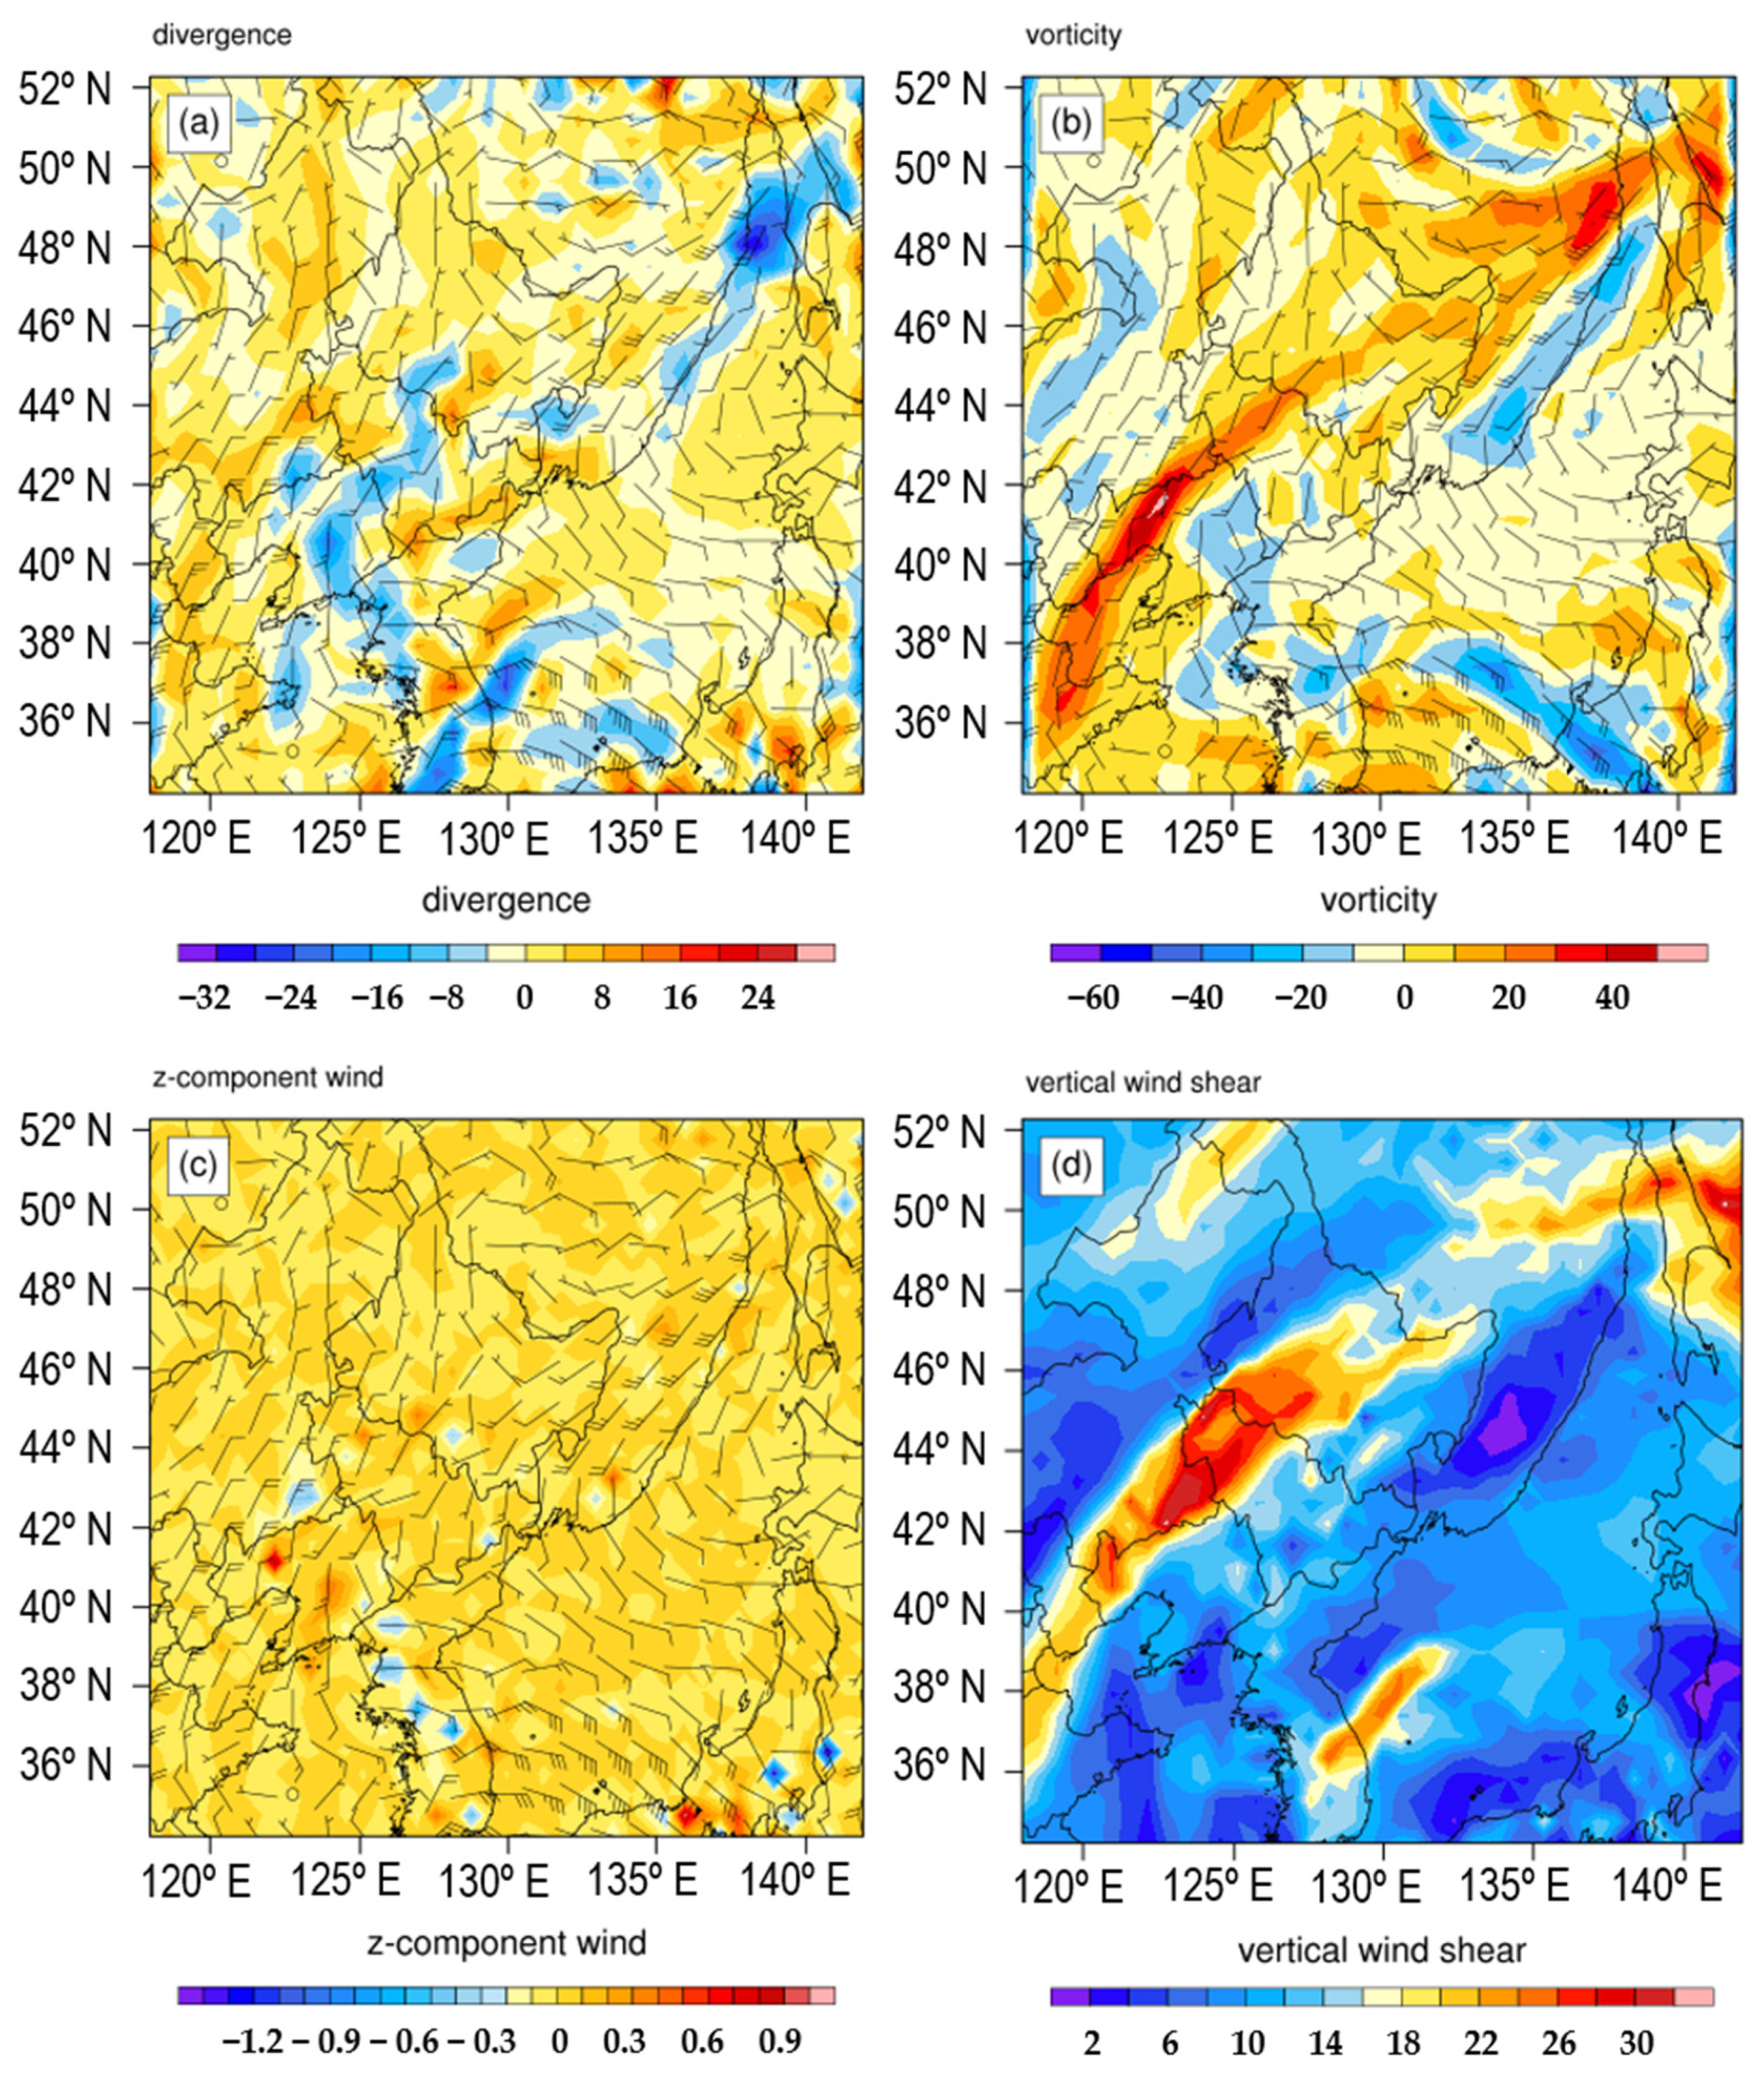
Figure 8a shows the maximum divergence center at 850 hPa is −6 × 10⁻⁵ s−1, it is in the middle of Liaoning and Jilin Province. At 1610, typhoon 1910 reaches the north of Japan, the cold vortex is west of Heilongjiang and Jilin Provinces. There is a convergence center in the middle of the saddle field and near the circulation of the upper cold vortex, the center is in the east of Jilin Province. There is a convergence center at the bottom of the cold vortex, which is −6 × 10⁻⁵ s−1, with a westerly flow, at the south of Liaoning and the Bohai Sea. From 1706 to 1708, the 500 hPa cold vortex moves to the Heilongjiang and Jilin, the southwest jet in front of the trough begins to strengthen, and there appears to be a strong convergence center −6 × 10⁻⁵ s−1 in Jilin and the east of Heilongjiang Province. Figure 8b shows, at 1419, at 850 hPa, that there is a positive vorticity belt about 1000 km long, 300 km wide located in the inverted trough, ranging from the central part of Liaoning Province to the eastern part of Heilongjiang Province. This comes across typhoon 1909’s residual vortex, the positive vorticity is northward transported from typhoon 1910, the positive vorticity center is 50 × 10−5 s−1, located at the middle of Liaoning Province. In front of it, the heavy rainstorm center is located, and then it moves to Jilin Province only after 1423. At 1610, there is a positive vorticity center 8 × 10⁻⁵ s−1 at the bottom of the cold vortex, which is at the westerly flow, at the junction of southern Liaoning and Bohai Sea. The north and south branches meet in the south of Liaoning Province. At 1707, at the east of Heilongjiang Province, there is a shear and positive vorticity belt with a center value of 8 × 10⁻⁵ s−1. Figure 8c shows, at 1419, at 850 hPa, there is a rising area in the inverted trough, and there are several rising centers in Liaoning and Jilin, the center 0.9 m/s is in Liaoning, at the junction of Jilin and central Liaoning, there is a positive and a negative in the inverted trough, 0.4 m/s, −0.4 m/s, conducive to form the secondary circulation, and enhanced to 1423. At 1610, the vertical velocity is not strong. At 1706, there appears a positive rising speed center 0.4 m/s is located at Jilin and east of Heilongjiang. It shows that the convection is not very strong in this precipitation process. Figure 8d shows, at 1419, between the height of 1500–6000 m, there is a positive vertical wind shear belt located at the west side of the inverted trough, at the junction of eastern Hebei and western Liaoning. The high-value center 28 m/s is located at the junction of Inner Mongolia, Liaoning and Jilin Provinces, and a small center of vertical wind shear 2 m/s at the north edge of the subtropical high is located at the south of Sihote mountain, and the rainstorm center is located on the line between the maximum center and the minimum center of vertical wind shear, which is close to the right side of the large value center. The results show that the right side of the downshear center is favorable for the occurrence of heavy rainfall.
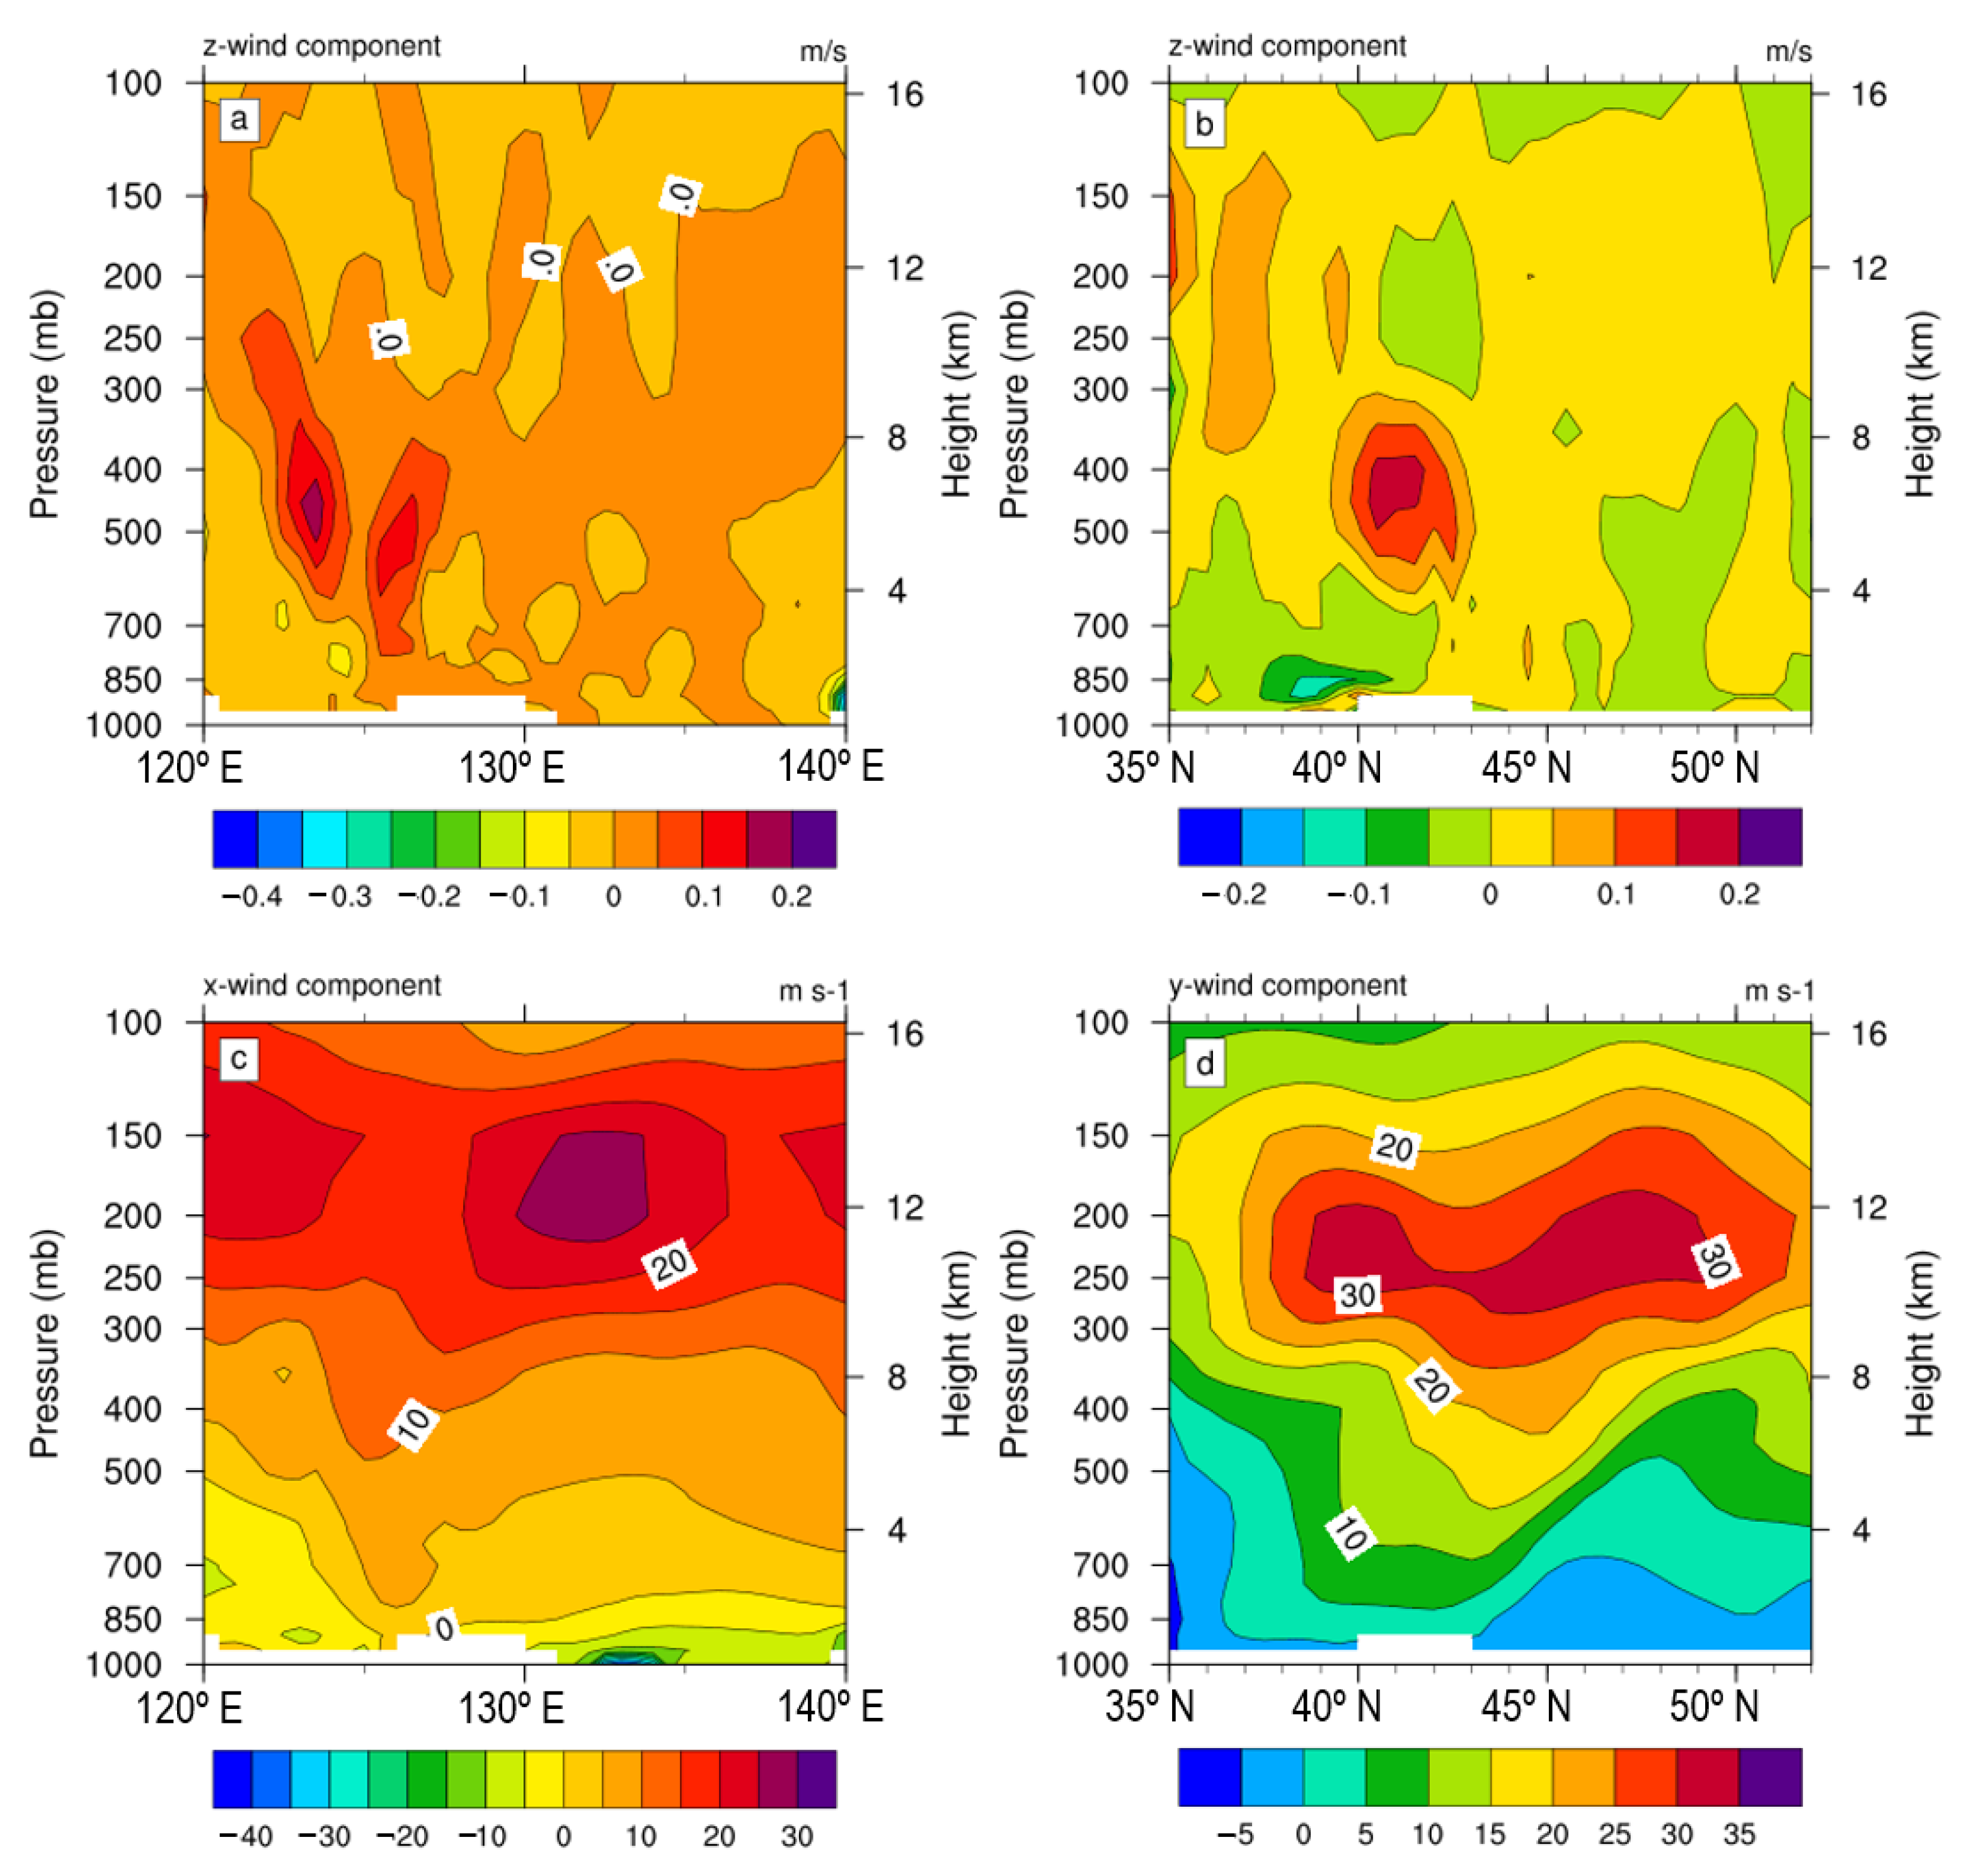
Figure 9a shows at 126.5° E, there is a rising column with the center value of 0.1 m/s at the height of 450–600 hPa, and at the west side, there is an ascending column with the center value of 0.15 m/s at the height of 400–500 hPa, it shows that there is an eastward-moving convection cell at the west of the rainstorm center, and the intensity is strengthened. The results show that the convective system in front of the westerly trough moves eastward and replenishes new energy and water vapor. Figure 9b shows, at 300–600 hPa, 39–43° N, there is a mass updraft center with the center value of 0.15 m/s, whose horizontal width is around 400 km and vertical height is around 4 km. The middle-level vortex may be the function of the typhoon residual vortex. Figure 9c shows there is a zonal westerly belt with several gale cores embedded in the upper 100–300 hPa, a 20 m/s gale core to the west of 125° E is caused by the northward cold vortex descending southward, and the gale core between 130–135° E is 25 m/s, which is caused by the southwest airflow in front of the westerly trough under the blocking of the subtropical high, indicating that there is a westerly jet eastward continuously in the latitudinal direction. Near the ground, east of 126° E, due to the east side of the typhoon-inverted trough, there is a maximum easterly airflow core between 131–135° E. The vertical wind shear between the upper and lower layers is between 132–134° E, which is bigger than 40 m/s. From 120 to 126° E, the easterly flow gradually decreases, and from 300 hPa to the ground, the westerly flow sinks. Figure 9d shows the jet core with a southerly wind of 30 m/s at 100–350 hPa is caused by the southwest airflow in front of the upper trough. From 39–43° N, the upper trough is deep, and the surface in front of the westerly trough is a southerly wind. From 43° N to the north, the lower layer is located at the west of the typhoon-inverted trough, which is the northerly wind. The upper-level in front of the upper trough is the southerly wind. There is a vertical wind shear in the upper and lower layers, and it inclines northward with the height.
3.5. Thermal and Instability Characteristics
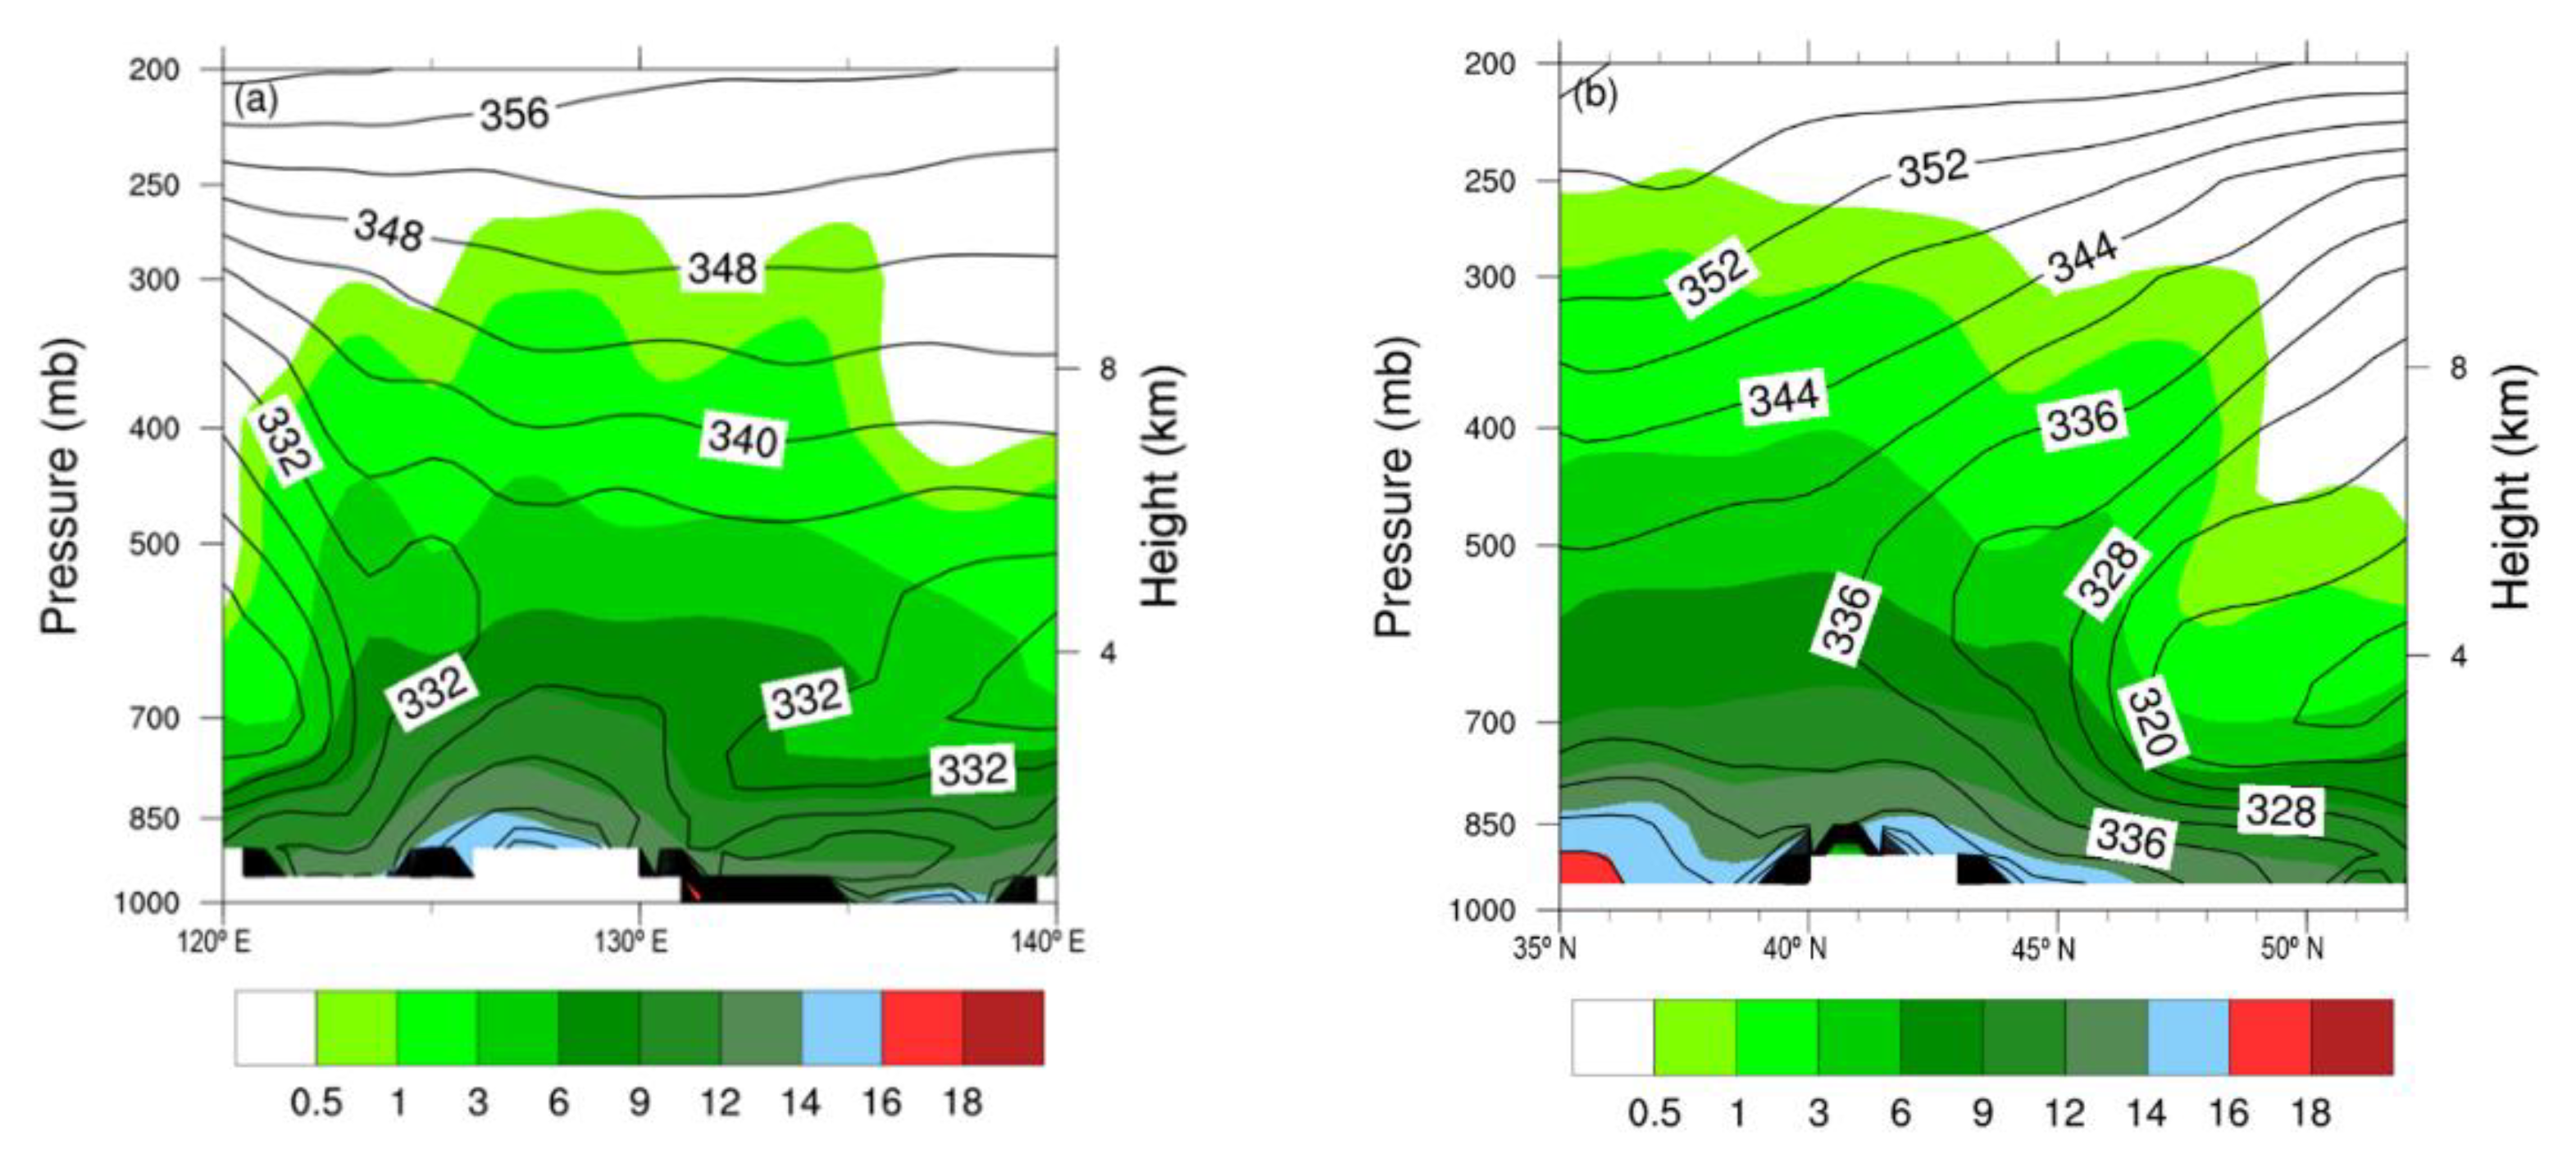
At 1419, at 850 hPa, the high energy tongue is transported from the center of the typhoon 1910 along the southwest airflow of the typhoon-inverted trough and the edge of the subtropical high to the northeast. Figure 10a shows, at 1419, along 42.5° N the zonal vertical profile of pseudo equivalent potential temperature and specific humidity, between 120–124° E, at the height of 400–850 hPa θse is the low-value area, less than 320 K, which indicates that dry and cold air intrudes from the west. The specific humidity above 700 hPa is less than 1 g/kg. From the west to the east of 120° E, the dry and cold air is obliquely intruded into the high humidity center between 124–135° E from the middle troposphere. The maximum value of θse at the center is greater than 352 k, and the specific humidity at 850 hPa is more than 14 g/kg. At 1421, the maximum vertical velocity between 42–44° N 124–126° E is more than 1 m/s. The center area of the low value of θse is located at 700 hPa, which indicates that the area below is a convective instability area. It can be seen that this area is in the convective instability area before and when the rainstorm occurs. As long as the upward movement exists, the convective systems will be triggered and the convective upward motion will be maintained and strengthened. Figure 10b shows, at 1419, the meridional vertical profile of pseudo equivalent potential temperature and specific humidity along 126.5° E, and it can be seen that to the south of 44° N under 700 hPa, θse is greater than 348 K and the warm moist air with specific humidity greater than 16 g/kg extends 47° N northward with the southerly wind. There is a high-value area at 41–43° N. The low value of θse is between the height of 500–700 hPa to the north of 45° N, the θse is 316 K at and the altitude is about 650 hPa. The intensified dry and cold air intrudes obliquely from the middle and upper levels. The front area at the junction of warm and humid air is stable at 41–47° N. The center of the low value of θse is located at 3–4 km height. The convective instability is strengthened in the middle and low troposphere, which leads to more intense precipitation. As the unstable state continues, there is still strong precipitation during 1420–1422.
3.6. Topographic Effect
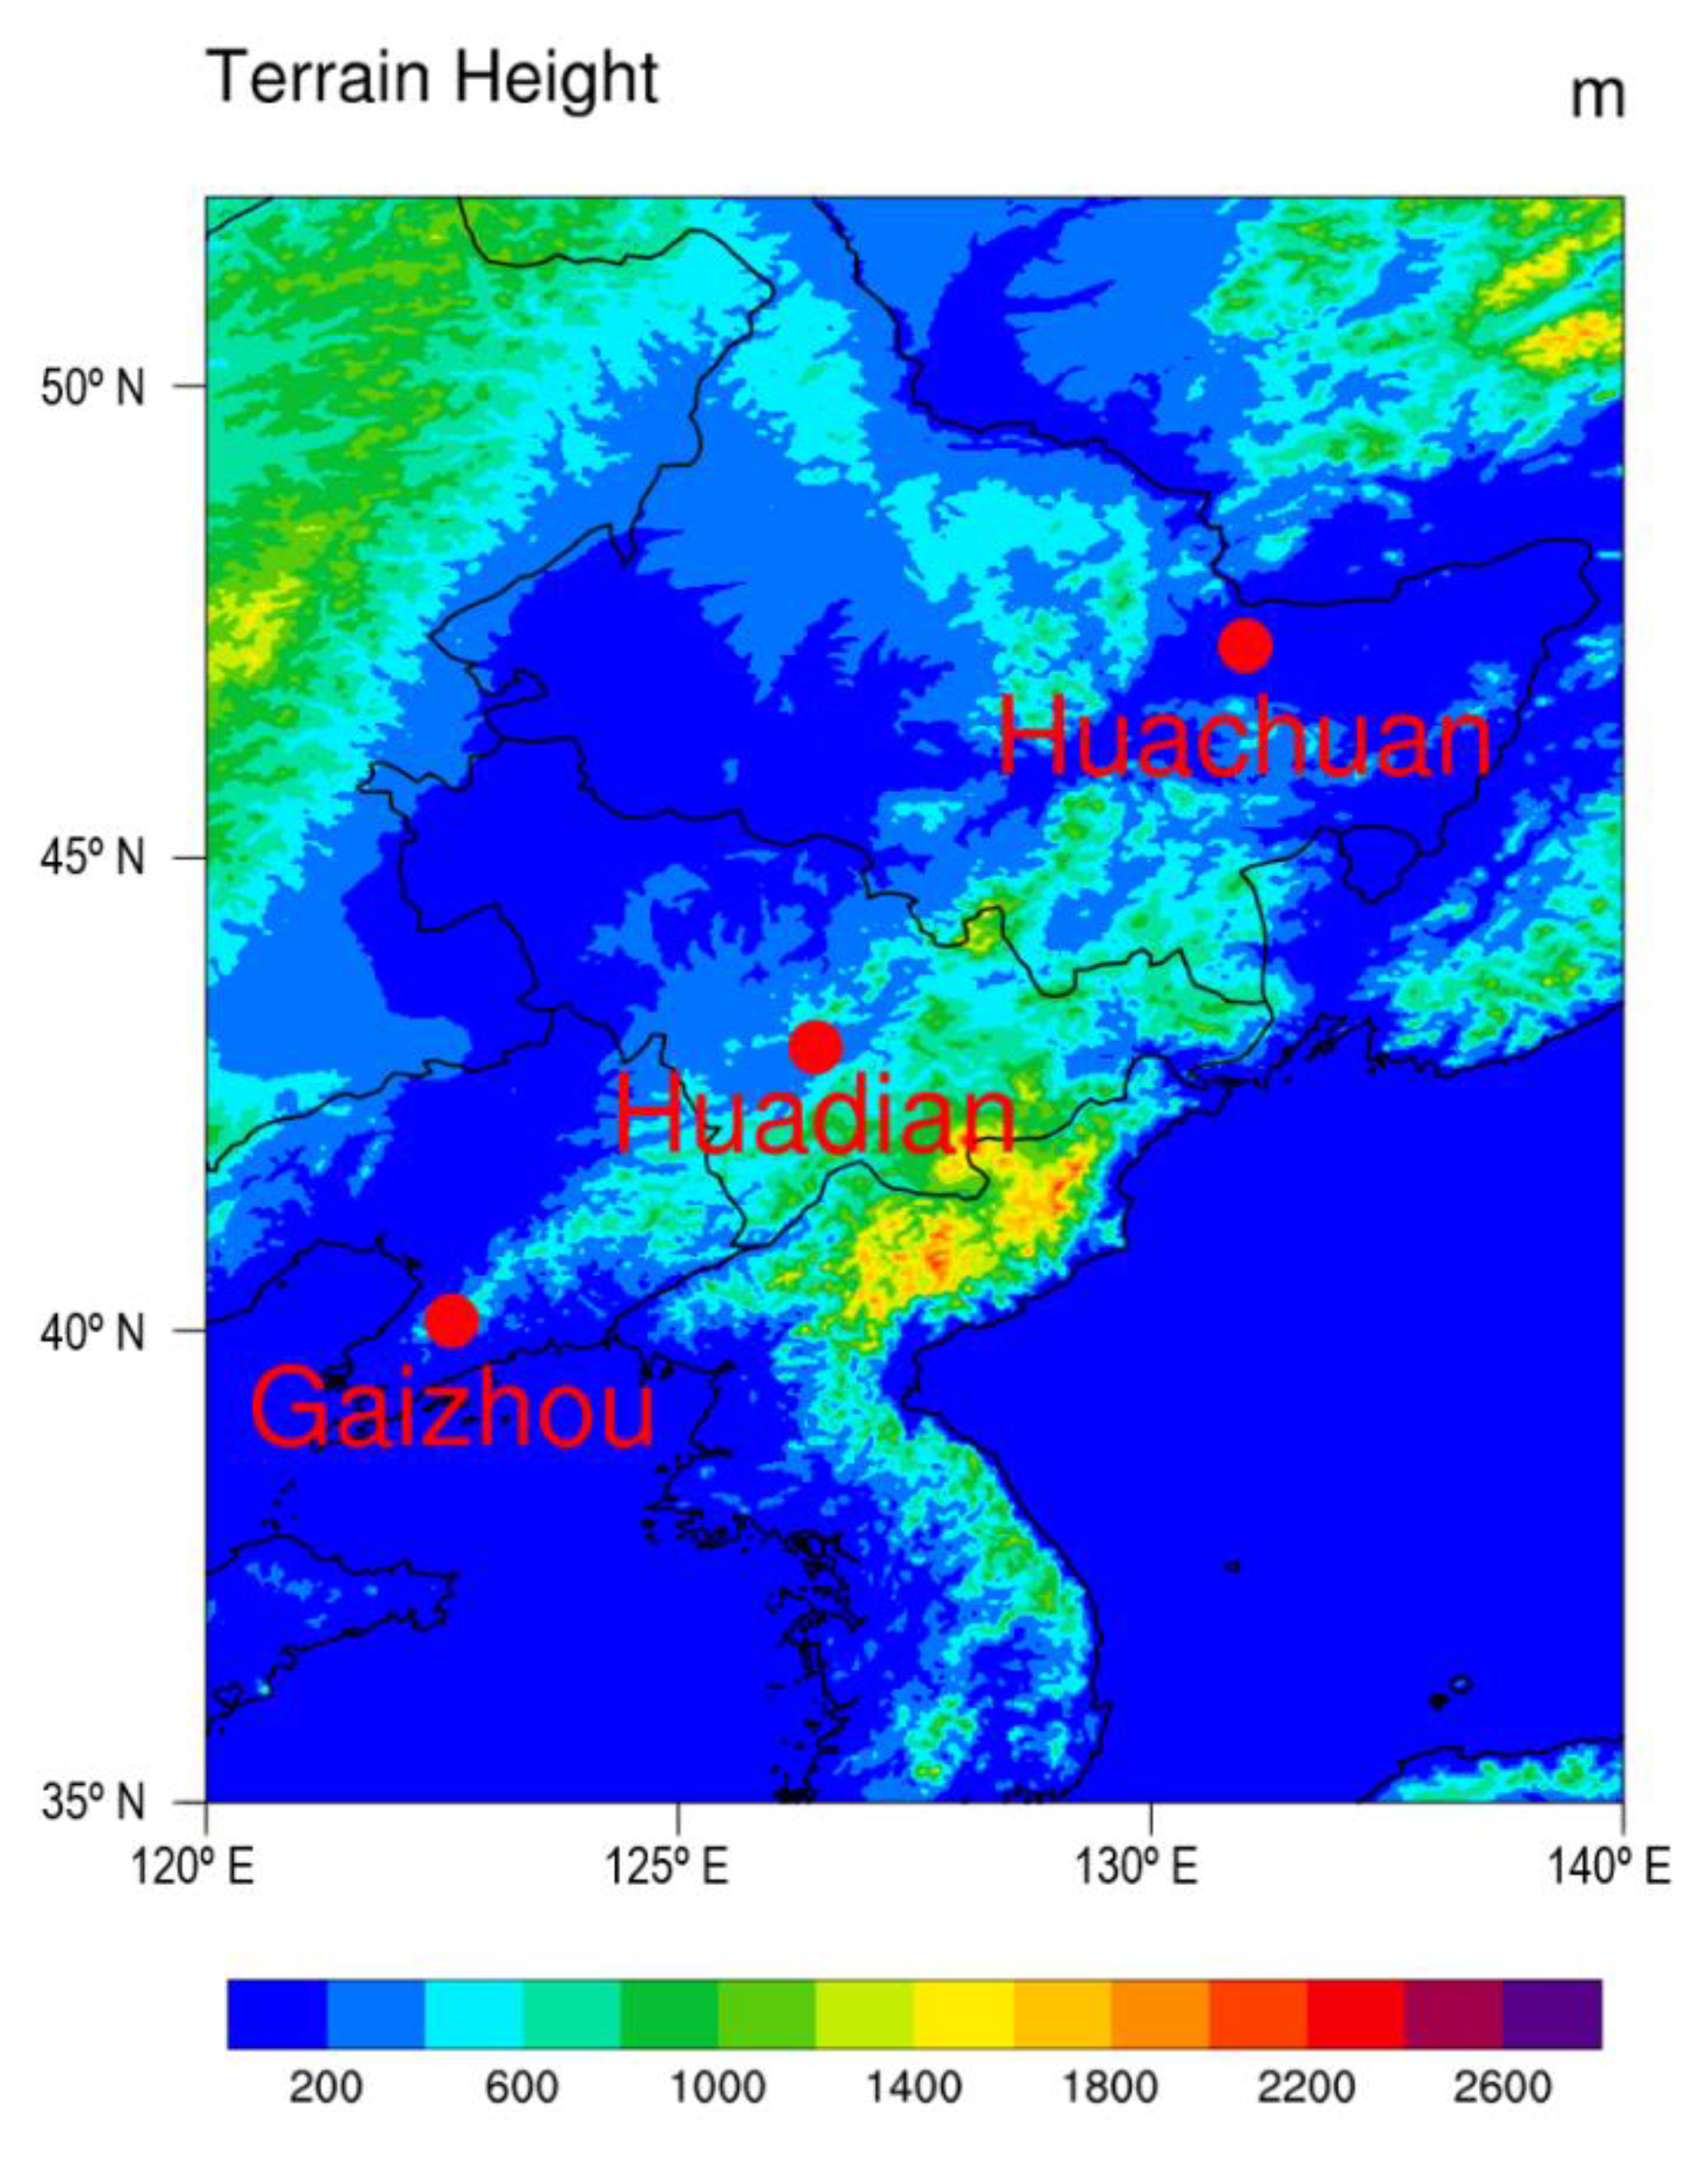
Figure 11 shows the topographic distribution map of Northeast China, the first stage precipitation of the residual vortex of typhoon 1909 (Lekima) occurred in Huadian of Jilin Province, which is located at the leeward slope of the northwest part of Changbai Mountain, and the topographic effect is significant. However, the second and third stages of precipitation occurred in Gaizhou of Liaoning Province and Huachuan of Heilongjiang Province respectively, which are plain areas with very flat terrain, and the role of topography is relatively small [12].
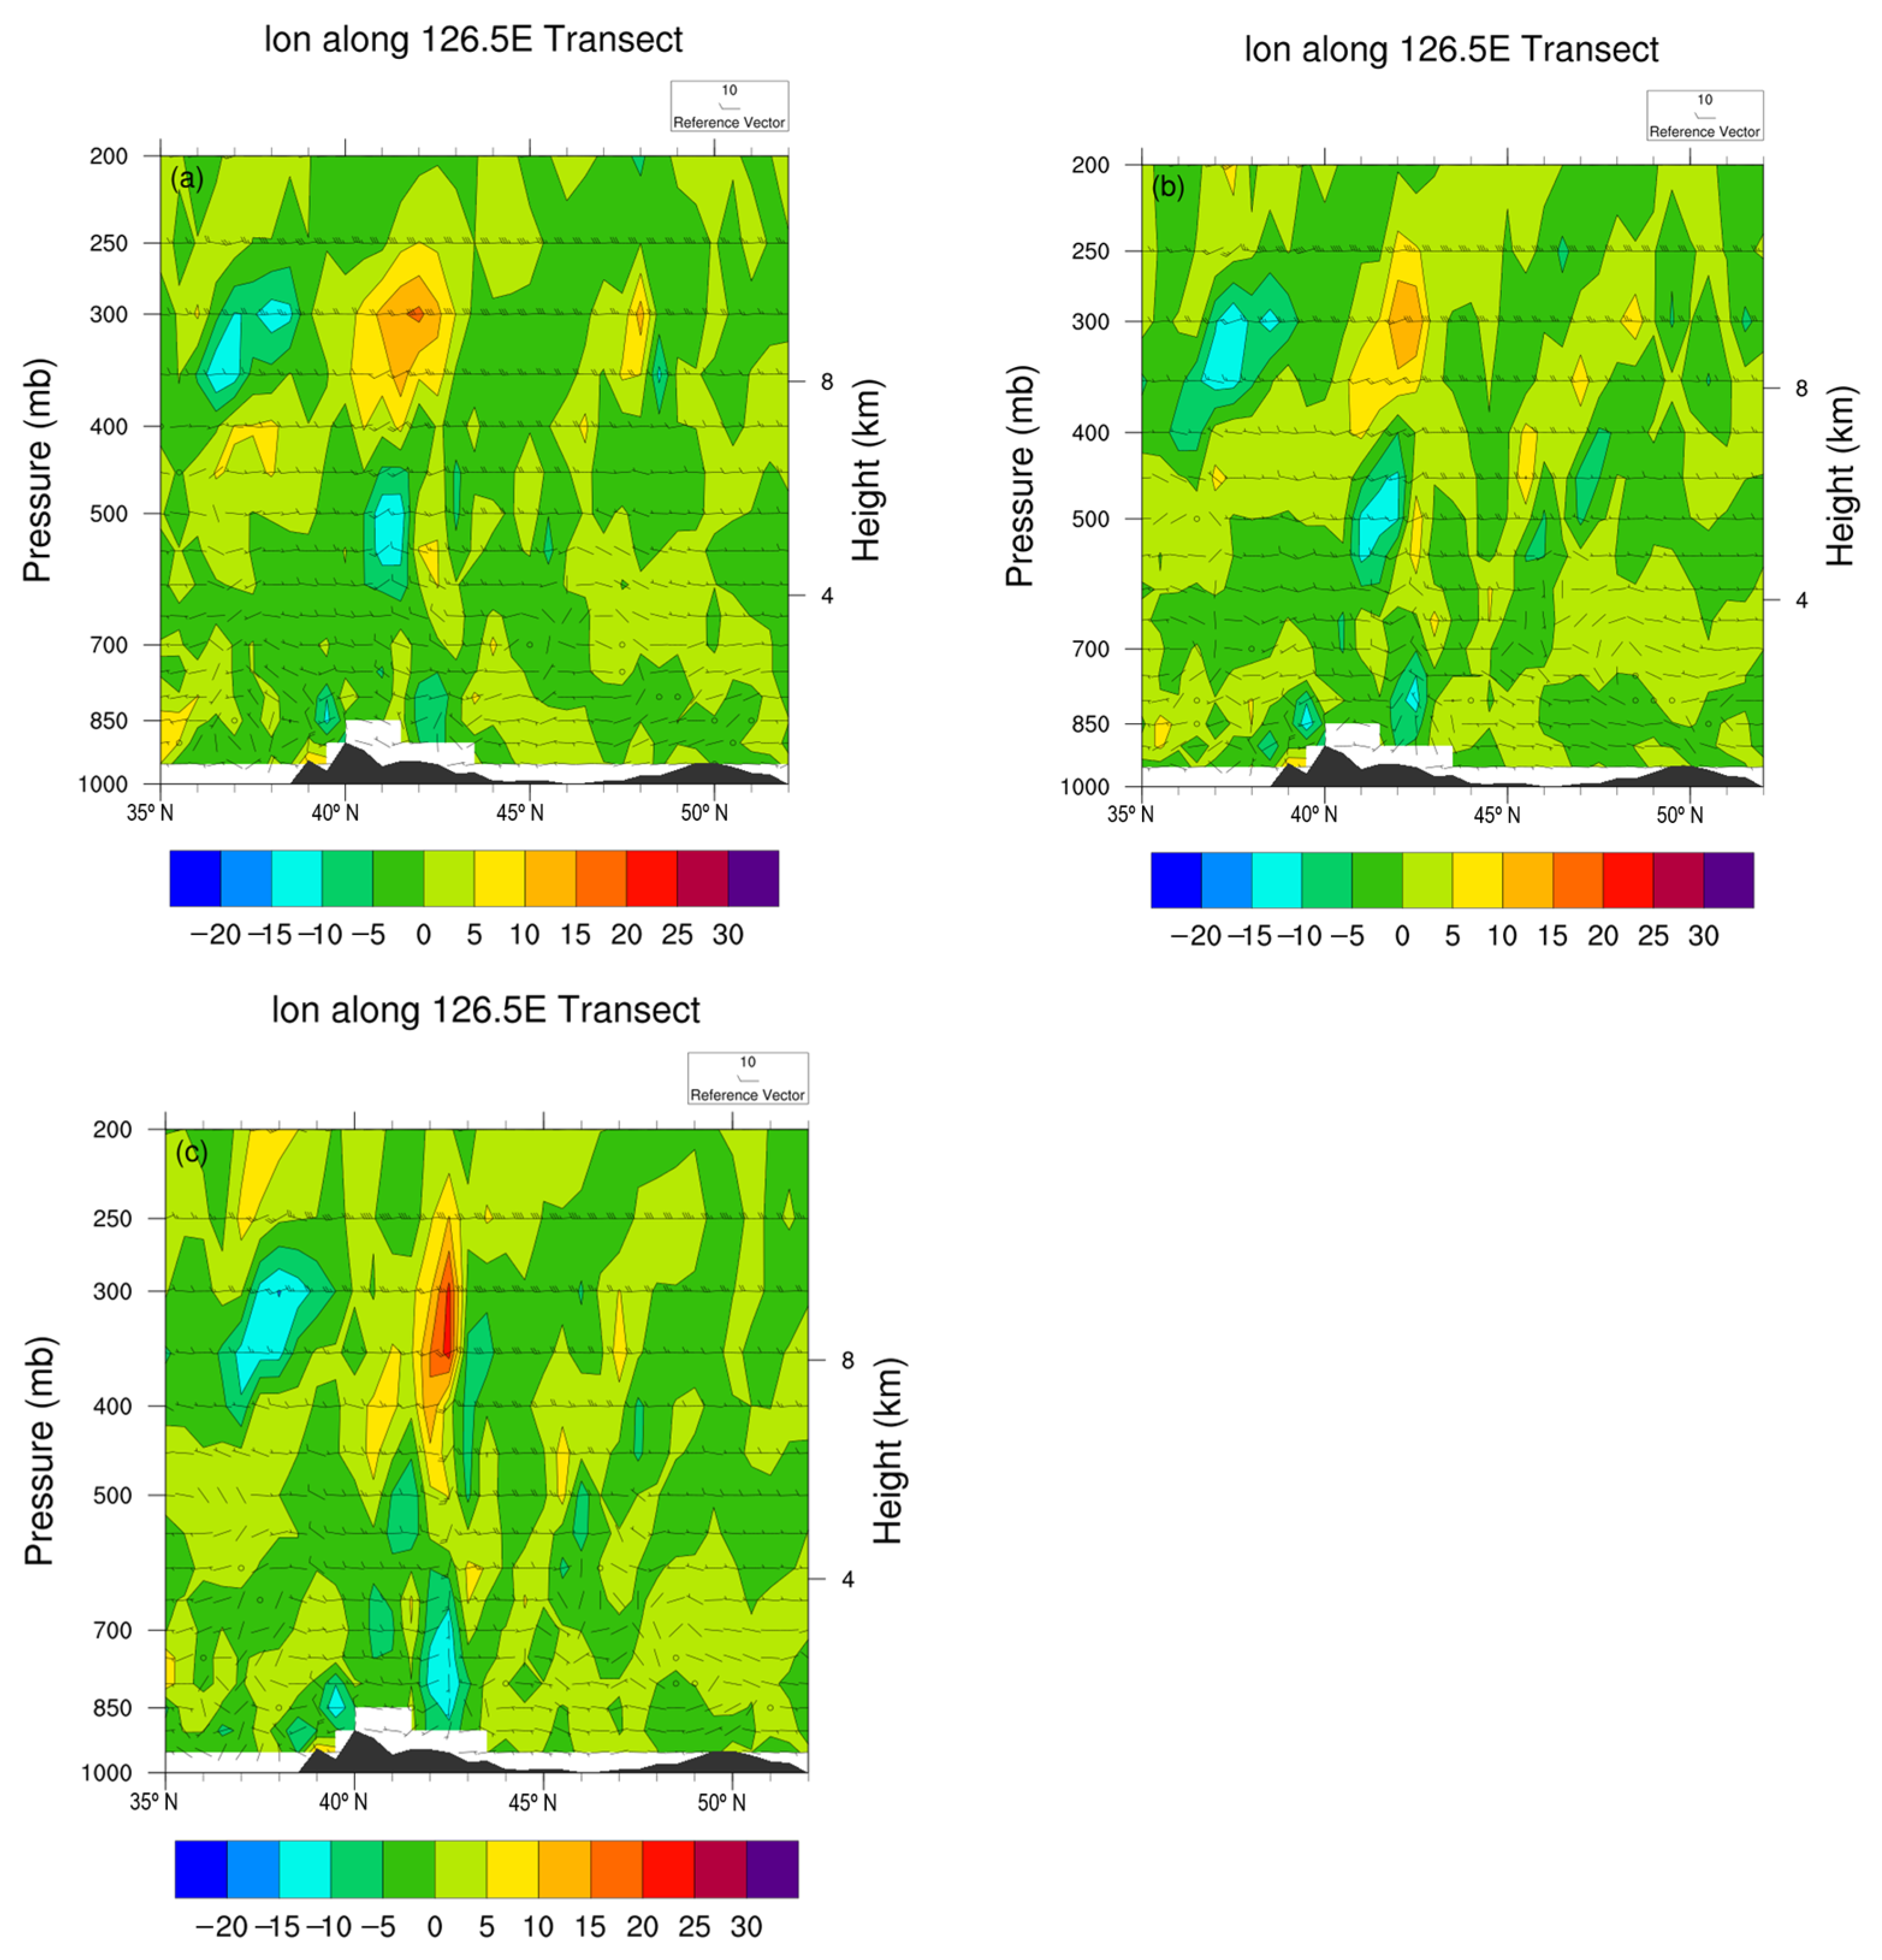
In order to further study the role of the topography of Changbai Mountain at the first heavy rainfall stage, a meridional section along 126.5° E was made (Figure 12) [14]. Figure 12a shows that the divergence distribution at 1419 the whole layer above the high terrain is almost a southerly flow before the typhoon landing, and the updraft is not obvious. There is a small convergence area −10 × 10−5 s−1 in the lower layer of the windward slope on the south side of the high terrain. On the leeward slope of Changbai Mountain, there is a convergence area −10 × 10−5 s−1 in the middle troposphere, and a large strong divergence area 15 × 10−5 s−1 in the upper troposphere. Figure 12b shows, at 1420, as typhoon 1909 moves closer to the land, affected by the terrain uplift, the convective systems were uplifted continuously on the windward slope of the south side of the high terrain. The range of convergence area in the middle troposphere of the leeward slope is enlarged. Figure 12c shows, at 1421, the convective systems are still excited continuously on the windward slope of the south side of the high terrain. However, driven by the northward movement of the upper southerly weather system, the upper troposphere divergence column moves northward, and the height of the convergence column below it decreases. As a result, the convective intensity in the rainstorm area is weakened.
Figure 13a shows, at 1419, that there are two convection systems along latitudinal 42.5° N in the vertical direction between 120–130° E. The convective system in the 123–125° E is caused by the westerly trough, with the convergence column in the west and the divergence column in the east, the divergence column tilts above the convergence column to form an inclined convective system. The convective systems are excited by the typhoon-inverted trough in the east of 126–128° E, and the convective system delivers from the west, when they pass through the windward slope, because of the terrain effect and the vertical upward motion of the western edge of the subtropical high is very strong, the vertical motion is enhanced due to the strengthened convection and the pumping effect of the upper troposphere divergence center. Figure 13b shows, at 1420, with the westerly upper trough moving closer to the mountainous area, due to the topographic uplift, the convective system is uplifted on the windward slope of the west side of the highland. Figure 13c shows, at 1421, due to the topographic uplift, that the convective system is uplifted in the windward slope on the west side of the highland. Due to the weakening of the convective convergence column in the west, and the vertical upward motion of the subtropical high edge decreases, which leads to the weakening of convective activity and the decrease in precipitation in the rainstorm area.
4. Conclusions
A heavy rainstorm occurred in Northeast China from 14 to 17 August 2019. In this paper, a synoptic method is used to study the weather situation, and the numerical simulation results are studied. Main conclusions are drawn as follows:
- The precipitation in the first stage is caused by the interaction between the residual vortex of typhoon 1909 (Lekima) and its inverted trough and the upper trough. The rain belt extends from southwest to northeast, and the rainfall center has typical meso-β-scale characteristics. At the second stage, the upper cold vortex falls to the south, the precipitation is caused by the interaction between the cold vortex and the residual circulation of typhoon 1909 and 1910.
- Before the occurrence of the first 1 h precipitation peak, the upper cold vortex was split into two parts, then the cold air flows southward along with the transverse trough, thus forming an extrusion between the subtropical high. Due to the organization of the residual vorticity of typhoon 1909, a vortex-like belt composed of convergence centers is formed near the rainstorm center. There is a positive vorticity belt in the typhoon-inverted trough. The center of heavy rain is located in front of the positive vorticity center. The secondary circulation forms between the ascending area of the inverted trough, and the sinking center at the inner edge of the subtropical high and the west side of the inverted trough. The water vapor is concentrated in the middle and low troposphere. Starting from the center of typhoon 1910, the water vapor and energy are transported to the northeast along the southwest airflow of the typhoon-inverted trough and the edge of the subtropical high. The upper trough intersects with the residual vortex trough of typhoon 1909, and convective systems are triggered, thus resulting in three times consecutive 1 h heavy rainfalls in the central and eastern part of Jilin Province.
- There is a zone tilted downward from northwest to southeast that contains dry and cold air, and it is in a convectively unstable state. Between the vertical direction of 1500–6000 m, the heavy rainfall center is located on the line between the maximum and minimum centers of vertical wind shear, which is close to the right of the maximum center. Upper westerly momentum propagates downward, the center of the rainstorm is located at the west of the downshear, and the upper southerly momentum propagates downward. The system tilts northward with the height, and the rainstorm area is located at the south side of the downshear. The divergent column tilts above the convergence column thus form the inclined convective systems.
- The heavy rainfall area is located in the leeward slope of the northwest of Changbai Mountain. The strong pumping effect is formed between the upper strong divergence area and the middle convergence area, which strengthens the vertical velocity, and the terrain effect is significant.The upper cold vortex fell to the south, and the circulation of typhoon 1910 merges into the residual vortex of typhoon 1909, which results in the second 1 h precipitation peak. The fusion of typhoon 1909, 1910 residual vortices and the cold vortices at the lower layer, which results in the third 1 h precipitation peak.
Author Contributions
Y.W. initiated the study and did the analysis of meteorological conditions, numerical simulation, dynamic diagnosis and analysis; wrote the original draft. T.W. contributes to full text discussion, checking and proofreading. All authors have read and agreed to the published version of the manuscript.
Funding
This work was funded by the National key R & D Program Fund of the Ministry of science and technology. (Grant No. 2018YFC1507301).
Institutional Review Board Statement
Not applicable.
Informed Consent Statement
Not applicable.
Data Availability Statement
The data presented in this study are available on request from the corresponding author. Due to the amount of data is very large, the data are not publicly available.
Acknowledgments
We thank to China Meteorological Administration for providing surface and sounding observation data, hourly precipitation observation data, NCAR for providing NCEP reanalysis data, WRF version 4.0 mesoscale numerical prediction model and NCL mapping software, Kochi University of Japan for providing hmw-8 cloud images. We are grateful to the High Performance Computing Center (HPCC) of Nanjing University for doing the numerical calculations in this paper on its blade cluster system.
Conflicts of Interest
The authors declare no conflict of interest.
References
- Zheng, X.Y.; Zhang, T.Z.; Bai, R.H. Northeast Rainstorm[M]; China Meteorological Press: Beijing, China, 1992; pp. 1–6. [Google Scholar]
- Li, Y.; Chen, L.S.; Lei, X.T. Numerical study on impacts of upper-level westerly trough on the extratropical transition process of typhoon Winnie (1997). Acta Meteorol. Sin. 2006, 64, 552–563. (In Chinese) [Google Scholar]
- Shen, A.; Tang, X.; Wu, H.; Shen, Y.; Xiong, S. Study on the distribution of torrential rain caused by residual vortex of typhoon Soudelor (1513). J. Meter. Sci. 2018, 38, 453–463. (In Chinese) [Google Scholar]
- Ye, L.; Chen, Y.; Li, S. Mesoscale analysis on rainfalls associated with typhoon Soudelor(1513) in different stages. J. Trop. Meter. 2018, 34, 371–382. (In Chinese) [Google Scholar]
- Wang, Y.; Lu, W.; Pan, Y. Numerical simulation of a torrential rain in the northeast of Huaihe basin part Ⅰ:Model verification and the characteristics analysis of MβCs. Acta Meteorol. Sin. Sin. 2008, 23, 223–232. [Google Scholar]
- Wang, Y.; Pan, Y.; Wang, Y. Numerical Simulation of a Torrential Rain Event in the Northeast of Huaihe Basin. Part II: Instability Conditions and the Mechanism of Intensification and Maintenance. Asia Pac. J. Atmos. Sci. 2011, 47, 79–90. [Google Scholar] [CrossRef]
- Sun, J.H.; Qi, L.L.; Zhao, S.X. A study on mesoscale convective systems of the severe heavy rainfall in north China by “9608” typhoon. Acta Meteorol. Sin. 2006, 64, 57–71. (In Chinese) [Google Scholar]
- Chen, S.S.; Knaff, J.A.; Marks, F.D. Effect of vertical wind shear and storm motion on tropical cyclone rainfall asymmetries deduced from TRMM. Mon. Weather Rev. 2006, 134, 193–208. [Google Scholar] [CrossRef]
- Zhenshou, Y.; Shouting, G.; Hongxiang, R. A numerical study of the severe heavy rainfall associated with the typhoon Haitang(0505). Acta Meteorol. Sin. 2007, 65, 864–876. (In Chinese) [Google Scholar]
- Chun-Chieh, W.U. Numerical simulation of typhoon Gladys (1994) and its interaction with Taiwan terrain using the GFDL hurricane model. Mon. Weather Rev. 2001, 129, 1533–1549. [Google Scholar]
- Lin, Y.-L.; Chiao, S.; Wang, T.-A.; Kaplan, M.L.; Weglarz, R. Some common ingredients of heavy orographic rainfall. Weather For. 2001, 16, 633–660. [Google Scholar] [CrossRef]
- Niu, X.; Du, H.; Liu, J. The numerical simulation of rainfall and precipitation mechanism associated with typhoons sinlaku(0216). Acta Meteorol. Sin. 2005, 63, 57–68. (In Chinese) [Google Scholar]
- Liu, Y.B.; Zhang, D.L.; Yau, M.K. A multiscale numerical study of hurricane Andrew (1992). Part I: Explicit simulation and verification. Mon. Weather Rev. 1997, 125, 3073–3093. [Google Scholar] [CrossRef] [Green Version]
- Zhang, D.L.; Liu, Y.B.; Yau, M.K. A multiscale numerical study of hurricane Andrew (1992). Part III: Dynamically induced vertical motion. Mon. Weather Rev. 1999, 128, 3772–3788. [Google Scholar] [CrossRef] [Green Version]
Figure 1.
Two nested model domains (D01,D02) and their horizontal resolutions (9 km and 3 km respectively).
Figure 1.
Two nested model domains (D01,D02) and their horizontal resolutions (9 km and 3 km respectively).

Figure 2.
(a) Schematic diagram of Typhoon 1909 (Lekima) moving path; (b) Accumulated precipitation from 12 UTC 14 August to 12 UTC 16 August 2019; (c) Accumulated precipitation from 12 UTC 16 August to 12 UTC 17 August 2019.
Figure 2.
(a) Schematic diagram of Typhoon 1909 (Lekima) moving path; (b) Accumulated precipitation from 12 UTC 14 August to 12 UTC 16 August 2019; (c) Accumulated precipitation from 12 UTC 16 August to 12 UTC 17 August 2019.


Figure 3.
(a) Potential height (shaded areas, gpm) and horizontal winds (barbs, kts) at 500 hPa; (b) Temperature (shaded areas, °C) and horizontal winds (barbs, kts) at 500 hPa; (c) Potential height (shaded areas, gpm) and horizontal winds (barbs, kts) at 850 hPa; (d) Pressure (shaded areas, hPa) and horizontal winds (barbs, kts) at sea level at 19 UTC on 14 August 2019.


Figure 4.
The HMW-8 satellite image (TBB, unit: °C) at 20 UTC on 14 August 2019.

Figure 5.
Horizontal winds (barbs;kts) and (a) vapor flux(shaded;g/(cm.hPa.s)); (b) water vapor flux divergence (shaded; 10−8 g/(cm2.hPa.s)) at 19 UTC on 14 August 2019.
Figure 5.
Horizontal winds (barbs;kts) and (a) vapor flux(shaded;g/(cm.hPa.s)); (b) water vapor flux divergence (shaded; 10−8 g/(cm2.hPa.s)) at 19 UTC on 14 August 2019.

Figure 6.
Vertical cross section of relative humidity (shaded;%) along 42.5° N (a), and 126.5° E (b) at 19 UTC on 14 August 2019.
Figure 6.
Vertical cross section of relative humidity (shaded;%) along 42.5° N (a), and 126.5° E (b) at 19 UTC on 14 August 2019.

Figure 7.
Vertical cross section of vapor flux (shaded; g/(cm.hPa.s)) along 42.5° N (a), and 126.5° E (b) at 19 UTC on 14 August 2019; Vertical cross section of water vapor flux divergence (shaded; 10−8 g/(cm2.hPa.s)) along 42.5° N (c), and 126.5° E (d) at 19 UTC on 14 August 2019.
Figure 7.
Vertical cross section of vapor flux (shaded; g/(cm.hPa.s)) along 42.5° N (a), and 126.5° E (b) at 19 UTC on 14 August 2019; Vertical cross section of water vapor flux divergence (shaded; 10−8 g/(cm2.hPa.s)) along 42.5° N (c), and 126.5° E (d) at 19 UTC on 14 August 2019.

Figure 8.
Horizontal winds (barbs;kts) and (a) divergence(10−5 s−1); (b) vorticity (10−5 s−1); (c) vertical velocity (m/s); (d) vertical wind shear between 1500–6000 m(m/s) at 19 UTC on 14 August 2019.
Figure 8.
Horizontal winds (barbs;kts) and (a) divergence(10−5 s−1); (b) vorticity (10−5 s−1); (c) vertical velocity (m/s); (d) vertical wind shear between 1500–6000 m(m/s) at 19 UTC on 14 August 2019.

Figure 9.
Vertical cross section of vertical velocity (shaded; m/s)) along 42.5° N (a), and 126.5° E (b) vertical cross section of u (shaded; m/s) along 42.5° N (c), and v(shaded; m/s) along 126.5° E (d) at 19 UTC on 14 August 2019.
Figure 9.
Vertical cross section of vertical velocity (shaded; m/s)) along 42.5° N (a), and 126.5° E (b) vertical cross section of u (shaded; m/s) along 42.5° N (c), and v(shaded; m/s) along 126.5° E (d) at 19 UTC on 14 August 2019.

Figure 10.
Vertical cross section of pseudo equivalent potential temperature (solid line; K) and specific humidity (shaded; g/kg) and along 42.5° N (a), and 126.5° E (b) at 19 UTC on 14 August 2019.
Figure 10.
Vertical cross section of pseudo equivalent potential temperature (solid line; K) and specific humidity (shaded; g/kg) and along 42.5° N (a), and 126.5° E (b) at 19 UTC on 14 August 2019.

Figure 11.
Topographic height map of Northeast China.

Figure 12.
vertical profile of the resultant wind (Plume) along longitude 126.5° E divergence (shaded, unit: 10−5 s−1), v and w * 20 (barbs; m/s) at (a) 19 (b) 20 (c) 21 UTC on 14 August 2019.
Figure 12.
vertical profile of the resultant wind (Plume) along longitude 126.5° E divergence (shaded, unit: 10−5 s−1), v and w * 20 (barbs; m/s) at (a) 19 (b) 20 (c) 21 UTC on 14 August 2019.

Figure 13.
Vertical profile of the resultant wind (Plume) along latitudinal 42.5° N divergence (shaded, unit: 10−5 s−1), u and w * 20 (barbs; m/s) at (a) 19:00 (b) 20:00 (c) 21:00 UTC on 14 August 2019.
Figure 13.
Vertical profile of the resultant wind (Plume) along latitudinal 42.5° N divergence (shaded, unit: 10−5 s−1), u and w * 20 (barbs; m/s) at (a) 19:00 (b) 20:00 (c) 21:00 UTC on 14 August 2019.

Publisher’s Note: MDPI stays neutral with regard to jurisdictional claims in published maps and institutional affiliations. |
© 2021 by the authors. Licensee MDPI, Basel, Switzerland. This article is an open access article distributed under the terms and conditions of the Creative Commons Attribution (CC BY) license (http://creativecommons.org/licenses/by/4.0/).
Share and Cite
MDPI and ACS Style
Wang, Y.; Wang, T. Numerical Simulation of a Heavy Rainstorm in Northeast China Caused by the Residual Vortex of Typhoon 1909 (Lekima). Atmosphere 2021, 12, 120. https://doi.org/10.3390/atmos12010120
AMA Style
Wang Y, Wang T. Numerical Simulation of a Heavy Rainstorm in Northeast China Caused by the Residual Vortex of Typhoon 1909 (Lekima). Atmosphere. 2021; 12(1):120. https://doi.org/10.3390/atmos12010120
Chicago/Turabian StyleWang, Yiping, and Tong Wang. 2021. "Numerical Simulation of a Heavy Rainstorm in Northeast China Caused by the Residual Vortex of Typhoon 1909 (Lekima)" Atmosphere 12, no. 1: 120. https://doi.org/10.3390/atmos12010120
Note that from the first issue of 2016, this journal uses article numbers instead of page numbers. See further details here.