Article

Assessment of Climate Change in Central Asia from 1980 to 2100 Using the Köppen-Geiger Climate Classification

1
State Key Laboratory of Desert and Oasis Ecology, Xinjiang Institute of Ecology and Geography, Chinese Academy of Sciences, Urumqi 830011, China
2
Department of Geography, Ghent University, 9000 Ghent, Belgium
3
University of Chinese Academy of Sciences, Beijing 100094, China
4
Sino-Belgian Joint Laboratory of Geo-information, Urumqi 830011, China
5
Research Centre for Ecology and Environment of Central Asia, Chinese Academy of Sciences, Urumqi 830011, China
6
Binjiang College, Nanjing University of Information Science and Technology, Wuxi 214105, China
7
Royal Meteorological Institute of Belgium, 1180 Brussels, Belgium
8
Department of Physics and Astronomy, Ghent University, 9000 Ghent, Belgium
9
Longnan Ecological Environment Bureau, Longnan 746000, China
*
Author to whom correspondence should be addressed.
Atmosphere 2021, 12(1), 123; https://doi.org/10.3390/atmos12010123
Submission received: 22 November 2020 / Revised: 18 December 2020 / Accepted: 15 January 2021 / Published: 17 January 2021
(This article belongs to the Section Climatology)

Abstract

:
The accelerated global warming and heterogeneous change in precipitation have been resulting in climate system shifts, which plays a key role in the stability of ecosystem and social economic development. Central Asia is account 80% of the temperate desert, characterized by fragile ecosystem; however, it has experienced the fastest warming in recent decades and projected warming in future. The Köppen-Geiger climate classification is a useful tool to assess the potential impacts of climate change on regional ecosystem. The spatial shift and temporal evolution of each climatic zone based on Köppen-Geiger climate classification are analyzed in historical and future period under different scenarios (RCP2.6, RCP4.5 and RCP8.5), high risk regions that might experience more frequent climatic zone shifts are delimited in this study, which could provide the useful information for developing mitigate strategies in coping with the warming threat. The hotter and dryer subtypes of arid climatic zone and warmer subtypes of temperate climatic zone expanded their coverage in Central Asia, corresponding to the tundra climatic, cooler subtype of arid and temperate climatic zone contracted. Based on a method defining the climate-sensitivity, high risk regions are mainly distributed in northern Kazakhstan and Tianshan Mountains region.

1. Introduction

In recent decades, the change of climate associated with global warming has received more attention worldwide [1], since it is expected to have direct or indirect effects on the local or regional energy and water exchange between the atmosphere and biosphere [2]. The rising global temperature accelerated and heterogeneous change of precipitation accompanied by changes in climate system [3]. Although climate system is not exact boundaries for all species, it limits the distribution and phenology of plant and plays a key role in maintaining ecological stability and social-economic developments [4]. The region of Central Asia, accounting for one third of the temperate deserts, nurtures 65 × 106 people in these fragile ecosystems [5], which is especially sensitive to climate change. The sustainability of the fragile ecosystem lies under the threat of dramatic climate change, which was among the regions that experienced the fastest warming of the world in recent decades (0.4 °C/decade) [6,7]. If those changes become more pronounced in the future, they would likely change the climatic zone by disappearance or appearance of some climatic types and would have more serious impacts on ecosystem, environment and society [8].
One simple, but frequently used method to assess the impact of climate change on ecosystems is climate classification by scientifically quantifies the climatic resources in order to classify the regional climate type [9]. Climate classification is a basic tool to study climate conditions and utilized to estimate possible effects on vegetation and ecosystem [10]. Among the existing climate classification methods, the Köppen scheme only needs temperature and precipitation (and their annual cycle pattern) to define, and has strict classification standard, clear boundary, which allowed it to become one of the most widely used methods [11]. The Köppen climate classification has been used to produce climatic zone maps [12] and applied to assess the climate change in specific regions [13,14]. During the past 60 years, the arid and tundra climatic zones are more sensitive to climate change; the area covered by arid zones expanded over the past 60 years, which caused a significant increasing risk of regional desertification [8,15]. A downward trend in the coverage of tundra climatic zone during the first 40 years of the twentieth century was followed by two increases during 1940s and early 1960s, and then a rapid decrease took place in the last 20 years [16]. Köppen classification has been wildly used to investigate the climate change in global scale, low-latitude region (tropical desert climatic zone), high-latitude region (Arctic tundra climate) and several countries, involving Central Asia; however, detailed analysis of spatiotemporal variation characteristics of climatic zone shifts in Central Asia seldom received individual attention. Due to the scarcely available observational data, to date the understanding of climate change, especially combined temperature and precipitation analysis in Central Asia, remains uncertain [17]. Efforts are needed in comprehensively investigating synthetic climate effect of multiple climate variables change and employ more data sources to minimize the uncertainty.
Therefore, the spatial shifts and temporal evolution of climatic zones of Central Asia based on the updated Köppen-Geiger climate classification criteria [18] were assessed for the period 1980–2016 and 2020–2100 by adopting multiple data sources in this study. Firstly, the historical (1980–2016), near future (2030–2066) and far future (2060–2096) climatic zone maps (under RCP2.6, RCP4.5 and RCP8.5 scenarios) were generated by using the ensemble dataset as base-map in following analysis and publicly for other research purposes. Secondly, the spatiotemporal shifts and annual change trends of each climate types were analyzed by least square regression, Mann-Kendall method and partial correlation analysis, which are used to estimate coverage of climatic zone expansion/construction and corresponding changing rate and explored the mainly contribution of climate factors to climatic zone shifts during historical and future periods. Finally, a climate-sensitivity index defined method was adopted, the climate-sensitivity intensity of both ensemble dataset and each isolated data source were calculated to delimit the high-risk regions that experienced or might face frequent climatic zone shifts, which could provide useful information for developing mitigating strategies in coping with the projected warming threat in fragile ecosystem.
This paper is organized as follows: the overview of the study area, available monthly temperature and precipitation datasets, Köppen-Geiger criteria, definition of the climate-sensitivity index and statistical methods adopted in this study are described in Section 2. The results of mapping climatic zone in different period, spatial shift characteristic and temporal evolution trend of each climate type, the contribution of different climate factors in climatic zone shifts and high-risk regions in which frequent climatic zone shifts are present in Section 3. The discussion about spatiotemporal variation in temperature and precipitation are analyzed in Section 4. Section 4 also compares our work with other findings and lists the uncertainties in this study. These conclusions are illustrated in Section 5.

2. Materials and Methods
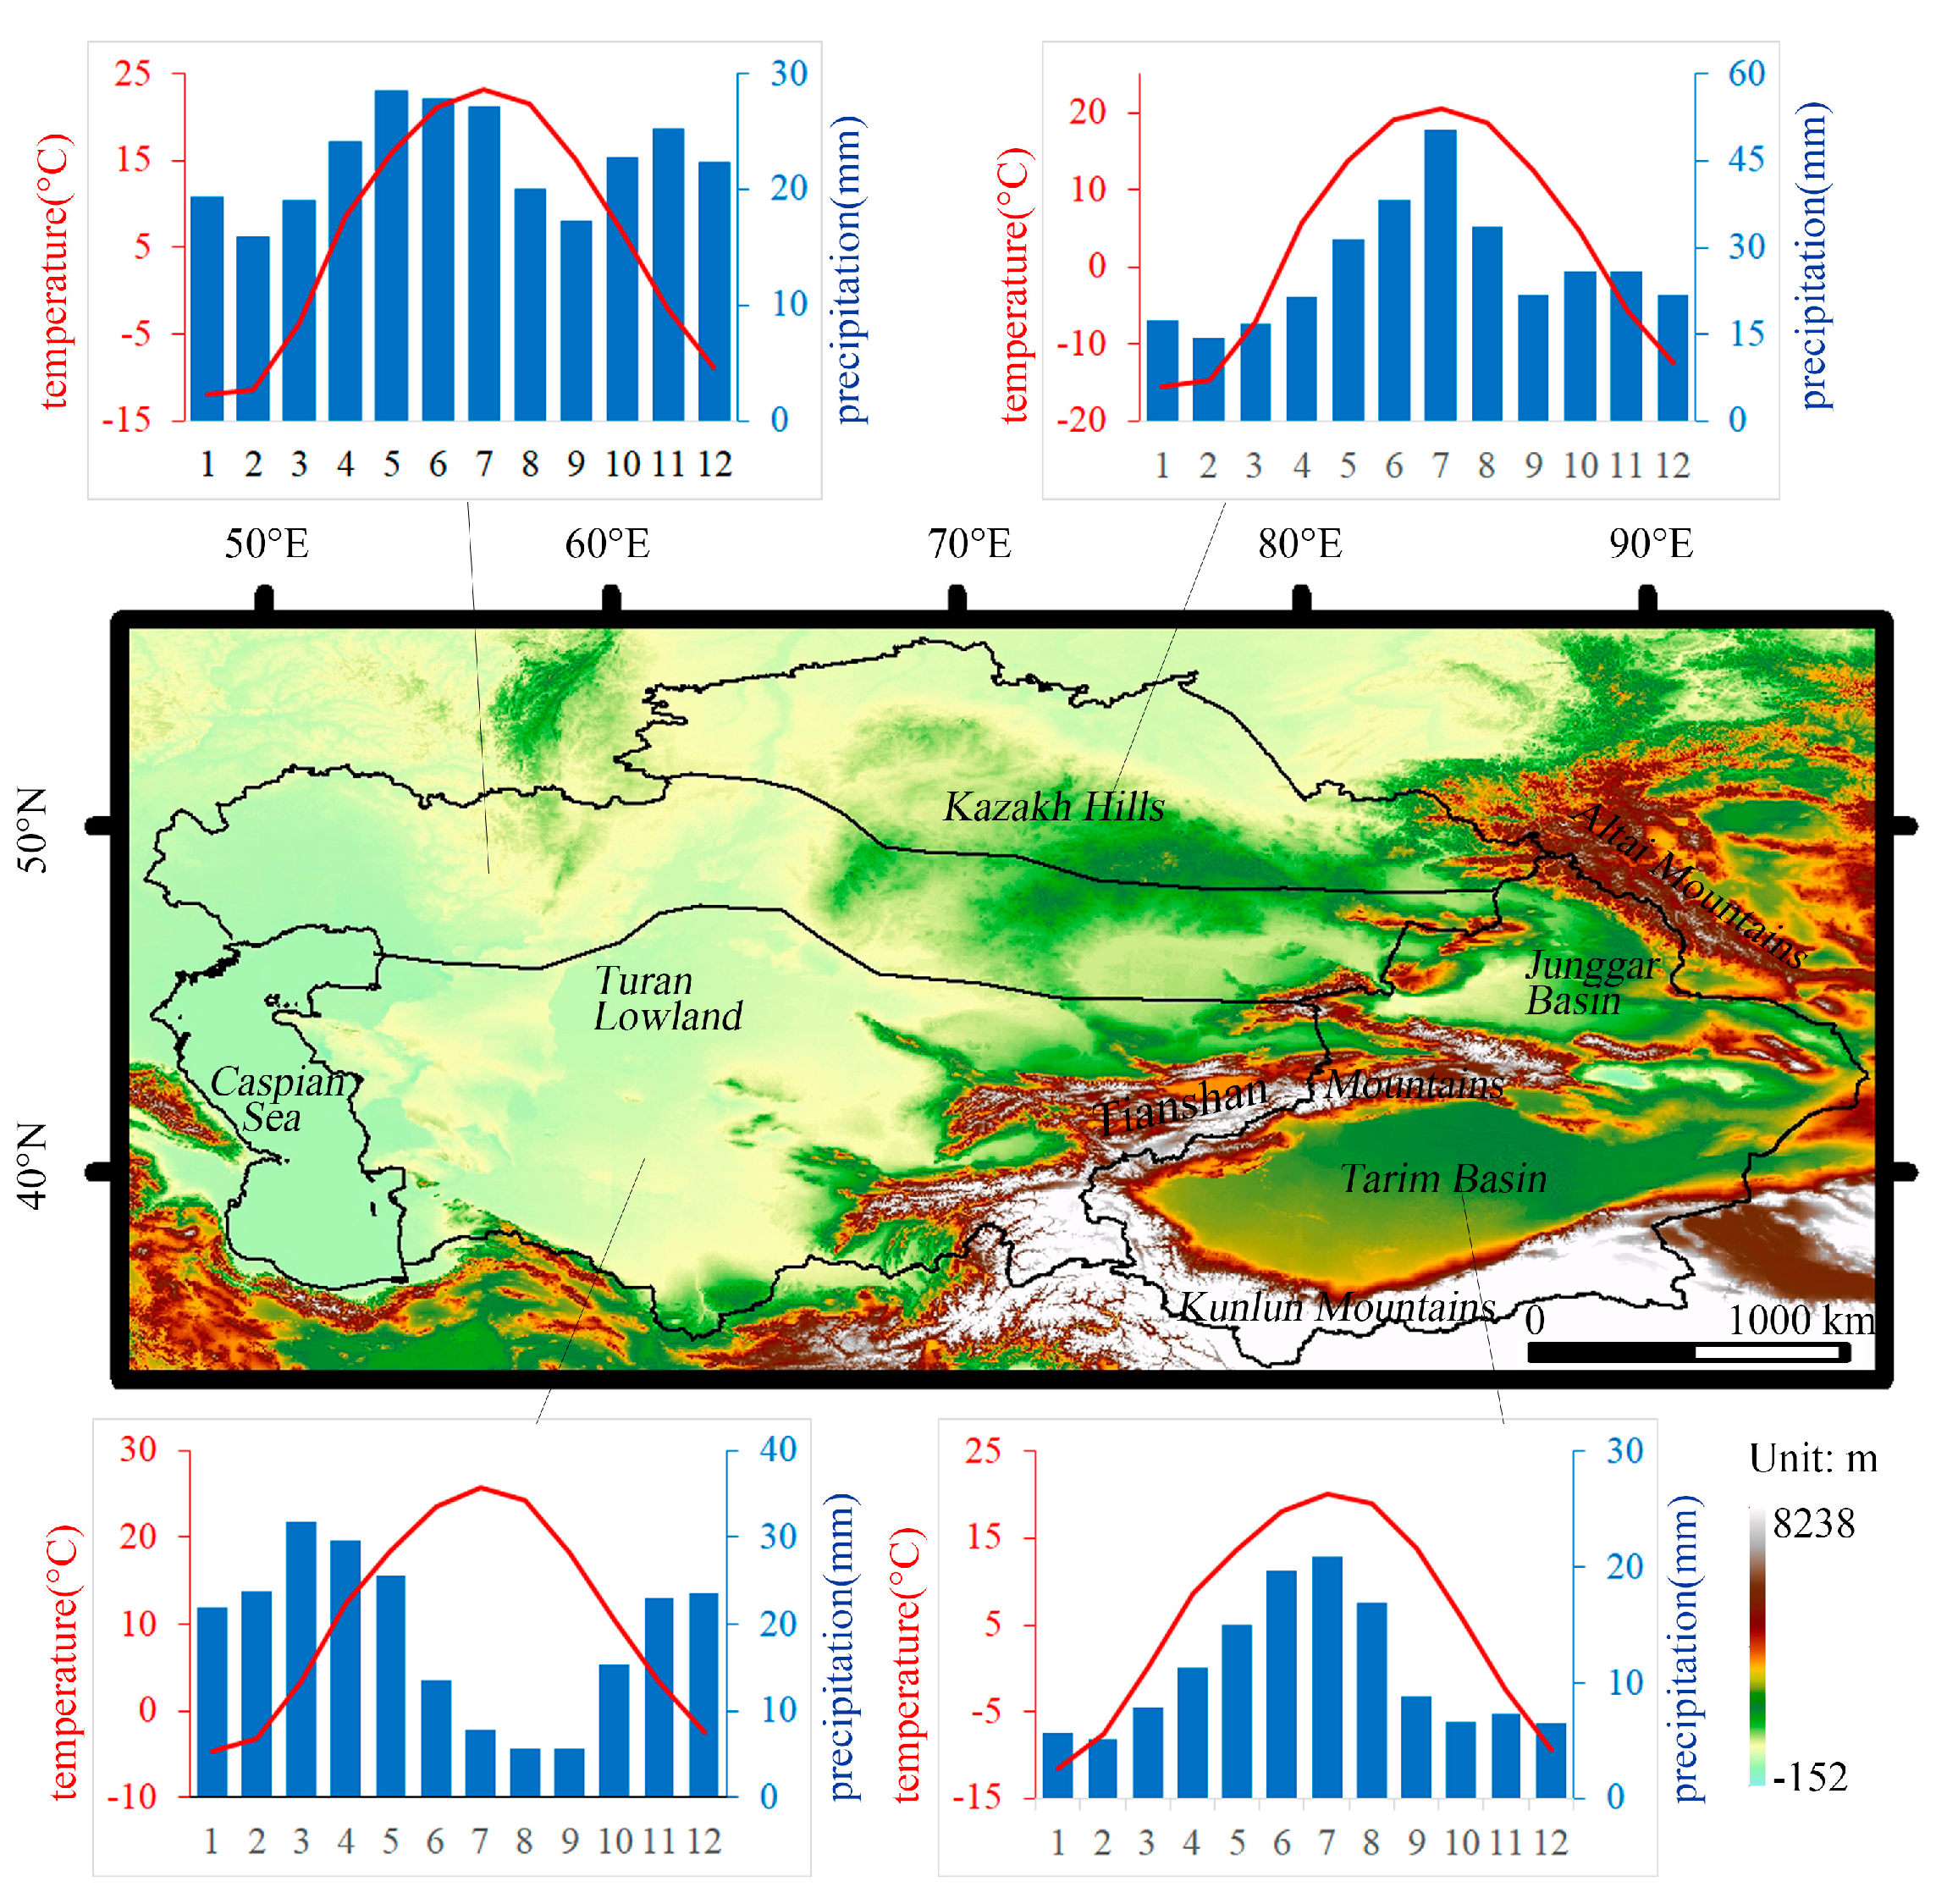
2.1. Study Area

The study region extends between 34°–56° N and 45°–98° E and mainly consists of the Xinjiang Uygur Autonomous Region, China (Xinjiang) and five central Asia states: Kazakhstan, Kyrgyzstan, Tajikistan, Uzbekistan and Turkmenistan (Figure 1). We will refer to this region as Central Asia (CA) [19]. This region is located in the hinterland of Eurasia, has a distinctive continental arid and semiarid climate with hot and dry summers and relatively warm, moist winters in the northwestern part and Xinjiang, while cold winters occur (with an even monthly precipitation) in northwest [20]. The topography of CA is complicated with elevation between 152 m below the sea level to 8238 m above sea level, it appears characterized by a special mountain-basin geomorphology [21]. CA contains many of the highest-altitude mountains, which generates the strong gradients in both temperature and precipitation. CA is controlled by the westerly circulation in the middle-high latitudes and the polar air mass [22]. The precipitation depends on Atlantic humid air mass and the seasonal pattern of precipitation is influenced by the polar air mass from north and Arabian Sea air mass for south [20]. The weak humid air mass carried by westerly circulation from the Arctic and Atlantic to CA intercepted by mountains, which provides dynamic lifting condition for precipitation on the windward slopes [23]. Therefore, the spatial distribution of precipitation in CA is that the maximum rainfall layer on the windward slopes, while on the vast inner Tianshan Mountains leeward slopes, the plains and basins appear scarce precipitation. The temperature is inversely proportional to the latitude and altitude in CA. The spatial distribution of the temperature depends on latitude; it decreases from south to north.

2.2. Data

In order to study the variation of CA’s climatic zones in the historical (1980–2016) and future (2020–2100) periods, three types of datasets (containing both precipitation and 2 m temperature) have been adopted. The latest version V3.1 of Climate Research Unit dataset (CRU) [25] and data from University of Delaware (UDel) [26] are based on interpolation of observational data (abbreviated as OBS). The European Centre for Medium-Range Weather Forecasts Interim Reanalysis data (ECMWF ERA-Interim) [27], the fifth generation of atmosphere reanalysis produced by ECMWF (ERA5) [28] and combination of CRU and National Centers for Environmental Prediction (NCEP) reanalysis data (CRUNCEP) [29] account for reanalysis data (abbreviated as REA) also used in this study, which were applied to investigate the climatic zones shift in historical period. The output of eleven general circulation models (GCMs) during 2020–2100 from Phase 5 of the Coupled Model Intercomparison Project [30] for the low greenhouse gas (GHG) emission scenario RCP2.6, median GHG emission scenario RCP4.5 and high GHG emission RCP8.5 were applied to analyze the future changes in climate zone. Some details on these datasets are provided in Table 1. Those datasets were resampled into 0.5° × 0.5° grids so as to unify the spatial resolution.

2.3. Methodologies

(1) Köppen-Geiger climate classification. The classification scheme identifies 5 major climate types using letters A to E: A tropical (3 subtypes), B dry climate (4 subtypes), C subtropical (9 subtypes), D temperate (12 subtypes) and E polar/mountain climate (2 subtypes). The criteria for each climate types listed in Table 2. Following Peel [18], the Arid climate (B) is identified firstly because of the fact that any locations that satisfy the arid climate criteria could also satisfy the criteria for one of other climate types (A, C, D or E). The other major climate types are mutually exclusive because they are based on temperature only. We also follow the criteria to classify sub-climate types.
(2) The precipitation, temperature and their annual cycle in all datasets were firstly averaged to generate the ensemble dataset in both historical and future periods. Then, based on the Köppen-Geiger classification criteria, we calculated a map of climate zones for each year from 1980 to 2016 and 2020 to 2100 by using ensemble datasets. Once the time series of the grid numbers of each climate zone were determined, we proceeded to the temporal variability analysis according to three methods: firstly, the long-term trend analysis of the area of each climatic zone is using least square regression [31].
slope = n i = 1 n X i Y i i = 1 n X i i = 1 n X Y i n i = 1 n X i 2 ( i = 1 n X i ) 2
where X i and Y i represent the values of the independent variables and dependent variable in the ith year, respectively. n is the cumulative number of years. Where the slope < 0 reveals downward trend of dependent variable, slope > 0 exhibits upward trend of dependent variable.
Secondly, the Mann-Kendall method to test the significance (99% levels of confidence) of climatic zone area changing trend. Due to the abnormally distributed temperature and precipitation, the nonparametric Mann-Kendall test proposed by the World Meteorological Organization has been wildly used for detecting the climate change tendency [1,32]. The Mann-Kendall method is based on the correlation between the ranks of a time series and their time order.
S = i = 1 n 1 ( j = i + 1 n s i g n ( x j x i ) )  
where
s i g n ( x j x i ) = { 1   i f   ( x j x i ) > 0 0   i f   ( x j x i ) = 0 1   i f   ( x j x i ) < 0  
List the data in the order in which they were collected over time, x 1 , x 2 , ..., x n and positive S means an increasing trend for the time series, while negative S means decreasing trend. If the null hypothesis H_0 is true, there is no trend in the data. Then, S can be assumed to be approximately normally distributed with:
{ μ = 0 σ = n ( n 1 ) ( 2 n + 5 ) / 18
The Z score of S is computed from Z = S / σ 0.5 . According to the Z score, the p value can be obtained. In this study, the level of p is 0.01.
Thirdly, so as to explore the contribution of the temperature, precipitation and their annual cycle pattern concerning the climatic zone changes/shifts, a partial correlation analysis method [32,33] was handled in the historical and future periods for each climate type. This method could measure the strength and direction of relationship between two variables, while controlling the other variables that may affect them. Through this mechanism, it is possible to attribute the climatic zone area trend in timing measures to trends in climate variables. The significance of the confident was computed by Student’s t test distribution at significance level of 99%.

2.4. The Definition of Climate-Sensitivity Region

Our research adopted a method to classify the Central Asia climate-sensitivity regions presented by Li [33,34] based on both spatial distribution and temporal variation of climatic types. Comparing the grid’s climatic type to its in last year in each grid, if changed, the record for change plus 1, the accumulation change is m, so the climate sensitivity could be defined as:
k = m / yr
When in historical period (1976–2005), yr is 36; in future period (2020–2100), yr is 80. If k < 0.25, this grid is being defined as climate stable region, if 0.25 ≤ k < 0.5, this grid is defined as low climate sensitive, if 0.5 ≤ k < 0.75, this grid is classified as middle climate sensitive, otherwise, as high climate sensitive.

3. Results

3.1. Spatial Distribution of the Köppen-Geiger Climate Types in CA

Figure 2 shows the spatial distribution of the Köppen-Geiger climate types for three periods based on the different data sources and scenarios. The CA is mainly occupied by arid climatic zone (B), cold temperate climatic zone (D) and polar climatic zone (E) during all periods. The cold desert (BWk) and cold steppe (BSk) is mainly distributed in the Turan lowland, Tarim Basin and Junggar Basin, the hot desert (BWh) and hot steppe (BWk) gradually appeared in Turkmenistan. The cold temperate (without dry season) climatic zone (Dfb and Dfc) is distributed in northern and eastern of Kazakhstan and in the lower mountainous regions. The polar climatic zone (ET) is spread over the Tianshan Mountain, Pamirs and Kunlun Mountains.
Regarding the historical period, the spatial distribution differences of ensemble OBS and ensemble REA is mainly reflected in climatic zone D and B difference in the southern Kazakh Hills and subtype difference of B over the Turan lowland. That might explain by the precipitation in OBS is lower than in REA approx. 15 mm/month, while the 2 m temperature is warmer 0.26 °C, which induced more regions to be classified as dry climatic zone or drier subtype, the B climatic zone derived from the OBS accounts for 17% of total area more than in REA (as shown in Figure 2d).
The spatial distributions of climatic zone under the RCP2.6 scenario for future (2030–2066) and far future (2060–2096) are very similar. However, the scenario of RCP4.5 and RCP8.5 show more hot subtypes and less cold climatic types (or subtypes) in far future. To be specific, the relative area of BWh increases by 2.42% and 5.9% and mainly shifts from BWk, correspondingly it decreases by 1.89% and 5.01% under the RCP4.5 and RCP8.5, respectively. The Dfa augments by 0.92% and 2.14%, mainly transfers from Dfc, which decreases 2.08% and 3.86% under RCP4.5 and RCP8.5, respectively. Due to the priority of B type in Köppen-Geiger criteria, climatic zone ET falls by 0.39% and 1.95% mainly contributed by BSh increase with 0.36% and 2.59% in the lower mountainous regions under RCP4.5 and RCP8.5, respectively (as shown in Figure 2h,l).

3.2. Statistical Analysis of the Evolution of Climate Zones’ Extent

According to the least square regression trend analysis (as shown in Table 3), from 1980 to 2016, the B type exhibited increasing trends, of which BWh and BSh significantly increased at a rate of 2.41 and 3.92 × 10⁴ km2/decade, respectively, while ET however significantly declined (p < 0.01) at a rate of 2.87 × 10⁴ km2/decade. From 2006 to 2100 (under RCP2.6 scenario), relative hot subtypes of B and D climatic zone showed a rising tendency, of which BWh, BSh and Dfa increased at rate of 0.36, 0.48 and 5.76 × 10⁴ km2/decade, respectively, while Dfb, Dfc and ET declined at rate of 2.48, 2.20 and 0.93 × 10⁴ km2/decade. Under RCP4.5 scenario, dry climatic zone exhibited expansion trend, the area of BWh, BWk and BSh risen with rate of 6.24, 4.48 and 1.78 × 10⁴ km2/decade, respectively. The D climatic zone had similar shifts with RCP2.6, the Dfa increased at rate of 6.78 × 10⁴ km2/decade while Dfb and Dfc declined at rate of 2.99 and 7.41 × 10⁴ km2/decade. ET contracted at rate of 2.42 × 10⁴ km2/decade. Under RCP8.5 scenario, most climate types exhibited more pronounced change. The shift of B climatic zone consistent with scenario RCP4.5, BWh, BWk and BSh expanded at rate of 16.53, 12.70 and 7.97 × 10⁴ km2/decade, while BSk decreased with rate of 0.60 × 10⁴ km2/decade. It is noteworthy that temperate climatic zone, Csa increased at rate of 2.39 × 10⁴ km2/decade. Dfa expanded 9.78 × 10⁴ km2/decade, corresponding to Dfb and Dfc shrunk about 3.01 and 14.38 × 10⁴ km2/decade, respectively. ET still contracted with rate by 6.07 × 10⁴ km2/decade (as shown in Table 3).
According to Köppen−Geiger criterion, mean annual precipitation (MAP), mean annual temperature (MAT), temperature of the hottest month (Thot), temperature of the coldest month (Tcold), number of months where the temperature is exceeds 10 (Tmon10), precipitation of driest month (Pdry), precipitation of the driest month in summer (Psdry), precipitation of the driest month in winter (Pwdry), precipitation of the wettest month in summer (Pswet) and precipitation of the wettest month in winter (Pwwet) are main drivers of climate type shifts. The spatial relation between the area change of each climate type and the change in those 10 variables has been analyzed in both the historical and future period.
The results showed that the strengths and sign of the relation varied among the climate types during different periods and under various GHG emission scenarios. In most cases, the trend of climatic zone’s area was attributed to the change of MAT, MAP, Thot, Tcold and Psdry. The positive partial correlation between the BWh area and MAT trends is significantly in historical and future periods (under RCP4.5 and RCP8.5 scenario). The correlation between BWk and MAP stayed negative and strongest throughout historical and future periods and all scenarios, while the area of BWk showed vary trends during the historical and future period. Due to the Tianshan Mountains, the spatial distribution of BWk was split into western and eastern part for which the precipitation exhibited varying trends and projected change tendency are also different with historical periods. The BSh variations were attributed to varying climate factors during different periods. The positive relation of MAT and BSh area was stronger than the Tcold and Pwwet during 1980–2016. However, the partial correlation of BSh and climate factors was different in future, Thot had a stronger positive relation under RCP2.6 scenario, MAP showed stronger negative relation under RCP4.5 scenario, while Tmon10 had stronger positive under RCP8.5 scenarios. The area change of BSk was mainly the result of the precipitation change, MAP had a stronger negative relation during the historical and future period (under RCP2.6 scenario), Pswet had a positive relation under RCP4.5 and Tmon10 had stronger correlation under RCP8.5 scenario.
The increase in area of Csa shows a stronger positive correlation with Tcold. The contraction of Dsb demonstrates negative relation with Thot during the historical and future period under RCP2.6 scenario, while it showed a negative correlation with MAP and MAT under RCP4.5 and RCP8.5, respectively. The Dfa shift was dominated by change of Thot, which illustrated a stronger positive relation during both periods and all scenarios. In contrast, the change of Dfa showed a negative relation with Thot. A positive correlation between Dfc and Psdry change during historical period, negative relation between Dfc and Thot, MAT and Thot change under RCP2.6, RCP4.5 and RCP8.5 scenario, respectively.
ET contraction was mainly induced by temperature change, the MAT of historical and future period under RCP4.5 and RCP8.5 revealed negative relation with shift of ET, while under RCP2.6, the ET’s area change was attribute to Thot.

3.3. Climate−Sensitivity Intensity and Spatial Distribution

According to the defined method of evaluated climate sensitive, we calculated the historical and future period climate−sensitivity based on ensemble datasets firstly. As shown in Figure 3a–d, the left panel represents the intensity of the climate−sensitivity, the region with extremely stable climate type mainly distributes in standalone Taklimakan desert (inland of the Tarim Basin) in historical period, while in future period, the climatic zone of Gurbantunggut desert (inland of the Junggar Basin), Karakum and Kyzylkum desert (Turan Lowland) also maintaining stability in all scenarios. The regions under relatively stable climatic zone are in the middle and southern Kazakhstan regarding the spatial distribution. The regions under relatively high climate sensitivity are mainly spread over the Kazakh Hills and northern Xinjiang. The regions under frequent climatic zone shift are distributed over the plains at northern side of Kazakh Hills during the historical period. Less grids showed a high climate−sensitivity and sporadically distributed in northern of study area in future period.
To reduce the uncertainty associated with the ensemble dataset and improve the reliability of the climate−sensitive results, we further calculated the climate−sensitivity of each standalone data sources. If the grid’s index greater than 0.5 in any of the datasets, this grid will accumulate 1. The grid with a higher value indicates that more data sources defined it as a high risk will occur climatic zone shifts. During historical period, all five data sources defined the region in the north of 50° N as high climate−sensitivity region, and 3–4 data sources regarded approx. 500 km region in western side of the national boundary line of China, Xinjiang and Kazakhstan and Yili River valley as high climate−sensitivity regions (as shown in Figure 3d).
Under future scenarios, most data sources defined the plain in northern side of the Kazakh Hills and the region over the east side of the Altai Mountains (western part of Mongolia) as high climate−sensitivity region. More than half of the data sources stipulated the Yili River valley as high climate−sensitivity region. One third of the data sources considered eastern Kyrgyzstan and the south rim of the Tarim Basin as high climate−sensitivity. Under RCP4.5 and RCP8.5 scenarios, the spatial distribution of the regions will experience frequent climate type shifts similar to the scenario RCP2.6 but with more data sources defined the Yili River valley as a high climate−sensitivity region (as shown in Figure 3f–h).

4. Discussion

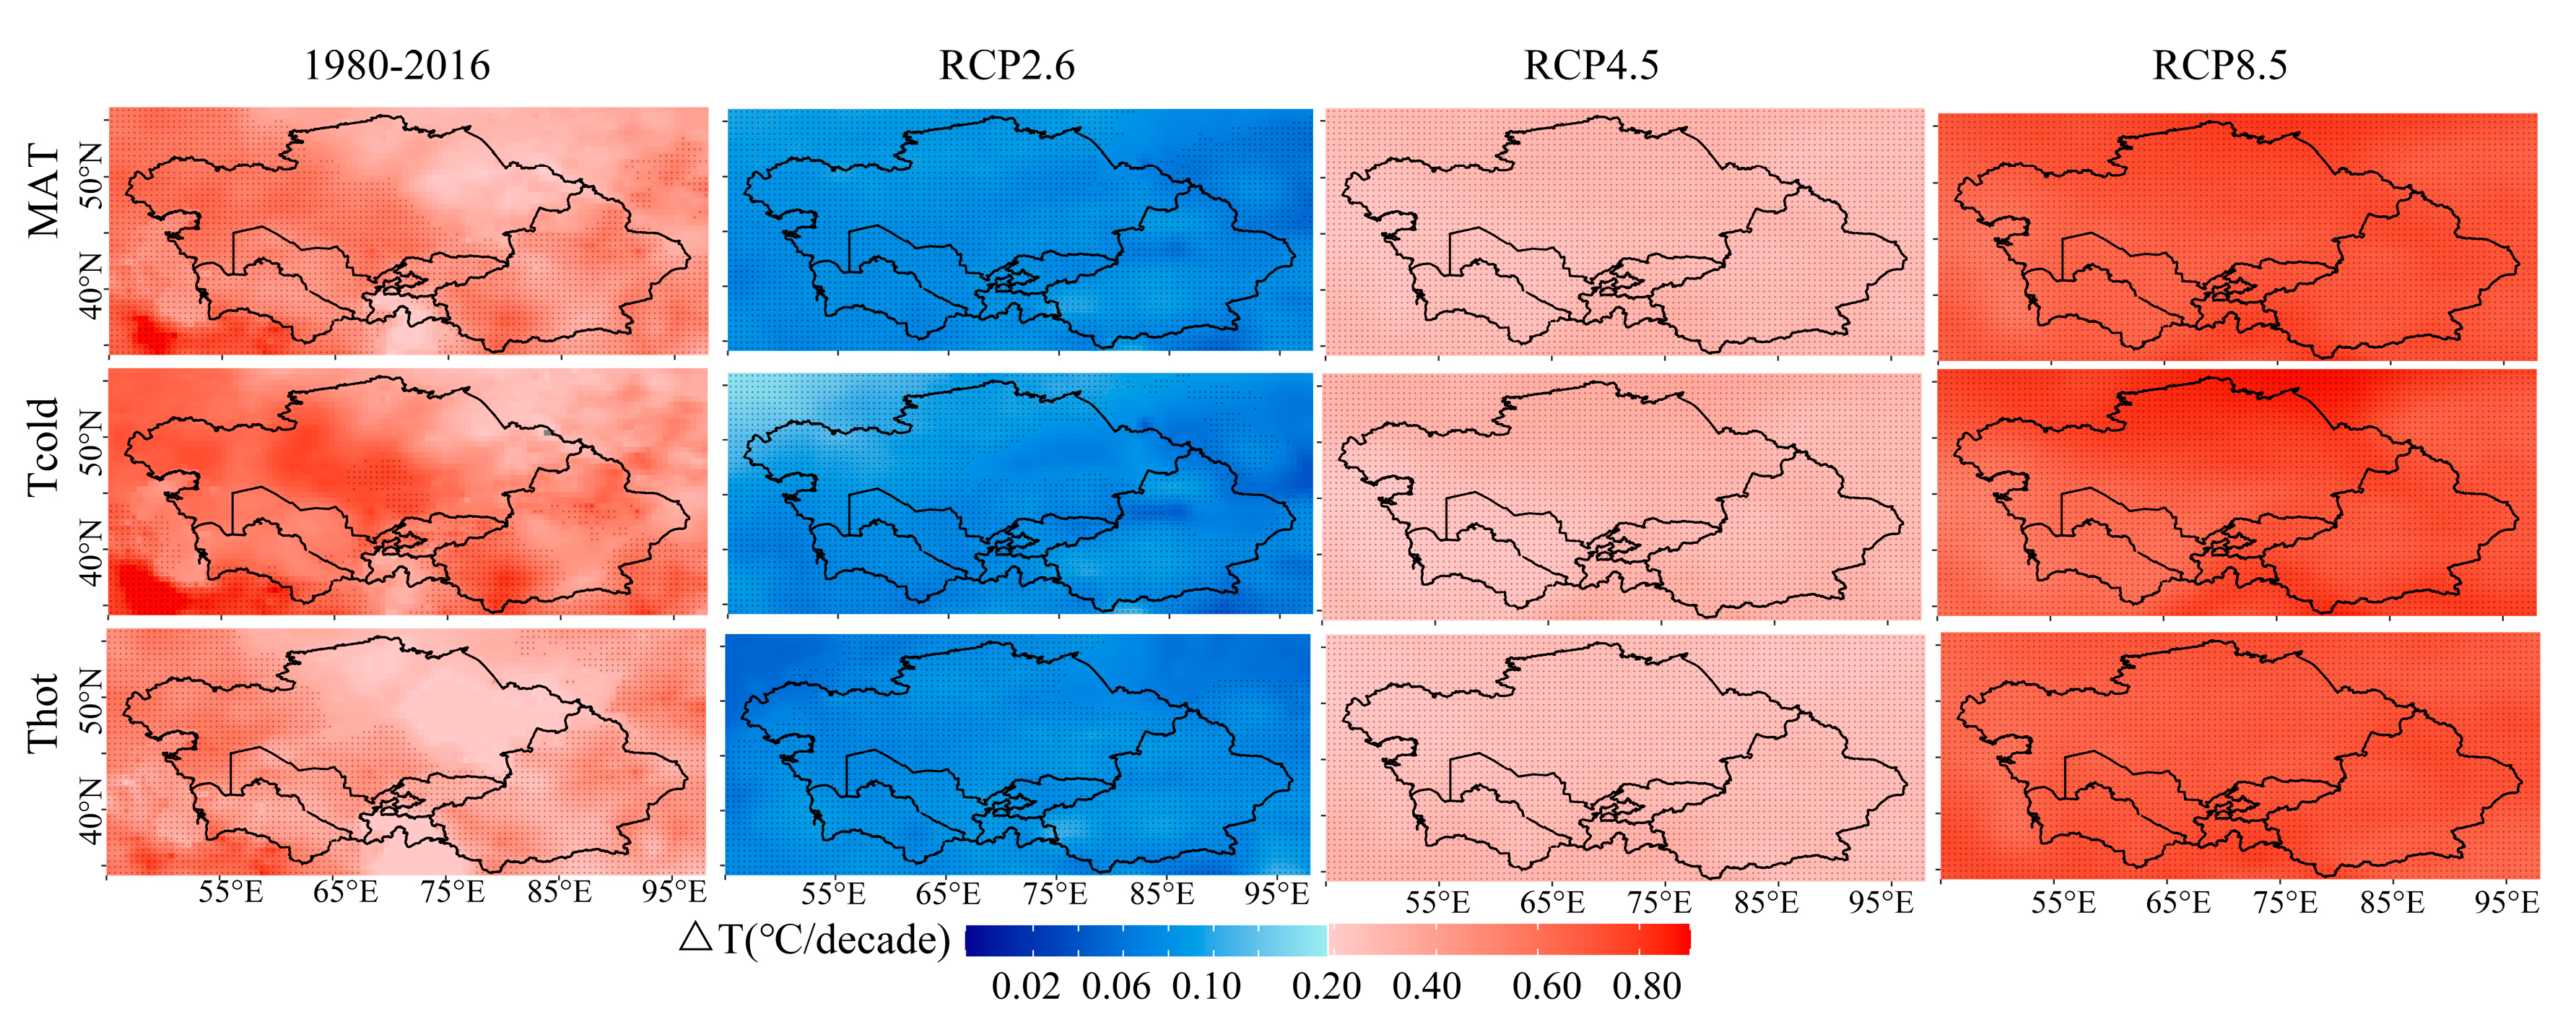
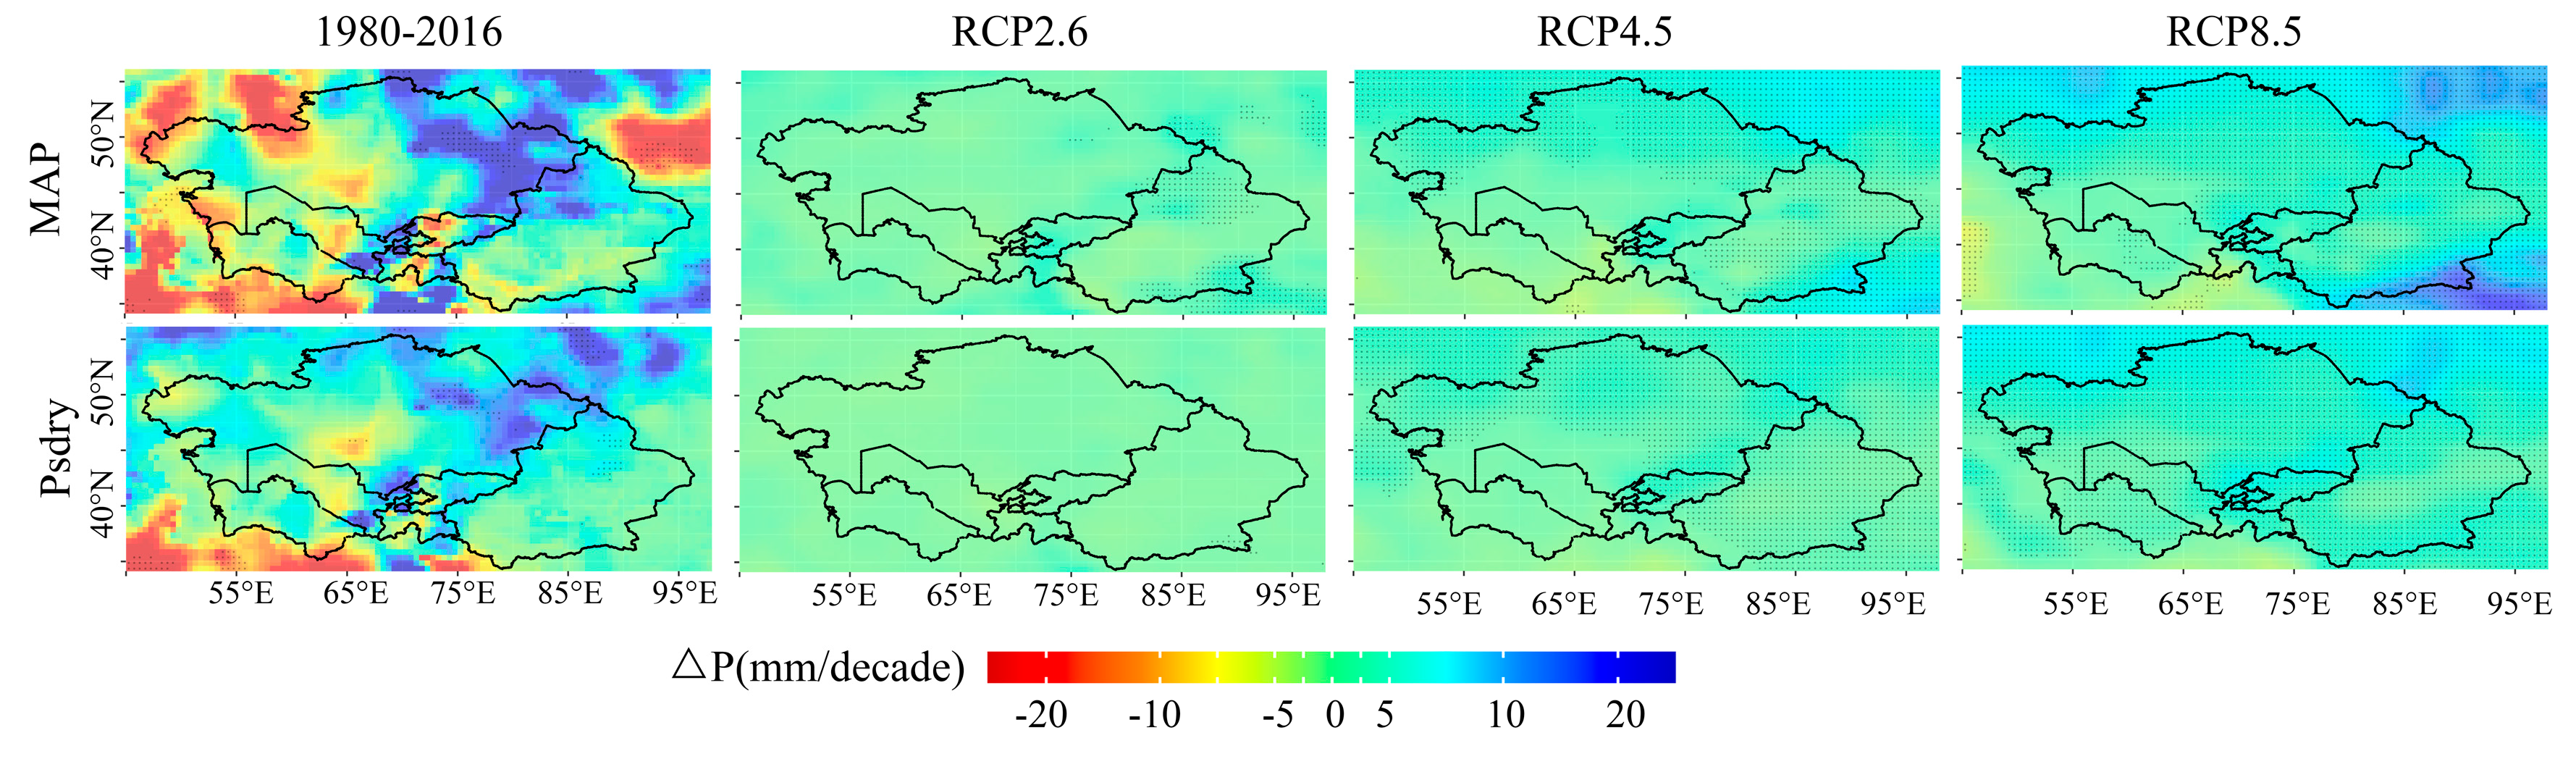
4.1. Projected Changes in Precipitation and Temperature

Köppen−Geiger climate classification is defined by temperature and precipitation and their annual cycle [18]. As mentioned in Section 3.2, annual mean temperature, annual accumulated precipitation, the temperature in hottest and coldest month and precipitation of the direst month in summer are attributed to dominant factors in affecting each climatic zone’s area. Therefore, the projected changes in both variables have been analyzed by least square fitting method to capture tendency and Mann−Kendall method to test the significance (99% level of confidence).
Figure 4 shows the spatiotemporal distribution of temperature variation during the historical (1980–2016) and future (2020–2100) period. The entire region has experienced quick warming-up processes (0.2–0.7 °C/decade) in historical period, which is consistent with previous work [6,35] and projected to continue warming up in future period under RCP4.5 (0.23–0.40 °C/decadal) and RCP8.5 (0.52–0.90°C/decadal) scenarios that is in line with the statistical downscaling results [6,34], while the annually temperature change under RCP2.6 illustrates a slightly warming up (0.02–0.10 °C/decadal) in CA. The warming rate of coldest months was quicker than in hottest months. The spatial distribution of change rates was not exactly same, the western of study area had higher warming rate than the eastern part in historical period and temperature in southern region rose faster than in north. However, temperature change rate in the future period had the opposite pattern, the northern region had higher increasing rate than in south, which corresponds to previous work that acceleration of warming rate is associated with the increase of latitudes.
The change rates of precipitation are heterogeneous (Figure 5) for both spatial and temporal distribution. During the historical period, the rate of historical precipitation is in range of −20–22 mm/decade. During 1980–2016, the plains located in northern Kazakh Hills and Junggar Basin showed an obvious increasing MAP, while the southern part of the study area illustrated decreasing rainfall. The changes in MAP have a nonuniform spatial distribution under three GHG emission scenarios. Under RCP2.6, most part of the region had a slightly wetting trend (0–2 mm/decadal). Under the RCP4.5 and RCP8.5, the MAP changing rate had slight declined in the southern part of study area (including Turkmenistan and northern Iranian plateau), while the other region illustrated increasing tendency, especially in the northern study area. The driest precipitation in summer had similar changing pattern but with smaller rate.

4.2. Comparison of This Study with Prior Studies

Regarding to the present Köppen−Geiger climate classification map, our result is similar with most existing global maps [2,3,4,12,13,35,36]. However, compared to the Köppen−Geiger climate classification map provided by Hylke et al. [5,12], our results show less region covered by arid climatic zone but colder temperate climatic zone in north Kazakhstan and area of tundra climatic zone is larger in Tianshan Mountains and Kunlun Mountains. Regarding the future Köppen−Geiger climate classification map, the main climate types in this study are similar with existing maps [6,7,12,13], while the map based on multiple GCMs under RCP8.5 in 2070–2100 is poleward in spatial distribution [8] than in our results.
The temporal evolution characteristics of Köppen climate types in this study are consistent with conclusions derive from global scale analysis [4,9,10,12]. According to the time series of relative occupied Köppen types in exiting work, arid climatic zone rises [13,37], while tundra climatic zone declines in Asia during the second half of the last century [11,16]. The area of B, C, D and E Köppen climate types are projected to shift poleward in both RCP4.5 and RCP8.5 scenario [8,12,37], which present in this study is warmer or dryer subtypes are projected shift northward.
In recent decades, Central Asia has experienced the fastest warming (0.4 °C/decadal) in the world and also received large amount of attention worldwide [6,7,38]. Considerable research efforts have drawn the conclusions that warming trend in 2 m temperature in Central Asia is based on different data sources in both historical period and future period. The warming rates are based on three reanalysis datasets (MERRA, CFSR and ERA−Interim), amount to 0.36 °C/decade and CRU possesses a larger rate about 0.42 °C/decade during the period from 1979 to 2011 [6]. The study based on statistical downscaling of GCMs under RCP4.5 reveals that the projected temperature shows an ascending trend at a rate of 0.37 °C/decade [35]. Although different data sources have dispute in variation strengths, the sign is similar.
In comparison, big uncertainties of the variation characteristics in precipitation have been noticed. Annual precipitation shows an increasing trend (0.7 mm/decade) in entire region based on CRU during 1930 to 2009, and the mountainous area demonstrates a greater rising trend than the entire region [7,35,39,40]. However, the result that based on Global Precipitation Climatology Center data shows no significant trend in annual cumulative precipitation, except for the precipitation in winter which rate is 1.1 mm/decade during 1960–2013 [24]. The study based on statistical downscaling of GCMs under RCP4.5 reveals that the projected precipitation exhibits an increasing tendency with a rate of 4.63 mm/decade [34,35]. These excellent studies describe the single variable (temperature or precipitation) detailed variations during the historical and future period are auxiliary evidences to prove the spatiotemporal characteristic of Köppen climate type shifts in Central Asia.

4.3. Uncertainties

The climate classification method of Köppen−Geiger could effectively indicate the climate−sensitivity region, where contain potential areas for ecosystem fluctuations, changes in plant community, development strategies for agriculture, livestock and planting structure that need to be adjusted [11]. In the arid and semiarid region, these regions should pay more attention to ecological maintenance. However, it also should be noted that the criteria of Köppen−Geiger have a large threshold span for different climate types [11]. Consequently, climate types that are situated near the threshold of criteria are more likely to shift. Therefore, although the entire region experienced strong climate variability, the regions of which climate types have shifted were mostly distributed in areas that are located near the boundary of different climate types.
The spatial shifts and temporal evolution of each climatic zone are investigated based on ensemble dataset in this study. On the one hand, the ensemble dataset results from different members averaged together to reduce the spread of uncertainties [13,41,42]; on the other hand, ensemble dataset masked the variability between members, which results from different GCMs developed based on dissimilar physical laws and physical−based empirical relationships [14,41]. We used ensemble data to assess the spatial and temporal variations of climatic zone, which might conceal the extreme climate change [43].

5. Conclusions

The spatial shifts and temporal evolution of the surface extent of Central Asia’s climatic zones as defined by Köppen−Geiger criteria were analyzed for the period 1980–2100 by adopting two observational datasets, three reanalysis datasets and eleven GCMs. In this study, the Köppen−Geiger climatic zone maps were generated for historical, near future and far future period and providing for other research purposes and emphasize the potential high-risk areas that might experience frequent climate type shifts, try to provide useful information in development mitigate strategies to face the warming threaten. Three significant findings were found in this analysis:
(1)
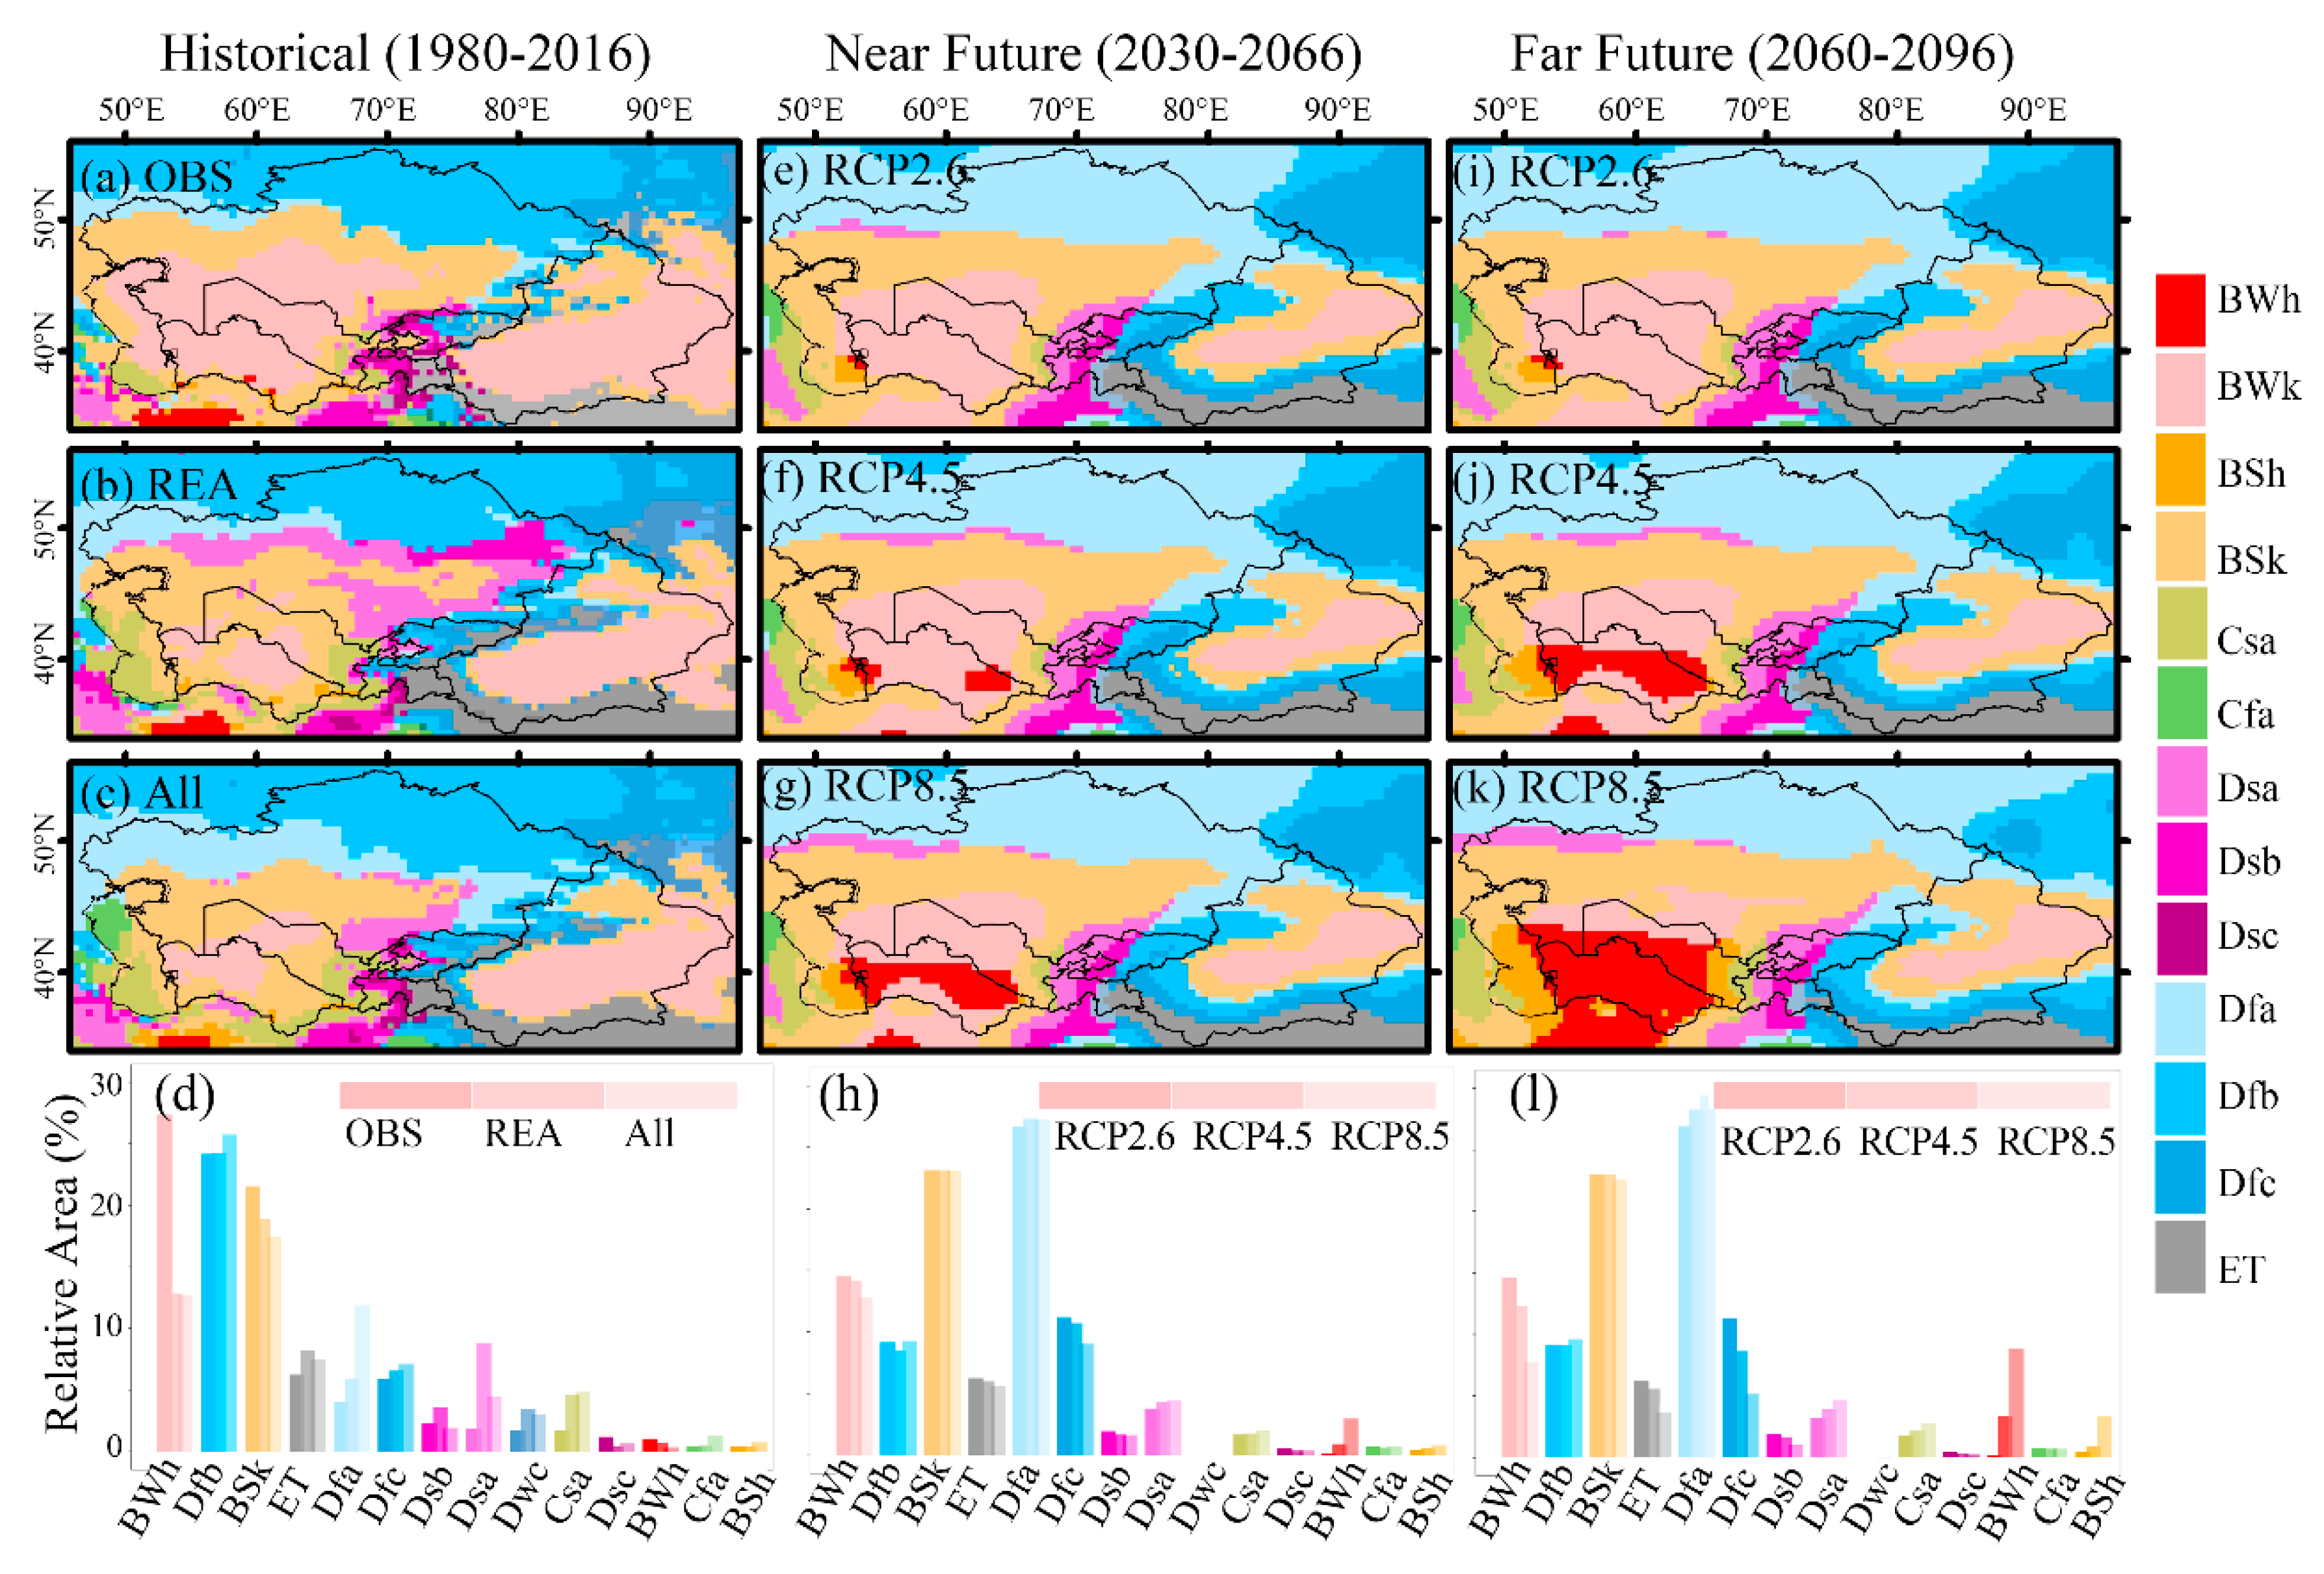
Although the proportions of climatic zones vary in different periods and emission scenarios, the arid climatic zone (B) (36–43%) and cold temperate climatic zone (D) (50–55%) dominated the Central Asia.
(2)
In both the historical and future period, the hotter and dryer subtypes of B (BWh and BSh) gradually cover more surface area in Turkmenistan and the northern Iranian Plateau, the area covered by ET shrunk in lower region of Kunlun Mountains and Tianshan Mountains. The other trends of climate type shifts did not pass the significant test during historical. However, under RCP4.5, the area covered by BWk declined and altered by BWh and BSh expansion with a rate of 25.01 and 7.13 grids/decade. The temperate climate zone and warmer subtype of D (Dfa) augmented with a rate of 6.60 and 27.15 grids/decade, which caused the downsizing in area covered by Dfb and Dfc under RCP4.5 scenario. The climatic zone shifts under RCP8.5 and RCP2.6 scenario are similar to RCP4.5 but with pronounced and small magnitude, respectively. The climate type shifts were mainly a consequence of variations of mean annual temperature, accumulate annual precipitation, temperature in hottest month and maximum precipitation in winter months.
(3)
In both periods and all GHG emission scenarios, the Taklimakan, Gurbantunggut, Karakum and Kyzylkum desert maintained stable arid climate type, while in the Kazakh Hills and its northern region and the Ili River valley showed a higher climate-sensitivity and might experience more frequent climatic zone shifts; the index calculated this by ensemble dataset and it was confirmed by multiple data sources.

Author Contributions

For research articles with several authors, a short paragraph specifying their individual contributions must be provided. H.H. and G.L.; Data curation, H.H. and A.K.; Formal analysis, H.H.; Methodology, H.H., P.C. and J.L.; Software, H.H.; Supervision, G.L., P.T. and P.D.M.; Writing—original draft, H.H.; Writing—review and editing, H.H., G.L., P.C., R.H., P.T. and P.D.M. All authors have read and agreed to the published version of the manuscript.

Funding

This research was jointly supported by the regional collaborative innovation project of Xinjiang (Grant No. 2020E01042), the National Natural Science Foundation of China (Grant No. U1803243, 41877012), and China Academy of Sciences President’s International Fellowship Initiative (PIFI) (Grant No. 2018VMB0006, 2017VCA0002).

Institutional Review Board Statement

Not applicable.

Informed Consent Statement

Not applicable.

Data Availability Statement

Not applicable.

Acknowledgments

We want to thank the editor and anonymous reviewers for their valuable comments and suggestions to this paper.

Conflicts of Interest

The authors declare no conflict of interest.

References

  1. Qin, D.; Plattner, G.; Tignor, M.; Allen, S.; Boschung, J.; Nauels, A.; Xia, Y.; Bex, V.; Midgley, P. Climate Change 2013: The Physical Science Basis. Contribution of Working Group I to the Fifth Assessment Report of the Intergovernmental Panel on Climate Change. Available online: https://www.ipcc.ch/site/assets/uploads/2018/03/WG1AR5_SummaryVolume_FINAL.pdf (accessed on 18 December 2020).
  2. Mooney, H.A.; Vitousek, P.M.; Matson, P.A. Exchange of materials between terrestrial ecosystems and the atmosphere. Science 1987, 238, 926–932. [Google Scholar] [CrossRef] [PubMed]
  3. Hoegh-Guldberg, O.; Jacob, D.; Bindi, M.; Brown, S.; Camilloni, I.; Diedhiou, A.; Djalante, R.; Ebi, K.; Engelbrecht, F.; Guiot, J. Impacts of 1.5 °C Global Warming on Natural and Human Systems. In Global Warming of 1.5 °C; An IPCC Special Report; IPCC Secretariat: Geneva, Switzerland, 2018. [Google Scholar]
  4. Ezcurra, E. Global Deserts Outlook; UNEP/Earthprint: Hertfordshire, UK, 2006. [Google Scholar]
  5. Yu, Y.; Pi, Y.; Yu, X.; Ta, Z.; Sun, L.; Disse, M.; Zeng, F.; Li, Y.; Chen, X.; Yu, R. Climate change, water resources and sustainable development in the arid and semi-arid lands of Central Asia in the past 30 years. J. Arid Land 2019, 11, 1–14. [Google Scholar] [CrossRef] [Green Version]
  6. Hu, Z.; Zhang, C.; Hu, Q.; Tian, H. Temperature Changes in Central Asia from 1979 to 2011 Based on Multiple Datasets. J. Clim. 2014, 27, 1143–1167. [Google Scholar] [CrossRef]
  7. Huang, J.; Ji, M.; Xie, Y.; Wang, S.; He, Y.; Ran, J. Global semi-arid climate change over last 60 years. Clim. Dyn. 2016, 46, 1131–1150. [Google Scholar] [CrossRef] [Green Version]
  8. Feng, S.; Hu, Q.; Huang, W.; Ho, C.-H.; Li, R.; Tang, Z. Projected climate regime shift under future global warming from multi-model, multi-scenario CMIP5 simulations. Glob. Planet. Chang. 2014, 112, 41–52. [Google Scholar] [CrossRef]
  9. Barry, R.G.; Chorley, R.J. Atmosphere, Weather and Climate; Routledge: New York, NY, USA, 2009. [Google Scholar]
  10. Cramer, W.P.; Leemans, R. Assessing impacts of climate change on vegetation using climate classification systems. In Vegetation Dynamics & Global Change; Springer: Boston, MA, USA, 1993; pp. 190–217. [Google Scholar]
  11. Belda, M.; Holtanová, E.; Halenka, T.; Kalvová, J. Climate classification revisited: From Köppen to Trewartha. Clim. Res. 2014, 59, 1–13. [Google Scholar] [CrossRef] [Green Version]
  12. Beck, H.E.; Zimmermann, N.E.; McVicar, T.R.; Vergopolan, N.; Berg, A.; Wood, E.F. Present and future Köppen-Geiger climate classification maps at 1-km resolution. Sci. Data 2018, 5, 180214, Correction in: 2020, 7, 1–2. [Google Scholar] [CrossRef] [PubMed] [Green Version]
  13. Chen, D.; Chen, H.W. Using the Köppen classification to quantify climate variation and change: An example for 1901–2010. Environ. Dev. 2013, 6, 69–79. [Google Scholar] [CrossRef]
  14. Feng, S.; Ho, C.-H.; Hu, Q.; Oglesby, R.J.; Jeong, S.-J.; Kim, B.-M. Evaluating observed and projected future climate changes for the Arctic using the Köppen-Trewartha climate classification. Clim. Dyn. 2012, 38, 1359–1373. [Google Scholar] [CrossRef] [Green Version]
  15. Chan, D.; Wu, Q. Significant anthropogenic-induced changes of climate classes since 1950. Sci. Rep. 2015, 5, 13487. [Google Scholar] [CrossRef] [Green Version]
  16. Wang, M.; Overland, J.E. Detecting Arctic climate change using Köppen climate classification. Clim. Chang. 2004, 67, 43–62. [Google Scholar] [CrossRef]
  17. Schiemann, R.; Lüthi, D.; Vidale, P.L.; Schär, C. The precipitation climate of Central Asia—Intercomparison of observational and numerical data sources in a remote semiarid region. Int. J. Climatol. 2008, 28, 295–314. [Google Scholar] [CrossRef]
  18. Peel, M.C.; Finlayson, B.L.; McMahon, T.A. Updated World Map of the Köppen-Geiger Climate Classification. Hydrol. Earth Syst. Sci. 2007, 11, 1633–1644. [Google Scholar] [CrossRef] [Green Version]
  19. Cowan, P.J. Geographic usage of the terms Middle Asia and Central Asia. J. Arid Environ. 2007, 69, 359–363. [Google Scholar] [CrossRef]
  20. Kharlamova, N.; Revyakin, V. Regional climate and environmental change in Central Asia. In Environmental Security and Sustainable Land Use-with Special Reference to Central Asia; Springer: Dordrecht, The Netherlands, 2006; pp. 19–26. [Google Scholar]
  21. Lioubimtseva, E.; Henebry, G.M. Climate and environmental change in arid Central Asia: Impacts, vulnerability, and adaptations. J. Arid Environ. 2009, 73, 963–977. [Google Scholar] [CrossRef]
  22. Hu, R.; Jiang, F.; Wang, Y.; Li, J.; Li, Y.; Abdimijit, A.; Luo, G.; Zhang, J. Arid ecological and geographical conditions in five countries of Central Asia. Arid Zone Res. 2014, 31, 1–12. [Google Scholar]
  23. Bothe, O.; Fraedrich, K.; Zhu, X. Precipitation climate of Central Asia and the large-scale atmospheric circulation. Theor. Appl. Climatol. 2012, 108, 345–354. [Google Scholar] [CrossRef]
  24. Song, S.; Bai, J. Increasing Winter Precipitation over Arid Central Asia under Global Warming. Atmosphere 2016, 7, 139. [Google Scholar] [CrossRef] [Green Version]
  25. Harris, I.; Jones, P.D.; Osborn, T.J.; Lister, D.H. Updated high-resolution grids of monthly climatic observations–the CRU TS3. 10 Dataset. Int. J. Climatol. 2014, 34, 623–642. [Google Scholar] [CrossRef] [Green Version]
  26. Willmott, C.J.; Matsuura, K. Terrestrial Air Temperature and Precipitation: Monthly and Annual Time Series (1950–1999) Version 1.02; Center for Climatic Research, University of Delaware: Newark, Delaware, 2001. [Google Scholar]
  27. Dee, D.P.; Uppala, S.M.; Simmons, A.; Berrisford, P.; Poli, P.; Kobayashi, S.; Andrae, U.; Balmaseda, M.; Balsamo, G.; Bauer, D.P. The ERA-Interim reanalysis: Configuration and performance of the data assimilation system. Q. J. R. Meteorol. Soc. 2011, 137, 553–597. [Google Scholar] [CrossRef]
  28. Hersbach, H.; Bell, B.; Berrisford, P.; Hirahara, S.; Horányi, A.; Muñoz-Sabater, J.; Nicolas, J.; Peubey, C.; Radu, R.; Schepers, D. The ERA5 global reanalysis. Q. J. R. Meteorol. Soc. 2020, 146, 1999–2049. [Google Scholar] [CrossRef]
  29. Viovy, N. CRUNCEP Version 7-Atmospheric Forcing Data for the Community Land Model; Research Data Archive at the National Center for Atmospheric Research; Computational and Information Systems Laboratory: Boulder CO, USA, 2018. [Google Scholar]
  30. Taylor, K.E.; Stouffer, R.J.; Meehl, G.A. An overview of CMIP5 and the experiment design. Bull. Am. Meteorol. Soc. 2012, 93, 485–498. [Google Scholar] [CrossRef] [Green Version]
  31. Madsen, H. Time Series Analysis; CRC Press: Boca Raton, FL, USA, 2007. [Google Scholar]
  32. Hamed, K.H. Trend detection in hydrologic data: The Mann–Kendall trend test under the scaling hypothesis. J. Hydrol. 2008, 349, 350–363. [Google Scholar] [CrossRef]
  33. Zhang, P.; Cai, Y.; Yang, W.; Yi, Y.; Yang, Z.; Fu, Q. Contributions of climatic and anthropogenic drivers to vegetation dynamics indicated by NDVI in a large dam-reservoir-river system. J. Clean. Prod. 2020, 256, 120477. [Google Scholar] [CrossRef]
  34. Li, Y.; Zhu, G. A new definition method of climate-sensitive region and its prediction. Acta Geogr. Sin. 2018, 73, 1283–1295. [Google Scholar]
  35. Luo, M.; Liu, T.; Meng, F.; Duan, Y.; Bao, A.; Frankl, A.; De Maeyer, P. Spatiotemporal characteristics of future changes in precipitation and temperature in Central Asia. Int. J. Climatol. 2019, 39, 1571–1588. [Google Scholar] [CrossRef]
  36. Rubel, F.; Kottek, M. Observed and projected climate shifts 1901–2100 depicted by world maps of the Köppen-Geiger climate classification. Meteorol. Z. 2010, 19, 135–141. [Google Scholar] [CrossRef] [Green Version]
  37. Jo, S.; Ahn, J.B.; Cha, D.h.; Min, S.K.; Suh, M.S.; Byun, Y.H.; Kim, J.U. The Köppen-Trewartha Climate-Type Changes over the CORDEX-East Asia Phase 2 Domain Under 2 and 3° C Global Warming. Geophys. Res. Lett. 2019, 46, 14030–14041. [Google Scholar] [CrossRef] [Green Version]
  38. Beck, C.; Grieser, J.; Kottek, M.; Rubel, F.; Rudolf, B. Characterizing global climate change by means of Köppen climate classification. Klimastatusbericht 2005, 51, 139–149. [Google Scholar]
  39. Huang, J.-p.; Guan, X.-d.; Ji, F. Enhanced cold-season warming in semi-arid regions. Atmos. Chem. Phys. 2012, 12, 5391. [Google Scholar] [CrossRef] [Green Version]
  40. Chen, F.; Huang, W.; Jin, L.; Chen, J.; Wang, J. Spatiotemporal precipitation variations in the arid Central Asia in the context of global warming. Sci. China Earth Sci. 2011, 54, 1812–1821. [Google Scholar] [CrossRef]
  41. Hassan, I.; Kalin, R.M.; White, C.J.; Aladejana, J.A. Selection of CMIP5 GCM ensemble for the projection of Spatio-temporal changes in precipitation and temperature over the Niger Delta, Nigeria. Water 2020, 12, 385. [Google Scholar] [CrossRef] [Green Version]
  42. Jiang, D.; Tian, Z.; Lang, X. Reliability of climate models for China through the IPCC Third to Fifth Assessment Reports. Int. J. Climatol. 2016, 36, 1114–1133. [Google Scholar] [CrossRef]
  43. Deng, Z.; Qiu, X.; Liu, J.; Madras, N.; Wang, X.; Zhu, H. Trend in frequency of extreme precipitation events over Ontario from ensembles of multiple GCMs. Clim. Dyn. 2016, 46, 2909–2921. [Google Scholar] [CrossRef]
Figure 1. The study area, temperature and precipitation’s annual cycle of four subregions in Central Asia. The subregions referred to a cluster method [24]. The temperature and precipitation were derived from Climate Research Unit dataset (CRU) during the period 19802016.
Atmosphere 12 00123 g001
Figure 2. Spatial distribution of climatic zone in Central Asia based on Köppen-Geiger climate classification. (ac): for historical period derived from observational datasets (OBS), reanalysis datasets (REA) and ensemble dataset (All), respectively. (eg): estimated climatic zone for near future (2030–2066) under RCP2.6, RCP4.5 and RCP8.5 scenarios based on ensemble GCMs, respectively. (ik): estimated climatic zone for far future (2060–2096) under RCP2.6, RCP4.5 and RCP8.5 scenarios based on ensemble GCMs, respectively. (d,h,l) are relative area of each climate type in total area during historical period, near future and far future, respectively. The different transparency represents the different data source or Representative Concentration Pathway. The color scheme was adopted from Peel et al. [18].
Atmosphere 12 00123 g002
Figure 3. The spatial distribution of the climate−sensitivity regions based on Köppen−Geiger classification. The intensity of the climate−sensitivity of climatic zones to climate change is shown in left panel, (a) for historical period, (bd) for the estimated potential climate−sensitivity regions in long−term future (2020-2100) under RCP2.6, RCP4.5 and RCP8.5 scenario, respectively. If the climate-sensitivity index is greater than 0.5, the grid will be defined as highly sensitive region. The grid accumulates 1 if any dataset (five data sources regarding historical period and eleven GCMs for future) outlined it as highly sensitive region, the number of data sources confirm the high sensitivity shown in right panel, (e) for the historical period, (fh): for future (2006–2100) under RCP2.6, RCP4.5 and RCP8.5 scenario, respectively.
Atmosphere 12 00123 g003
Figure 4. The spatiotemporal distribution of temperature variation in the mean annual temperature, the temperature in coldest and hottest month. The top panel exhibits the mean annual temperature change rates of historical and future period under RCP2.6, RCP4.5 and RCP8.5 scenario, respectively. The middle panel exhibits the temperature in coldest month change rates of historical and future period under RCP2.6, RCP4.5 and RCP8.5 scenario, respectively. The bottom panel exhibits the temperature in hottest month change rates of historical and future period under RCP2.6, RCP4.5 and RCP8.5 scenario, respectively. The hatched areas on the figures indicates statistically significant change at 99.9% significant level. The following figures use the same manner.
Atmosphere 12 00123 g004
Figure 5. Same as Figure 4, but the top panel for annual accumulated precipitation and bottom panel for Precipitation of the driest month in summer.
Atmosphere 12 00123 g005
Table 1. Main parameters of the datasets.
DatasetResolutionOrigin
CRU V3.10.5° × 0.5°The Climatic Research Unit at the
University of East Anglia
UDel_AirT_Precip0.5° × 0.5°University of Delaware
ERA-Intreim0.25° × 0.25°ECMRWF
ERA50.25° × 0.25°ECMWF
CRUNCEP0.5° × 0.5°NCEP
CanESM22.185° × 2.815°Canadian Centre for Climate, Canada
CNRM-CM51.40° × 1.40°Centre National de Recherches
Meteorologiques, France
CSIRO-Mk3.61.875° × 1.875°Commonwealth Scientific and
Industrial Research, Australia
GFDL-CM32.5° × 2.0°Geophysical Fluid Dynamics Laboratory, USA
GISS-E2-R2.5° × 2.0°NASA Goddard Institute for Space Studies, USA
HadGEM2-ES1.875° × 1.875°Met Office Hadley Centre, UK
IPSL-CM5A-LR3.75° × 3.75°Institute Pierre-Simon Laplace, France
MIROC51.40° × 1.40°Atmosphere and Ocean Research Institute, Japan
MPI-ESM-LR1.875° × 1.875°Max Planck Institute for Meteorology, Germany
MRI-CGCM31.125° × 1.125°Meteorological Research Institute, Japan
NorESM1-M2.5° × 1.875°Norwegian Climate Centre, Norway
Table 2. Description of the Köppen-Geiger symbols and their defining criteria.
ZoneType\Sub-TypeCriteria
A Tropical Tcold ≥ 18
Af Rainforest Pdry ≥ 60
Am Monsoon  Not(Af) & Pdry ≥ 100-MAP/25
Aw Savannah Not(Af) & Pdry < 100-MAP/25
B Arid MAT < 10*Pth
BW DesertMAT < 5*Pth
 BWh Hot Desert MAT ≥ 18
 BWk Cold Desert MAT < 18
BS SteppeMAT ≥ 5*Pth
 BSh Hot Steppe MAT ≥ 18
 BSk Cold Steppe MAT < 18
C Temperate Thot > 10&0 < Tcold < 18
Cs Dry SummerPsdry < 40&Psdry < Pwwet/3
 Csa Hot Summer Thot ≥ 22
 Csb Warm Summer Not (Csa) & Tmon10 ≥ 4
 Csc Dry Summer Not (Csa or Csb) & 1 < Tmon10 < 4
Cw Dry WinterPwdry < Pswet/10
 Cwa Hot Summer Thot ≥ 22
 CwbWarm Summer Not (Cwa) & Tmon10 ≥ 4
 Cwc Cold Summer Not (Cwa or Cwb) & 1<Tmon10< 4
Cf Without Dry SeasonNot (Cs) or (Cw)
 Cfa Hot Summer Thot ≥ 22
 Cfb Warm Summer Not (Cfa) & Tmon10 ≥ 4
 Cfc Cold Summer Not (Cfa or Cfb) & 1 < Tmon10 < 4
D Cold Temperate Thot > 10 & Tcol ≤ 0
Ds Dry SummerPsdry < 40 & Psdry < Pwwet/3
 Dsa Hot Summer Thot > 22
 DsbWarm Summer Not (Dsa) & Tmon10 ≥ 4
 Dsc Cold Summer Not (Dsa, Dsb or Dsd)
 DsdVeryColdWinter Not (Dsa or Dsb) & Tcold < 38
Dw Dry WinterPwdry < Pswet/10
 Dwa Hot Summer Thot > 22
 Dwb Warm Summer Not (Dwa) & Tmon10 ≥ 4
 Dwc Cold Summer Not (Dwa, Dwb or Dwd)
 Dwd Very Cold Winter Not (Dwa or Dwb) & Tcold < 38
Df Without Dry SeasonNot (Ds) or (Dw)
 Dfa Hot Summer Thot > 22
 Dfb Warm Summer Not (a) & Tmon10 ≥ 4
 Dfc Cold Summer Not (a, b or d)
 Dfd Very Cold Winter Not (a or b) & Tcold < −38
E Polar Thot < 10
ET Tundra Thot > 0
EF Frost Thot ≤ 0
Note: MAT = Mean Annual Temperature (°C), MAP = Mean Annual Precipitation (mm/yr). Thot = Temperature of the hottest month, Tcold = Temperature of the coldest month, Tmon10 = number of months where the temperature is above 10, Pdry = Precipitation of driest month, Psdry = Precipitation of the driest month in summer, Pwdry = Precipitation of the driest month in winter, Pswet = Precipitation of the wettest month in summer, Pwwet = Precipitation of the wettest month in winter, Pth = varies according to the following rules (if 70% of the MAP occurs in winter then Pth = 2 × MATmm, if 70% of the MAP occurs in summer then 2 × (MAT + 14) mm, otherwise Pth = 2 × (MAT + 7) mm). Summer (winter) is defined as warmer (colder) six months period of AMJJAS (ONDJFM).
Table 3. Partial correlations between the shifts of climate type and climate variables.
Climate TypeTrend
(104 km2/Decade)
MAPMATThotTcoldPdryPsdryPwdryPswetPwwetTmo10
BWhHis2.41 ***0.130.43 ***−0.05−0.28−0.15−0.09−0.16−0.140.08−0.18
RCP2.60.36 ***−0.014−0.020.34 ***0.060.010.01−0.02−0.020.04
RCP4.56.24 ***0.040.43 ***−0.010.018−0.080.1−0.03−0.26−0.01
RCP8.516.53 ***−0.100.33 ***0.160.15−0.2 *0.20 *0.11−0.22 **0.090.1
BWkHis4.63−0.5 ***0.36 **−0.02−0.04−0.170.200.15−0.200.11−0.27 *
RCP2.60.04−0.31 ***0.060.25 **0.110.080.060.17−0.18 *−0.28 **
RCP4.54.48 ***−0.35 ***0.14−0.12−0.05−0.020.050.12−0.22 **−0.10
RCP8.512.70 ***−0.26 **0.08−0.22 **0.010.08−0.060.01−0.06−0.1−0.07
BShHis3.92 ***0.010.67 ***−0.03−0.50 ***−0.000.140.000.30 *−0.020.10
RCP2.60.48 ***0.25 **−0.20 **0.65 ***0.05−0.01−0.02−0.19 *0.120.12
RCP4.51.78 ***0.20 *0.32 ***−0.090.080.000.01−0.150.010.00
RCP8.57.97 ***0.010.150.050.00−0.010.03−0.060.130.010.63 ***
BSkHis6.89−0.39 **0.130.220.34 **0.250.160.200.18−0.080.38 *
RCP2.6−0.19−0.21 **−0.020.19 *0.20 *−0.09−0.01−0.020.050.10
RCP4.5−0.09−0.28 ***−0.050.09−0.03−0.01−0.030.120.36 ***0.07
RCP8.5−0.60 *−0.080.060.09−0.19 ***0.10−0.110.07−0.02−0.14−0.35 ***
CsaHis1.370.56−0.080.070.43 ** 0.16−0.24−0.30 *−0.14−0.08
RCP2.60.50 *0.15−0.04−0.21 *0.37 ***−0.130.10−0.130.28 ***0.27 ***
RCP4.51.65 ***0.27 ***−0.130.020.42 ***−0.060.04−0.080.060.04
RCP8.52.39 ***0.12−0.19 *0.070.38 ***0.06−0.090.080.120.19 *−0.01
DsbHis−3.68−0.240.21−0.71 ***−0.23−0.28−0.34 **0.060.230.33 *−0.17
RCP2.6−0.29 **−0.000.09−0.32 ***0.070.03−0.08−0.000.150.10
RCP4.5−0.86 ***−0.35 ***0.14−0.12−0.05−0.020.050.12−0.10−0.22 **
RCP8.5−17.76 ***0.16−0.41 ***0..110.20−0.080.060.060.110.140.16
DfaHis−4.360.02−0.150.33 *−0.130.110.270.11−0.07−0.09−0.01
RCP2.65.76 ***0.19 *0.060.65 ***−0.36 ***−0.130.30 ***0.00−0.200.16
RCP4.56.78 ***0.20 *−0.090.32 ***−0.140.090.02−0.21−0.13 *−0.02
RCP8.59.78 ***0.33 ***−0.20*0.39 ***−0.110.0350.00−0.19−0.15−0.12−0.27 *
DfbHis7.910.140.47 ***−0.30 *−0.270.190.22−0.020.035−0.110.05
RCP2.6−2.48 ***0.19 *−0.25 **−0.66 ***−0.07−0.080.0600.010.18 *−0.05
RCP4.5−2.99 ***0.030.30 ***−0.48 **−0.060.13−0.070.09−0.01−0.07
RCP8.5−3.01 ***−0.140.23 **−0.29 ***0.000.09−0.050.10−0.080.050.038
DfcHis1.30−0.25−0.060.170.280.140.30 *0.280.100.050.01
RCP2.6−2.02 ***−0.140.09−0.41 ***−0.040.29 **−0.23 *0.02−0.18 *−0.08
RCP4.5−7.41 ***0.01−0.33 ***−0.090.10−0.040.02−0.11−0.120.09
RCP8.5−14.38 ***0.01−0.20 *−0.45 **0.02−0.110.1−0.06−0.01−0.010.04
ETHis−2.87 ***−0.03−0.49 ***−0.100.34 **0.110.100.07−0.21−0.02−0.03
RCP2.6−0.93 ***−0.070.10−0.76 ***0.016−0.130.150.08−0.06−0.17
RCP4.5−2.42 ***0.04−0.47 ***−0.29 ***0.038−0.060.04−0.06−0.010.05
RCP8.5−6.07 ***0.03−0.42 ***−0.13−0.100.02−0.02−0.10−0.050.12−0.38
Note: the number of * represent the different significance level. * represents the p < 0.1, ** represents the p < 0.05, *** represents the p < 0.01.
Publisher’s Note: MDPI stays neutral with regard to jurisdictional claims in published maps and institutional affiliations.

