
Age-Related Neuronal Deterioration Specifically Within the Dorsal CA1 Region of the Hippocampus in a Mouse Model of Late Onset Alzheimer’s Disease
Abstract
Background:
Neuronal damage resulting from increased oxidative stress is important in the development of late onset/age-related Alzheimer’s disease (LOAD). We have developed an oxidative stress–related mouse model of LOAD based on gene deletion of aldehyde dehydrogenase 2 (ALDH2), an enzyme important for the detoxification of endogenous aldehydes arising from lipid peroxidation. Compared to wildtype (WT) mice, the knockout (KO) mice exhibit AD-like pathologies and a progressive decline in recognition and spatial memory. This progression presumably has a morphological basis induced by oxidative damage.
Objective:
We performed morphometric analyses in the dorsal hippocampal CA1 region (dCA1) to determine if altered neuronal structure can help account for the progressive cognitive impairment in 3- to 12-month-old KO mice.
Methods:
Dendritic morphology was quantitatively analyzed by branched structured analysis and Sholl analysis following Golgi-Cox staining in WT mice (148 neurons) versus KO mice (180 neurons).
Results:
The morphology and complexity of dCA1 pyramidal neurons were similar at age 3 months in WTs and KOs. However, by 6 months there were significant reductions in apical and basal dendritic length, dendrite complexity, and spine density in KO versus WT mice that were maintained through ages 9 and 12 months. Immunostaining for protein adducts of the lipid peroxidation product 4-hydroxynonenal revealed significant increases in staining in dCA1 (but not ventral CA1) by 3 months, increasing through 12 months.
Conclusion:
This specific and progressive increase in dCA1 oxidative damage preceded detectable synaptic trimming in KO mice, in keeping with studies showing that lesions to dorsal hippocampus primarily impair cognitive memory.
INTRODUCTION
Oxidative stress is considered a primary driving force in the etiology of late-onset Alzheimer’s disease (LOAD) [1, 2]. An important mediator of oxidative damage in AD is the lipid peroxidation product, 4-hydroxynonenal (HNE), and increased levels of both free HNE and HNE protein adducts accumulate in the brains of AD patients at both early and late stages of disease progression [3–5]. Many of these proteins have been identified, and oxidative modifications by HNE adduct formation often result in altered activity [6]. These include proteins involved in the regulation of energy metabolism, antioxidant defense, neuronal communication, stress responses, cytoskeletal integrity, cell signaling, and amyloid-β (Aβ) disposition. We have developed a mouse model that mimics this manifestation of oxidative damage, based on gene deletion of aldehyde dehydrogenase 2 (ALDH2), a key enzyme in one of the primary detoxification pathways for HNE [7]. Aldh2 knockout (KO) mice exhibit increased levels of HNE protein adducts in the hippocampus and cortex [7, 8], and a progressive age-related decline in hippocampus-dependent working and spatial memory tasks [7, 9]. Aldh2 KO mice also exhibit numerous AD-like pathological changes, including age-related increases in Aβ, phosphorylated tau protein and activated caspases, synaptic loss, defective CREB signaling, and several vascular pathologies [7].
In the current study, we performed morphometric analysis of pyramidal neurons in the dorsal hippocampal CA1 region (dCA1) of wildtype (WT) and KO mice sampled at ages 3, 6, 9, and 12-13 months. We recently showed in 12-month-old KO mice that dCA1 neurons specifically display considerable cutback in their arborization compared to WT mice. Furthermore, this dendritic trimming was comparatively minimal in KO ventral CA1 neurons (vCA1) as well as in overlying layer V pyramidal neurons of the primary sensory neocortex [10]. So the most striking loss of synaptic input was in dCA1, part of the circuitry that registers a cognitive map for navigation, enabling animals to properly orient and execute behaviors in a learned environment [11]. This reflects defects in dCA1-dependent cognitive function that we have previously reported in Aldh2 KO mice [7, 9]. The purpose of the current study was to determine the timeline for the development of lost CA1 dendritic structure and if such loss is correlated with oxidative damage. Therefore, an important question we address here is if elevated oxidative damage precedes dendritic decline in KO versus WT mice.
MATERIALS AND METHODS
Animals
All procedures for animal experimentation were undertaken in accordance with the principles and guidelines of the Canadian Council on Animal Care and were approved by the Queen’s University Animal Care Committee. All mice were maintained under a 12-h light/dark cycle, with free access to food and water. The Aldh2-/- mice have a C57BL/6J background and were generated by gene targeting knockout as previously described [12]. Mice were kindly provided by Dr. T. Kawamoto (University of Occupational and Environmental Health, Kitakyushu, Japan). Wildtype and Aldh2-/- cohorts used in the current study were generated by mating heterozygotes and genotyping progeny by PCR analysis of genomic DNA extracted from ear punches using the primers as reported [13].
Golgi-cox staining
Golgi-cox staining was performed as we described previously [10]. Briefly, brains were perfused with 20 ml PBS by transcardiac perfusion under isoflurane anesthesia, after which brains were removed and processed using the FD Rapid GolgiStain™ Kit (FD NeuroTechnologies, Columbia, MD) following the manufacturer’s instructions. A Leica VT1000 S Vibrating-blade vibratome was used to cut 130 to 150μm coronal sections of the fixed brains. The sections were cut in artificial cerebrospinal fluid (aCSF) comprised of 240 mM sucrose, 3.3 mM KCl, 26 mM NaHCO3, 1.3 mM MgSO4·7H2O, 1.23 mM NaH2PO4, 11 mM D-glucose, and 1.8 mM CaCl2. Sections were mounted on gelatin-coated slides and dried in the dark in a fume hood for at least 24 h prior to staining.
Morphological analyses
Morphological analyses were carried out using the Neurolucida System Version 11.03, and Neurolucida Explorer Software (MBF Bioscience, VT, USA) as described [10], with the operator blinded as to the genotype of the animal. Pyramidal neurons (Fig. 1A) were traced and analyzed under a 40x objective lens. In each animal, both apical and basal dendritic arbors were examined. We used coronal sections in the CA1 region of the dorsal hippocampus between Bregma –2.6 and –3.8. Neurons were visually inspected for the integrity of dendritic branches, to confirm that dendrites displayed no breaks in their staining, and that dendrites were not obscured by other neurons. The age groups and the numbers of neurons analyzed are shown in Table 1.
Fig.1
A) Golgi-Cox-stained coronal slice at the level of the dorsal CA1 region of a 6-month-old mouse. CA1 stratum pyramidale with apical dendrites in the stratum radiatum. Ai) Pyramidal neurons in a hippocampus from a wild-type (WT) mouse. Aii) Higher magnification of apical dendritic branches showing healthy dendrites with spines (blue arrows). A single example of an abnormal dendritic bleb or ‘bead’ (red arrow at top of Figure) is noted. Aiii) Pyramidal neuron in dCA1 from a knockout (KO) mouse. Aiv) and Av) Higher magnification of apical dendrite branches showing minor dendritic beading (red arrows) alongside dendritic spines. B) Digital tracings of dCA1 neurons showing apical and basal dendritic arbors, dendrites (lines), and Sholl rings (circles) placed at 20μm diameter intervals. Dots along dendrites are click points during tracing. Compared to the two representative WT neurons, the two pyramidal traces from KO mice show a reduced dendritic arbor.
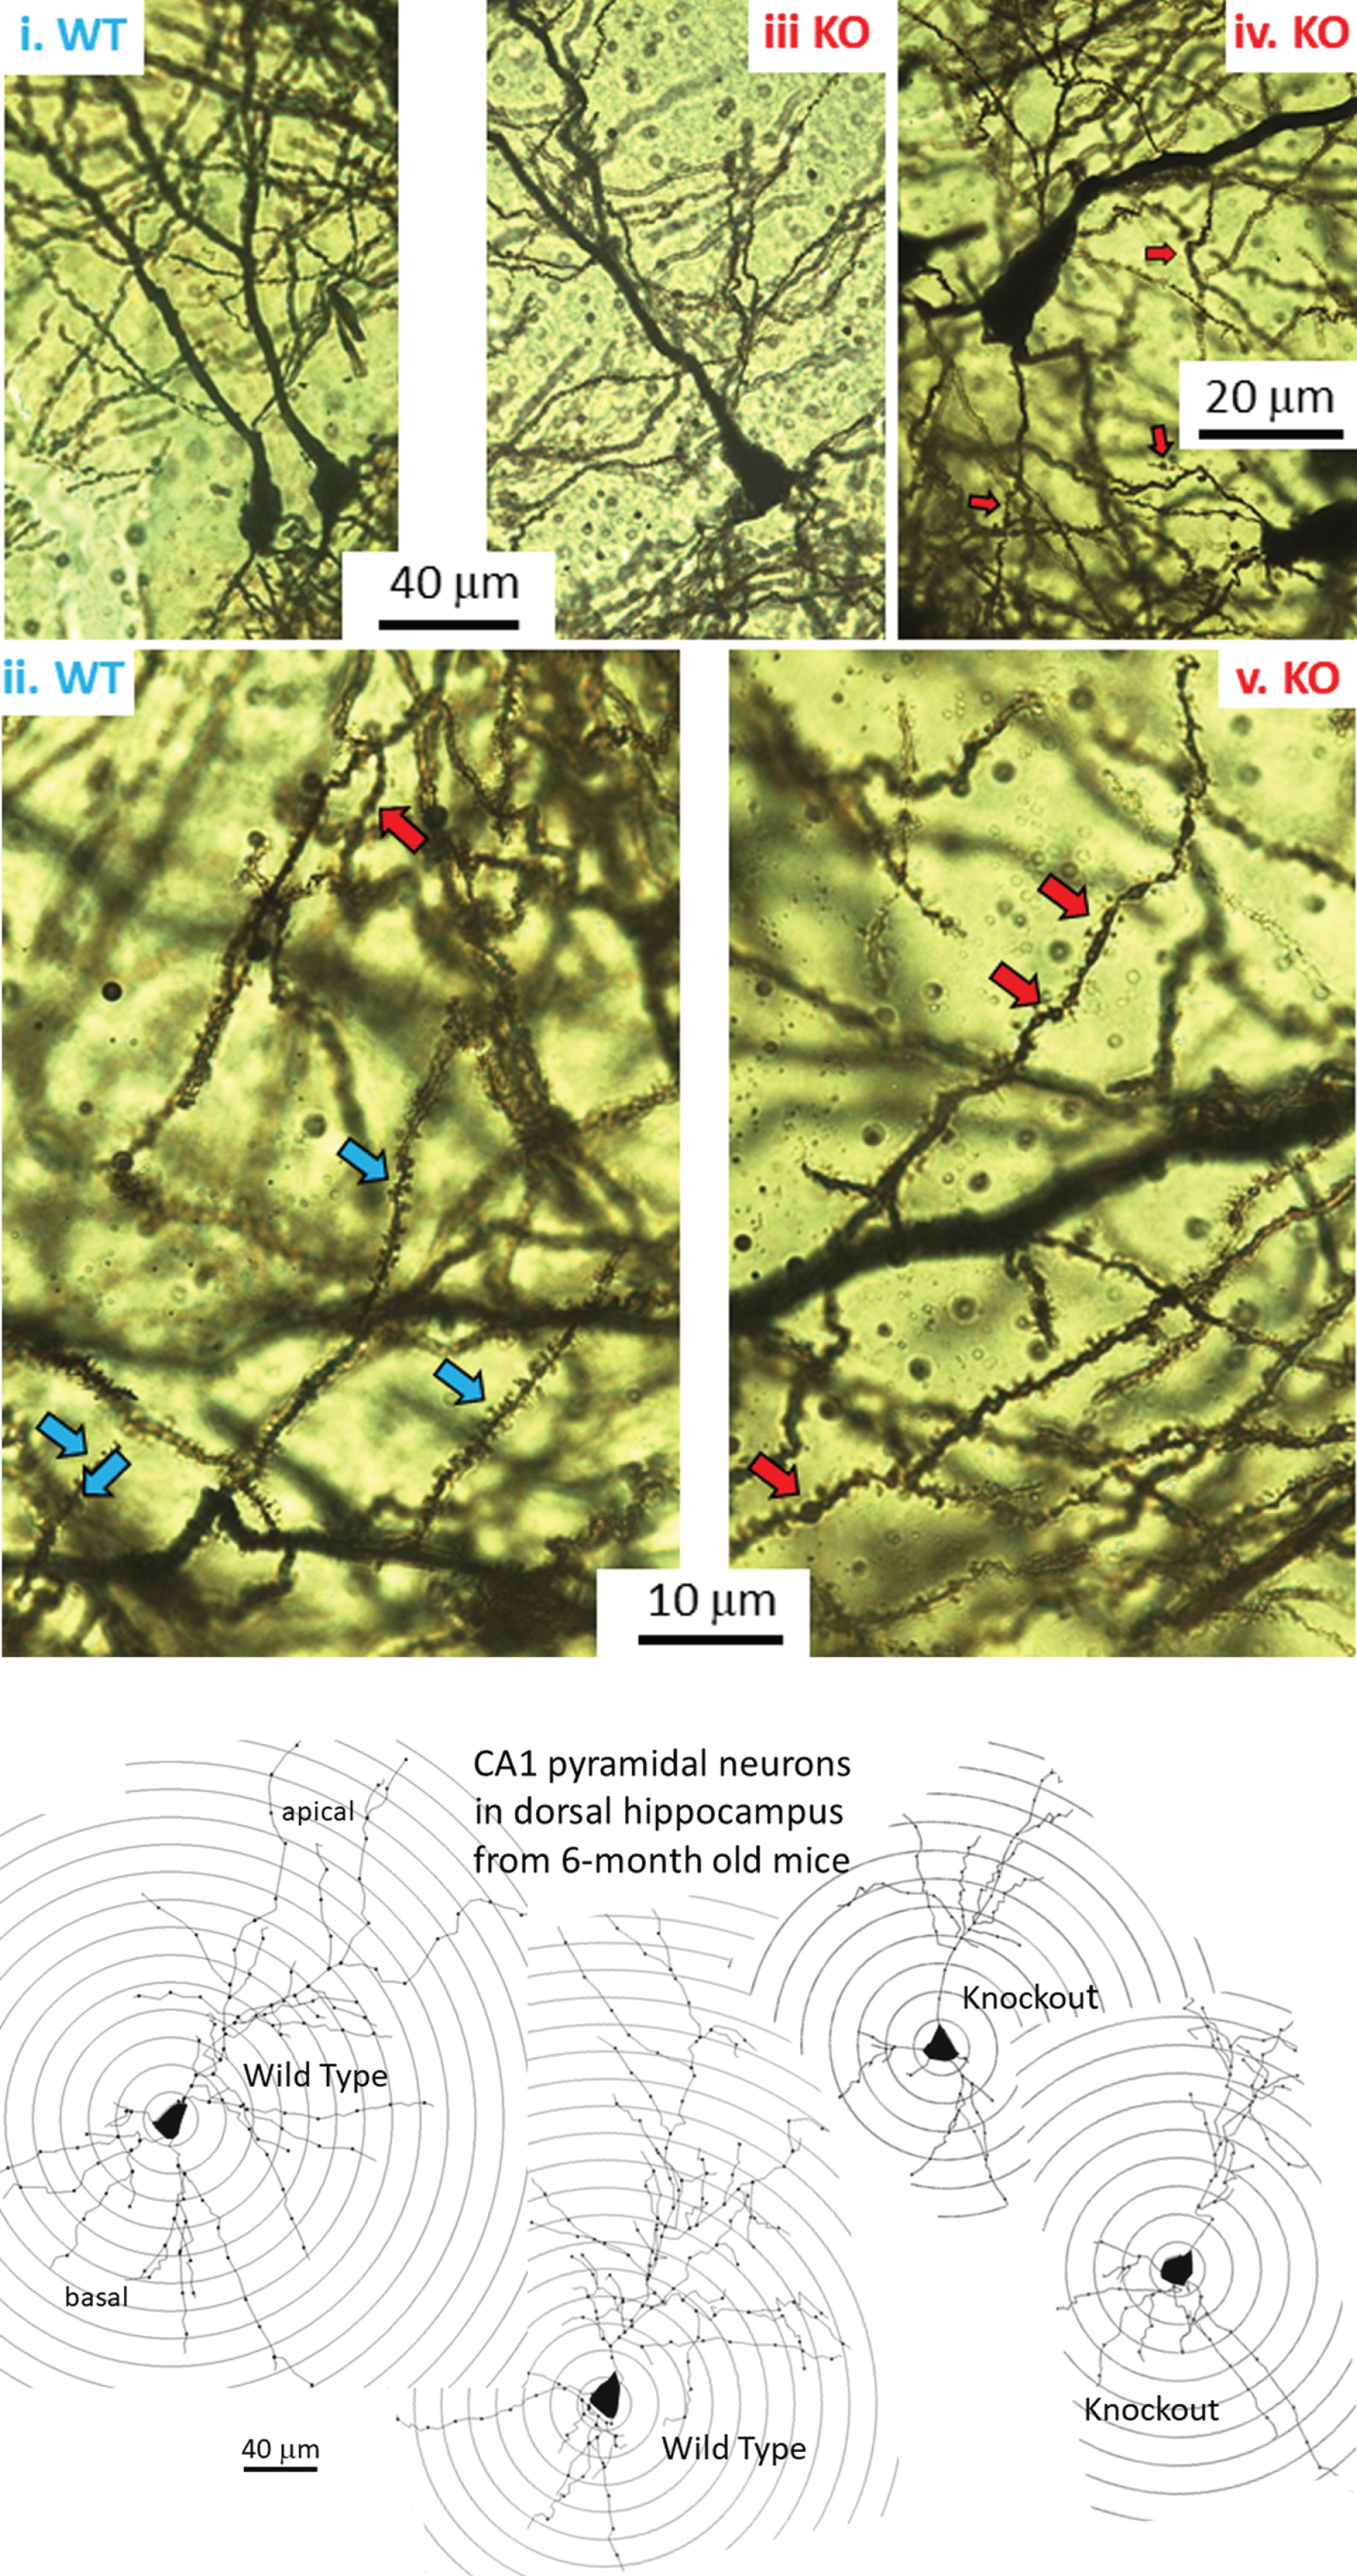
Table 1
Numbers of mice and neurons analyzed morphometrically in each age group. Morphometry was carried out with the experimenter blinded to WT or KO groups. The 12M group has been described previously [10] and is used here for age comparisons. Spine density analysis was carried out in 2 of the 4 neurons in each group
| Age | Type | Mouse n | Males | Females | Neurons/mouse | Total neurons |
| 3 M | WT | 10 | 5 | 5 | 4 | 40 |
| KO | 10 | 5 | 5 | 4 | 40 | |
| 6 M | WT | 10 | 5 | 5 | 4 | 40 |
| KO | 10 | 5 | 5 | 4 | 40 | |
| 9 M | WT | 8 | 5 | 3 | 4 | 32 |
| KO | 10 | 5 | 5 | 4 | 40 | |
| 12 M | WT | 9 | 4 | 5 | 4 | 36 |
| KO | 15 | 5 | 10 | 4 | 60 |
Sholl analysis maximizes the chances of detecting changes in dendritic morphology that develop with age. Using the Neurolucida Explorer Software, a Sholl analysis [14] was performed on each neuron. Concentric rings, each increasing in radius by 20μm, were centered on the cell body (Fig. 1B). Dendrite length was measured within a concentric ring area and plotted. Branching points (nodes) were reported as the number per concentric ring area. Intersections were determined as the number of points where the processes crossed a ring.
Complexity, as defined in Neurolucida Explorer, refers to the normalization and comparison of dendrites among fundamentally different neurons. Complexity = [Sum of the terminal orders + Number of terminals] * [Total dendritic length / Number of primary dendrites], A ‘terminal’ is defined as a dendritic ending, and ‘Terminal order’ is the number of “sister” branches encountered while proceeding from the terminal to cell body (calculated for each terminal) [15].
A branched structure analysis was also performed on each neuron. (https://www.mbfbioscience.com/help/nx11/Content/Analyses/Branched_Structure_Analysis.htm). This included a variety of analyses, one being the neuron summary that provides an overview of the selected neuron components: axons, dendrites, and cell body. The overview includes dendritic lengths, complexity, and the number of nodes and ends. Also, the number of basal dendrites per cell body was counted to determine if any primary dendrites were completely lost in KO versus WT.
For spine density analyses, the dCA1 region was compared between the WT and KO mice (under blinded conditions) because only this region proved to have significantly reduced dendritic arbors in KO versus WT mice [10]. Two neurons per mouse were sampled and data averaged separately for each animal. For each neuronal average, one segment was chosen from a proximal apical dendrite (30–120μm from the cell body), one from a distal apical dendrite (220–340μm from the cell body), and one from a basal dendrite [16]. The number of spines along each 10μm length was counted under oil immersion using a 100X objective lens. Apical and basal spine counts were pooled.
Immunohistochemical staining for HNE protein adducts
Immunohistochemical analyses were performed on 30μm cryostat sections from mouse brain following perfusion and immersion fixation with 4% PFA. Brain sections were treated with 1% H2O2 for 15 min, blocked for 1.5 h with 6% normal goat serum + 2% bovine serum albumin + 0.3% Triton X-100 in PBS, and incubated for 24 h at 4°C with rabbit anti-HNE antibody (1:400, bs-6313R, Bioss). Sections were then incubated with secondary biotinylated goat anti-rabbit IgG for 2 h at room temperature (1:200, BA-1000, Vector Laboratories), and staining completed using a Vectastain Elite ABC kit (PK-6100, Vector Laboratories). Sections were mounted on glass slides, dehydrated through an ethanol and xylene series, and coverslipped. To normalize illumination for each immunohistochemical run of slides, the image brightness was adjusted using a control slide (without antibody) to set light intensity and exposure time. These values were held constant during density measurements of the immunostained slides.
Statistical analysis
For the morphological analyses, we used WT and KO mice and analyzed 4 dCA1 neurons in each mouse (Table 1). The mean value of the 4 replicate neurons for each neuronal trait in each animal was then averaged for the WT or KO mice. For the spine density analysis of dCA1 neurons, two neurons per mouse were analyzed. For the immunohistochemical analyses, 9–14 sections from each of 3-4 mice per group were analyzed. Differences between KO and WT animals for Sholl analysis of each neuronal trait were analyzed using a Student’s t-test for unpaired data, whereas comparisons of the summary data for each trait, and for the immunohistochemical analysis, were analyzed by 2-way ANOVA and a Tukey post-hoc test for multiple comparisons. All statistical analyses were performed using GraphPad Prism, Version 8.2.1.
RESULTS
Figure 1A shows coronal Golgi-Cox- stained sections of the 6-month-old mouse brain at the level of the dorsal CA1 region. Two adjacent CA1 neurons in a WT mouse are shown in Fig. 1Ai. At higher magnification, Fig. 1Aii shows the apical dendritic arbor of a WT mouse. Typically, dendritic spines are visible (blue arrows) with the rare dendritic bleb (red arrow at top of Figure). Figure 1Aiii shows a single dCA1 neuron from a KO mouse. Higher magnification shows that spines are present, but blebs are common (Fig. 1Aiv and 1Av, red arrows), although we have not quantified this. Dendritic blebs, or beads, are areas of a dendrite that have lost their spines and taken on a beaded appearance due to loss of cytoskeleton and a bulging out of the plasma membrane. This is typical of ischemic neurons in the early phases of deterioration.
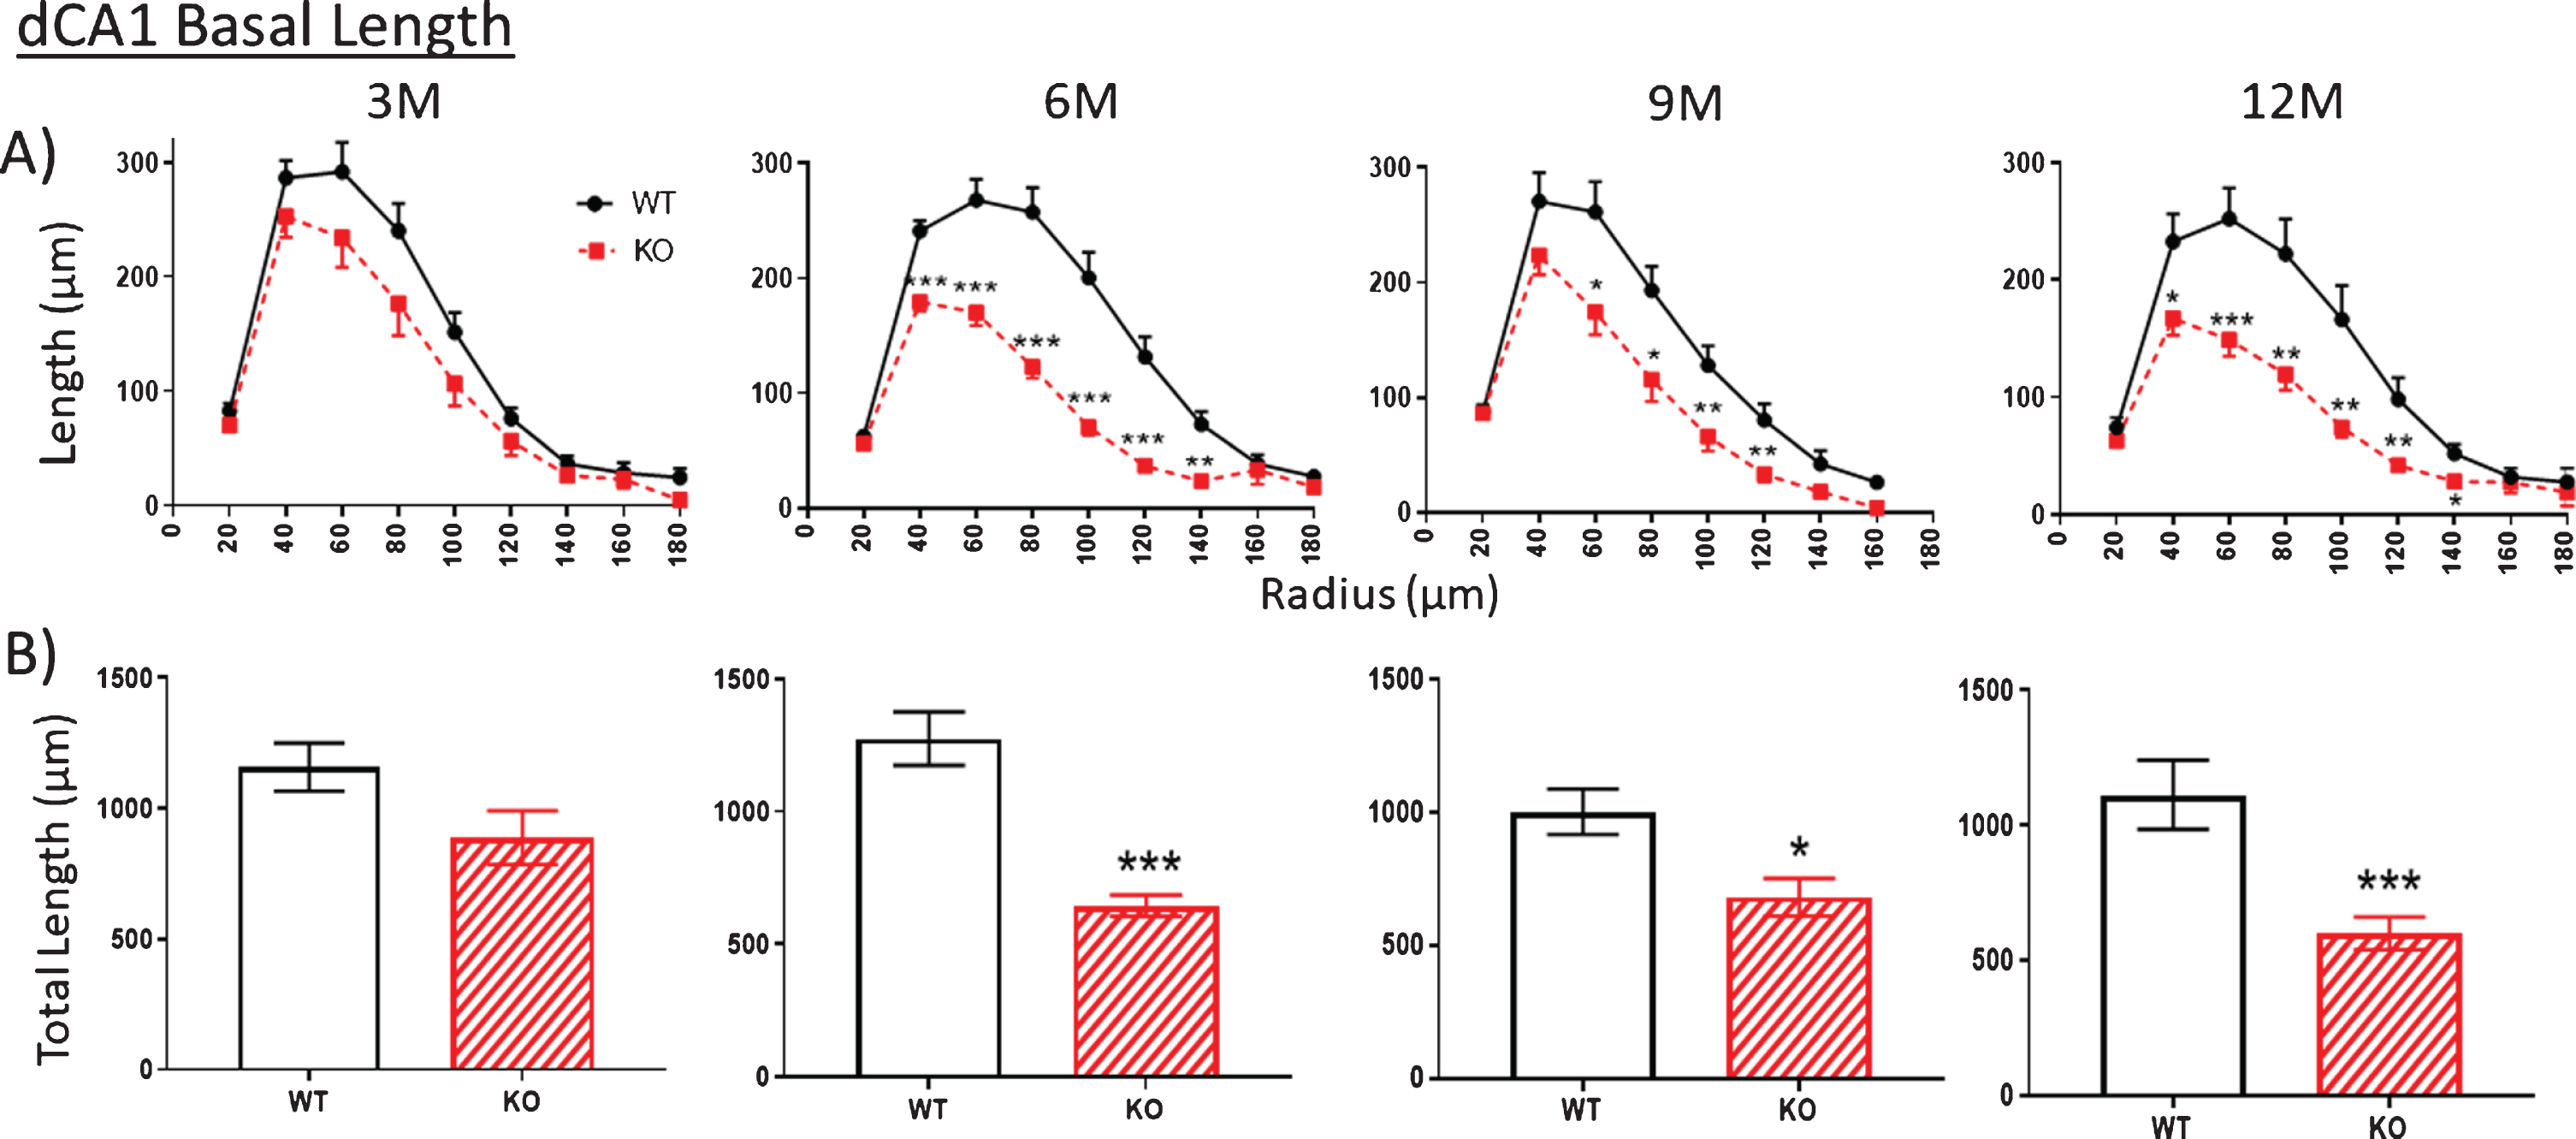
Whether overall dendritic arbors are affected requires digital reconstruction. Digital renderings of two representative dCA1 pyramidal neurons from two WT mice (Fig. 1B, left) illustrate dendritic arbors compared to cells from two KO mice (Fig. 1B, right). Sholl rings are overlaid at 20μm-diameter increments and centered on the cell body. These traces illustrate apparent reductions in the extent of dCA1 arbors in KO mice, but this requires more stringent measurements in more neurons. Thus, we examined both apical (Fig. 2) and basal (Fig. 3) dendritic length in dCA1 pyramidal neurons using the Sholl analysis. At three months of age (3 M), there is no statistical difference in the length of apical dendrites between WT and KO mice (Fig. 2A, 3M). This changes dramatically by six months (6 M) where dendrite length measured at each Sholl ring is reduced in knockout (KO) versus wild type (WT) mice (Fig. 2A, 6M). This reduction is also reflected in the total dendritic length and is highly significant both in apical (Fig. 2B) and basal (Fig. 3B) dendrites of the dCA1 pyramidal neurons. These arbor reductions in KO versus WT mice are maintained in the 6, 9, and12 month cohorts.
Fig.2
A, B) At 3 months of age (3M), dendritic length within the apical arbor is not significantly reduced in the dorsal CA1 (dCA1) pyramidal cell region of KO mice compared to WT. However, by 6 months (6 M), KO dendrite length is significantly reduced compared to WT controls. This difference is maintained at 9 and 12 M. Data represent the mean±SEM of measurements from 8–15 mice per group (see Table 1) and were analyzed by Student’s t-test for unpaired data (A), and two-way ANOVA and a Tukey multiple comparison post-hoc test (B). *significant difference between WT and KO as indicated (*p < 0.05, **p < 0.01, ***p < 0.001).
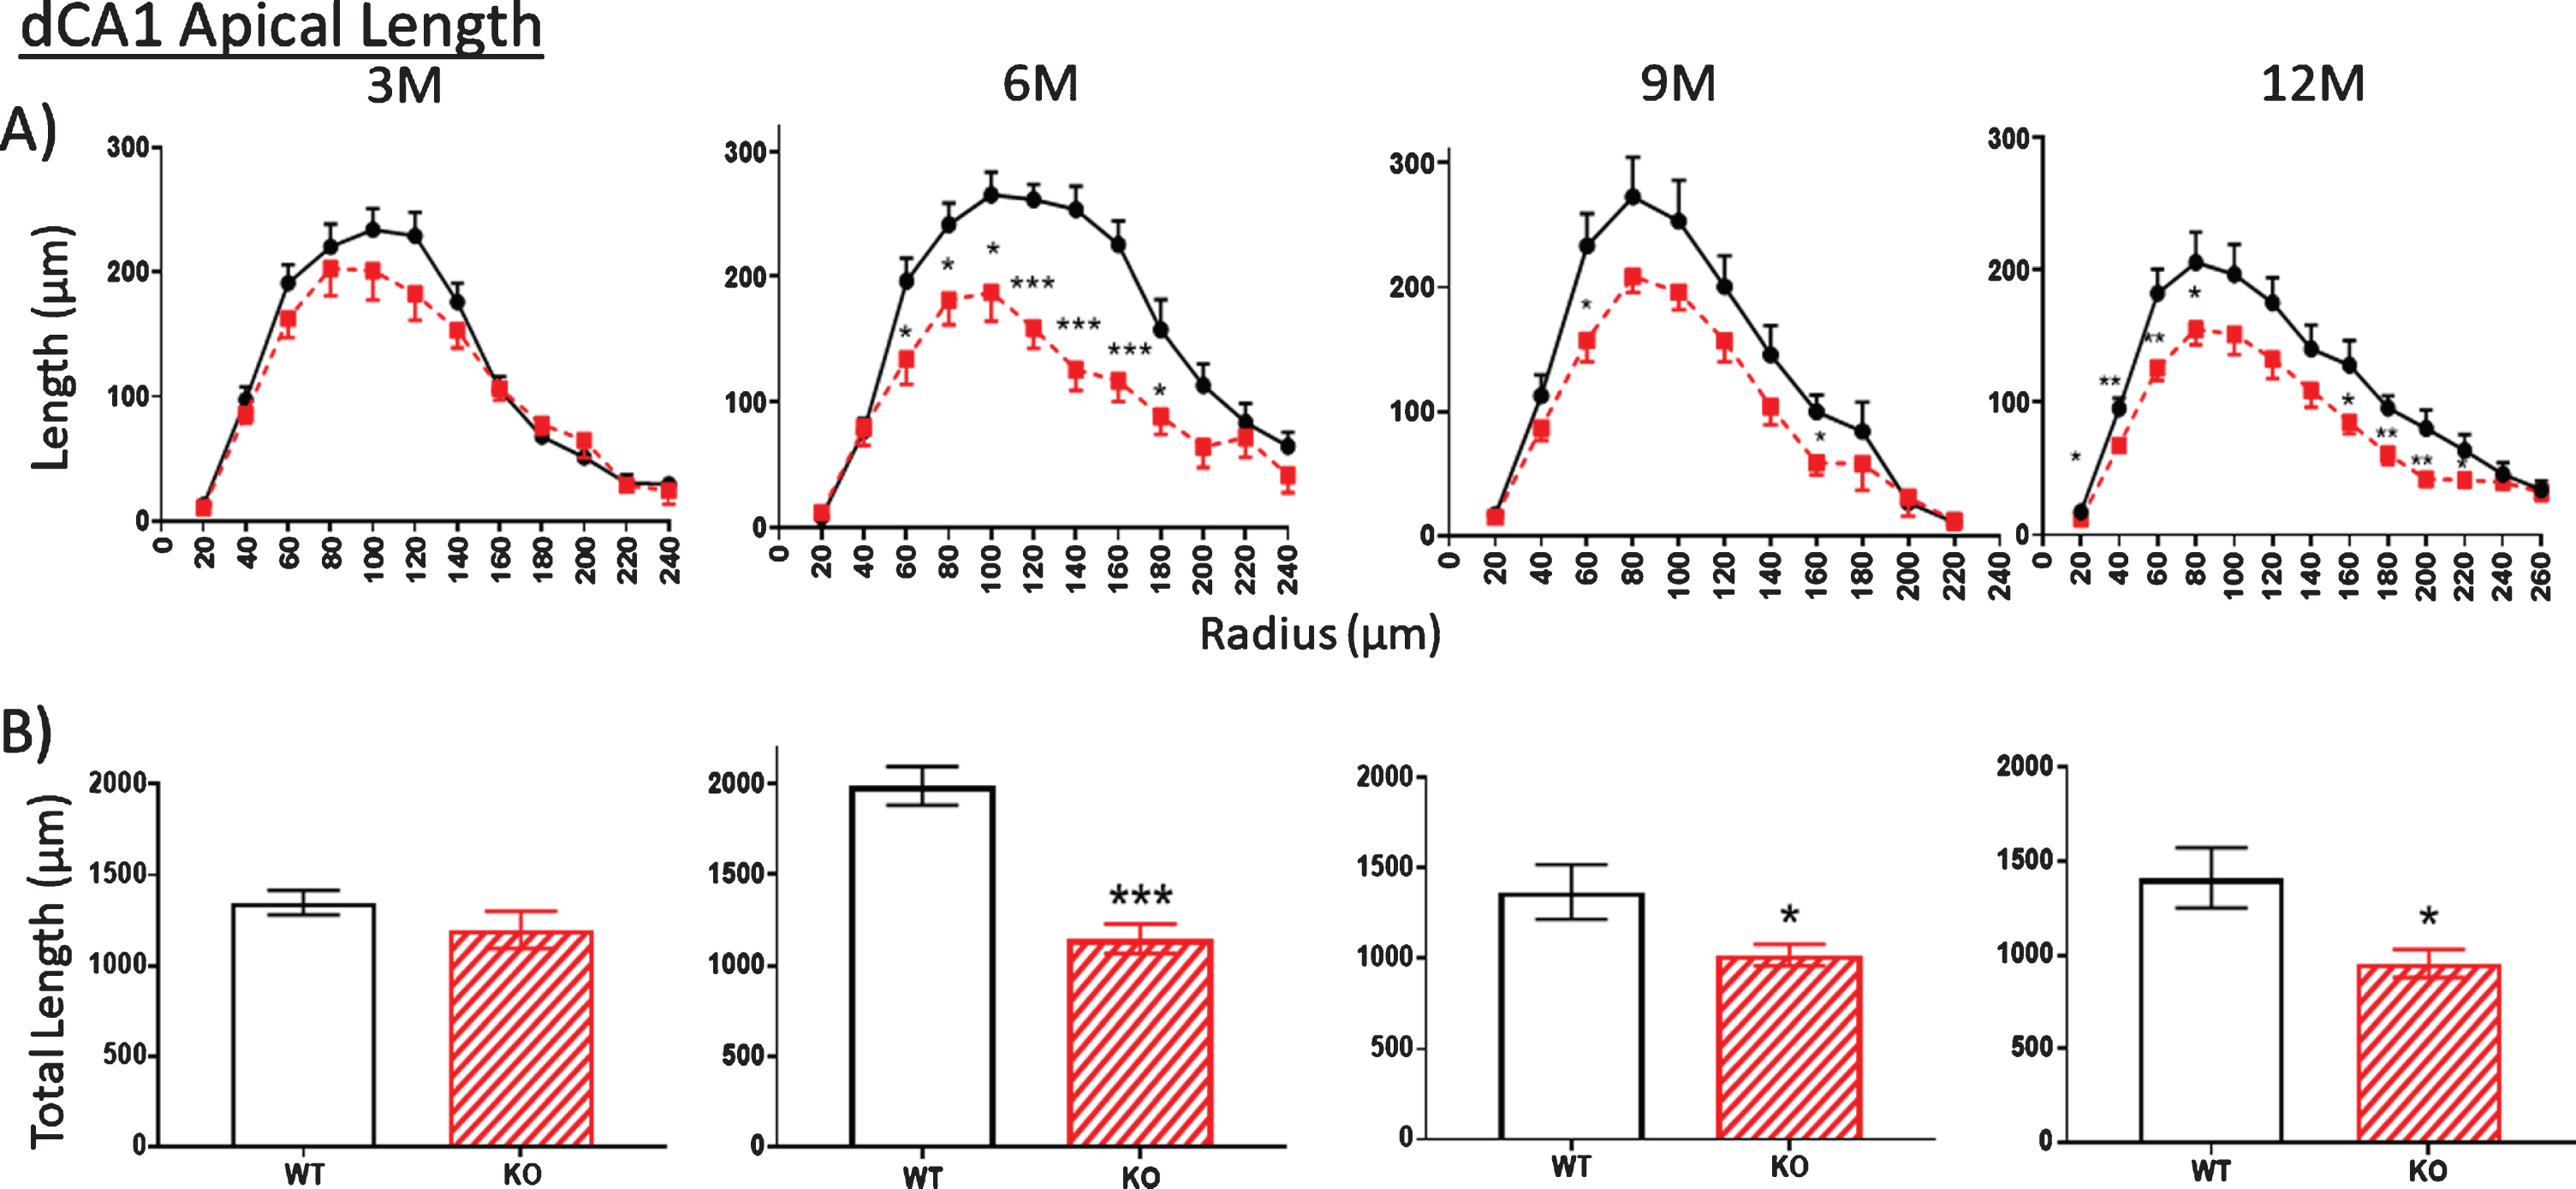
Fig.3
A, B) Similar to Fig. 2, at 3 months (3M), dendritic length within the basal arbor is not significantly reduced in dCA1 of KO mice compared to WT. However, by 6 months (6 M), KO dendrite length is significantly less This difference is maintained at 9 and 12 M. Data represent the mean±SEM of measurements from 8–15 mice per group and were analyzed by Student’s t-test for unpaired data (A), and two-way ANOVA and a Tukey multiple comparison post-hoc test (B). *significant difference between WT and KO as indicated (*p < 0.05, **p < 0.01, ***p < 0.001).
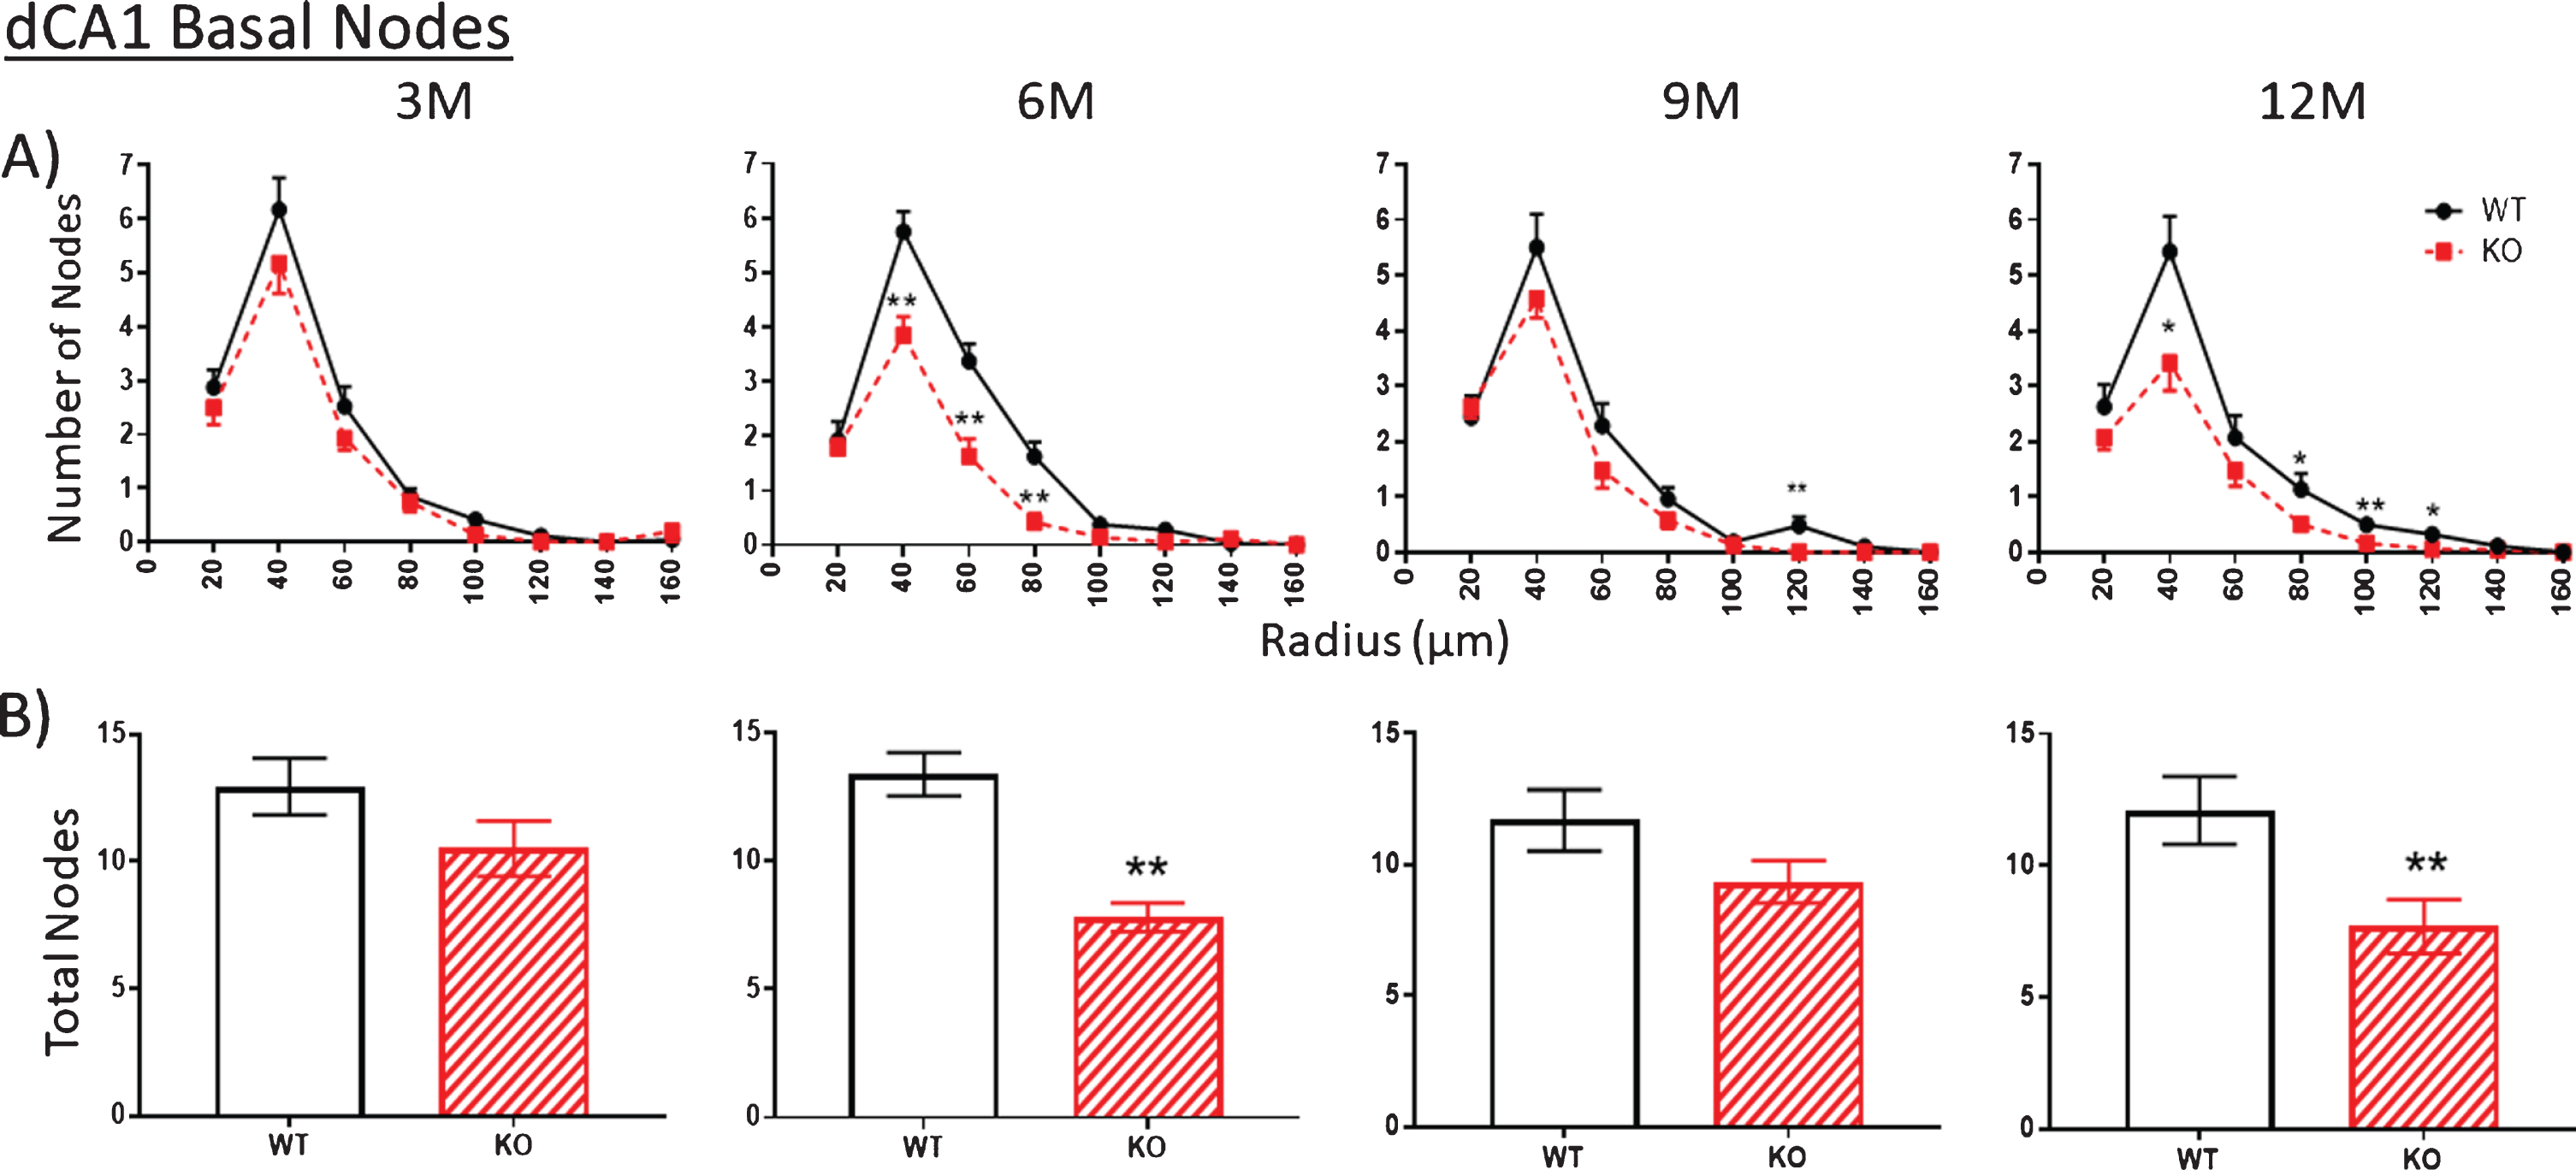
Nodes
The number of nodes (branch points) in apical (Fig. 4, 3M) and basal (Fig. 5, 3M) arbors are similar between WT and KO mice at 3 months of age. However, by 6 months, node numbers are significantly reduced in KO versus WT mice both in apical (Fig. 4, 6M) and basal (Fig. 5, 6M) arbors. This reduction is maintained through 9 and 12 months but with only the latter being statistically significant. The reduced numbers of ends in KO mice indicates a loss of dendritic branches from both apical and basal arbors.
Fig.4
A, B). The number of apical dendritic nodes [branch points] in a dCA1 arbor is similar in KO versus WT mice at 3 M but is significantly reduced by 6 M. This difference is narrowed by 9 M but is more apparent at 12 M, even as WT numbers also are reduced. Data represent the mean±SEM of measurements from 8–15 mice per group and were analyzed by Student’s t-test for unpaired data (A), and two-way ANOVA and a Tukey multiple comparison post-hoc test (B). *significant difference between WT and KO as indicated (*p < 0.05, **p < 0.01, ***p < 0.001).
![A, B). The number of apical dendritic nodes [branch points] in a dCA1 arbor is similar in KO versus WT mice at 3 M but is significantly reduced by 6 M. This difference is narrowed by 9 M but is more apparent at 12 M, even as WT numbers also are reduced. Data represent the mean±SEM of measurements from 8–15 mice per group and were analyzed by Student’s t-test for unpaired data (A), and two-way ANOVA and a Tukey multiple comparison post-hoc test (B). *significant difference between WT and KO as indicated (*p < 0.05, **p < 0.01, ***p < 0.001).](https://content.iospress.com:443/media/jad/2021/79-4/jad-79-4-jad201024/jad-79-jad201024-g004.jpg)
Fig.5
A, B). As with the apical arbor in Fig. 4, the number of nodes in the basal arbor is no different at 3 M in KO versus WT mice. However, the KO number is significantly reduced compared to WT by 6 M. This reduction is narrowed by 9 M but is again apparent at 12 M. Data represent the mean±SEM of measurements from 8–15 mice per group and were analyzed by Student’s t-test for unpaired data (A), and two-way ANOVA and a Tukey multiple comparison post-hoc test (B). *significant difference between WT and KO as indicated (*p < 0.05, **p < 0.01).
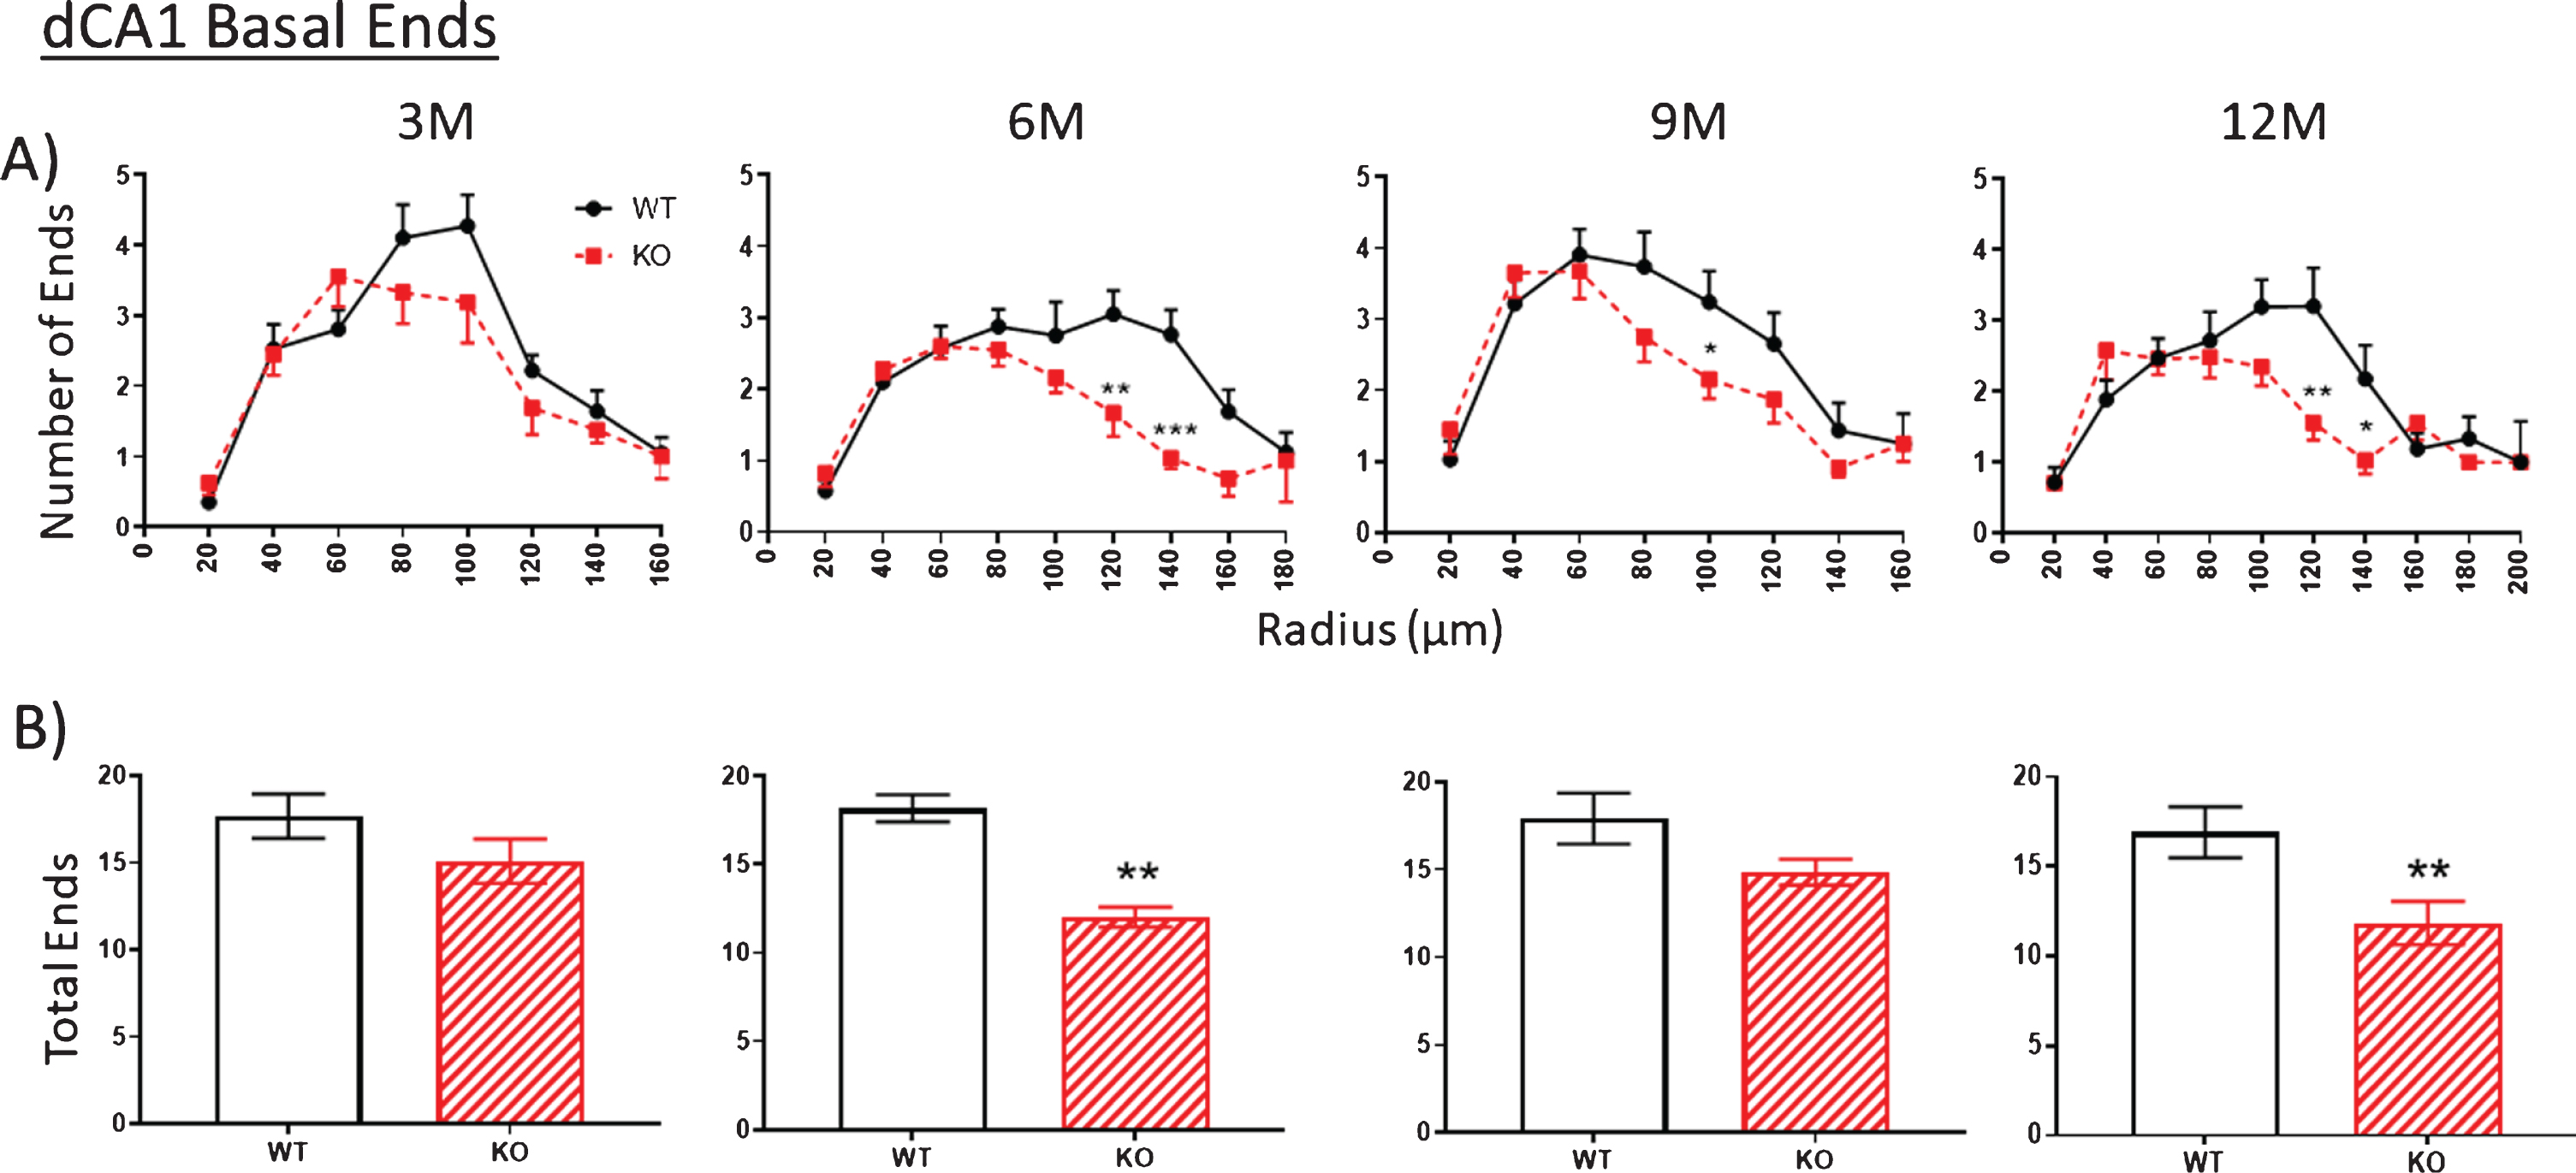
Ends
The number of ends in both apical (Fig. 6, 3M) and basal (Fig. 7, 3M) arbors are also similar between WT and KO mice at 3 months but by 6 months, end numbers are significantly reduced in KO versus WT mice both in apical (Fig. 6, 6M) and basal (Fig. 7, 6M) arbors. This reduction is maintained through 9 and 12 months but with only the latter being statistically significant. The reduced numbers of nodes in KO mice indicates a loss of dendritic branches from both apical and basal arbors. (As noted below, the consistent number of basal dendrites measured at the pyramidal cell body throughout the 3- to 12-month period indicates that the parent dendrites themselves are not cut back at the level of the soma).
Fig.6
A, B). The number of apical dendritic ends in a dCA1 arbor as a measure of total dendrite branches is not significantly reduced in KO versus WT mice at 3 M. Then between 3 to 6 M, KO end numbers are significantly decreased compared to WT. This difference is narrowed by 9 M but is again apparent at 12 M. Data represent the mean±SEM of measurements from 8–15 mice per group and were analyzed by Student’s t-test for unpaired data (A), and two-way ANOVA and a Tukey multiple comparison post-hoc test (B). *significant difference between WT and KO as indicated (*p < 0.05, **p < 0.01, ***p < 0.001).
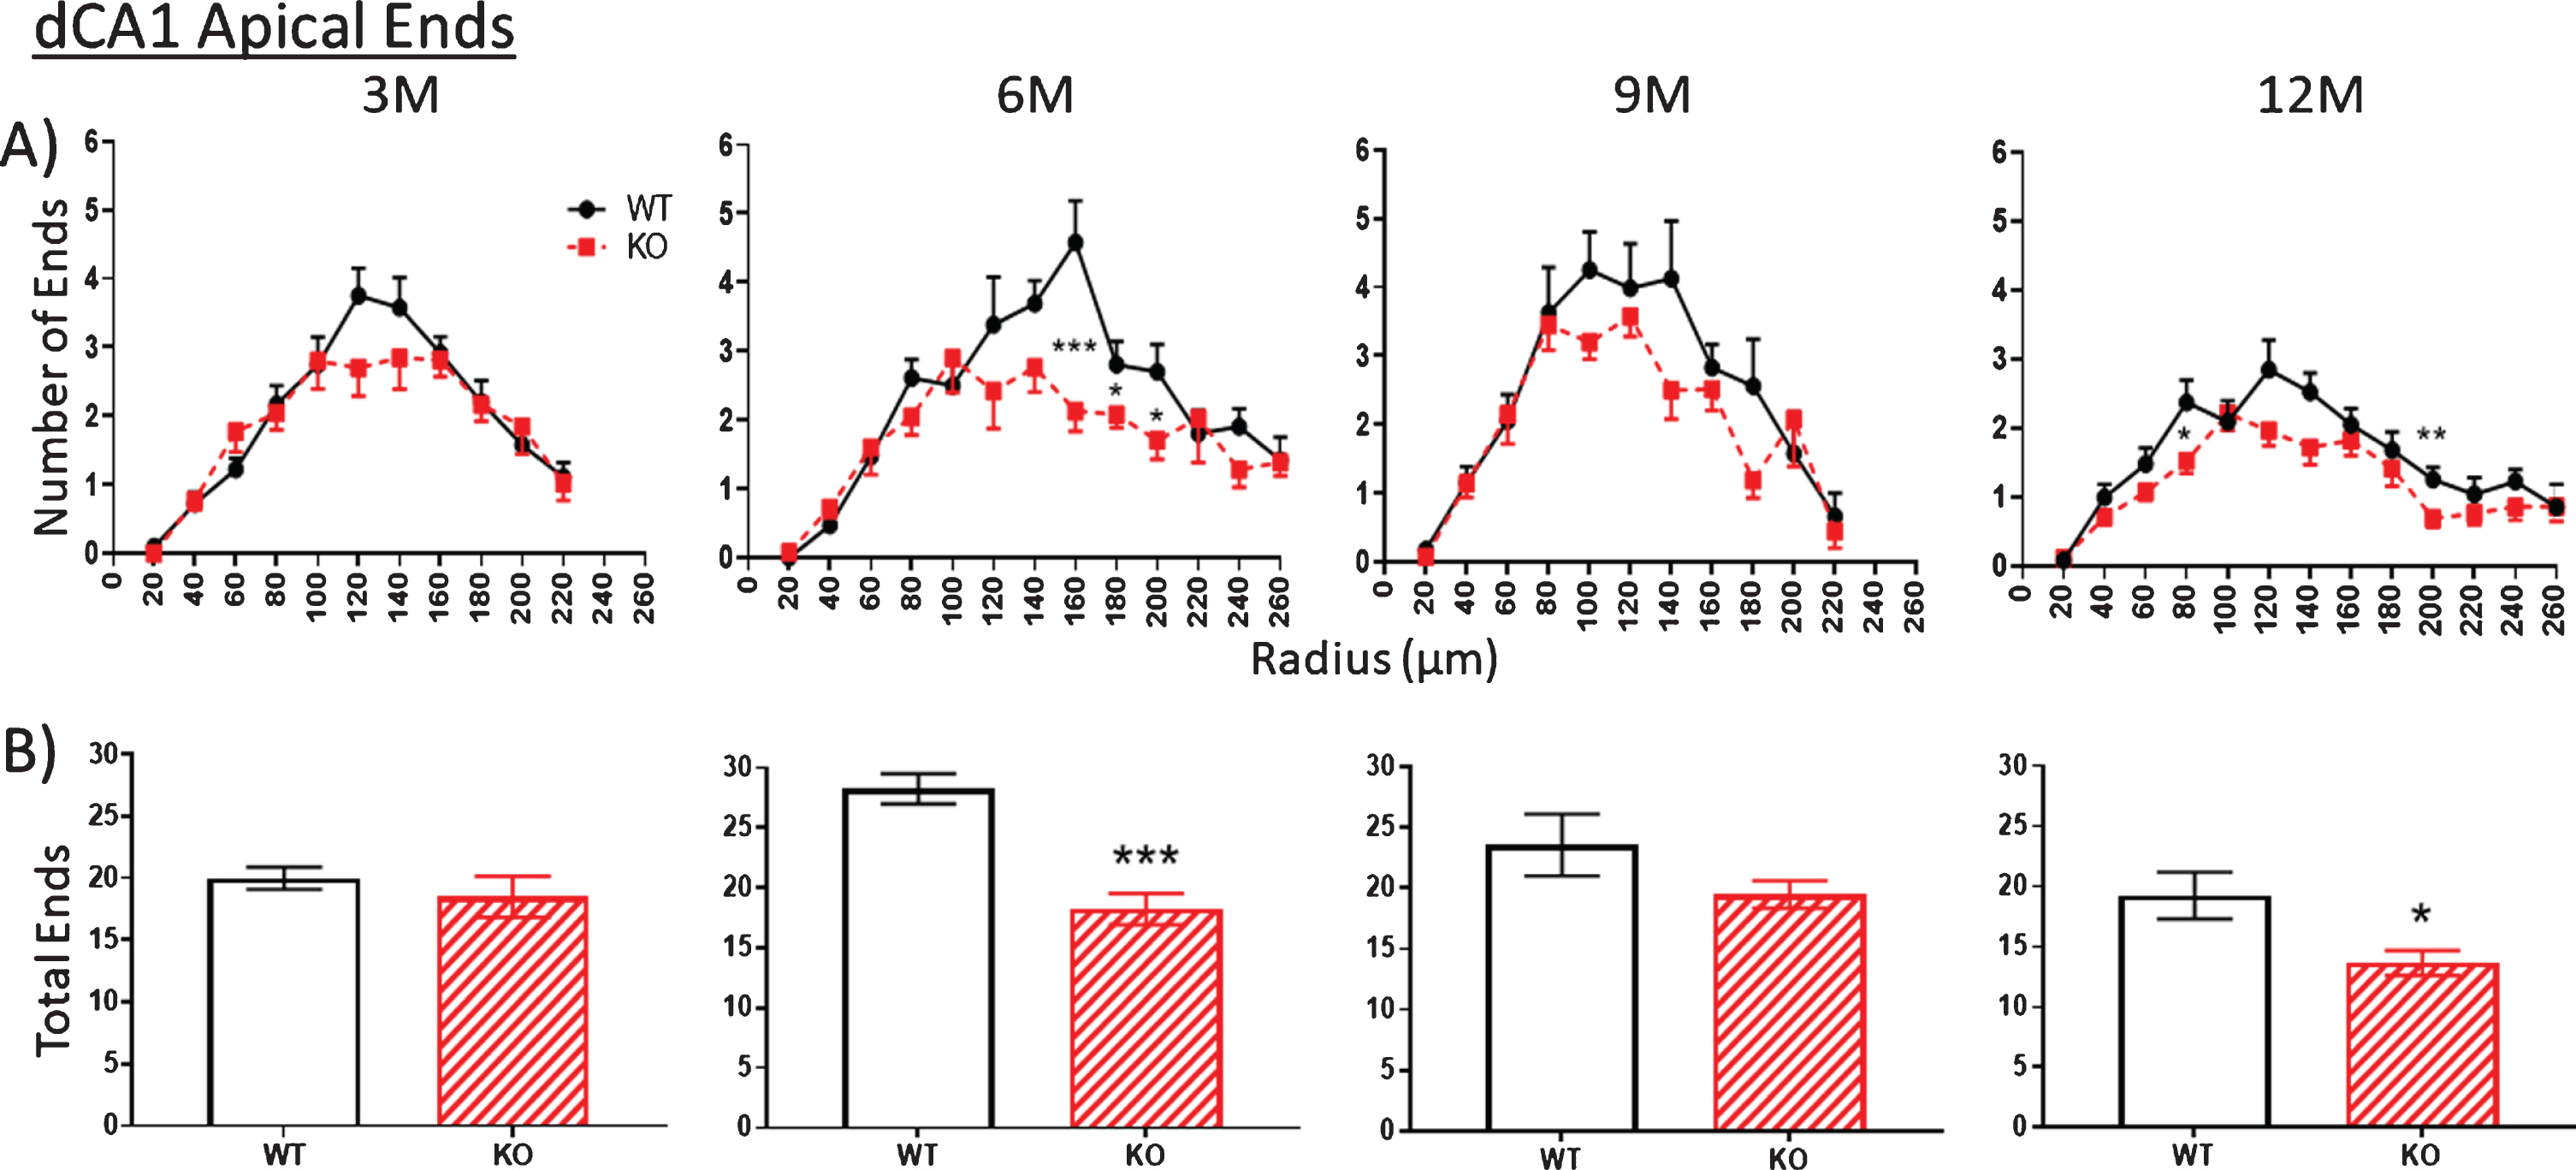
Fig.7
A,B). Similar to the apical arbor, at 3 months the number of ends in the basal arbor is similar in KO versus WT mice. Then between 3 to 6 M, KO end numbers are significantly decreased compared to WT. This difference is narrowed by 9 M but is again apparent at 12 M. Data represent the mean±SEM of measurements from 8–15 mice per group and were analyzed by Student’s t-test for unpaired data (A), and two-way ANOVA and a Tukey multiple comparison post-hoc test (B). *significant difference between WT and KO as indicated (*p < 0.05, **p < 0.01, ***p < 0.001).
Intersections
The trend described above regarding nodes and ends is repeated in the counts of the number of intersections between dendrites and each Sholl ring. Again, there are no differences at 3 months in WT versus KO mice in apical (Fig. 8A) and basal arbors (Fig. 9A), but there are statistically significant reductions, particularly at 6 months, which remain significant in the older age groups (Figs. 8A, 9A). This reduction is particularly striking in the basal dendrites across the 6-, 9-, and 12-month age groups (Fig. 9A).
Fig.8
The extent of apical arborization can be further gauged by A) counting the number of dendrite intersections with Sholl rings. This value is significantly less in the dCA1 apical region of KO versus WT by 6 months but not at 3 months. KO Intersection numbers remain consistently lower, but less so through 9 and 12 months. B) Calculating the apical arbor complexity score. This parameter is similar in WT and KO mice at 3 months, but by 6 months complexity has greatly increased but in WT mice only. KOs fail to further develop over 9 and 12 months whereas the WT complexity peak decreases over the same period. The unexpected complexity reduction at 9 M in WT mice (arrow) is also observed in an independent measurement (specifically spine density shown in Fig. 10). Data represent the mean±SEM of measurements from 8–15 mice per group and were analyzed by Student’s t-test for unpaired data (A), and two-way ANOVA and a Tukey multiple comparison post-hoc test (B). *significant difference between WT and KO as indicated (*p < 0.05, **p < 0.01, ***p < 0.001).
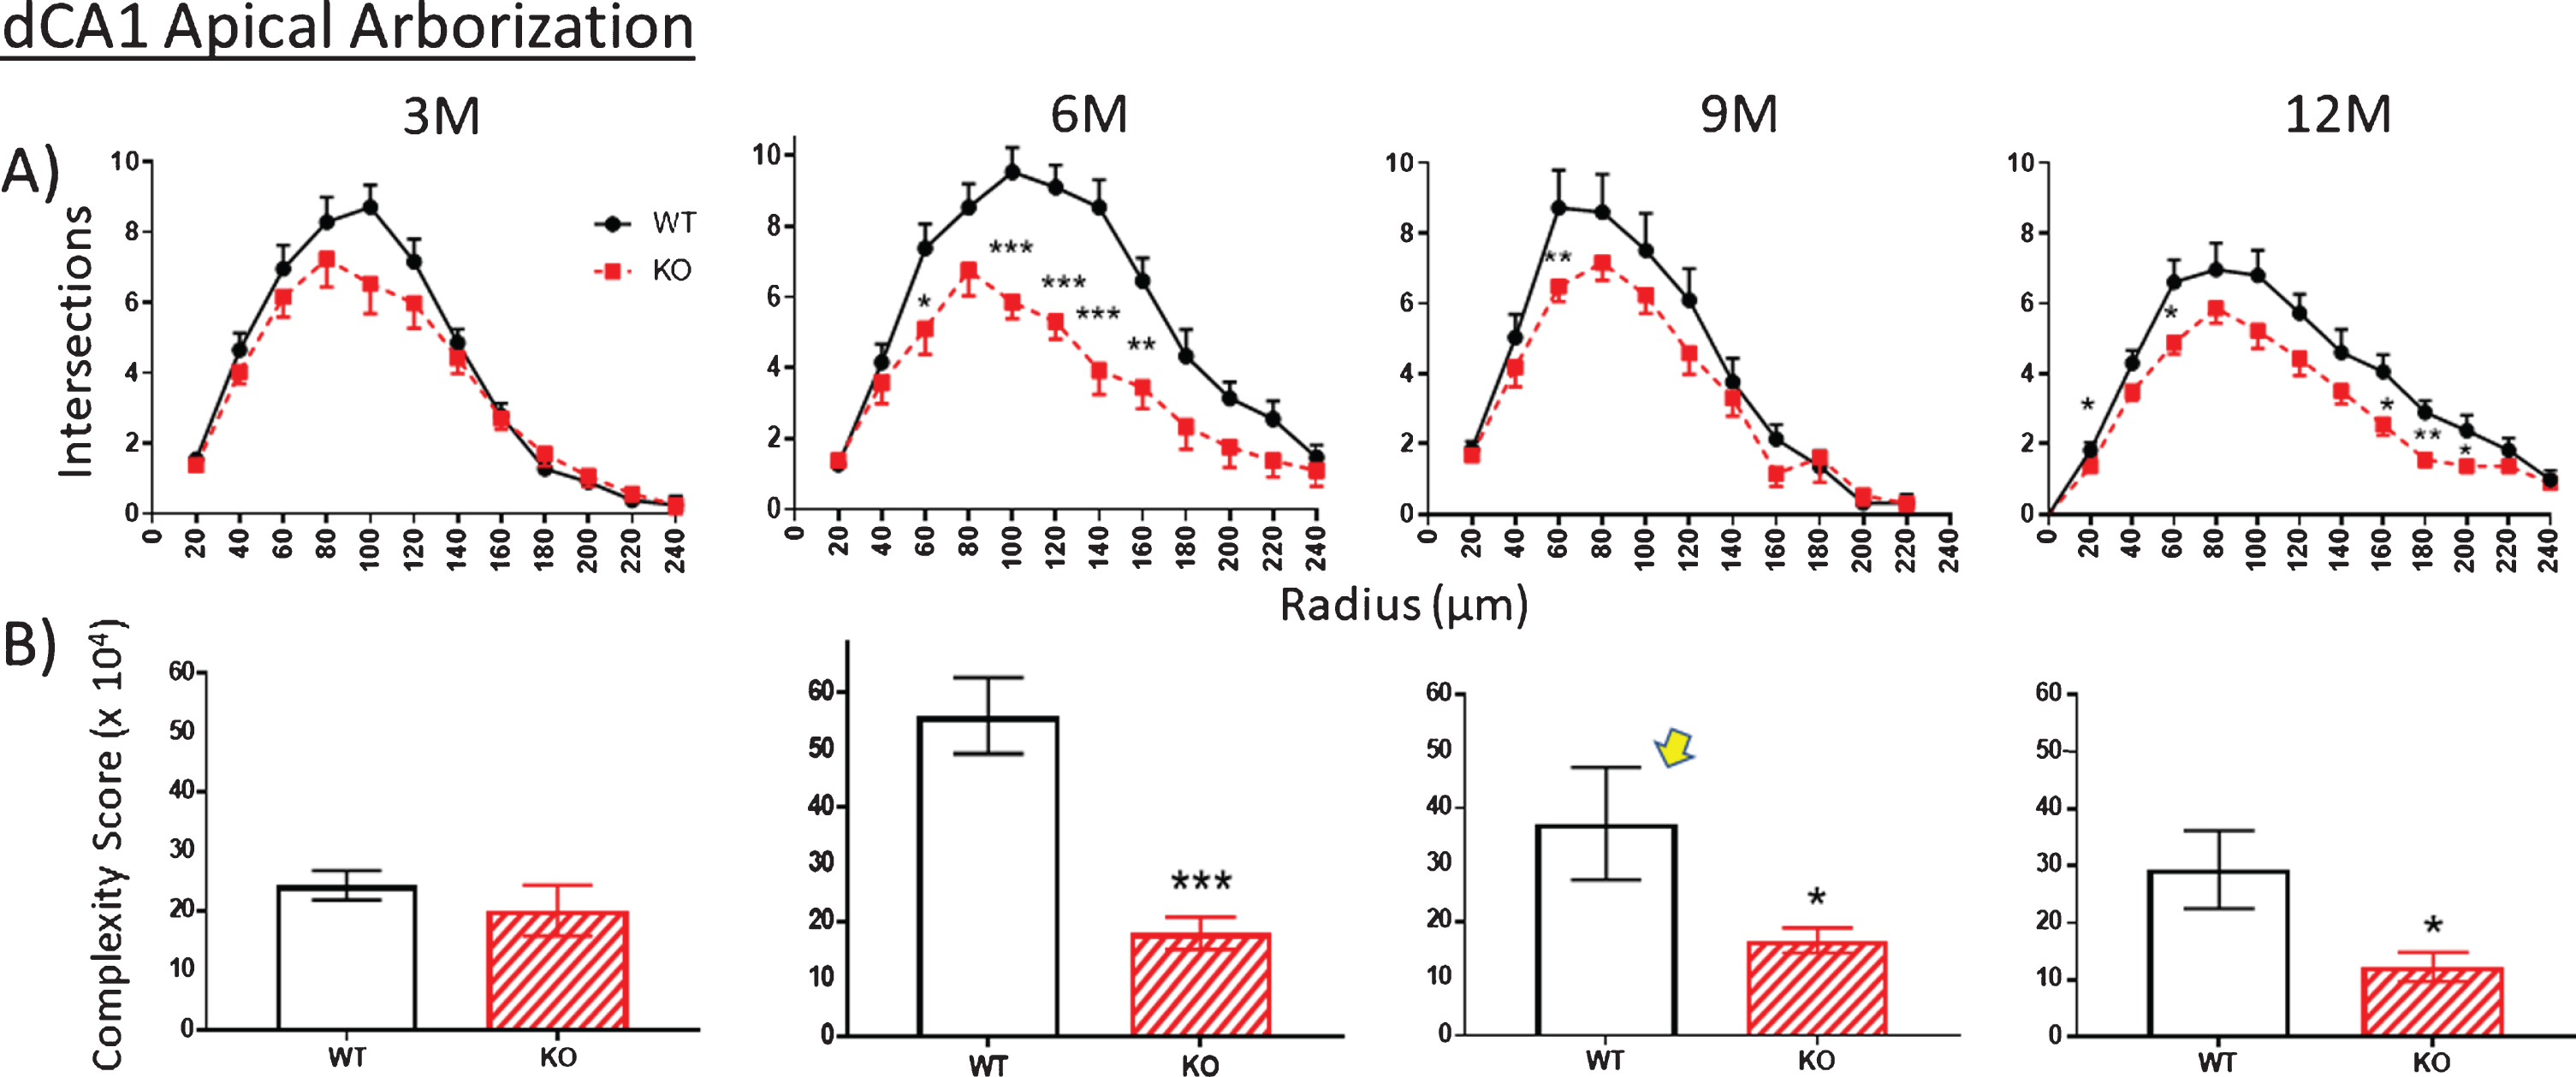
Fig.9
A). The extent of basal arborization is significantly less in the dCA1 basal region of KO versus WT across all ages. B) Likewise, the basal arbor complexity score is less in KO versus WT mice across all ages. The unexpected reduction in complexity at 9 M in WT mice (arrow) is also observed in an independent measurement (specifically spine density shown in Fig. 10). Data represent the mean±SEM of measurements from 8–15 mice per group and were analyzed by Student’s t-test for unpaired data (A), and two-way ANOVA and a Tukey multiple comparison post-hoc test (B). *significant difference between WT and KO as indicated (*p < 0.05, **p < 0.01, ***p < 0.001).
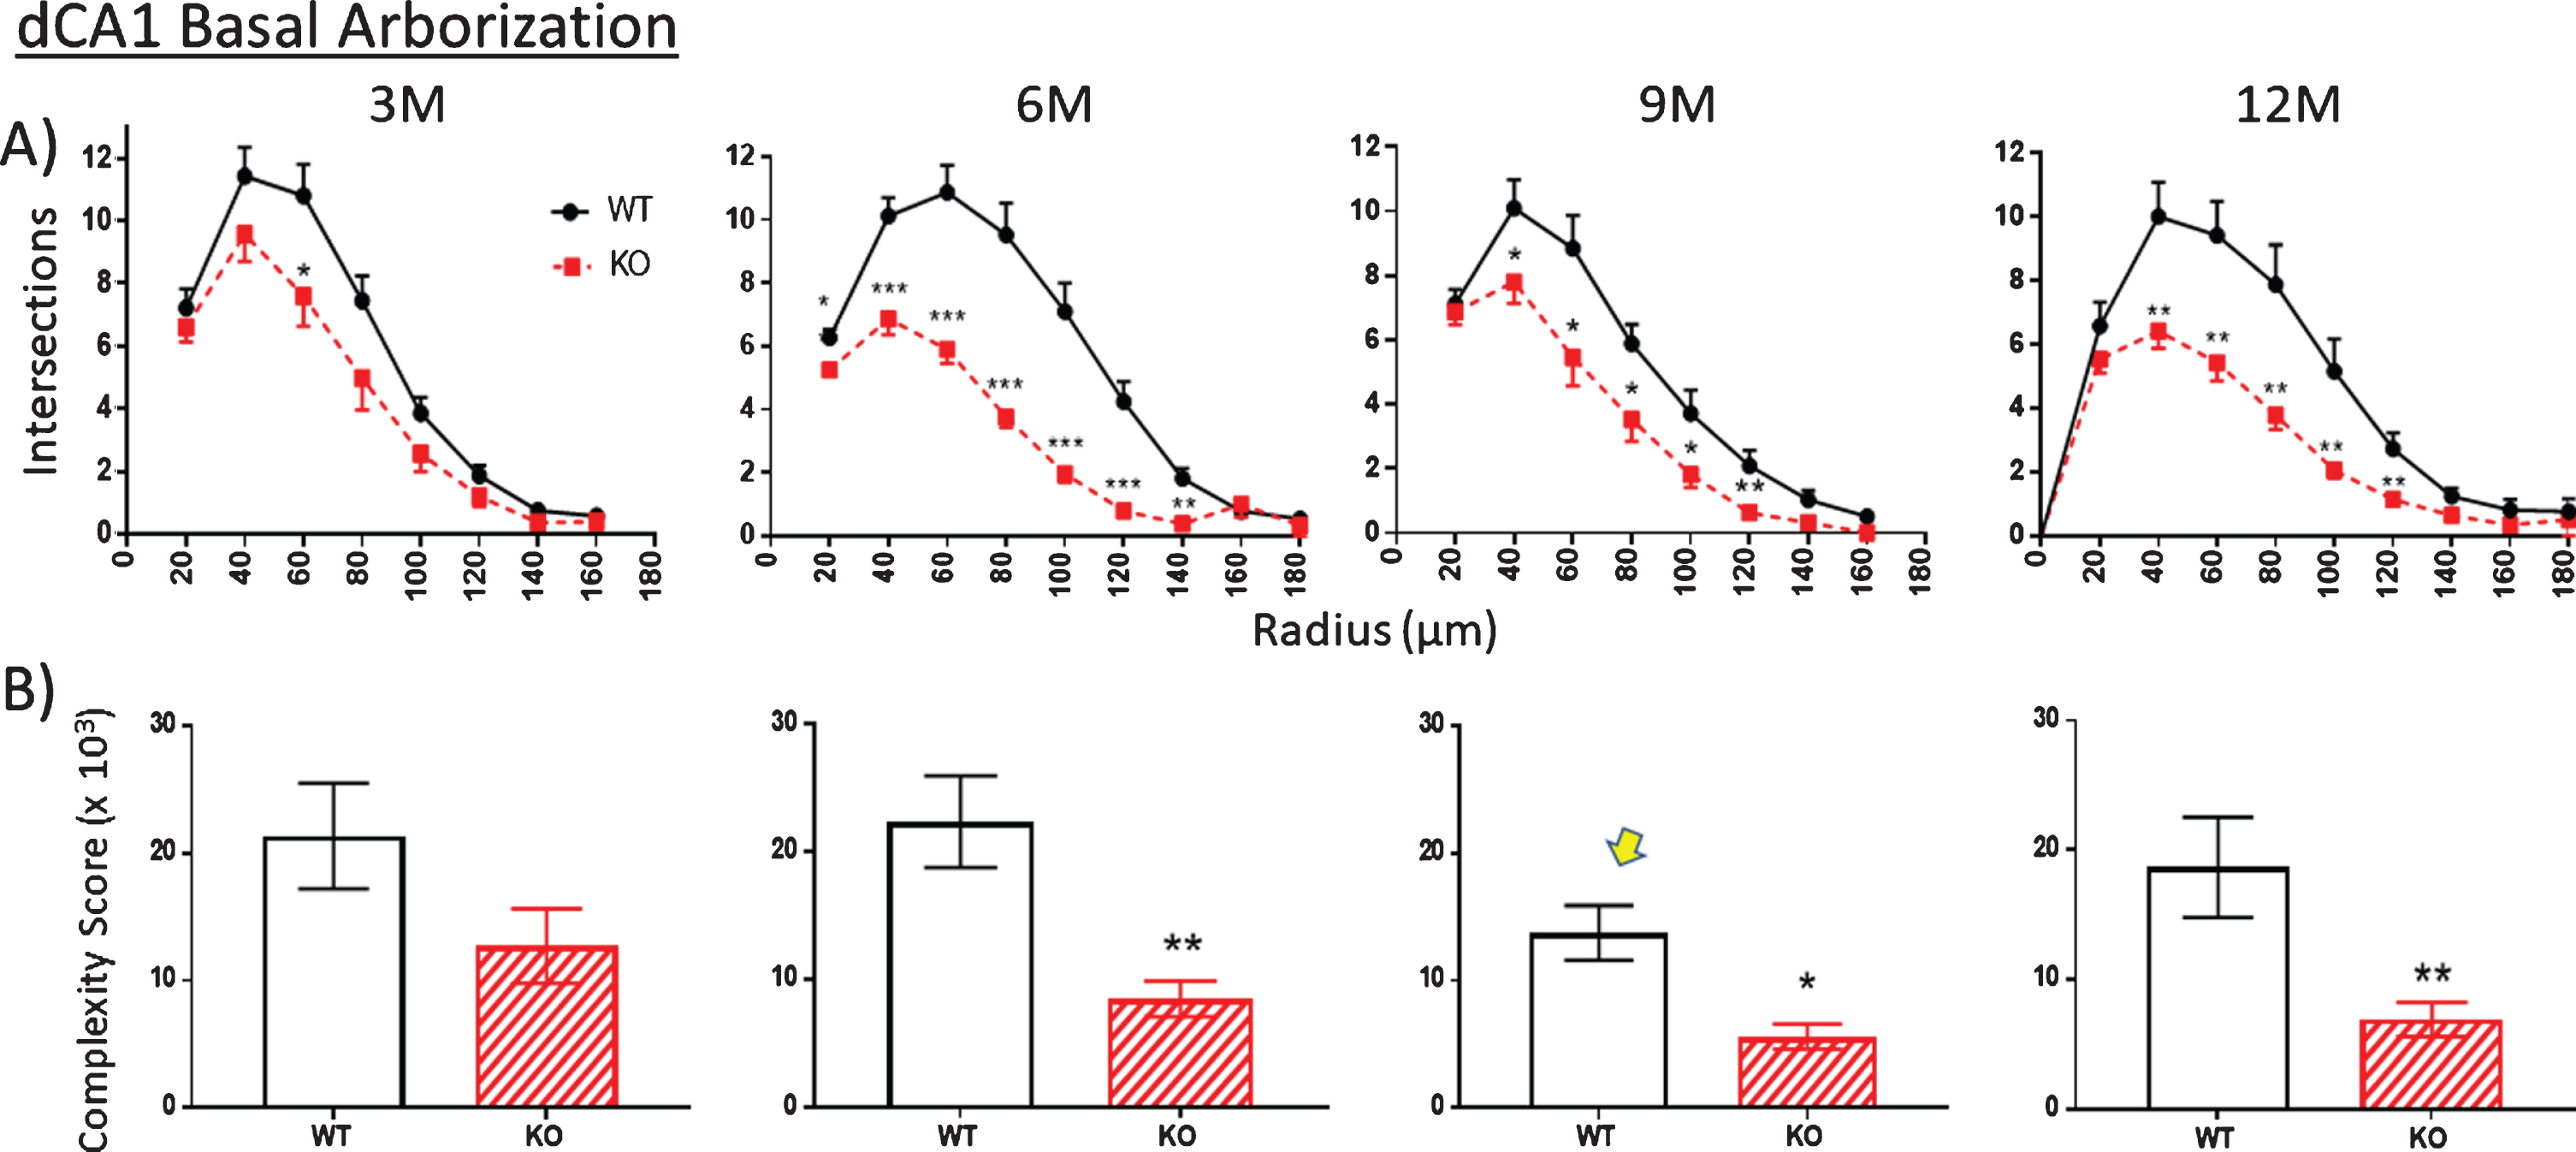
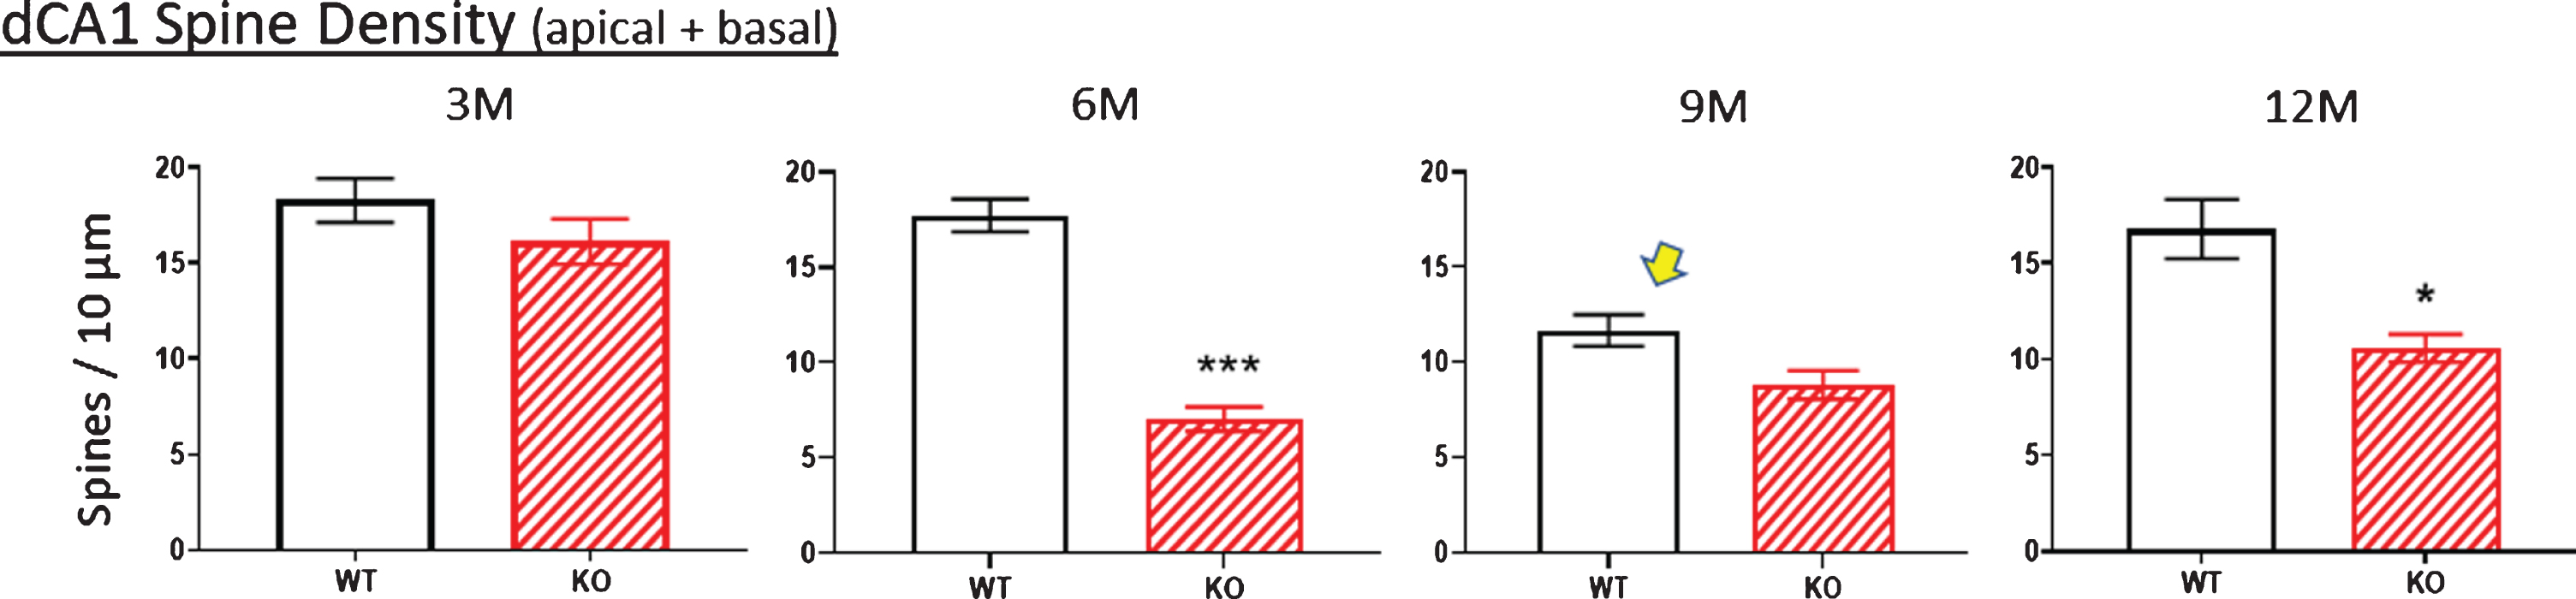
Fig.10
Age-related changes in spine density (pooled apical+basal arbors) of WT and KO mice display similar densities at age 3 M. By 6 M, WT values are unchanged whereas KO values significantly drop. Oddly, the WT value drops at 9 M and this is also observed in the independent complexity score measured at 9 M (arrows in Figs. 8B, 9B). Nevertheless, spine density is consistently lower in KO versus WT across age groups. Data represent the mean±SEM of measurements from 8–15 mice per group and were analyzed by two-way ANOVA and a Tukey multiple comparison post-hoc test. *significant difference between WT and KO as indicated (*p < 0.05, ***p < 0.001).
Complexity score
Using the calculation of arbor complexity, the above KO reductions combine to reduce the arbor complexity score. Regarding the apical arbor, the 3-month complexity score is equivalent in WT and KO groups (Fig. 8B), but then essentially doubles by 6 months and then progressively drops over 9 and 12 months. Basal dendrite complexity better reflects the previous measurements. That is, there is no statistical difference at 3 months in KO versus WT mice, but then significant reductions are seen at 6, 9, and 12 months (Fig. 9B). Note that the 9-month WT complexity value of the apical and basal dendrites appears low (Fig. 8B,9B, arrow). It reflects the reductions in KO nodes, ends, and intersections observed in previous figures. The unexpected reduction at 9 M in WT mice is however also observed in an independent measurement, specifically spine density, as described below.
Dendritic spine density
The apparent pruning of the pyramidal arbors and loss of spines of KO versus WT mice in the dorsal (but not ventral) CA1 region of 12-month KOs [10] prompted us to examine at what age the density of spines (i.e., the number of spines/10μm of dendritic length) was reduced and whether it coincided with cutback of the dendritic arbor in KO versus WT mice. Spines counts were made along dendrites confirmed as originating from dCA1 pyramidal cell bodies. Figure 10 shows spine density change with age along WT versus KO dendrites. Values in the apical and basal regions were pooled because we previously found no difference in the spine density reduction between the two arbors in 12-month-old KO mice [10]. Total spine density was not significantly different between 3-month-old mice WT and KO mice (Fig. 10, 3M), whereas at 6 months the reduction in KO mice was highly significant compared to WT. The reduction was less apparent in 9 M and 12 M KO mice, suggesting some recovery in KO mice. There was an unexpected reduction in the 9 M WT mice (Fig. 9B, arrow), This was the specific time point when this specific cohort of WT mice also displayed an unexpected decrease in the complexity score (Fig. 9B, arrow), a measure independent of spine density. Despite this apparent reduced synaptic input to the 9 M WT cohort, spine loss was consistently greater in KOs versus WTs at 6, 9, and 12 months.
Pyramidal cell bodies
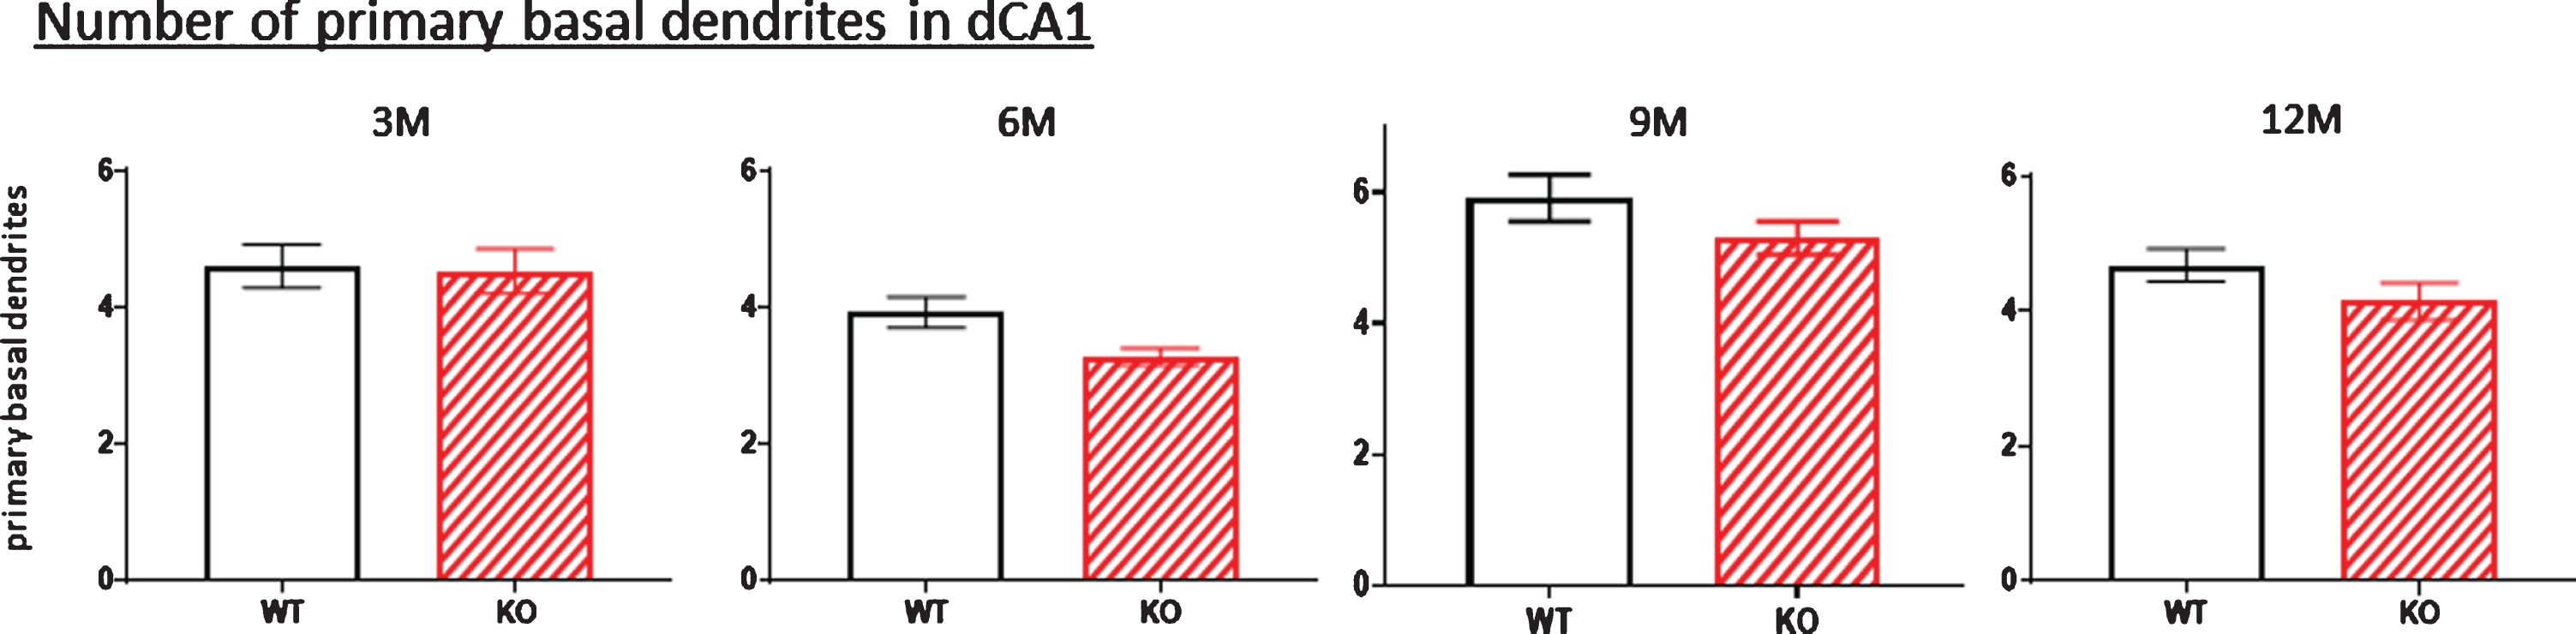
One possibility that might account for the reduced dendritic arbor of the dorsal hippocampal neurons (at least for the basal dendritic arbors) in KOs is that these neurons have lost one or more dendrites emanating from the cell body. We addressed this possibility in Fig. 11 where the number of basal dendrites emerging from the cell body were counted. There was no consistent age-related reduction in basal dendrite number in the KO mice between 3 and 12 months, indicating that the reduced basal dendritic arbors in the dorsal hippocampus of KOs do not result from lost primary dendrites arising from a cell body. There is a possible increase in basal dendritic numbers at nine months (Fig. 11, 9M). However, because both WT and KO littermates were affected, it could merely represent a general increase among this particular age cohort.
Fig.11
Because of the significant reduction in the dCA1 arborization of basal dendrites observed in KO versus WT mice (Figs. 1, 3, 5, 7, 9), the number of primary basal dendrites were measured in this region as mice aged. There were no significant differences in the total number of primary basal dendrites in KO versus WT mice at any age. Data represent the mean±SEM of measurements from 8–15 mice per group, analyzed by two-way ANOVA and a Tukey multiple comparison post-hoc test.
Oxidative damage measurements
Our mouse model displays a progressive increase in HNE protein adducts (a proxy for oxidative damage) in the KO mice based on immunoblot analysis of hippocampal homogenates [7]. We wanted to confirm this immunohistochemically in KO dCA1 where we found dendritic cutback to be most apparent [10]. Moreover, did the onset of oxidative damage precede the dendritic loss in dCA1 that is first apparent at 6 months?
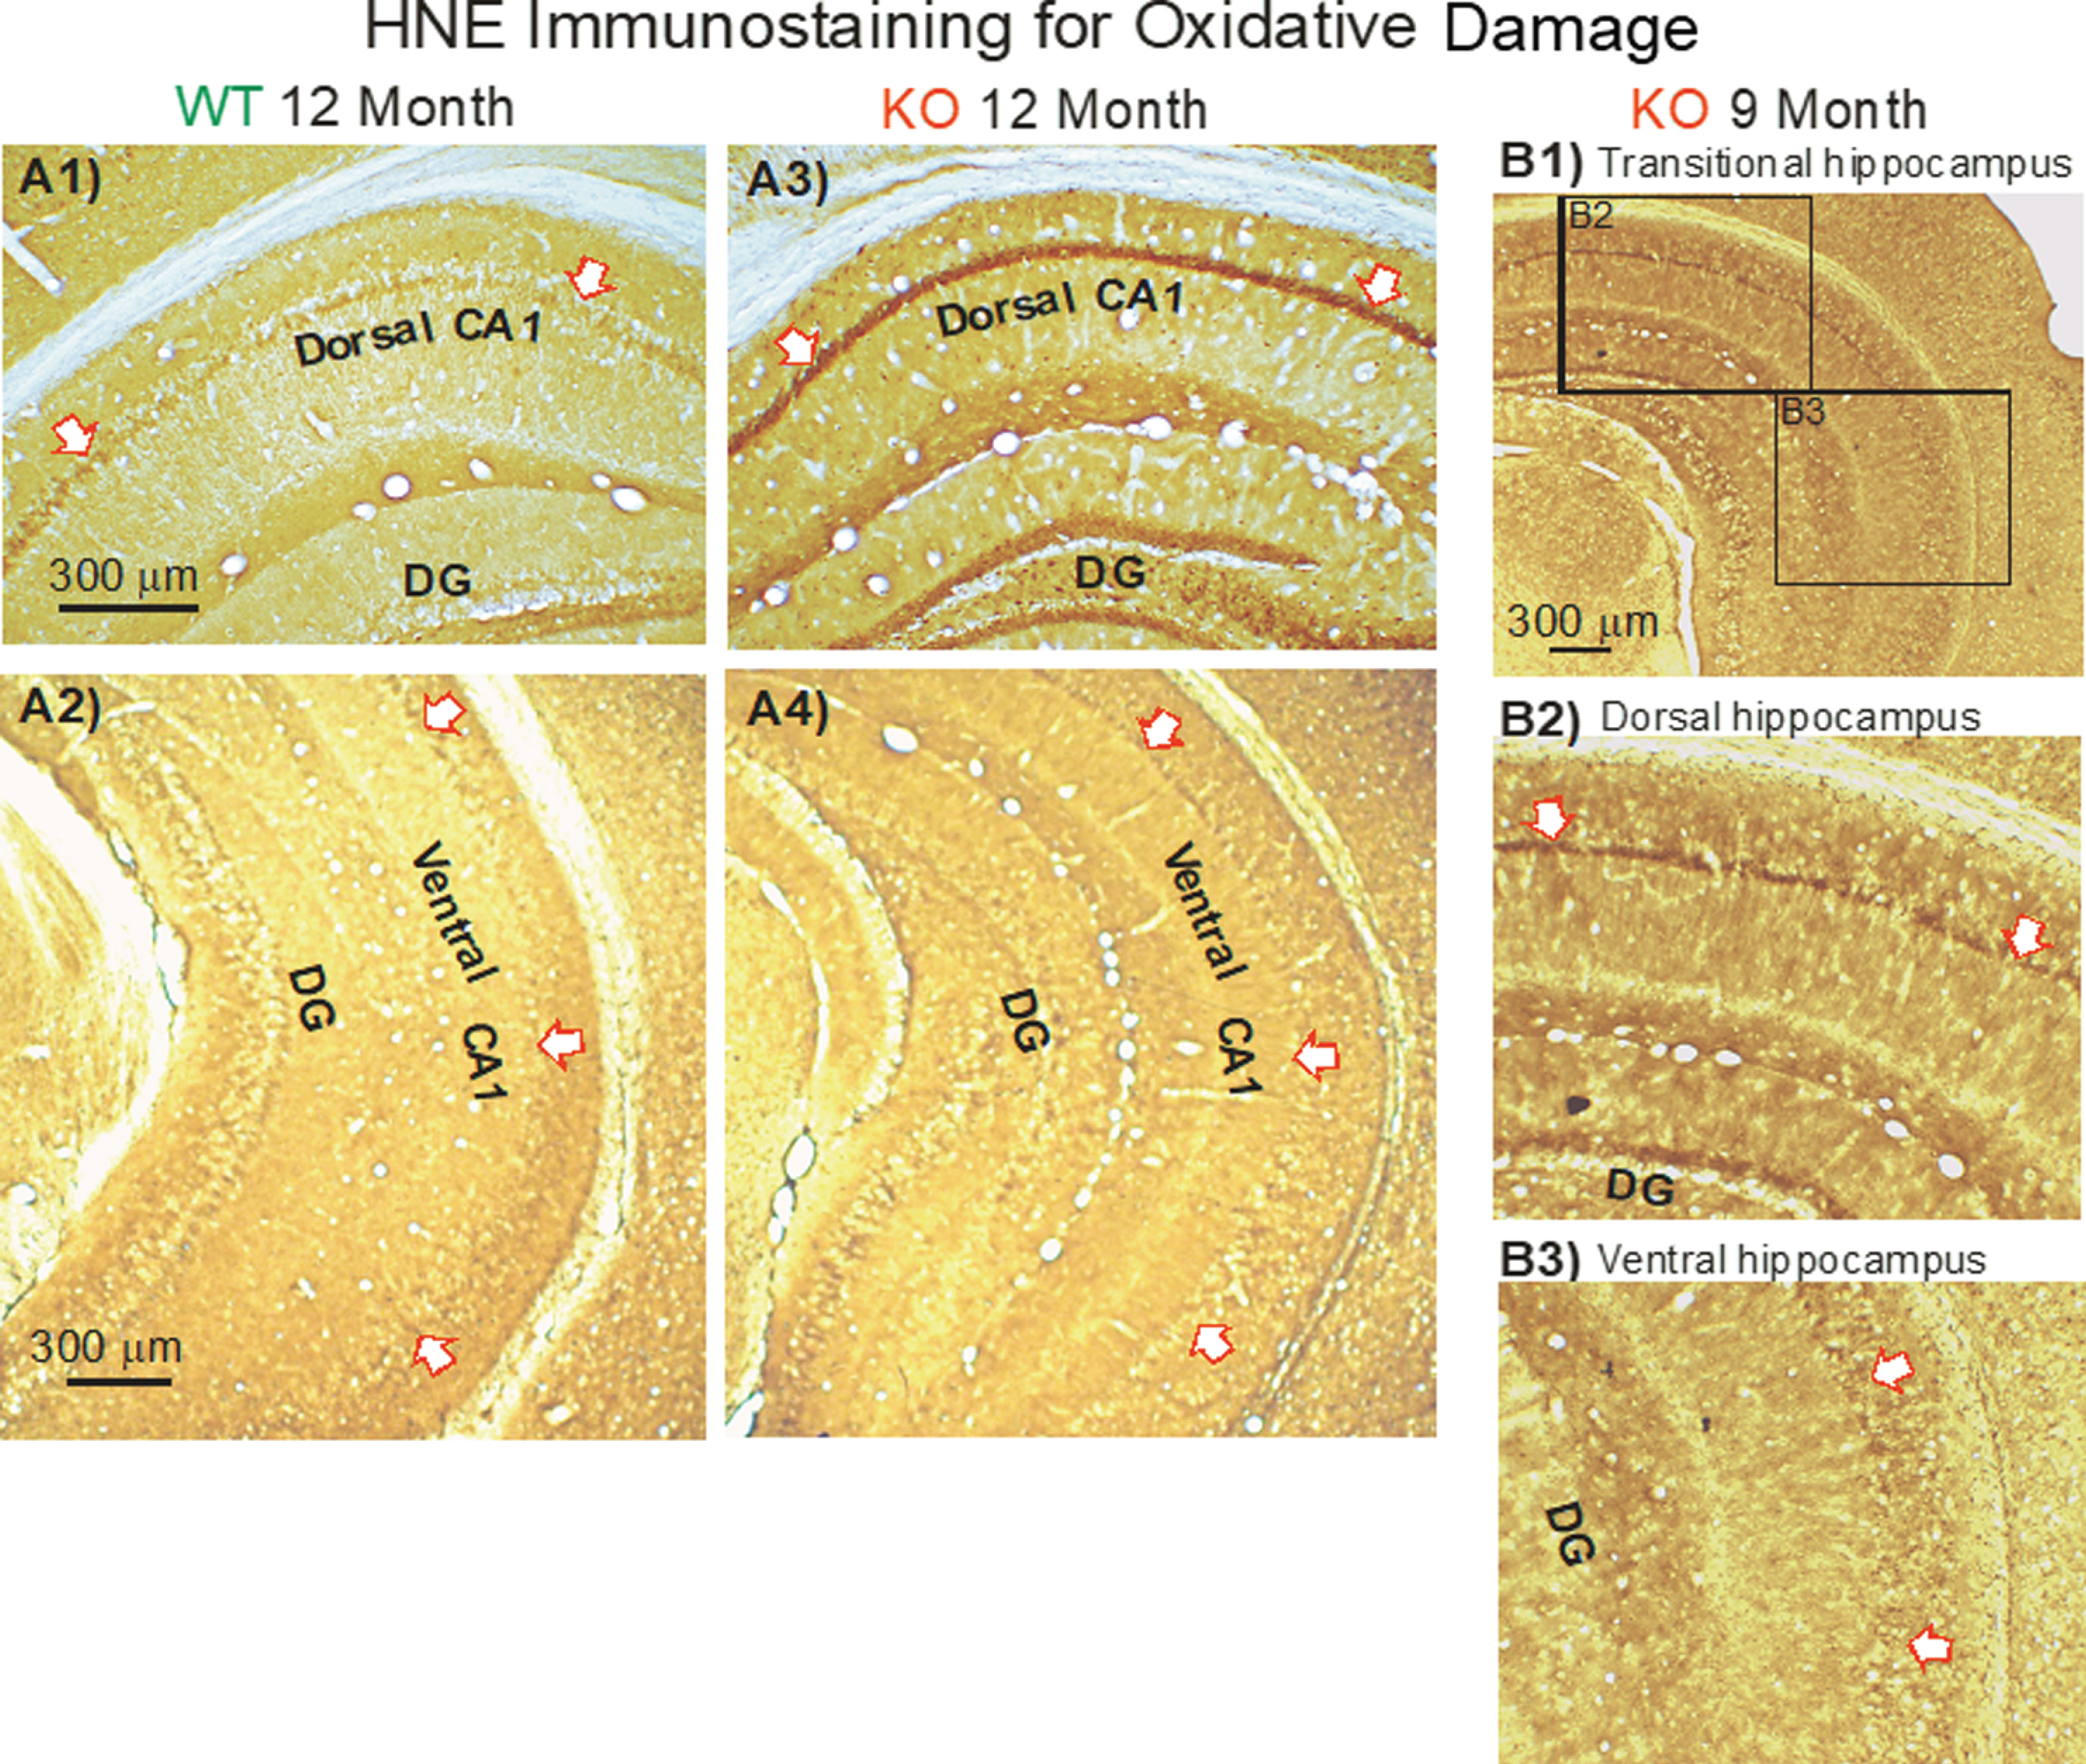
Compared to 12-month-old WT mice (Fig. 12A1), HNE staining of dCA1 pyramidal cell bodies in KO mice was dramatic (Fig. 12A3, arrows). And yet staining in the vCA1 was minimal in both WT (Fig. 12A2) and KO mice (Fig. 12A4). The difference is further shown in a single section of a 9-month-old mouse (Fig. 12B1) where obvious staining in dCA1 pyramidal neurons (Fig. 12B2, arrows) transitions to minor staining in vCA1 (Fig. 12B3, arrows).
Fig.12
In KO versus WT mice, HNE immunostaining (indicating oxidative damage) increased with aging in the dorsal CA1 region, but not in the ventral CA1 region. Arrows demarcate the CA1 cell body layer. A) Examples of HNE staining in the dorsal hippocampus from a WT mouse (A1) and from a KO mouse (A3) at age 12 months. Examples of HNE staining in the ventral hippocampus from a WT mouse (A2) and from a KO mouse (A4) at age 12 months. DG represents the dentate gyrus. B) In a single HNE-stained section (B1), the transition from darker staining in dCA1 (B2) to lighter staining in vCA1 (B3) is apparent.
Age-related immunohistochemical staining of dorsal CA1 cell bodies were plotted as density measurements from sections taken from 3, 6, 9, and 12-month WT versus KO mice (Fig. 13A). There was a significantly higher density of staining in the dCA1 pyramidale layer of the KO mice, as well as in the stratum radiatum of the dCA1 region (not plotted). As the KO mice aged through 6, 9, and 12 months, this disparity in staining density increased compared to WT. Regression analysis of the difference in HNE staining between dCA1 pyramidale in KO versus WT over time (Fig. 13C) indicated a strong linear correlation (R2 = 0.91).
Fig.13
A) Measuring the density of staining along the CA1 cell body layer at each age it was apparent that KO mice exhibited elevated staining compared to WT mice in the dorsal CA1. This elevation was statistically significant at 3 M and progressively increased through 12 M. B) No comparable increases were observed in the ventral CA1 pyramidale of the same mice. Data represent the mean±SEM of measurements from 9–14 sections from 3-4 mice per group and were analyzed by two-way ANOVA and a Tukey multiple comparison post-hoc test. *significant difference between WT and KO as indicated (**p < 0.01, ***p < 0.001). C) As the KO mice aged, the disparity in staining density in dCA1 pyramidale increased compared to WT. Regression analysis of the difference in HNE staining between KO and WT over time indicated a strong linear correlation (R2 = 0.91).
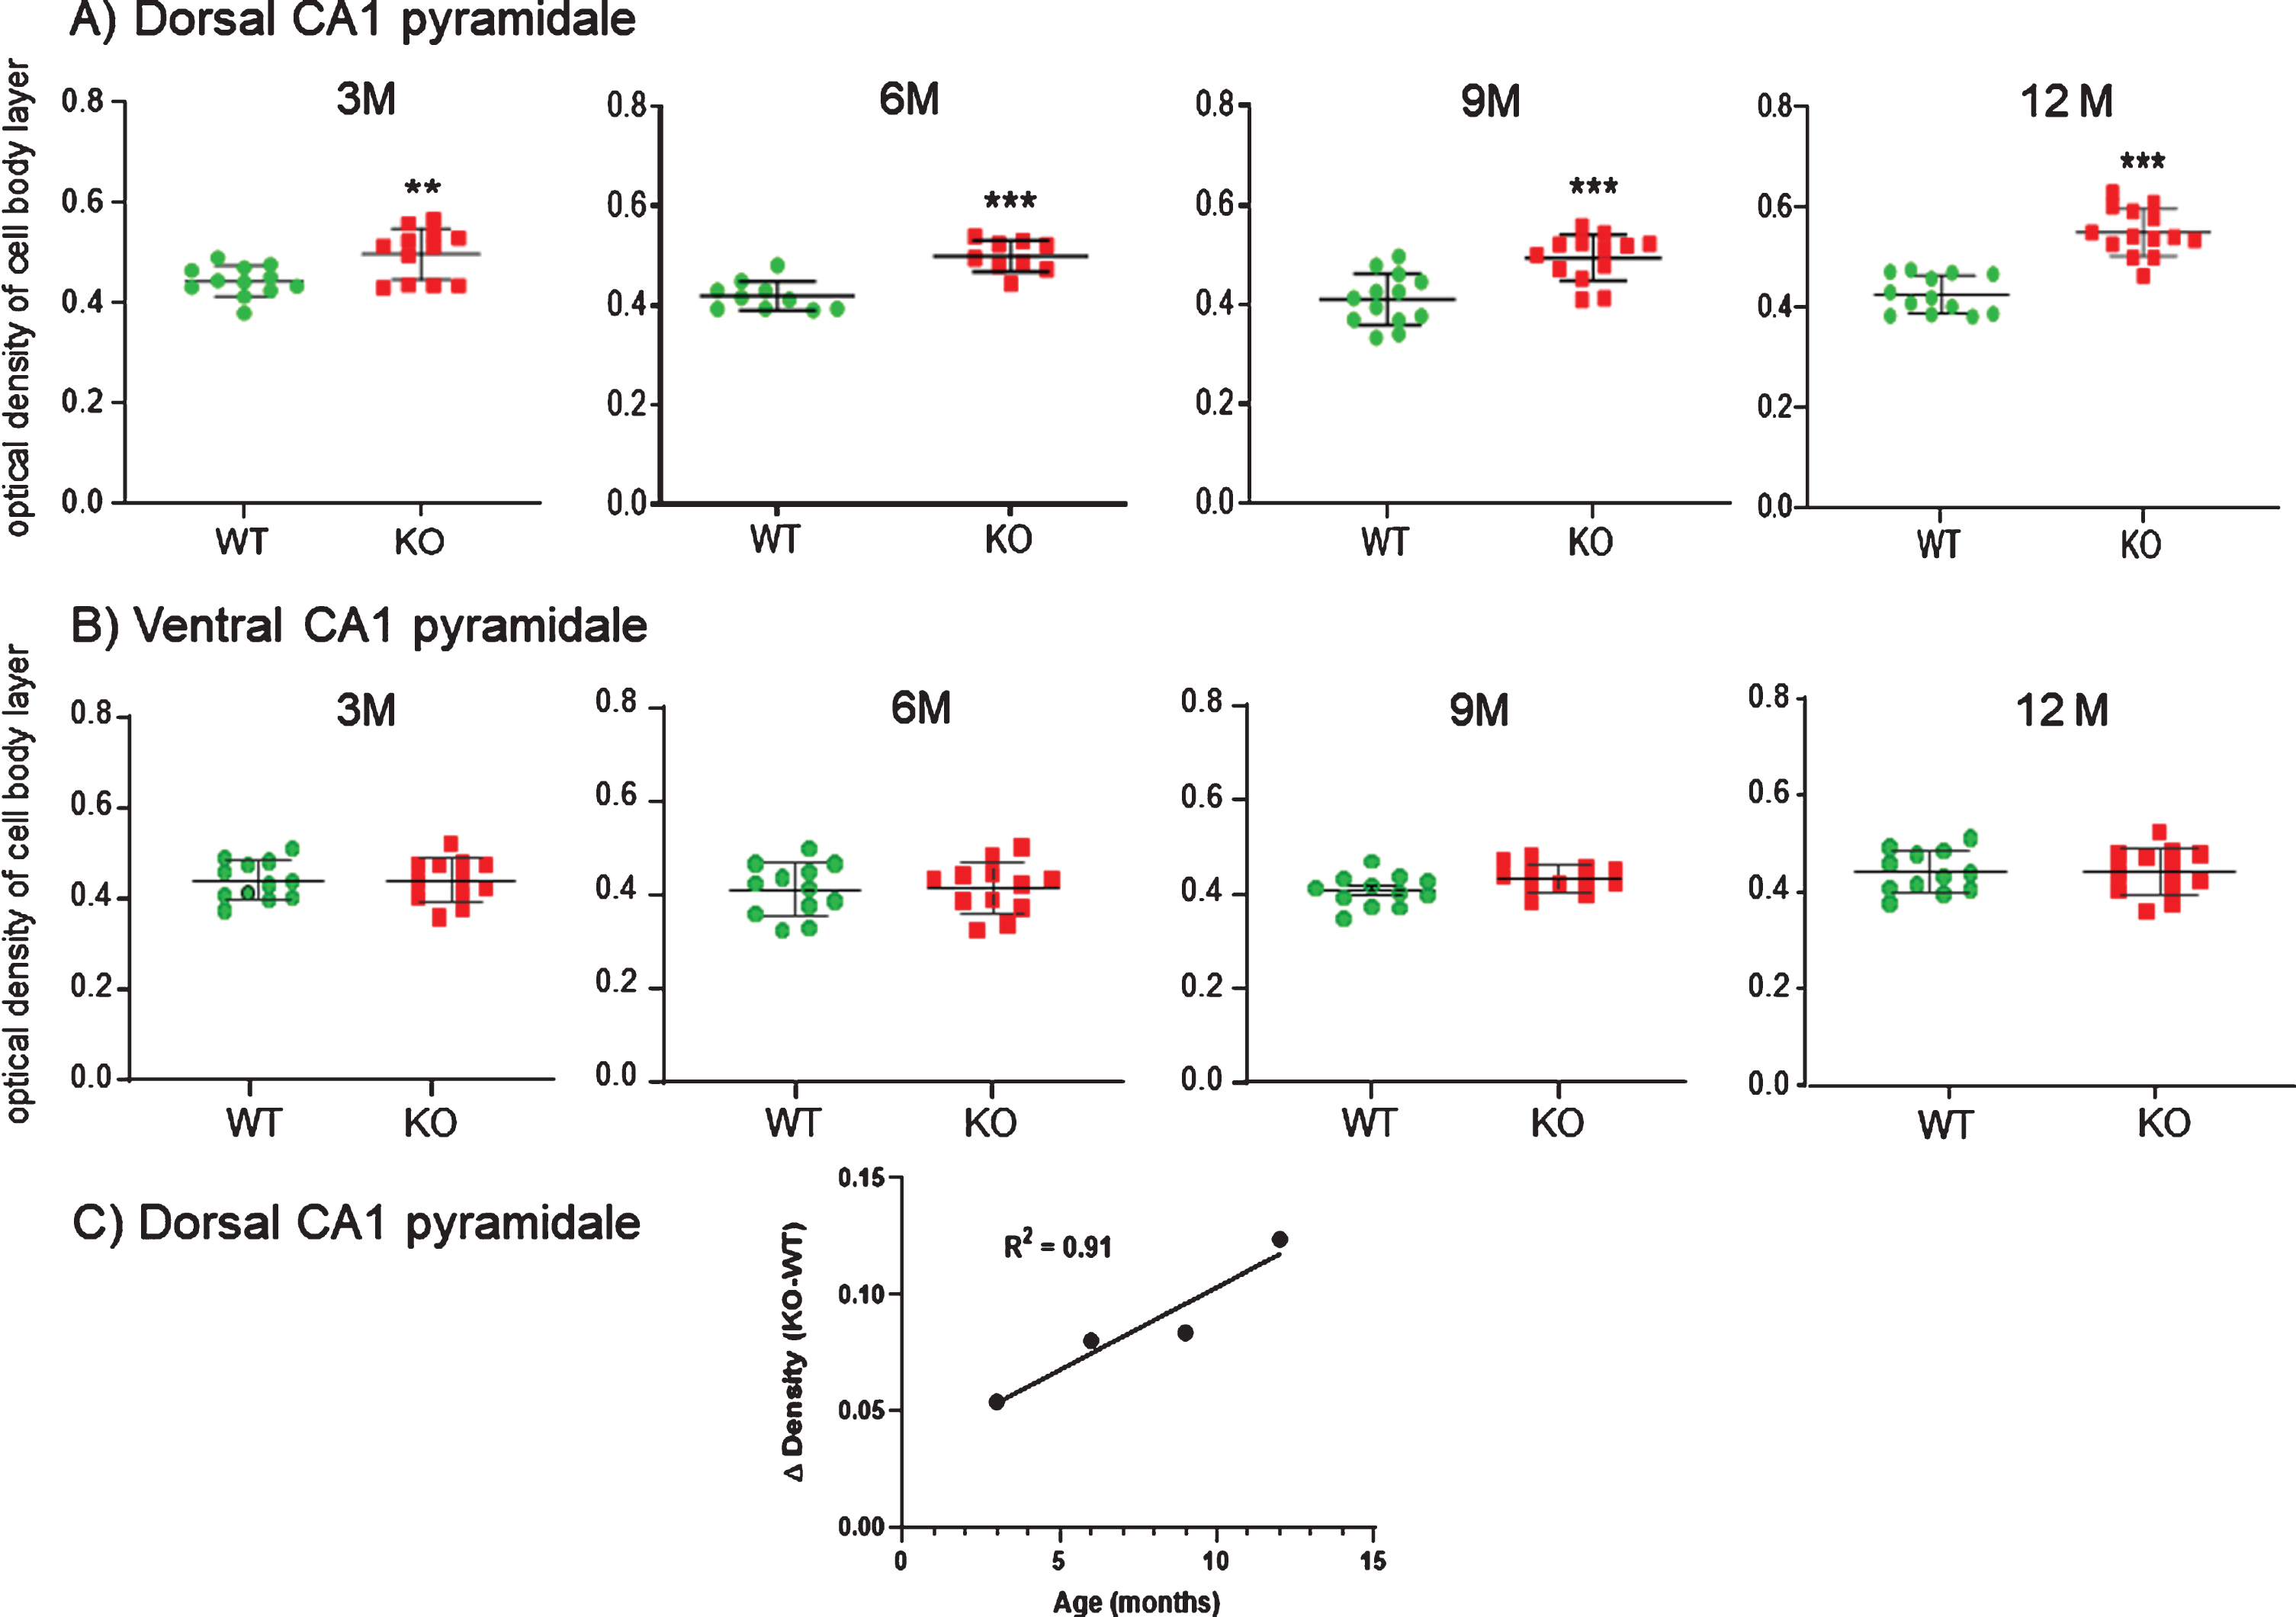
In contrast, there was no significant increase in the ventral CA1 pyramidale layer throughout 3, 6, 9, or 12 months in KO versus WT (Fig. 13B). Likewise, there was no difference in HNE staining in ventral CA1 stratum radiatum, nor in the medial septal region of the basal forebrain nor in the retrosplenal and entorhinal cortices (data not shown).
The increase in HNE staining in the dCA1 (but not vCA1) pyramidale was observable across the entire dorsal hippocampus of KO (Fig. 12A3) versus WT sections (Fig. 12A1). This included the cell body and dendritic regions of CA1, CA2, CA3, and dentate gyrus (not plotted).
DISCUSSION
We recently reported that in 12-month-old Aldh2-/- (KO) mice, both basal and apical CA1 dendrites of pyramidal neurons located in the dorsal but not ventral hippocampus are significantly shorter, have fewer branches, and have reduced complexity and spine density compared to age-matched WT mice [10]. However, the cell body perimeter and the number of primary dendrites emanating from these same pyramidal neurons were not affected, indicating that dendrites, not their cell bodies, were altered structurally in the in dCA1 of the KO mice. Cutback of basal CA1 dendritic arbors in human AD has been reported [17], and a number of other studies in human AD have shown spine loss and reduced dendritic arbors in the hippocampus [18–20]. We concluded that the reduced complexity and spine density of dCA1 pyramidal cells could reflect a regional vulnerability to oxidative damage, or that there was a reduction in synaptic input specifically to dCA1 pyramidal neurons that could have compromised the circuitry involving recognition and spatial memory for which the dorsal hippocampus region is a crucial component. Such behavioral deficits are observed in our KOs beginning around 3 months of age. Therefore, here we studied the emergence and development of this dramatic cutback in dCA1 pyramidal cell arborization at ages 3, 6, and 9 months in both WT and KO mice and compared the data to our previous 12-month data.
A developing cut-back of dCA1 cell arbors in KO mice
We used several morphometric measures to determine 1) the extent of the dendritic arbor in the WT versus KO mice, 2) when cutback became detectable, and 3) to what extent the arbor further deteriorated as the mice aged. We measured several parameters: dendritic length, dendritic nodes and ends, branch points, arbor complexity, and the density of spines along dendrites. With regard to every parameter measured, there was no difference in KO versus WT mice at the age of three months. Yet by six months, there was a dramatic reduction in every parameter measuring the extent of the dendritic arbor. This applied to both apical and basal regions of the dCA1 neurons. Generally, each parameter remained significantly reduced in KO versus WT mice.
The progressive reduction in spine density measured in KO versus WT mice between 3 and 6 months of age was observed in both apical and basal dendrites. We had previously characterized the loss as occurring with all morphological types of spines (mushroom, stubby, filopodic) [10] but pooled these numbers for this study. The majority of spines (95%) are of the mushroom type. Importantly, reductions to both the arbor and to the spine density provide independent correlative evidence that morphologically detectable loss of synaptic input to dCA1 neurons is not apparent until after 3 months of age in KO versus WT. Moreover, dendritic cutback is most dramatic between 3 and 6 months. In contrast, increases in oxidative damage in dCA1 cell bodies in KOs (denoted by HNE staining) are gradual and detectable from 3 months onward. Unlike dendrite cutback, there is no sudden staining increase at 6 months. Rather it is highest at 12 months. While oxidative damage and dendritic cutback may help account for the behavioral deficits seen in the KO mice at 3 months [7], such changes are too subtle for our techniques to detect at that age.
No morphological changes to pyramidal cell bodies
The only measured parameter that remained relatively constant in WT versus KO mice was the number of primary basal dendrites emanating from the cell body. These values did not greatly fluctuate over the entire 3 to 12 months, thus reductions in dendrite branches in KO mice must have occurred more distally, the result of trimming of secondary and tertiary dendrites. Regarding possible changes to the neuronal soma, we previously measured cell body perimeters and determined that there was no systematic swelling or shrinking of the pyramidal cell body population in KO compared to WT mice.
Oxidative damage precedes the detection of reduced dendritic development of dCA1 pyramidal neurons
Compared to WT mice, elevated oxidative damage, indicated by increased HNE staining, was significantly increased in the dCA1 cell body layer and stratum radiatum at 3 months of age in KO mice. It steadily increased in KO but not WT mice through 12 months. No comparable change was observed in the ventral CA1 pyramidale in KO versus WT mice. Regarding the dendritic arbors, every morphological parameter that we measured showed that the extent and complexity of the dCA1 dendrites were similar in 3-month-old WT and KO mice. So our HNE immunostaining detected increased, but mild, oxidative damage in the dorsal CA1 cell body layer of KO versus WT mice starting at 3 months when there was no significant cutback in the dCA1 dendritic arbor. So increased oxidative damage precedes, and can help account for, the selective reduction of dendritic complexity in dCA1 first detected at 6 months of age.
Based on the dendritic cutback that we detailed in this ALDH2-/- mouse at 12 months, we proposed an elevated vulnerability of the dorsal hippocampus to oxidative damage compared to vCA1 and to neocortex [10]. The findings presented here confirm this over a longer time frame. Ischemia/reperfusion is well known to cause the accelerated formation of reactive oxygen species [21, 22], and the dCA1 region is much more vulnerable than vCA1 to ischemic damage following ischemia reperfusion [23], suggesting that antioxidant defense mechanisms to counteract excessive reactive oxygen species production are less effective in the dCA1 region. This is consistent with a number of studies describing differential gene expression along the dorsoventral long axis of the hippocampus [24–27].
Several antioxidant genes exhibit greater expression in vCA1 pyramidal neurons compared to dCA1 neurons, including mitochondrial superoxide dismutase, myeloperoxidase, ALDH5A1, and NAD(P)H quinone oxidoreductase [24, 27]. In contrast, the expression of the superoxide–generating enzyme NADPH oxidase 4 is 2-fold greater in dCA1 neurons. Glutathione transferase A4 has high catalytic activity towards the conjugation of reduced glutathione with HNE, and plays a major role in HNE detoxification [28, 29]. Its level of expression is 2-fold greater in vCA1 neurons, as is the expression of the transcription factor Nrf2, which responds to oxidative stress by upregulating the expression of number of antioxidant enzymes. Interestingly, in addition to its role in mediating lipid peroxidation-induced cellular damage, at lower concentrations HNE can act as a signaling molecule. HNE activates the Nrf2 signaling pathway by forming HNE adducts with Keap1 and preventing the formation of the Nrf2-Keap1 complex. Free Nrf2 is then able to translocate to the nucleus and increase transcription [30–32]. Thus in the KO mice, with reduced capacity to catabolize HNE, one might expect a more robust activation of Nrf2 in the ventral hippocampus. Overall, these data suggest that the dCA1 region is inherently more susceptible to the deleterious effects of oxidative stress-induced damage, which then likely promotes the trimming back of dCA1 arbors.
With respect to behavioral changes in KO mice, we have assessed the time course for development of cognitive impairment for three hippocampus-dependent tasks- the open field novel object recognition (NOR) task (working memory), spontaneous alternations in the Y-maze (spatial working memory), and the Morris water maze (MWM) task (spatial reference memory) [7, 9]. In all three behavioral tests, there is a progressive decrease in performance in KO mice compared to no change in their WT littermates. For the NOR and Y-maze tasks, memory deficits begin at 3.5 to 4 months of age and plateau in 7.5- to 8-month-old animals [7]. Likewise, in the MWM task, impaired performance is observed in 2.5-3-month-old animals and continues to decline until 6 to 7 months [9]. No further deterioration is seen in 9- or 12-month-old animals. Thus, the changes in cognitive performance mirror the appearance of oxidative damage in the dorsal hippocampus.
In conclusion, our study indicates that increased oxidative damage contributes to loss of neural reserve, particularly via dCA1 dendritic cutback, that normally defines the ability to maintain healthy cognitive function. However, in addition to the structural changes documented here, the numerous AD-like pathological changes seen in this model also likely contribute to the progressive decline in performance of dCA1-dependent memory tasks. This study demonstrates the gradual and significantly reduced branching and complexity of dendrites specific to CA1 pyramidal neurons in the dorsal (but not ventral) hippocampus. This cutback occurs between the ages of 3 and 6 months in Aldh2 null mice as compared to their WT counterparts. This on-going trimming back of KO dendritic arbors in dorsal hippocampus is preceded by oxidative damage which is elevated by 3 months of age within the dCA1, but not in the vCA1, of KO mice. The specific cutback in dorsal CA1 helps account for the previously documented progressive worsening of cognitive deficits in these KO mice compared to their WT cohort [7, 9].
ACKNOWLEDGMENTS
The authors thank Ms. Lihua Xue and Ms. Diane Anderson for technical assistance and Dr. D.J. Cook (Department of Surgery, Queen’s University) for the use of his microscope and the Neurolucida system. Thank-you also to Dr. Fernanda de Felice for helpful advice. The Aldh2-/- mice were kindly provided by T. Kawamoto, University of Occupational and Environmental Health, Kitakyushu, Japan. This work was supported by a grant to RHM by the Saudi Cultural Bureau, a Canadian Institutes of Health Research grant to BMB (PJT 153013), and operating grants from the Heart and Stroke Foundation of Canada (G-19-0024266) and the National Science and Engineering Research Council (RGPN/04624-2017) to RDA.
Authors’ disclosures available online (https://www.j-alz.com/manuscript-disclosures/20-1024r1).
REFERENCES
[1] | Nunomura A , Perry G , Aliev G , Hirai K , Takeda A , Balraj EK , Jones PK , Ghanbari H , Wataya T , Shimohama S , Chiba S , Atwood CS , Petersen RB , Smith MA ((2001) ) Oxidative damage is the earliest event in Alzheimer disease. J Neuropathol Exp Neurol 60: , 759–767. |
[2] | Praticò D ((2008) ) Oxidative stress hypothesis in Alzheimer’s disease: A reappraisal. Trends Pharmacol Sci 29: , 609–615. |
[3] | Reed T , Perluigi M , Sultana R , Pierce WM , Klein JB , Turner DM , Coccia R , Markesbery WR , Butterfield DA ((2008) ) Redox proteomic identification of 4-Hydroxy-2-nonenal-modified brain proteins in amnestic mild cognitive impairment: Insight into the role of lipid peroxidation in the progression and pathogenesis of Alzheimer’s disease. Neurobiol Dis 30: , 107–120. |
[4] | Reed TT , Pierce WM , Markesbery WR , Butterfield DA ((2009) ) Proteomic identification of HNE-bound proteins in early Alzheimer disease: Insights into the role of lipid peroxidation in the progression of AD. Brain Res 1274: , 66–76. |
[5] | Perluigi M , Sultana R , Cenini G , Di Domenico F , Memo M , Pierce WM , Coccia R , Butterfield DA ((2009) ) Redox proteomics identification of 4-hydroxynonenal-modified brain proteins in Alzheimer’s disease: Role of lipid peroxidation in Alzheimer’s disease pathogenesis. Proteomics Clin Appl 3: , 682–693. |
[6] | Sultana R , Perluigi M , Butterfield DA ((2013) ) Lipid peroxidation triggers neurodegeneration: A redox proteomics view into the Alzheimer disease brain. Free Radic Biol Med 62: , 157–169. |
[7] | D’Souza Y , Elharram A , Soon-Shiong R , Andrew RD , Bennett BM ((2015) ) Characterization of Aldh2 -/- mice as an age-related model of cognitive impairment and Alzheimer’s disease. Mol Brain 8: , 27. |
[8] | Knopp RC , Lee SH , Hollas M , Nepomuceno E , Gonzalez D , Tam K , Aamir D , Wang Y , Pierce E , BenAissa M , Thatcher GRJ ((2020) ) Interaction of oxidative stress and neurotrauma in ALDH2-/- mice causes significant and persistent behavioral and pro-inflammatory effects in a tractable model of mild traumatic brain injury. Redox Biol 32: , 101486. |
[9] | Elharram A , Czegledy NM , Golod M , Milne GL , Pollock E , Bennett BM , Shchepinov MS ((2017) ) Deuterium-reinforced polyunsaturated fatty acids improve cognition in a mouse model of sporadic Alzheimer’s disease. FEBS J 284: , 4083–4095. |
[10] | Mehder RH , Bennett BM , Andrew RD ((2020) ) Morphometric analysis of hippocampal and neocortical pyramidal neurons in a mouse model of late onset Alzheimer’s disease. J Alzheimers Dis 74: , 1069–1083. |
[11] | Fanselow MS , Dong H-W ((2010) ) Are the dorsal and ventral hippocampus functionally distinct structures? Neuron 65: , 7–19. |
[12] | Kitagawa K , Kawamoto T , Kunugita N , Tsukiyama T , Okamoto K , Yoshida A , Nakayama K , Nakayama K ((2000) ) Aldehyde dehydrogenase (ALDH) 2 associates with oxidation of methoxyacetaldehyde; in vitro analysis with liver subcellular fraction derived from human and Aldh2 gene targeting mouse. FEBS Lett 476: , 306–311. |
[13] | Isse T , Oyama T , Kitagawa K , Matsuno K , Matsumoto A , Yoshida A , Nakayama K , Nakayama K , Kawamoto T ((2002) ) Diminished alcohol preference in transgenic mice lacking aldehyde dehydrogenase activity. Pharmacogenetics 12: , 621–626. |
[14] | Sholl DA ((1953) ) Dendritic organization in the neurons of the visual and motor cortices of the cat. J Anat 87: , 387–406. |
[15] | Pillai AG , de Jong D , Kanatsou S , Krugers H , Knapman A , Heinzmann J-M , Holsboer F , Landgraf R , Joëls M , Touma C ((2012) ) Dendritic morphology of hippocampal and amygdalar neurons in adolescent mice is resilient to genetic differences in stress reactivity. PLoS One 7: , e38971. |
[16] | Perez-Cruz C , Nolte MW , van Gaalen MM , Rustay NR , Termont A , Tanghe A , Kirchhoff F , Ebert U ((2011) ) Reduced spine density in specific regions of CA1 oyramidal neurons in two transgenic mouse models of Alzheimer’s disease. J Neurosci 31: , 3926–3934. |
[17] | Yamada M , Wada Y , Tsukagoshi H , Otomo E , Hayakawa M ((1988) ) A quantitative Golgi study of basal dendrites of hippocampal CA1 pyramidal cells in senile dementia of Alzheimer type. J Neurol Neurosurg Psychiatry 51: , 1088–1090. |
[18] | Mehraein P , Yamada M T-DE ((1975) ) Quantitative study on dendrites and dendritic spines in Alzheimer’s disease and senile dementia. Adv Neurol 12,: , 453–458. |
[19] | Ferrer I , Gullotta F ((1990) ) Down’s syndrome and Alzheimer’s disease: Dendritic spine counts in the hippocampus. Acta Neuropathol 79: , 680–685. |
[20] | Moolman DL , Vitolo OV , Vonsattel J-PG , Shelanski ML ((2004) ) Dendrite and dendritic spine alterations in Alzheimer models. J Neurocytol 33: , 377–387. |
[21] | Granger DN , Kvietys PR ((2015) ) Reperfusion injury and reactive oxygen species: The evolution of a concept. Redox Biol 6: , 524–551. |
[22] | Milne GL , Dai Q , Roberts LJ ((2015) ) The isoprostanes–25 years later. Biochim Biophys Acta 1851: , 435–445. |
[23] | Ashton D , Van Reempts J , Haseldonckx M , Willems R ((1989) ) Dorsal-ventral gradient in vulnerability of CA1 hippocampus to ischemia: A combined histological and electrophysiological study. Brain Res 487: , 368–372. |
[24] | Cembrowski MS , Wang L , Sugino K , Shields BC , Spruston N ((2016) ) Hipposeq: A comprehensive RNA-seq database of gene expression in hippocampal principal neurons. Elife 5: , e14997. |
[25] | Thompson CL , Pathak SD , Jeromin A , Ng LL , MacPherson CR , Mortrud MT , Cusick A , Riley ZL , Sunkin SM , Bernard A , Puchalski RB , Gage FH , Jones AR , Bajic VB , Hawrylycz MJ , Lein ES ((2008) ) Genomic anatomy of the hippocampus. Neuron 60: , 1010–1021. |
[26] | Dong H-W , Swanson LW , Chen L , Fanselow MS , Toga AW ((2009) ) Genomic-anatomic evidence for distinct functional domains in hippocampal field CA1. Proc Natl Acad Sci U S A 106: , 11794–11799. |
[27] | Cembrowski MS , Bachman JL , Wang L , Sugino K , Shields BC , Spruston N ((2016) ) Spatial gene-expression gradients underlie prominent heterogeneity of CA1 pyramidal neurons. Neuron 89: , 351–368. |
[28] | Awasthi YC , Ansari GAS , Awasthi S ((2005) ) Regulation of 4-hydroxynonenal mediated signaling by glutathione S-transferases. Methods Enzymol 401: , 379–407. |
[29] | Balogh LM , Atkins WM ((2011) ) Interactions of glutathione transferases with 4-hydroxynonenal. Drug Metab Rev 43: , 165–178. |
[30] | Zhang H , Forman HJ ((2009) ) Signaling pathways involved in phase II gene induction by α, β-unsaturated aldehydes. Toxicol Ind Health 25: , 269–278. |
[31] | Dalleau S , Baradat M , Guéraud F , Huc L ((2013) ) Cell death and diseases related to oxidative stress: 4-hydroxynonenal (HNE) in the balance. Cell Death Differ 20: , 1615–1630. |
[32] | Łuczaj W , Gęgotek A , Skrzydlewska E ((2017) ) Antioxidants and HNE in redox homeostasis. Free Radic Biol Med 111: , 87–101. |

