Article

Non-Invasive Method to Detect Infection with Mycobacterium tuberculosis Complex in Wild Boar by Measurement of Volatile Organic Compounds Obtained from Feces with an Electronic Nose System

by
Kelvin de Jesús Beleño-Sáenz
1,2,
Juan Martín Cáceres-Tarazona
2,
Pauline Nol
3,†,
Aylen Lisset Jaimes-Mogollón
2,
Oscar Eduardo Gualdrón-Guerrero
2,
Cristhian Manuel Durán-Acevedo
2,
Jose Angel Barasona
4,
Joaquin Vicente
5,
María José Torres
6,
Tesfalem Geremariam Welearegay
7,
Lars Österlund
7,
Jack Rhyan
3 and
Radu Ionescu
8,*
1
Mechatronics Engineering Department, Universidad Autónoma del Caribe, Barranquilla 080020, Colombia
2
GISM Group, Faculty of Engineering and Architecture, University of Pamplona, Pamplona 543050, Colombia
3
Centers for Epidemiology and Animal Health, Veterinary Services, Animal and Plant Health Inspection, Service, United States Department of Agriculture, Fort Collins, CO 80526, USA
4
VISAVET Health Surveillance Centre, Animal Health Department, Faculty of Veterinary Medicine, Complutense University of Madrid, 28040 Madrid, Spain
5
SaBio Instituto de Investigación en Recursos Cinegéticos IREC, ETSIA Ciudad Real, University of Castilla La Mancha & CSIC, 13003 Ciudad Real, Spain
6
Biomedical Institute of Sevilla (IBiS), University of Seville, University Hospital Virgen del Rocío/CSIC, 41071 Seville, Spain
7
The Ångström Laboratory, Department of Materials Science and Engineering Sciences, Uppsala University, P.O. Box 35, 75103 Uppsala, Sweden
8
Institute of Veterinary Medicine and Animal Sciences, Estonian University of Life Sciences, 51006 Tartu, Estonia
*
Author to whom correspondence should be addressed.
Current address: Colorado Division of Parks and Wildlife, Wildlife Health Program, Fort Collins, CO 80521, USA.
Sensors 2021, 21(2), 584; https://doi.org/10.3390/s21020584
Submission received: 9 December 2020 / Revised: 8 January 2021 / Accepted: 13 January 2021 / Published: 15 January 2021
(This article belongs to the Special Issue Electronic Noses and Tongues for Environmental Monitoring)

Abstract

:
More effective methods to detect bovine tuberculosis, caused by Mycobacterium bovis, in wildlife, is of paramount importance for preventing disease spread to other wild animals, livestock, and human beings. In this study, we analyzed the volatile organic compounds emitted by fecal samples collected from free-ranging wild boar captured in Doñana National Park, Spain, with an electronic nose system based on organically-functionalized gold nanoparticles. The animals were separated by the age group for performing the analysis. Adult (>24 months) and sub-adult (12–24 months) animals were anesthetized before sample collection, whereas the juvenile (<12 months) animals were manually restrained while collecting the sample. Good accuracy was obtained for the adult and sub-adult classification models: 100% during the training phase and 88.9% during the testing phase for the adult animals, and 100% during both the training and testing phase for the sub-adult animals, respectively. The results obtained could be important for the further development of a non-invasive and less expensive detection method of bovine tuberculosis in wildlife populations.

1. Introduction

Bovine tuberculosis (bTB), caused by Mycobacterium bovis (M. bovis), is an emerging disease among wild animals in many parts of the world, and threatens to spill back as a potential source of infection for livestock and humans [1]. bTB can be easily transmitted from an infected animal to a non-infected one with whom it shares the same habitat, prevailing the aerogenic transmission. It can also be transmitted from animals to humans through consumption of meat products of infected animals, by contact with the blood of infected animals during slaughter, or through inhalation of air exhaled by infected animals [2,3]. In humans, bTB causes severe morbidity and even death, especially in the case of people involved in hunting and slaughter of animals without sufficient sanitary control.
Standard bTB testing in live animals consists of single intradermal tuberculin tests for screening (caudal fold test or single cervical skin test) with a comparative cervical test, or an interferon gamma release assay test, as supplemental or confirmatory tests [4,5,6]. The final diagnosis of bovine tuberculosis requires post-mortem laboratory confirmation of the disease via histopathology, polymerase chain reaction, and bacteriological culture [5,6].
The detection of bovine tuberculosis in wildlife is generally done through techniques such as hunter-kill surveys, road-kill surveys, or actively capturing and/or killing animals for serologic testing and/or post-mortem examination [7,8,9]. There is need for less invasive, less expensive techniques to remotely detect bTB disease in wildlife populations.
The detection of disease-specific volatile organic compounds (VOCs) from the feces may provide a solution for remote surveillance of wildlife. They reflect metabolomic changes produced by the disease in the host, and their analysis emerged as a promising approach for disease diagnosis and monitoring [10].
Two complementary methods are generally applied for VOC analysis: analytical techniques and electronic nose systems. The analytical techniques allow for the identification of disease-specific biomarkers. Yet, the concentration of many compounds emitted by biological samples is below the limit of detection of the analytical equipment and not all possible biomarkers are detected [11]. The electronic nose systems are formed of an array of cross-reactive chemical gas sensors, where each sensor lacks sufficient selectivity for detecting individual VOCs in a gaseous mixture, but, instead, the electronic nose system is trained to detect a disease-specific VOC pattern [12]. The electronic nose systems present advantages such as portability, easy operation, easy interpretation of results, and low cost [12].
Apparently, unique VOCs or patterns of VOCs were detected through analytical studies in the feces of cattle and white-tailed deer infected with M. bovis [13,14], and in the feces of goats infected with Mycobacterium avium paratuberculosis [15,16]. Very recently, in the first study of this kind performed on wild boar (Sus scrofa), we reported the identification of M. bovis-specific VOC patterns in the feces and breath of wild boar [17]. Similarly, electronic nose systems were also shown to be able to detect the VOC pattern of M. bovis in the headspace of serum from cattle and badgers [18,19], and in the breath of cattle [20].
In the present study, we report for the first time the detection of M. bovis from the measurement of the VOCs emitted from feces with an electronic nose system. This study was performed on free-ranging wild boar living in Doñana National Park, Spain, where bTB is endemic in the ungulate host community, including wild boar [21]. The successful development of this technology could lead to devices designed to remotely and non-invasively detect M. bovis and other pathogens in wildlife populations.

2. Materials and Methods

2.1. Animals and Samples

The realization of this study was approved by the Commission of Animal Experiments from the University of Castilla-La Mancha, Spain (PR-2015-03-08). The procedures that were applied in this study were designed and implemented by scientists with experience in the field, after approval from the Spanish Ethics Committee in accordance with the European Commission Directive 86/609/EEC for animal experiments.
Fecal samples were obtained from 37 wild boars that were captured in Doñana National Park, Spain, as described in Nol et al. [17] and Barasona et al. [22]. The animals were captured at different sites from the park, located on a radius of 4.4 km, including Martinazo, Palacio, Santa Olalla, and Fuente del Duque. Boar were trapped in a portable cage and corral traps, as described in Barasona et al. [14]. Age determination was based on the recommendations given in Sáenz de Buruaga et al. [23]. Sub-adult and adult animals (12–24 months and >24 months, respectively) were sedated using a combination of tiletamine-zolazepam (100 mg/mL Zoletil®, Virbac, Carros, France, 3 mg/kg dose) and medetomidine (Medetor®, Virbac, Carros, France, 0.05 mg/kg dose), intramuscularly administered in the lateral region of animal’s gluteus with 5-mL darts (Telinject®, Römerberg, Germany) using a 14-mm diameter blowpipe (Telinject®, Römerberg, Germany) [22]. Juvenile animals (<12 months) were manually restrained.
Fecal samples were collected from all animals, either manually per rectum or postmortem when no feces could be obtained per rectum during live animal handling. Volatile organic compounds were collected from the VOC headspace formed by approximately 5 g of a fecal sample inside a 125-mL glass jar, as described by Nol et al. [9], via a vacuum pump (AirChek XR5000, SKC Inc., Eighty-Four, PA, USA) into a glass cartridge containing sorbent material suitable for VOC preconcentration and storing (Tenax TA, Sigma Aldrich, St. Louis, MO, USA). The samples were stored at 4 °C before analysis.
Once the fecal samples were collected, the animals were euthanized via captive bolt and exsanguination as part of Doñana National Park population control and health-monitoring program. The wild boars were necropsied, and blood, lung lobes, lymph nodes, and any other tissue displaying lesions compatible with M. bovis infection were cultured and analyzed for identification of M. bovis, as described by Nol et al. [9] and Safianowska et al. [24].
Full characterization of the animals included in this study and number of fecal VOC samples analyzed per animal are presented in Table 1. Animal grouping on age, disease, sex, and location is summarized in Table 2.

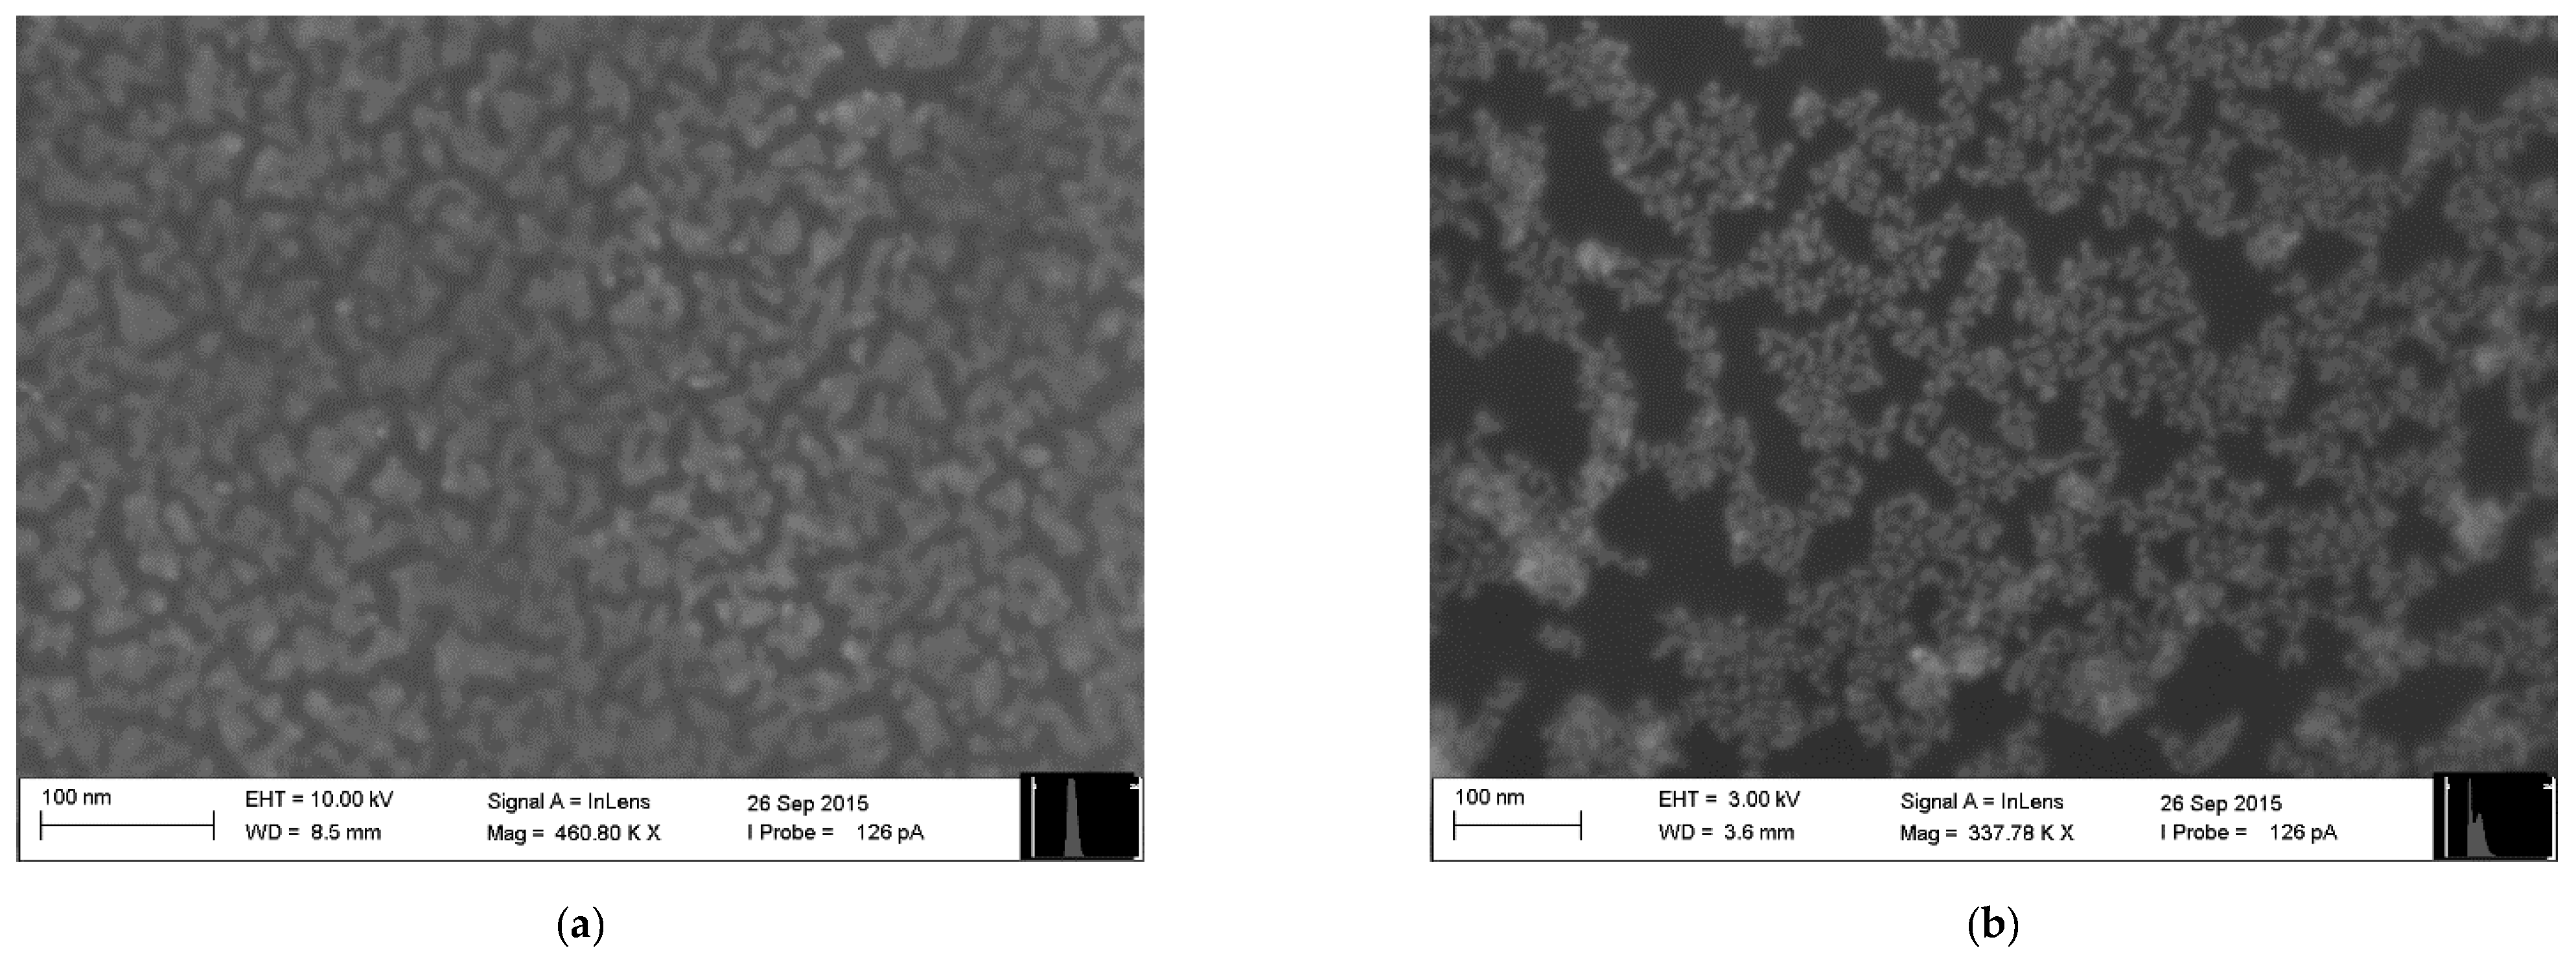
2.2. Electronic Nose and Sensing Measurements

The electronic nose employed in this study consisted of 10 chemical gas sensors based on monolayers of ultrapure organically-functionalized gold nanoparticles fabricated employing the Advanced Gas Deposition (AGD) technique, as described in Welearegay et al. [25]. The sensors were fabricated on 13 × 8 mm2 one-side polished p-type silicon substrates provided with two parallel gold electrodes on their polished side, forming a 15-μm-gap active area region, where the sensing material was deposited. The characteristics of the sensors with different organic functionalities are presented in Table 3. Differences in their resistance are due to variations of the Au nanoparticle assembly structure and conductivity of the cross-linked functional organic groups attached to the Au nanoparticles. For the sake of exemplification, two sensing nanomaterials are presented in Figure 1.
The setup employed for performing the measurement of the fecal VOC samples with the electronic nose system is shown in Figure 2. The sensors were placed inside a 26-cm3 inner volume Teflon test chamber provided with two openings for the sample inlet and sample outlet, respectively (Figure 2a(E),b). The Tenax TA sorbent tube storing the fecal VOC sample (Figure 2a(G)) was heated at 250 °C for 5 min inside a home-built temperature-controlled thermal desorption unit (Figure 2a(D),c) to desorb the VOCs from the Tenax TA matrix.
Sample measurements comprised the following cycles.
(i)
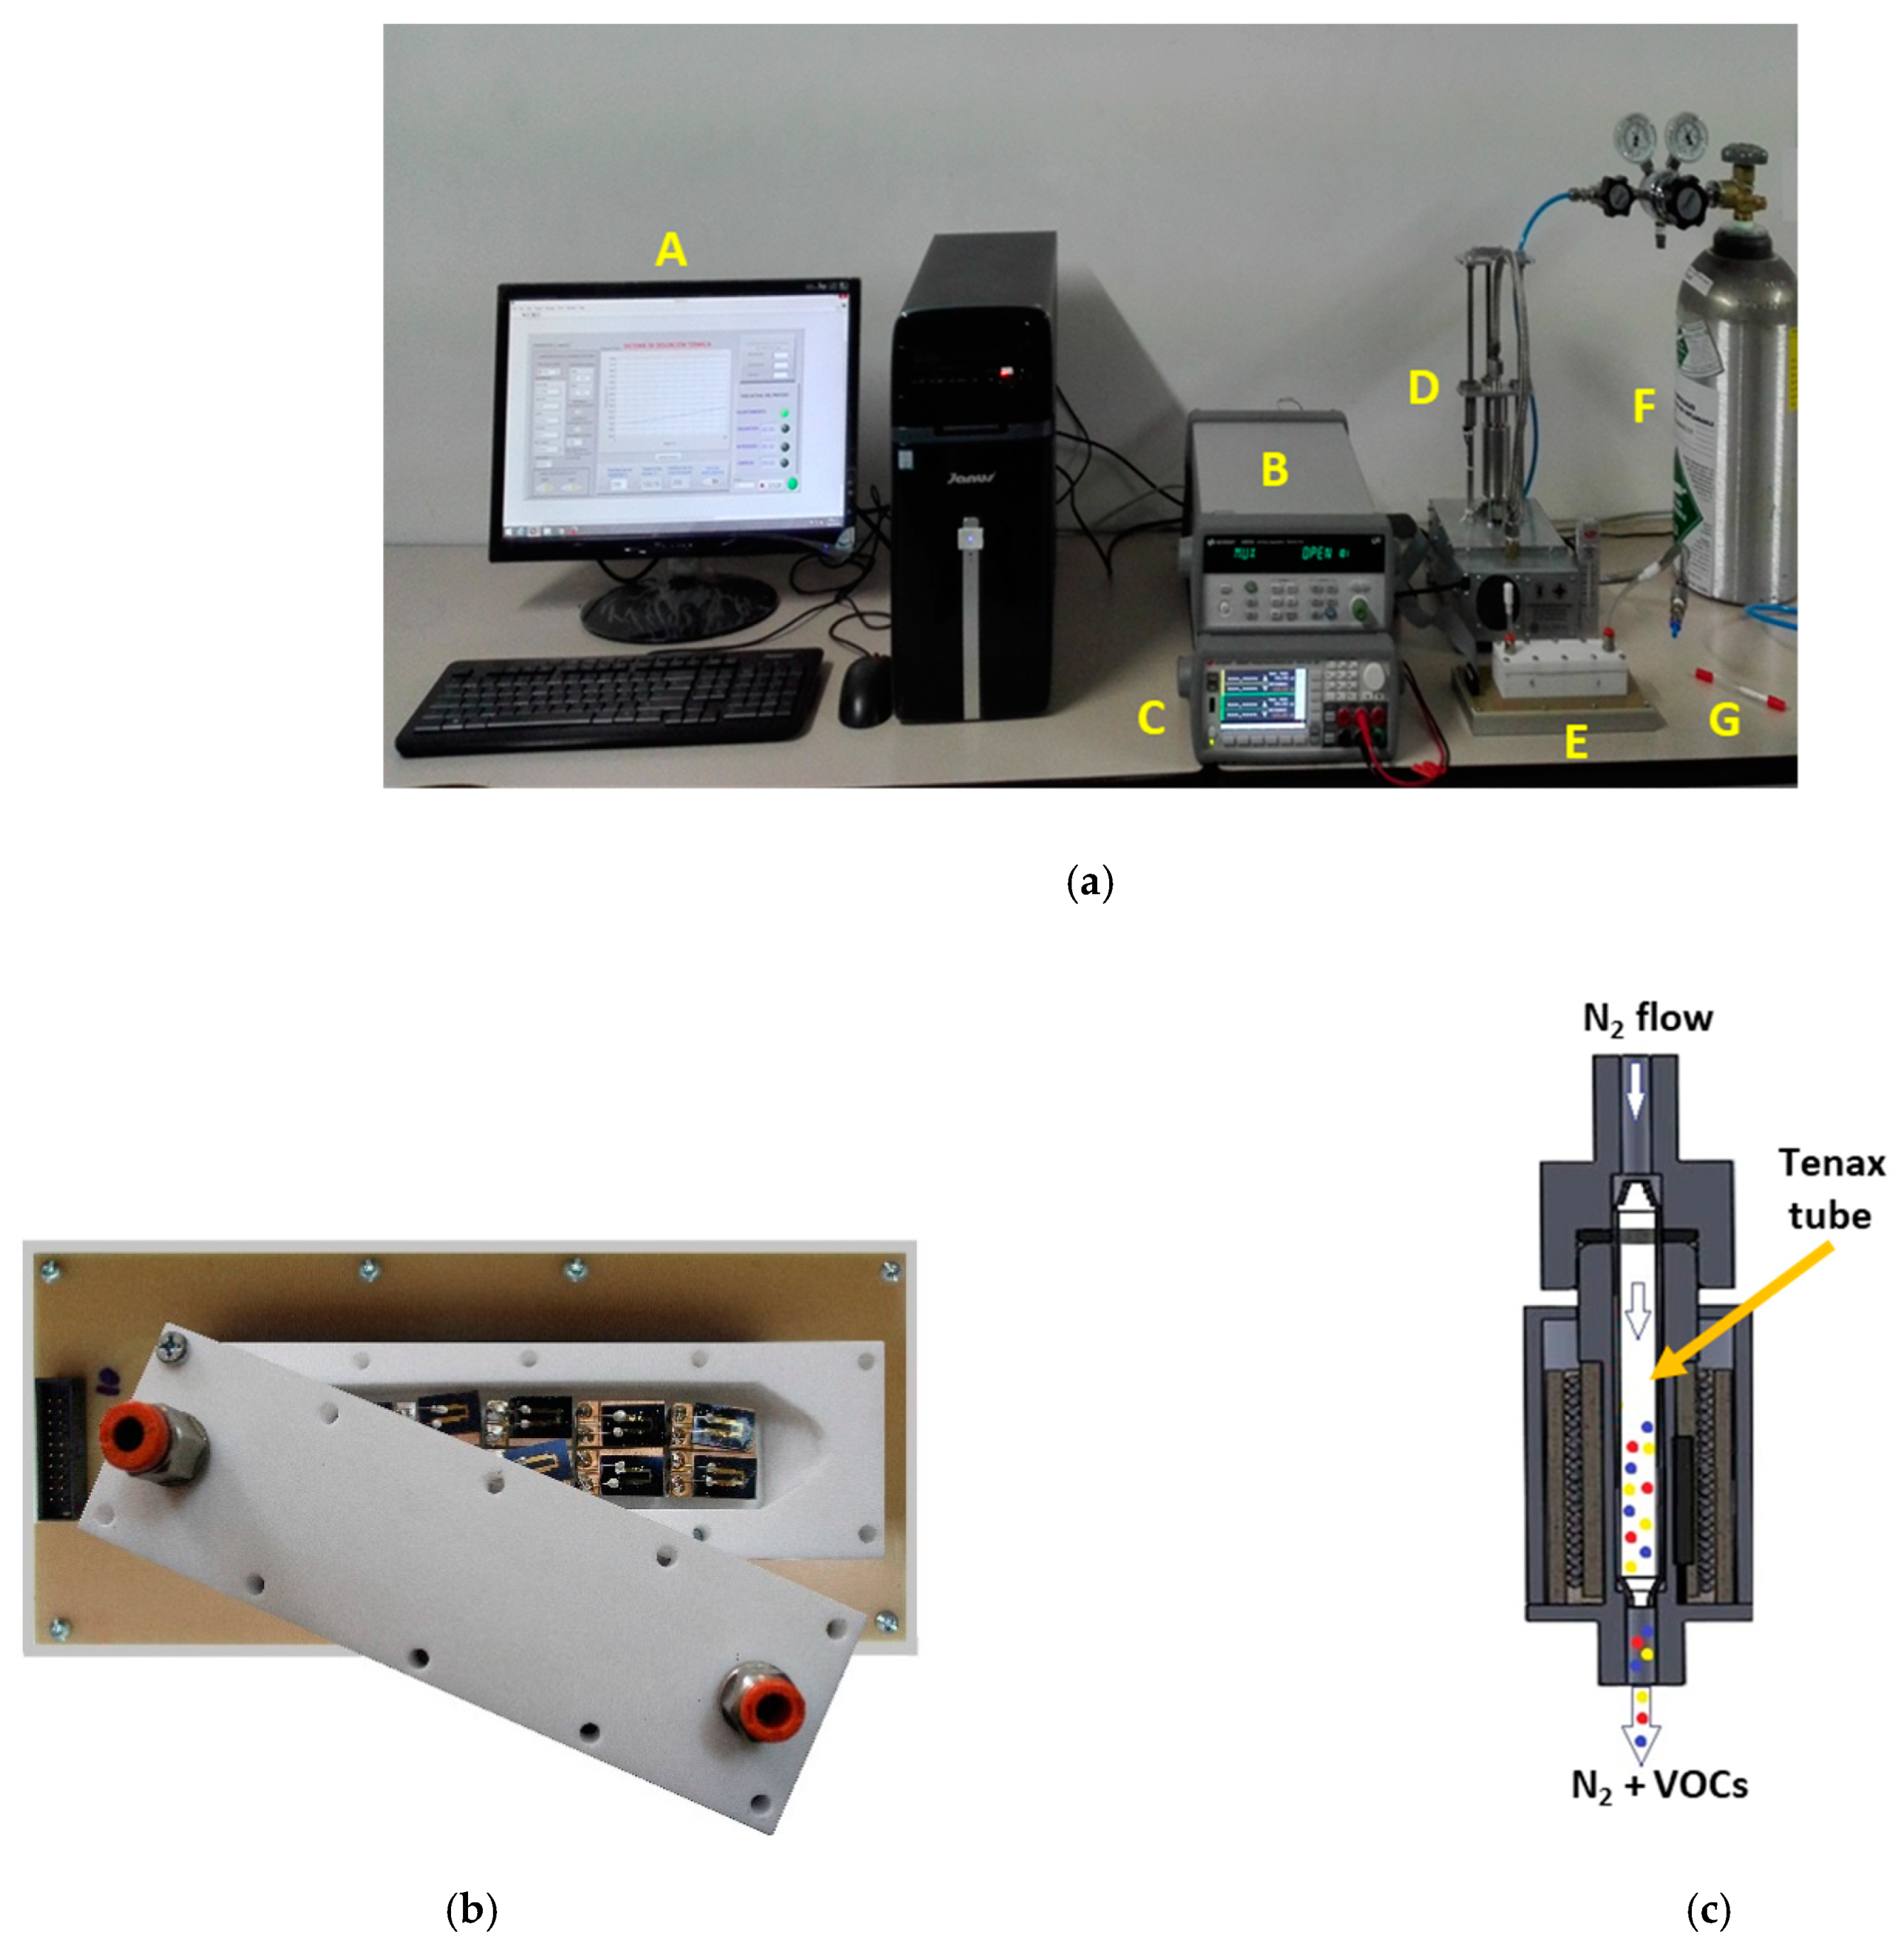
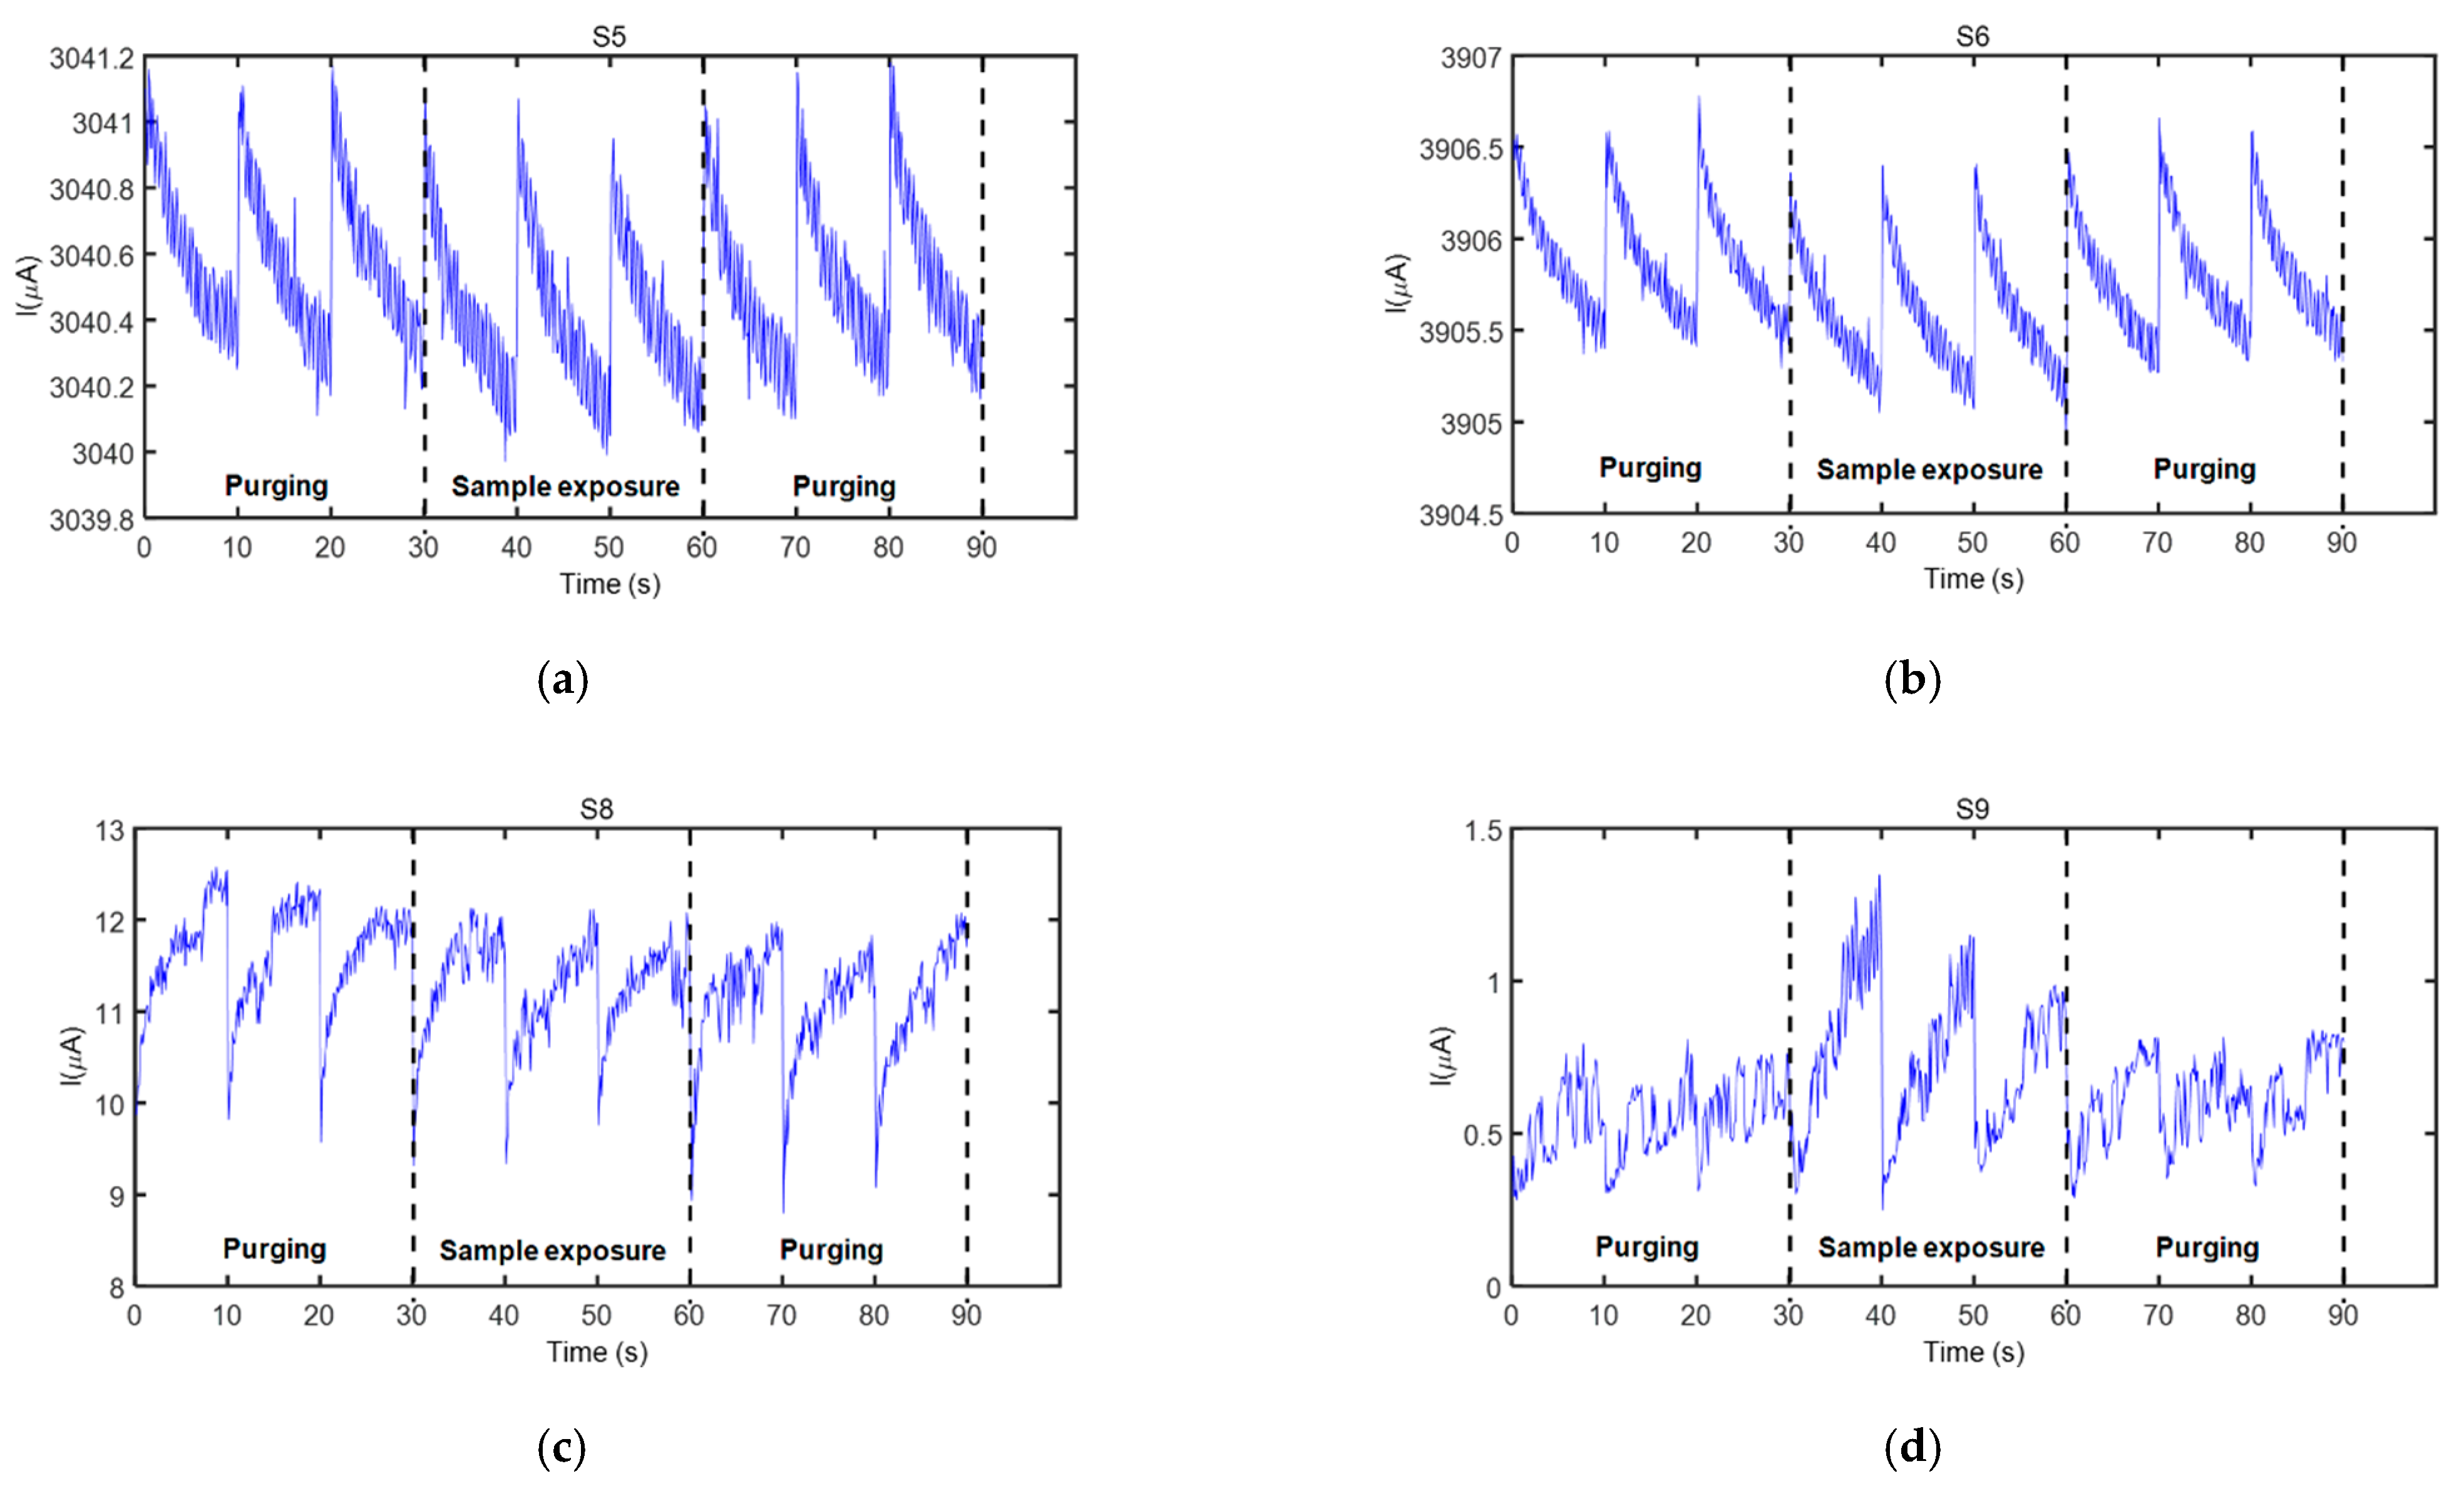
5 min of continuous N2 flow (delivered from a commercial N2 gas bottle, Cryogas S.A., Colombia—Figure 2a(F)) passed at 5 L/min flow rate through the sensor test chamber for purging purposes before the sample measurement,
(ii)
5 min of exposure to the fecal VOCs carried by continuous N2 flow that passed at 100 mL/min flow rate at first through the thermal desorption unit for taking the thermally released VOCs (see Figure 2c) and then through the sensor test chamber together with the fecal VOCs,
(iii)
5 min of continuous N2 flow passed at 5 L/min flow rate through the sensor test chamber for purging purposes after the sample measurement.
During the entire measurement process, the sensors were successively operated at 8 V for 10 s in a switching mode. Thus, during the operation period of one of the sensors, the other ones remained inactive by not supplying an operation voltage to them. Therefore, all sensors were once active every 100 s, implying 30 s of operation of each sensor during the 5 min duration of each measurement cycle.
A high precision power source (B2902A, Keysight Technologies, Hungary—Figure 2a(C)) controlled the sensor supply, as well as the thermal desorption unit. The dc current through each sensor during each operation period was acquired at nine samples/s acquisition rate employing a high resolution data acquisition system (34992A LXI/Data Acquisition Keysight Technolgies, Hungary—Figure 2a(B)) and stored in a computer (Figure 2a(A)) for further analysis. The measurement process consisted of three complete operation periods per sensor for each 5-min measurement cycle (see Figure 3).

2.3. Data Analysis

A 20-point moving average filter was applied to the acquired sensor signals in order to reduce the noise generated by the electronic devices. Three features were extracted on the filtered signals from sensor responses to each sample analyzed (see Figure 4b).
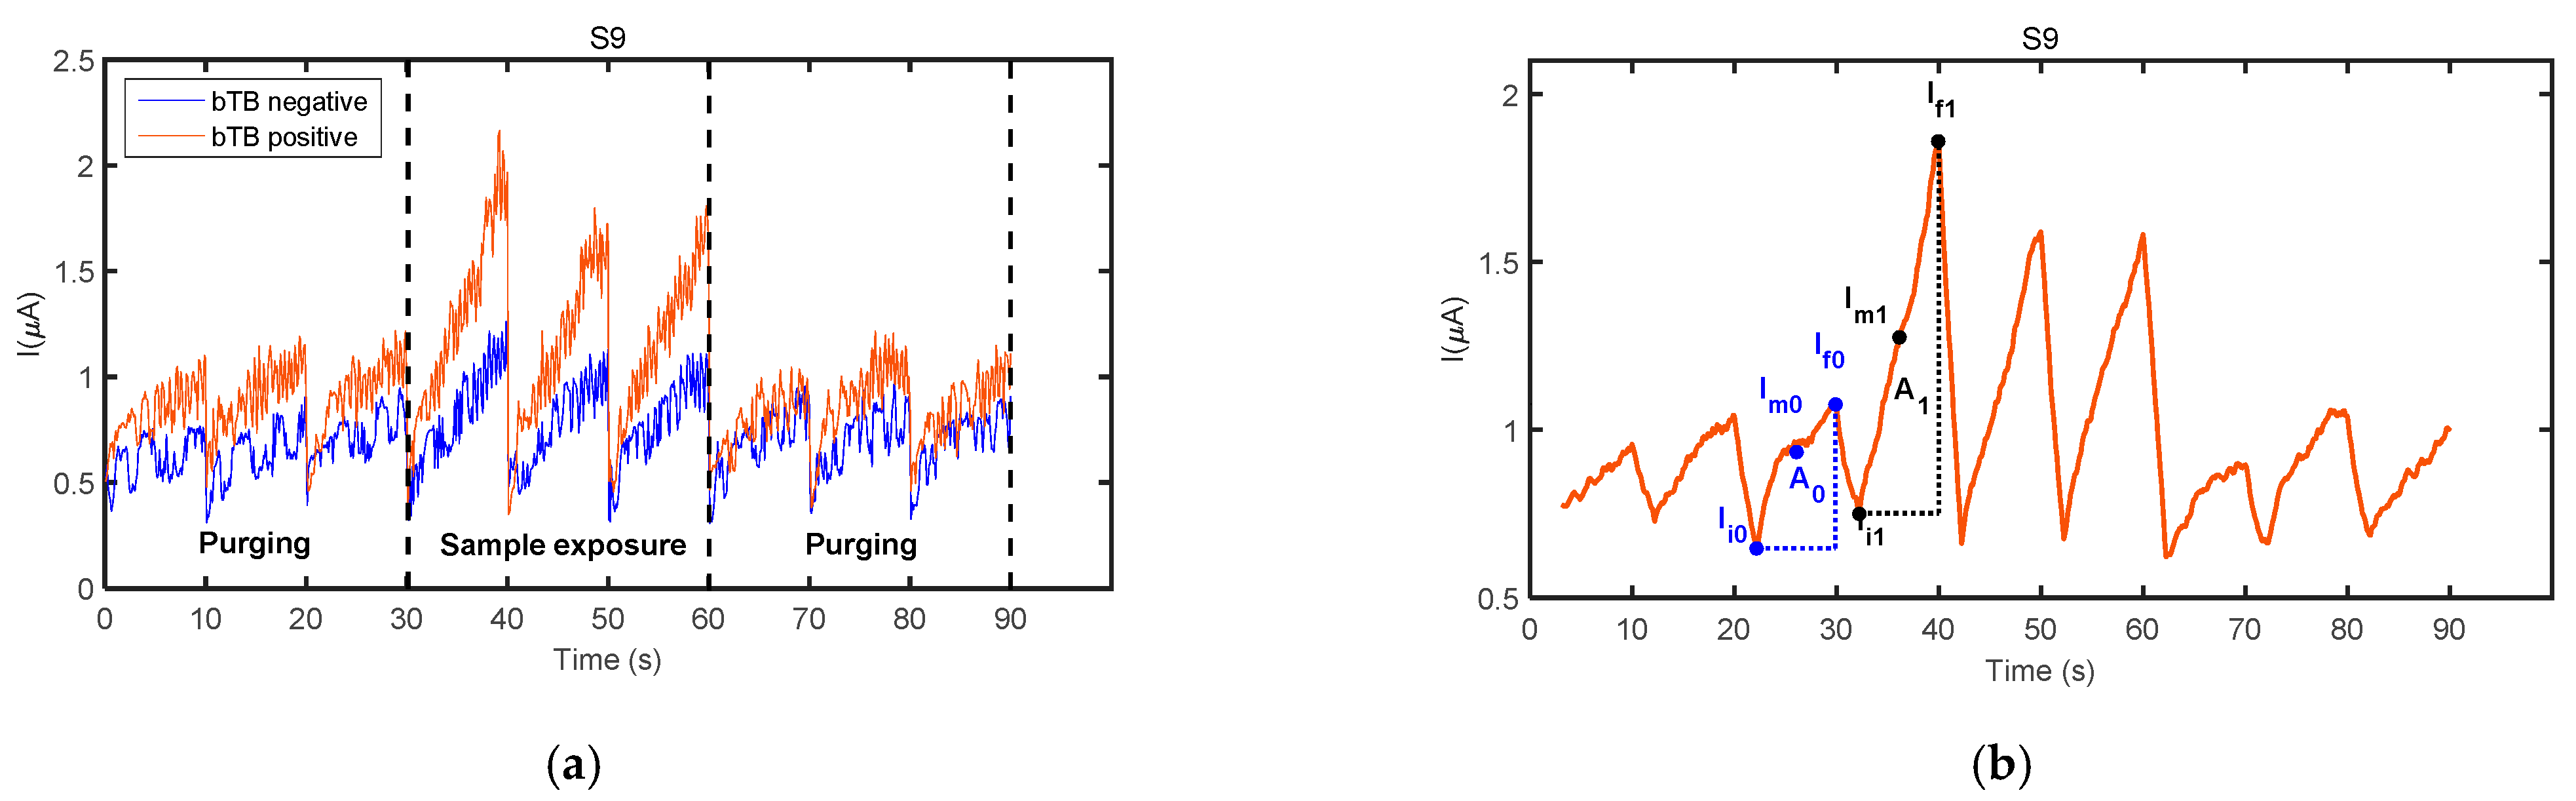
  • F1: A1/A0, where A1 is the area under the curve calculated from the first 70 data points of the filtered signal for the first operation period of the sensor exposure to the fecal VOC sample, and A0 is the area under the curve calculated from the first 70 data points of the filtered signal obtained in the last operation period of the same sensor during the purging process immediately prior to sample exposure,
  • F2: (Im1 − Im0)/Im0, where Im1 is the averaged current calculated with the first 70 current values of the filtered signal for the first operation period of the sensor exposure to the fecal VOC sample, and Im0 is the average current calculated with the first 70 current values of the filtered signal obtained in the last operation period of the same sensor during the purging process immediately prior to sample exposure,
  • F3: (∆I1 − ∆I0)/∆I0, where ∆I1 = If1 − Ii1 and ∆I0 = If0 − Ii0, and where If1 and Ii1 are the 70th and 1st current values, respectively, of the filtered signal for the first operation period of the sensor exposure to the fecal VOC sample, and If0 and Ii0 are the 70th and 1st current values, respectively, of the filtered signal obtained in the last operation period of the same sensor during the purging process immediately prior to sample exposure.
One of the two samples collected from each wild boar was employed for building classification models for bTB positive and bTB negative animals. The Discriminant Function Analysis (DFA) pattern recognition algorithm was used for this aim [26]. The analysis was separately performed for each age group of animals: adult, sub-adult, and juvenile. The selection of the most discriminative sensors and features for building the classification models for each age group was heuristically achieved by calculating the discrimination accuracy of the models through leave-one-out cross-validation, which is an error estimation that was extensively employed in the literature when analyzing small sample biological datasets [27]. Only the sensors that responded to the fecal VOC samples (see the Results section) were considered for building the classification models. All possible combinations of at least two features extracted from these sensors were assessed, and those that achieved the best classification result for each age group were finally selected. The discrimination potential of the models built was verified by assessing the classification accuracy of the second sample of those animals for which two samples were available (see Table 1).

3. Results

3.1. Sensor Responses

Four sensors from the electronic nose employed in this study responded to the fecal VOC samples analyzed. These sensors were S5, S6, S8, and S9 (see Table 3 for details), and their characteristic responses to a representative VOC sample are presented in Figure 3. Only the three operation periods in the active mode of the sensors, acquired during each measurement cycle, are indicated in this figure (initial purging process (first three operation periods), sample exposure (next three operation periods), and purging process after a sample measurement (last three operation periods)). Current modulation during the 90 data points acquired during every operation period of a sensor can be clearly observed in this figure.
Sensors’ exposure to the fecal VOC samples of bTB positive and bTB negative boar revealed slightly different response patterns, as visible in Figure 4a. In general, a good repeatability between the three operation periods of the same measurement cycle was observed for all sensors and samples analyzed, as denoted by sensors’ responses presented in Figure 3 and Figure 4. However, in some cases, a drift was noticed during the three operation periods of sample exposure, as it was the case presented in Figure 3d. For this reason, only the first operation period of the sensors acquired during sample exposure and the last operation period acquired during the purging process immediately prior to sample exposure were considered for feature extraction. The parameters used to calculate sensor response features are presented in Figure 4b.

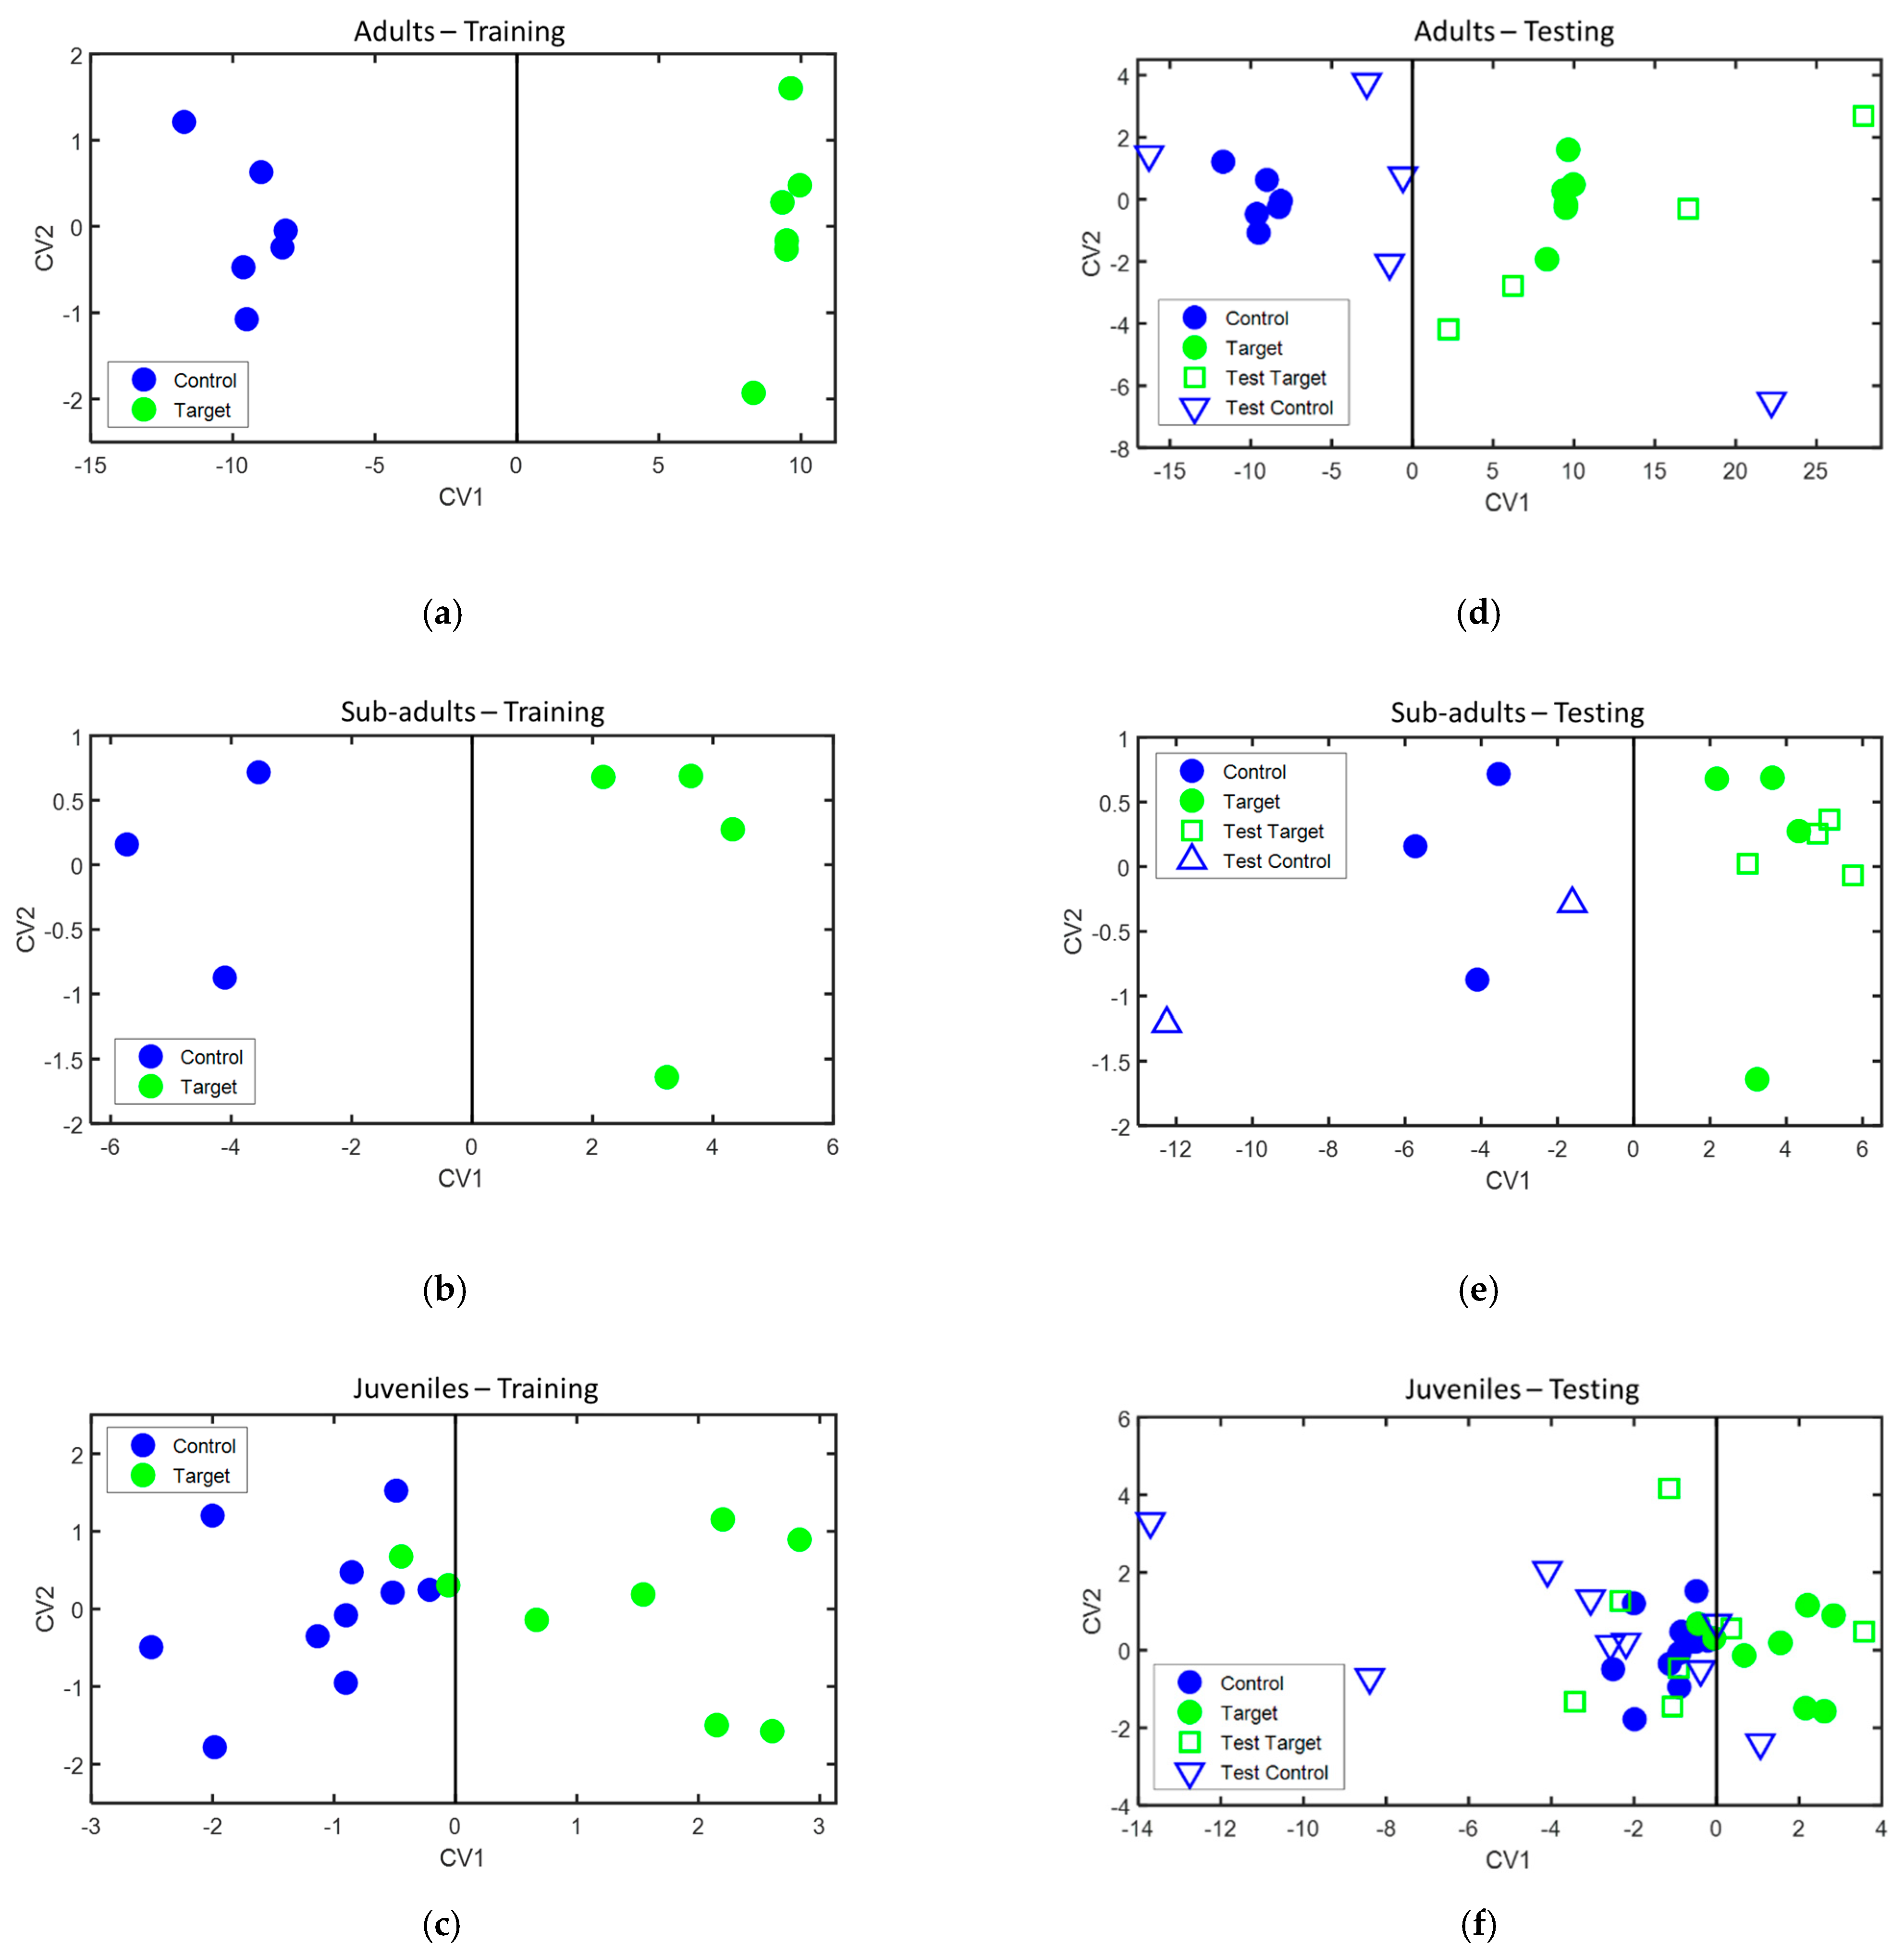
3.2. Classification Results

During the training phase, classification models were separately built for each age group of animals with one sample acquired from each animal. The classification models obtained are presented in Figure 5 (left panels), while the sensors and features used to build each one of the models are presented in Table 4. Leave-one-out cross-validation of these models provided 100% accuracy, 100% sensitivity, and 100% specificity in the case of the adult and sub-adult animals, and 88.9% accuracy, 75% sensitivity, and 100% specificity in the case of the juvenile animals.
During the testing phase, when the second sample of those animals for which two samples were available, was projected over the classification models built during the training phase. Their classification achieved 88.9% accuracy, 100% sensitivity, and 80% specificity for the adult animals, 100% accuracy, 100% sensitivity, and 100% specificity for the sub-adult animals, and 62.5% accuracy, 28.6% sensitivity, and 88.9% specificity for the juvenile animals. Their projection on the classification models is presented in Figure 5 (right panels), and the classification results during both the training and testing phase are summarized in Table 5.

4. Discussion

For performing this study, we built an electronic nose system comprising an array of cross-reactive chemical gas sensors based on organically-functionalized gold nanoparticles. This kind of sensors demonstrated very good suitability for detecting low VOC concentrations in biological samples, and room temperature operation that is a key feature of these nanomaterials [28,29,30].
The organic ligands were carefully selected with the intent to present affinity to a broad range of VOCs that are generally found in fecal samples, such as aromatic compounds, alcohols, ketones, esters, aldehydes, alkanes, alkenes, and furans [14,16,17]. The sensing materials were deposited by AGD, which allows for the fabrication of ultra-pure nanomaterials [31]. Sensor resistances ranged between several kΩ up to several MΩ, which are ideal values for gas sensing applications.
Animals captured at different sites located on a large area of 4.4-km radius inside Doñana National Park were included in this study in order to deal with possible sources of contamination present in a national park that could influence the composition of feces (e.g., natural sources of watering and contact with other wild animals).
The sensors that presented good responses to the fecal VOC samples analyzed in this study were sensors S5, S6, S8, and S9 (see Table 3 for details). S5 and S8, with organic ligands with an aromatic functional group in their tail, are likely to have high affinity for VOCs with aromatic functional groups in their structure, while the organic ligand of S6, with a long chain polar group in its tail, has good affinity for polar molecules, such as ketones. This feature is in line with a previous study in which aromatic compounds and ketones were reported as tentative fecal VOC biomarkers for bTB in swine [17]. S9, which employed 1-butanethiol as an organic ligand, has high affinity for non-polar VOC molecules, such as alkanes and alkane derivatives, and certainly widened the range of detected VOCs.
Yet, other sensors had similar organic functionalities as the sensors that responded to the fecal VOC samples analyzed (e.g., S7 and S8, or S1 and S5, respectively). However, they could present very different morphologies because of slightly different experimental conditions during their fabrication [25]. This is indicated by their different resistance values presented in Table 3. Therefore, their detection potential for fecal VOCs may not have been totally tuned.
The dynamic sensors’ operation mode employed in this study, implemented by applying short voltage pulses to the sensors (10 s duration) followed by longer inactivity periods (90 s duration), allowed for analyzing the surface adsorption-desorption reaction kinetics that occur between the sensing material and the sensed VOCs. This operation mode provides more information than the static operation mode when the sensor is continuously operated at a constant voltage [32].
During the short voltage pulses when the sensor was in the active state, the current through the sensor varied between two values, which either decreased or increased, depending on the organic functionality linking the gold nanoparticles (see sensor responses presented in Figure 3 and Figure 4). It is important to note that the sensors did not achieve a steady state condition (i.e., constant stabilized current) during their operation, which ensured that only their dynamic operation was assessed in this study. Considering the sensors that presented a good response to the fecal VOC samples analyzed, for 2-mercaptobenzoxazole and 11-mercaptoundecanoic acid, the current decreased during the voltage supply, which produces a slight heating effect, suggesting a p-type semiconducting behavior, while for 4-methoxy-α-toluenethiol and 1-butanethiol, the current increased during the voltage supply, suggesting an n-type semiconducting behavior.
For data analysis, only the first operation period of each sensor during VOC sample exposure was considered for extracting sensor features, corresponding to the first 100 s of VOC exposure, as each sensor was successively active for 10 s during this operation period. Actually, it is expected that a higher concentration of the VOCs desorbed in the thermal desorption unit was transferred by N2 flow to the sensor test chamber in the first moments of sample exposure. Figure 3d revealed that even S9, the penultimate activated sensor, presented a noticeable response to the VOC sample during its first operation period, suggesting that VOC concentration was still present in a suitable level in the measurement chamber.
The classification models built based on sensor responses showed very good accuracies for bTB detection for the adult and sub-adult animals, while, for the juvenile animals, the results were not adequate (see Table 5). Following previous analytical studies that suggested an age-dependent difference of the metabolomics pathway of bTB in swine [17], different sensor features were chosen in this study to build more robust bTB classification models for the different age groups (see Table 4).
The adult and sub-adult animals were sedated with a combination of tiletamine-zolazepam and medetomidine, which avoided their stress during sample collection while not affecting VOC composition, as reported in our previous study [17]. The juvenile animals were manually restrained while collecting the fecal sample, which may have induced a stress response, possibly altering the composition of the pattern of VOCs emitted by biological samples [17]. However, other metabolic factors in juveniles could have made their VOCs take on a different pattern as well. In order to clarify this point, further research should be done by either sedating the juvenile animals in a similar manner to the adult and sub-adult animals while collecting the fecal samples, or by passively collecting the samples without handling them.
The influence of the number of animals from each age group on the results obtained cannot be disregarded. The classification of the sub-adult animals could be easier because of the smaller size of this age group. The larger sample size of the juvenile group could have complicated their classification with the DFA algorithm employed in this study. Other pattern recognition algorithms that could better adjust to the dataset of the juvenile animals could be assessed in order to try to obtain better results.
Overall, the present study complements the current research trend focused on the investigation of alternative methods based on the measurement of VOCs emitted by biological samples with electronic nose systems for simpler and less expensive diagnosis of diseases. While numerous studies of this kind were realized on human beings, the studies realized on animals are rather scarce [12]. Actually, the present study is the first report that assesses the diagnosis of an animal disease from the measurement of the VOCs emitted by feces with an electronic nose system. For M. bovis diagnosis in bovines, promising results were obtained in the analysis of breath samples with the NA-NOSE electronic nose system developed by Technion Israel Institute of Technology comprising an array of six chemical gas sensors based on organically-functionalized gold nanoparticles (86.4% accuracy on a population of 22 animals) [20], as well as in the analysis of the VOCs emitted by serum samples with the commercial αFOX3000 MOS electronic nose system developed by Alpha M.O.S. Co. (Tolouse, France) based on an array of nine metal oxide semiconducting gas sensors (95.2% accuracy on a population of 21 animals) [19].

5. Conclusions

This research reports a proof-of-concept study regarding the diagnosis of bTB, caused by Mycobacterium bovis, in wild boar, from the analysis of the VOCs emitted by animal feces with an electronic nose system. The analysis of fecal samples was selected because they can be non-invasively collected and have great potential to provide a convenient means for the detection of M. bovis in wildlife populations.
The study was realized on free-ranging wild boar captured in Doñana National Park, Spain, where bTB disease is endemic in ungulates. In order to counteract the influence of possible confounding factors on feces’ composition (e.g., natural sources of watering, contact with other wild animals), animals captured on a large area of a 4.4-km radius inside the park were included in the study.
The samples were analyzed with a home-made electronic nose system that comprised an array of 10 chemical gas sensors based on organically-functionalized gold nanoparticles fabricated employing the AGD technique, which yields ultrapure and narrow size-ranged nanoparticle synthesis. During sample measurement, the sensors were operated in the dynamic mode by successively applying short voltage pulses to each one of them in a switching mode, which allowed for investigating the reaction kinetics that occur between the sensing film and the VOC sample.
The study was separately performed on three age groups of animals: adult, sub-adult, and juvenile. The classification results built with the DFA pattern recognition algorithm provided 100% accuracy during both model training and validation for the sub-adult animals, 100% accuracy during model training and 88.9% during model validation for the adult animals, and 88.9% accuracy during model training and 62.5% during model validation for the juvenile animals. The obtained results could have been influenced by the sample size of each age group (smaller in sub-adult and larger in juvenile animals), as well as animal handling during sample collection (the sub-adult and adult animals were anesthetized while the juveniles were manually restrained).
Overall, while taking into account the necessity to handle all animals similarly in future studies, the results obtained in this study could pave the way for the further development and implementation of a non-invasive and less expensive approach to detect bTB disease in wild populations. Nevertheless, the reported results need to be validated on larger cohorts of animals, while other pattern recognition techniques could be assessed to explore algorithms that may more effectively adjust to the dataset of juvenile animals.

6. Patents

A patent application was filed with the results reported in this manuscript. Title: In vitro methods for the diagnosis of bovine tuberculosis in swine; Applicant: The United States as Represented by the Secretary of Agriculture, Washington, DC; Inventors: Radu Ionescu and Pauline Nol; Application number: US62/981,591; Filing date: 02/26/2020.

Author Contributions

Conceptualization, P.N., J.R., and R.I. Methodology, K.d.J.B.-S., J.M.C.-T., P.N., A.L.J.-M., O.E.G.-G., C.M.D.-A., J.A.B., J.V., M.J.T., T.G.W., L.Ö., and R.I. Formal analysis, K.d.J.B.-S., C.M.D.-A., and R.I. Investigation, K.d.J.B.-S., P.N., J.A.B., J.V., M.J.T., T.G.W., and R.I. Resources, J.V., L.Ö., J.R., and R.I. Data curation, K.d.J.B.-S. and R.I. Writing—original draft preparation, R.I. Writing—review and editing, P.N., J.A.B., J.V., M.J.T., T.G.W., L.Ö., and R.I. Project administration, J.R. Funding acquisition, J.V., J.R., P.N., and R.I. All authors have read and agreed to the published version of the manuscript.

Funding

This research was funded by the United States Department of Agriculture, Animal and Plant Health Services, Wildlife Services, National Feral Swine Program, the United States Department of Agriculture, Animal and Plant Health Services, Veterinary Services (contract no. 15-9408-0367), the SaBio Instituto de Investigación en Recursos Cinegéticos (IREC) (MINECO, AEI/FEDER, UE, AGL2016-76358-R), European Union’s Horizon 2020 research and innovation programme under the Marie Skłodowska-Curie grant agreement no. 777832, and COMBIVET ERA Chair, H2020-WIDESPREAD-2018-04, grant agreement no. 857418.

Institutional Review Board Statement

The study was conducted according to the guidelines of the Declaration of Helsinki, and approved by the Commission of Animal Experiments from the University of Castilla-La Mancha, Spain (protocol code PR-2015-03-08 from 2015-03-08).

Informed Consent Statement

Not applicable.

Data Availability Statement

The data presented in this study are available on request from the corresponding author. The data are not publicly available due to patenting issue.

Acknowledgments

We express our appreciation to I. Diez, C. Gortazar, J. Martinez, J.A. Muriel, R. Triguero, and A. Yepes for their efforts in facilitating and conducting the field and animal work.

Conflicts of Interest

The authors declare no conflict of interest.

References

  1. Di Marco, V.; Mazzone, P.; Capucchio, M.T.; Boniotti, M.B.; Aronica, V.; Russo, M.; Fiasconaro, M.; Cifani, N.; Corneli, S.; Biasibetti, E.; et al. Epidemiological significance of the domestic black pig (Sus scrofa) in maintenance of bovine tuberculosis in Sicily. J. Clin. Microbiol. 2012, 50, 1209–1218. [Google Scholar] [CrossRef] [Green Version]
  2. Bapat, P.R.; Dodkey, R.S.; Shekhawat, S.D.; Husain, A.A.; Nayak, A.R.; Kawle, A.P.; Daginawala, H.F.; Singh, L.K.; Kashyap, R.S. Prevalence of zoonotic tuberculosis and associated risk factors in Central Indian populations. J. Epidemiol. Glob. Health 2017, 7, 277–283. [Google Scholar] [CrossRef]
  3. Müller, B.; Dürr, S.; Alonso, S.; Hattendorf, J.; Laisse, C.J.M.; Parsons, S.D.C.; Van Helden, P.D.; Zinsstag, J. Induced tuberculosis in humans. Emergy Infect. Dis. 2013, 19, 899–908. [Google Scholar] [CrossRef] [Green Version]
  4. Palmer, M.V.; Waters, W.R. Advances in bovine tuberculosis diagnosis and pathogenesis: What policy makers need to know. Vet. Microbiol. 2006, 112, 181–190. [Google Scholar] [CrossRef] [Green Version]
  5. Richeldi, L. Rapid identification of Mycobacterium tuberculosis infection. Clin. Microbiol. Infect. 2006, 12, 34–36. [Google Scholar] [CrossRef] [Green Version]
  6. Lerche, N.W.; Yee, J.A.L.; Capuano, S.V.; Flynn, J.L. New approaches to tuberculosis surveillance in nonhuman primates. ILAR J. 2008, 49, 170–178. [Google Scholar] [CrossRef] [Green Version]
  7. Dugal, C.J.; Van Beest, F.M.; Vander Wal, E.; Brook, R.K. Targeting hunter distribution based on host resource selection and kill sites to manage disease risk. Ecol. Evol. 2013, 3, 4265–4277. [Google Scholar] [CrossRef]
  8. Sandoval Barron, E.; Swift, B.; Chantrey, J.; Christley, R.; Gardner, R.; Jewell, C.; McGrath, I.; Mitchell, A.; O’Cathail, C.; Prosser, A.; et al. A study of tuberculosis in road traffic-killed badgers on the edge of the British bovine TB epidemic areafile. Sci. Rep. 2018, 8, 1–8. [Google Scholar] [CrossRef] [Green Version]
  9. Wobeser, G. Bovine tuberculosis in Canadian wildlife: An updated history. Can. Vet. J. La Rev. Vet. Can. 2009, 50, 1169–1176. [Google Scholar]
  10. Rodríguez-Hernández, P.; Cardador, M.J.; Arce, L.; Rodríguez-Estévez, V. Analytical tools for disease diagnosis in animals via fecal volatilome. Crit. Rev. Anal. Chem. 2020. [Google Scholar] [CrossRef]
  11. Kataoka, H.; Saito, K.; Kato, H.; Masuda, K. Noninvasive analysis of volatile biomarkers in human emanations for health and early disease diagnosis. Bioanalysis 2013, 5, 1443–1459. [Google Scholar] [CrossRef]
  12. Wilson, A.D. Applications of electronic-nose technologies for noninvasive early detection of plant, animal and human diseases. Chemosensors 2018, 6, 45. [Google Scholar] [CrossRef] [Green Version]
  13. Ellis, C.K.; Rice, S.; Maurer, D.; Stahl, R.; Waters, W.R.; Palmer, M.V.; Nol, P.; Rhyan, J.C.; VerCauteren, K.C.; Koziel, J.A. Use of fecal volatile organic compound analysis to discriminate between non-vaccinated and BCG—Vaccinated cattle prior to and after Mycobacterium bovis challenge. PLoS ONE 2017, 12, 1–25. [Google Scholar] [CrossRef]
  14. Stahl, R.S.; Ellis, C.K.; Nol, P.; Waters, W.R.; Palmer, M.; VerCauteren, K.C. Fecal volatile organic ccompound profiles from white-tailed deer (Odocoileus virginianus) as indicators of Mycobacterium bovis exposure or Mycobacterium bovis Bacille Calmette-Guerin (BCG) vaccination. PLoS ONE 2015, 10, 1–20. [Google Scholar] [CrossRef] [Green Version]
  15. Purkhart, R.; Köhler, H.; Liebler-Tenorio, E.; Meyer, M.; Becher, G.; Kikowatz, A.; Reinhold, P. Chronic intestinal Mycobacteria infection: Discrimination via VOC analysis in exhaled breath and headspace of feces using differential ion mobility spectrometry. J. Breath Res. 2011, 5, 027103. [Google Scholar] [CrossRef]
  16. Bergmann, A.; Trefz, P.; Fischer, S.; Klepik, K.; Walter, G.; Steffens, M.; Ziller, M.; Schubert, J.K.; Reinhold, P.; Köhler, H.; et al. In vivo volatile organic compound signatures of Mycobacterium avium subsp. paratuberculosis. PLoS ONE 2015, 10, 1–20. [Google Scholar] [CrossRef] [Green Version]
  17. Nol, P.; Ionescu, R.; Welearegay, T.G.; Barasona, J.A.; Vicente, J.; Beleño-Sáenz, K.J.; Barrenetxea, I.; Torres, M.J.; Ionescu, F.; Rhyan, J. Evaluation of volatile organic compounds obtained from breath and feces to detect mycobacterium tuberculosis complex in wild boar (Sus scrofa) in Doñana National Park, Spain. Pathogens 2020, 9, 346. [Google Scholar] [CrossRef]
  18. Ellis, C.K.; Volker, S.F.; Griffin, D.L.; VerCauteren, K.C.; Nichols, T.A. Use of faecal volatile organic compound analysis for ante-mortem discrimination between CWD-positive, -negative exposed, and -known negative white-tailed deer (Odocoileus virginianus). Prion 2019, 13, 94–105. [Google Scholar] [CrossRef]
  19. Cho, Y.S.; Jung, S.C.; Oh, S. Diagnosis of bovine tuberculosis using a metal oxide-based electronic nose. Lett. Appl. Microbiol. 2015, 60, 513–516. [Google Scholar] [CrossRef]
  20. Peled, N.; Ionescu, R.; Nol, P.; Barash, O.; McCollum, M.; Vercauteren, K.; Koslow, M.; Stahl, R.; Rhyan, J.; Haick, H. Detection of volatile organic compounds in cattle naturally infected with Mycobacterium bovis. Sens. Actuators B Chem. 2012, 171–172, 588–594. [Google Scholar] [CrossRef] [Green Version]
  21. Barroso, P.; Barasona, J.A.; Acevedo, P.; Palencia, P.; Carro, F.; Negro, J.J.; Torres, M.J.; Gortázar, C.; Soriguer, R.C.; Vicente, J. Long-term determinants of tuberculosis in the ungulate host community of Doñana National Park. Pathogens 2020, 9, 445. [Google Scholar] [CrossRef] [PubMed]
  22. Barasona, J.A.; López-Olvera, J.R.; Beltrán-Beck, B.; Gortázar, C.; Vicente, J. Trap-effectiveness and response to tiletamine-zolazepam and medetomidine anaesthesia in Eurasian wild boar captured with cage and corral traps. BMC Vet. Res. 2013, 9, 107. [Google Scholar] [CrossRef] [Green Version]
  23. Sáenz de Buruaga, M.; Lucio, A.; Purroy, J. Reconocimiento de Sexo y Edad en Especies Cinegéticas; Edilesa: León, Spain, 1991. [Google Scholar]
  24. Safianowska, A.; Walkiewicz, R.; Nejman-Gryz, P.; Chazan, R.; Grubek-Jaworska, H. Diagnostic utility of the molecular assay GenoType MTBC (HAIN Lifescience, Germany) for identification of tuberculous mycobacteria. Pneumonol. Alergol. Pol. 2009, 77, 517–520. [Google Scholar] [PubMed]
  25. Welearegay, T.G.; Cindemir, U.; Österlund, L.; Ionescu, R. Fabrication and characterisation of ligand-functionalised ultrapure monodispersed metal nanoparticle nanoassemblies employing advanced gas deposition technique. Nanotechnology 2018, 29, 065603. [Google Scholar] [CrossRef]
  26. Ionescu, R.; Llobet, E.; Vilanova, X.; Brezmes, J.; Sueiras, J.E.; Calderer, J.; Correig, X. Quantitative analysis of NO2 in the presence of CO using a single tungsten oxide semiconductor sensor and dynamic signal processing. Analyst 2002, 127, 1237–1246. [Google Scholar] [CrossRef]
  27. Zollanvari, A.; Braga-Neto, U.M.; Dougherty, E.R. Applications of electronic-nose technologies for noninvasive early detection of plant, animal and human diseases. Pattern Recognit. 2009, 42, 2705–2723. [Google Scholar] [CrossRef]
  28. Tisch, U.; Haick, H. Nanomaterials for cross-reactive sensor arrays. MRS Bull. 2010, 35, 797–803. [Google Scholar] [CrossRef]
  29. Peng, G.; Tisch, U.; Adams, O.; Hakim, M.; Shehada, N.; Broza, Y.Y.; Billan, S.; Abdah-Bortnyak, R.; Kuten, A.; Haick, H. Diagnosing lung cancer in exhaled breath using gold nanoparticles. Nat. Nanotechnol. 2009, 4, 669–673. [Google Scholar] [CrossRef]
  30. Durán-Acevedo, C.M.; Jaimes-Mogollón, A.L.; Gualdrón-Guerrero, O.E.; Welearegay, T.G.; Martinez-Marín, J.D.; Caceres-Tarazona, J.M.; Sánchez- Acevedo, Z.C.; Beleño-Saenz, K.J.; Cindemir, U.; österlund, L.; et al. Exhaled breath analysis for gastric cancer diagnosis in Colombian patients. Oncotarget 2018, 9, 28805–28817. [Google Scholar] [CrossRef]
  31. Ionescu, R.; Cindemir, U.; Welearegay, T.G.; Calavia, R.; Haddi, Z.; Topalian, Z.; Granqvist, C.-G.; Llobet, E. Fabrication of ultra-pure gold nanoparticles capped with dodecanethiol for Schottky-diode chemical gas sensing devices. Sens. Actuators B Chem. 2017, 239, 455–461. [Google Scholar] [CrossRef]
  32. Welearegay, T.G.; Diouani, M.F.; Österlund, L.; Borys, S.; Khaled, S.; Smadhi, H.; Ionescu, F.; Bouchekoua, M.; Aloui, D.; Laouini, D.; et al. Diagnosis of human echinococcosis via exhaled breath analysis: A promise for rapid diagnosis of infectious diseases caused by helminths. J. Infect. Dis. 2019, 219, 101–109. [Google Scholar] [CrossRef] [PubMed]
Figure 1. Surface Electron Microscopy (SEM) images of gold nanoparticles functionalized with: (a) 2-Mercaptobenzoxazole and (b) 4-Methoxy-α-toluenethiol.
Sensors 21 00584 g001
Figure 2. (a) Measurement setup: A—computer, B—data acquisition system, C—power source, D—thermal desorption unit, E—sensor test chamber, F—N2 gas bottle, and G—Tenax TA storage tube. (b) Inner view of the sensor test chamber with the chemical gas sensors. (c) Schematic representation of the thermal desorption unit, illustrating released fecal VOCs transported by the N2 gas flow.
Sensors 21 00584 g002
Figure 3. Sensor response (current) as a function of sampling time showing all measurement cycles of the sensors that responded to the fecal VOC samples, when the electronic nose was exposed to one of the samples from wild boar #2 (see Table 1): (a) Sensor S5, (b) Sensor S6, (c) Sensor S8, and (d) Sensor S9. Sensor details are found in Table 3.
Sensors 21 00584 g003
Figure 4. (a) Exposure of sensor S9 to the fecal VOC samples of a bTB negative wild boar (blue curve—boar #2 in Table 1) and a bTB positive wild boar (red curve—boar #12 in Table 1). (b) Parameters used to calculate sensor response features, indicated on the filtered signal of sensor S9 to the fecal VOC sample of wild boar #12. Sensor details are found in Table 3.
Sensors 21 00584 g004
Figure 5. Classification models built for: (a) adult animals, (b) sub-adult animals, and (c) juvenile animals. Projection of the test samples on the classification models for: (d) adult animals, (e) sub-adult animals, and (f) juvenile animals. CV1 and CV2: canonical variables of the DFA model, calculated as a linear combination of sensor features, as described in Ionescu et al. [26]. Legend: control—bTB negative animals, target—bTB positive animals, filled symbols—samples used in the training phase, and empty symbols—samples used in the testing phase.
Sensors 21 00584 g005
Table 1. Information about animals and samples analyzed in this study.
Animal No.M. bovis InfectionSexAge 1LocationNumber of Samples 2
1PositiveMaleAdultMartinazo2
2NegativeMaleJuvenileSanta Olalla2
3PositiveMaleJuvenilePalacio2
4PositiveMaleJuvenilePalacio2
5PositiveFemaleAdultPalacio2
6PositiveFemaleSub-adultPalacio2
7NegativeMaleSub-adultSanta Olalla2
8NegativeFemaleSub-adultSanta Olalla2
9PositiveMaleAdultSanta Olalla2
10NegativeMaleJuvenileSanta Olalla2
11NegativeFemaleAdultSanta Olalla2
12PositiveMaleAdultSanta Olalla2
13NegativeMaleAdultSanta Olalla2
14NegativeFemaleAdultMartinazo2
15PositiveFemaleJuvenileMartinazo2
16NegativeMaleJuvenileMartinazo2
17PositiveMaleSub-adultMartinazo2
18PositiveMaleSub-adultMartinazo2
19NegativeFemaleJuvenilePalacio2
20NegativeFemaleJuvenilePalacio2
21NegativeFemaleJuvenileMartinazo2
22NegativeFemaleJuvenileSanta Olalla2
23NegativeFemaleAdultSanta Olalla2
24NegativeFemaleJuvenileSanta Olalla2
25PositiveFemaleJuvenileMartinazo2
26PositiveMaleJuvenileMartinazo2
27PositiveFemaleJuvenileMartinazo2
28PositiveFemaleJuvenileMartinazo1
29PositiveMaleAdultSanta Olalla1
30PositiveFemaleAdultSanta Olalla1
31PositiveMaleJuvenileMartinazo2
32NegativeFemaleAdultMartinazo1
33NegativeMaleAdultSanta Olalla2
34PositiveMaleSub-adultSanta Olalla2
35NegativeFemaleJuvenileSanta Olalla2
36NegativeMaleJuvenileFuente del Duque1
37NegativeFemaleSub-adultMartinazo1
1 Adult: >24 months, Subadult: 12–24 months, Juvenile: <12 months. 2 The second VOC sample was collected from the same fecal sample introduced in the same jar, immediately after the collection of the first sample. In some cases, one of the samples was damaged during transport and/or handling. Therefore, for some animals, only one sample was available for the analysis.
Table 2. Animal grouping on age, disease, sex, and location.
AgeLocationbTB NegativebTB Positive
MaleFemaleMaleFemale
AdultSanta Olalla2231
Martinazo-21-
Palacio---1
Total2442
Sub-adultSanta Olalla111-
Martinazo-12-
Palacio---1
Total1231
JuvenileSanta Olalla23--
Martinazo1124
Palacio-22-
Fuente del Duque1---
Total4644
Table 3. Information about the sensors employed in this study.
Sensor No.Organic FunctionalityElectrical Resistance
S12-Mercaptobenzoxazole347 kΩ
S2Methyl-3-mercaptopropionate253 kΩ
S31-Decanethiol506 kΩ
S41-Decanethiol641 kΩ
S52-Mercaptobenzoxazole1.5 kΩ
S611-Mercaptoundecanoic acid1.6 kΩ
S74-Methoxy-α-toluenethiol11 kΩ
S84-Methoxy-α-toluenethiol6.8 MΩ
S91-Butanethiol759 kΩ
S10Octadecylamine6.2 MΩ
Table 4. Sensors and features used to build the classification models for each age group of animals. In this table, “a” represents adult, “s” represents sub-adult, and “j” represents juvenile. Sensor details are presented in Table 3, and sensor features in Section 2.3.
Sensors
S5S6S8S9
FeaturesF1-a, sa, j-
F2a, jss, jj
F3a, jja, s, jj
Table 5. Success rates achieved by the classification models during the training and testing phases, respectively. TN: true positives. TN: true negatives. FP: false positives. FN: false negatives. Accuracy = (TP + TN)/(TP + TN + FP + FN). Sensitivity = TP/(TP + FN). Specificity = TN/(TN + FP).
PhaseAge GroupAccuracy (%)Sensitivity (%)Specificity (%)TPTNFNFP
TrainingAdult1001001006600
Sub-adult1001001004300
Juvenile88.97510061020
TestingAdult88.9100804401
Sub-adult1001001004200
Juvenile62.528.688.92851
Publisher’s Note: MDPI stays neutral with regard to jurisdictional claims in published maps and institutional affiliations.

