1. Introduction
Microbiological disinfection hierarchy is a concept based on the general descending order of susceptibility of classes of microorganisms to antimicrobial chemicals. Disinfection kills most, but not necessarily all, microorganisms, and depending on the efficacy of the methods and the resistance of the microorganisms, two types of disinfection hierarchy are usually established, namely: (i) the one that evaluates disinfection systems and their efficacy, starting from cleaning and disinfectant cleaning (hygienization) to sanitization and disinfection, until reaching sterilization, which kills all microorganisms, and (ii) the one that is distinguished by the placement across levels different microorganisms depending on their different structures, compositions, and physiologies which determines the order of resistance to antiseptics and disinfectants [
1]. Most microbial-based hierarchical distributions are built according to the variety of susceptibilities of human pathogens to chemical disinfectants. However, there seems to be a constant pattern in which the highest resistance corresponds to prions, protozoa cysts (i.e., coccidia), and bacterial endospores (i.e.,
Bacillus), while the lowest resistance corresponds to lipid enveloped viruses (coronavirus, retrovirus, orthomyxovirus, etc.) that always have a lower degree of resistance than Gram-negative bacteria [
1,
2]. For biosafety reasons, the hierarchical scales are not normally composed of potentially dangerous pathogens (such as the Ebola virus or SARS-CoV-2) but use surrogate microorganisms. Approaches with surrogate microorganisms are based on the axiom that the experimental disinfection or sterilization action on a hardier microorganism to physical treatments and chemical agents, including heat, drying, radiation, and chemicals, will necessarily be more effective against less resistant ones.
Ultraviolet (UV) light has been demonstrated to be capable of destroying viruses, bacteria, and fungi [
3,
4]. The SARS-CoV-2 virus has not yet been specifically tested for its UV susceptibility, but other tests on related coronaviruses have concluded that they are highly susceptible to UV inactivation [
5,
6]. The use of UV-C (100–280 nm) irradiation has an advantage with respect to higher (280–400 nm) wavelength UV treatments (A and B) because of its higher DNA damaging energy, which results in the formation of photodimers in the genomes of microorganisms [
4,
7]. UV-C has been used for no-touch surface decontamination of multidrug-resistant bacteria in hospital settings [
8,
9,
10]. UV-C has also been incorporated in continuous air disinfection systems, allowing for effective air purification by decreasing viable airborne microorganisms [
11]. In vitro investigations have reported that extremely small doses of 1.2 to 1.7 mJ cm
−2 of far UV-C
222-nm light inactivated aerosolized H1N1 influenza virus and coronaviruses [
6,
12]. It has been reported that UV-C
207–222-nm is a promising candidate against COVID-19 propagation, as this radiation would inactivate SARS-CoV-2 and other hazardous microorganisms that contaminate surfaces in public spaces without harming mammalian skin or eyes [
13]. Ozone produced from ambient air can be considered a side effect of far UV-C lamp operation, although it is well known for its killing action against bacteria, fungi, and viruses [
14,
15]. Furthermore, the combined application of UV-C and ozone has demonstrated synergistic effects against
Escherichia coli [
16],
Bacillus subtilis endospores [
17], and
Aspergillus niger conidia [
18].
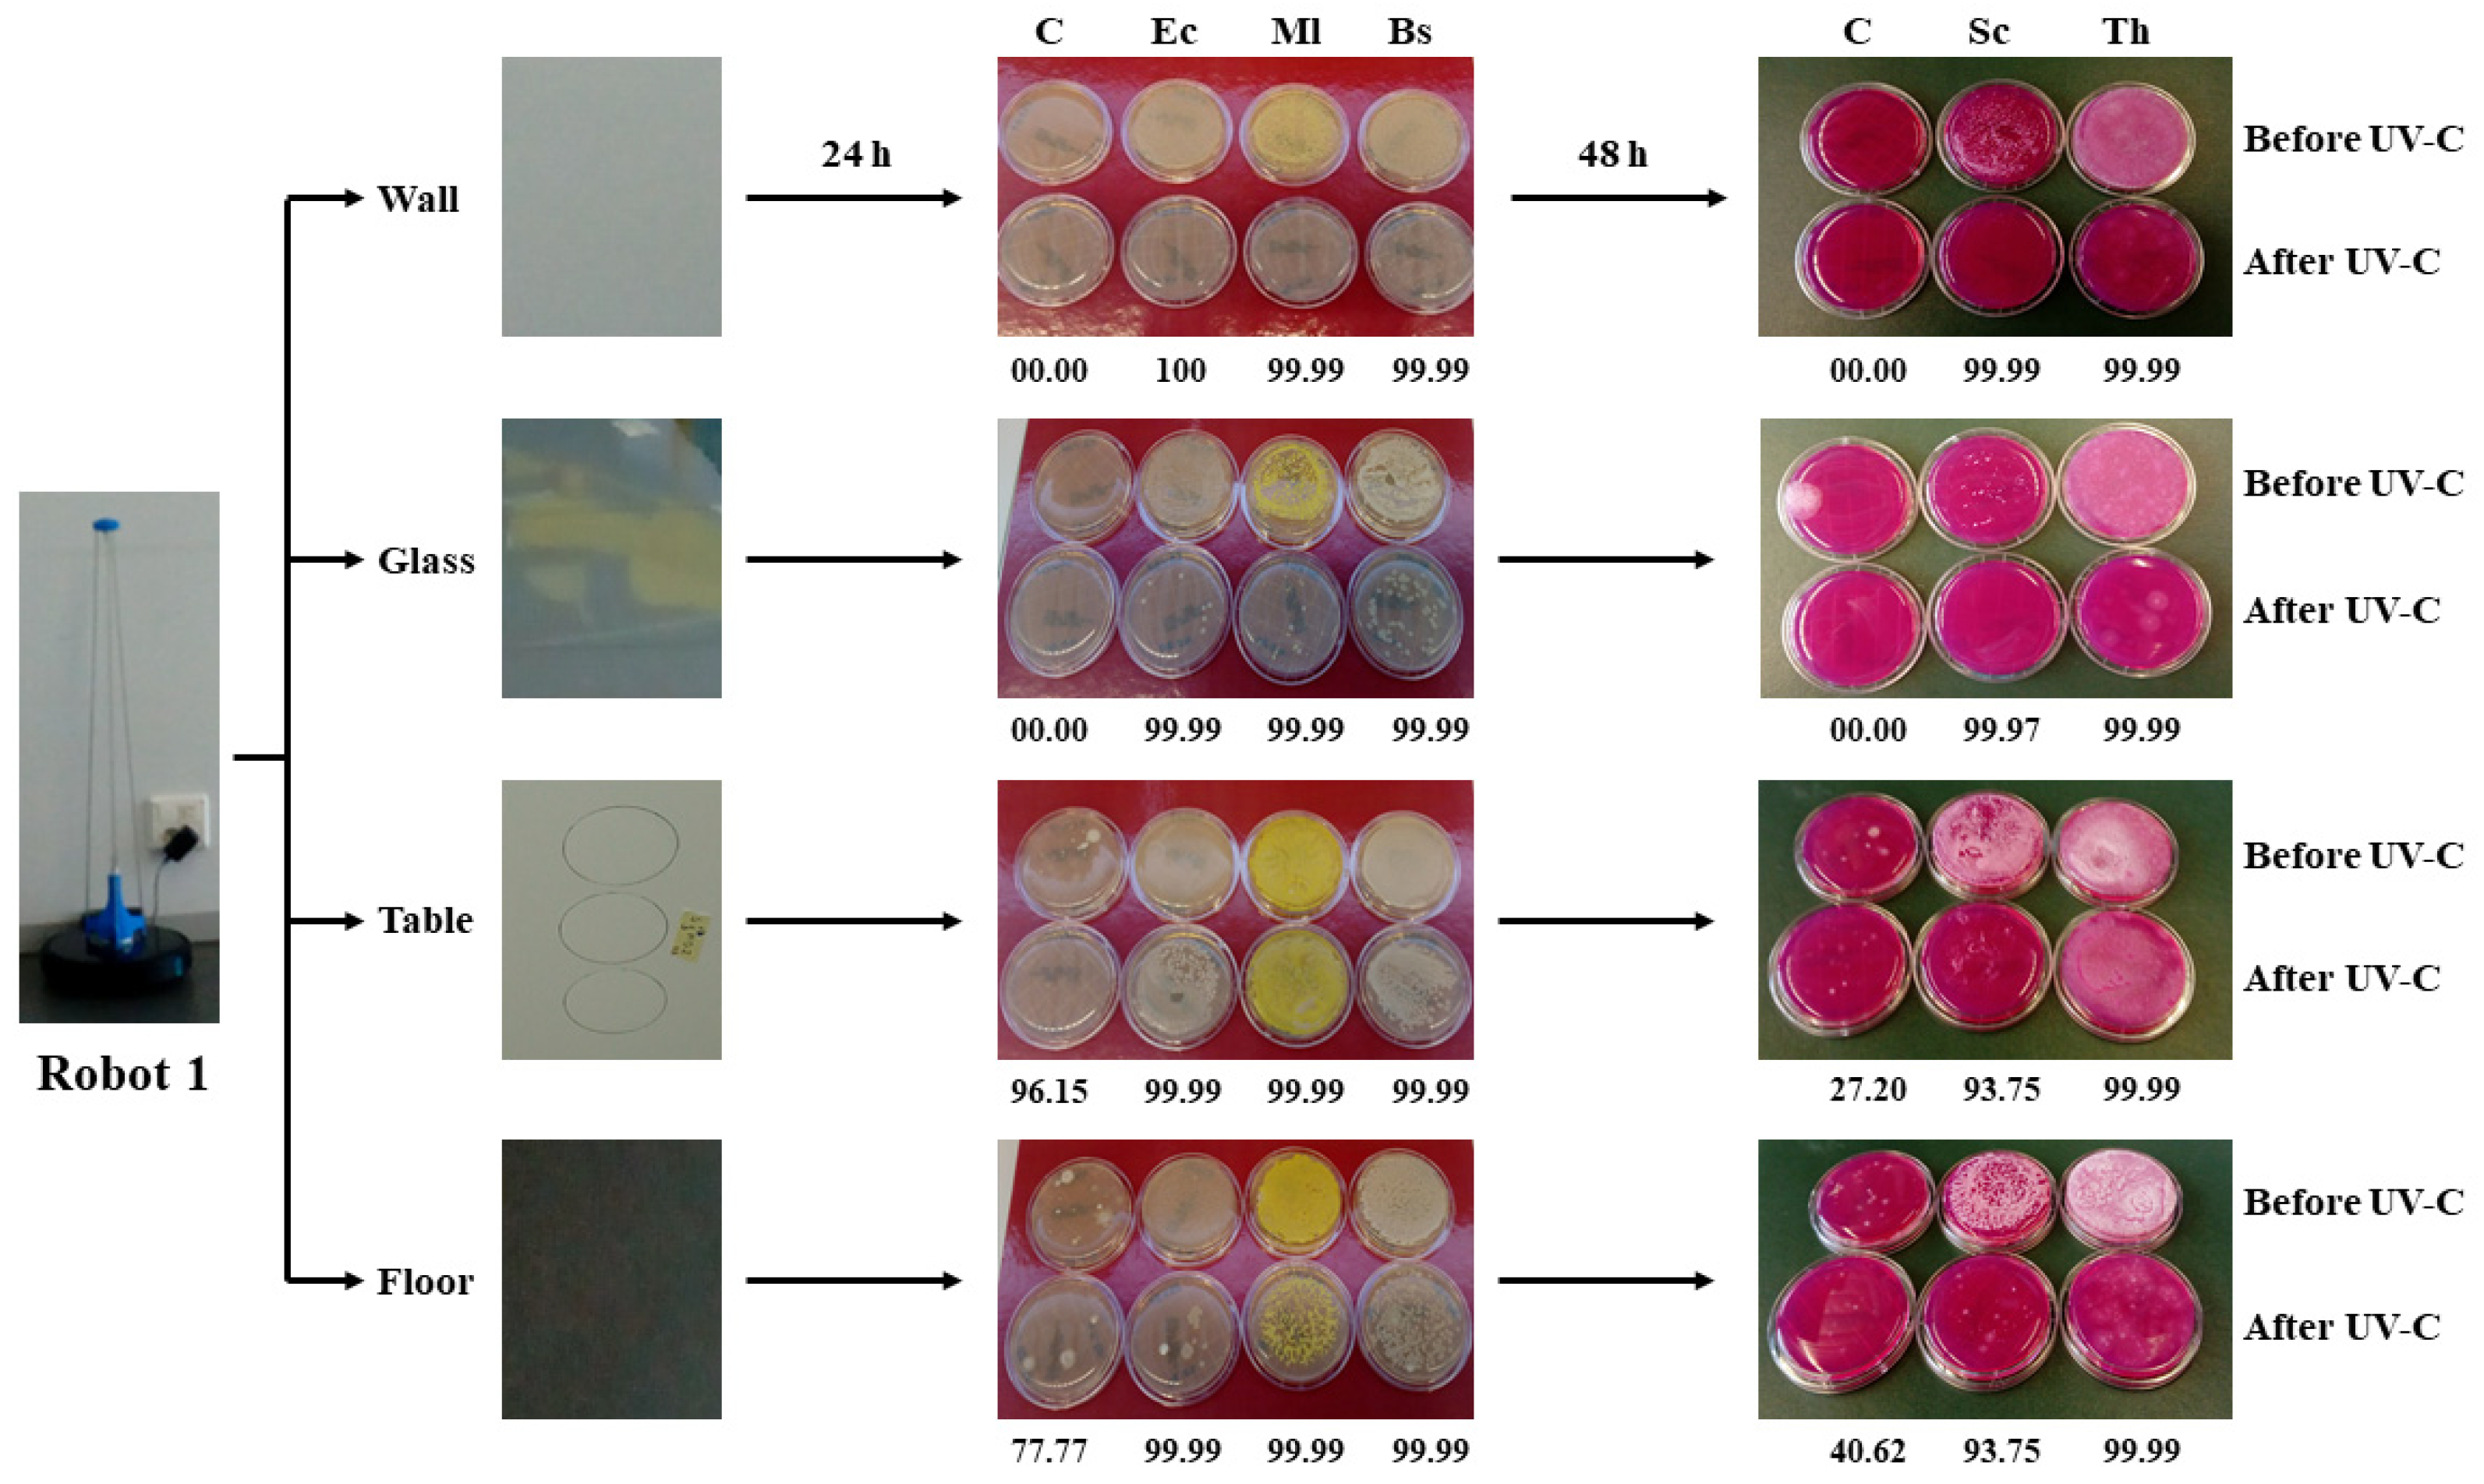
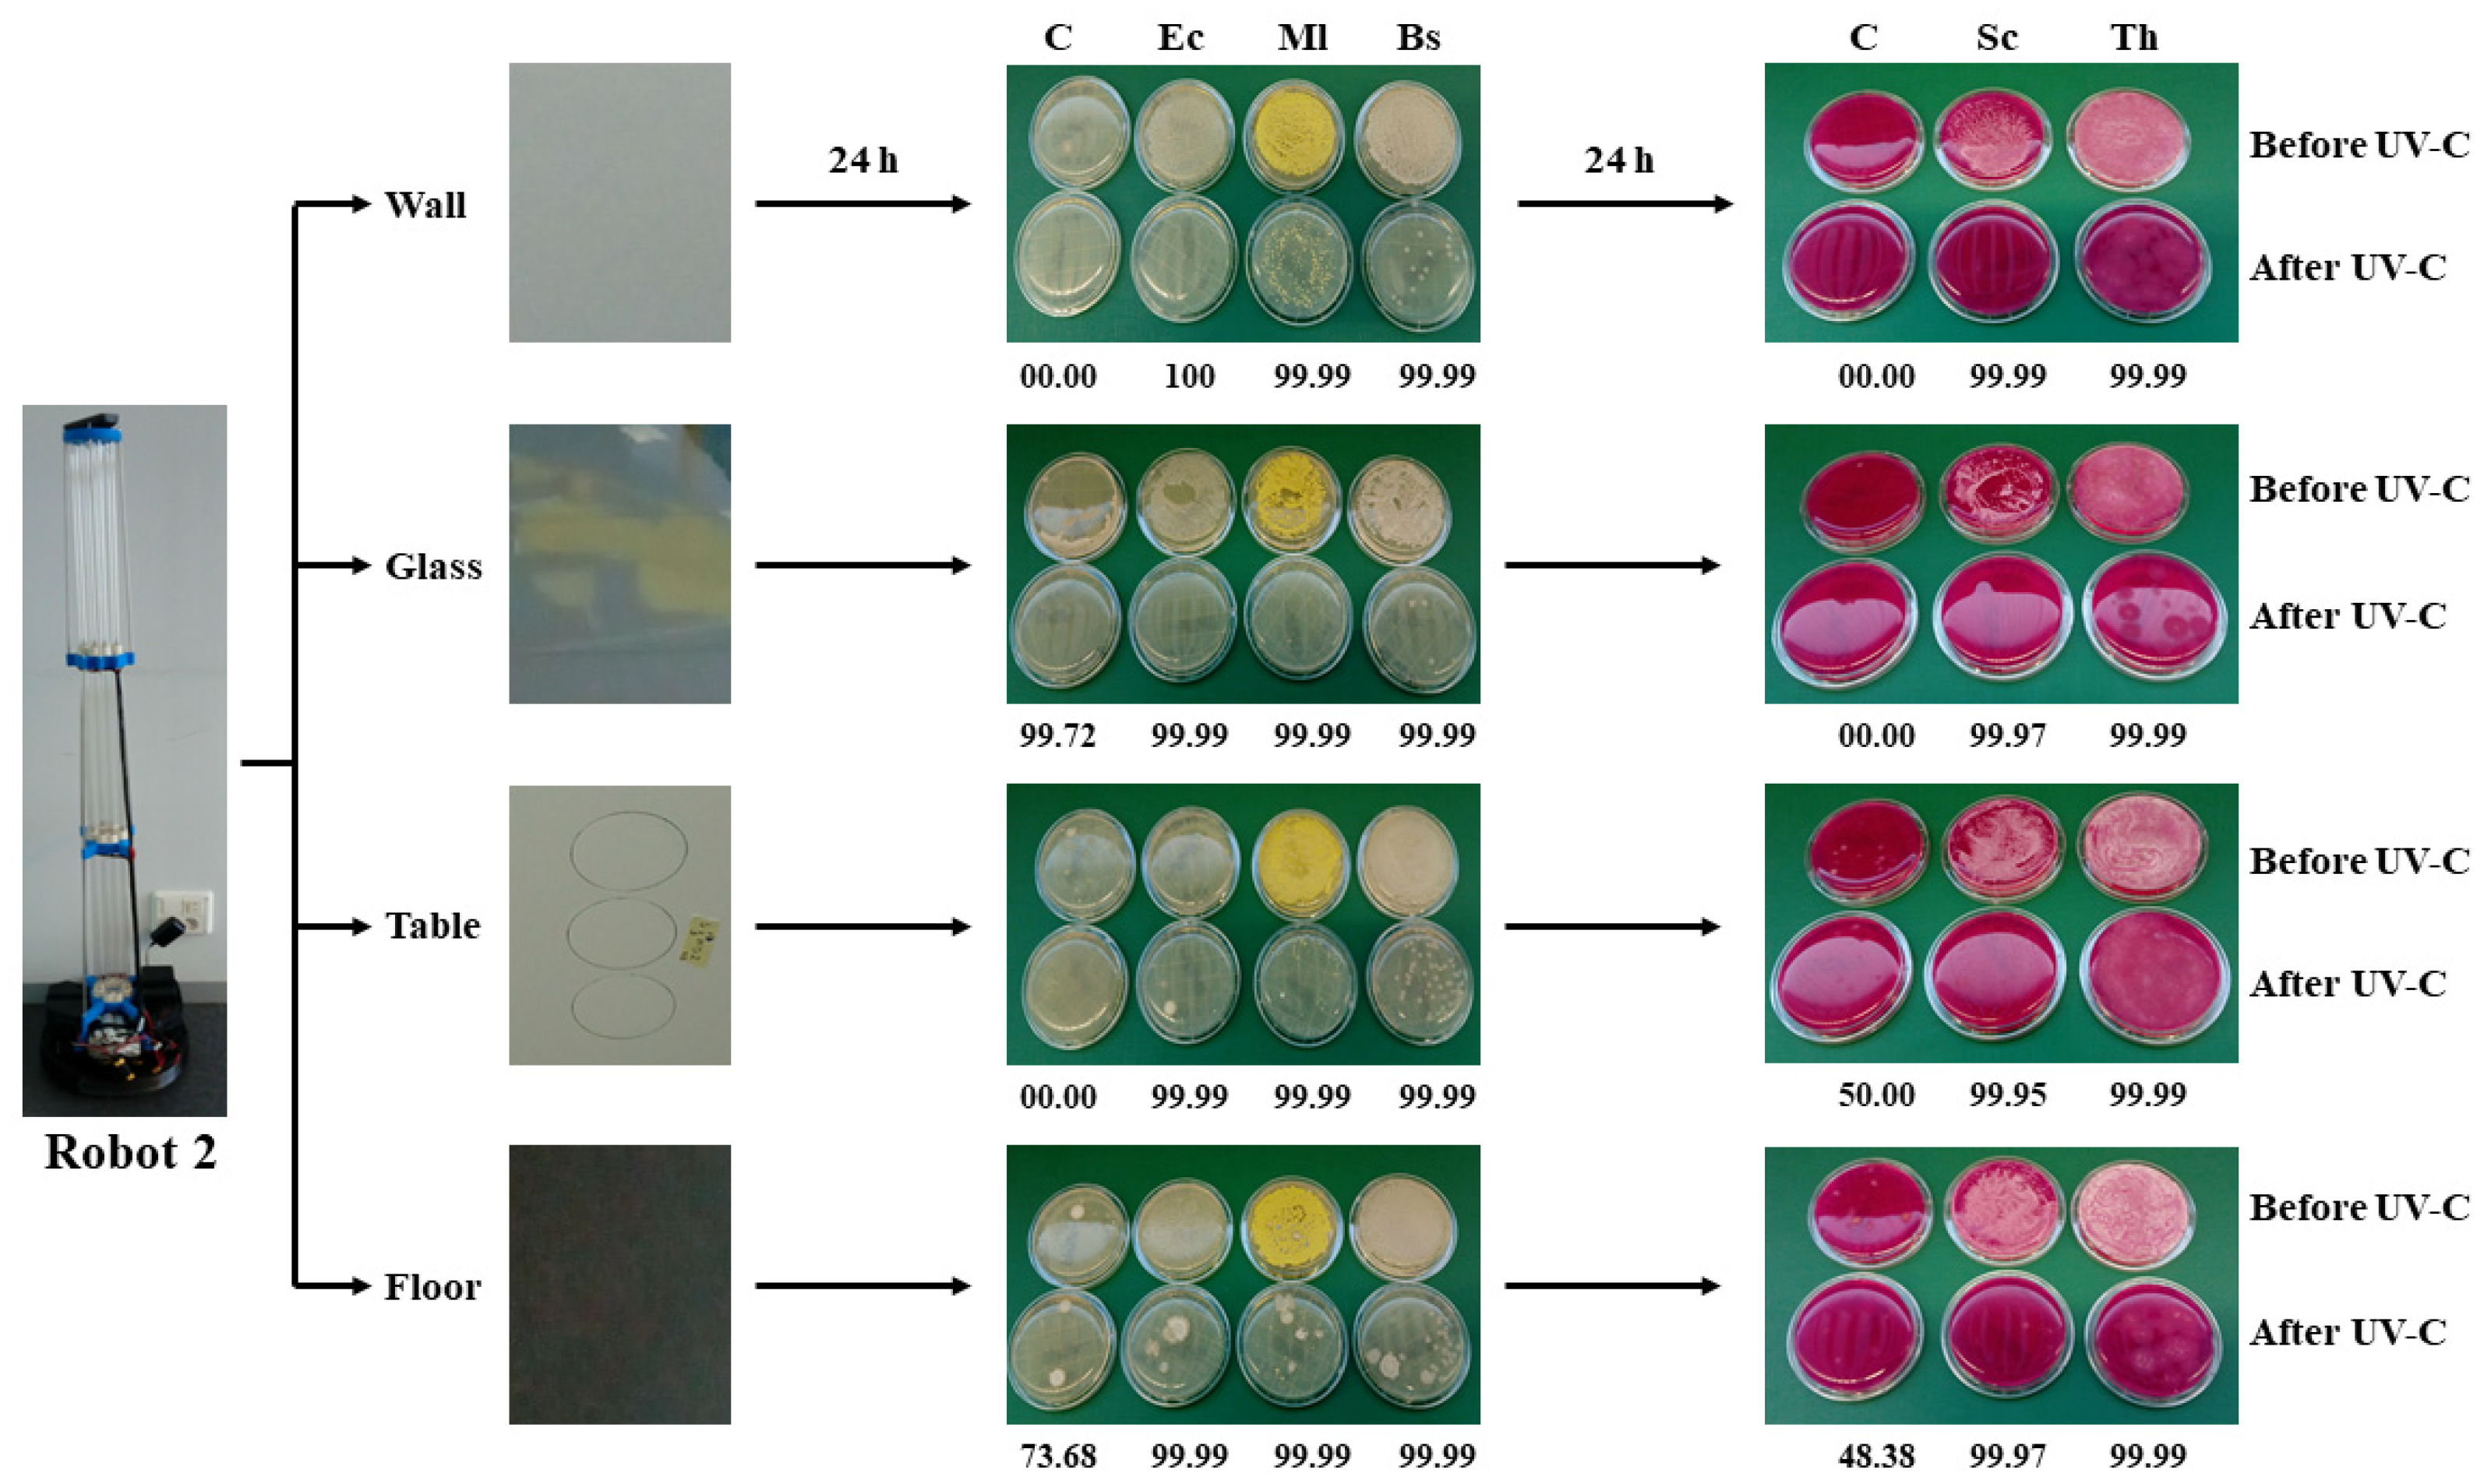
In the present work, the disinfecting power of low-pressure mercury vapour lamps (displayed on two Arborea Intellbird robots, namely: robot 1 with filter glass 40 W UV-C245–256-nm light, and robot 2 with quartz glass 450 W UV-C185–254-nm light and ozone generation at a 185 nm wavelength) was evaluated on four artificially contaminated surfaces (wall, window, floor, and table). The evaluation was performed to assess the disinfection power of the robots on microorganisms with different degrees of resistance. Our objective was to obtain high-level disinfection (HLD) through the complete elimination of all viable microorganisms, except for some fungal conidia and bacterial endospores, when they were present in a significant amount, on the four inanimate surfaces considered after 1 h of dynamic exposure to UV-C and UV-C plus ozone generated by robots 1 and 2, respectively.
2. Materials and Methods
2.1. Robot 1
The first robot was based on utility models registered by Arborea Intellbird (Salamanca, Spain) and was built by modifying the “Conga” household cleaning robot with the authorization and collaboration of its manufacturer (Cecotec, Valencia, Spain). The robot is disc-shaped at the base, measuring 35 cm in diameter and 110 cm in height (
Figure 1). This model of cleaning robot was originally designed for vacuuming and washing floors. It is a light platform, with remarkable robustness, with “detect and avoid” and “detect and actuate” sensors that allow the robots to move with complete freedom. The system includes a remote sensing tool that uses Laser Imaging Detection and Ranging (LIDAR) to illuminate the target with a laser light and measures the reflection (0.3 m s
−1) to build a map of the environment, facilitating the precise positioning of the robot. The HLD system uses a filter glass 40 W UV-C
245–256-nm mercury amalgam luminaire. Lamps are anchored to the base through two UV-resistant plastic adaptors and stainless-steel rods. The equipment works automatically, crossing the surface of the environment to be disinfected without human presence with great precision. It automatically charges the battery when it runs out and resumes work at the point where it stopped. Disinfection is achieved through the accumulation of UV-C radiation peaks, with at least five runs at less than 1 m (20, 38, 56, 74, and 92 cm) distance from the target.
2.2. Robot 2
Based on the same robotic platform as robot 1, but measuring 148 cm in height (
Figure 2), this second robot has a power of 450 W in the germicidal luminaires with quartz glass UV-C
185–254-nm light. In addition to generating UV-C in the germicidal band close to 253 nm, it also produces light in the ozone spectra, generating a 185 nm wavelength. This has a double germicidal effect on the surfaces that need to be disinfected. The ozone peak measured on the target surfaces, at the time of passing this robot at a 20 cm distance, is 0.37 part per million (ppm).
2.3. Microorganisms and Culture Conditions
In this study, strains from the Department of Microbiology and Genetics teaching collection (University of Salamanca, Salamanca, Spain), namely, Escherichia coli MG01 (Gram-negative bacterium), Micrococcus luteus MG04 (Gram-positive coccus), Bacillus subtilis MG07 (endospore-forming Gram-positive bacillus), and Saccharomyces cerevisiae MG10 (yeast), and the Spanish Type Culture Collection (CECT, Valencia, Spain) strain Trichoderma harzianum CECT2413 (sporulated filamentous fungus), were chosen as model microorganisms representing distinct ranges of survival against disinfectants, thus being suitable indicators and an adequate measure of overall microorganism survival determination. A pure culture of each microorganism was incubated either on Luria–Bertani (LB) broth plates containing 1.5% agar or on Potato Dextrose Agar (PDA) plates, at 37 and 28 °C, respectively. After five days of growth, the microorganisms were collected by scrapping with an inoculation loop, resuspended in sterile water, and diluted to a 0.5 OD600-nm (Zuzi spectrophotometer, Rogo-Sampaic, Wissous, France). Then, the number of viable bacteria or fungi in the microbial suspensions was estimated using the method of counting colony forming units (cfu) and, expressed as cfu mL−1, corresponded to the following: E. coli 1.65 × 10⁹, M. luteus 3.1 × 10⁶, S. cerevisiae 1.6 × 10⁴, T. harzianum 1.25 × 10⁷, and B. subtilis 1.93 × 10⁸. These suspensions were the standardized microbial suspensions that were kept at 4 °C and were used in further experiments.
2.4. Sampling on Inoculated Surfaces
A prospective study was conducted to evaluate the effectiveness of a UV-C light no-touch disinfection robot at reducing environmental contamination. Before UV-C irradiation, 1 mL or 0.1 mL of microbial suspension were placed in an area of 9 cm in diameter (63.6 cm2) for irradiation. Sampling was performed on four different surfaces: two horizontal surfaces, namely a melamine table (T) and vinyl floor (F), and two vertical surfaces, namely a plastic painted wall (W) and glass window (G). Floor samples were taken 10 cm away from the wall. Wall and glass window samples were 110 cm and 85 cm, respectively, from the ground. The height of the table was 73 cm. In T, F, and W surfaces, a 1 mL from each microbial suspension was applied using a sterile cotton swab. A similar procedure was followed for the G surface but applying only 0.1 mL from each microbial suspension because of the difficulty in holding such a volume on a vertical glass surface. All of the surface inoculations were carried out in triplicate.
2.5. UV-C Irradiations
All of the UV-C irradiations were conducted in the absence of people, inside a 135 m
3 (270 cm in height, 700 cm in width, and 714.5 cm in length) room with no controlled climate; thus, disinfection was carried out for 1 h at room temperature, between 18 and 21 °C. The UV-C irradiance of robot 1 (245–256 nm) and robot 2 (185–254 nm) was measured as µW cm
−2 using a Linshantech UV Light Meter LS126C (Shenzen Linshang Technology, Huizhou, China), which measures 254 nm UV-C light in a range of 0–20,000 μW cm
−2, with a spectral response from 230 to 280 nm and a dominant wavelength of λp = 254 nm. The irradiance value measurements were converted into units of fluence (mJ cm
−2). The LS126C apparatus was located on the target surface while the robots operated freely around the room. The UV-C sensor measured the light perceived at each pass of the robot at less than 1 m distance. This resulted in five measurements because each measure was taken 18 cm further away from the previous one, which were 20, 38, 56, 74, and 92 cm from the surface on which the sensor was placed. The robots operated for 1 h inside the 135 m
3 room where the study was carried out. As one of the walls of the room was made of glass, sensor-recorded measurements could be taken at each pass in front of the robot throughout the experiment. The complete operation of robot 1 can be seen in
Supplementary Video 1. 2.6. Ozone Treatments
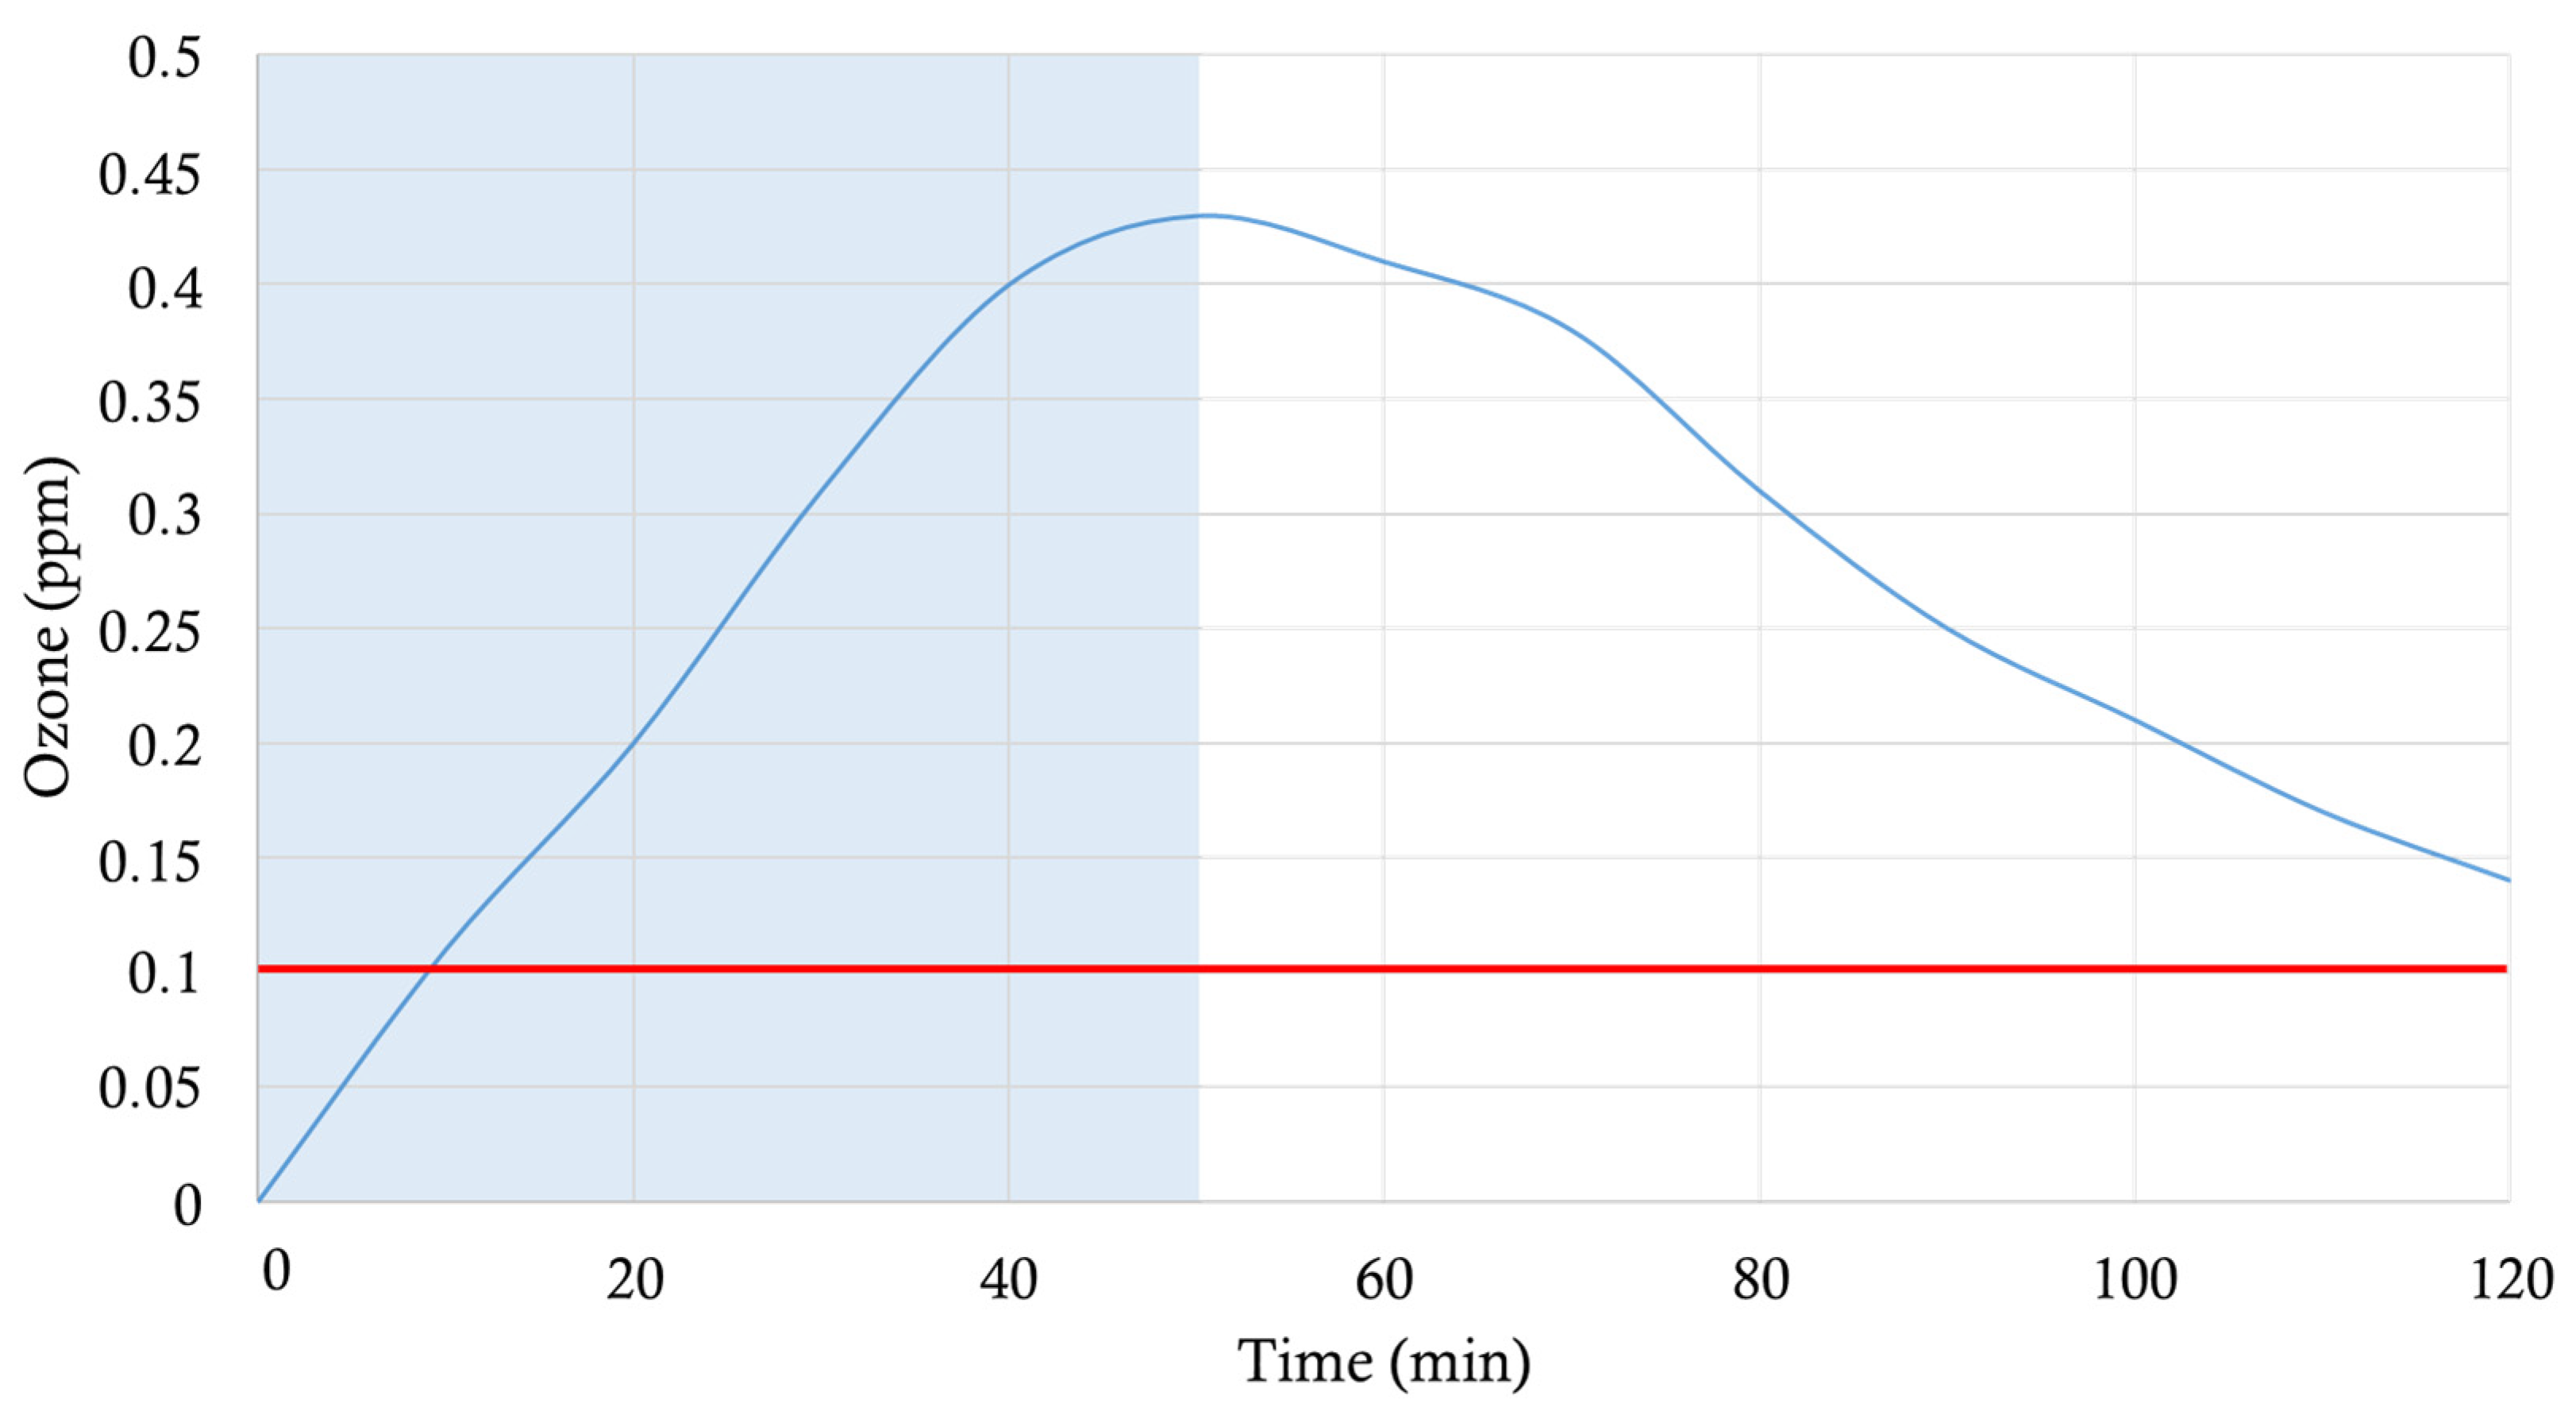
As for the UV-C irradiations, all of the ozone treatments were conducted in the above-described room and in the absence of people for obvious safety reasons. A cardboard sheet with an aluminum layer on its surface was placed 0.5 cm away from plastic painted wall surfaces where an
E. coli suspension had been applied. In such a manner, the wall surfaces covered by the cardboard could not be irradiated by the UV-C light generated by robot 2, yet the ozone produced at 185 nm could reach them. Ozone production was monitored for 2 h with a portable WatchGas UNI O3 (WatchGas, Capelle aan den Ijssel, The Netherlands), with a resolution of 10 ppb (0.01 ppm) ozone. An ozone sensor was placed on the wall surface where the reference microorganisms were distributed and were covered with aluminum foil in order to avoid exposure to UV-C light. Although the robot was working for 50 min (when it was switched off), the ozone-meter was working for 120 min, until we found out that the ozone levels were undetectable by the device. As indicated for the UV-C sensor, one of the walls of the room was made of glass, which allowed us to see the sensor-recorded measurements taken throughout the experiment. Thus, ambient ozone concentrations were monitored during the whole procedure. The levels of ozone in the room were 0 ppm as the ozone-meter did not register the level of the gas just before the robot began to work. A maximum peak was obtained at 0.43 ppm, as can be seen in
Figure 3.
2.7. Microbial Sampling
Un-irradiated (N0) and irradiated samples (N) were collected separately before (before irradiation) and after exposure to UV-C light. For enumeration, both N0 and N (immediately after irradiation and after exposure to ozone, when applicable) samples from each model microorganism and type of surface were collected on the replicate organism detection and counting (Rodac) plates in triplicate. Five sets of six 9 cm diameter circles, three for N0 and three for N samples, were marked on the surfaces to be tested (
Supplementary Figure S1). The circles served to determine the application area of the microbial suspensions and the exact points where the 6.6 cm diameter Rodac plates had to be pressed to the surface for 5 s for the microorganism’s recovery. Additionally, samples from the four analyzed surfaces where the model microorganisms had not been applied were taken in triplicate to evaluate the UV-C effect on environmentally present microorganisms. Rodac-plate count agar (PCA) plates were used to count bacteria, and Rodac-Rose Bengal chloramphenicol (RBC) plates were chosen as the selective medium for the enumeration of filamentous fungi and yeast. Bacterial plates were incubated at 37 °C for 24 h (robot 1) and 48 h (robot 2). The fungal plates from both assays were incubated at 28 °C for 48 h. All of the plates were considered for analysis, and no further clear bacterial or fungal colonies were observed after this incubation time.
2.8. Disinfection Experiments Analysis
The disinfection power of both robots was evaluated, considering the cfu reduction levels of the target microorganisms. The changes in cfu after UV-C or UV-C plus ozone treatments were quantified by determining the number of survival microorganisms. This rate expresses the performance as a percentage reduction in terms of a reduction factor, and, for convenience, typically in factors of 10 using a logarithmic (log) reduction scale—a log reduction value (LRV). Log reduction is a mathematical term that is used when testing a product’s efficacy in order to show the relative number of live microorganisms eliminated from a surface through disinfection. This value can be expressed as a LRV function (Log reduction = log10 (N0/N)) with respect to the initial microorganism concentration before the disinfection process. Where N0 is the cfu of the microorganisms before UV-C irradiation or UV-C irradiation plus ozone exposure (cfu mL−1), and N is the cfu of the microorganisms after UV-C irradiation or UV-C irradiation plus ozone exposure (cfu mL−1). For example, a 1 log reduction corresponds to inactivating 90% of a target microorganism, with the microbial count being reduced by a factor of 10. Thus, a 2 log reduction will see a 99% reduction, or microorganism reduction by a factor of 100, and so on. Bacterial or fungal counts over 100 cfu per 25 cm2 (which is the area of the Rodac plate) were considered uncountable, and such a value, according to ISO 100.012, has to be below 10 cfu per 25 cm2 once the disinfection process has concluded.
4. Discussion
A collaborative investigation has been carried out harnessing robotics, engineering, and microbiological efforts to produce and validate automated and self-sufficient systems able to generate HLD power in our daily life for ordinary touched surfaces during the COVID-19 lockdown. Both in the environmental pollution controls and the bacterial and fungal artificially inoculated surfaces, microbial population reduction values have served to validate the effectiveness of the robotic solutions through applying 40 W UV-C light and 450 W UV-C light, the latter with the capacity to generate 0.43 ppm ozone peaks, so as to obtain HLD on vertical and horizontal surfaces made of different materials. The result has been that the effectiveness of the two developed robots was proven, validated by their effect in reducing the populations of surrogate microorganisms with different degrees of resistance to UV-C radiation and ozone. The hierarchical resistance of microorganisms varies according to the type of antiseptic and disinfectant tested. Some authors have found the resistance of Gram-negative bacteria, with a thin but complex cell wall, to be above yeasts, as well as Gram-positive bacteria, to be ranked from least to most susceptible to chemical disinfection [
1]. However, there is no question that enveloped viruses have the lowest scores in disinfectant resistance tests [
2]. The US environmental protection agency (EPA) has also used the disinfection hierarchy to approve the use of registered products for treating surfaces contaminated with emerging viral pathogens, specifically on the SARS coronavirus (SARS-CoV), influenza A (H1N1) virus, and Ebola virus [
20]. The reduction percentages obtained with subrogate microorganisms with much more recognized resistance than lipid-enveloped viruses, such as SARS-CoV-2, reaffirms the effectiveness achieved in real-life scenarios of our disinfection systems with accumulated UV-C plus ozone. It should be pointed out that it was not necessary to apply irradiation cycles and doses to a clean room and operating room control, but instead the application of a cycle of 1 h with enough UV-C plus ozone to control microorganisms (viruses, bacteria, fungi, and spores), for use in daily life.
The outcome of the current study, although aimed at the need to face the new threat of SARS-CoV-2, represents a versatile tool for broader use. Thus, the obtained data validate the employment of UV-C and UV-C plus ozone generating robots described in the current study for the disinfection of different surfaces, spaces, and environments. In this sense, it is noteworthy to mention that the results obtained in one of the surfaces (wall) are comparable to those achieved for glass. Indeed, this result is relevant because of the different nature of both surfaces, one being more porous (wall) than the other (glass). It would be reasonable to think that in porous surfaces, microorganisms would last longer as the penetrance of the UV-C light is not so good, and the cavities present in such surfaces could provide a reservoir. This is something that could be faced by the UV-C plus ozone generating robot and presumably would penalize the disinfection power of UV-C robot lacking ozone generation. However, our data refute such a theory, as the results achieved with both robots showed similar results in the analyzed surfaces. Every microorganism, based on its biological characteristics, has a distinctive sensitivity in response to a UV-C dose, a kind of fingerprint. Whereas
B. subtilis requires more energy to achieve inactivation, microorganisms like
E. coli and enveloped viruses become inactivated with a relatively low dose of radiance. However, different works have reported that different experimental conditions make it difficult to achieve a general UV-C user criterion. By applying higher doses of energy, reducing exposure distance, and increasing exposure times, the disinfection ratio is greatly improved. In addition, the dose of static UV-C is determined based on the intensity of a given UV-C wavelength at a fixed distance. In this way, UV-C
253.7–254-nm at fluence rates of 40.4 to 50 mJ cm
−2 inactivated endospores of
B. subtilis [
21,
22], and 15 s of UV-C
222-nm at 29.2 mJ cm
−2 was able to achieve a 100% control of
E. coli [
23]. Similar UV-C
254-nm doses were needed for 90% inactivation of
B. subtilis (48 mJ cm
−2) and
E. coli (30 mJ cm
−2) [
24]. By comparison, much lower fluence rates of 1.1 mJ cm
−2 of UV-C
254-nm [
25] and 1.6 mJ cm
−2 of UV-C
222-nm [
12] served to inactivate 95% aerosolized H1N1 influenza virus. This last study concluded that low-intensity levels equivalent to 2 mJ cm
−2 of UV-C
222-nm on the center of the irradiation target in public locations might represent a safe and efficient methodology for limiting the transmission and spread of airborne-mediated microbial diseases. This same UV-C
222-nm fluence was demonstrated to produce enough DNA damage to kill
B. subtilis endospores [
26]. Although this particular study also reported skin damage after typical UV-C
254-nm, none after UV-C
207-nm [
26], our robots were designed to be used exclusively in the absence of people, and the sweeping of the entire room by the robot achieved a cumulative effect of additional radiation in successive passes. Exposure time plays an extremely important role, and the dynamic UV-C
245–256-nm and UV-C
185–254-nm lamps were able to build up enough fluence, 1.21 mJ cm
−2 for robot 1 and 1.70 mJ cm
−2 for robot 2 in just one run at a 20 cm distance, to attain surface HLD without any doubt whatsoever. A recent report has shown that the combination of UV-C light-emitting diodes (LEDs), or low-pressure mercury vapor UV-C
254-nm lamps with 2 mg L
−1 chlorine, effectively inactivated waterborne spores of
T. harzianum [
27]. In the present study, as shown in
Table 2, we have proven that both robots, with a successful disinfection effect, displayed a better microbial control performance on vertical surfaces. As we have started out from different microbial densities, 10
9 cfu mL
−1 for
E. coli to 10
4 cfu mL
−1 for
S. cerevisiae, the log
10 reduction values calculated for both robots were proportionate to the initial microbial quantities tested. Thus, the fact that
S. cerevisiae was reduced by 1.2 log
10 after robot 1 action on horizontal surfaces does not indicate more resistance of this yeast to UV-C
245–256-nm than
B. subtilis endospores, with reductions of 5.28–5.80 log
10, as the reduction range was much lower for
S. cerevisiae, starting from a much smaller amount. Similarly, the log
10 reduction values obtained for
M. luteus can be explained by its starting density, which was from 62 to 532 times lower than those of
B. subtilis and
E. coli, respectively.
Ozone is a toxic gas that is effective as a germicide, but it must be present in a concentration far greater than that which can be safely tolerated by humans or animals. The inhalation of ozone can cause sufficient irritation to the lungs that can result in pulmonary edema [
28]. As a result, the maximum acceptable concentration of generated ozone must not exceed 0.05 ppm by volume of air circulating through a given device in the presence of people. In any case, the full killing power of ozone occurs mostly during the first 4 min of exposure, after which it starts to decompose [
29]. An early report on non-enveloped poliovirus identified genomic damage as the most likely mechanism of viral inactivation [
30]. It is well known that by targeting the membrane glycoproteins, glycolipids, or certain amino acids such as tryptophan, ozone acts on the sulfhydryl groups of certain enzymes and structural proteins, resulting in a disruption of normal microbial activity [
31]. Although it has been reported that high ozone concentrations (80–150 ppm) were needed to reduce
B. subtilis endospores by 6–7 log
10 under exposure periods of 90 min [
32,
33], a lower (2.3 ppm) ozone lethal threshold concentration was proposed for
Bacillus endospores [
34]. Furthermore, other authors [
35] demonstrated that the
E. coli minimum bactericidal concentration of ozone is 1 ppm. Although surface disinfection of non-enveloped viruses was obtained with 6.25 ppm ozone when applied alone for 0.5–10 min [
36], such a concentration does not contradict that the inactivation could also be achieved with lower doses. Exposure of contaminated surfaces to 2 ppm ozone for 4 h has been proposed as an extensive and effective supplement to traditional chemical disinfection methods [
37]. The synergistic bactericidal effect of combined UV-C and ozone owing mainly to the enhanced destruction of
B. subtilis, E. coli, or
A. niger cell structures by producing excess hydroxyl radicals is well documented [
16,
17,
18]. In our study, the UV-C
185-nm ozone generation (0.22 ppm in a 1-h cycle with a maximum peak of 0.43 ppm) contributed to the disinfection power of the cumulative 3.62 mJ cm
−2 UV-C
185–254-nm fluence produced at <92 cm distance from the target surface. The ozone produced had, by itself, a disinfection power generating a log
10 reduction of 5.31. That implies that areas that could not be reached by the UV-C light could nevertheless be disinfected. Higher range ozone-producing robots will help to eliminate microorganism reservoirs, despite staying in the shadows. The US-OSHA requires that workers not be exposed to an average concentration of more than 0.10 ppm for 8 h. As ozone is highly reactive, the 0.22 ppm produced by robot 2 rapidly dissipated in a 135 m
3 room, reaching levels below the US-OSHA limit, namely: 0.1 ppm after 120 min, and 0 ppm at 140 min, making it safe for everyday use, after a 1 h safety period.
Here, we have used a set of microorganisms that can be hierarchically classified according to their level of resistance to evaluate the efficacy of two robots equipped with UV-C lamps and ozone production in order to obtain HLD on four inanimate surfaces after 1 h of dynamic exposure. This technology has been independently successfully used and has proven to be effective when used in nursing homes during the COVID-19 outbreak, and the robotic solution represents a versatile tool that could be employed for disinfection in the light of microbial threats posed by our everyday life. Because of their small size and easy handling, the two robots have great potential to be used in all closed environments where the transmission of pathogens is maximum, and, despite the fact that they cannot be employed in the presence of people, the short time needed to achieve HLD outweighs such a constraint. Disinfection is one of the cornerstones of infection prevention and, therefore, disease control. Thus, apart from maintaining areas with a low level of microorganisms routinely when needed, like surgical rooms, UV-C generating ozone robots will be of great help to prevent pathogens spreading and will be a useful tool during outbreaks and pandemics, becoming a first line of defence against pathogens propagation.

 ,
, 


