Assessment of Cable Length Limit for Effective Protection by Z-Source Circuit Breakers in DC Power Networks

1
Electrical and Computer Engineering, Mercer University, Macon, GA 31207, USA
2
Electrical and Computer Engineering, Old Dominion University, Norfolk, VA 23529, USA
*
Author to whom correspondence should be addressed.
Electronics 2021, 10(2), 183; https://doi.org/10.3390/electronics10020183
Submission received: 13 November 2020
/
Revised: 9 January 2021
/
Accepted: 12 January 2021
/
Published: 15 January 2021
(This article belongs to the Section Power Electronics)
Abstract
:This paper introduces groundbreaking research on how to assess the Cable Length Limit (CLL) to ensure effective protection by Z-source Circuit Breakers (ZCBs) in DC power networks. It has been revealed that the line parameters of power cables have a significant impact on the cutoff performance of ZCBs. The question of assessing the CLL has been raised as an unsolved problem. In this paper, a method of CLL assessment is proposed based on physical models and simulation tests. To verify the proposed method, two studies were performed to assess the Cable Length Limits depending on fault levels and power delivery levels, respectively. The ZCB parameters were specified for a simulation testing system for a 5 MW distribution line feeder. The effectiveness of ZCB protection was tested in groups of simulation tests with various impacting quantities, i.e., cable lengths, fault current levels, and power delivery levels. The effective cable lengths for the ZCB to detect and successfully interrupt a faulty branch in the DC network were assessed and analyzed. The testing results prove that the CLL decreases along with a decreasing fault current level, as well as an increasing power delivery level. Based on data analysis, an equation was derived to calculate the effective length of the ZCB for DC lines, and the equation can be used to generate new CLL curves for various load-power requirements. This study could increase the reliability of a ZCB’s response to a fault in DC transmission and distribution lines. It could also help power system designers/operators to maintain reliable protection with ZCBs in DC power system networks.
1. Introduction
1.1. DC Network Development and Protection Solutions
Today, more and more renewable energy resources in DC format and High-Voltage DC (HVDC) transmission and Medium-Voltage DC (MVDC) distribution networks are forming and being integrated into modern electric power systems. They can provide a long-term sustainable solution for future energy demands. Traditionally, AC systems were generally preferred for high-voltage, high-power transmission for long-distance power delivery due to the affordability of power transformers. However, the advancements in power electronics technology along with the development of highly efficient AC/DC and DC/DC converters have significantly increased the attraction of using DC systems. There is also an increasing demand for a reliable power solution for consumers, which makes it a challenging task for power utilities to supply quality power with high reliability. A DC network integrating DC-nature renewable energy sources and distributed generators could be a viable solution for renewable energy harvesting, local power reliability, and smart grid automation. A DC microgrid with the advantages of a large power supply capacity, flexible control, low line losses, easy access to distributed power resources, etc. is an effective solution for the rapid growth of modern power demands [1,2]. The failure of DC-line protection can result in a large fault inrush current, which influences the operation of the whole grid and may cause damage to electric apparatus and even pose a threat to human life. Thus, it is essential to ensure the reliability and effectiveness of fault protection in DC power networks.
For broader applications of DC power systems, reliability issues should be addressed carefully. Protection, control, and communication are some key issues to be inspected to provide a reliable power supply. Especially, in fault current protection, the opening of an arc-based circuit breaker cannot itself extinguish the arc generated in a DC system due to the lack of a natural zero crossing point [3]. The quenching of such an arc is the most significant concern since it increases the cost of maintenance and reduces the lifespan of the breaker [4,5,6]. A circuit model of a molded-case circuit breaker (MCCB) is proposed and the interruption phenomenon of the MCCB is analyzed in [7]. The dielectric recovery strength of a low-voltage MCCB is improved by changing the splitter plate [8]. An auxiliary solid-state switching device, along with a pre-charged commutation capacitor or a passive network, is used in a traditional solid-state DC breaker to force commutation in the primary solid-state switching device by reverse biasing [2]. The forced commutation requires additional circuitry, which makes traditional DC circuit breakers economically unfeasible. There have been several alternatives proposed to solve the arc problem in DC-network protection. One solution is to use oversized AC circuit breakers. However, they are expensive and large in scale [9]. The second option is to use hybrid circuit breakers, which have increased response times and also have cost constraints [10,11,12,13,14,15]. The third alternative is a solid-state circuit breaker, which requires an additional auxiliary forced commutation circuit that increases the cost and complexity of the circuit [16]. Especially, the high losses in a purely semiconductor-based breaker make it impracticable for high-voltage DC applications, in contrast to lower-power DC applications. Alternatively, the concept of the Z-source Circuit Breaker (ZCB) is introduced to address the arc-quenching phenomenon for DC networks.
1.2. The State of the Art of Z-Source Circuit Breakers
The Z-source inverter, as initially introduced by F.Z. Peng [17], could interface to a voltage or current source and utilize the short-circuit state to achieve a voltage boost. This new topology led to the introduction of a considerable number of “switched Z-source network” structures applied to power electronics converters [18]. Later, the concept of the “Z-source” was adopted into the ZCB for the protection of DC networks. The ZCB is a thyristor (i.e., silicon controlled rectifier, or SCR)-based power electronic circuit breaker that can operate autonomously with low maintenance and has the ability to interrupt fault currents in DC format [1]. The ZCB is a unique form of solid-state circuit breaker providing fault protection in high-power DC branches. A ZCB operates under the principle of a resonant circuit along with the automatic-turnoff feature of SCR to interrupt load-carrying currents at a zero crossing point, functioning at an extremely high speed [19]. To date, several topologies of ZCBs have been introduced in order to improve upon the first proposed ZCB topology [2,20,21,22]. A ZCB can be specified to detect and interrupt high-impedance faults in DC networks [23,24]. Since most of the time, a ZCB stays in an “ON” status, its steady-state power loss is critical for system efficiency. The power-loss conditions of three bidirectional ZCB topologies were compared in [25]. The study formulized the efficiency of power delivery in ZCBs at rated load conditions as a cost function and revealed that the Inter-Cross-Connected Bi-directional Z-source Circuit Breaker (ICC-BZCB) topology, as shown in Figure 1, had low overall power loss compared to the other two topologies. The topology and formulization of the ICC-BZCB were firstly studied in [22], based on which the relationship between its steady-state power loss and configurable tripping time was analyzed in [26], which found that the power delivery efficiency of the ZCB decreased while the demanded tripping time increased. Therefore, the ICC-BZCB was applied to the study of its performance with DC distribution lines in this study.
The ZCB protects the electric component downstream. Typically, the ZCB is placed close to the to-be-protected device. However, when the fault location is not close to the ZCB, the additional impedance of the DC cable might drag the ZCB’s operation out of its detectable range and thus cause a failure in fault protection. The protection failure can cause damage to electric devices within a power system and even the collapse of the entire power network. Therefore, the Cable Length Limit (CLL) must be assessed to guarantee the ZCB’s response to a fault in the desired ranges. It helps power engineers to provide effective protection solutions with ZCBs in DC power networks. Unfortunately, the influence of power cables on the ZCB’s operation has not been discussed or analyzed before. Therefore, we performed groundbreaking research on the influence of the Cable Length Limit on the effectiveness of ZCB protection. This paper reveals and analyzes the unsolved problem of CLL assessment.
In this paper, a method of CLL assessment is proposed based on physical models and simulation tests. To verify the proposed method, two studies were performed to assess the Cable Length Limits depending on fault levels and power delivery levels, respectively. From the results of the simulation tests, the relationships among the CLL, fault level, and power delivery level were analyzed. Based on the relationships, the CLL curve for a certain load condition can be developed to help power engineers to design and specify the effective protection ranges for ZCBs. In the rest of paper, Section 2 introduces the specifications of the ZCB, cable line, and simulation system, as well as a demonstration of the ZCB’s performance under the line parameter’s influence. After demonstrating proof for the existence of CLL points, Section 3 and Section 4 address the assessment of CLL depending on fault levels and power delivery levels, respectively.
2. Demonstration of ZCB’s Performance “with” and “without” Line Parameter Considerations
2.1. Specification of ZCB Parameters
In this section is demonstrated how the cable line affects the ZCB’s cutoff performance in response to faults. At first, the testing system was configured according to the circuit connections in Figure 1 and built in the Matlab/Simulink environment. As shown in Figure 1, the ZCB consisted of three capacitors (C0, C1, and C2), two inductors (L1 and L2), one SCR (T1), and one diode (D2), and the line was represented in an RLC circuit with a resistor (RLine), an inductor (LLine), and a capacitor (CLine). The testing system had a load power rating of 5 MW supplied by a source voltage (Vs) of 5 kV and a DC-load consisting of a parallel RC connection (RL//CL). The line parameters were obtained using a realistic numerical value for the line used in [17]. The base fault resistance (Rf_Base) for the assessment here was 5 Ω, which is the same as the rated load resistance and was used to calculate the actual value of the fault resistance (Rf_Actual) as in (1).
Then, the parameters of the ICC-BZCB for fault current detection and interruption can be determined according to the following steps [22,26]. The ZCB parameters can be identified according to the boundary condition of a tripping time and other restrictions. The tripping time (ttripping) of a ZCB is defined as the time period between the initial fault occurrence and the SCR regaining its forward blocking capability. The SCR current after a fault occurs (t = 0) is expressed as:
where:
- iscr is the current of SCR in amps;
- C is the Z-source capacitance for C0, C1, and C2, in farads;
- Iload is the load current, in amps;
- CL is the load capacitance, in farads;
- k is the minimum detectable fault ramp rate, in ;
- vs. is the source voltage, in volts;
- L is the Z-source inductance for L1 and L2, in henries;
- t is the time after a fault occurs, in seconds.
The minimum detectable fault conductance ramp of a ZCB is defined as:
where:
- Rf_max is the maximum detectable fault resistance in ;
- ttripping is the desired tripping time, in seconds.
Upon substituting the value of k obtained from (3) into (2) and (4), and by setting (a) t equals the desired tripping time of the SCR, ttripping, and (b) the SCR current as zero at ttripping, i.e., , for (2) and (4), the numerical values of Z-source components can be specified for the specified tripping time.
Finally, the specified inductance value of L should be checked using (5), to ensure that the preliminary condition of (2) is met.
Table 1 lists the specified ZCB parameters and line parameters when the desired tripping time (ttripping) is set to 10 µs and the maximum detectable fault resistance (Rf_max) is 5 Ω.
2.2. Demonstration of Effects of Cable Length on ZCB’s Performance
According to the circuit connection shown in Figure 1, a simulation testing system was built in the Matlab/Simulink environment. The ZCB’s parameters were configured in the testing system as shown in Table 1. The “Г” model of a power cable was applied to the cable line in the simulation here, as shown in Figure 1. The line impedance values per unit length (i.e., “r”, “l”, and “c” in Table 1) were obtained from the realistic parameters of a DC cable described in [27,28,29]. A group of simulation tests were performed, and the ZCB’s behaviors “with” two different cable lengths (i.e., 65 m and 75 m) were compared to demonstrate the effects of cable line parameters on the ZCB’s cutoff performance. The cable length is expressed in lLine. For each cable length, the ZCB was tested under three fault current levels.
Figure 2 shows the three cases in the operation of ZCB with a load current (IL = 1.0 kA) pre-fault: Case I has a fault resistance (Rf = 0.1 p.u.) that causes a short-circuit fault current of 11 p.u. (equaling 10.0 p.u. from Rf and 1.0 p.u. from RL) in total; likewise, Case II considers a fault resistance (Rf = 0.5 p.u.) creating a fault current of 3.0 p.u.; finally, Case III shows a fault condition with Rf = 1.0 p.u. that causes a fault current of 2.0 p.u.
From the testing results, it is observable that the ZCB independently responded to a high-level fault current in Cases I and II and neglected the variance in cable length (regardless of whether it was 65 or 75 m), as shown in Figure 2a. However, for Case III, the ZCB failed to cut off the fault current when the cable length was extended to 75 m, although the ZCB still responded with a cable length of 65 m. The difference in the ZCB’s response in this case is shown in Figure 2b. This test reveals that:
- (1)
- The cable length does have an influence on the effectiveness of ZCBs, which can be observed in Figure 2b.
- (2)
- The fault current level has an impact on the ZCB’s performance. With the same cable length of 75 m, the ZCB does not turn off at Rf = 1.0 p.u., while it turns off in the other two cases.
Therefore, the Cable Length Limit must be determined to ensure effective protection by an ZCB in DC system protection.
2.3. Proposed Method of Cable Length Limit (CLL) Assessment
As shown in Figure 1 for physical models for CLL study, the cable line contributes three elements that influence the ZCB’s operation:
- (1)
- By applying the “Г” model of a power cable, the LLine can be combined into the L2 of the ZCB for the analysis of the ZCB’s operation. According to the numerical analysis in [22,26], there is a big margin in L2, and thus, the effect of LLine on the ZCB’s behavior is very limited and can be neglected for assessing the CLL.
- (2)
- (3)
- In addition, the RLine is connected in series in the fault circuit and would attenuate the resonance of an LC circuit, which contributes to the reverse current for the SCR’s turning off. Therefore, RLine has a negative effect on the ZCB’s operation and must be included in the assessment of the CLL too.
In the prior-art methods of ZCB parameter specification [22,26], a third-order equation can be established by applying the condition of “C0 = C1 = C2” and some simplifications. Unfortunately, when considering the parameters of the power cable, the order of the to-be-solved equation increases to four orders, at least. It is impossible to perform the CLL assessment by solving the high-order equation numerically. Therefore, the proposed method of CLL assessment consists of the following steps:
- Step 1:
- identify the ZCB parameters based on the prior-art methods, without considering the influence of the power cable.
- Step 2:
- build a model of the physical model (as shown Figure 1) in a simulation tool, e.g., the Matlab/Simulink environment applied here. Set the ZCB parameters from Step 1 in the simulation model. Set the cable parameters as a function of the cable length into the simulation model.
- Step 3:
- perform a number of simulations to check the impact of different quantities on the ZCB’s turnoff behavior. The quantities include the cable length, fault resistance (i.e., fault levels), and load amount (i.e., power delivery levels).
- Step 4:
- determine the CLL by analyzing the simulation results.
3. Assessing Cable Length Limit Depending on Fault Levels
In this section, how the Cable Length Limit was assessed under different fault levels is described. This study analyzed the effects of impacting quantities—the cable length and fault levels—and their interactions. To determine the CLL for a successful tripping in the ICC-BZCB, multiple groups of simulation tests were performed to observe the ZCB’s cutoff behavior with different cable lengths, in order to identify the CLL at a certain fault level. In these tests, the fault levels increased from 2.0 p.u. to 11.0 p.u. of the rated current in the simulation system.
The DC cable information was investigated, and some models and parameters are listed in Table 2. In this study, based on the ratings of the simulation system, the realistic parameters for a DC cable described in [27,28,29] were adopted, as the unit parameters listed in Table 1 and the entire cable parameters listed in Table 3.
Table 3 lists the testing parameters of the simulation system and the estimated CLL for each fault level. The actual values of fault resistance, line resistance, line capacitance, and line inductance were calculated using (1) and (6), respectively, where Rf_base, r, l, and c were obtained from Table 1. The cable length is expressed in lLine. The estimated CLLs were measured and recorded from simulation tests by gradually increasing the cable length from 0 until the ZCB failed to cut off the fault. The ZCB parameters remained unchanged during the tests. The CLLs under various fault levels are also virtually demonstrated in Figure 3 for the effective protection of ZCBs at various fault levels.
From the results, it was found that as the fault resistance increased, the Cable Length Limit for effective protection by the ZCB decreased gradually. Additionally, the breaker could provide protection for a longer distance in the case of a high-level fault current (i.e., a low fault resistance), whereas the protective distance was reduced significantly for a low-level fault current (i.e., a high fault resistance). Therefore, the cable length must be limited if the power system designer and operator plan to protect the entire line for their expected fault levels. In addition, similar tables and figures (such as Table 3 and Figure 3) can be introduced to determine a Cable Length Limit for a specified minimum fault current to protect DC cables. According to the relationship of CLL with Rfault in Figure 3, the CLL is proportional to the fault current level. Therefore, if the specified minimum fault current can be protected against within a certain cable, any higher fault current in that cable can be protected against as well due to the relatively higher CLLs.
4. Assessing Cable Length Limit Depending on Power Delivery Levels
In this section, how the CLL was further assessed by changing the power delivery level in the DC cables is described. This study analyzed the effects of impacting quantities—the cable length and power delivery levels—and their interactions. A DC network has a constant voltage and supplies multiple DC feeders. These feeders may have different power delivery levels, depending on their load connections. How the CLL changes with the power delivery level is still an open question. This study intended to find out how the CLL would be influenced by its power delivery level and determine the relationship of the CLL with the power delivery level through mathematics.
4.1. Effective Protection for Various Power Delivery Conditions
Beyond one case study in Section 3, the CLL was assessed here by changing the power delivery level in the pre-fault condition. The locations of faults in the DC lines for a successful tripping of the ICC-BZCB were recorded with four cases of load power pre-fault. In the simulation system, the voltage of the DC supply was fixed at Vs = 5.0 kV, with load powers of PL = 75 kW, 100 kW, 500 kW, and 5.0 MW, respectively. A fault branch consisting of a switch and fault resistance (Rf) was used to emulate the fault in the system, as shown in Figure 1. Based on the method of parameter specification in Section 2.1, the ZCB parameters were identified for the four cases as shown in Table 4. The values of the fault bases for this study are also listed in Table 4. The actual value of fault resistance (Rf_Actual) was calculated using (1), and is expressed per unit as Rf in Figure 4. For each load-power pre-fault condition, the ZCB’s behaviors were recorded and analyzed at different fault levels.
From the four groups of simulation tests, four CLL curves were developed for the four power delivery levels, respectively, as shown in Figure 4. Each CLL curve represents the CLL points at various fault levels, at a certain power delivery level. Table 5 lists the data of the identified CLL points and related power delivery levels. By observing the CLL curves and analyzing the data, conclusions can be drawn as follows:
- (a)
- As the value of Rf increases under a certain load, the effective protection by the breaker reduces accordingly. This is the same conclusion as the one from Section 3. This conclusion does not change with the power delivery level.
- (b)
- For a constant Rf, the breaker is able to respond to the fault at a longer distance in the case of a lower load-power requirement and vice versa. In other words, a lower power delivery level leads to a higher CLL. Therefore, for a long-distance, high-power condition, multi-line power delivery can be a solution for increasing the CLL and thus maintaining effective protection by ZCBs in DC networks.
4.2. Verification and Generation of CLL Curves
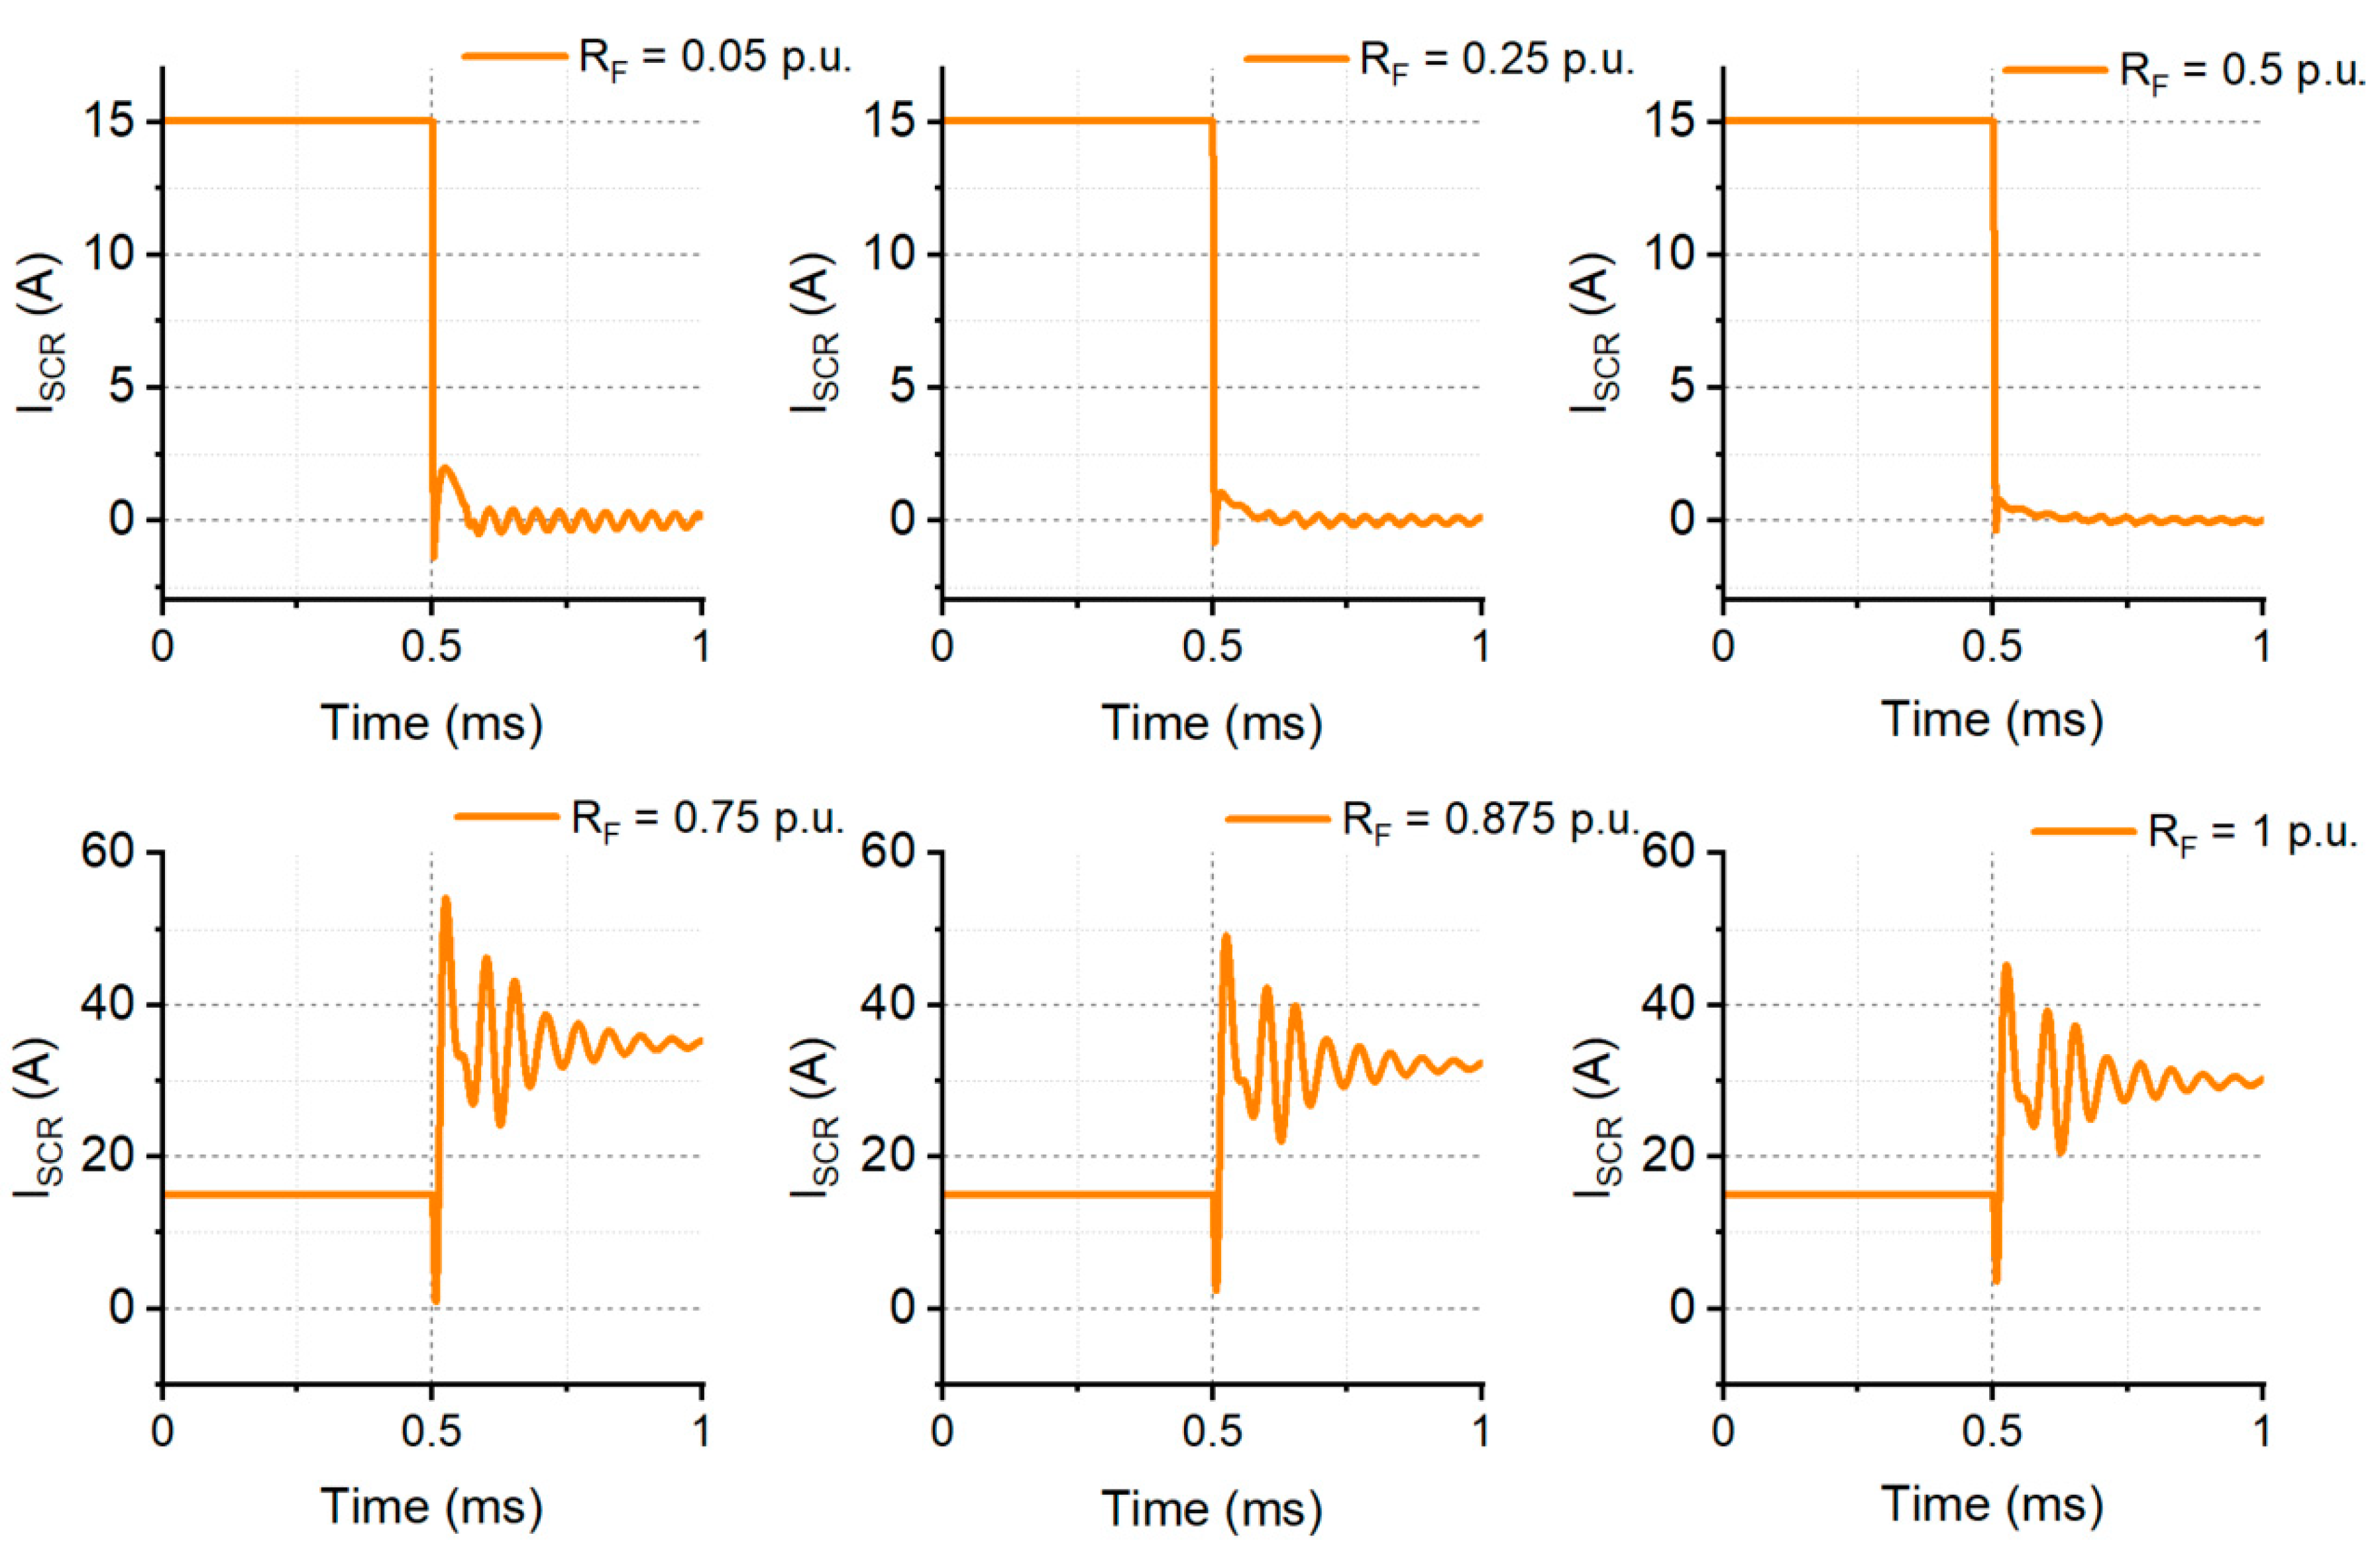
By applying the curve-fitting technique to the CLL points in Figure 4, the CLL curves for a power delivery level could be derived mathematically. To verify the usefulness of the CLL curves, six simulation tests were performed by adding a short DC line (with a length of 10 km) between the ICC-BZCB model and the load of 75 kW in Matlab/Simulink. From the CLL curve for 75 kW, it can be observed that the threshold for the 10 km cable line limit is 0.67 × Rf in p.u. The responsiveness and waveforms of the ICC-BZCB for six different values of Rf were simulated. It can be clearly observed in Figure 5 that the ZCB responded to all the faults with a fault resistance equal to or less than the threshold, e.g., 0.05 × Rf (p.u.), 0.25 × Rf (p.u.), and 0.5 × Rf (p.u.), whereas the breaker lost its responsiveness when the magnitude of Rf increased beyond that threshold. Therefore, the derived CLL curves are valid for specifying the cable line limits under a certain load condition and with a specified minimum fault current for cutoff.
When one CLL curve has been developed and tested, the CLL curves for other conditions can be derived based on the existing one. By performing numerical analysis on the data of the CLL assessments in Section 3 and Section 4, it was found that a new CLL curve could be developed according to (7):
In (7), CLLbase and Pbase are the existing CLL point and its related power delivery level, respectively, and CLLnew and Pnew are the new CLL point and its related power delivery level, respectively. When the effective length of the ZCB is measured and calculated for the base condition, all the other effective length curves can be generated conveniently with (7).
5. Conclusions
In this paper, we performed groundbreaking research on how the effectiveness of ZCB protection is influenced by the CLL. A method of CLL assessment is proposed based on physical models and simulation tests. To verify the proposed method, two studies were performed to assess the Cable Length Limits depending on fault levels and power delivery levels, respectively. The Cable Length Limit was assessed and determined to guarantee reliable DC-line protection by the ZCB. The relationships of the CLL with the fault level and power delivery level prove that (a) the Cable Length Limit decreases along with a decreasing fault current level, and (b) the Cable Length Limit decreases along with an increasing power delivery level. Therefore, the cable length must be limited within a certain range to ensure the ZCB’s turnoff behavior at a target fault level. Additionally, for the long-distance protection of the cable line, the effective protection range of ZCBs can be extended by applying the multi-line power delivery approach.
Based on the relationships shown by the CLL curves, an equation for calculating the effective length of a ZCB for DC lines was derived and can be used to generate new CLL curves for various load-power requirements. The derived CLL curves can be used by power system designers/operators to maintain reliable protection with ZCBs in DC power system networks.
Author Contributions
Conceptualization, R.F. and Y.Z.; methodology, R.F. and Y.Z.; software, S.B.; validation, S.B.; formal analysis, R.F., S.B., and Y.Z.; investigation, R.F., S.B., J.M.K., and Y.Z.; resources, Y.Z.; data curation, S.B. and J.M.K.; writing—original draft preparation, R.F.; writing—review and editing, R.F. and Y.Z.; visualization, S.B.; supervision, R.F. and Y.Z.; project administration, R.F. and Y.Z.; funding acquisition, R.F. All authors have read and agreed to the published version of the manuscript.
Funding
This research received no external funding. The APC was funded by the School of Engineering at the Mercer University.
Conflicts of Interest
The authors declare no conflict of interest.
References
- Corzine, K.A.; Ashton, R.W. A new Z-source DC circuit breaker. IEEE Trans. Power Electron. 2012, 27, 2796–2804. [Google Scholar] [CrossRef]
- Chang, A.H.; Sennett, B.R.; Avestruz, A.-T.; Leeb, S.B.; Kirtley, J.L. Analysis and design of DC system protection using Z-source circuit breaker. IEEE Trans. Power Electron. 2016, 31, 1036–1049. [Google Scholar] [CrossRef]
- Cuzner, R.M.; Venkataramanan, G. The status of DC micro-grid protection. In Proceedings of the IEEE 2008 Industry Applications Society Annual Meeting (IAS’08), Edmonton, AB, Canada, 5–9 October 2008; pp. 1–8. [Google Scholar]
- Lee, S.; Kim, H. A study on Low-Voltage DC circuit breakers. In Proceedings of the IEEE 2013 International Symposium on Industrial Electronics (ISIE), Taipei, Taiwan, 28–31 May 2013; pp. 1–6. [Google Scholar]
- Ganhao, Z. Study on DC circuit breaker. In Proceedings of the IEEE 2014 Fifth International Conference on Intelligent Systems Design and Engineering Applications (ISDEA), Hunan, China, 15–16 June 2014; pp. 942–945. [Google Scholar]
- Ma, R.; Rong, M.; Yang, F.; Wu, Y.; Sun, H.; Yuan, D.; Wang, H.; Niu, C. Investigation on arc behavior during arc motion in air DC circuit breaker. IEEE Trans. Plasma Sci. 2013, 41, 2551–2560. [Google Scholar] [CrossRef]
- Lee, K.A.; Cho, Y.M.; Lee, H.J. Circuit Model and Analysis of Molded Case Circuit Breaker Interruption Phenomenon. Electronics 2020, 9, 2047. [Google Scholar] [CrossRef]
- Cho, Y.M.; Lee, K.A. Experimental Study on Splitter Plate for Improving the Dielectric Recovery Strength of Low-Voltage Circuit Breaker. Electronics 2020, 9, 2148. [Google Scholar] [CrossRef]
- Liljestrand, L.; Backman, M.; Jonsson, L.; Dullni, E.; Riva, M. Medium voltage DC vacuum circuit breaker. In Proceedings of the IEEE 2015 3rd International Conference on Electric Power Equipment–Switching Technology (ICEPE-ST), Busan, Korea, 25–28 October 2015; pp. 495–500. [Google Scholar]
- Polman, H.; Ferreira, J.A.; Kaanders, M.; Evenblij, B.H.; Gelder, P.V. Design of a bi-directional 600 V/6 kA ZVS hybrid DC switch using IGBTS. In Proceedings of the Conference Record of the 2001 IEEE Industry Applications Conference. 36th IAS Annual Meeting (Cat. No.01CH37248), Chicago, IL, USA, 30 September–4 October 2001; Volume 2, pp. 1052–1059. [Google Scholar]
- Meyer, J.M.; Rufer, A. A DC hybrid circuit breaker with ultrafast contact opening and integrated gate-commutated thyristors (IGCTS). IEEE Trans. Power Del. 2006, 21, 646–651. [Google Scholar] [CrossRef]
- Hassanpoor, A.; Hfner, J.; Jacobson, B. Technical assessment of load commutation switch in hybrid HVDC breaker. IEEE Trans. Power Electron. 2015, 30, 5393–5400. [Google Scholar] [CrossRef]
- Song, X.; Peng, C.; Huang, A. A medium voltage hybrid DC circuit breaker—Part I: Solid state main breaker based on 15 kV SiC Emitter Turn-off (ETO) thyristor. IEEE J. Emerg. Sel. Topics Power Electron. 2017, 5, 278–288. [Google Scholar] [CrossRef]
- Dring, D.; Ergin, D.; Wrflinger, K.; Dorn, J.; Schettler, F.; Spahic, E. System integration aspects of dc circuit breakers. IET Power Electron. 2016, 9, 219–227. [Google Scholar] [CrossRef]
- Bsche, D.; Wikening, E.D.; Kpf, H.; Kurrat, M. Hybrid dc circuit breaker feasibility study. IEEE Trans. Compon. Packag. Manuf. Technol. 2017, 7, 354–362. [Google Scholar]
- Shen, Z.J.; Miao, Z.; Roshandeh, A.M. Solid state circuit breakers for DC micrgrids: Current status and future trends. In Proceedings of the IEEE 2015 First International Conference on DC Microgrids (ICDCM), Atlanta, GA, USA, 7–10 June 2015; pp. 228–233. [Google Scholar]
- Peng, F.Z. Z-source inverter. In Proceedings of the Conference Record of the 2002 IEEE Industry Applications Conference. 37th IAS Annual Meeting (Cat. No.02CH37344), Pittsburgh, PA, USA, 13–18 October 2002; Volume 2, pp. 775–781. [Google Scholar]
- Nozadian, M.H.B.; Babaei, E.; Hosseini, S.H.; Asl, E.S. Switched Z-soirce networks: A review. IET Power Electron. 2019, 12, 1616–1633. [Google Scholar]
- Corzine, K.A.; Ashton, R.W. Structure and analysis of the Z-source MVDC breaker. In Proceedings of the IEEE 2011 Electric Ship Technologies Symposium (ESTS), Alexandria, VA, USA, 10–13 April 2011; pp. 334–338. [Google Scholar]
- Ryan, D.J.; Torresan, H.D.; Bahrani, B. A Bi-Directional Series Z-Source Circuit Breaker. IEEE Trans. Power Electron. 2017, 33, 7609–7621. [Google Scholar]
- Savaliya, S.G.; Fernandes, B.G. Analysis and Experimental Validation of Bidirectional Z-Source DC Circuit Breakers. IEEE Trans. Ind. Electron. 2019, 67, 4613–4622. [Google Scholar] [CrossRef]
- Keshavarzi, D.; Ghanbari, T.; Farjah, E. A Z-Source-Based Bidirectional DC Circuit Breaker with Fault Current Limitation and Interruption Capabilities. IEEE Trans. Power Electron. 2017, 32, 6813–6822. [Google Scholar] [CrossRef]
- Bhatta, S.; Fu, R.; Zhang, Y. A New Method of Detecting & Interrupting High-Impedance Faults by Specifying the Z-Source Breaker in Modern Power Systems. Electronics 2020, 9, 1654. [Google Scholar] [CrossRef]
- Bhatta, S.; Fu, R.; Zhang, Y. Detecting High-Impedance Fault with Z-Source Circuit Breakers in Smart Grids. In Proceedings of the IEEE Applied Power Electronics Conference and Exposition (APEC 2020), New Orleans, LA, USA, 15–19 March 2020; pp. 1755–1761. [Google Scholar]
- Bhatta, S.; Zhang, Y.; Fu, R. Comparative Analysis of Power Loss Associated with Topology of Bi-Directional Z-Source Circuit Breakers. In Proceedings of the IEEE 2018 SoutheastCon 2018, St. Petersburg, FL, USA, 19–22 April 2018; pp. 1–5. [Google Scholar]
- Bhatta, S.; Zhang, Y.; Fu, R. Relationship of Steady-State Power Loss and Configurable Tripping Time in Z-Source Circuit Breakers. In Proceedings of the IEEE 2019 Applied Power Electronics Conference and Exposition (APEC), Anaheim, CA, USA, 17–21 March 2019; pp. 3483–3489. [Google Scholar]
- Teppoz, L.; Bornard, G.; Besancon, G. Discrete-time control design for an hvdc transmission between two infinite buses. IFAC Proc. 2004, 37, 1057–1062. [Google Scholar] [CrossRef]
- Thomas, J.L.; Poullain, S.; Benchaib, A. Analysis of a robust DC-bus voltage control system for a VSC transmission scheme. In Proceedings of the IEE International Conf. on AC-DC Power Transmission, London, UK, 28–30 November 2001; pp. 119–124. [Google Scholar]
- Sabatier, J.; Youssef, T.; Pellet, M. An HVDC line parameters estimation method without optimization. Int. J. Electr. Power Energy Syst. 2016, 83, 541–546. [Google Scholar] [CrossRef]
Figure 1.
Physical models of Inter-Cross-Connected Bi-directional Z-source Circuit Breaker (ICC-BZCB), cable line, load, fault branch, and their connections.
Figure 1.
Physical models of Inter-Cross-Connected Bi-directional Z-source Circuit Breaker (ICC-BZCB), cable line, load, fault branch, and their connections.

Figure 2.
Performance of ZCB under different fault current levels, comparing cable lengths of 65 and 75 m: (a) Rf = 0.1 p.u. and Rf = 0.5 p.u.; (b) Rf = 1.0 p.u.
Figure 2.
Performance of ZCB under different fault current levels, comparing cable lengths of 65 and 75 m: (a) Rf = 0.1 p.u. and Rf = 0.5 p.u.; (b) Rf = 1.0 p.u.


Figure 3.
Summary of Cable Length Limit related to fault current levels.

Figure 4.
CLL curves for various load-power requirements.

Figure 5.
A simulation study of the ICC-BZCB’s effectiveness with various Rf values, with a 10 km line.
Figure 5.
A simulation study of the ICC-BZCB’s effectiveness with various Rf values, with a 10 km line.


Table 1.
Specifications of ZCB and line parameters.
| Parameters | Value | Remarks | |
|---|---|---|---|
| Z-Source Breaker Components | C0 = C1 = C2 = CZCB | 369 µF | Z-Source Capacitors |
| L1 = L2 = LZCB | 76.9 µH | Z-Source Inductors | |
| Source and Load Parameters | VS | 5 kV | Source Voltage |
| PL | 5 MW | Load Power | |
| RL | 5 Ω | Load Resistance | |
| CL | 20.25 µF | Load Capacitance | |
| Cable Line Parameters | r | 3.0 × 10⁻² Ω km−1 | Line Series Resistance |
| l | 1.05 × 10⁻³ H km−1 | Line Series Inductance | |
| c | 11 × 10−9 F km−1 | Line Shunt Capacitance | |
| Fault Branch | Rf_Base | 5 Ω | Fault Resistance Base |
Table 2.
Models and ratings of some DC cables.
| Model | Rated Power | Rated Voltage | Rated Current |
|---|---|---|---|
| Prysmian Group DC Power Cables (XLPE, P-Laser, MI-paper, and MI-PPL paper) | 2400 MW–4000 MW | 525 kV–800 kV | 4.57 kA–5.6 kA |
| Phoenix Contact DC Cables | 2 kW–200 kW | 600 kV–1.0 kV | 2 A–200 A |
| Amphenol SINE Systems DC Power Cords | 7.8 kW–18 kW | 600 V | 13 A–30 A |
| Molex Power Cables | 3 kW–40 kW | 600 kV–1.0 kV | 5 A–40 A |
Table 3.
Summary of identified Cable Length Limits (CLLs) versus fault levels.
| Rf (in p.u.) | Rf_Actual (in Ω) | Cable Length Limit (CLL, in m) | Actual Line Parameters | ||
|---|---|---|---|---|---|
| RLine (in mΩ) | CLine (in nF) | LLine (in mH) | |||
| 0.10 | 0.50 | 485.80 | 14.55 | 5.34 | 0.51 |
| 0.20 | 1.00 | 375.52 | 11.25 | 4.13 | 0.39 |
| 0.50 | 2.50 | 200.45 | 6.00 | 2.20 | 0.21 |
| 0.80 | 4.00 | 115.64 | 3.45 | 1.27 | 0.12 |
| 1.00 | 5.00 | 70.25 | 2.10 | 0.77 | 0.07 |
Table 4.
Specification of ZCB parameters and fault bases according to power delivery levels.
| Power Delivery Level (PL) | Load Current (IL) | C0 = C1 = C2 = CZCB | L1 = L2 = LZCB | RF_base |
|---|---|---|---|---|
| 75 kW | 15 A | 5.54 μF | 5.13 mH | 333.33 Ω |
| 100 kW | 20 A | 7.38 μF | 3.85 mH | 250.00 Ω |
| 500 kW | 100 A | 36.90 μF | 0.77 mH | 50.00 Ω |
| 5000 kW | 1000 A | 369.00 μF | 0.07 mH | 5.00 Ω |
Table 5.
Summary of identified CLLs versus power delivery levels.
| RF (p.u) | RF_Actual (Ω) | Cable Length Limit (CLL, in km) | ||||||
|---|---|---|---|---|---|---|---|---|
| 75 kW | 100 kW | 500 kW | 5 MW | 75 kW | 100 kW | 500 kW | 5 MW | |
| 0.05 | 16.67 | 12.50 | 2.50 | 0.25 | 35.67 | 26.75 | 5.35 | 0.54 |
| 0.25 | 83.33 | 62.50 | 12.50 | 1.25 | 23.80 | 17.85 | 3.57 | 0.36 |
| 0.50 | 166.67 | 125.00 | 25.00 | 2.50 | 14.54 | 10.90 | 2.18 | 0.22 |
| 0.75 | 250.00 | 187.50 | 37.50 | 3.75 | 8.67 | 6.50 | 1.30 | 0.13 |
| 0.88 | 291.67 | 218.75 | 43.75 | 4.37 | 6.53 | 4.90 | 0.98 | 0.10 |
| 1.00 | 333.33 | 250.00 | 50.00 | 5.00 | 4.67 | 3.50 | 0.70 | 0.07 |
Publisher’s Note: MDPI stays neutral with regard to jurisdictional claims in published maps and institutional affiliations. |
© 2021 by the authors. Licensee MDPI, Basel, Switzerland. This article is an open access article distributed under the terms and conditions of the Creative Commons Attribution (CC BY) license (http://creativecommons.org/licenses/by/4.0/).
Share and Cite
MDPI and ACS Style
Fu, R.; Bhatta, S.; Keller, J.M.; Zhang, Y. Assessment of Cable Length Limit for Effective Protection by Z-Source Circuit Breakers in DC Power Networks. Electronics 2021, 10, 183. https://doi.org/10.3390/electronics10020183
AMA Style
Fu R, Bhatta S, Keller JM, Zhang Y. Assessment of Cable Length Limit for Effective Protection by Z-Source Circuit Breakers in DC Power Networks. Electronics. 2021; 10(2):183. https://doi.org/10.3390/electronics10020183
Chicago/Turabian StyleFu, Ruiyun, Sagar Bhatta, Joseph M. Keller, and Yucheng Zhang. 2021. "Assessment of Cable Length Limit for Effective Protection by Z-Source Circuit Breakers in DC Power Networks" Electronics 10, no. 2: 183. https://doi.org/10.3390/electronics10020183
Note that from the first issue of 2016, this journal uses article numbers instead of page numbers. See further details here.