DNA Methylation Dynamics in Atlantic Salmon (Salmo salar) Challenged With High Temperature and Moderate Hypoxia
 Anne Beemelmanns1*
  Laia Ribas2
  Dafni Anastasiadi2
  Javier Moraleda-Prados2
  Fábio S. Zanuzzo1
  Matthew L. Rise1
  A. Kurt Gamperl1
- 1Department of Ocean Sciences, Memorial University, St. John’s, NL, Canada
- 2Department of Renewable Marine Resources, Institut de Ciències del Mar, Consejo Superior de Investigaciones Científicas (CSIC), Barcelona, Spain
The marine environment is predicted to become warmer and more hypoxic, and these conditions may become a challenge for marine fish species. Phenotypically plastic responses facilitating acclimatization to changing environments can be mediated by DNA methylation through the modulation of gene expression. To investigate whether temperature and hypoxia exposure induce DNA methylation changes, we challenged post-smolt Atlantic salmon (Salmo salar) to increasing temperatures (12 → 20°C, 1°C week–1) under normoxia or moderate hypoxia (∼70% air saturation) and compared responses in the liver after 3 days or 4 weeks at 20°C. DNA methylation was studied in six genes related to temperature stress (cirbp, serpinh1), oxidative stress (prdx6, ucp2), apoptosis (jund), and metabolism (pdk3). Here, we report that exposure to high temperature, alone or combined with hypoxia, affected the methylation of CpG sites within different genomic regulatory elements around the transcription start of these temperature/hypoxia biomarker genes. Yet, we uncovered distinct CpG methylation profiles for each treatment group, indicating that each environmental condition may induce different epigenetic signatures. These CpG methylation responses were strongly dependent on the duration of stress exposure, and we found reversible, but also persistent, CpG methylation changes after 4 weeks of exposure to 20°C. Further, several of these changes in CpG methylation correlated with transcriptional changes, and thus, can be considered as regulatory epigenetic marks (epimarkers). Our study provides insights into the dynamic associations between CpG methylation and transcript expression in Atlantic salmon, and suggests that this epigenetic mechanism may mediate physiological acclimation to short-term and long-term environmental changes.
Introduction
Increasing temperatures and deoxygenation (hypoxia) of the oceans associated with global warming (Breitburg et al., 2018; Claret et al., 2018; IPCC, 2019) can affect the physiology of marine organisms resulting in shifts in phenotypic traits (Somero, 2010; Crozier and Hutchings, 2014). Aquatic ectotherms, such as fish, are especially sensitive to variations in temperature and hypoxia, as these conditions have lasting effects on their development, growth, metabolism, immunity and reproduction (Brett, 1956, 1971; Hughes, 1973; Currie and Schulte, 2014; Abdel-Tawwab et al., 2019). Phenotypic plasticity, by which prolonged or repeated stress exposure leads to changes in phenotypic responses that optimize physiological performance, has been observed in fishes and this allows them to survive in rapidly changing environments (Crozier and Hutchings, 2014; Seebacher et al., 2015; Beaman et al., 2016). Many fish species have evolved molecular mechanisms and strategies that operate at the transcript level, and enable them to respond and adapt to these environmental stressors (Hazel and Prosser, 1974; Larsen et al., 2011). Although it is still not well-understood how signals of environmental stressors are perceived and integrated into the genome, there is growing evidence that epigenetic mechanisms (e.g., DNA methylation) play an essential role in facilitating this phenotypic plasticity through the modulation of gene expression (Jaenisch and Bird, 2003; Turner, 2009; Eirin-Lopez and Putnam, 2019; McCaw et al., 2020; Ryu et al., 2020; Venney et al., 2020).
Epigenetic modifications are a dynamic combination of DNA methylation, histone modifications, and non-coding RNAs that regulate gene expression (Bird, 2002; Best et al., 2018; Eirin-Lopez and Putnam, 2019). DNA methylation is the reversible addition of a methyl group (CH3) to the 5′ carbon end of cytosine (5mC) nucleotides catalyzed by specific DNA methyltransferases (Edwards et al., 2017). The best characterized process in animals is the methylation of cytosine-phosphate-guanine (CpG) dinucleotides that provides a signal for the activation or deactivation of gene transcription (Jones, 2001, 2012; Edwards et al., 2017). Classically, the hyper-methylation of CpG-rich promoters has been associated with gene silencing through the blockage of the transcription initiation machinery (Jones, 2001, 2012; Bird, 2002; Edwards et al., 2017). However, DNA methylation patterns are far more dynamic and context-dependent than originally thought (Jones, 2012; Baubec and Schübeler, 2014; Ambrosi et al., 2017). For example, increasing evidence also suggests that promoter hyper-methylation is associated with gene activation (Smith et al., 2020). Further, DNA methylation changes appear in a variety of genomic elements that contribute to transcriptional regulation: e.g., within the 5′ upstream (promoter) region (Campos et al., 2013; McGaughey et al., 2014; Han et al., 2016; Wang et al., 2016; Moghadam et al., 2017; Zheng et al., 2017; Uren Webster et al., 2018; Veron et al., 2018), specifically at transcription factor binding sites and enhancers (Bogdanović et al., 2016; Li et al., 2017), as well as in exons (Ball et al., 2009; McGaughey et al., 2014; Li et al., 2017; Moghadam et al., 2017; Uren Webster et al., 2018) and introns of the gene body (Anastasiadi et al., 2018a). These DNA methylation changes can be rapidly induced in response to environmental cues (Angers et al., 2010) and can persist through cell division within generations, but also across multiple generations (Jablonka and Raz, 2009; Nelson et al., 2013; Mirbahai and Chipman, 2014; Szyf, 2015; Wang et al., 2016; Ryu et al., 2018, 2020; Valdivieso et al., 2020; Venney et al., 2020). Consequently, the temporal relationship between environmentally induced DNA methylation changes and gene expression appears to be complex, and thus, additional research is needed before we can fully understand epigenetic processes that modulate phenotypic variation in response to changing environments.
The most challenging environmental stressors faced by fishes include seasonal changes in water temperature (Brett, 1956, 1971; Madeira et al., 2016; Wade et al., 2019) and low water oxygen levels (hypoxia) (Hughes, 1973; Burt et al., 2013; Abdel-Tawwab et al., 2019), and these stressors are predicted to become a greater risk with global warming (Breitburg et al., 2018; Claret et al., 2018; IPCC, 2019). Coastal ecosystems are particularly vulnerable to extreme seasonal temperature increases and hypoxia events, and marine heatwaves are predicted to occur with higher frequency and duration in the future (Frölicher et al., 2018; Oliver et al., 2018). Marine aquaculture species, like Atlantic salmon (Salmo salar), are confined in coastal sea-cages and exposed to increasing temperatures that co-occur with hypoxia for prolonged periods during the summer months, and cannot relocate to more favorable conditions (Burt et al., 2012; Stehfest et al., 2017; Wade et al., 2019; Burke et al., 2020). For instance, water temperatures in Atlantic salmon sea-cages in Tasmania have already exceeded 22–23°C in the summer, while in the Northern Atlantic water temperatures can reach 18–20°C, and oxygen levels often drop to 60–70% of air saturation during these periods (Burt et al., 2012; Stehfest et al., 2017; Wade et al., 2019; Burke et al., 2020). Yet, Atlantic salmon have an optimal growth performance between 10 and 14°C and significant mortalities (∼30%) are observed if temperatures reach 22–23°C (Hvas et al., 2017; Gamperl et al., 2020). As a consequence, these extreme and suboptimal environmental conditions negatively affect their physiological and growth performance (Wade et al., 2019; Gamperl et al., 2020), and they were recently identified as the primary cause of a mass mortality event at cage-sites in Newfoundland in the summer of 2019 (Burke et al., 2020). Thus, this is raising concerns worldwide with respect to salmon health and welfare as the climate warms. Our research has already shown that elevated temperatures (20°C) alone, or in combination with moderate hypoxia (∼70% air saturation), results in large-scale transcriptional changes in the liver of Atlantic salmon, and that the expression of genes related to the heat-shock response, apoptosis and immune defense were up-regulated, whereas those connected to oxidative stress and various metabolic processes were largely suppressed (Beemelmanns et al., 2020). However, it is still not clear how resilient fish are to long-term exposure to elevated temperatures (alone or in combination with hypoxia), and it is important to understand the epigenetic mechanisms regulating these changes in gene expression, and consequently, how they mediate physiological plasticity and acclimatization responses.
Recent research provides compelling evidence that teleost DNA methylation is influenced in various ways by thermal challenges (Campos et al., 2013; Han et al., 2016; Anastasiadi et al., 2017; Burgerhout et al., 2017; Metzger and Schulte, 2017; Ryu et al., 2018, 2020; Uren Webster et al., 2018; McCaw et al., 2020; Valdivieso et al., 2020). Nonetheless, the role of DNA methylation in regulating gene expression during or following hypoxic stress is still largely unexplored (Wang et al., 2016; Veron et al., 2018). Epigenetic marks established during early development are known to be sensitive to environmental cues due to the high rate of mitotic cell division (Faulk and Dolinoy, 2011; Toraño et al., 2016; Pérez et al., 2019). On the contrary, it is still unclear whether environmental stressors experienced at older life-stages (i.e., immature juveniles and adults) can also induce DNA methylation changes that are integrated into the genome as epigenetic marks and facilitate physiological acclimation (reversible or permanent). Given that DNA methylation changes of specific CpGs are sensitive to environmental influences, and can be stably associated with a particular phenotypic response, they can be applied as epigenetic biomarkers (epimarkers). For example, DNA methylation markers are utilized in medicine as non-invasive diagnostic tools for the prognosis of cancer and other diseases (Mikeska and Craig, 2014). Epimarkers have also been used to construct clocks capable of accurately estimating age in humans (Horvath, 2013) and in other vertebrates, including fish (Polanowski et al., 2014; De Paoli-Iseppi et al., 2019; Anastasiadi and Piferrer, 2020). The development of epimarkers to detect past environmental stress exposure in marine organisms gives us the ability to identify early exposures to detrimental stressors, and this will enhance biomonitoring and conservation as well as aquaculture management efforts (Gavery and Roberts, 2017; Beal et al., 2018; Best et al., 2018; Eirin-Lopez and Putnam, 2019). Recently, epigenetic markers were developed to predict sex in fish species, and this will improve sex-control programs in aquaculture (Anastasiadi et al., 2018b; Piferrer, 2018). Further, epigenetic footprinting (epigenetic memory) of lifetime stressors allows for the detection of anthropogenic pollutants, toxins, or even changes in temperature in the marine environment (Beal et al., 2018; Anastasiadi et al., in press).
In this study, we employed Multiplex Bisulfite Sequencing (MBS) to measure CpG methylation within a ∼500 bp region around the transcription start sites of six thermal/hypoxia biomarker genes in the liver of post-smolt Atlantic salmon following short-term (3 days) and prolonged (4 weeks) exposure to (i) high temperature (20°C) and normoxia (∼100% air saturation) (Warm & Normoxic—WN) or (ii) high temperature (20°C) and moderate hypoxia (∼70% air saturation) (Warm & Hypoxic—WH), as compared to (iii) control conditions (12°C, normoxia) (Control—CT) (Figure 1). The biomarker genes used in this study were selected based on previous microarray and qPCR studies on liver tissue from the same experimental fish, and they exhibited stress-induced mRNA expression changes that were associated with physiological performance (Beemelmanns et al., 2020). These target genes are known to be important regulators of temperature (cirbp, serpinh1) (Ishida and Nagata, 2011; Zhong and Huang, 2017; Akbarzadeh et al., 2018; Houde et al., 2019) and oxidative stress (prdx6, ucp2) (Brand and Esteves, 2005; Ambruso, 2013), apoptosis (jund) (Weitzman et al., 2000), and glucose metabolism (pdk3) (Kuntz and Harris, 2018; Table 1). By using this gene-specific locus approach, we aimed to identify epigenetic marks within important genomic regulatory elements [i.e., the 5′ upstream region (including putative TATA-box or Polymerase II (POL-II) promoter sequences), 5′ UTR, first coding exon, and first intron] (Figure 2). We hypothesized that epigenetic modifications are induced by environmental stressors, that these epigenetic marks are important in mediating physiological plasticity and acclimatization responses, and that they may be applicable as epimarkers to predict environmental stress exposure and/or tolerance.
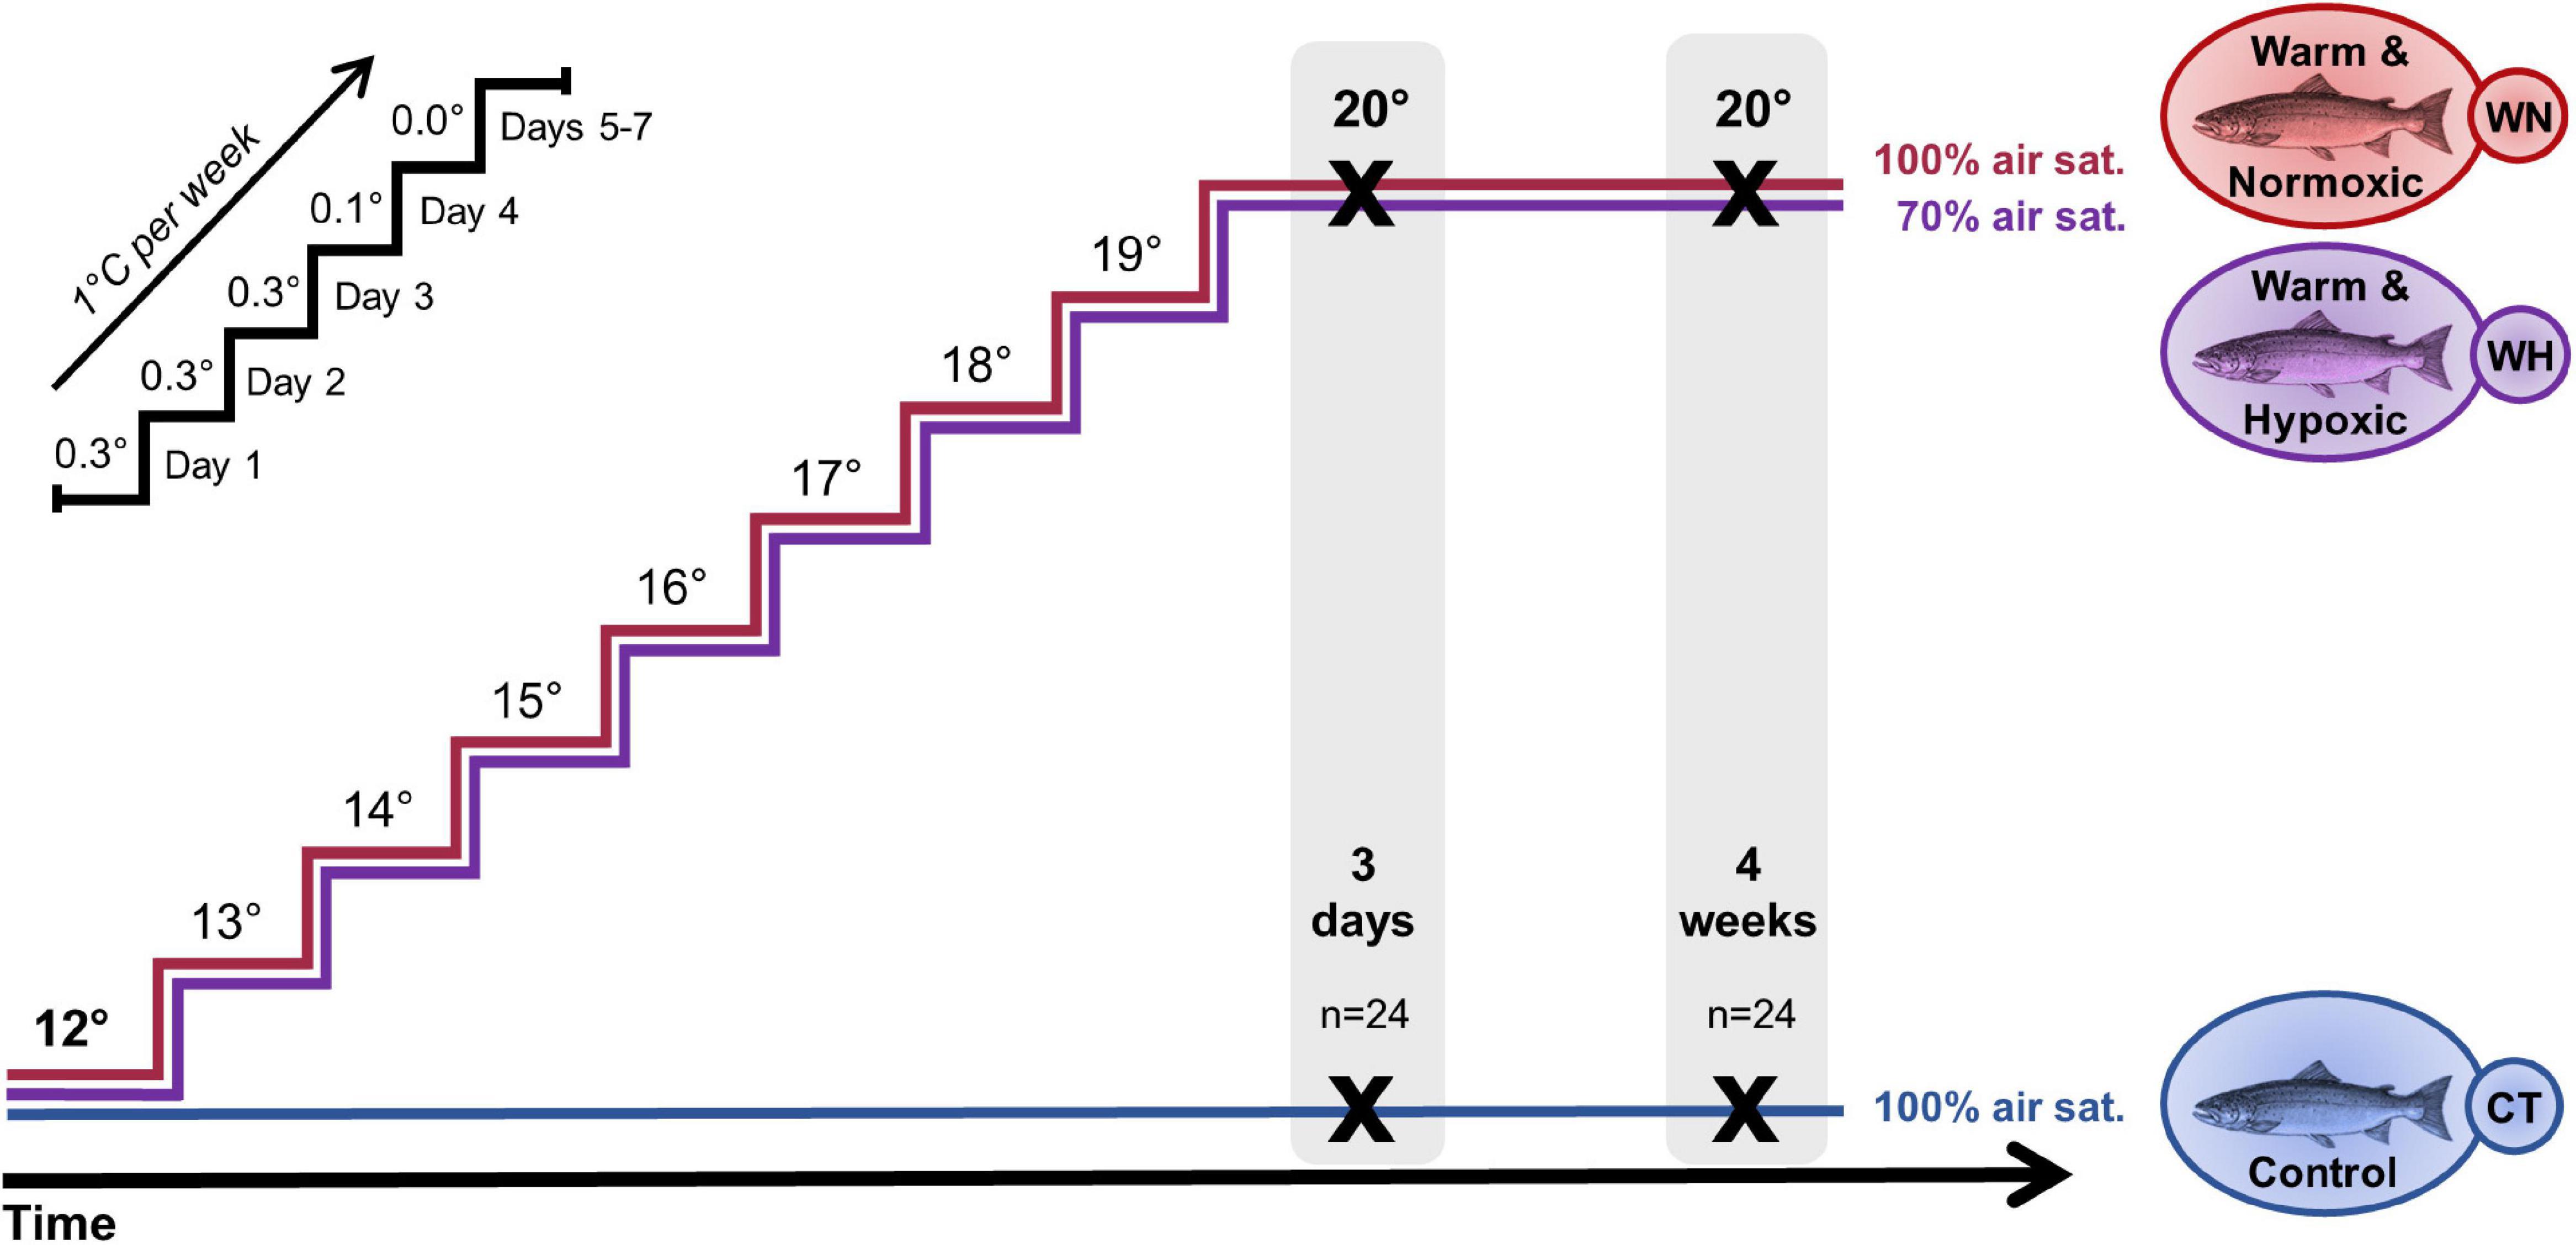
Figure 1. Design of the temperature and hypoxia challenge with Atlantic salmon. Post-smolt salmon were either exposed to: (i) a temperature increase from 12 → 20°C and normoxia (∼100% air saturation) (Warm & Normoxic, WN); (ii) a temperature increase from 12 → 20°C and moderate hypoxia (∼70% air sat.) (Warm & Hypoxic, WH); or (iii) a constant water temperature of 12°C and normoxia (∼100% air sat.) (Control, CT). The temperature was increased by 1°C week– 1, following the temperature regimen shown in the upper left portion of the figure. Liver samples were collected 3 days and 4 weeks after the temperature reached 20°C (n = 8 per treatment/time point, N = 48 total) and used to measure gene expression (qPCR, Fluidigm BiomarkTM) and to examine CpG methylation (Multiplex Bisulfite Sequencing, MBS) in a ∼500 bp region around the transcription start site.
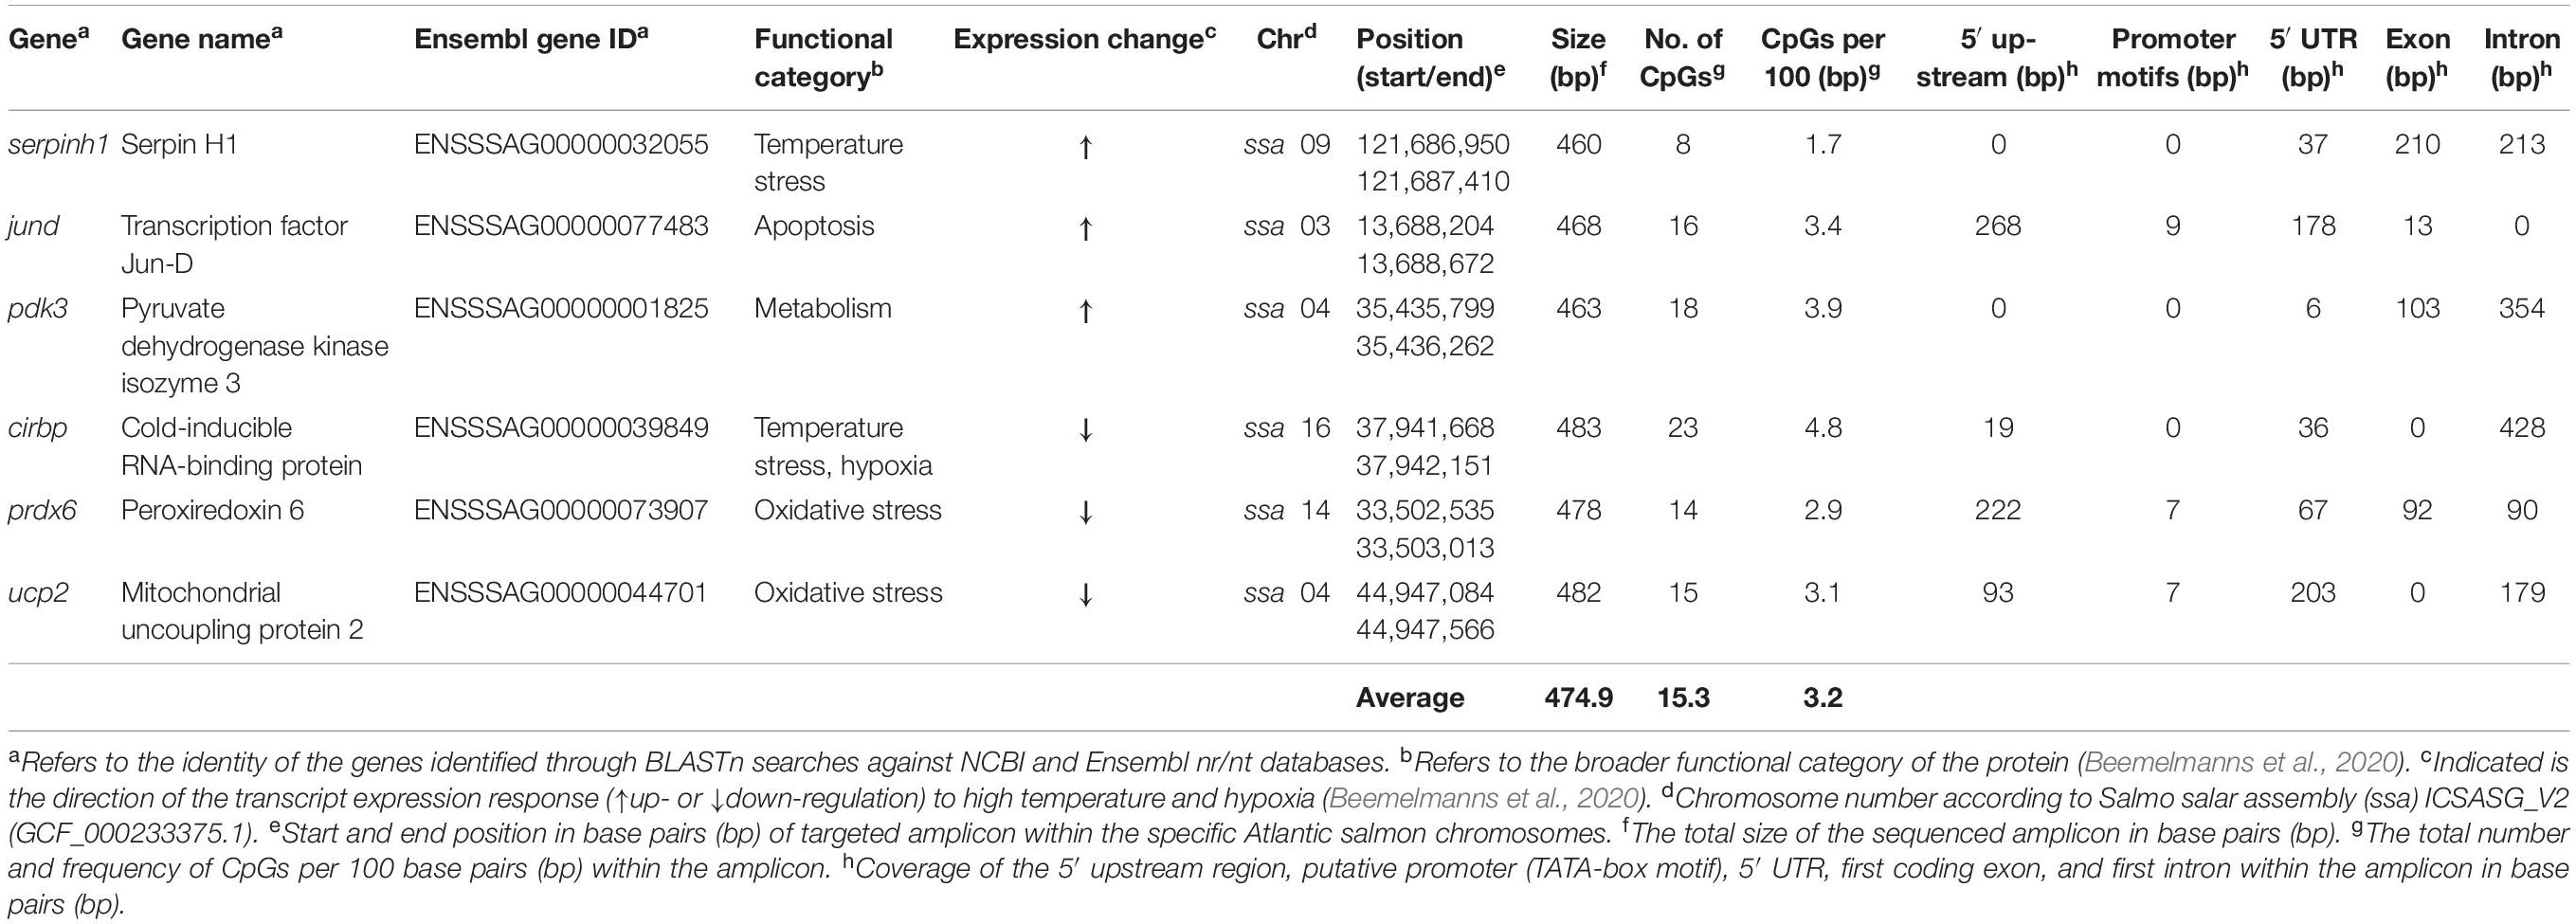
Table 1. Overview of genes used for Multiplex Bisulfite Sequencing (MBS).
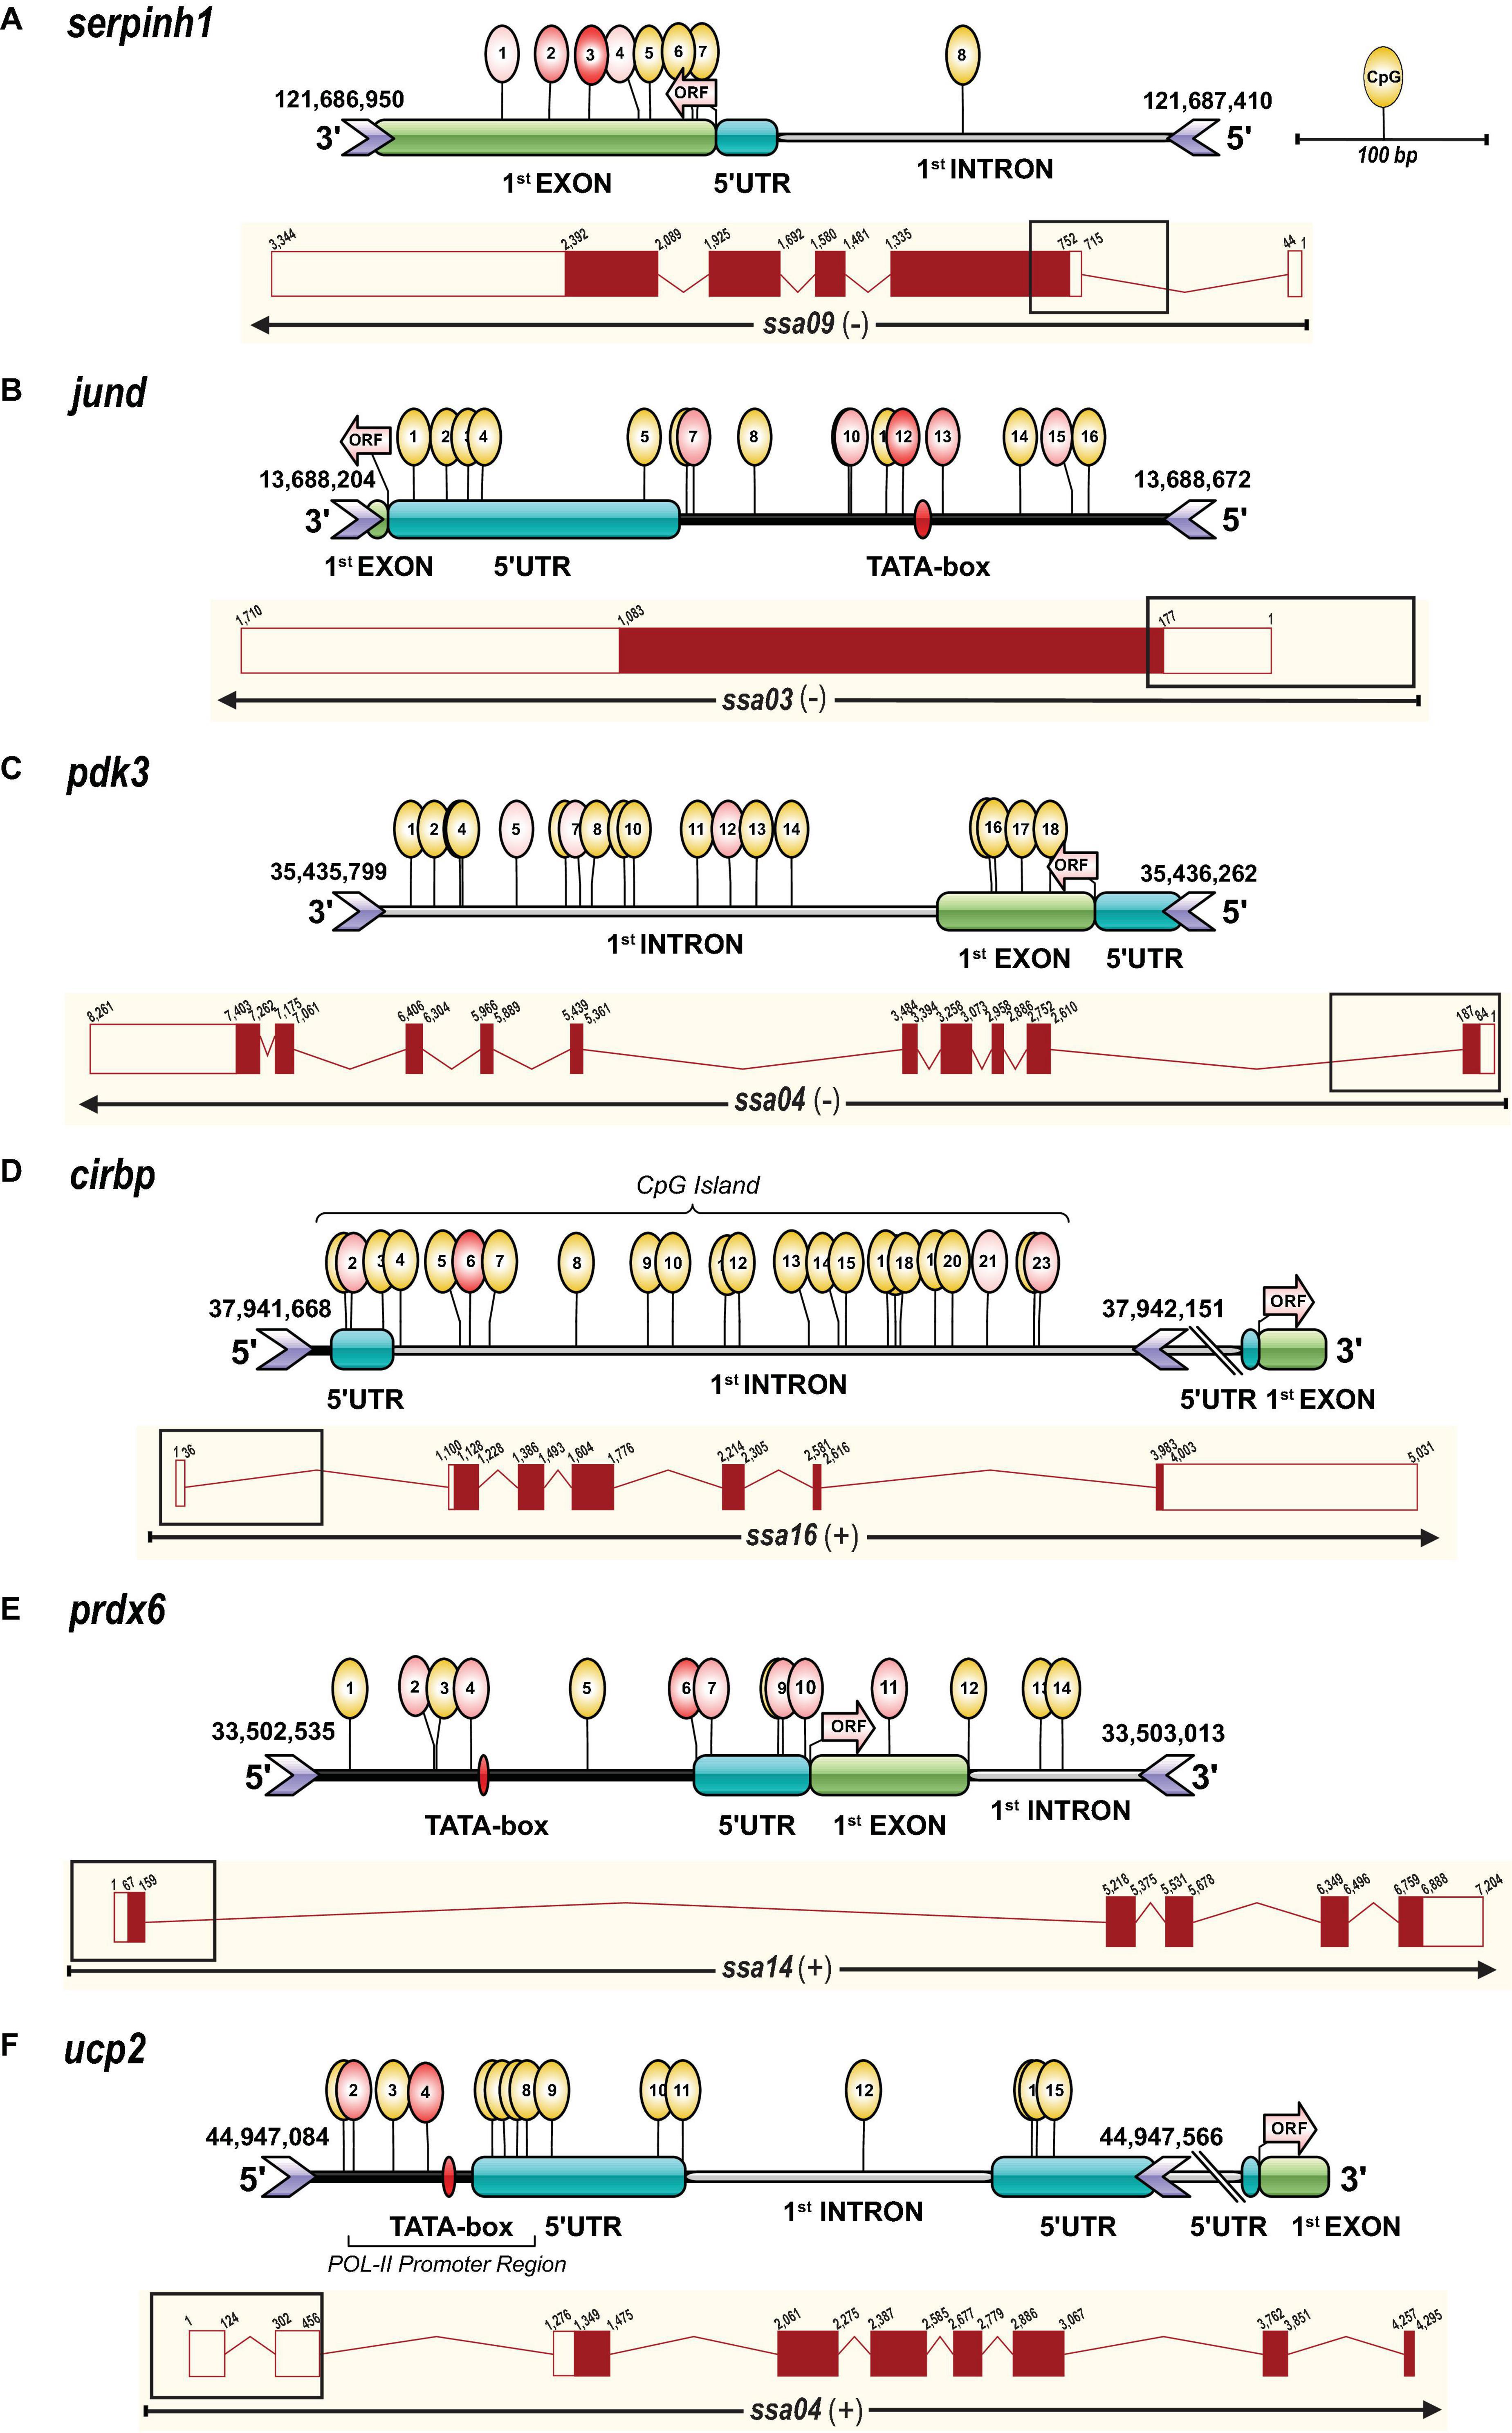
Figure 2. Gene transcript and amplicon structure (∼500 bp) including CpG methylation marks. Each panel contains an illustration representing the targeted amplicon sequence structure including CpG methylation marks assessed by Methylation Bisulfite Sequencing (MBS) and a complete transcript diagram for the genes (A) serpinh1, (B) jund, (C) pdk3, (D) cirbp, (E) prdx6, and (F) ucp2. The amplicon structure illustration was performed with IBS software (Liu et al., 2015) and shows the genomic regions (5′ upstream, 5′ UTR, first coding exon and first intron) and CpG methylation marks determined based on the Atlantic salmon (Salmo salar) genome assembly (ssa) version ICSASG_v2 available on NCBI and Ensembl. The identification of putative promoter regions (TATA-box, POL-II promoter sequence) and CpG islands was performed in silico with promoter prediction tools (www.softberry.com). The start codon and the beginning of the open reading frame (ORF) are indicated by an arrow in light red. The exact chromosome location of the sequenced region, including genomic start and end positions, is given in base pairs (bp) on top of the location of the forward and reverse primers (> <icons) for each gene (Table 1). The positions for the detected methylated cytosines in a CpG context are illustrated by yellow circular marks on top of the genomic elements. The treatment responsive CpG methylation sites are indicated in red and the intensity of this color corresponds to the significance of the response (Table 2). The transcript diagrams below the amplicon structure for each gene were obtained and modified from the Ensembl database (http://useast.ensembl.org/index.html), and show exons as red boxes and introns as lines. Filled boxes are protein-coding exon sequences and unfilled boxes are untranslated regions (UTRs), and for each of them, the cumulative size is indicated in bp. The black rectangular box on top of each transcript diagram represents the genomic area (∼500 bp) that was targeted for the MBS approach.
Results
CpG Methylation Dynamics
To examine the methylation profiles of salmon exposed to the WN or WH conditions at 20°C for 3 days or 4 weeks, in comparison to CT fish (Figure 1), we performed Principal Component Analysis (PCA) using the methylation values of CpGs that responded to the treatment with a change in their methylation levels (thereafter called ‘treatment responsive CpGs’) (Table 2). These PCA analyses were separated into up- (Figure 3) and down-regulated (Figure 4) genes so that the direction of the response was considered. Overall, we detected different CpG methylation profiles for WN and WH fish (Figures 3, 4 and Supplementary Table S1). However, these CpG methylation responses were gene-specific, context-specific and exposure time-dependent, suggesting temporal changes within different genomic elements (Figures 2–4 and Table 2).
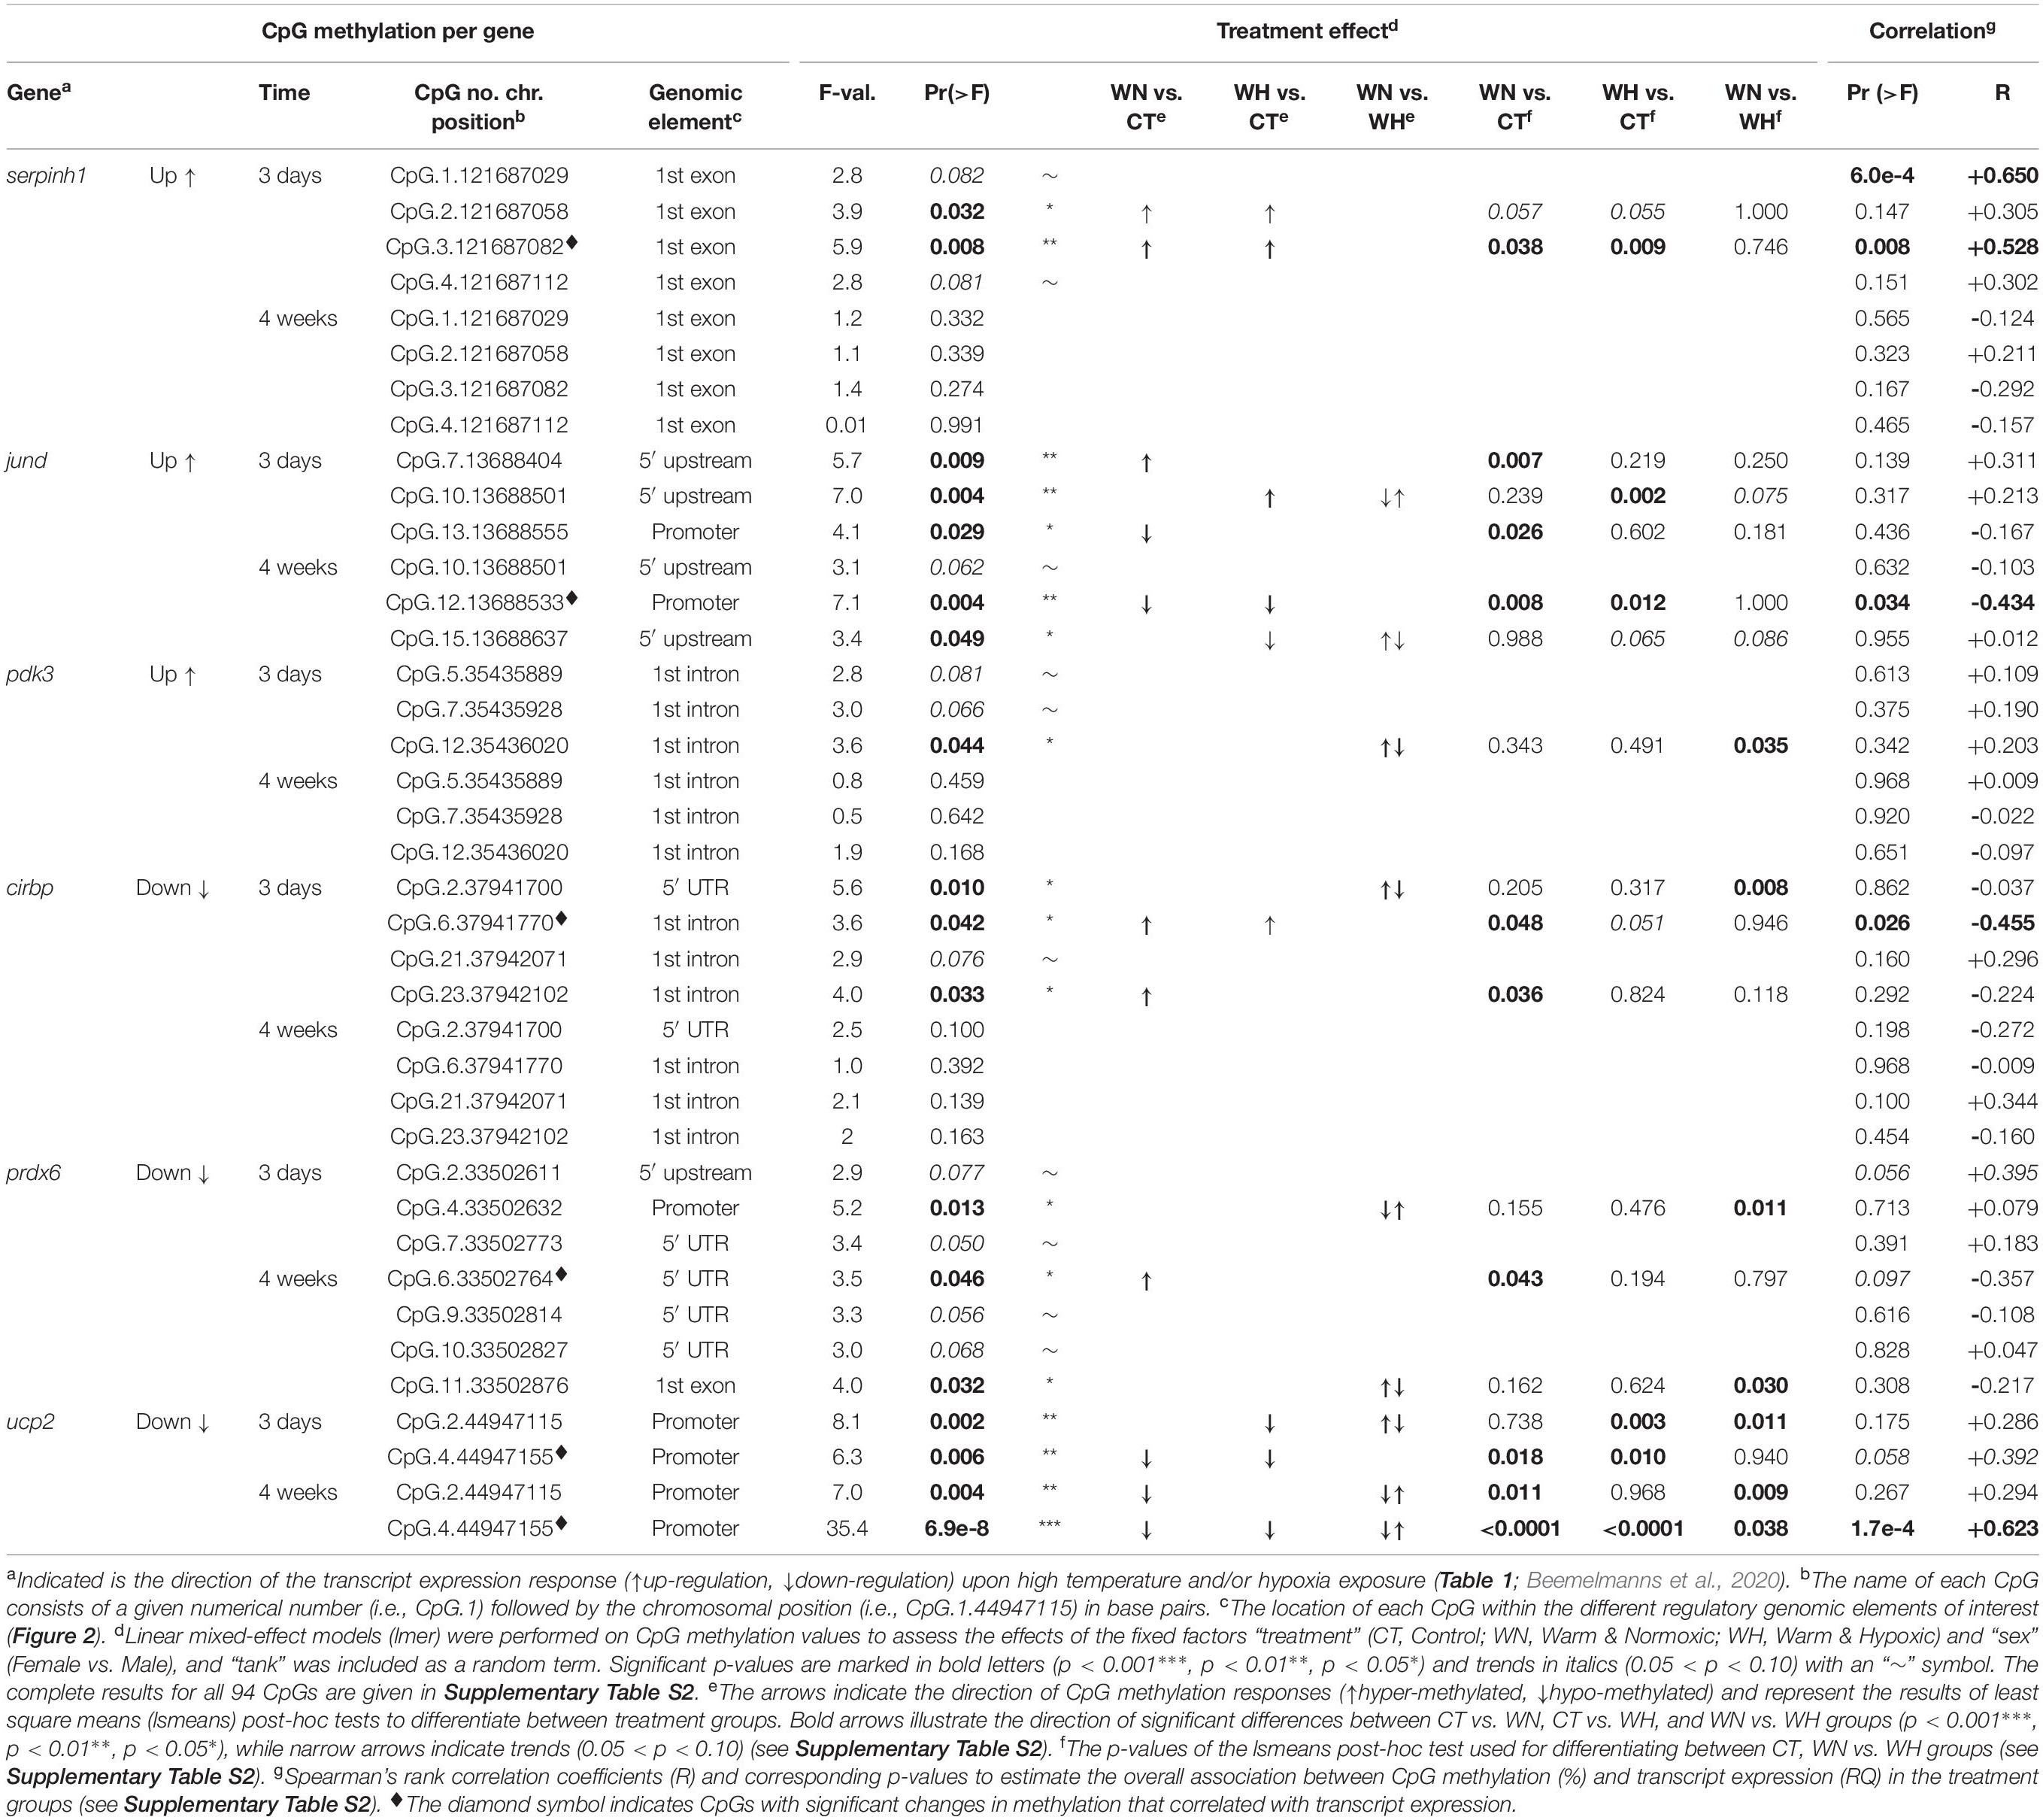
Table 2. CpG methylation and relationship to the transcript expression of six genes (cirbp, jund, pdk3, prdx6, serpinh1, and ucp2) assessed by linear mixed-effect models (lmer) and correlation analyses.
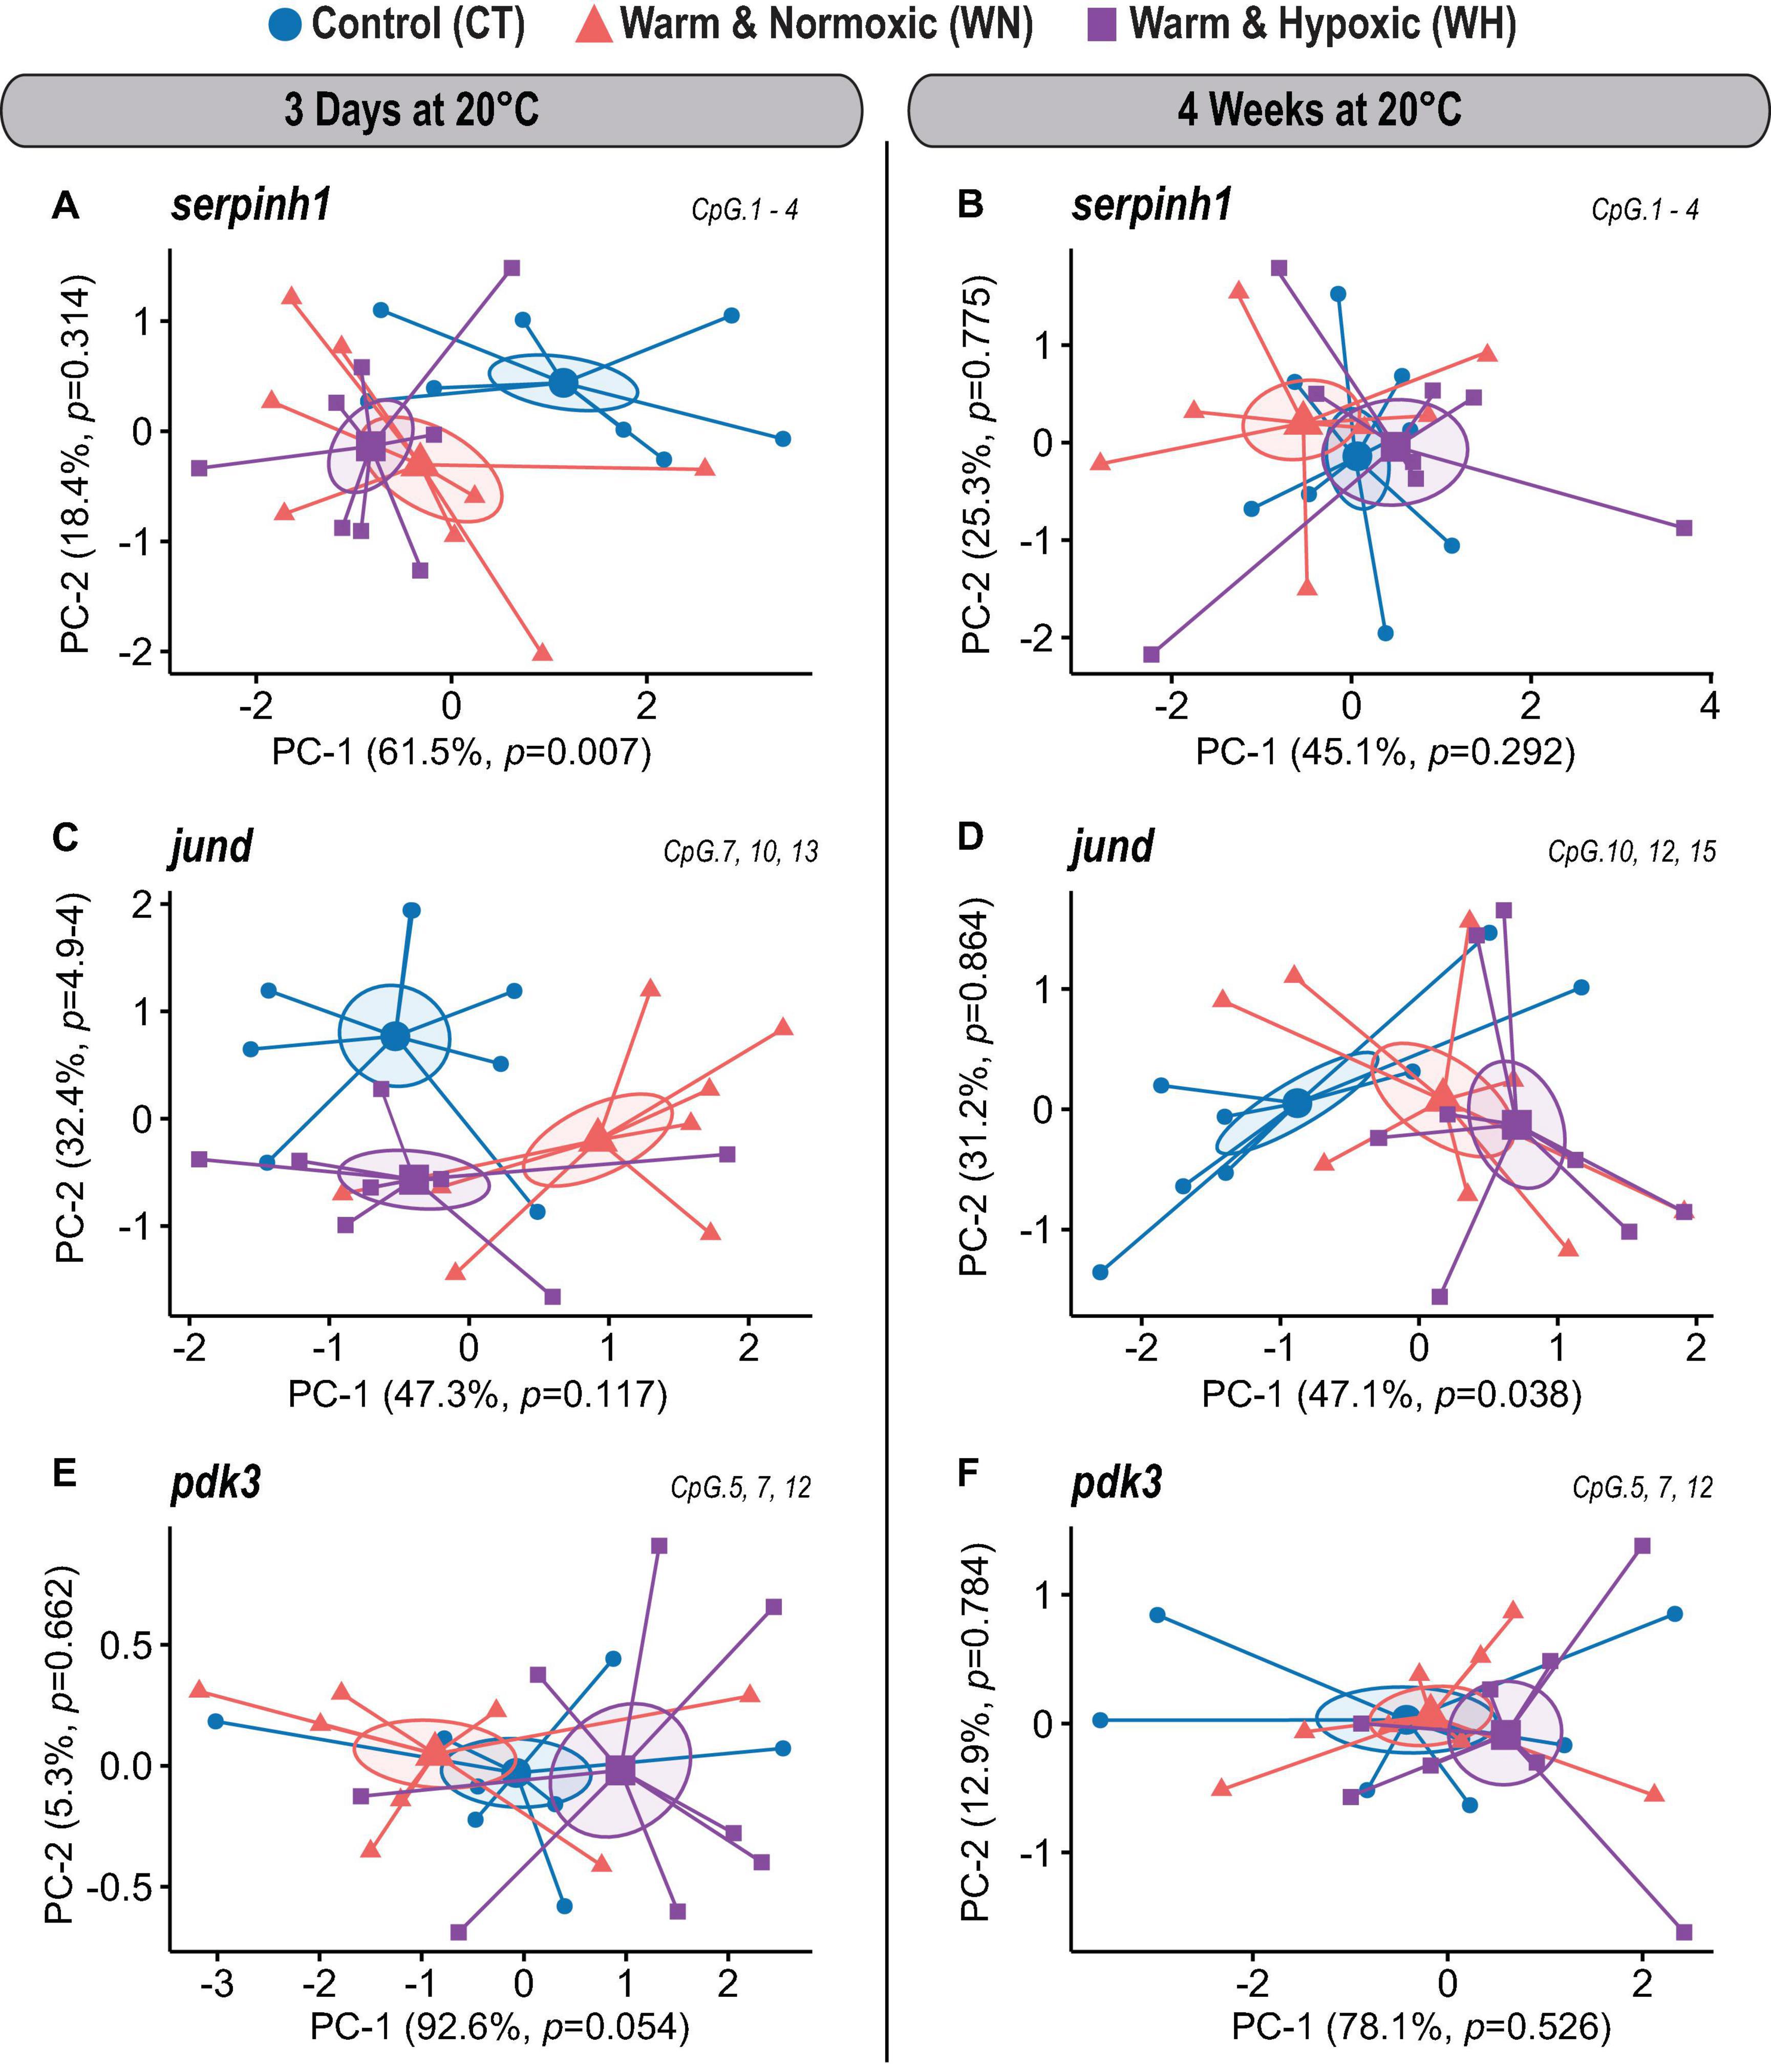
Figure 3. DNA methylation dynamics of responsive CpGs in three genes up-regulated in Atlantic salmon exposed to high temperature and hypoxia. Principal Component Analysis (PCA) on DNA methylation percentages (%) for treatment responsive CpGs from three up-regulated target genes (serpinh1, jund, and pdk3) measured in the liver of Atlantic salmon exposed to high temperature alone (WN: 20°C, ∼100% air saturation) or combined with hypoxia (WH: 20°C, ∼70% air sat.) for 3 days or 4 weeks, as compared to control conditions (CT: 12°C, ∼100% air sat.) (n = 8 per treatment/time point, N = 48 total). PCAs are illustrated separately for each up-regulated gene and exposure time point [serpinh1 (A,B); jund (C,D), pdk3 (E,F)]. PCAs show cluster distribution between the CT, WN, and WH groups with ellipses demonstrating the dispersion of variance and enlarged symbols indicating the center of the distribution for each group. The variance explained by PC-1 and PC-2 are specified in percentage values (%). The p-values represent the treatment effect obtained by applying linear mixed-effect models on the extracted scores of PC-1 and PC-2. Each PCA was based on a specific selection of treatment responsive CpGs as indicated in the upper right corner (see Table 2).
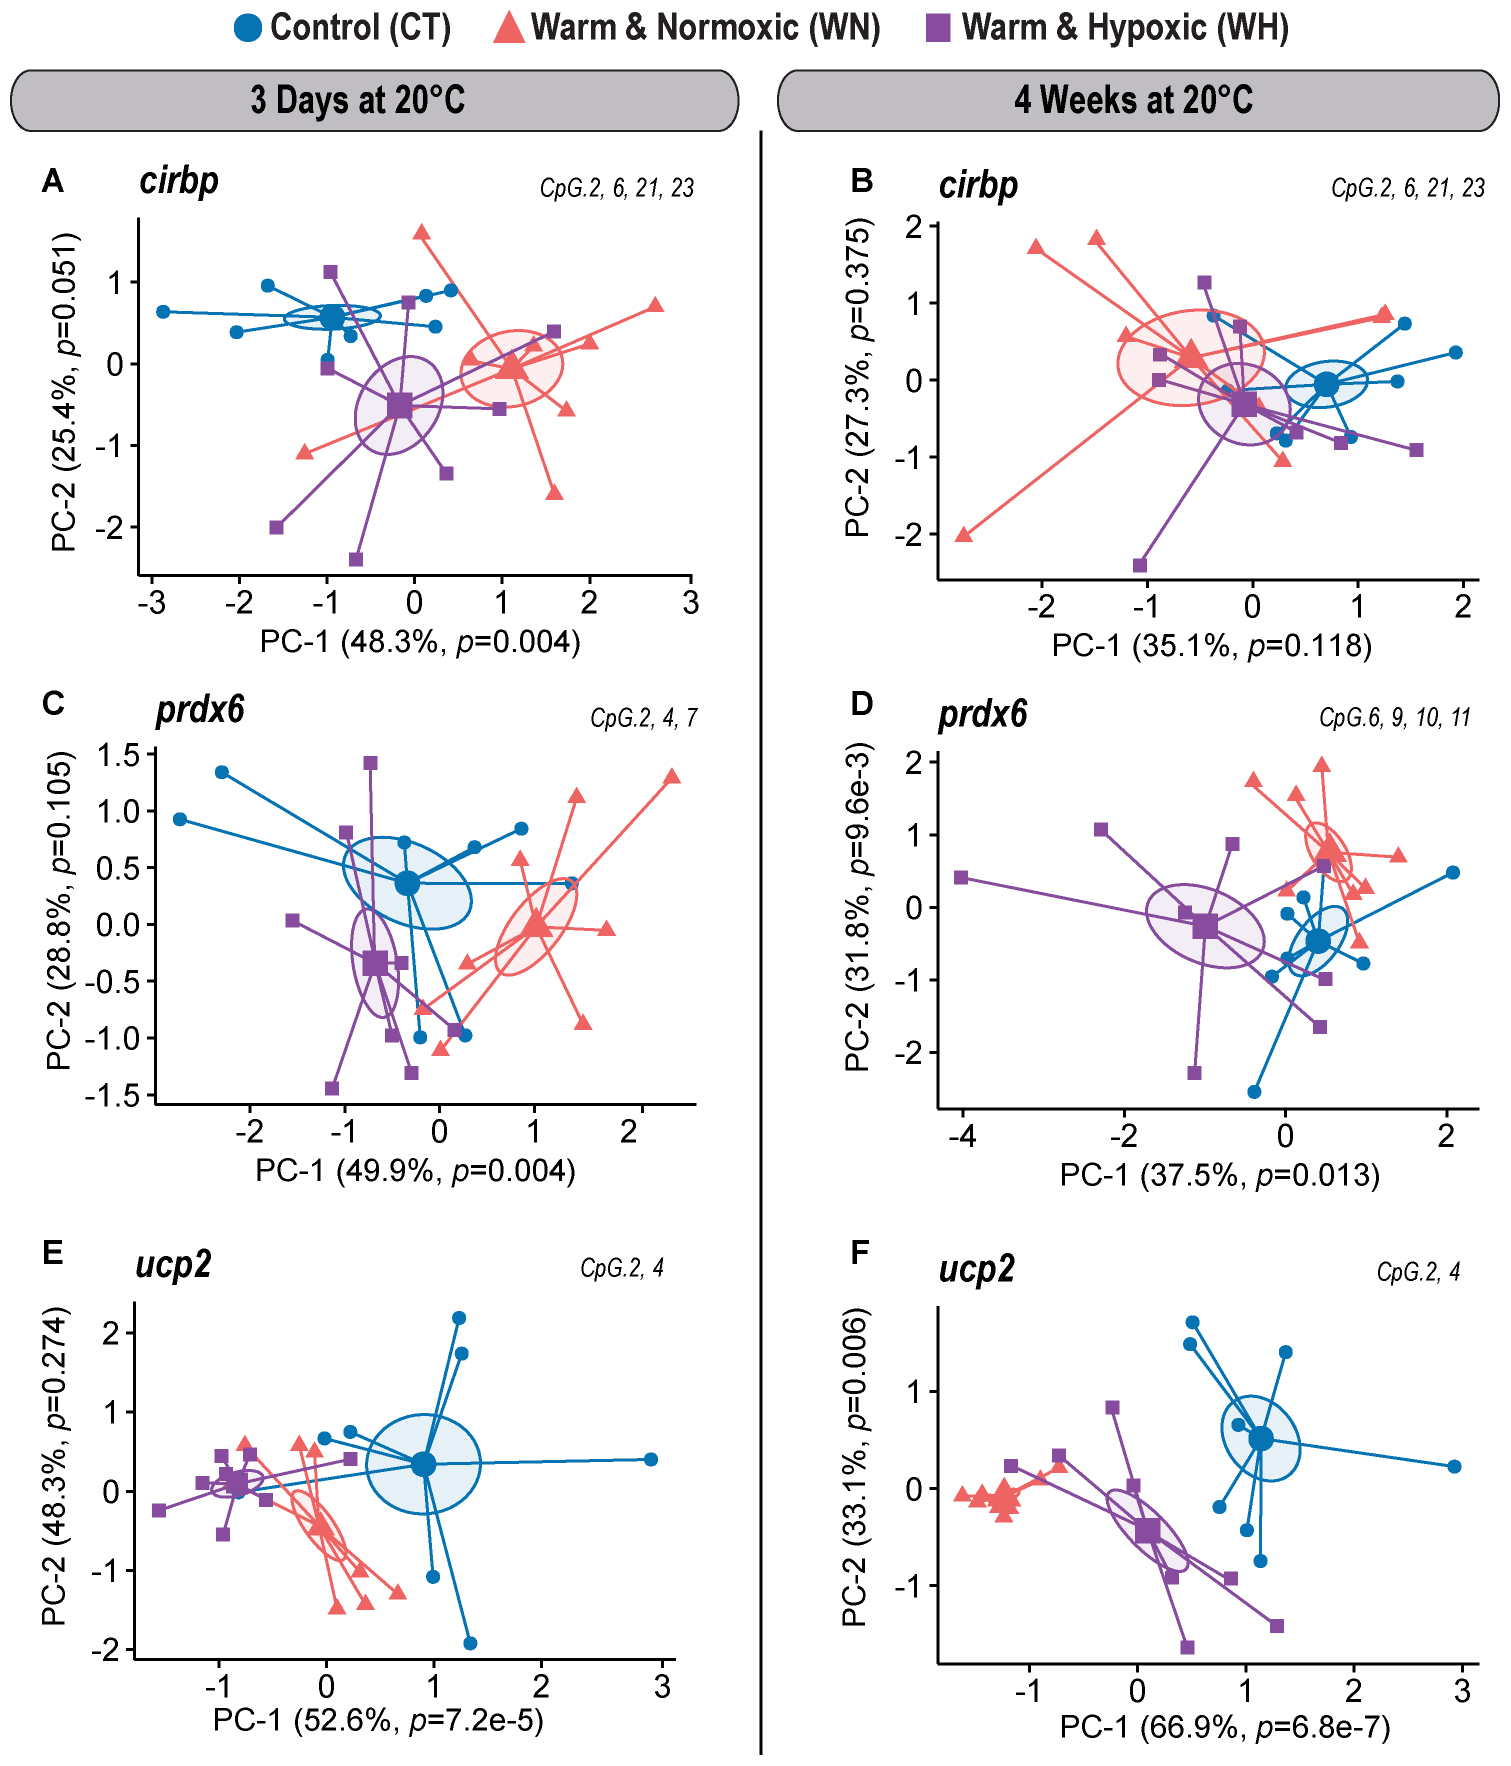
Figure 4. DNA methylation dynamics of responsive CpGs in three genes down-regulated in Atlantic salmon exposed to high temperature and hypoxia. Principal Component Analysis (PCA) on DNA methylation percentages (%) for treatment responsive CpGs from three down-regulated target genes (cirbp, prdx6, and ucp2) measured in the liver of Atlantic salmon exposed to high temperature alone (WN: 20°C, ∼100% air saturation) or combined with hypoxia (WH: 20°C, ∼70% air sat.) for 3 days or 4 weeks, as compared to control conditions (CT: 12°C, ∼100% air sat.) (n = 8 per treatment/time point, N = 48 total). PCAs are illustrated separately for each down-regulated gene and exposure time point [cirbp (A,B); prdx6 (C,D), ucp2 (E,F)]. PCAs show cluster distribution between the CT, WN, and WH groups with ellipses demonstrating the dispersion of variance and enlarged symbols indicating the center of the distribution for each group. The variances explained by PC-1 and PC-2 are specified in percentage values (%). The p-values represent the treatment effect obtained by applying linear mixed-effect models on the extracted scores of PC-1 and PC-2. Each PCA was based on a specific selection of treatment responsive CpGs as indicated in the upper right corner (see Table 2).
CpG Methylation Dynamics of Up-Regulated Genes
In the first coding exon of serpinh1, four CpGs (No. 1–4) were responsive in the WN and WH groups after 3 days of exposure to 20°C (Figure 2A and Table 2). Based on their collective methylation values, we found similar, but distinct, profiles between WN and WH fish as compared to CT fish, as shown by a clear cluster separation along with the first Principal Component (PC-1: F = 6.1, p = 0.007; CT vs. WN p = 0.046, CT vs. WH p = 0.007, WN vs. WH p = 0.624; 61.5% variation; Figure 3A and Supplementary Table S1). However, the effects for these same CpGs diminished after exposure to 20°C for 4 weeks, as evidenced by the overlapping ellipses for all three treatment groups in the PCA (PC-1: F = 1.3, p = 0.292; Figure 3B and Supplementary Table S1).
Different CpG methylation profiles were also found based on three responsive CpGs (No. 7, 10, and 13) located within the 5′ upstream region close to the putative promoter site (TATA-box) of the gene jund (Figure 2B and Table 2) in fish exposed to WN or WH conditions at 20°C for 3 days as compared to the CT group (PC-2: F = 10.7, p = 4.9e-4; CT vs. WN p = 0.008, CT vs. WH p < 0.0001, WN vs. WH p = 0.384; 32.4% variation; Figure 3C and Supplementary Table S1). However, after 4 weeks of exposure to 20°C, the methylation of a different set of three responsive CpGs (No. 10, 12, and 15) located in the same 5′ upstream region (Figure 2B and Table 2) only resulted in a significant separation of the WH group from the CT group (PC-1: F = 3.7, p = 0.038; CT vs. WH p = 0.033; 47.1% variance; Figure 3D and Supplementary Table S1).
For pdk3, we only found weak effects for the combined responses of three CpGs (No. 5, 7, and 12) situated in the first intron (Figure 2C and Table 2) upon short-term exposure to 20°C (PC-1: F = 3.3, p = 0.054; Figure 3E and Supplementary Table S1). However, we did not observe significantly different methylation profiles for this gene between the two treatment groups (WN, WH) and the CT group at either of the exposure time points (Figures 3E,F and Supplementary Table S1).
CpG Methylation Dynamics of Down-Regulated Genes
For the gene cirbp, we identified one responsive CpG in the first part of the 5′ UTR (No. 2) and three CpGs in the intron (1,074 bp) that interrupts the 5′ UTR (No. 6, 21, and 23) upon short-term WN and WH exposure at 20°C (Figure 2D and Table 2). Based on their collective responses, the WN fish displayed the strongest difference in CpG methylation as compared to the CT group along PC-1 (F = 6.9, p = 0.004; CT vs. WN p = 0.005, WN vs. WH p = 0.031; 48.3% variance; Figure 4A and Supplementary Table S1). In contrast, the WH group showed a trend for a greater cluster separation from the CT group with regards to PC-2 (F = 3.4, p = 0.051; CT vs. WH p = 0.041; 25.4% variance; Figure 4A and Supplementary Table S1). When comparing the same set of CpGs after 4 weeks of exposure to 20°C, the CpG methylation profiles were similar between all three groups (PC-1: F = 2.3, p = 0.118; Figure 4B and Supplementary Table S1).
The gene prdx6 had two responsive CpGs located in the 5′ upstream region in close proximity to the putative TATA-box site (Nos. 2 and 4) and one CpG within the 5′ UTR (No. 7) (Figure 2E and Table 2) that differentiated the WN group from the CT group, but also from the WH group, after short-term exposure to 20°C (PC-1: F = 6.5, p = 0.004; CT vs. WN p = 0.041, WN vs. WH p = 0.004; 49.9% variance; Figure 4C and Supplementary Table S1). In contrast, after long-term exposure to 20°C, we identified a different set of four responsive CpGs within the 5′ UTR (No. 6, 9, and 10) and the first coding exon (No. 11) (Figure 2E and Table 2). Based on these CpGs the WH group clustered differently from the CT group, but also from the WN group, along PC-1 (F = 5.3, p = 0.013; CT vs. WH p = 0.041, WN vs. WH p = 0.017; 37.5% variance; Figure 4D and Supplementary Table S1); while the WN group clustered apart from the CT group along PC-2 (F = 5.7, p = 9.6e-3; CT vs. WN p = 0.008; 31.8% variance; Figure 4D and Supplementary Table S1).
Finally, ucp2 had two highly responsive CpGs (Nos. 2 and 4) located in the 5′ upstream region in close proximity to the putative TATA-box and POL-II motif (Figure 2F and Table 2) that differentiated the WN and WH groups from the CT group after short- and long-term exposure to 20°C (3-days/PC-1: F = 14.6, p = 7.2e-5; 52.6% variation; 4-weeks/PC-1: F = 27.2, p = 6.8e-7; 66.9% variation; Figures 4E,F and Supplementary Table S1). Interestingly, WH fish displayed a more pronounced separation from CT fish after 3 days of exposure to 20°C (3-days/PC-1: CT vs. WN p = 0.011, CT vs. WH p < 0.0001, WN vs. WH p = 0.061; Figure 4E and Supplementary Table S1), whereas the methylation levels were more strongly affected in WN fish after 4 weeks at this temperature (4-weeks/PC-1: CT vs. WN p < 0.0001, CT vs. WH p = 0.017, WN vs. WH p = 0.001; Figure 4F and Supplementary Table S1).
Correlation Analyses Between Global CpG Methylation and Transcript Expression Changes
The collective responses of all significantly affected (p < 0.05) CpGs (Table 2) and the overall relative transcript expression levels (RQ) were investigated in a global PCA approach for short-term (3 days) (Figures 5A,B) and long-term (4 weeks) WN or WH exposure to 20°C (Figures 5D,E and Supplementary Table S1). The association between collective CpG methylation and transcript expression responses was estimated by correlating the extracted scores from the PC-1 of the global CpG methylation and the transcript expression PCAs using Pearson correlation coefficients (R) (Figures 5C,F).
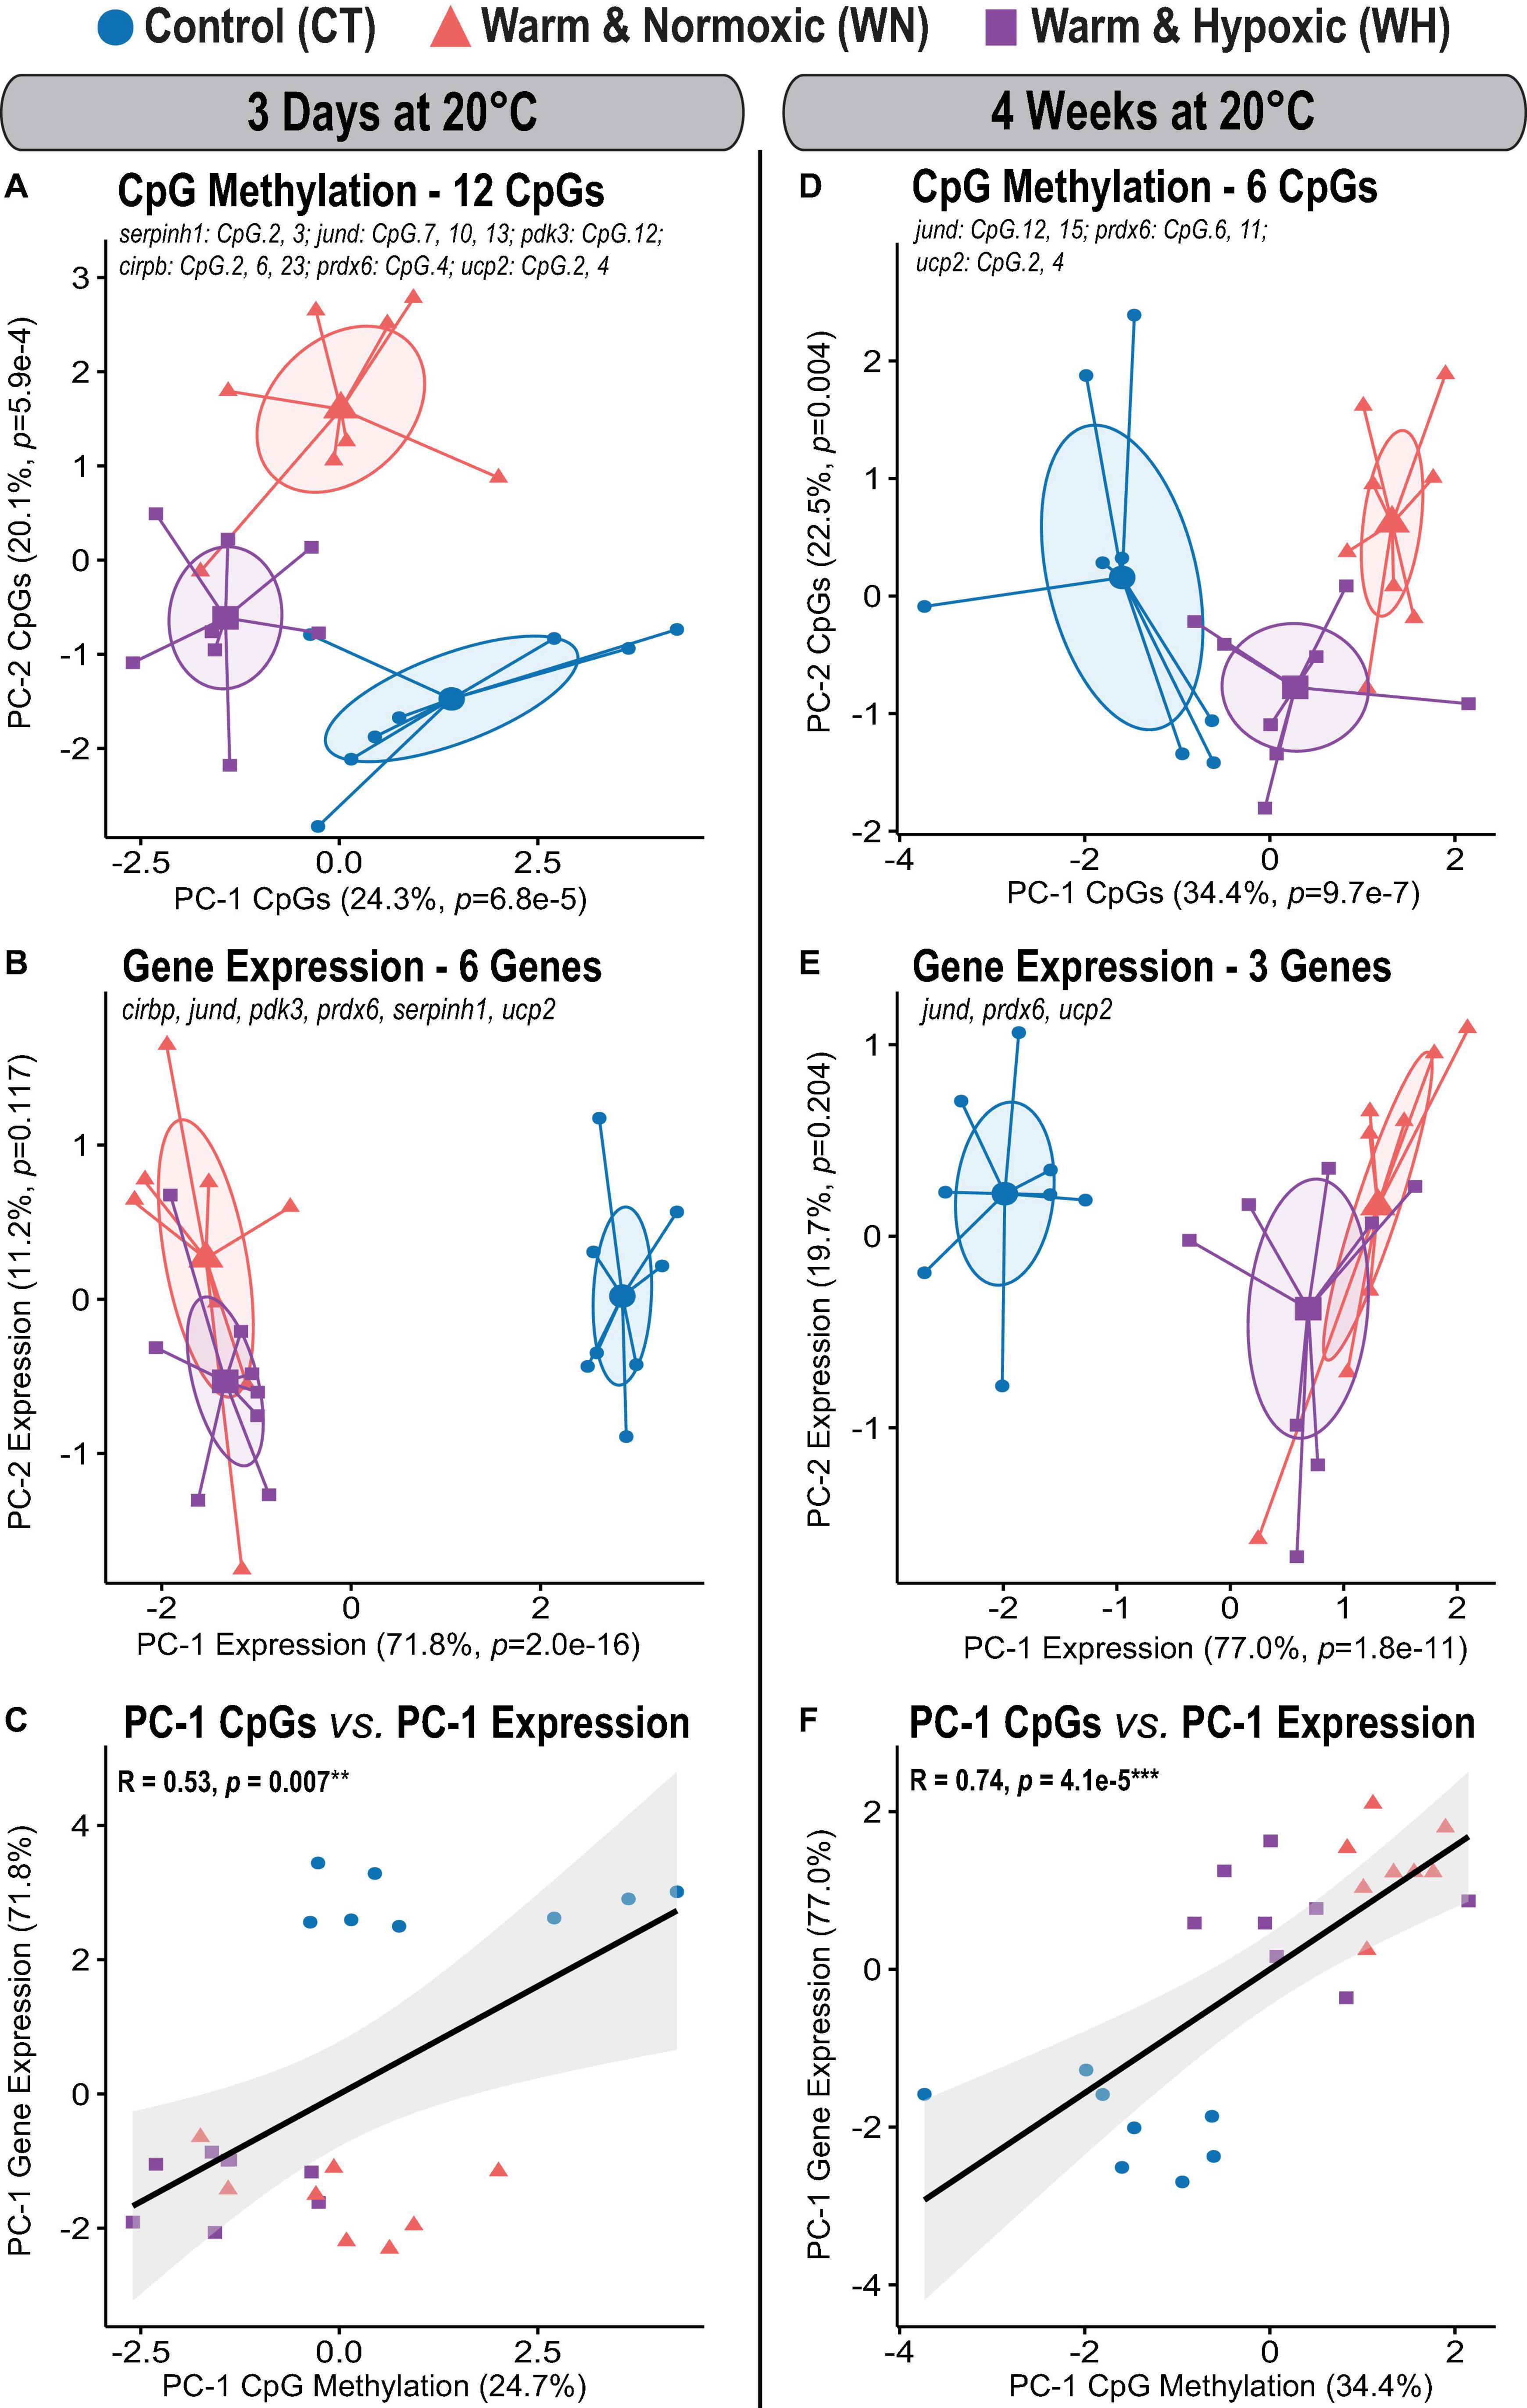
Figure 5. Global DNA methylation changes in Atlantic salmon exposed to high temperature and hypoxia, and their relationship to transcript expression. Principal Component Analysis (PCA) for all significantly affected CpGs and corresponding transcript expression in the liver of Atlantic salmon exposed to high temperature alone (WN: 20°C, ∼100% air saturation) or combined with hypoxia (WH: 20°C, ∼70% air sat.) for 3 days or 4 weeks as compared to control conditions (CT: 12°C, ∼100% air sat.) (n = 8 per treatment/time point, N = 48 total). (A) PCA based on 12 significantly affected CpGs after 3 days at 20°C and (B) the corresponding transcript expression PCA of six genes (serpinh1, jund, pdk3 cirbp, prdx6, and ucp2). PCAs show cluster distribution between the CT, WN, and WH groups, with ellipses demonstrating the dispersion of variance and enlarged symbols indicating the center of the distribution for each group. The variance explained by PC-1 and PC-2 are specified as percentage values (%). The p-values represent the treatment effect on CpG methylation obtained by applying linear mixed-effect models to the extracted scores of PC-1 and PC-2. (C) Correlation between the extracted PC-1 scores of the transcript expression PCA and the PC-1 scores of the CpG methylation PCAs. (D) PCA based on six significantly affected CpGs after 4 weeks at 20°C and (E) the corresponding transcript expression PCA for three genes (jund, prdx6, and ucp2). (F) Correlation between the extracted PC-1 scores of the transcript expression PCA and the PC-1 scores of the CpG methylation PCAs. In (C,F), the strength of the correlation is indicated by the Pearson correlation coefficient (R) and the corresponding level of significance (p < 0.001***, p < 0.01**). The transcript expression data for the six genes (serpinh1, jund, pdk3, cirbp, prdx6, and ucp2) from the short-term exposure time point (3 days at 20°C) were previously published as part of an initial transcriptome study by Beemelmanns et al. (2020), and included herein to specifically investigate the correlation between transcript expression and DNA methylation responses.
Global CpG Methylation and Transcript Expression Changes After 3 Days at 20°C
The effects of short-term exposure to 20°C in WN and WH fish were evident in the collective CpG methylation and transcript expression profiles of the six genes (Figures 5A,B). Salmon of all three treatment groups could be clearly distinguished from each other given their distinct methylation profiles when all 12 significantly affected CpGs (Table 2) were considered (PC-1: F = 14.7, p = 6.8e-5; CT vs. WN p = 0.020, CT vs. WH p < 0.0001, WN vs. WH p = 0.026; 24.3% variation; PC-2: F = 29.8, p = 5.9e-4; CT vs. WN p = 0.001; WN vs. WH p = 0.004; 20.1% variation; Figure 5A and Supplementary Table S1). The transcript expression of the corresponding six target genes in both WN and WH fish was highly dysregulated, but both treatment groups showed a similar separation in comparison to the CT fish (PC-1: F = 248.0, p = 2.0e-16; CT vs. WN p < 0.0001, CT vs. WH p < 0.0001, WN vs. WH p = 0.478; 71.8% variation; Figure 5B and Supplementary Table S1). Nevertheless, the significant positive correlation between the PC-1 scores of the global CpG methylation and the transcript expression PCAs (Spearman R = 0.53, p = 0.007; Figure 5C) indicates a similar cluster distribution and an association between these responses.
Global Methylation and Transcript Expression Changes After 4 Weeks at 20°C
After WN and WH exposure to 20°C for 4 weeks, the effects on CpG methylation were less pronounced, with only six significantly affected CpGs amongst three genes (jund, prdx6, and ucp2) (Table 2). However, we still observed a significant segregation between all three treatment groups in the PCA based on their collective CpG responses (PC-1: F = 26.1, p = 9.7e-7; CT vs. WN p < 0.0001, CT vs. WH p < 0.0001, WN vs. WH p = 0.026; 34.4% variation; Figure 5D and Supplementary Table S1). Also, the transcript expression of these three genes was similarly dysregulated in the WN and WH fish after 4 weeks at 20°C as compared to the CT fish at 12°C (PC-1: F = 82.5, p = 1.8e-11; CT vs. WN p < 0.0001, CT vs. WH p < 0.0001, WN vs. WH p = 0.067; 77.0% variation; Figure 5E and Supplementary Table S1). When overlaying the PCA cluster of the global CpG methylation and transcript expression responses after 4 weeks at 20°C, a similar distribution along PC-1 was evident, and this was reflected in a highly significant positive correlation between their PC-1 scores (Spearman R = 0.74, p = 4.1e-5, Figure 5F).
Correlations Between CpG Methylation and Transcript Expression Responses
The association between the methylation of significantly affected CpGs and transcript expression was examined in component maps, which segregated all variables according to their specific responses in a 2-dimensional space (i.e., response variables that cluster on opposing directions alongside Component 1 “CP-1” or Component 2 “CP-2” have an inverse correlation). First, we described the general relationship between CpG methylation and transcript expression reflected in the component maps (Figure 6). Second, we analyzed more specifically the methylation level of individual CpGs that: (i) were identified within the component maps as high contributors; (ii) were significantly affected by the treatments; and; (iii) showed strong correlations with transcript expression (Figure 7, Table 2, and Supplementary Table S2).
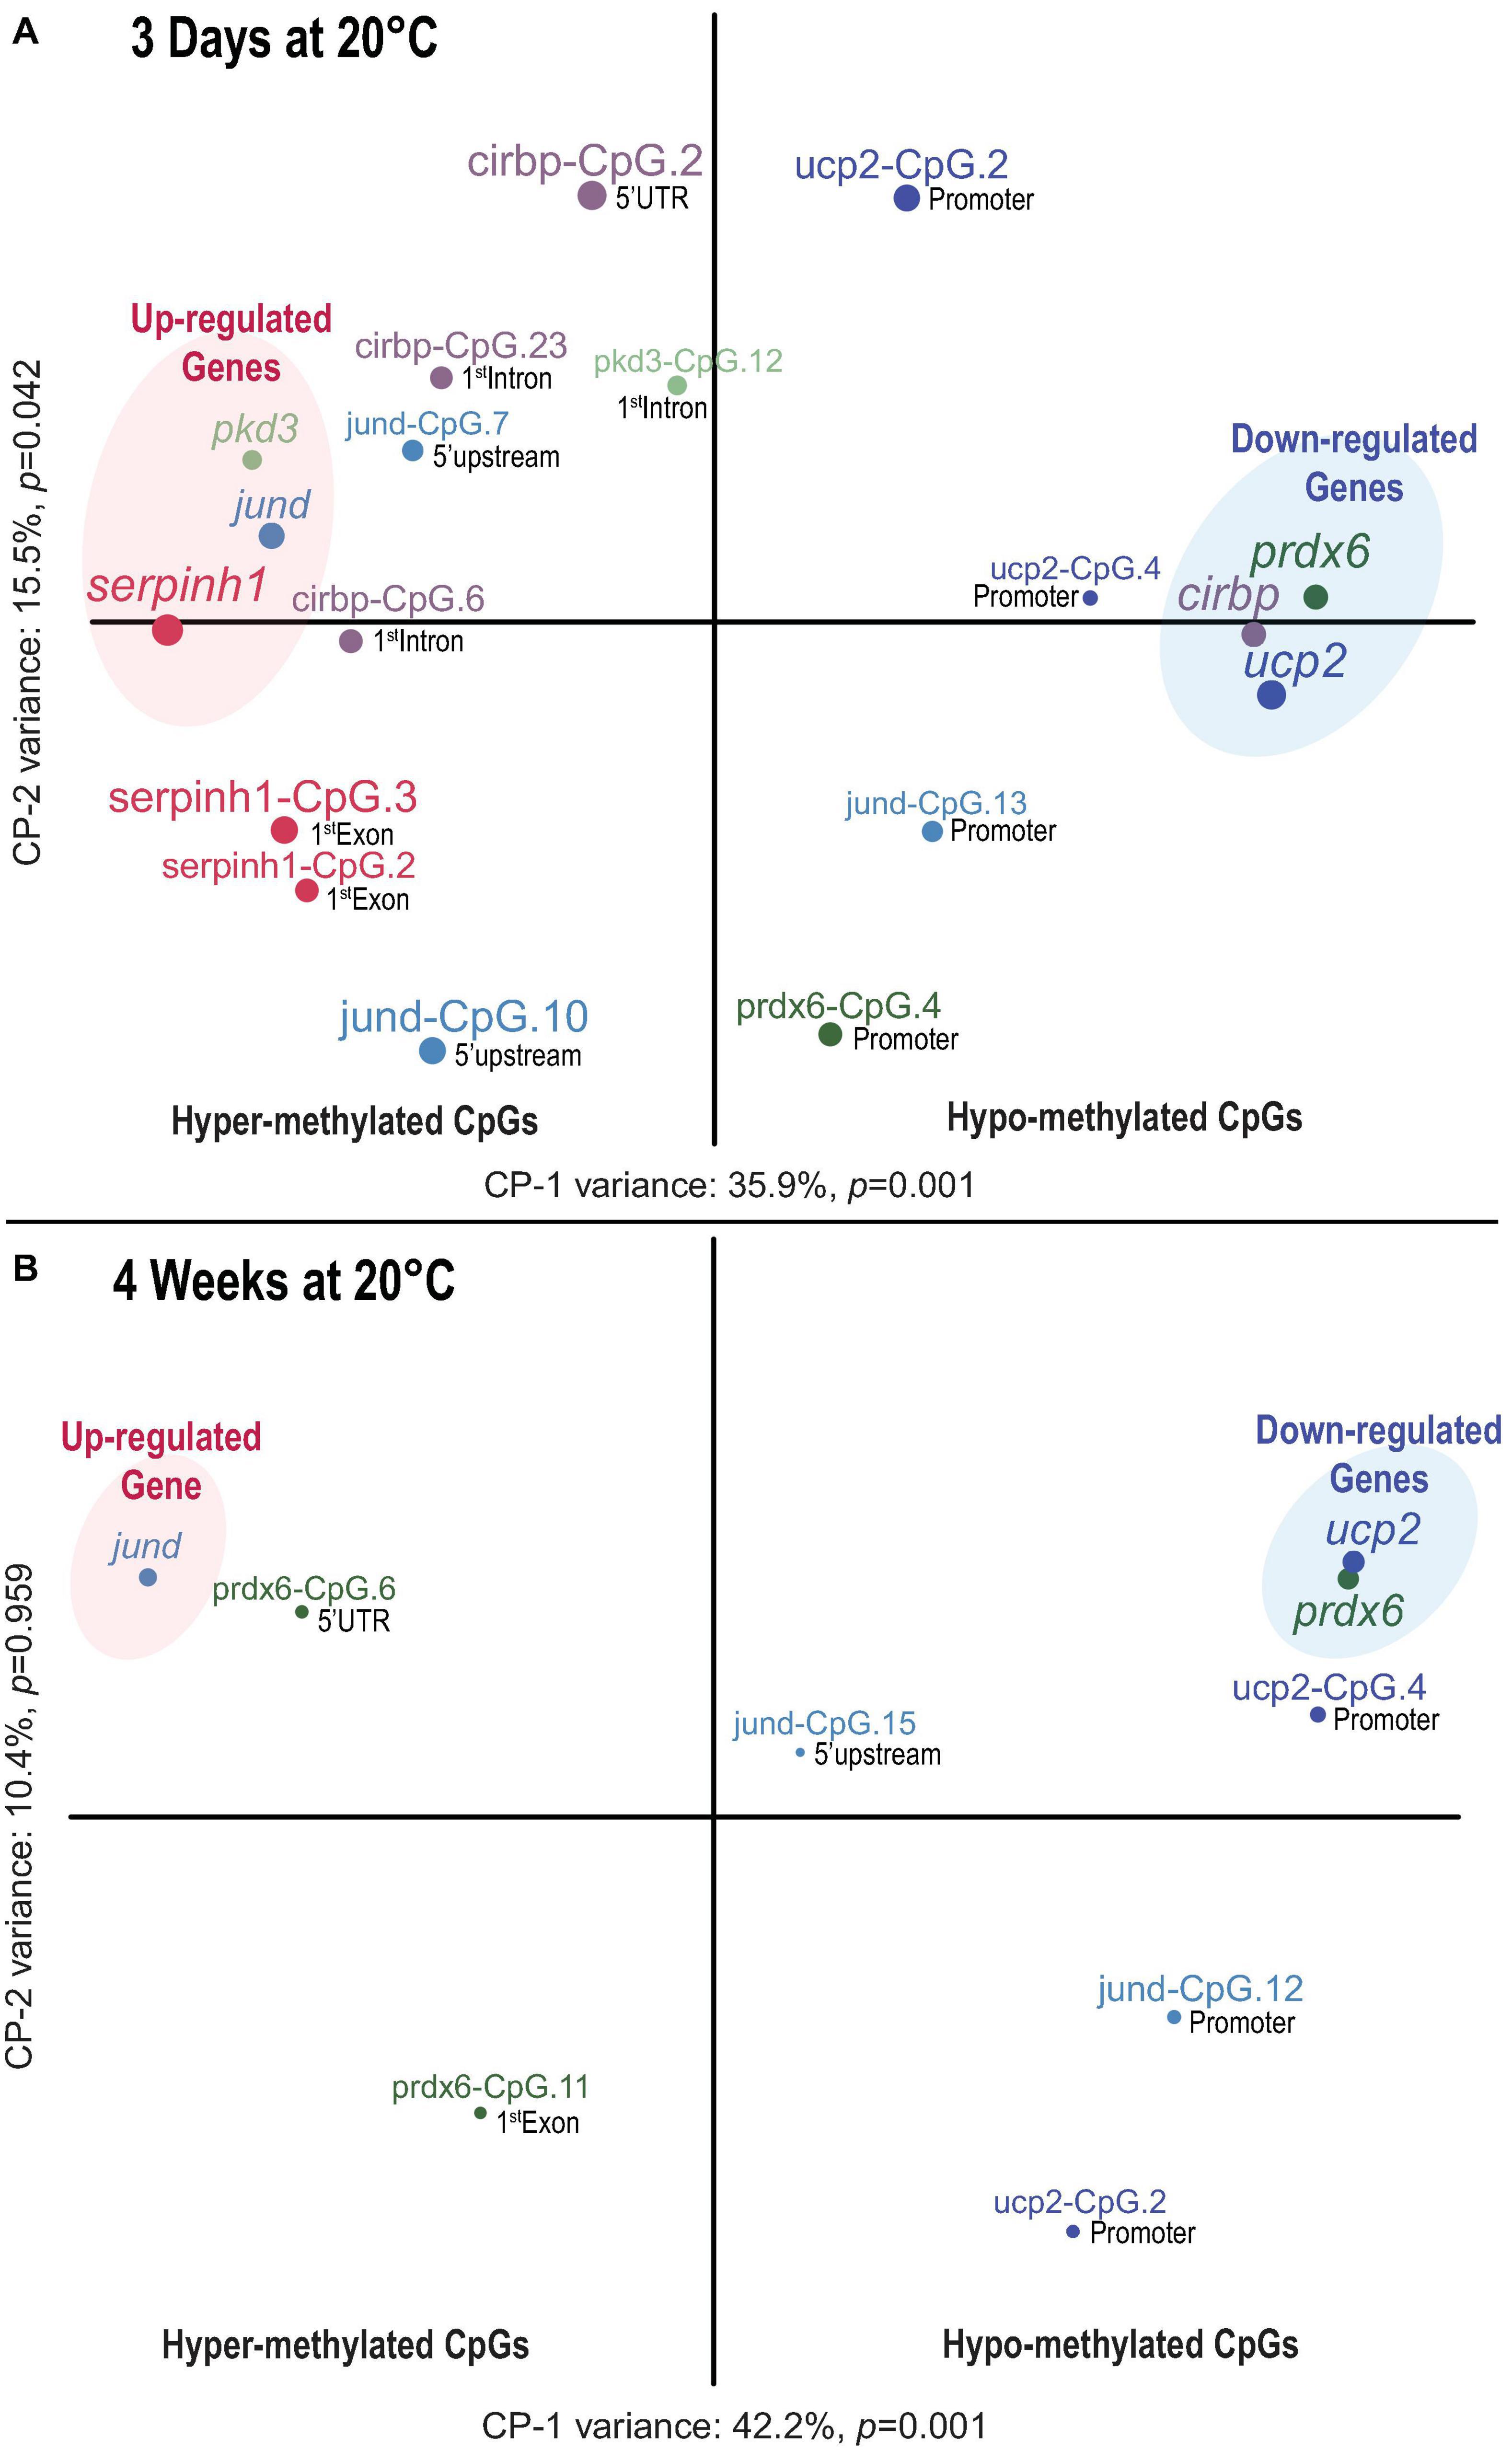
Figure 6. Time dependent association between CpG methylation and transcript expression in Atlantic salmon exposed to high temperature and hypoxia. (A) Component map based on 12 significantly affected CpGs and the transcript expression of six genes (serpinh1, jund, pdk3 cirbp, prdx6, and ucp2) in the liver of Atlantic salmon challenged for 3 days to 20°C with and without hypoxia (∼70% air saturation). (B) Component map based on six significantly affected CpGs and the corresponding transcript expression for three genes (jund, prdx6, and ucp2) in the liver of Atlantic salmon challenged for 4 weeks to 20°C with and without hypoxia (∼70% air saturation) (n = 8 per treatment/time point, N = 48 total). Each component map illustrates the relationship between CpG methylation and the transcript expression response. The results of the battery of inference permutation test indicate which components are significantly affected (p < 0.05). The circle and label size correspond with the magnitude of the component scores obtained for each response variable, and the label color associates CpGs with corresponding genes. The terms hyper- and hypo-methylation relate to the direction of the respective CpG methylation response (see Table 2). The genomic location (promoter, 5′ upstream, 5′ UTR, first coding exon and first intron) of each CpG is indicated next to the circles (see Figure 2). The CpGs indicated by “promoter” were located close to (i.e., within < 25 bp) or within the putative promoter motif (TATA-box, POL-II promoter sequence) (see Figure 2). The transcript expression data for the six genes (serpinh1, jund, pdk3, cirbp, prdx6, and ucp2) from the short-term exposure time point (3 days at 20°C) were previously published as part of an initial transcriptome study by Beemelmanns et al. (2020), and were included herein to specifically investigate the correlation between transcript expression and DNA methylation responses.
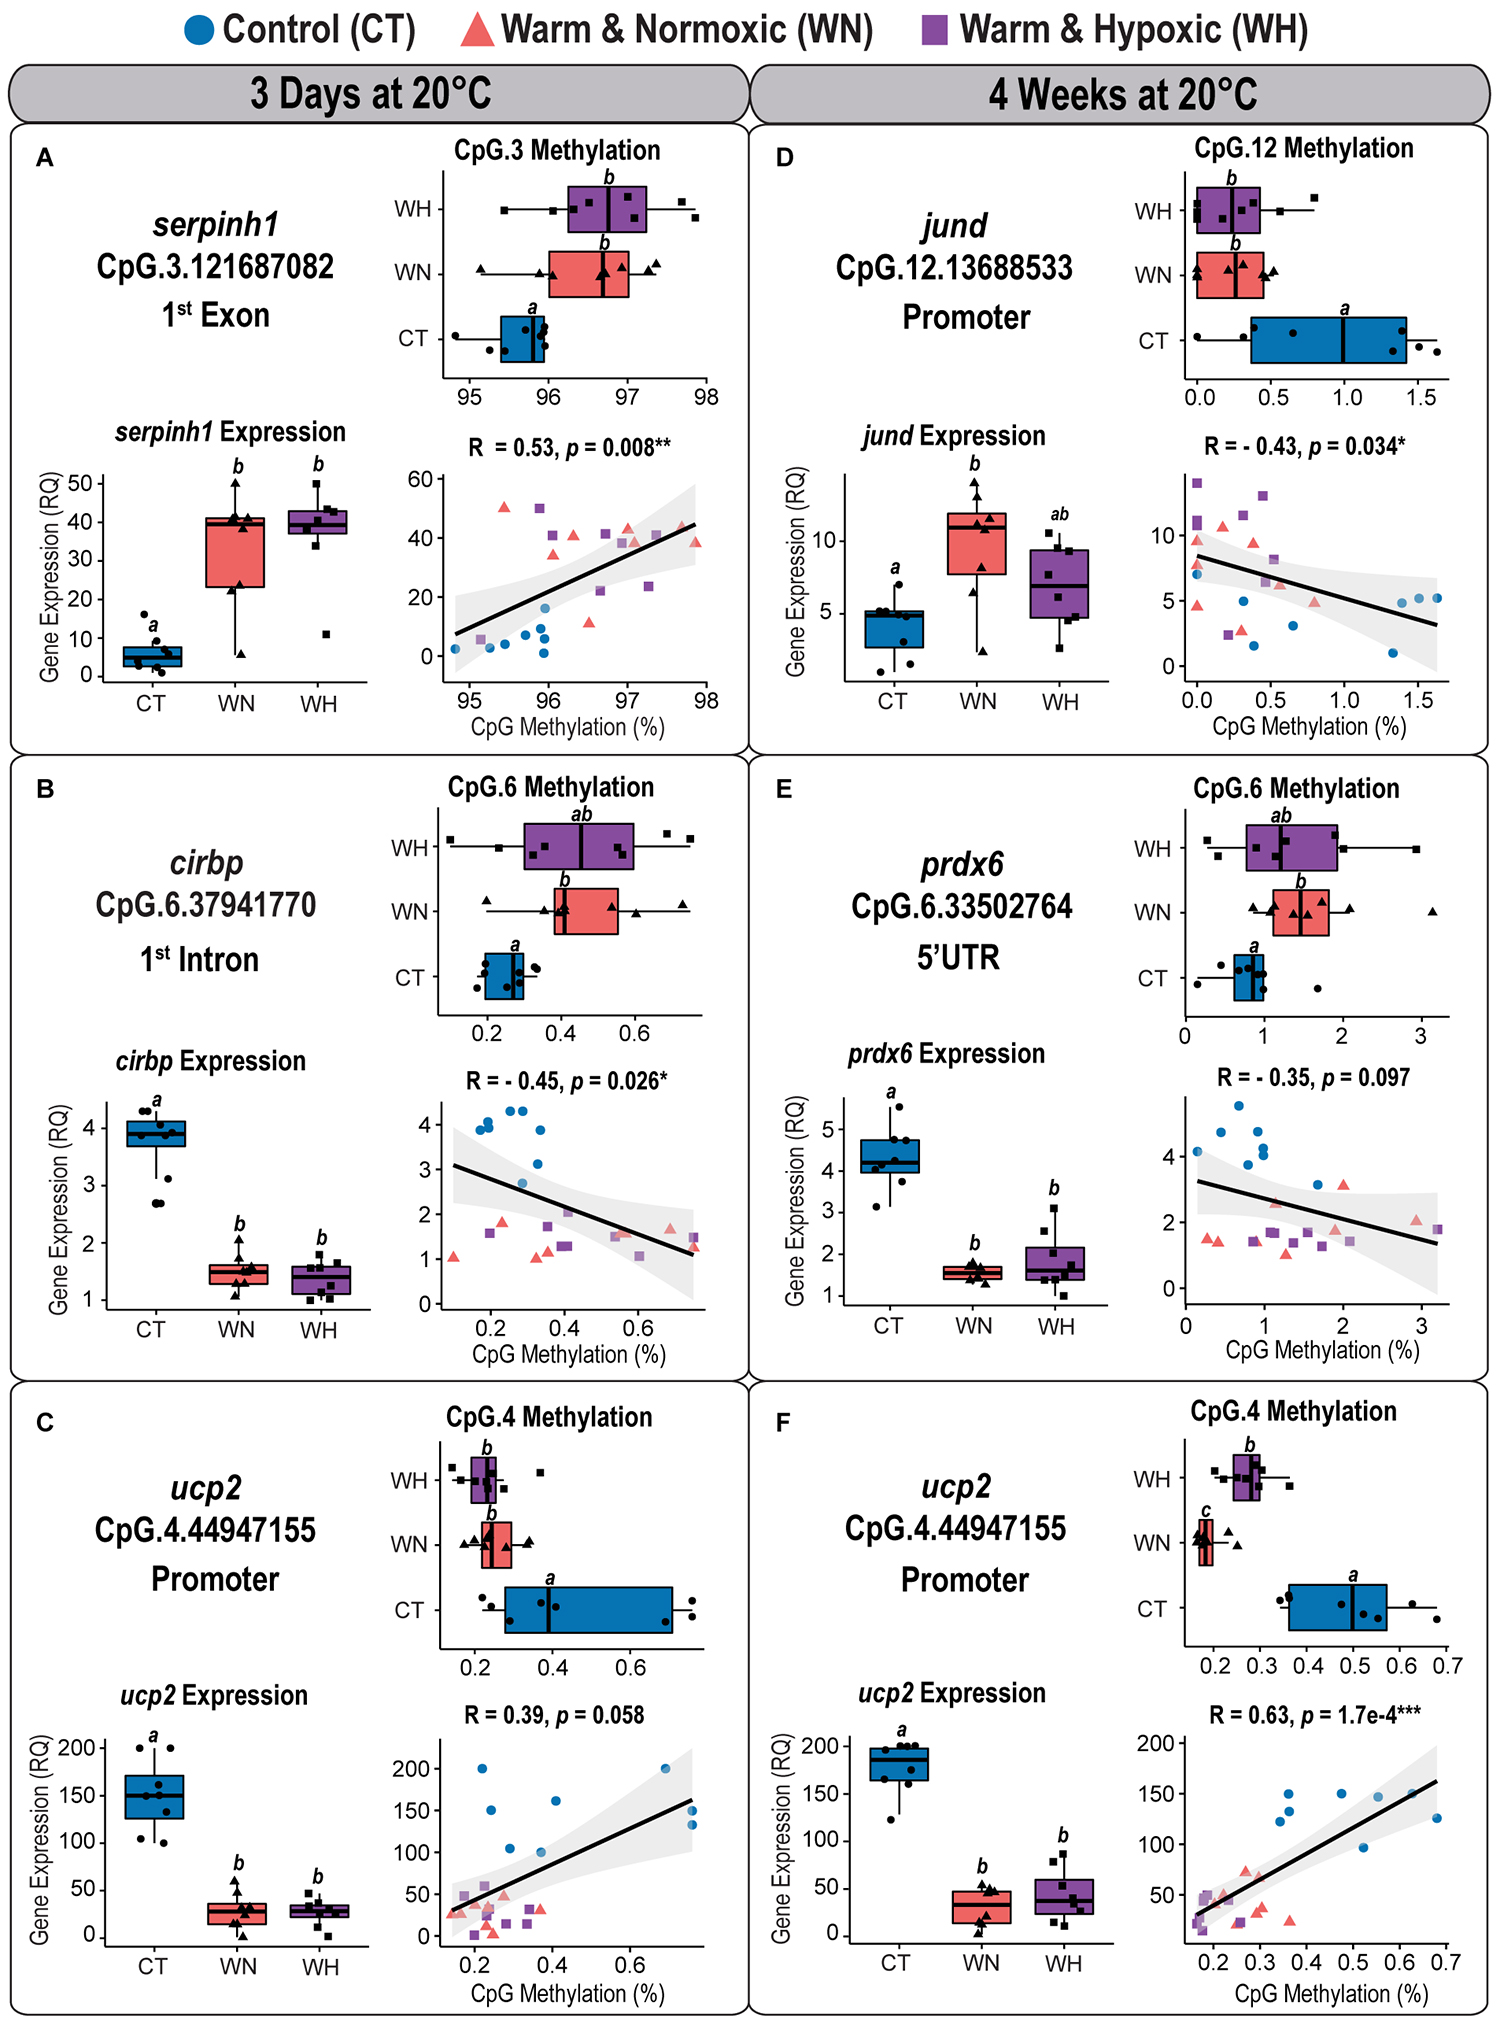
Figure 7. Correlation analyses between CpG methylation and transcript expression in Atlantic salmon exposed to high temperature and hypoxia. Each panel contains a graph showing the correlation between CpG methylation percentage (%) and transcript expression (RQ) measured in the liver of Atlantic salmon exposed to high temperature alone (WN: 20°C, ∼100% air saturation) or combined with hypoxia (WH: 20°C, ∼70% air sat.) for 3 days or 4 weeks, as compared to control conditions (CT: 12°C, ∼100% air sat.) (n = 8 per treatment/time point, N = 48 total). Spearman’s rank correlation coefficients (R) and the level of significance (p < 0.001***, p < 0.01**, p < 0.05*) are indicated for each relationship. Also contained within each panel are boxplots displaying the percentage of CpG methylation (%) and transcript expression (relative quantity, RQ) for fish of the three treatment groups. Dissimilar letters in the box plots indicate groups that are significantly different (determined using least square means post-hoc tests). The left panel shows the correlation analyses between (A) serpinh1 vs. CpG.3, (B) cirbp vs. CpG.6, and (C) ucp2 vs. CpG.4 measured after 3 days at 20°C. The right panel shows the correlation analyses between (D) jund vs. CpG.12, (E) prdx6 vs. CpG.6, and (F) ucp2 vs. CpG.4 measured after 4 weeks at 20°C (see Table 2 and Supplementary Table S2). The transcript expression data for the three genes (serpinh1, cirbp, and ucp2) from the short-term time point (3 days at 20°C) were previously published as part of an initial transcriptome study by Beemelmanns et al. (2020), and included herein to specifically investigate the correlation between transcript expression and DNA methylation responses.
CpG Methylation and Corresponding Transcript Expression Responses After 3 Days at 20°C
The first component map is based on the methylation values of 12 significantly affected CpGs and the corresponding relative expression (RQ) of six genes from salmon exposed for 3 days at 20°C with and without hypoxia (Figure 6A). The six genes segregated according to their responses into up-regulated (serpinh1, jund, and pdk3) and down-regulated genes (cirbp, prdx6, and ucp2) on opposing directions along CP-1 (35.9%, p = 0.001) (Figure 6A). Eight CpGs (serpinh1-CpG.2, serpinh1-CpG.3, jund-CpG.7, jund-CpG.10, cirbp-CpG.2, cirbp-CpG.6, cirbp-CpG.23, and pdk3-CpG.12) clustered along with up-regulated genes (Figure 6A), indicating higher methylation levels (i.e., they were hyper-methylated when compared to the control group) (Table 2). On the contrary, four CpGs (jund-CpG.13, prdx6-CpG.4, ucp2-CpG.2, and ucp2-CpG.4) clustered together with the down-regulated genes in the component map, and thus, this suggested that they had lower methylation levels (i.e., they were hypo-methylated) (Figure 6A and Table 2).
The two serpinh1-specific CpGs (serpinh1-CpG.2 and serpinh1-CpG.3), both located in the first coding exon (Figure 2A), clustered very closely to the up-regulated gene itself, reflecting a positive association between their responses (Figure 6A). After exposure to WN and WH for 3 days at 20°C, we found a strong trend of hyper-methylation for serpinh1-CpG.2 (F = 3.9, p = 0.032; CT vs. WN p = 0.057, CT vs. WH p = 0.055; Table 2) and a significant effect for serpinh1-CpG.3 (F = 5.9, p = 0.008; CT vs. WN p = 0.038, CT vs. WH p = 0.009; Figure 7A and Table 2). Specifically, serpinh1-CpG.3 had a significant positive correlation with up-regulated serpinh1 expression (Spearman R = 0.53, p = 0.008; Figure 7A and Table 2).
Two jund-specific CpGs (jund-CpG.7 and jund-CpG.10) located in the 5′ upstream region had a positive association with the up-regulated gene jund, whereas it was the opposite for jund-CpG.13 situated in close proximity (∼7 bp) to the putative promoter site (TATA-box) (Figures 2B, 6A). The site jund-CpG.7 was more highly methylated in WN fish as compared to CT fish after 3 days at 20°C (F = 5.7 p = 0.009; CT vs. WN p = 0.007; Table 2), while jund-CpG.10 showed increased methylation in WH fish (F = 7.1, p = 0.004; CT vs. WH p = 0.002; Table 2). In contrast, the methylation of jund-CpG.13 was reduced in fish exposed to the WN challenge after 3 days at 20°C as compared to CT fish (F = 4.1,p = 0.029; CT vs. WN p = 0.026; Table 2). However, for none of these three CpG sites were the methylation levels significantly correlated with jund expression (Table 2).
All three responsive CpGs located in the 5′ UTR or first intron of the down-regulated gene cirbp (cirbp-CpG.2, cirbp-CpG.6, and cirbp-CpG.23) (Figure 2D and Table 2) clustered on the opposite side of the component map as compared to its transcript expression (Figure 6A). Interestingly, cirbp-CpG.6, situated in the first intron (Figure 2D), clustered along CP-1 in the opposite direction to cirbp expression, reflecting their strong negative association (Figure 6A). The site cirbp-CpG.6 was more highly methylated in WN salmon exposed to 20°C for 3 days as compared to CT fish, and there was a similar trend for WH fish (F = 3.6, p = 0.042; CT vs. WN p = 0.048, CT vs. WH p = 0.051; Figure 7B and Table 2). Yet, there was a significant negative correlation between the hyper-methylation of cirbp-CpG.6 and the down-regulation of cirbp expression (Spearman R = −0.45, p = 0.026; Figure 7B and Table 2).
For the down-regulated gene ucp2, both analyzed CpG sites (ucp2-CpG.2 and ucp2-CpG.4) were located within the putative promoter region (Figure 2F) and positively correlated with ucp2 expression, although the relationship was stronger for ucp2-CpG.4 (Figure 6A and Table 2). The methylation level of ucp2-CpG.4, located ∼12 bp 5′ upstream of the TATA-box (Figure 2F), was significantly lower upon short-term exposure to WN and WH in comparison to CT (F = 6.3, p = 0.006; CT vs. WN p = 0.018; CT vs. WH p = 0.010; Figure 7C and Table 2), and showed a strong tendency for a positive correlation with down-regulated ucp2 expression (Spearman R = 0.39, p = 0.058; Figure 7C and Table 2).
CpG Methylation and Corresponding Transcript Expression Responses After 4 Weeks at 20°C
The second component map is based on the methylation of six significantly affected CpGs and the corresponding relative expression of three genes from salmon exposed to the WN and WH treatments at 20°C for 4 weeks (Figure 6B). The genes separated according to their responses into up-regulated (jund) and down-regulated (prdx6, ucp2) genes along Component 1 (CP-1, 42.2%, p = 0.001) (Figure 6B). Two CpG sites were more highly methylated (prdx6-CpG.6 and prdx6-CpG.11), while four exhibited lower methylation (jund-CpG.12, jund-CpG.15, ucp2-CpG.2, and ucp2-CpG.4) (Figure 6B and Table 2).
Based on the component map, there was a negative association between the up-regulated gene jund and the methylation levels of jund-CpG.12 and jund-CpG.15 (Figure 6B and Table 2) located in the 5′ upstream/promoter region (Figure 2B). Interestingly, the site jund-CpG.12 which is located in close proximity to the putative TATA-box (∼6 bp) (Figure 2B) had a significantly lower level of methylation in WN and WH salmon exposed to 20°C for 4 weeks as compared to CT fish (F = 7.1, p = 0.004; CT vs. WN p = 0.008, CT vs. WH p = 0.012; Figure 7D and Table 2), and was negatively correlated with jund expression (Spearman R = −0.43, p = 0.034; Figure 7D and Table 2).
The expression levels of the down-regulated gene prdx6 were inversely related to the methylation levels of prdx6-CpG.6 and prdx6-CpG.11 (Figure 6B and Table 2). The site prdx6-CpG.6, which is located in the 5′ UTR region (Figure 2E), had a significantly higher methylation level in fish from the WN group after exposure to 20°C for 4 weeks as compared to the CT group, and a similar trend was observed for the WH group (F = 3.5, p = 0.046, CT vs. WN p = 0.043, CT vs. WH p = 0.094; Figure 7E and Table 2). However, the negative relationship between down-regulated prdx6 transcript expression and prdx6-CpG.6 hyper-methylation level fell short of being significant (Spearman R = −0.35, p = 0.097; Figure 7E and Table 2).
Finally, the two ucp2 specific CpGs located in close proximity to the putative promoter region (Figure 2F) remained hypo-methylated, and were positively correlated with expression of the down-regulated gene ucp2 after 4 weeks at 20°C (Figure 6B and Table 2). This suggests that there were persistent and long-lasting changes in CpG methylation. Specifically, ucp2-CpG.4 stayed close to ucp2 expression in the component map, possibly reflecting their time-persistent positive association (Figure 6B). The ucp2-CpG.4 site still had a lower level of methylation in WN and WH fish after long-term exposure to 20°C as compared to fish in the CT group (F = 35.4, p = 6.9e-8; CT vs. WN p < 0.0001; CT vs. WH p < 0.0001; Figure 7F and Table 2), and showed a positive correlation with ucp2 expression (Spearman R = 0.623, p = 1.7e-4; Figure 7F and Table 2).
Sex Effects on DNA Methylation
In our statistical analyses we included sex as a factor in the linear mixed models to account for potential sex-specific influences on DNA methylation levels. Remarkably, we found evidence for sex-specific effects on DNA methylation when all significantly affected CpGs were considered for both exposure time points (3-days/PC-1: F = 6.4, p = 0.018; 4-weeks/PC-2: F = 5.7, p = 0.026; Supplementary Table S1). More specifically, we identified sex effects on CpG methylation for the genes jund (3-days/PC-2: F = 7.9, p = 0.009; Supplementary Table S1), pdk3 (3-days/PC-2: F = 4.5, p = 0.044; Supplementary Table S1), prdx6 (4-weeks/PC-2: F = 7.3, p = 0.012; Supplementary Table S1), and ucp2 (3-days/PC-2: F = 7.9, p = 0.010; 4-weeks/PC-2: F = 5.3, p = 0.030; Supplementary Table S1).
Discussion
DNA Methylation Responses to High Temperature Alone or Combined With Moderate Hypoxia
In this study, we report that high temperature alone, and in combination with moderate hypoxia, induced dynamic DNA methylation changes in five treatment-responsive genes in the liver of post-smolt Atlantic salmon that are involved in the heat shock response (serpinh1) (Ishida and Nagata, 2011), the regulation of mRNA stability (cirbp) (Zhong and Huang, 2017), the cellular oxidative stress response (prdx6, ucp2) (Brand and Esteves, 2005; Ambruso, 2013), and apoptosis (jund) (Weitzman et al., 2000). Remarkably, the collective CpG methylation changes in these genes revealed distinct methylation profiles in ∼1.5 year-old fish exposed to each environmental condition (i.e., WN vs. WH) for 3 days and 4 weeks, that were associated with global transcript expression changes. These results suggest that each environmental condition (temperature, hypoxia) experienced during a salmon’s lifetime may leave a different signature (footprint) on DNA methylation that is important for the regulation of gene expression responses. Further, it indicates that environmentally induced changes in DNA methylation are not exclusively manifested during early life-history stages (i.e., embryos and larvae) in fishes. These are novel and important findings for the following two reasons.
First, the integration of epigenomic changes during an organism’s lifetime is still not well-understood even in mammals (Aguilera et al., 2010; Pérez et al., 2019), and it is generally thought that epigenetic marks are mainly sensitive to environmental cues during the early life-stages of development when the rate of mitotic cell division is high and epigenetic marks are in the process of being established (Faulk and Dolinoy, 2011; Toraño et al., 2016). This is based on previously published studies that have primarily examined DNA methylation changes when fish were exposed to elevated temperatures during early developmental stages (i.e., embryo to larvae) (Campos et al., 2013; Han et al., 2016; Anastasiadi et al., 2017; Burgerhout et al., 2017; McCaw et al., 2020). For instance, Anastasiadi et al. (2017) demonstrated that temperature increases of only +2°C during the early developmental stages (i.e., 0–15 days post-fertilization) but not in later stages (i.e., 20–60 dpf) of the European sea bass (Dicentrarchus labrax) resulted in global DNA methylation changes of many genomic loci and alterations in the expression of environmental stress-relevant genes.
Second, the effects of hypoxia on DNA methylation remain largely unexplored, as so far only two studies have examined the effect of this environmental stressor on DNA methylation (Wang et al., 2016; Veron et al., 2018). For example, rainbow trout (Oncorhynchus mykiss) embryos exposed to acute hypoxia (∼22% air saturation for 24 h) had hypo- and hyper-methylated CpGs within the proximal promoters of the up-regulated gene paralogs bnip3a and bnip3lb1 (Bcl-2/E1B-19 K interacting protein 3), which are involved in mitochondrial-mediated apoptosis and/or mitochondrial autophagy (Veron et al., 2018).
In our study, we report that high temperatures, and exposure to this condition in combination with moderate hypoxia, can induce DNA methylation changes in fish long after early development has been completed and epigenetic marks are established. Collectively, our results indicate that environmental challenges experienced later in life can be differentially integrated into the genome as epigenetic marks, and thus, regulate gene expression responses that can alter the fish’s phenotype. Hence, these epigenetic changes could be advantageous for individual fish as they allow for immediate and flexible adjustments of transcript expression to environmental pressures, and facilitate phenotypic plasticity.
Exposure Time-Dependent CpG Methylation and Acclimatization Responses
The DNA methylation changes reported in this study were highly dependent on the duration of stress exposure, and this agrees with what has recently been shown for Atlantic salmon larvae subjected to acute vs. chronic stress (Uren Webster et al., 2018). In the treatment groups exposed to the environmental challenges (at 20°C) for only 3 days, we found induced DNA methylation responses in 12 CpGs located in six genes (serpinh1, jund, cirbp, pdk3, prdx6, and ucp2) when compared to control fish held at 12°C. On the contrary, these effects were weaker after prolonged stress (at 20°C) for 4 weeks, with differential DNA methylation observed for only six CpGs in three genes (jund, prdx6, and ucp2). Interestingly, the average amplicon methylation levels in four out of the six studied genes with significant treatment effects were quite low (less than 3%). However, this is similar to trans-generational effects reported in humans where methylation differences were ∼5% (Heijmans et al., 2008), and in zebrafish (Danio rerio) where sexual dimorphic methylation profiles differed by ∼2% (Caballero-Huertas et al., 2020). Hence, these findings suggest that small changes in DNA methylation levels at CpG sites can be drivers for the epigenetic regulation of gene expression.
Reversible CpG methylation changes were found for five genes (serpinh1, jund, cirbp, pdk3, and prdx6) while only one gene (ucp2) showed lasting changes in CpG methylation. These findings indicate that there were two types of DNA methylation-mediated responses to the applied stressors: (i) a stronger rapid response to short-term stress that can be reversed; and (ii) a weaker, but more persistent, response that may be permanent. The second type of response, involving epigenetic regulatory adjustments over an extended period of thermal stress, is very likely to coincide with the acclimatization response of individuals (Metzger and Schulte, 2017). Acclimatization is the ability of individuals to maintain and remodel physiological processes repeatedly throughout their lifetime to compensate for the negative effects of changing environments (Seebacher et al., 2015; Beaman et al., 2016). In comparison to DNA-based mutations, dynamic epigenetic changes, such as DNA methylation, can mediate quick and plastic phenotypic responses and facilitate “reversible plasticity” or acclimatization that is crucial for coping with variable environments (Jaenisch and Bird, 2003; Turner, 2009; Beaman et al., 2016), such as those associated with climate change-related events (Claret et al., 2018; Frölicher et al., 2018; IPCC, 2019). Some studies have shown that epigenetic changes in histone variants occur with seasonal temperature acclimation in fish (Araya et al., 2010; Simonet et al., 2013). However, our knowledge about the role that DNA methylation plays beyond developmental plasticity (i.e., during the embryonic and larval stages) in teleost fish species is limited to one study in three-spine sticklebacks (Gasterosteus aculeatus), in which it was demonstrated that both developmental temperature and adult acclimation temperature can have long-lasting effects on the epigenome (Metzger and Schulte, 2017). Hence, our findings of persistent CpG methylation changes for the down-regulated gene ucp2 (which encodes for Mitochondrial uncoupling protein 2) suggest that this epigenetic change could be important in regulating the coupling of mitochondrial respiration to ATP synthesis in cells during chronic high temperature exposure (Brand and Esteves, 2005). Under stressful conditions, mitochondrial coupling may be enhanced partly through a lower expression of ucp2, and this would have the added benefit of decreasing ROS synthesis. This may be an important mechanism for cell protection against oxidative stress (Laskowski et al., 2016), and for the long-term survival of Atlantic salmon at high temperatures (Gamperl et al., 2020). Indeed, Gerber et al. (2020) have shown that long-term acclimation of salmon to 20 vs. 12°C increases the respiratory coupling ratio (RCR) and decreases mitochondrial ROS release when tested at 20°C.
These temporal dynamics, but also persistent associations between stress-induced changes in CpG methylation and gene expression, may be important epigenetic regulatory mechanisms facilitating acclimatization responses that enable Atlantic salmon to cope with climate change-related challenges, such as predicted increases in temperature and the frequency and severity of hypoxic episodes (Breitburg et al., 2018; Claret et al., 2018; IPCC, 2019). A putative fixation of these environmentally induced epigenetic marks (“epi-mutations”) may create an “epigenetic memory” that could prime individuals throughout their lifetime (Mirbahai and Chipman, 2014; Ryu et al., 2020), and possibly across generations (i.e., confer non-genetic inheritance) (Jablonka and Raz, 2009; Nelson et al., 2013; Szyf, 2015; Wang et al., 2016; Ryu et al., 2018; Venney et al., 2020) given that these epigenetic marks would have been integrated into the germline and skipped epigenetic reprogramming (Seisenberger et al., 2013). In the context of global warming, transgenerational epigenetic inheritance is increasingly being accepted as relevant with regards to the survival of species, as it enables organisms to adjust their phenotype to a warmer future environment over multiple generations (trans-generational acclimatization) (Jablonka and Raz, 2009; Veilleux et al., 2015; Ryu et al., 2018, 2020; McCaw et al., 2020). This has been suggested to lead to an epigenetic buffering at the population level that may allow species to alter their phenotype to react to the immediate impacts of changing environments, and it would ultimately provide sufficient time for genetic adaptations to occur (O’Dea et al., 2016).
CpG Methylation Changes and Their Relation to Transcript Expression Responses
In this study, we found differences in the CpG methylation profiles between salmon exposed to the WN vs. WH challenges, whereas the transcript expression profiles for both treatment groups were similarly dysregulated as compared to the CT group (i.e., based on global CpG methylation and transcript expression profiles; Figures 5A,B,D,E). These findings might be due to complex interactions between several layers of epigenetic regulatory mechanisms. In fish, temperature can also induce changes in histone modifications and variants (Araya et al., 2010; Simonet et al., 2013) as well as changes in the levels of non-coding RNAs [e.g., microRNAs (miRNAs)], and these are also known to play an essential role in temperature-driven processes (Campos et al., 2014; Zhang et al., 2017). Likewise, exposure to hypoxia alters the regulation of miRNAs in different tissues (Lau et al., 2014; Huang et al., 2015) and results in histone-dependent chromatin modifications (Hancock et al., 2015). Consequently, in the current study, it is likely that histone modifications and changes in the levels of non-coding RNAs contributed to the observed gene expression response, and this may explain the herein observed differences between DNA methylation and gene expression profiles. Clearly, understanding the interactive effects of different epigenetic regulatory mechanisms is an area of research that deserves further attention.
We measured DNA methylation levels in the liver, however, different responses might have occurred in other tissues. For instance, in adult European sea bass (3 years old) that were exposed to +3.6°C from 7 to 63 days-post-fertilization, a larger number of differentially methylated regions (DMRs) were found in testis and muscle, while the lowest number of DMRs was observed in the liver (Anastasiadi et al., in press). When considering that the liver is a core metabolic organ in fishes (Tierney et al., 2013) with rather narrow margins for epigenetic plasticity (i.e., DNA methylation) (Anastasiadi et al., in press), it is noteworthy that we were able to determine differences in CpGs methylation in these liver samples from post-smolt (400–600 g) salmon (Gamperl et al., 2020).
In this study, we also report that sex (female/male) had a significant effect on the variation of DNA methylation levels, and this is consistent with previous studies in other fish species (Zhang et al., 2013; Anastasiadi et al., 2018b; Podgorniak et al., 2019; Caballero-Huertas et al., 2020). Remarkably, we found sex-specific effects on CpG methylation for the target genes jund, pdk3, prdx6, and ucp2 in the liver of these maturing Atlantic salmon. Similar results were described in zebrafish gonads showing sexually dimorphic methylation patterns of immune-related genes (Caballero-Huertas et al., 2020) and also after an immune-stimulation during early stages of development (Moraleda-Prados et al., 2021). The exposure of maturing zebrafish to high temperature resulted in sex ratio shifts with lasting transgenerational changes of their testicular epigenome (Valdivieso et al., 2020). In addition, genetic background may directly affect DNA methylation patterns, and there is increasing evidence for strong associations between the epigenome and genetics (i.e., a family effect) (Burgerhout et al., 2017; Cheung et al., 2017).
Collectively, our findings suggest that the relationship between environmentally induced DNA methylation and transcript expression changes involve complex interactions between several layers of epigenetic regulatory mechanisms that are likely to be tissue-specific and depend on the sex of the fish. Based on our results, we hypothesize that males and females may activate distinct epigenetic regulatory mechanisms to acclimate to high temperature and/or hypoxia exposure, and this question should be addressed in future research.
CpG Methylation in Different Genomic Elements Regulate Transcript Expression
In this study, we used the MBS method to identify highly context-dependent DNA methylation changes for a particular genomic region of ∼500 bp that included parts of the 5′ upstream region (i.e., including putative promoter sequences, the 5′ UTR, the first coding exon and/or the first intron) of six treatment-responsive genes (see Figure 2). The assessed amplicons which contained parts of the 5′ upstream region with putative TATA-box and/or POL-II sequences of genes, such as jund, prdx6, and ucp2 consistently displayed differential methylation patterns in the global CpG analysis (i.e., when considering all responsive CpGs per gene amplicon) after short-term (3 days) and long-term (4 weeks) WN and WH exposure at 20°C. For instance, a hyper-methylated promoter CpG site of the gene jund, which encodes the transcription factor JunD that regulates the protection of cells from p53-dependent senescence and apoptosis (Weitzman et al., 2000), was inversely correlated with up-regulated jund expression. The hypo-methylation of CpG sites in promoter regions is well documented to mediate the activation of gene expression upon environmental perturbations in salmonids (Burgerhout et al., 2017; Veron et al., 2018) and other fish species (Campos et al., 2013; Wang et al., 2016; Zheng et al., 2017). Also, in domesticated mouse lines, a reduction of a single CpG within the promoter which is specifically located at the putative binding site of transcription factor USF1 (Upstream Stimulatory Factor 1) was associated with up-regulated mup (Major urinary protein) transcript expression (Nelson et al., 2013).
On the contrary, hypo-methylated promoter CpG sites of the gene ucp2 (Mitochondrial uncoupling protein 2) were positively correlated with down-regulated ucp2 expression. These findings are in contrast to the classical model of gene regulation by DNA methylation in which gene silencing is regulated by promoter hyper-methylation (Jones, 2001, 2012; Bird, 2002; Edwards et al., 2017). However, increasing evidence suggests that DNA methylation patterns are far more dynamic and context-dependent than originally thought (Jones, 2012; Baubec and Schübeler, 2014; Ambrosi et al., 2017), and that promoter hyper-methylation can be positively associated with high transcriptional activity (Smith et al., 2020). For instance, Veron et al. (2018) found hyper- and hypo-methylated CpG sites in the promoter region of bnip3a and bnip3lb1, and suggested that there was a positive correlation with mRNA changes in rainbow trout fry with a hypoxic history. Clearly, the possibility that hypo-methylation of CpGs within the promoter region could be related to gene suppression deserves further investigation and calls for a more context-dependent view of epigenetic transcriptional regulation.
The methylation levels of the first coding exon might also be linked to the epigenetic regulation of transcript expression responses upon temperature and hypoxic stress in Atlantic salmon. For instance, the up-regulation of the gene serpinh1 (encoding Serpin H1 alias HSP47) in WN and WH fish, a chaperone with an important function in collagen biosynthesis and maintenance during temperature stress (Ishida and Nagata, 2011), was positively correlated with the hyper-methylation of CpGs located within the first coding exon. This is in agreement with the findings of Wang et al. (2016) who showed that the F0 and F2 generations of hypoxia exposed marine medaka (1.4 ± 0.2 mg L–1 DO, 120 days post-hatch) had a higher number of differentially methylated regions in exons (as compared to the promoter) and that the exonic region of the transcription factor encoding gene foxp2 (Forkheadbox P2) was hyper-methylated. Furthermore, McGaughey et al. (2014) postulated that exon methylation (in particular in the last coding exon) is an even better predictor of mRNA expression levels than promoter methylation in zebrafish, and reported an association between increasing exon methylation of genes (hyper-methylation) and higher transcription activity.
Interestingly, the down-regulation of the gene prdx6 [which encodes for Peroxiredoxin 6; an important mediator of cell protection against oxidative stress (Ambruso, 2013)] in WN and WH fish, was inversely correlated with the hyper-methylation of a CpG site within the 5′ UTR. Consequently, DNA methylation of the 5′ UTR appears to be another regulatory mechanism of gene expression in Atlantic salmon, since similar percentages of differentially methylated CpGs were discovered in the 5′ UTR (4%) and putative promoter (6%) after chronic stress exposure (cold-shock and air-exposure) during early larval development (Moghadam et al., 2017). Also, Cortese et al. (2008) reported an inverse correlation between the 5′ UTR methylation profiles and the expression of nine target genes in cancer cells, suggesting that these genes were at least partially regulated by 5′ UTR methylation changes. However, our understanding of the impacts of DNA methylation changes within the 5′ UTR of a gene is limited and requires additional research.
Finally, WN and WH fish had hyper-methylated CpGs located in the first intron of cirbp (as part of a CpG island), and this change was inversely correlated with cirbp down-regulation; a gene encoding for a cold-inducible RNA-binding protein involved in the regulation of mRNA stability during temperature and hypoxic stress (Zhong and Huang, 2017). This pattern agrees with the recent findings of Anastasiadi et al. (2018a), who demonstrated inverse correlations between DNA methylation of the first intron and gene expression across tissues and species.
Collectively, our findings reinforce that environmental stressor-induced DNA methylation changes appear in a variety of different genomic elements, and result in a highly complex and context-dependent regulation of the expression of genes with different functions.
Conclusion
We demonstrated that elevated temperature (20°C) as a single stressor, or combined with moderate hypoxia (∼70% air sat.), induced methylation changes at several CpG sites within different genomic elements around the transcription start site of five biomarker genes (cirbp, serpinh1, prdx6, ucp2, and jund), and that these methylation changes correlated with gene expression responses. These CpG methylation changes were also highly dependent on the duration of the stress, with some being reversible (cirbp, serpinh1, prdx6, and jund) whereas others were persistent (ucp2). These temporal, context-dependent and dynamic associations between stress-induced CpG methylation changes and gene expression may be an important epigenetic regulatory mechanism facilitating physiological plasticity and acclimatization, that allows fish species to cope with climate change-related challenges, such as predicted increases in temperature and the frequency and severity of hypoxic episodes. These responsive CpG methylation marks could be considered as putative predictors of gene expression changes, and this is important in the context of aquaculture and the development of epigenetic markers (epimarkers) to predict phenotypic traits. To date, the study of epigenetics and its application in aquaculture is in its infancy, and epimarkers hold significant promise as predictors of tissue development, growth rates, sex ratios, reproduction, disease resistance and stress tolerance (Gavery and Roberts, 2017; Best et al., 2018; Granada et al., 2018). As several epigenetic marks of the five thermal/hypoxia-responsive genes (serpinh1, jund, cirbp, prdx6, and ucp2) were firmly linked to differential expression, and subsequently physiological changes (Beemelmanns et al., 2020), they have potential as tools to detect: (i) past exposure to either acute or chronic temperature/hypoxia stress; (ii) early responses to sub-lethal stressors; and (iii) to predict thermal and/or hypoxia tolerance in salmonid fishes. Hence, our data suggest that the detected epigenetic marks associated with these biomarker genes could potentially be used not only in aquaculture breeding programs, but also for conservation and ecological surveys of wild populations. Future genome-wide methylation studies should focus on effects at different developmental stages (i.e., larvae, juvenile and adult), within and across generations, to generate age-specific DNA methylation profiles and to identify stably induced epigenetic marks. These would have significant potential for the prediction of thermal and/or hypoxia tolerance in the context of climate change-related challenges faced by wild and aquaculture fish populations.
Materials and Methods
This experiment was performed as part of the “Mitigating the Impacts of Climate-Related Challenges on Salmon Aquaculture (MICCSA)” project. A detailed description of the experimental protocol is published in Gamperl et al. (2020). All experimental procedures described herein were approved by the Institutional Animal Care Committee of Memorial University (NL, Canada) (Protocol #16-90-KG), and followed guidelines set by the Canadian Council on Animal Care. All parts of this study adhere to the ARRIVE Guidelines for reporting animal research (Kilkenny et al., 2010), and a completed ARRIVE guidelines checklist is provided in the Supplementary Material.
Animal Husbandry
The experiment was performed from March-August 2017 in the “Laboratory for Atlantic Salmon and Climate Change Research” (LASCCR) at Memorial University, St. John’s, NL, Canada. Three hundred and sixty post-smolt (∼1.5 year-old fish, immature) Atlantic salmon with a starting mass of 137.6 ± 1.3 g (mean ± SE) were randomly distributed into six 2.2 m3 circular indoor fiberglass tanks (60 fish tank–1) supplied with seawater (32 ppt salinity) at 15 L min–1 (flow-through system) that were initially maintained at 12°C and 100% air saturation with a photoperiod of 14 h light: 10 h dark. These fish were mixed offspring from an aquaculture company’s commercial brood-stock (of St. John River strain) to capture as much genetic variation as possible. The fish were fed a daily ration of 1% body weight day–1 with a commercial salmon feed (5 mm, EWOS Dynamic S, EWOS Canada Ltd, Surrey, BC, Canada). All fish in this experiment were implanted with Passive Integrated Transponder (PIT) tags (Loligo® Systems ISO 11784 certified PIT tags, Viborg, Denmark) approximately 2 months before the experiment.
Experimental Design
For the experiment, we assigned two tanks randomly to one of three treatments: (i) Warm & Normoxic (WN) fish were challenged with an incremental increase in water temperature (from 12 to 20°C at 1°C week–1) at ∼100% air saturation, and then 20°C for an additional 4 weeks; (ii) Warm & Hypoxic (WH) fish were exposed to the same temperature regimen (as in i), but simultaneously exposed to moderate hypoxia (O2 level of ∼70% air saturation) throughout the experiment; whereas (iii) Control (CT) fish were maintained at 12°C and ∼100% air saturation (Figure 1). The weekly temperature increases in the tanks of the WN and WH treatment groups were 0.3°C (from days 1 to 3), 0.1°C on day 4, and then no change from days 5 to 7. The temperature and dissolved oxygen level in the tanks were monitored daily (YSI, ProODO, Yellow Springs, OH, United States) and ammonia and nitrite levels in the tanks were measured weekly (LaMotte test kit, Chestertown, MD, United States). During the experiment, salmon were carefully fed by hand to satiation twice daily (at 9:00 and 15:00) (see Gamperl et al., 2020 for additional experimental details).
For sampling, eight fish per group (four fish per tank duplicate) were periodically netted individually out of the tanks and euthanized in an aerated seawater bath (∼10 L) containing a lethal dose (0.4 g L–1) of the central nervous system depressant MS-222 (tricaine methanesulphonate; Syndel Laboratories, Nanaimo, BC, Canada) followed by cerebral concussion (blow to the head between the eyes). We recorded physiological growth parameters as described and reported in Gamperl et al. (2020), and determined the sex of the fish by visual inspection of the gonads. For the current study, a 200 mg piece of liver was collected from WN and WH fish subjected to 20°C for 3 days and 4 weeks, and from CT fish at 12°C at the same sampling points (n = 8 fish per group/sampling point, N = 48 fish in total); then flash-frozen in liquid nitrogen, and stored at −80°C until further processing. The number of samples per exposure time point (i.e., 24) was based on prior experiments with similar designs and treatments (Gamperl et al., 2020), and was considered as sufficient to achieve statistical robustness and power (80%) to detect a significant effect (p < 0.05) with an estimated medium-large effect size (43%), according to a priori power calculations (Beemelmanns et al., 2020).
Multiplex Bisulfite Sequencing (MBS)
DNA Extraction and Bisulfite Conversion
Multiplex Bisulfite Sequencing (MBS) was performed in principle according to the protocol developed by Anastasiadi et al. (2018b). In the first step, we extracted DNA from 10 mg of liver tissue using the Wizard Genomic DNA Purification Kit (Promega, Madison, WI, United States) following the instruction manual. In addition, a total of 10 μg of genomic DNA per sample was precipitated in 0.2 M NaCl and 70% ethanol and washed 2× with 70% ethanol to remove any salt contaminants. The quantity and purity of the DNA samples before and after purification were measured with a ND-100 spectrophotometer (NanoDrop Technologies, Wilmington, DE, United States), and the integrity of DNA samples was examined on 1% agarose gels. For each sample, 1 μg of DNA was bisulfite converted with the EZ DNA Methylation-DirectTM Kit (D5020; Zymo Research, Irvine, CA, United States) following the manufacturer’s manual with minor adjustments. To ensure a high bisulfite conversion ratio, we extended the desulphonation time to 30 min, and performed the elution of the bisulfite converted DNA twice with 40 μL of Milli-Q autoclaved H2O to reach a theoretical concentration of 25 ng μL–1 of bisulfite converted DNA.
Gene Selection for MBS
The selection of target genes was based on a previous transcriptomic (44K microarray and qPCR validation) study, and we chose genes that were differentially expressed in the liver of identical experimental fish exposed to the same WN and WH treatments (Beemelmanns et al., 2020). For the current DNA methylation study, we picked six target genes that fulfilled the following conditions: (i) were significantly up-regulated (jund, pdk3, and serpinh1) or down-regulated (cirbp, prdx6, and ucp2) upon exposure to 20°C and hypoxia; (ii) had significant correlations with physiological and growth parameters; and (iii) showed functional associations with the heat-shock response, oxidative stress, apoptosis and/or metabolism (Beemelmanns et al., 2020; Table 1). For each target gene, we determined the chromosome location and size (bp) of the 5′ and 3′ untranslated regions (UTRs) of exons, protein-coding exonic regions (exons), non-coding intronic regions (introns) and individual CpG sites based on the Atlantic salmon genome assembly (ssa) ICSASG_V2 (Lien et al., 2016) available on-line on “NCBI1,” “SalmoBase2,” and “Ensembl3”. We determined putative promoter regions [TATA-box motif, Polymerase II (POL-II) promoter sequence] within the 5′ upstream region of each gene in silico using the promoter site prediction software “Promoter.2.0” (Knudsen, 1999), and “TSSW” as well as “TSSG” online tools available on http://www.softberry.com (Solovyev et al., 2010). CpG islands were identified with the online tool “CpG Finder4.”
Primer Design and Amplicon Sequence Structure
The primers were designed to encompass important genomic elements that regulate gene expression, such as the 5′ upstream region (including putative promoter), the 5′ UTR, the first coding exon and the first intron (Figure 2 and Table 1). Primers were developed using “MethPrimer” with the incorporated “Plus CpG Islands Prediction” algorithm (Li and Dahiya, 2002) to locate the primers in regions with a high CpG frequency (Supplementary Table S3). In addition, an in silico test was conducted with “Primer3” (Untergasser et al., 2012) to validate the binding capacity of the primers to the bisulfite converted target region. Forward and reverse adapters were added to the 5′ ends of the primers, as described in the Illumina protocol for 16S metagenomics library preparation (Supplementary Table S3). For an individual gene, the number of CpGs ranged from a minimum of 8 to a maximum of 23, and a total of 94 CpGs were covered with an average of 15.3 CpGs per gene and a frequency of 3.2 CpGs per 100 base pairs (Table 1 and Supplementary Table S4). The gene structure and CpG methylation marks of the sequenced regions (∼500 bp) were illustrated for each gene using the IBS software (Liu et al., 2015; Figure 2).
PCR Amplification
The PCR amplification with 25 ng of bisulfite converted DNA as template was completed in a 26 μL reaction volume with 5X Green GoTaq Flexi Buffer (Promega, Madison, WI, United States), 2.5 U of GoTaq G2 Hot Start polymerase (Promega), 2.5 mM of MgCl2 (Promega), 0.8 mM of dNTPs (Promega) and 0.4 μM of each forward and reverse primer (Tecknocroma, Barcelona, Spain). The PCR reactions were performed using 7 min at 95°C, followed by 40 cycles of [1 min at 95°C, 2 min at the primer-pair specific annealing temperature (Supplementary Table S3), and 65°C for 2 min], and a final incubation step of 10 min at 65°C. The presence and size of all PCR amplicons were verified by 1% agarose gel electrophoresis. Sanger sequencing of the PCR amplicons (Center for Research of Agricultural Genomics CRAG, Bellaterra, Spain) and BLASTn searches against NCBI nr/nt databases (January 2019) were also carried out before Illumina sequencing to validate the sequence identities and primer specificity.
PCR Amplicon Purification and Normalization
Magnetic bead-based normalization and size selection of the DNA quantities across all PCR amplicons were conducted with Sera-mag SpeedBeads (Fisher 09981123; Waltham, MA, United States) following a customized protocol described in Anastasiadi et al. (2018b) which was modified from Rohland and Reich (2012) and Hosomichi et al. (2014). For the final bead-based normalization procedure, the cleaned PCR amplicons were incubated in equal volumes with 20-fold diluted magnetic beads (20% PEG-8000, 2.5 M NaCl) and 20 μL of isopropanol for 5 min (room temperature), and then washed with 70% fresh ethanol on a magnetic stand. The normalized PCR amplicons were eluted in 13 μL of Milli-Q autoclaved H2O to obtain an equal quantity of DNA (in picomoles). In a final step, we combined 4 μL of the size-selected and normalized amplicons of each gene to obtain pools of 48 samples.
Indexing of Amplicons and Sequencing
Each sample (PCR amplicon) was indexed with a unique Nextera XT code combination according to a dual-index strategy using i7 and i5 indices from the Nextera XT index Kit Set A (Illumina®-NexteraTM, San Diego, CA, United States) according to Illumina’s protocol for 16S metagenomic library preparation. After indexing, the target amplicons were cleaned using a 0.6× Sera-mag SpeedBeads size-selection strategy (Fisher 09981123; Waltham, United States) and eluted in 22 μL of Milli-Q autoclaved H2O. For each sample, a high-sensitivity DNA assay was carried out with a Bioanalyzer (Agilent 2100, Santa Clara, CA, United States) to determine the concentration, molarity, and the exact amplicon size. A final amplicon library pool of 40 nM was prepared by combining each sample in an equimolar manner. The amplicon library was sequenced with 300 bp paired-end Illumina Mi-seq v3 (Illumina, San Diego, CA, United States) at the National Genome Analysis Center (CNAG, Barcelona, Spain).
Bioinformatics and Data Acquisition
De-multiplexed fastq raw sequence files per forward and reverse reads were provided by CNAG. The total number of Illumina read-pairs for all 48 samples ranged between 172,495 and 1,993,577 with an average of 402,849 ± 54,069 (mean ± SEM) (Supplementary Table S5). We trimmed adapters and low-quality reads with default settings (Phred score < 20) of paired-end reads with Trim Galore! (v.0.4.4_dev, Babraham Bioinformatics) (Krueger, 2018), and checked the quality with MultiQC (v.1.9) (Ewels et al., 2016). We utilized Bismark (v.0.20.0) to generate an in silico bisulfite converted Atlantic salmon genome reference with the bismark_genome_preparation command (Krueger and Andrews, 2011). Specifically, we concatenated the genome sequences of five chromosomes that contain the loci of the six target genes (ssa03/NC_027302.1, ssa04/NC_027303.1, ssa09/NC_027308.1, ssa14/NC_027313.1, and ssa16/NC_027315.1; downloaded from NCBI in January 2019) to obtain a shorter bisulfite converted genome reference and minimize the alignment processing time. The trimmed reads were aligned against this customized bisulfite converted genome reference using Bismark (Krueger and Andrews, 2011). The alignment performed was un-directional for paired-end reads using a minimum alignment function of “f(x) = 0 + −0.4∗x (x = read length).” Mapping efficiencies were 79% on average, with a total average number of 245,102 ± 5,507 (mean ± SEM) mapped read-pairs for all samples (Supplementary Table S5). Finally, we extracted the methylation values with the bismark_methylation_extractor (v0.19.0) tool. The bisulfite conversion ratios were within the necessary range of 99.2–99.5% (Supplementary Table S5). Further calculations were performed in R (v3.6.0.) (R Core Team, 2018). The coverage per CpG position was calculated as “Σ methylated Cs + non-methylated Cs” and reads with a coverage of <5 were filtered out. The percentage of methylation (%) for each CpG position was determined using the equation “CpG methylation (%) = (methylated Cs/coverage) ∗100.” To localize the exact position of the 94 CpGs within each chromosome, we utilized the GenomicRanges package (v3.8 Bioconductor) in R (Lawrence et al., 2013; Figure 2 and Supplementary Table S4). We achieved a high coverage with an average of 35,983 ± 2071 reads over all genes (Supplementary Table S6), which was evenly distributed across samples (Supplementary Figure S1) but more variable across genes (Supplementary Figure S2). Overall, gene methylation levels ranged between 0 and 100%. The genes serpinh1 (92.3 ± 0.17%) and pdk3 (26.6 ± 0.69%) had high average methylation percentages, while jund (0.7 ± 0.02%), ucp2 (0.5 ± 0.02%), cirbp (0.5 ± 0.01%), and prdx6 (1.4 ± 0.07%) showed low DNA methylation levels (Supplementary Figure S3 and Supplementary Table S6).
Gene Expression Data Acquisition
The precise methods used for RNA extraction, cDNA synthesis and gene expression analysis can be found in Beemelmanns et al. (2020) (see Supplementary Methods and Supplementary Table S7), and were conducted according to previous established protocols (Xu et al., 2013; Booman et al., 2014; Caballero-Solares et al., 2017; Eslamloo et al., 2017). The mRNA transcript levels of six target genes (cirbp, jund, pdk3, prdx6, serpinh1, and ucp2) and two normalizer genes [60S ribosomal protein L32 (rpl32, BT043656); eukaryotic translation initiation factor 3 subunit D (eif3d, GE777139)] (Xue et al., 2015; Eslamloo et al., 2017) were obtained using the Fluidigm BiomarkTM HD system (96.96 dynamic arrays) according to the protocol described in Beemelmanns and Roth (2016) and Beemelmanns et al. (2020) (Supplementary Methods and Supplementary Table S7). For the current study, we re-used the mean threshold cycle (CT) values of these 8 genes from 48 liver samples of the same experimental fish (Fish ID: #73–#120) that were measured previously as part of the larger MICCSA project (Beemelmanns et al., 2020). This dataset which contains the CT values for all samples, including those of the current study, is accessible on-line at https://doi.org/10.1594/PANGAEA.913696. In our previous geNorm analysis with qBase+ (Hellemans et al., 2007) the two reference genes rpl32 (geNorm M = 0.302) and eif3d (geNorm M = 0.313) were determined as a stable combination for normalization purposes of this dataset (geNorm V = 0.115) (Beemelmanns et al., 2020; Supplementary Methods and Supplementary Table S7). Hence, the relative quantity (RQ) of expression was determined for each target gene through the normalization to the geometric mean (CT values) of the endogenous reference genes rpl32 and eif3d, including the primer amplification efficiencies (Beemelmanns et al., 2020; Supplementary Methods), and setting the sample with the lowest expression level as the calibrator (RQ = 1.0) (Hellemans et al., 2007).
Statistical Analyses
Univariate Statistics
All statistical tests and visualizations were performed in the R environment (v3.6.0.) (R Core Team, 2018). The differences in CpG methylation levels between the treatment groups were assessed using linear mixed-effect models by applying the lmer function implemented in the lme4 (Bates et al., 2014) and lmerTest packages of R (Kuznetsova et al., 2017). Our statistical models were computed to test the effects of “treatment” and “sex” (fixed factors) on the DNA methylation of individual CpGs. We included “tank” as a random term to account for variation between tank replicates (tank effect) and to consider the mixed genetic background (unknown kinship) of randomly assigned fish among tanks. For each lmer, the residual distribution and the fit were examined, and values were log2 or arcsine transformed to fulfill assumptions for normality when necessary. Finally, models that identified significant effects were followed by a least square means post-hoc test with Tukey’s method for p-value adjustment for multiple comparisons by applying the lsmeans function in R (Lenth, 2016).
Multivariate Statistics
To compare the CpG methylation, and the corresponding transcript expression profiles, of fish from the CT, WN, and WH groups at the two exposure time points, we performed PCAs using the ade4 package in R (Dray et al., 2015). During the univariate statistical analysis, we identified CpGs that were responsive to the treatment and defined as significantly affected at p < 0.05 or showed a trend with 0.05 < p < 0.10 for either of the exposure time points (Table 2 and Supplementary Table S2). We only included the values of a selection of responsive CpGs to draw PCAs for each gene and exposure time point individually, since we found different sets of responsive CpGs depending on the exposure time (Figures 3, 4, and Table 2). Finally, PCAs were projected based on the methylation levels of all significantly affected CpGs (p < 0.05), as well as for all corresponding transcript expression levels [relative quantity–(RQ)] for both exposure time points (Figure 5 and Table 2). We considered the approach of dimensionality reduction via the PCA method as the most appropriate way to deal with our high-dimensional data because of its potential to reduce noise while preserving the global structure (Nguyen and Holmes, 2019). Accordingly, for each PCA, we plotted the PC-1 and PC-2 that accounted for most of the model variation to obtain a projection of the whole dataset onto a small dimension. To statistically test differences in cluster distribution between the treatments within the PCA, we extracted the scores of PC-1 and PC-2, and fitted for each of them a linear mixed-effect model as described in the previous paragraph (see Supplementary Table S1).
Correlation Analysis
To investigate the effects of DNA methylation on the regulation of gene expression, we followed three different statistical approaches. First, we performed a PCA based on the overall relative transcript expression values (RQ) for the six genes and correlated the extracted score values with those of the global CpG methylation PCAs using Pearson correlation coefficients (R). Specifically, the PC-1 scores from the global CpG methylation PCA were correlated with PC-1 scores of the transcript expression PCA for both time points (Figures 5C,F). Second, we applied the epPCA.inference.battery command of the package InPosition in R (Beaton et al., 2014), which allows for the simultaneous assessment of the relationship between CpG methylation and transcript expression responses in component maps (Figure 6). The incorporated battery of inference permutation tests calculated the significance of the components, and the magnitude of component scores per response variable was visualized through circle and label size (Beaton et al., 2014). Finally, we estimated significant positive or negative correlations between individual CpG methylation and RQ-values for each gene (cirbp, jund, pdk3, prdx6, serpinh1, and ucp2) with Spearman’s rank correlation coefficients (R) (Figure 7, Table 2, and Supplementary Table S2).
Data Availability Statement
The datasets generated for this study can be found in the online repositories. The names of the repository/repositories and accession number(s) can be found below: https://www.ncbi.nlm.nih.gov/geo/, GSE153343; doi: 10.1594/PANGAEA.913696
Ethics Statement
The animal study was reviewed and approved by the Institutional Animal Care Committee of Memorial University (NL, Canada) (Protocol #16-90-AG).
Author Contributions
AB carried out the experiment and samplings, performed the MBS protocol and bioinformatic sequence analysis, conducted statistical data analyses, interpreted results, and wrote the manuscript. LR contributed to the MBS protocol, provided reagents, and interpreted results. DA assisted with the MBS protocol, supported the bioinformatic sequence and statistical data analyses, and interpreted results. JM-P supported the bioinformatic sequence analysis. FZ contributed to the design of the experiment and carried out the experiment and samplings. MR contributed to the experimental design and the interpretation of the results. AKG conceived the study, designed the experiment, provided reagents, and interpreted results. All authors contributed intellectually, revised, and approved the final manuscript.
Funding
Funding for this research was provided to AKG by the Ocean Frontier Institute, through an award from the Canada First Research Excellence Fund (20181007) and was supported by the Spanish Ministry of Science Grants AGL2015-73864-JIN “Ambisex” and RYC2018-024017-I, and an “Interomics” Grant (202030E004) from the Spanish National Research Council (CSIC) to LR. This research was conducted on samples collected through the “Mitigating the Impact of Climate-Related Challenges on Salmon Aquaculture (MICCSA)” project. MICCSA funding was provided by the Atlantic Canada Opportunities Agency (781-9658-205222), Innovate NL (5404-1209-104), and Innovate PEI to AKG.
Conflict of Interest
The authors declare that the research was conducted in the absence of any commercial or financial relationships that could be construed as a potential conflict of interest.
Acknowledgments
We thank Brian Dixon for suggesting this pan-Atlantic collaboration and are very grateful to Francesc Piferrer for his collaboration in this project and the use of his lab facility and supplies for MBS library preparation at the Institute of Marine Sciences (ICM) in Barcelona, Spain. We thank the staff of the Dr. Joe Brown Aquatic Research Building (JBARB, Memorial University of Newfoundland, Canada) for assistance with fish husbandry. We are grateful to Rebeccah Sandrelli, MacGregor Parent, Olufemi Ajiboye, Tasha Harrold, and Gord Nash for assistance with sampling, and to Tasha Harrold for her help in managing the “Mitigating the Impact of Climate-Related Challenges on Salmon Aquaculture (MICCSA)” project and Module J2 of the Ocean Frontier Institute. We thank Sílvia Joly and Núria Sánchez-Baizán for their kind assistance in performing the MBS protocol, and Alejandro Valdivieso Muñoz for his intellectual support during MBS data assessment.
Supplementary Material
The Supplementary Material for this article can be found online at: https://www.frontiersin.org/articles/10.3389/fmars.2020.604878/full#supplementary-material
Footnotes
- ^ https://www.ncbi.nlm.nih.gov/assembly/GCF_000233375.1
- ^ https://salmobase.org/genome_browser
- ^ https://uswest.ensembl.org/Salmo_salar/Info/Index
- ^ http://www.softberry.com
References
Abdel-Tawwab, M., Monier, M. N., Hoseinifar, S. H., and Faggio, C. (2019). Fish response to hypoxia stress: growth, physiological, and immunological biomarkers. Fish Physiol. Biochem. 45, 997–1013. doi: 10.1007/s10695-019-00614-9
Aguilera, O., Fernández, A. F., Muñoz, A., and Fraga, M. F. (2010). Epigenetics and environment: a complex relationship. J. Appl. Physiol. 109, 243–251. doi: 10.1152/japplphysiol.00068.2010
Akbarzadeh, A., Günther, O. P., Houde, A. L., Li, S., Ming, T. J., Jeffries, K. M., et al. (2018). Developing specific molecular biomarkers for thermal stress in salmonids. BMC Genomics 19:749. doi: 10.1186/s12864-018-5108-9
Ambrosi, C., Manzo, M., and Baubec, T. (2017). Dynamics and context-dependent roles of DNA methylation. J. Mol. Biol. 429, 1459–1475. doi: 10.1016/j.jmb.2017.02.008
Ambruso, D. R. (2013). Peroxiredoxin-6 and NADPH oxidase activity. Hydrog. Peroxide Cell Signal. Pt B 527, 145–167. doi: 10.1016/B978-0-12-405882-8.00008-8
Anastasiadi, D., Díaz, N., and Piferrer, F. (2017). Small ocean temperature increases elicit stage-dependent changes in DNA methylation and gene expression in a fish, the European sea bass. Sci. Rep. 7, 1–12. doi: 10.1038/s41598-017-10861-6
Anastasiadi, D., Esteve-Codina, A., and Piferrer, F. (2018a). Consistent inverse correlation between DNA methylation of the first intron and gene expression across tissues and species. Epigenet. Chromatin 11:37. doi: 10.1186/s13072-018-0205-1
Anastasiadi, D., Vandeputte, M., Sánchez-Baizán, N., Allal, F., and Piferrer, F. (2018b). Dynamic epimarks in sex-related genes predict gonad phenotype in the European sea bass, a fish with mixed genetic and environmental sex determination. Epigenetics 13, 988–1011. doi: 10.1080/15592294.2018.1529504
Anastasiadi, D., and Piferrer, F. (2020). A clockwork fish: age prediction using DNA methylation-based biomarkers in the European seabass. Mol. Ecol. Resour. 20, 387–397. doi: 10.1111/1755-0998.13111
Anastasiadi, D., Shao, C., Chen, S., and Piferrer, F. (in press). Footprints of global change in marine life: inferring past developmental temperature based on DNA methylation and gene expression marks. Mol. Ecol. doi: 10.1111/mec.15764
Angers, B., Castonguay, E., and Rachel, M. (2010). Environmentally induced phenotypes and DNA methylation: how to deal with unpredictable conditions until the next generation and after. Mol. Ecol. 19, 1283–1295. doi: 10.1111/j.1365-294X.2010.04580.x
Araya, I., Nardocci, G., Morales, J. P., Vera, M. I., Molina, A., and Alvarez, M. (2010). MacroH2A subtypes contribute antagonistically to the transcriptional regulation of the ribosomal cistron during seasonal acclimatization of the carp fish. Epigenet. Chromatin 3:14. doi: 10.1186/1756-8935-3-14
Ball, M. P., Li, J. B., Gao, Y., Lee, J.-H., LeProust, E. M., Park, I.-H., et al. (2009). Targeted and genome-scale strategies reveal gene-body methylation signatures in human cells. Nat. Biotechnol. 27:361. doi: 10.1038/nbt.1533
Bates, D., Maechler, M., Bolker, B., and Walker, S. (2014). lme4: Linear Mixed-Effects Models Using Eigen and S4. R Packag. Version 1, 1–23.
Baubec, T., and Schübeler, D. (2014). Genomic patterns and context specific interpretation of DNA methylation. Curr. Opin. Genet. Dev. 25, 85–92. doi: 10.1016/j.gde.2013.11.015
Beal, A., Rodriguez-Casariego, J., Rivera-Casas, C., Suarez-Ulloa, V., and Eirin-Lopez, J. M. (2018). “Environmental epigenomics and its applications in marine organisms,” in Population Genomics: Marine Organisms, eds M. F. Oleksiak and O. P. Rajora (Berlin: Springer), 325–359. doi: 10.1007/13836_2018_28
Beaman, J. E., White, C. R., and Seebacher, F. (2016). Evolution of plasticity: mechanistic link between development and reversible acclimation. Trends Ecol. Evol. 31, 237–249. doi: 10.1016/j.tree.2016.01.004
Beaton, D., Chin Fatt, C. R., and Abdi, H. (2014). An ExPosition of multivariate analysis with the singular value decomposition in R. Comput. Stat. Data Anal. 72, 176–189. doi: 10.1016/j.csda.2013.11.006
Beemelmanns, A., and Roth, O. (2016). Biparental immune priming in the pipefish Syngnathus typhle. Zoology 119, 262–272. doi: 10.1016/j.zool.2016.06.002
Beemelmanns, A., Zanuzzo, F. S., Xue, X., Sandrelli, R. M., Rise, M. L., and Gamperl, A. K. (2020). Transcriptomic responses of Atlantic salmon (Salmo salar) to high temperature stress alone, or in combination with moderate hypoxia. ResearchSquare [Preprint]. Available online at: https://www.researchsquare.com/article/rs-38228/v1
Best, C., Ikert, H., Kostyniuk, D. J., Craig, P. M., Navarro-Martin, L., Marandel, L., et al. (2018). Epigenetics in teleost fish: from molecular mechanisms to physiological phenotypes. Comp. Biochem. Physiol. Part B Biochem. Mol. Biol. 224, 210–244. doi: 10.1016/j.cbpb.2018.01.006
Bird, A. (2002). DNA methylation patterns and epigenetic memory. Genes Dev. 16, 6–21. doi: 10.1101/gad.947102.6
Bogdanović, O., Smits, A. H., de la Calle Mustienes, E., Tena, J. J., Ford, E., Williams, R., et al. (2016). Active DNA demethylation at enhancers during the vertebrate phylotypic period. Nat. Genet. 48, 417–426. doi: 10.1038/ng.3522
Booman, M., Xu, Q., and Rise, M. L. (2014). Evaluation of the impact of camelina oil-containing diets on the expression of genes involved in the innate anti-viral immune response in Atlantic cod (Gadus morhua). Fish Shellfish Immunol. 41, 52–63. doi: 10.1016/j.fsi.2014.05.017
Brand, M. D., and Esteves, T. C. (2005). Physiological functions of the mitochondrial uncoupling proteins UCP2 and UCP3. Cell Metab. 2, 85–93. doi: 10.1016/j.cmet.2005.06.002
Breitburg, D., Levin, L. A., Oschlies, A., Grégoire, M., Chavez, F. P., Conley, D. J., et al. (2018). Declining oxygen in the global ocean and coastal waters. Science 359:eaam7240. doi: 10.1126/science.aam7240
Brett, J. R. (1956). Some principles in the thermal requirements of fishes. Q. Rev. Biol. 31, 75–87. doi: 10.1086/401257
Brett, J. R. (1971). Energetic responses of salmon to temperature. A study of some thermal relations in the physiology and freshwater ecology of sockeye salmon (Oncorhynchus nerkd). Am. Zool. 11, 99–113. doi: 10.1093/icb/11.1.99
Burgerhout, E., Mommens, M., Johnsen, H., Aunsmo, A., Santi, N., and Andersen, Ø. (2017). Genetic background and embryonic temperature affect DNA methylation and expression of myogenin and muscle development in Atlantic salmon (Salmo salar). PLoS One 12:e0179918. doi: 10.1371/journal.pone.0179918
Burke, H., Gardner, I., and Farrell, A. P. (2020). A review of the 2019 Newfoundland and Labrador South Coast cultured Atlantic salmon mortality event. Department of Fisheries and Land Resources, Government of Newfoundland and Labrador, Special Studies and Reports. Available online at: https://www.gov.nl.ca/ffa/files/publications-pdf-2019-salmon-review-final-report.pdf
Burt, K., Hamoutene, D., Mabrouk, G., Lang, C., Puestow, T., Drover, D., et al. (2012). Environmental conditions and occurrence of hypoxia within production cages of Atlantic salmon on the south coast of Newfoundland. Aquac. Res. 43, 607–620. doi: 10.1111/j.1365-2109.2011.02867.x
Burt, K., Hamoutene, D., Perez-Casanova, J., Gamperl, A. K., and Volkoff, H. (2013). The effect of intermittent hypoxia on growth, appetite and some aspects of the immune response of Atlantic salmon (Salmo salar). Aquac. Res. 45, 124–137. doi: 10.1111/j.1365-2109.2012.03211.x
Caballero-Huertas, M., Moraleda-Prados, J., Joly, S., and Ribas, L. (2020). Immune genes, IL1β and Casp9, show sexual dimorphic methylation patterns in zebrafish gonads. Fish Shellfish Immunol. 97, 648–655. doi: 10.1016/j.fsi.2019.12.013
Caballero-Solares, A., Hall, J. R., Xue, X., Eslamloo, K., Taylor, R. G., Parrish, C. C., et al. (2017). The dietary replacement of marine ingredients by terrestrial animal and plant alternatives modulates the antiviral immune response of Atlantic salmon (Salmo salar). Fish Shellfish Immunol. 64, 24–38. doi: 10.1016/j.fsi.2017.02.040
Campos, C., Sundaram, A. Y., Valente, L. M., Conceição, L. E., Engrola, S., and Fernandes, J. M. (2014). Thermal plasticity of the miRNA transcriptome during Senegalese sole development. BMC Genomics 15:525. doi: 10.1186/1471-2164-15-525
Campos, C., Valente, L., Conceição, L., Engrola, S., and Fernandes, J. (2013). Temperature affects methylation of the myogenin putative promoter, its expression and muscle cellularity in Senegalese sole larvae. Epigenetics 8, 389–397. doi: 10.4161/epi.24178
Cheung, W. A., Shao, X., Morin, A., Siroux, V., Kwan, T., Ge, B., et al. (2017). Functional variation in allelic methylomes underscores a strong genetic contribution and reveals novel epigenetic alterations in the human epigenome. Genome Biol. 18:50. doi: 10.1186/s13059-017-1173-7
Claret, M., Galbraith, E. D., Palter, J. B., Bianchi, D., Fennel, K., Gilbert, D., et al. (2018). Rapid coastal deoxygenation due to ocean circulation shift in the northwest Atlantic. Nat. Clim. Chang. 8, 868–872. doi: 10.1038/s41558-018-0263-1
Cortese, R., Hartmann, O., Berlin, K., and Eckhardt, F. (2008). Correlative gene expression and DNA methylation profiling in lung development nominate new biomarkers in lung cancer. Int. J. Biochem. Cell Biol. 40, 1494–1508. doi: 10.1016/j.biocel.2007.11.018
Crozier, L. G., and Hutchings, J. A. (2014). Plastic and evolutionary responses to climate change in fish. Evol. Appl. 7, 68–87. doi: 10.1111/eva.12135
De Paoli-Iseppi, R., Deagle, B. E., Polanowski, A. M., McMahon, C. R., Dickinson, J. L., Hindell, M. A., et al. (2019). Age estimation in a long-lived seabird (Ardenna tenuirostris) using DNA methylation-based biomarkers. Mol. Ecol. Resour. 19, 411–425. doi: 10.1111/1755-0998.12981
Dray, S., Dufour, A. B., and Thioulouse, J. (2015). ade4: Analysis of Ecological Data: Exploratory and Euclidean Methods in Environmental Sciences. R Package Version 1.7–2.
Edwards, J. R., Yarychkivska, O., Boulard, M., and Bestor, T. H. (2017). DNA methylation and DNA methyltransferases. Epigenet. Chromatin 10:23. doi: 10.1186/s13072-017-0130-8
Eirin-Lopez, J. M., and Putnam, H. M. (2019). Marine environmental epigenetics. Ann. Rev. Mar. Sci. 11, 335–368. doi: 10.1146/annurev-marine-010318-095114
Eslamloo, K., Xue, X., Hall, J. R., Smith, N. C., Caballero-Solares, A., Parrish, C. C., et al. (2017). Transcriptome profiling of antiviral immune and dietary fatty acid dependent responses of Atlantic salmon macrophage-like cells. BMC Genomics 18:706. doi: 10.1186/s12864-017-4099-2
Ewels, P., Magnusson, M., Lundin, S., and Käller, M. (2016). MultiQC: summarize analysis results for multiple tools and samples in a single report. Bioinformatics 32, 3047–3048. doi: 10.1093/bioinformatics/btw354
Faulk, C., and Dolinoy, D. C. (2011). Timing is everything: the when and how of environmentally induced changes in the epigenome of animals. Epigenetics 6, 791–797. doi: 10.4161/epi.6.7.16209
Frölicher, T. L., Fischer, E. M., and Gruber, N. (2018). Marine heatwaves under global warming. Nature 560, 360–364. doi: 10.1038/s41586-018-0383-9
Gamperl, A. K., Ajiboye, O. O., Zanuzzo, F. S., Sandrelli, R. M., Peroni, E. F. C., and Beemelmanns, A. (2020). The impacts of increasing temperature and moderate hypoxia on the production characteristics, cardiac morphology and haematology of Atlantic Salmon (Salmo salar). Aquaculture 519:734874. doi: 10.1016/j.aquaculture.2019.734874
Gavery, M. R., and Roberts, S. B. (2017). Epigenetic considerations in aquaculture. PeerJ 5:e4147. doi: 10.7717/peerj.4147
Gerber, L., Clow, K. A., Mark, F. C., and Gamperl, A. K. (2020). Improved mitochondrial function in salmon (Salmo salar) following high temperature acclimation suggests that there are cracks in the proverbial ‘ceiling’. Sci. Rep. doi: 10.1038/s41598-020-78519-4
Granada, L., Lemos, M. F. L., Cabral, H. N., Bossier, P., and Novais, S. C. (2018). Epigenetics in aquaculture – the last frontier. Rev. Aquac. 10, 994–1013. doi: 10.1111/raq.12219
Han, B., Li, W., Chen, Z., Xu, Q., Luo, J., Shi, Y., et al. (2016). Variation of DNA methylome of zebrafish cells under cold pressure. PLoS One 11:e0160358. doi: 10.1371/journal.pone.0160358
Hancock, R. L., Dunne, K., Walport, L. J., Flashman, E., and Kawamura, A. (2015). Epigenetic regulation by histone demethylases in hypoxia. Epigenomics 7, 791–811. doi: 10.2217/epi.15.24
Hazel, J. R., and Prosser, C. L. (1974). Molecular mechanisms of temperature compensation in poikilotherms. Physiol. Rev. 54, 620–677. doi: 10.1152/physrev.1974.54.3.620
Heijmans, B. T., Tobi, E. W., Stein, A. D., Putter, H., Blauw, G. J., Susser, E. S., et al. (2008). Persistent epigenetic differences associated with prenatal exposure to famine in humans. Proc. Natl. Acad. Sci. U.S.A. 105, 17046–17049. doi: 10.1073/pnas.0806560105
Hellemans, J., Mortier, G., De Paepe, A., Speleman, F., and Vandesompele, J. (2007). qBase relative quantification framework and software for management and automated analysis of real-time quantitative PCR data. Genome Biol. 8:R19. doi: 10.1186/gb-2007-8-2-r19
Horvath, S. (2013). DNA methylation age of human tissues and cell types. Genome Biol. 14:R115. doi: 10.1186/gb-2013-14-10-r115
Hosomichi, K., Mitsunaga, S., Nagasaki, H., and Inoue, I. (2014). A Bead-based Normalization for Uniform Sequencing depth (BeNUS) protocol for multi-samples sequencing exemplified by HLA-B. BMC Genomics 15:645. doi: 10.1186/1471-2164-15-645
Houde, A. L. S., Akbarzadeh, A., Günther, O. P., Li, S., Patterson, D. A., Farrell, A. P., et al. (2019). Salmonid gene expression biomarkers indicative of physiological responses to changes in salinity and temperature, but not dissolved oxygen. J. Exp. Biol. 222:jeb198036. doi: 10.1242/jeb.198036
Huang, C., Chen, N., Wu, X.-J., Huang, C.-H., He, Y., Tang, R., et al. (2015). The zebrafish miR-462/miR-731 cluster is induced under hypoxic stress via hypoxia-inducible factor 1α and functions in cellular adaptations. FASEB J. 29, 4901–4913. doi: 10.1096/fj.14-267104
Hughes, G. M. (1973). Respiratory responses to hypoxia in fish. Am. Zool. 13, 475–489. doi: 10.1093/icb/13.2.475
Hvas, M., Folkedal, O., Imsland, A., and Oppedal, F. (2017). The effect of thermal acclimation on aerobic scope and critical swimming speed in Atlantic salmon, Salmo salar. J. Exp. Biol. 220, 2757–2764. doi: 10.1242/jeb.154021
IPCC (2019). “Summary for policymakers,” in IPCC Special Report on the Ocean and Cryosphere in a Changing Climate, eds H.-O. Pörtner, D. C. Roberts, V. Masson-Delmotte, P. Zhai, M. Tignor, E. Poloczanska, et al. (Geneva: IPCC).
Ishida, Y., and Nagata, K. (2011). “Hsp47 as a collagen-specific molecular chaperon,” in Methods in Enzymology, eds J. Abelson, M. Simon, G. Verdine, and A. Pyle (Cambridge, MA: Academic Press), 167–182. doi: 10.1016/b978-0-12-386471-0.00009-2
Jablonka, E., and Raz, G. (2009). Transgenerational epigenetic inheritance: prevalence, mechanisms, and implications for the study of heredity and evolution. Q. Rev. Biol. 84, 131–176. doi: 10.1086/598822
Jaenisch, R., and Bird, A. (2003). Epigenetic regulation of gene expression: how the genome integrates intrinsic and environmental signals. Nat. Genet. 33, 245–254. doi: 10.1038/ng1089
Jones, P. A. (2001). The role of DNA methylation in mammalian epigenetics. Science 293, 1068–1070. doi: 10.1126/science.1063852
Jones, P. A. (2012). Functions of DNA methylation: islands, start sites, gene bodies and beyond. Nat. Rev. Genet. 13, 484–492. doi: 10.1038/nrg3230
Kilkenny, C., Browne, W. J., Cuthill, I. C., Emerson, M., and Altman, D. G. (2010). Improving bioscience research reporting: the ARRIVE guidelines for reporting animal research. PLoS Biol. 8:e1000412. doi: 10.1371/journal.pbio.1000412
Knudsen, S. (1999). Promoter2.0: for the recognition of PolII promoter sequences. Bioinformatics 15, 356–361. doi: 10.1093/bioinformatics/15.5.356
Krueger, F. (2018). Trim Galore, Babraham Bioinformatics. Available online at: http://www.bioinformatics.babraham.ac.uk/projects/trim_galore/ (accessed January, 2019).
Krueger, F., and Andrews, S. R. (2011). Bismark: a flexible aligner and methylation caller for Bisulfite-Seq applications. Bioinformatics 27, 1571–1572. doi: 10.1093/bioinformatics/btr167
Kuntz, M. J., and Harris, R. A. (2018). “Pyruvate dehydrogenase kinase,” in Encyclopedia of Signaling Molecules, ed. S. Choi (New York, NY: Springer). doi: 10.1007/978-1-4614-6438-9_101636-2
Kuznetsova, A., Brockhoff, P. B., and Christensen, R. H. B. (2017). lmerTest package: tests in linear mixed effects models. J. Stat. Softw. 82, 1–26. doi: 10.18637/jss.v082.i13
Larsen, P. F., Schulte, P. M., and Nielsen, E. E. (2011). Gene expression analysis for the identification of selection and local adaptation in fishes. J. Fish Biol. 78, 1–22. doi: 10.1111/j.1095-8649.2010.02834.x
Laskowski, M., Augustynek, B., Kulawiak, B., Koprowski, P., Bednarczyk, P., Jarmuszkiewicz, W., et al. (2016). What do we not know about mitochondrial potassium channels? Biochim. Biophys. Acta Bioenerg. 1857, 1247–1257. doi: 10.1016/j.bbabio.2016.03.007
Lau, K., Lai, K. P., Bao, J. Y. J., Zhang, N., Tse, A., Tong, A., et al. (2014). Identification and expression profiling of MicroRNAs in the brain, liver and gonads of marine medaka (Oryzias melastigma) and in response to hypoxia. PLoS One 9:e110698. doi: 10.1371/journal.pone.0110698
Lawrence, M., Huber, W., Pagès, H., Aboyoun, P., Carlson, M., Gentleman, R., et al. (2013). Software for computing and annotating genomic ranges. PLoS Comput. Biol. 9:e1003118. doi: 10.1371/journal.pcbi.1003118
Li, L.-C., and Dahiya, R. (2002). MethPrimer: designing primers for methylation PCRs. Bioinformatics 18, 1427–1431. doi: 10.1093/bioinformatics/18.11.1427
Li, S., He, F., Wen, H., Li, J., Si, Y., Liu, M., et al. (2017). Low salinity affects cellularity, DNA methylation, and mRNA expression of igf1 in the liver of half smooth tongue sole (Cynoglossus semilaevis). Fish Physiol. Biochem. 43, 1587–1602. doi: 10.1007/s10695-017-0395-7
Lien, S., Koop, B. F., Sandve, S. R., Miller, J. R., Kent, M. P., Nome, T., et al. (2016). The Atlantic salmon genome provides insights into rediploidization. Nature 533, 200–205. doi: 10.1038/nature17164
Liu, W., Xie, Y., Ma, J., Luo, X., Nie, P., Zuo, Z., et al. (2015). IBS: an illustrator for the presentation and visualization of biological sequences. Bioinformatics 31, 3359–3361. doi: 10.1093/bioinformatics/btv362
Madeira, D., Vinagre, C., and Diniz, M. S. (2016). Are fish in hot water? Effects of warming on oxidative stress metabolism in the commercial species Sparus aurata. Ecol. Indic. 63, 324–331. doi: 10.1016/j.ecolind.2015.12.008
McCaw, B., Stevenson, T. J., and Lancaster, L. T. (2020). Epigenetic responses to temperature and climate. Integr. Comp. Biol. 1–12. doi: 10.1093/icb/icaa049
McGaughey, D. M., Abaan, H. O., Miller, R. M., Kropp, P. A., and Brody, L. C. (2014). Genomics of CpG methylation in developing and developed zebrafish. G3 Genes Genomes Genet. 4, 861–869. doi: 10.1534/g3.113.009514
Metzger, D. C. H., and Schulte, P. M. (2017). Persistent and plastic effects of temperature on DNA methylation across the genome of threespine stickleback (Gasterosteus aculeatus). Proc. R. Soc. B Biol. Sci. 284:20171667. doi: 10.1098/rspb.2017.1667
Mikeska, T., and Craig, J. (2014). DNA methylation biomarkers: cancer and beyond. Genes 5, 821–864. doi: 10.3390/genes5030821
Mirbahai, L., and Chipman, J. K. (2014). Epigenetic memory of environmental organisms: a reflection of lifetime stressor exposures. Mutat. Res. Genet. Toxicol. Environ. Mutagen. 76, 10–17. doi: 10.1016/j.mrgentox.2013.10.003
Moghadam, H. K., Johnsen, H., Robinson, N., Andersen, Ø, Jørgensen, E. H., Johnsen, H. K., et al. (2017). Impacts of early life stress on the methylome and transcriptome of atlantic salmon. Sci. Rep. 7, 1–11. doi: 10.1038/s41598-017-05222-2
Moraleda-Prados, J., Caballero-Huertas, M., Valdivieso, V., Joly, S., Ji, J., Roher, N., et al. (2021). Immune stimulation during sex differentiation alters epigenetics and can induce feminization in a dose-dependent manner in fish. Dev. Comp. Immunol. 114:103848. doi: 10.1016/j.dci.2020.103848
Nelson, A. C., Cauceglia, J. W., Merkley, S. D., Youngson, N. A., Oler, A. J., Nelson, R. J., et al. (2013). Reintroducing domesticated wild mice to sociality induces adaptive transgenerational effects on MUP expression. Proc. Natl. Acad. Sci. U.S.A. 110, 19848–19853. doi: 10.1073/pnas.1310427110
Nguyen, L. H., and Holmes, S. (2019). Ten quick tips for effective dimensionality reduction. PLoS Comput. Biol. 15:e1006907. doi: 10.1371/journal.pcbi.1006907
O’Dea, R. E., Noble, D. W. A., Johnson, S. L., Hesselson, D., and Nakagawa, S. (2016). The role of non-genetic inheritance in evolutionary rescue: epigenetic buffering, heritable bet hedging and epigenetic traps. Environ. Epigenetics 2:1. doi: 10.1093/eep/dvv014
Oliver, E. C. J., Donat, M. G., Burrows, M. T., Moore, P. J., Smale, D. A., Alexander, L. V., et al. (2018). Longer and more frequent marine heatwaves over the past century. Nat. Commun. 9:1324. doi: 10.1038/s41467-018-03732-9
Pérez, R. F., Santamarina, P., Tejedor, J. R., Urdinguio, R. G., Álvarez-Pitti, J., Redon, P., et al. (2019). Longitudinal genome-wide DNA methylation analysis uncovers persistent early-life DNA methylation changes. J. Transl. Med. 17:15. doi: 10.1186/s12967-018-1751-9
Piferrer, F. (2018). “Epigenetics of sex determination and differentiation in fish,” in Sex Control in Aquaculture, eds H. Wang, S. Chen, Z.-G. Shen, and F. Piferrer (Chichester, UK: John Wiley & Sons, Ltd), 65–83. doi: 10.1002/9781119127291.ch3
Podgorniak, T., Brockmann, S., Konstantinidis, I., and Fernandes, J. M. O. (2019). Differences in the fast muscle methylome provide insight into sex-specific epigenetic regulation of growth in Nile tilapia during early stages of domestication. Epigenetics 14, 818–836. doi: 10.1080/15592294.2019.1618164
Polanowski, A. M., Robbins, J., Chandler, D., and Jarman, S. N. (2014). Epigenetic estimation of age in humpback whales. Mol. Ecol. Resour. 14, 976–987. doi: 10.1111/1755-0998.12247
R Core Team (2018). R: A Language and Environment for Statistical Computing. Available online at: http://www.r-project.org/ (accessed January, 2019).
Rohland, N., and Reich, D. (2012). Cost-effective, high-throughput DNA sequencing libraries for multiplexed target capture. Genome Res. 22, 939–946. doi: 10.1101/gr.128124.111
Ryu, T., Veilleux, H. D., Donelson, J. M., Munday, P. L., and Ravasi, T. (2018). The epigenetic landscape of transgenerational acclimation to ocean warming. Nat. Clim. Chang. 8, 504–509. doi: 10.1038/s41558-018-0159-0
Ryu, T., Veilleux, H. D., Munday, P. L., Jung, I., Donelson, J. M., and Ravasi, T. (2020). An epigenetic signature for within-generational plasticity of a reef fish to ocean warming. Front. Mar. Sci. 7:284. doi: 10.3389/fmars.2020.00284
Seebacher, F., White, C. R., and Franklin, C. E. (2015). Physiological plasticity increases resilience of ectothermic animals to climate change. Nat. Clim. Chang. 5, 61–66. doi: 10.1038/nclimate2457
Seisenberger, S., Peat, J. R., Hore, T. A., Santos, F., Dean, W., and Reik, W. (2013). Reprogramming DNA methylation in the mammalian life cycle: building and breaking epigenetic barriers. Philos. Trans. R. Soc. B Biol. Sci. 368:20110330. doi: 10.1098/rstb.2011.0330
Simonet, N., Reyes, M., Nardocci, G., Molina, A., and Alvarez, M. (2013). Epigenetic regulation of the ribosomal cistron seasonally modulates enrichment of H2A.Z and H2A.Zub in response to different environmental inputs in carp (Cyprinus carpio). Epigenet. Chromatin 6:22. doi: 10.1186/1756-8935-6-22
Smith, J., Sen, S., Weeks, R. J., Eccles, M. R., and Chatterjee, A. (2020). Promoter DNA hypermethylation and paradoxical gene activation. Trends Cancer 6, 392–406. doi: 10.1016/j.trecan.2020.02.007
Solovyev, V. V., Shahmuradov, I. A., and Salamov, A. A. (2010). Identification of Promoter Regions and Regulatory Sites. Cham: Springer.
Somero, G. N. (2010). The physiology of climate change: how potentials for acclimatization and genetic adaptation will determine “winners” and “losers.”. J. Exp. Biol. 213, 912–920. doi: 10.1242/jeb.037473
Stehfest, K. M., Carter, C. G., McAllister, J. D., Ross, J. D., and Semmens, J. M. (2017). Response of Atlantic salmon Salmo salar to temperature and dissolved oxygen extremes established using animal-borne environmental sensors. Sci. Rep. 7:4545. doi: 10.1038/s41598-017-04806-2
Szyf, M. (2015). Nongenetic inheritance and transgenerational epigenetics. Trends Mol. Med. 21, 134–144. doi: 10.1016/j.molmed.2014.12.004
Tierney, K. B., Farrell, A. P., and Brauner, C. J. (2013). Fish Physiology: Organic Chemical Toxicology of Fishes. Cambridge, MA: Academic Press.
Toraño, E. G., García, M. G., Fernández-Morera, J. L., Niño-García, P., and Fernández, A. F. (2016). The impact of external factors on the epigenome: in utero and over lifetime. Biomed Res. Int. 2016, 1–17. doi: 10.1155/2016/2568635
Turner, B. M. (2009). Epigenetic responses to environmental change and their evolutionary implications. Philos. Trans. R. Soc. B Biol. Sci. 364, 3403–3418. doi: 10.1098/rstb.2009.0125
Untergasser, A., Cutcutache, I., Koressaar, T., Ye, J., Faircloth, B. C., Remm, M., et al. (2012). Primer3–new capabilities and interfaces. Nucleic Acids Res. 40:e115. doi: 10.1093/nar/gks596
Uren Webster, T. M., Rodriguez-Barreto, D., Martin, S. A. M., Van Oosterhout, C., Orozco-terWengel, P., Cable, J., et al. (2018). Contrasting effects of acute and chronic stress on the transcriptome, epigenome, and immune response of Atlantic salmon. Epigenetics 13, 1191–1207. doi: 10.1080/15592294.2018.1554520
Valdivieso, A., Ribas, L., Monleón-Getino, A., Orbán, L., and Piferrer, F. (2020). Exposure of zebrafish to elevated temperature induces sex ratio shifts and alterations in the testicular epigenome of unexposed offspring. Environ. Res. 186:109601. doi: 10.1016/j.envres.2020.109601
Veilleux, H. D., Ryu, T., Donelson, J. M., van Herwerden, L., Seridi, L., Ghosheh, Y., et al. (2015). Molecular processes of transgenerational acclimation to a warming ocean. Nat. Clim. Chang. 5, 1074–1078. doi: 10.1038/nclimate2724
Venney, C. J., Wellband, K. W., and Heath, D. D. (2020). Rearing environment affects the genetic architecture and plasticity of DNA methylation in Chinook salmon. Heredity doi: 10.1038/s41437-020-0346-4
CrossRef Full Text. [Epub ahead of print].
Veron, V., Marandel, L., Liu, J., Vélez, E. J., Lepais, O., Panserat, S., et al. (2018). DNA methylation of the promoter region of bnip3 and bnip3l genes induced by metabolic programming. BMC Genomics 19:677. doi: 10.1186/s12864-018-5048-4
Wade, N. M., Clark, T. D., Maynard, B. T., Atherton, S., Wilkinson, R. J., Smullen, R. P., et al. (2019). Effects of an unprecedented summer heatwave on the growth performance, flesh colour and plasma biochemistry of marine cage-farmed Atlantic salmon (Salmo salar). J. Therm. Biol. 80, 64–74. doi: 10.1016/j.jtherbio.2018.12.021
Wang, S. Y., Lau, K., Lai, K.-P., Zhang, J.-W., Tse, A. C.-K., Li, J.-W., et al. (2016). Hypoxia causes transgenerational impairments in reproduction of fish. Nat. Commun. 7:12114. doi: 10.1038/ncomms12114
Weitzman, J. B., Fiette, L., Matsuo, K., and Yaniv, M. (2000). JunD protects cells from p53-dependent senescence and apoptosis. Mol. Cell 6, 1109–1119. doi: 10.1016/S1097-2765(00)00109-X
Xu, Q., Feng, C. Y., Hori, T. S., Plouffe, D. A., Buchanan, J. T., and Rise, M. L. (2013). Family-specific differences in growth rate and hepatic gene expression in juvenile triploid growth hormone (GH) transgenic Atlantic salmon (Salmo salar). Comp. Biochem. Physiol. Pt D Genomics Proteomics 8, 317–333. doi: 10.1016/j.cbd.2013.09.002
Xue, X., Hixson, S. M., Hori, T. S., Booman, M., Parrish, C. C., Anderson, D. M., et al. (2015). Atlantic salmon (Salmo salar) liver transcriptome response to diets containing Camelina sativa products. Comp. Biochem. Physiol. D Genomics Proteomics 14, 1–15. doi: 10.1016/j.cbd.2015.01.005
Zhang, C., Tong, C., Tian, F., and Zhao, K. (2017). Integrated mRNA and microRNA transcriptome analyses reveal regulation of thermal acclimation in Gymnocypris przewalskii: a case study in Tibetan Schizothoracine fish. PLoS One 12:e0186433. doi: 10.1371/journal.pone.0186433
Zhang, Y., Zhang, S., Liu, Z., Zhang, L., and Zhang, W. (2013). Epigenetic modifications during sex change repress gonadotropin stimulation of cyp19a1a in a teleost ricefield eel (Monopterus albus). Endocrinology 154, 2881–2890. doi: 10.1210/en.2012-2220
Zheng, J.-L., Guo, S.-N., Yuan, S.-S., Xia, H., Zhu, Q.-L., and Lv, Z.-M. (2017). Preheating mitigates cadmium toxicity in zebrafish livers: evidence from promoter demethylation, gene transcription to biochemical levels. Aquat. Toxicol. 190, 104–111. doi: 10.1016/j.aquatox.2017.06.022
Keywords: DNA methylation, high temperature, low oxygen, environmental changes, acclimatization, epigenetic marks, biomarkers, aquaculture
Citation: Beemelmanns A, Ribas L, Anastasiadi D, Moraleda-Prados J, Zanuzzo FS, Rise ML and Gamperl AK (2021) DNA Methylation Dynamics in Atlantic Salmon (Salmo salar) Challenged With High Temperature and Moderate Hypoxia. Front. Mar. Sci. 7:604878. doi: 10.3389/fmars.2020.604878
Received: 10 September 2020; Accepted: 16 November 2020;
Published: 14 January 2021.
Edited by:
Jose M. Eirin-Lopez, Florida International University, United StatesReviewed by:
Mikko Juhani Nikinmaa, University of Turku, FinlandDaniel Garcia-Souto, University of Vigo, Spain
Malthe Hvas, Norwegian Institute of Marine Research (IMR), Norway
Copyright © 2021 Beemelmanns, Ribas, Anastasiadi, Moraleda-Prados, Zanuzzo, Rise and Gamperl. This is an open-access article distributed under the terms of the Creative Commons Attribution License (CC BY). The use, distribution or reproduction in other forums is permitted, provided the original author(s) and the copyright owner(s) are credited and that the original publication in this journal is cited, in accordance with accepted academic practice. No use, distribution or reproduction is permitted which does not comply with these terms.
*Correspondence: Anne Beemelmanns, abeemelmanns@mun.ca