Role of Hydrogen in a Low-Carbon Electric Power System: A Case Study
 Michael Schulthoff
 Ivan Rudnick2
  Abhishek Bose
 Emre Gençer
- 1Chair of Thermodynamics, Ruhr-University Bochum, Bochum, Germany
- 2MIT Energy Initiative, Massachusetts Institute of Technology, Cambridge, MA, United States
The European Union set a 2050 decarbonization target in the Paris Agreement to reduce carbon emissions by 90–95% relative to 1990 emission levels. The path toward achieving those deep decarbonization targets can take various shapes but will surely include a portfolio of economy-wide low-carbon energy technologies/options. The growth of the intermittent renewable power sources in the grid mix has helped reduce the carbon footprint of the electric power sector. Under the need for decarbonizing the electric power sector, we simulated a low-carbon power system. We investigated the role of hydrogen for future electric power systems under current cost projections. The model optimizes the power generation mix economically for a given carbon constraint. The generation mix consists of intermittent renewable power sources (solar and wind) and dispatchable gas turbine and combined cycle units fueled by natural gas with carbon capture and sequestration, as well as hydrogen. We created several scenarios with battery storage options, pumped hydro, hydrogen storage, and demand-side response (DSR). The results show that energy storage replaces power generation, and pumped hydro entirely replaces battery storage under given conditions. The availability of pumped hydro storage and demand-side response reduced the total cost as well as the combination of solar photovoltaic and pumped hydro storage. Demand-side response reduces relatively costly dispatchable power generation, reduces annual power generation, halves the shadow carbon price, and is a viable alternative to energy storage. The carbon constrain defines the generation mix and initializes the integration of hydrogen (H2). Although the model rates power to gas with hydrogen as not economically viable in this power system under the given conditions and assumptions, hydrogen is important for hard-to-abate sectors and enables sector coupling in a real energy system. This study discusses the potential for hydrogen beyond this model approach and shows the differences between cost optimization models and real-world feasibility.
Introduction
The European Union has set an ambitious objective of decarbonizing its economy by 90–95% (relative to 1990 levels) by 2050 in order to meet its goals under the Paris Agreement. Meeting this objective will require drastically—if not entirely—decarbonizing the EU's electricity sector (European Commission, 2018). Achieving that goal is only possible by limiting carbon dioxide (CO2) emissions and setting a total carbon budget, even though part of the carbon budget might be used in the electricity sector. While the exact pathway of decarbonization is unclear, any such pathway needs to ensure both firmness and flexibility in the electric power system (Lund et al., 2015; Child et al., 2019). Decarbonizing the electricity sector without firm and flexible resources would be significantly more costly (Child et al., 2018). Krakowski et al. (2016) claim that a high level of renewable power generation requires a massive expansion of power capacity by two to three times and identifies dispatchable power plants, imports, and demand-side response as an option to reduce costs (Krakowski et al., 2016).
Power to gas is recognized as a promising and viable option for electricity storage as it creates hydrogen from (excess) electricity in a process called electrolysis. When fluctuating renewables or excess electricity is used for electrolysis, the amount of produced hydrogen is related to the amount of available electricity (flexible electrolysis). The power of the electrolysis process is then adjusted. Afterwards, hydrogen can be stored and used for various purposes, e.g., as fuel for turbines or as feedstock in industry. (Estermann et al., 2016; Weidner et al., 2018; Glenk and Reichelstein, 2019; Petkov and Gabrielli, 2020). Especially for long-term and seasonal storage (Brey, 2020; Petkov and Gabrielli, 2020), hydrogen can link the electricity sector to the heat sector (Nastasi et al., 2018). While power to gas is a feasible option to store large amounts of energy, substantially reducing the cost of electrolysis is fundamental to its viability (Schiebahn et al., 2015).
Applying carbon constraints to meet CO2 reduction targets leads to an increase in electricity price, but adding storage lowers that cost increase. Haller et al. (2012) found that the electricity price is nearly double for a 90% CO2 reduction (without storage or transmission). The availability of storage increases the cost only by 28% and leads to a carbon reduction of 98% (Haller et al., 2012). Further, the value of energy storage rises with tighter emission limits, and energy storage increases the utilization of the cheapest low-carbon power resource (Sisternes et al., 2016). Several studies have investigated the role of storage technologies for future power systems. Child et al. (2018) found that power to gas (mainly biomethane) can provide seasonal balancing for a 100% renewable energy system. Overall, storage technologies can have a cost share of up to 28% of levelized cost of energy (LCOE) and reduce the power system's cost, without taking hydrogen into account (Child et al., 2019). However, for the economic feasibility of more than 80% renewable share in a power system, large-scale storage, power imports, and other flexibility options must be available (Pfenninger and Keirstead, 2015).
The characterization of the solution space is of utmost importance to take a comprehensive approach. In the electric power sector, persistent and growing interest in the literature regarding the use of hydrogen and electrolysis techniques for both storage and grid balancing is found. However, we note important questions about such implementations' economic viability, suggesting an area of exploration for our power systems modeling. The development of electrolysis technology is considerably advanced, as Buttler et al. (2018) demonstrate through a review of commercial technologies currently available, as well as expected improvements going forward (Buttler and Spliethoff, 2018). They note the technical suitability of current electrolysis technologies for several applications, including energy storage and grid balancing. They also identify opportunities to leverage sector coupling via power-to-gas and power-to-liquid production to form storage as second-order decarbonization. The review also provides detailed technical parameters on performance of various electrolysis technologies, which will prove valuable for techno-economic assessments.
We note a range of results when utilizing flexible electrolysis, coupled with hydrogen storage, as a support mechanism for the electric power system. Bennoua et al. (2015) model the introduction of flexible electrolysis and hydrogen storage in the French power system, examining its potential use for load following (in the context of France’s large baseload nuclear capacity), as well as for use as a balancing mechanism for variability in generation (Bennoua et al., 2015).
Guinot et al. (2015) take an economic view and focus on the profitability of electrolysis-based hydrogen production for grid balancing in France. Specifically, by examining the viability of hydrolysis plants incorporated in frequency regulation activities, they find that the capacity component of payments mostly drives the plants' revenue. However, they note that compensation would have to increase two to three times over a 2010 baseline for such operations to be profitable for the plant (Guinot et al., 2015).
However, looking more on the systemic scale with the Spanish power system model, Gutiérrez-Martín et al. (2015) envision the successful integration of electrolysis for flexible energy storage at a large scale. Focusing on the transition from a modern power system to a decarbonized one, the authors note the economic viability and an emissions reduction under various technology and policy scenarios and optimistically project the integration of 50 MW of electrolysis capacity (Gutiérrez-Martín et al., 2015).
This study presents the results of quantitative analysis to compare alternative decarbonization options for the electric power sector. It investigates investigates the evolution of power generation monitoring new capacity build dispatch of available power generation assets, generator-level emission, and overall cost of the solution to meet an abstract system's hourly power demand. The focus of the analysis and the conclusion drawn are not meant to determine definitive solutions to the decarbonization challenge but to demonstrate trade-offs among the corresponding firm and flexible resource options.
Methodology
The decarbonization pathway of the electric power sector is uncertain and can take different shapes. For this analysis, a hypothetical power system is created, called EnergyVille, to simulate the characteristics and grid conditions of a power system comparable to that of Texas in 2050, based on its wind and solar profiles. Texas is characterized by high onshore wind and low offshore wind capacity factors. Renewable power sources are characterized by the expected technology performance in 2050. We have used a configurable capacity expansion tool, GenX, to perform this analysis and simulate an energy system with 420 TWh annual demand and a peak demand of 85 GW. The method of GenX is described in detail by Sisternes et al. (2016) and Jenkins and Sepulveda (2017).
The power generation technology portfolio includes solar PV, onshore wind, offshore wind, natural gas with carbon capture and sequestration (CCS), green (zero-emission hydrogen produced from renewable power sources) and blue (low-emission hydrogen produced from steam methane reforming with CCS) hydrogen, and nuclear and hydroelectric (“hydro”). Natural gas and hydrogen are utilized in combined-cycle (CC) gas turbines and open-cycle (OC) gas turbines. The hydroelectric power generation has an existing capacity of 1 GW and is not expandable. The available energy storages consist of 1-h (“battery storage 1 h”) and 4-h battery energy storage (“battery Storage 4 h”), pumped hydro, as well as several hydrogen storage options (see Table 1). Additionally, it is assumed that natural gas, exogenous blue hydrogen (produced from natural gas with CCS in the steam methane reforming (SMR) process), and endogenous green hydrogen (produced from entirely carbon-free energy sources) are available with their associated market prices in the system. In terms of hydrogen storage, hydrogen is produced endogenously within the system.
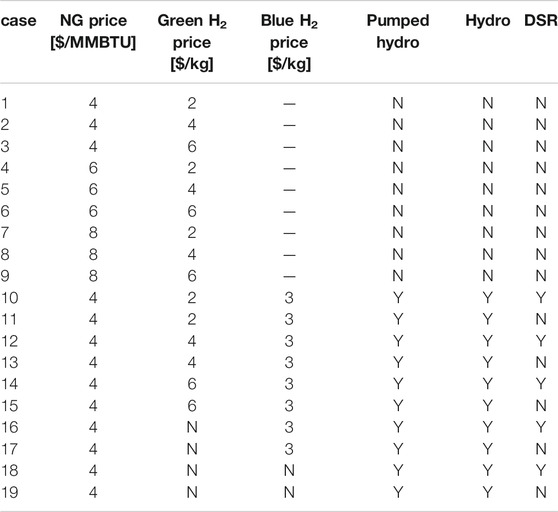
TABLE 1. Summary of case inputs (Y: included in the scenario: N: not included in the scenario).
The selected technologies span a wide range of dispatchable and nondispatchable power generation options that are collectively required for the grid's stability. Figure 1 illustrates the simplified structure of the model, as well as its system boundaries. Within the system boundaries, the GenX model optimizes the installation of the electric power system. Under given assumptions and based on the generation and load profiles with an hourly resolution for one year (Supplementary Material S1), the model calculates an optimal solution for each scenario.
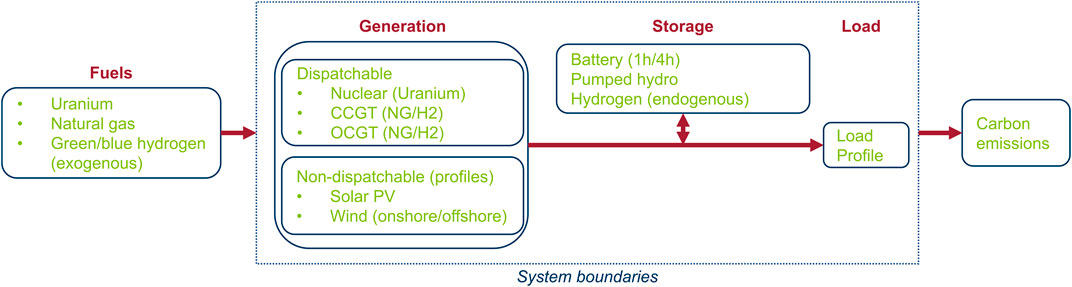
FIGURE 1. Model structure and system boundaries.
The wind profiles were derived from NREL’s techno-economic dataset (NREL, 2019). The used wind profiles correspond to the ERCOT (Electric Reliability Council of Texas) region, where the offshore wind resources have lower capacity factors than the onshore resources in the western part of the state (ERCOT, 2019). Furthermore, the wind profiles used include a percentage improvement in capacity factors (15% for onshore and 9% for offshore), which are based on the values reported in the NREL’s data (see Supplementary Material S2). The wind profiles correspond to resource estimates for the 2013 weather year (ERCOT, 2019; NREL, 2019).
Model Assumptions
The model assumptions are listed in the supplementary material (see Supplementary Material S3). The input data (e.g., CAPEX, OPEX, fuel, and efficiency) are based on former studies of the MIT Energy Initiative (Sepulveda et al., 2018; Mallapragada et al., 2020a; Mallapragada et al., 2020b).
Generally, two prominent types of hydrogen are available for the model. First, exogenous hydrogen, which is available as blue or green hydrogen for a specific price as a fuel, depending on the scenario. Exogenous hydrogen comes from outside the system boundaries and could be interpreted as an import fuel.
Second, endogenous hydrogen is produced within the system boundaries as H2 storage. Endogenous hydrogen is produced by an electrolyzer and uses the surplus energy from the grid. Respectively to the shutdown times and costs of natural gas CCGT and OCGT, endogenous hydrogen is not per se “green.” While the cost of exogenous hydrogen is constant within a scenario for any amount, the price for endogenous hydrogen is dependent on the utilization of the electrolyzer and, therefore, variable within the optimization process in a scenario.
The optimization model has been built based on the load profile for solar and wind for a full year with an hourly resolution. Technology costs are gathered from the NREL’s 2018 Annual Technology Baselines Report, Lazard, and discussion with experts (Lazard, 2018a; Lazard, 2018b; NREL, 2018). The table (see Supplementary Material S3) lists assumptions for power generation, storage options, grid properties, and other costs. Hydrogen storage (power to gas) is available, combined with OC and CC gas turbines, as well as with and without infrastructure. “Without infrastructure” represents decentralized hydrogen production, while “with infrastructure” is centralized hydrogen production, including transport and distribution infrastructure. As the model is based on one year of wind and solar data, no seasonal differences are considered within different years.
We set a “penalty” for non-served energy 9,000 $/MWh. This high penalty is chosen to force the model to install enough capacity to meet the electricity demand on an hourly basis and is a necessary input requirement for the model method. As electricity import or export is not optional here, EnergyVille must act autonomously in this model. However, up to 10% of the load can be shifted to lower electricity prices via demand-side response for 180 $/MWh. Furthermore, the model assumes an existing capacity of 1000 MW hydroelectric power, which is not expandable. Therefore, it will not be shown in the installed capacity, but in the annual electricity production. Moreover, the heat rates, power plant efficiencies for nuclear source, CCGT, and OCGT, and round trip efficiencies of battery storage and hydrogen storage options are listed (see Supplementary Material S4). Assumed efficiencies for hydrogen storage are 70% (charging) for electrolysis, 53.7% for OCGT, and 40% for CCGT.
Furthermore, a carbon budget of 5.3 tCO2/GWh for gross electricity demand in 2050 is assumed. This value was chosen in cooperation and discussions with Iberdrola, based on the company's internal assumptions and data. In this model, the consumption of 420 TWh leads to a system-wide carbon cap of approximately 2.3 million tons CO2. The carbon budget is a cumulative amount of carbon dioxide that can be emitted during a specific time frame.
The fuel costs are constant for nuclear (1.06 $/MMBTU) and exogenous blue H2 (27.25 $/MMBTU). The price is a variable parameter for natural gas CCS (4, 6, 8 $/MMBTU) and exogenous green hydrogen (17.58, 35.17, 52.75 $/MMBTU or 2, 4, 6 $/kg). While exogenous green hydrogen is produced via electrolysis, exogenous blue hydrogen is produced via natural gas with CCS by using the SMR process. The SMR process has an efficiency of 75%. The natural gas CCS (SMR) process assumed in this model captures 90% of the emitted CO2 of natural gas. The costs for exogenous green and blue hydrogen are independent of the cost of electricity or natural gas in the model. These values were derived from Gençer (2019) and Mallapragada et al. (2020a).
Scenarios
This model investigates various input options and responses to variations of the input parameters. Scenarios are defined to isolate the role of natural gas and hydrogen prices; introduce pumped hydro storage, including the availability of conventional hydroelectric generation; and consider the potential of demand-side response (DSR). A total of 19 cases covering various combinations of the key input parameters have been defined, as listed in Table 1. In all cases, battery energy storage for 1 and 4 h and H2 storage (as described in 2.1, “endogenous hydrogen”) are available options. Assumptions shown in Supplementary Material S3 are constant for all cases.
The scenarios can be divided into two sets of cases. The first set (1–9) investigates the influence of the different NG and green H2 prices without options like pumped hydro, hydroelectric (hydro), or demand-side response in the model, but including 1- and 4-h battery energy storage. Therefore, in cases 1–3, the NG price is constant (4 $/MMBTU), and the exogenous hydrogen price is varying from 2 to 6 $/kg. Cases 4–6 and 7–9 follow the same scheme at NG prices of 6 and 8 $/MMBTU. The first set investigates the role of hydrogen as a storage option under the given conditions, as power to gas and battery storage are the exclusively available storage options here. In contrast, the duration of battery storage is limited to four hours.
The second set (10–19) involves the storage options pumped hydro, hydro, and DSR, which are available for cases with even numbers. Here, power-to-gas storage with hydrogen has to compete with other storage options or demand-side management. Further, those cases investigate the influence of the exogenous green and blue hydrogen prices and options while having a constant and low NG price. Moreover, cases 10–17 include blue hydrogen as an option. Cases 16–19 exclude green hydrogen. Case 10 is the low-NG and low-green hydrogen scenario with all possible options. Case 11 is similar to case 10, but excludes DSR. Cases 12–13 and 14–15 are increasing the exogenous green hydrogen price and investigate the impact of DSR. Cases 18 and 19 exclude exogenous green and blue hydrogen to force the model onto NG and storage options. Even scenario numbers have demand-side management available, while uneven scenarios (numbers) do not investigate the role of DSR in competition with storage options.
Results and Discussion
In the following, we present the results. Further, we interpret and discuss the outcomes in consideration of the input parameters based on the two sets of scenarios. We investigate the installed capacity, total annual power generation, total CO2 emissions, total cost, and the marginal abatement cost (shadow CO2 price) for each case. Regarding the high cost of nonserved energy of 9,000 $/MWh, more than 99% of the energy demands are served in that model, which shows that the penalty was chosen high enough to force the model to serving the electricity demand. Case 12,14, and 16 have a non-served energy share or 0.61%, and case 10 of 0.21%.
Installed Capacity
In Figure 2, the installed capacity for each case and the technology mix are shown. The model chose nuclear, offshore wind, CC with blue hydrogen for power generation, or 1-h battery storage in none of the cases. Furthermore, none of the power-to-gas hydrogen storage options shown in Table 1 is selected by the model. Generally, this decision can be traced back to higher CAPEX and OPEX costs for those technologies. In terms of hydrogen storage, the cost of hydrogen per kilogram is dependent on the costs of the electrolyzer, storage capacity and possibly infrastructure, and electricity from the grid to produce endogenous hydrogen within the system, which is burned in CCGT or OCGT afterward. For every scenario and under given assumptions, producing endogenous hydrogen and burning it in turbines is more expensive than using exogenous hydrogen. The cost of endogenous hydrogen is higher than the assumed exogenous hydrogen prices because the endogenous hydrogen price is dependent on the infrastructure costs and the utilization of the electrolyzer. The higher the utilization and the more hydrogen is produced, the lower is the endogenous hydrogen price.
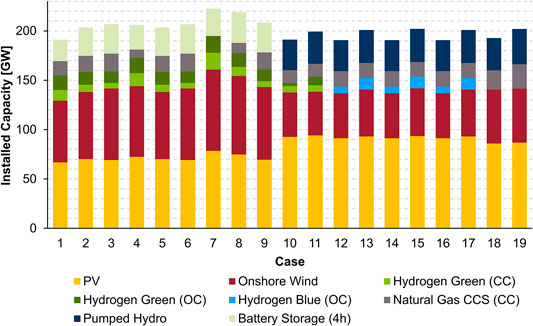
FIGURE 2. Installed capacity and capacity mix by technology type for each case in GW.
General
In power generation, nuclear has the highest CAPEX at 5,211 $/kW and OPEX of 99,000 $/MWyr, which are approximately ten times higher than that of solar PV. With the used ERCOT wind profile, offshore wind has a lower capacity factor than onshore wind in this model and also the CAPEX is more than four times higher than that for onshore wind and the OPEX about 2.5 times higher. For blue hydrogen in a CCGT, the fuel costs are half of those of the green hydrogen, but it still emits CO2 through the SMR process, while the carbon budget limits the CO2 emissions. The process efficiency for CCGT is higher (53.7%) than that for OCGT (39.9%). Since the modeling decisions are cost-oriented and the carbon budget is a limiting factor, the efficiency has less weight in the decision process. Furthermore, the CAPEX for OCGT is slightly lower than that for CCGT, and the OPEX is approximately half of that of CCGT. However, when blue hydrogen (OC) is included, the installed capacity is relatively small, at 6.5–11.8 GW compared to a total of 200 GW.
Solar PV and Onshore Wind
Moreover, the introduced carbon cap is one of the main factors determining the generation mix. For all cases, solar PV and onshore wind are the dominant power generation technologies. The total share of solar PV and wind on the total power generation is 67.7% in case 1 and 72.8% in case 18—the share of solar ranges from 33.5% in case 6 to 48.5% in case 10. Meanwhile, onshore wind is between 22.2% in case 11 and 37% in case 7. Even though the onshore wind has a higher capacity factor of 47% than 31% for solar PV in this model, more solar PV is installed than onshore wind. In the first set (cases 1–9), the shares of solar PV and onshore wind are each pending around 35%. The availability of pumped hydro and the fixed capacity of 1 GW for hydroelectric power reduce onshore wind to 22.2% in case 11 and to 28.3% in case 18 in the second set. Lower cost per year for pumped hydro than battery storage, as well as significantly lower CAPEX and OPEX compared to onshore wind, combined with low costs for solar PV lead to an enhancement of solar PV and a decrease in onshore wind. In cases 10–19, the share of solar PV is 43 and 48.5% compared to around 35% in the first set. It is economically more viable to install more solar PV, even with the lower capacity factor, and to store the energy in pumped hydro, instead of installing onshore wind. Furthermore, the long-term storage capability of pumped hydro provides extra flexibility to the grid.
Storage
In cases 1 to 9, 4-h battery storage is installed at 21 GW power in case 1 to 31 GW in case 8. For cases 10 to 19, pumped hydro as a storage option is available and fully replaces the system's battery storage. Battery storage and pumped hydro have the same CAPEX and OPEX, but pumped hydro has a significantly higher lifespan at 40 years rather than 15 years for battery storage. Therefore, the same CAPEX cost can amortize on a longer time frame for pumped hydro, which lowers the annual fixed costs. Pumped hydro ranges from 30.9 GW in case 10 to 35.6 GW in case 19. In Figure 3, the shares of the different technologies for the installed capacity are shown.
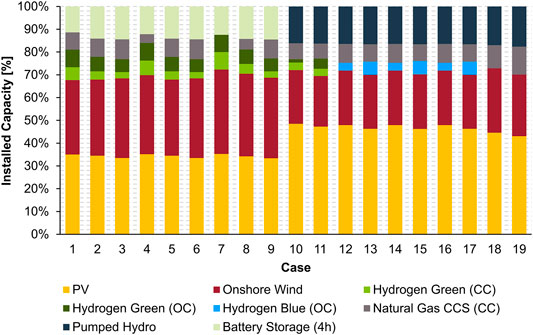
FIGURE 3. Normalized installed capacity and capacity mix by technology type for each case.
Dispatchable Power Generation
Dispatchable power is installed to serve the energy demand when the wind and solar PV power generation is insufficient. Large storage systems charged by grid surplus, if available, are another way to solve this problem. The surplus in the grid emerges when more electricity is produced on the grid than load, which leads to instability of the grid. One way to solve this problem is to shut off the dispatchable power, which creates cost for the start-up again, or renewables are curtailed. Both options lower the capacity factor of each technology, which leads to higher levelized costs of energy. Another way is to store surplus energy in storage systems, which produces fixed and operational costs. Furthermore, the demand can be shifted to times of renewable power generation (DSR).
In conclusion, DSR directly affects the installed capacity and reduces relatively costly dispatchable power generation because cheaper renewable power can be used to serve the controlled load, instead of a more expensive controllable generation. Moreover, energy storage replaces power generation, depending on the CAPEX and OPEX of the storage. The data are shown in Supplementary Material S6, S7. While solar is less costly than onshore wind, it is only available during the Sun hours, while wind power can be also available at night. Availability of pumped hydro leads to a shift of less wind and more solar PV power capacity due to lower fixed and operational costs and the possibility to store the solar PV electricity in pumped hydro during the day and discharge during the night (compare cases 1–9: without pumped hydro; cases 10–19: withpumped hydro). The total share of renewables (solar PV and wind) is constant at around 70% for all cases.
Available dispatchable power generation options are CC and OC with exogenous blue and green hydrogen, as well as CC with natural gas and CCS. Exogenous blue hydrogen is available in cases 10 to 17 only. The share of natural gas CCS (CC) is 4–9% in cases 1–9, except for the fully renewable case 7 (high NG price; blue hydrogen not available in this case). In the second set (10–19), natural gas is constant at 7–8%, except for cases 18 and 19 at 10 and 12%. In cases 18 and 19, no hydrogen as a dispatchable power generation is available. Therefore, the model must select natural gas for its dispatchable power generation to avoid nonserved energy costs.
In the first set (1–9), exogenous green hydrogen (CC) is chosen at 2.7% in case 6 to 7.6% in case 7. Green hydrogen (OC) is slightly higher, at 6–8%. A green hydrogen price of 2 $/kg leads to a capacity share of 8%, while it drops to 6% in the cases with higher green hydrogen prices.
In cases 10 and 11, green hydrogen (CC) is around 3%, while (OC) is 1% in case 10 and 4% in case 11. Green hydrogen is still cheaper than blue hydrogen in cases 10 and 11. Therefore, blue hydrogen (CC) is not installed. The introduction of pumped hydro and DSR is a viable option for cheap green hydrogen at 2 $/kg. In cases 12 to 19, green hydrogen is not economically viable compared to the other options due to the increased hydrogen price of 4 and 6 $/kg. Here, blue hydrogen is always cheaper at 3 $/kg than green hydrogen but emits CO2. Blue hydrogen is fluctuating between 3 and 6% in cases 12 to 17, depending on the availability of DSR. When DSR is available, it is cheaper than installing dispatchable blue hydrogen (OC). If DSR is not available, the share of blue hydrogen is 6%.
Total Annual Power Generation
Figure 4 illustrates the annual power generation for each case by the different technologies, based on the installed capacity shown in Figure 2. The options nuclear, offshore wind, 1-h battery storage, and blue hydrogen (CC) are not shown in Figure 4, as those are not used for any of the cases. Figure 5 illustrates the normalized values for the annual power generation.
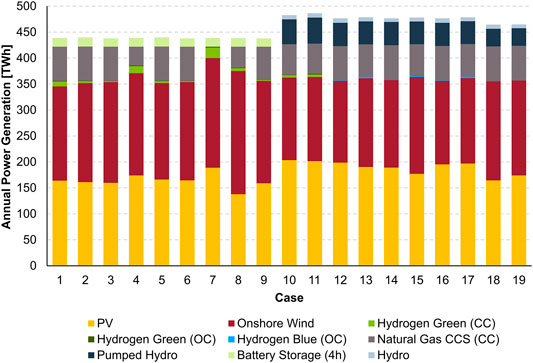
FIGURE 4. Total annual power generation by technology type for each case in TWh.
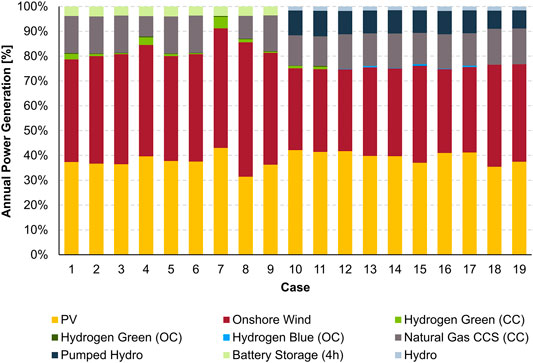
FIGURE 5. Normalized total annual power generation by technology type for each case.
General
Overall, the annual power generation is higher in the cases 10–19 at an average of 476 TWh versus cases 1–9 at 439 TWh. In particular, the availability of pumped hydro and DSR leads to a higher annual power generation. The difference is related to pumped hydro storage, as it is cheaper than battery storage and, therefore, more often used.
Solar PV and Onshore Wind
Solar PV and onshore wind generate most power in all cases, between 75% and 91%. In cases 1 to 9, solar PV ranges from an annual power generation of 138 TWh in case 8 up to 189 TWh in case 7. Onshore wind generates 186 TWh in case 5 and up to 237 TWh in case 8. While solar PV ranges between 36% and 43%, onshore wind has a higher share of 41–54%. The higher capacity factor of 0.47 for onshore wind than 0.31 is the main reason. In the first set (1–9), more solar PV than onshore wind capacity is installed. But regarding the higher CF, the annual power generation of onshore wind is higher. In the second set, solar PV produces 177 TWh (37%) in case 15 and up to 203 TWh (42%) in case 10. Onshore wind generates from 159 TWh (31%) to 191 TWh (41%). Solar PV and onshore wind culminate around 76% in the second set (10–19); this is related to using pumped hydro as the cheap storage option. In comparison, renewable power generation in the first set is even higher (average 83%).
Storage
In cases 1 to 9, battery storage contributes from 16 TWh in case 9 up to 18 TWh in case 2 (3.7–4%). The availability of pumped hydro in the second set fully replaces battery storage. While only slightly more pumped hydro capacity (33 GW) is installed in the second set than battery storage (28 GW) in the first set, the annual power generation has more than doubled (from 17 TWh for battery storage in the first set, to 43 TWh for pumped hydro in the second set, on average). Therefore, the cheaper the energy storage and proportional power generation options, the less power generation is installed. Also, more storage becomes economically viable in this model and plays a more critical role in the energy system.
Dispatchable Power Generation
The carbon budget of 5.3 tCO2/GWh limits the electricity produced by carbon-emitting power generation. For natural gas (CC), this limit equals a share of around 15%, or 65 TWh, of annual power generation.
In cases 1–9, exogenous green hydrogen (CC) contributes 0.4–4.6% (case 7) to the mix. The lower the price for exogenous green hydrogen in the scenario, the more it is installed. The installation and annual power generation are dependent on the proportion of natural gas and the green hydrogen price, but even more of by the carbon intensity limit of 5.3 tCO2/GWh.
In cases 10–19, exogenous green hydrogen generates electricity in cases 10 and 11 because of the relatively low price of 2 $/kg, while blue hydrogen is available for a higher price of 3 $/kg. In cases 12–15, the green hydrogen price increases to 4 $/kg and is, therefore, higher than the exogenous blue hydrogen price. The green hydrogen is replaced by blue hydrogen solar and wind installation. The carbon cap limits the replacement with natural gas or more exogenous blue hydrogen. Blue hydrogen contributes only up to 0.6% of the annual production, limited by the carbon cap. The detailed data for Figures 4,5 are shown in Supplementary Material S8.
Capacity Factors
Figure 6 shows the minimum and maximum capacity factors for all power generation technologies and storage technologies that occur in the results. The capacity factor describes the ratio between the time of the device in use and the total time it could be utilized. The resulting range corresponds to the cases in which the technology is available as a modeling option, and the model selects it. and the green average for the year in each scenario. Pumped hydro is only available in scenarios 10–19; therefore, the CF is zero in the scenarios 1–9. If pumped hydro is available, it has a minimum CF of 10.8%. The green bar represents cases 10–19, while the gray and green bars combined include all cases. Natural gas is available in all cases, but in case 7, it is not chosen by the model (CF = 0) regarding the price assumptions for natural gas and hydrogen. Except for case 7, all scenarios include natural gas CCS (CC). The green bar represents all scenarios, excluding case 7, and the light green bar includes case 7.
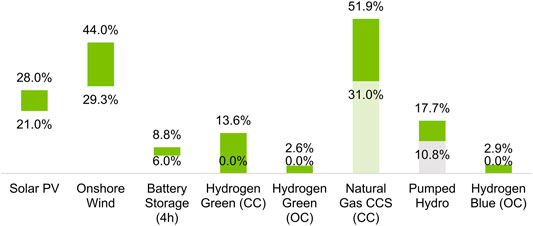
FIGURE 6. Minimum and maximum capacity factors of power generation and storage technologies for all scenarios.
In cases 10–19, battery storage is not installed because it is replaced by pumped hydro. Therefore, the CF is zero in those cases. Also, pumped hydro and hydrogen blue (CC) are not available in the first set (1–9). The minimum displayed in Figure 6 is the overall minimum of installed capacity. For cases 1–9, the CF for solar PV is between 21 and 38%, while it is 21.6–25% in cases 10–19. Onshore wind ranges between 29.3 and 34.1% in cases 1–9 and 38.1 up to 44% in cases 10–19. While solar is constant on average in both sets, onshore wind increases in the second set. The averaged CF for solar and wind here is limited by the average CF assumed in the model.
The CF of exogenous green hydrogen (CC) ranges between 3.5 and 13.6% in cases 1–9 and (OC) ranges from 0 to 2.6% (cases 10–19: CC: 0–8.4%: OC: 0–2.6%). Natural gas is between 41.7 and 51.9% in the first set, while it is lower in the second set between 31.0 and 50.6%, caused by pumped hydro and DSR. In this model, the availability of DSR leads to increasing CF for cheap solar PV, while more expensive onshore wind and natural gas CCS (CC) capacity factors are reduced. Therefore, storage options and DSR can decrease the CF of expensive power generation (lowering OPEX) and increase CF for cheaper power generation technologies. Figures for cases 1–9 and 10–19 are shown in Supplementary Material S9, S10.
Total Carbon-Dioxide Emissions and Intensities
The carbon-dioxide emissions for all cases are shown in Figure 7. The limit for the total CO2 emissions is around 2.3 million tons of system-wide CO2 emissions. As the limit is defined by generated electricity—which can be slightly different from the required annual generation of 420 TWh per year—the total allowed carbon-dioxide emissions vary. For example, case 1 already hit the carbon cap at 2.24 million tons CO2, while case 13 hit the carbon cap at 2.3 million tons CO2. Cases 4 and 9–12 are not using the full carbon budget. The reasons for this are the relations between natural gas and green hydrogen pricing and the availability of storage and DSR.
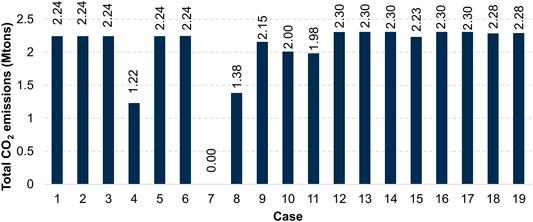
FIGURE 7. Total electric system-wide carbon-dioxide emissions for each case
For all other scenarios, the carbon budget is fully used due to cheaper fossil-based and, therefore, CO2 emitting options. Without a carbon budget, more natural gas with CCS will be installed in that model, and the emissions will increase above the carbon budget. So, the carbon cap helps integrate hydrogen as dispatchable power generation (cases 1–9), but cheaper storage options replace hydrogen in that model (10–19). In particular, case 7 is emitting no CO2 because of the high NG price of 8 $/MMBTU and low green hydrogen price of 2 $/kg. This price situation causes the installation of green hydrogen (CC and OC), avoiding natural gas CCS (CC). Case 7 was created to force the model into a fully renewable system and included for sensitivity.
Figure 8 illustrates the carbon intensity of each case and the limit of 5.3 tCO2/GWh. The limit is essential for the shadow carbon price in chapter 3.6 because reaching the limit of 5.3 tCO2/GWh of the carbon intensity causes a carbon pricing for not exceeding the limit.
Total Cost
Figure 9 shows each case's total costs split up into fixed, variable, and nonserved energy. Figure 10 illustrates the normalized costs.
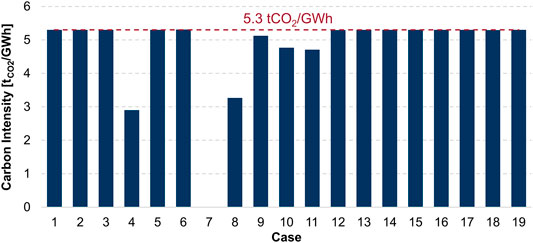
FIGURE 8. Carbon intensity and carbon intensity limit for each case
The main cost driver is the fixed costs, at an average of 14.9 billion dollars (83%). Overall, nonserved energy and start-up costs are low, at a maximum of 0.26 billion dollars (3%) in case 15 and 0.44 billion dollars (2%) in case 19. Variable cost is, on average, 2.9 billion dollars (16%).
The total costs of the first set (1-9) are from 18.1 to 21.0 billion dollars, while those of the second set (10-19) are lower in general at 15.9-17.8 billion dollars. The availability of pumped hydro storage and demand-side response reduces the fixed and variable costs immensely. The fixed costs in cases 1–9 are 14.8–16.7 billion dollars, at an average of 16 billion dollars. The variable costs are 2.6 (case 7) to 4.4 billion dollars (case 9). Case 7 without CO2-emitting power generation has low fuel cost (only green hydrogen) and a high share of renewables (see Figure 2). As shown in Figure 2, pumped hydro storage causes an expansion of cheaper solar PV, instead of more expensive onshore wind, while serving the demand and providing a higher share of renewables. The combination of solar PV and pumped hydro storage leads to a cost reduction in the system.
In cases 12, 14, and 16, DSR leads to a cost reduction of 0.6 billion dollars. In case 18, the cost reduction with DSR is 1.2 billion dollars compared to case 19. The absence of blue and green hydrogen has a bigger effect on case 19 (without DSR) than on case 18. However, DSR also causes the costs of nonserved energy.
In some cases, it is cheaper for the model to accept the penalty for NSE when DSR is available than to install green hydrogen. More blue hydrogen and natural gas are not possible in cases 12, 14, and 16 because the carbon intensity limit is already reached. Furthermore, DSR increases the capacity factor of solar PV and decreases the capacity factor of more expensive power generation like onshore wind. This fact reduces the fixed costs, which causes the difference between the even and uneven cases.
In cases 10–19, the natural gas price is always low at 4 $/MMBTU. Therefore, the prices for even and uneven cases are stable at 16.1 and 16.7 billion dollars, except for cases 10 and 19. Regarding Figure 2, hydrogen green (CC) is only installed in cases 10 and 11. Supplementary Material S11 summarizes detailed data of the costs.
Shadow Carbon Price
Shadow carbon price (SCP) is a concept that helps companies reduce future regulatory uncertainty by allowing them to anticipate the potential carbon cost to their business. For governments, the SCP helps understand the impact on specific, carbon-intensive industries, as well as on economic activity in general. Furthermore, the SCP can be used to avoid damage to specific industrial sectors by calculating the impact of a carbon price. The SCP allows investigation into the impacts of business models before regulations are reinforced.
To conclude, companies and governments can use the SCP to design a moderate transition (García, 2018). The shadow carbon price shown here is the marginal abatement cost, which describes the cost of reducing a ton CO2.
In this model, the shadow carbon price represents the minimum carbon price that accepts the carbon budget as an insurmountable limit for the power sector exclusively. This simplification is problematic (the actual CO2 price will correspond to the marginal CO2 abatement cost of—in theory—the whole economy; thus, the SCP shown in this section does not represent an estimate of the potential future economy-wide CO2 price). Our model does not allow a penalty for exceeding the given carbon budget. Therefore, the calculated SCP represents the breakeven price of CO2 for no carbon-emitting and carbon-emitting technologies.
The carbon prices shown are calculated in combination with the installed power generation in Figure 2 and the total annual generation in Figure 4. Therefore, the carbon price here can be understood as the minimum cost for not exceeding the carbon intensity limit. Without the carbon price in some cases, the model would pick cheaper options with more carbon emissions. In this model, the carbon price correlates with installed natural gas CCS (CC) capacity. The higher the installed capacity of emitting power generation, the higher is the shadow carbon price. Furthermore, the shadow carbon price can be understood to compensate for the additional cost of avoiding natural gas CCS (CC) in that model. The shadow carbon price is shown in Figure 11.
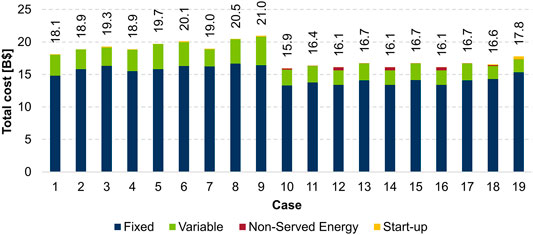
FIGURE 9. Fixed, variable, nonserved energy, start-up, and total cost for each case in billion dollars.
Regarding Figure 8 in all cases that are entirely using the carbon budget in their power generation configuration have a carbon price. Cases 1–9, no storage options, blue hydrogen, or DSR is available; therefore, the carbon price is directly dependent on the price of natural gas and green hydrogen. In cases 1–3, the natural gas price is constant at 4 $/MMBTU, while the green hydrogen price is 2, 4, and 6 $/kg respectively. The higher the price of green hydrogen assumed, the more the model tends to use natural gas, instead of hydrogen; but the carbon budget limits the installation of more natural gas. In particular, in case 3, the SCP is high at 771 $/tCO2 because no storage options or DSR are available, natural gas is cheap at 4$/MMBTU, and green hydrogen is assumed to be relatively expensive at 6 $/kg. So, the model tends to favor natural gas for its dispatchable power generation, instead of green hydrogen. The installed power for natural gas CCS (CC) is the second highest in all runs at 18 GW. The highest installed power is in case 19 at 25 GW, because green hydrogen and blue hydrogen are not available. Therefore, only natural gas CCS (CC) can be used as a dispatchable power generation source.
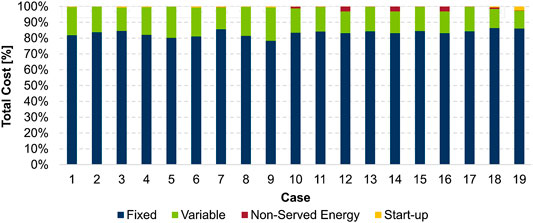
FIGURE 10. Normalized total cost for the different cases in billion dollars.
Cases 4 and 7–10 do not fill the carbon budget with the configured power generation, so no carbon price is required. Case 4 does not hit the carbon cap, because the natural gas price is high at 8 $/MMBTU and the green hydrogen price is low at 2 $/kg. Case 7 is a fully renewable case without any CO2 emissions. In cases 8–10, the natural gas price is high at 8 $/MMBTU, which makes green hydrogen an economically viable option without having a carbon price. In cases 12 to 19, the pattern between the even and uneven cases is visible. In the cases with an even number, DSR is an available option. Therefore, DSR cuts the SCP by half in this model and is a viable alternative to storage. Case 19 has a high SCP at 409 $/tonCO2 because green and blue hydrogen and DSR are not available. Case 18 has the same settings, but with DSR.
The limit for annual power generation for natural gas (i.e., CCGT/OCGT with CCS) is 15% due to the carbon cap. The carbon price is dependent on the costs of dispatchable power generation, fuel costs, and fuel carbon intensity. In a highly regenerative power generation grid, at a share of up to 74% in this model, the carbon price is mainly defined by the dispatchable power systems.
Further Analysis
Onshore Wind Curtailment
For further analysis, the wind curtailment is briefly analyzed for scenario 12. The available capacity factor for every hour of the wind profile is compared with the actual capacity factor at that particular time. The actual capacity factor is calculated from the installed power and the current power generation at that moment. Figure 12 shows the difference between the wind profile's available capacity factor and the current capacity factor of onshore wind.
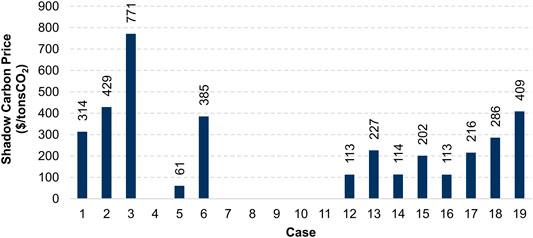
FIGURE 11. Shadow carbon price for the different cases.
For scenario 12, onshore wind produced 157 TWh electricity, while overall, 29.7 TWh is curtailed, which is a share of 18.9%. For 1,645 h of the considered year, onshore wind electricity is curtailed by the model; while for 1,379 h, the curtailment (difference) is higher than 10%. The curtailment curve is shown in Figure 12. The ordinate shows the difference between the available CF and the current CF at that moment, which are sorted by value (high to low) for the considered year.
From this overall perspective, curtailed electricity has enormous potential for low-carbon hydrogen production. In particular, the utilization of that green electricity for hydrogen production might be relevant in sector coupling and in using that hydrogen as a feedstock. This utilization might be a great opportunity, but it is also much more complicated, as it seems from this perspective.
Figure 13 illustrates the curtailment of onshore wind for the considered year. The values shown on the abscissa is the time in hours for the considered year (from January to December). The ordinate shows the difference between the available CF and the current CF at that moment. The higher the value, the more electricity from onshore wind is curtailed. If the available CF is fully curtailed, the relative share between available and current CF must be considered. The relative share of available and current CF is shown in Supplementary Material S12.
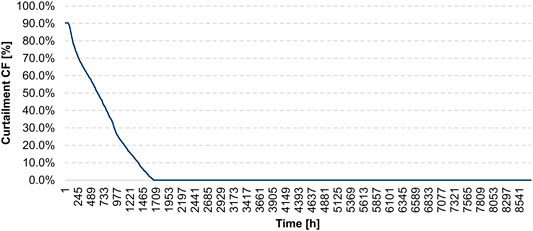
FIGURE 12. Curtailment of onshore wind, the difference between available CF and current CF for the considered year (sorted by value).
Solar PV Curtailment
Solar PV produced 199 TWh electricity, while overall, 52.2 TWh is curtailed, which is a share of 33.2%. For 1957 h of the considered year, solar PV electricity is curtailed by the model. The curtailment curves are shown in Supplementary Material S12, S13.
Utilization of Curtailment Electricity From Renewables
The availability of curtailment electricity from onshore wind and solar PV is “peaky.” Utilizing that electricity is complex. Batteries are technically feasible to deal which such a storing profile, but the capacity is still expensive. The model installs a certain amount of battery storage, but in many cases, it is economically more viable for the model to curtail (under the given conditions). When the onshore wind is curtailed, one possible situation is that the load will be relatively low in the model for a specific time frame, solar PV generation will be high, and battery capacity will have already charged.
Furthermore, if shutdown and start-up costs for CCGT/OCGT turbines are higher than the fuel and operation costs of these turbines, the low-cost electricity of onshore wind is curtailed. The curtailment is the most economical option to avoid overgeneration of electricity in the system. If the model curtails onshore wind or solar PV, it is dependent on the economic situation at that specific time frame. In reality, this creates an imbalance of generation and load. Consequently, the net frequency rises, leading to a destabilization of the grid and, in the worst case, a black-out.
The analysis and interpretation of that data are not trivial and can be easily misinterpreted. More analysis and research in that direction must be done, in particular in terms of sector coupling. The result suggests that a high CF of an electrolyzer can hardly be realized only with curtailment electricity. Additional amounts of (renewable) power generation must be derived for hydrogen production to realize the high CF of electrolysis. Moreover, a high CF of electrolyzers is necessary to make hydrogen production economically viable.
Furthermore, this model does not consider the location of power generation and load. The generation and demand are at the same locations, and transmission between those is not considered.
While key findings can be derived from this power system model, it has its limitations. For a full assessment and interpretation of viable options, the whole energy systems must be considered. For example, endogenous hydrogen storage is not a viable option in that model. Producing hydrogen via electrolysis from a low-carbon energy mix (in particular moments from an even fully renewable grid) as feedstock for industrial purposes might be relevant and is not considered here. As industries have to reduce their emissions, new heating technologies and chemical feedstock sources will gain importance.
Hydrogen Storage Reference Scenario
Furthermore, a reference case is created to force the model into endogenous hydrogen storage. Therefore, we shut down the options for nuclear, CCGT CCS, CCGT hydrogen (exogenous), and OCGT hydrogen (exogenous) for generation and battery storage (1 and 4 h) and pumped hydro as storage. Only onshore wind, offshore wind, solar PV, and endogenous hydrogen storage are available for the model. The results are summarized in Table 2.
The model installs 131.8 GW of onshore wind, 15.2 GW of offshore wind, and 91.9 GW of solar PV in that case for generation. Further, endogenous hydrogen storage OCGT is installed at 60.2 GW. The total installed capacity is 299 GW and, therefore, much higher than that in other cases. This scenario shows the reason why hydrogen is not chosen in other scenarios. The assumed round trip efficiency of 37.6% is relative compared to other storage options.
Furthermore, the model tends to install more solar PV, onshore wind, and even offshore wind, which has not been installed in former scenarios. The installed hydrogen storage capacity, which accounts for 20% of the total capacity, only accounts for 2% of the total power generation. The hydrogen storage option is used for 801 h in total while utilized for 684 h at about 10% of the power. The scenario has no carbon emissions since it is entirely renewable. This scenario's total costs are 31.8 billion dollars, which is 44% higher than the average costs of the former scenarios. The charging curve is shown in Supplementary Material S15.
This model assumes no charging and discharging constraints in terms of the ramp-up speed of the electrolyzer. Figure 14 illustrates the charging power during the assumed year. On average, the storage is, if used, charged at 36% (21,6 GW) of its installed capacity.
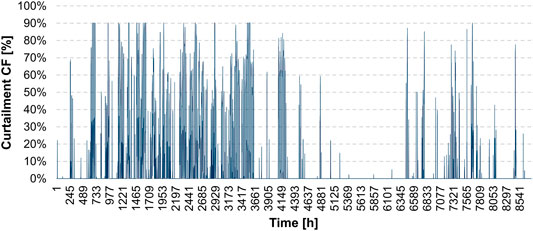
FIGURE 13. Curtailment of onshore wind, the difference between available CF and current CF for the considered year
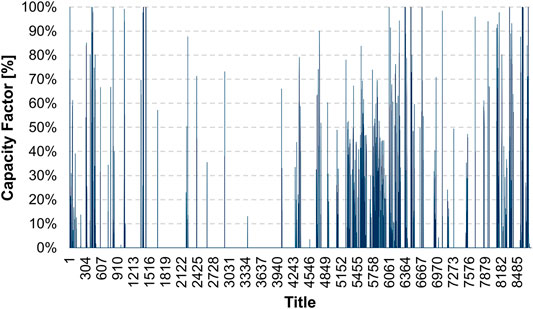
FIGURE 14. Charging power of hydrogen OCGT storage vs. time
More visualizations of the discharging power, installed capacity, annual power generation, and total cost are shown in Supplementary Material S16–18. The hydrogen storage reference scenario is named “case 0.”
Conclusion
A deeply decarbonized power grid requires a very high share of variable renewable energy sources. Solar PV and wind are already cost-competitive to fossil fuels in some cases, but carbon pricing will be required to overcome a certain market penetration of Solar PV and wind power for decarbonization. The power system requires dispatchable generation and/or massive grid storage options to stabilize the grid.
For meeting the Paris Agreement goals, this dispatchable power generation must be partly or fully low carbon. Green and blue hydrogen–based capacity can play a role but must compete with natural gas with CCS, biomass, nuclear, storage options (as hydro pumped storage or batteries), and depending on the location, of conventional hydroelectric. Furthermore, interconnections with neighboring markets, storage options, and DSR can reduce the installation of extra generation capacity.
The role of hydrogen in the future energy systems is hard to predict, but under given conditions and market projections, the power to hydrogen option for energy storage is not cost-competitive with the cost of electrolysis in 2050. The modeling results of this study suggest that alternative available energy storage options are always deployed before the electrolytic endogenous hydrogen storage route (under given conditions). Therefore, power to hydrogen cannot be regarded as the most promising flexibility resource for the electric system, and alternative options should be available and feasible. Therefore, a market-by-market approach is needed, with regard to the potential role of hydrogen in the power sector.
The presented results are based on economic cost optimization, and the feasibility in the real world must be carefully considered. Large-scale resource provision and recycling for batteries, locations, and societal acceptance of CCS, pumped hydro, or onshore wind and solar PV are just some underestimated, potentially limiting factors. Large-scale energy storage will be necessary to decarbonize the energy grid, but most of the introduced storage options will be confronted with the aforementioned problems. Hydrogen will not be economically viable on a large in electric power systems with today's projections, but it is a feasible, especially, under consideration of inter-sectoral connection. Hydrogen can be (relatively easily) stored on a large scale in gas vessels or salt caverns for the long term and in high capacities, which is only possible today with pumped hydro or fossil energy carriers.
This model is limited in many dimensions. These limitations must be considered to understand the results and derive findings. The simulation only considers one year, so it is not looking into seasonal differences of wind, solar, and load profiles. Furthermore, locations of power generation plants and loads are not simulated (no losses by transmitting electricity via grid). In general, the grid structure is not considered. The grid stability is another important factor which is to be ignored, and no backup generation is installed in times of failing infrastructure (technical issues, natural catastrophes). The model focused on power systems, not the entire energy system. Sectoral interconnections will gain more importance, which is a limitation of the model.
A key result of this model is that endogenously produced hydrogen under given conditions is always more costly than importing hydrogen for the assumed price ranges. In reality, hydrogen must be produced somewhere. It is economically viable if certain countries can produce hydrogen at a less cost-intensive price (high solar radiation and cheap access to water and hydropower plants) and export to other countries. The local conditions (accessible water supply, wind and solar availability, and land) are high costs for the price structure of exportable hydrogen. Curtailment of electricity from wind and solar PV will not be sufficient to serve electrolyzers alone (low capacity factors of electrolyzers, no steady supply, and low efficiency). Furthermore, dedicated renewables are needed to ensure high utilization factors and lower hydrogen prices.
In conclusion, the future electric power system requires a plethora of technology options to balance the variable renewable energy sources. With current cost trends and projections, hydrogen storage is not competitive with alternative solutions as the deployment and generation in the explored cases are minimal for the power system.
However, hydrogen can play a key role as a versatile energy carrier in the energy system, most obviously in its supply to hard-to-abate sectors. Potential multisectoral use of hydrogen (e.g., as a decarbonized feedstock, for specific high-temperature industrial processes) can lower its cost as the investment for the entire value chain will be shared with other sectors. In particular, infrastructure costs for hydrogen (electrolyzer, piping, and truck distribution) can be allocated and shared with other sectors, similar to the natural gas grid. Sector coupling will change the cost and investment structure for hydrogen completely and will be different from what is shown in that model.
With industrial emission constraints [see “Europeans Green Deal” (European Commission, 2019)], renewable or low-carbon hydrogen produced with electricity from the grid can become an economically viable option for many industries as a feedstock as those industries have to reduce their emissions on the long term.
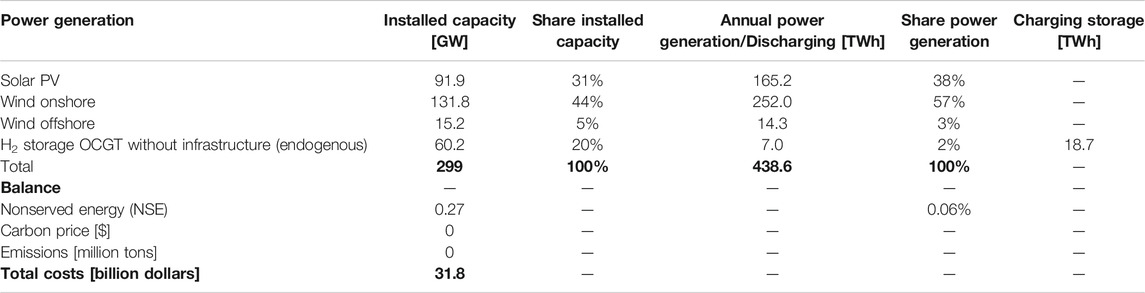
TABLE 2. Summary of results for hydrogen storage scenario.
Data Availability Statement
The original contributions presented in the study are included in the article/Supplementary Material, further inquiries can be directed to the corresponding author.
Author Contributions
EG: Conceptualization, methodology, formal analysis, supervision, reviewing, and editing the manuscript. MS: Methodology, software, formal analysis, and writing the original draft. IR: Formal analysis. AB: Formal analysis
Funding
Iberdrola, MIT Energy Initiative Low-Carbon Energy Centers.
Conflict of Interest
The authors declare that the research was conducted in the absence of any commercial or financial relationships that could be construed as a potential conflict of interest.
Supplementary Material
The Supplementary Material for this article can be found online at: https://www.frontiersin.org/articles/10.3389/fenrg.2020.585461/full#supplementary-material
Abbreviations
CAPEX, capital expenditures; CC, combined cycle (gas turbine); CCS, carbon capture and sequestration; CF, capacity factor; CO2, carbon dioxide; DSR, demand-side response; EU, European Union; ERCOT, Electric Reliability Council of Texas; GT, gas turbine; GW, gigawatt; GWh, gigawatt-hour; H2, hydrogen; kW, kilowatt; MMBTU, million British thermal unit; MWh, megawatt-hour; N, no; NG, natural gas; OC, open cycle (gas turbine); PV, photovoltaic; SCP, shadow carbon price; t, ton; TWh, terawatt-hour; Y, yes; yr., year
References
Bennoua, S., Le Duigou, A., Quéméré, M.-M., and Dautremont, S. (2015). Role of hydrogen in resolving electricity grid issues. Int. J. Hydrogen Energy 40, 7231–7245. doi:10.1016/j.ijhydene.2015.03.137
Brey, J. J. (Forthcoming 2020). Use of hydrogen as a seasonal energy storage system to manage renewable power deployment in Spain by 2030. Int. J. Hydrogen Energy. doi:10.1016/j.ijhydene.2020.04.089
Buttler, A., and Spliethoff, H. (2018). Current status of water electrolysis for energy storage, grid balancing and sector coupling via power-to-gas and power-to-liquids: a review. Renew. Sustain. Energy Rev. 82, 2440–2454. doi:10.1016/j.rser.2017.09.003
Child, M., Bogdanov, D., and Breyer, C. (2018). The role of storage technologies for the transition to a 100% renewable energy system in Europe. Energy Procedia 155, 44–60. doi:10.1016/j.egypro.2018.11.067
Child, M., Kemfert, C., Bogdanov, D., and Breyer, C. (2019). Flexible electricity generation, grid exchange and storage for the transition to a 100% renewable energy system in Europe. Renew. Energy 139, 80–101. doi:10.1016/j.renene.2019.02.077
Ercot (2019). Generation: intermittent renewable resources. Available at: http://www.ercot.com/gridinfo/generation (Accessed October 16, 2019).
Estermann, T., Newborough, M., and Sterner, M. (2016). Power-to-gas systems for absorbing excess solar power in electricity distribution networks. Int. J. Hydrogen Energy 41, 13950–13959. doi:10.1016/j.ijhydene.2016.05.278
European Commission (2018). A clean planet for all: a European Strategic long-term vision for a prosperous, modern, competitive and climate neutral economy. Brussels. Belgium: European Commission.
European Commission (2019). A European green deal: a european green deal striving to be the first climate-neutral continent. Brussels. Belgium: European CommissionAvailable at: https://ec.europa.eu/info/strategy/priorities-2019-2024/european-green-deal_en (Accessed December 19, 2020)
García, C. G. E. (2018). Shadow carbon pricing and the role of development banks. NAFIN Fellowship Programme. Working Paper No 2.
Gençer, E. (2019). MIT energy initiative spring symposium: can hydrogen become part of the climate solution? hydrogen towards deep decarbonization. Cambridge, MA: MIT Energy Initiative.
Glenk, G., and Reichelstein, S. (2019). Economics of converting renewable power to hydrogen. Nat Energy 4, 216–222. doi:10.1038/s41560-019-0326-1
Guinot, B., Montignac, F., Champel, B., and Vannucci, D. (2015). Profitability of an electrolysis based hydrogen production plant providing grid balancing services. Int. J. Hydrogen Energy 40, 8778–8787. doi:10.1016/j.ijhydene.2015.05.033
Gutiérrez-Martín, F., Ochoa-Mendoza, A., and Rodríguez-Antón, L. M. (2015). Pre-investigation of water electrolysis for flexible energy storage at large scales: the case of the Spanish power system. Int. J. Hydrogen Energy 40, 5544–5551. doi:10.1016/j.ijhydene.2015.01.184
Haller, M., Ludig, S., and Bauer, N. (2012). Decarbonization scenarios for the EU and MENA power system: considering spatial distribution and short term dynamics of renewable generation. Energy Pol. 47, 282–290. doi:10.1016/j.enpol.2012.04.069
Jenkins, J. D., and Sepulveda, N. A. (2017). Enhanced decision support for a changing electricity landscape: the genx configurable electricity resource capacity expansion model. Cambridge, MA: MIT Energy Initiative.
Krakowski, V., Assoumou, E., Mazauric, V., and Maïzi, N. (2016). Feasible path toward 40–100% renewable energy shares for power supply in France by 2050: a prospective analysis. Appl. Energy 171, 501–522. doi:10.1016/j.apenergy.2016.03.094
Lazard, (2018a). Lazard’s levelized cost of storage analysis: Version 4.0. Hamilton, Bermuda: Lazard.
Lund, P. D., Lindgren, J., Mikkola, J., and Salpakari, J. (2015). Review of energy system flexibility measures to enable high levels of variable renewable electricity. Renew. Sustain. Energy Rev. 45, 785–807. doi:10.1016/j.rser.2015.01.057
Mallapragada, D. S., Gençer, E., Insinger, P., Keith, D. W., and O’Sullivan, F. M. (2020a). Can industrial-scale solar hydrogen supplied from commodity technologies Be cost competitive by 2030? Cell Rep. Phys. Sci. 1, 100174. doi:10.1016/j.xcrp.2020.100174
Mallapragada, D. S., Sepulveda, N. A., and Jenkins, J. D. (2020b). Long-run system value of battery energy storage in future grids with increasing wind and solar generation. Appl. Energy 275, 115390. doi:10.1016/j.apenergy.2020.115390
Nastasi, B., Lo Basso, G., Astiaso Garcia, D., Cumo, F., and de Santoli, L. (2018). Power-to-gas leverage effect on power-to-heat application for urban renewable thermal energy systems. Int. J. Hydrogen Energy 43, 23076–23090. doi:10.1016/j.ijhydene.2018.08.119
NREL (2019). Wind integration data sets: eastern and western wind integration data sets. Available at: https://www.nrel.gov/grid/wind-integration-data.html (Accessed October 16, 2019).
Petkov, I., and Gabrielli, P. (2020). Power-to-hydrogen as seasonal energy storage: an uncertainty analysis for optimal design of low-carbon multi-energy systems. Appl. Energy 274, 115197. doi:10.1016/j.apenergy.2020.115197
Pfenninger, S., and Keirstead, J. (2015). Renewables, nuclear, or fossil fuels? Scenarios for Great Britain's power system considering costs, emissions and energy security. Appl. Energy 152, 83–93. doi:10.1016/j.apenergy.2015.04.102
Schiebahn, S., Grube, T., Robinius, M., Tietze, V., Kumar, B., and Stolten, D. (2015). Power to gas: technological overview, systems analysis and economic assessment for a case study in Germany. Int. J. Hydrogen Energy 40, 4285–4294. doi:10.1016/j.ijhydene.2015.01.123
Sepulveda, N. A., Jenkins, J. D., de Sisternes, F. J., and Lester, R. K. (2018). The role of firm low-carbon electricity resources in deep decarbonization of power generation. Joule 2, 2403–2420. doi:10.1016/j.joule.2018.08.006
Sisternes, F. J. de., Jenkins, J. D., and Botterud, A. (2016). The value of energy storage in decarbonizing the electricity sector. Appl. Energy 175, 368–379. doi:10.1016/j.apenergy.2016.05.014
Weidner, S., Faltenbacher, M., François, I., Thomas, D., Skùlason, J. B., and Maggi, C. (2018). Feasibility study of large scale hydrogen power-to-gas applications and cost of the systems evolving with scaling up in Germany, Belgium and Iceland. Int. J. Hydrogen Energy 43, 15625–15638. doi:10.1016/j.ijhydene.2018.06.167
Keywords: hydrogen, storage, electric power systems, capacity expansion, decarbonization
Citation: Schulthoff M, Rudnick I, Bose A and Gençer E (2021) Role of Hydrogen in a Low-Carbon Electric Power System: A Case Study. Front. Energy Res. 8:585461. doi: 10.3389/fenrg.2020.585461
Received: 20 July 2020; Accepted: 09 November 2020;
Published: 14 January 2021.
Edited by:
Xiao-Yu Wu, University of Waterloo, CanadaReviewed by:
Marco Miotti, Stanford University, United StatesHaitao Zhao, Chinese Academy of Sciences (CAS), China
Copyright © 2021 Schulthoff, Rudnick, Bose and Gençer. This is an open-access article distributed under the terms of the Creative Commons Attribution License (CC BY). The use, distribution or reproduction in other forums is permitted, provided the original author(s) and the copyright owner(s) are credited and that the original publication in this journal is cited, in accordance with accepted academic practice. No use, distribution or reproduction is permitted which does not comply with these terms.
*Correspondence: Emre Gençer, egencer@mit.edu