Zebrafish Melanophores Suggest Novel Functions of Cell Chirality in Tissue Formation

Graduate School of Frontier Biosciences, Osaka University, Yamadaoka 1-3, Suita, Osaka 565-0781, Japan
*
Author to whom correspondence should be addressed.
Symmetry 2021, 13(1), 130; https://doi.org/10.3390/sym13010130
Submission received: 1 November 2020
/
Revised: 14 December 2020
/
Accepted: 8 January 2021
/
Published: 13 January 2021
(This article belongs to the Special Issue Left-Right Asymmetry in Cell Biology)
Abstract
:Several types of cells show left–right asymmetric behavior, unidirectional rotation, or spiral movements. For example, neutrophil-like differentiated HL60 (dHL60) cells show leftward bias in response to chemoattractant. Neurons extend neurites, creating a clockwise spiral. Platelet cells shows unidirectional spiral arrangements of actin fibers. In the microfabricated culture environment, groups of C2C12 cells (mouse myoblast cell line) were autonomously aligned in a counter-clockwise spiral pattern, and isolated C2C12 cells showed unidirectional spiral pattern of the actin skeleton. This biased directionality suggested that these cells have inherent cell chirality. In addition to these cells, we recently found that melanophores of zebrafish also have an intrinsic cellular chirality that was shown by their counter-clockwise self-rotation. Although this cell chirality is obvious, the function of the cell chirality is still unclear. In this review, we compare the cell chirality of melanophores of zebrafish with other cell chirality and consider the function of cell chirality in morphogenesis.
1. Introduction
Various cells have been reported to have left–right asymmetricity. Some cells have asymmetric intracellular structure. For example, when human platelet cells attach and spread on the glass surface, their cytoskeleton proteins such as actin and vinculin arrange in a left hand spiral [1]. Similar spiral arrangement of actin cytoskeleton was also reported in C2C12 cells (mouse myoblast cell line), which were cultured in the small adhesive island [2]. Cellular left–right asymmetry is not restricted only to intracellular structure. In the microfabricated culture environment, groups of C2C12 cells were autonomously aligned in a counter-clockwise spiral pattern [3]. When neurons extend neurites, the neurites turn rightward on a poly-lysine coated dish [4,5]. As a consequence, extended neurites become a clockwise spiral. Furthermore, left–right asymmetry was also observed in the cell behavior. On the tip of the neurites, there is a structure called growth cone. The growth cone filopodia rotate in the right-screw direction during elongation. The right-screw rotation causes the above mentioned rightward turning of neurites [5]. As another example of left–right asymmetry in the cell behavior, chemotaxis of neutrophil-like differentiated HL60 (dHL60) cells was reported. dHL60 cells showed the strong leftward bias in the chemotaxis in response to chemoattractant, f-Met-Leu-Phe (fMLP) [6]. These examples suggest that cells have inherent chirality.
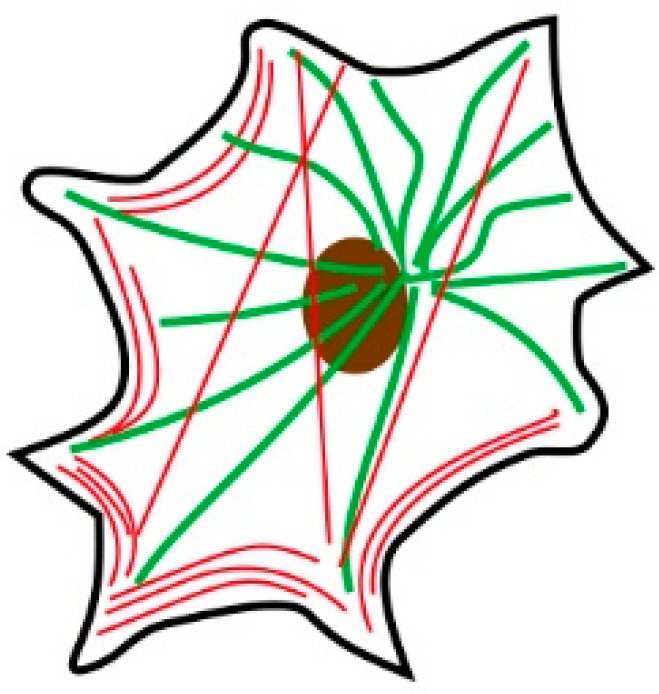
In many cases, the cell chirality depends on the cytoskeleton, such as actin fibers and microtubules. Most actin fibers localize at cell periphery, and some actin fibers are across a cell as stress fibers (Figure 1). Microtubules extend radially from the center of the cell. Actin fibers are involved in cell movement or cell deformation, while microtubules are involved in intracellular transportation and cilia movement. Actin fibers are constituted with actin monomer protein, while microtubules are constituted with tubulin proteins. Depolymerization of the cytoskeleton with some drugs leads to the loss of cell chirality [5,6]. Because most biomolecules have chirality, it is suggested that the chirality of molecules that constitute cytoskeletons brings cells chirality.
On the other hand, the physiological function of cell chirality is unobvious. In some cases, cell chirality is related to the left–right asymmetry of a body plan. For example, early mouse embryo have a pit structure called a “node” at the distal tip. In the pit, cells have a cilium, and unidirectional beating cilia generates unidirectional flow, which generates left–right asymmetry of the embryo [7]. In Drosophila larva, cells of hindgut rotate counterclockwise that twist the hindgut dextral [8]. However, there are many variations of cell chirality that do not relate to the left–right asymmetry of a body plan. As another example of cell chirality that does not seem to relate to the left–right asymmetry, melanophores of zebrafish rotation was reported [9]. The rotation movement of melanophores has some interesting characteristics. We would like to compare the chirality of zebrafish melanophore to other examples of cell chirality to discuss the physiological function of cell chirality.
2. Main
2.1. Zebrafish Melanophores Have Inherent Cellular Chirality
Zebrafish have stripes on the surface of their body. The stripes contain three types of pigment cells: black melanophores, yellow xanthophores, and reflector iridophores. These cells interact with each other during the larval stage to create the striped pattern. While interaction with iridophore is suggested as necessary for survival of melanophores and xanthophores [10,11], interaction between melanophores and xanthophores affects the pattern of pigment cells [12,13]. The interaction between melanophores and xanthophores has been shown to be controlled by gap junction and membrane potential [12,14,15]. Especially, the mutations of connexin41.8, which are a component of gap junction, have been reported to bring various pigment cell pattern phenotypes [16].
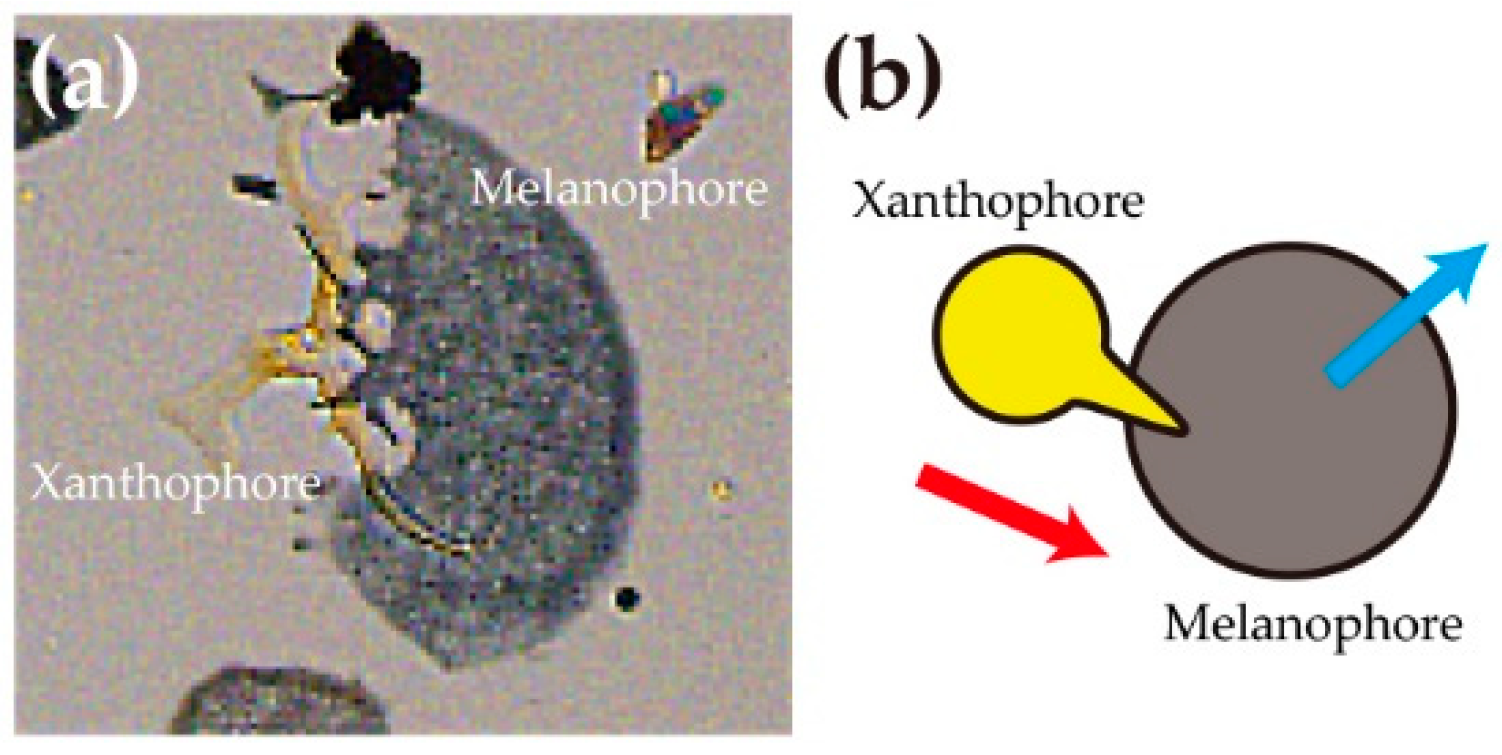
The interaction between melanophores and xanthophores was analyzed in vitro in detail [13]. When a melanophore was placed next to a xanthophore, the xanthophore extended pseudopods towards the melanophore and touched its surface. The melanophore showed repulsive movement and ran away from the xanthophores, and the xanthophore further extended pseudopods and chased the melanophore (Figure 2a). This “run and chase movement” functions as a mechanism to exclude melanophores from the xanthophore dominant region; the mechanism is assumed to lead to the separation of the yellow area and the black regions. In this run-and-chase cell interaction, the left–right directions of movements of each cell are significantly biased. When cells are observed from dish basement where cells attach, melanophores have a strong tendency to move leftward from xanthophores. On the other hand, xanthophores also have a strong tendency to move towards the right side of melanophores (Figure 2b).
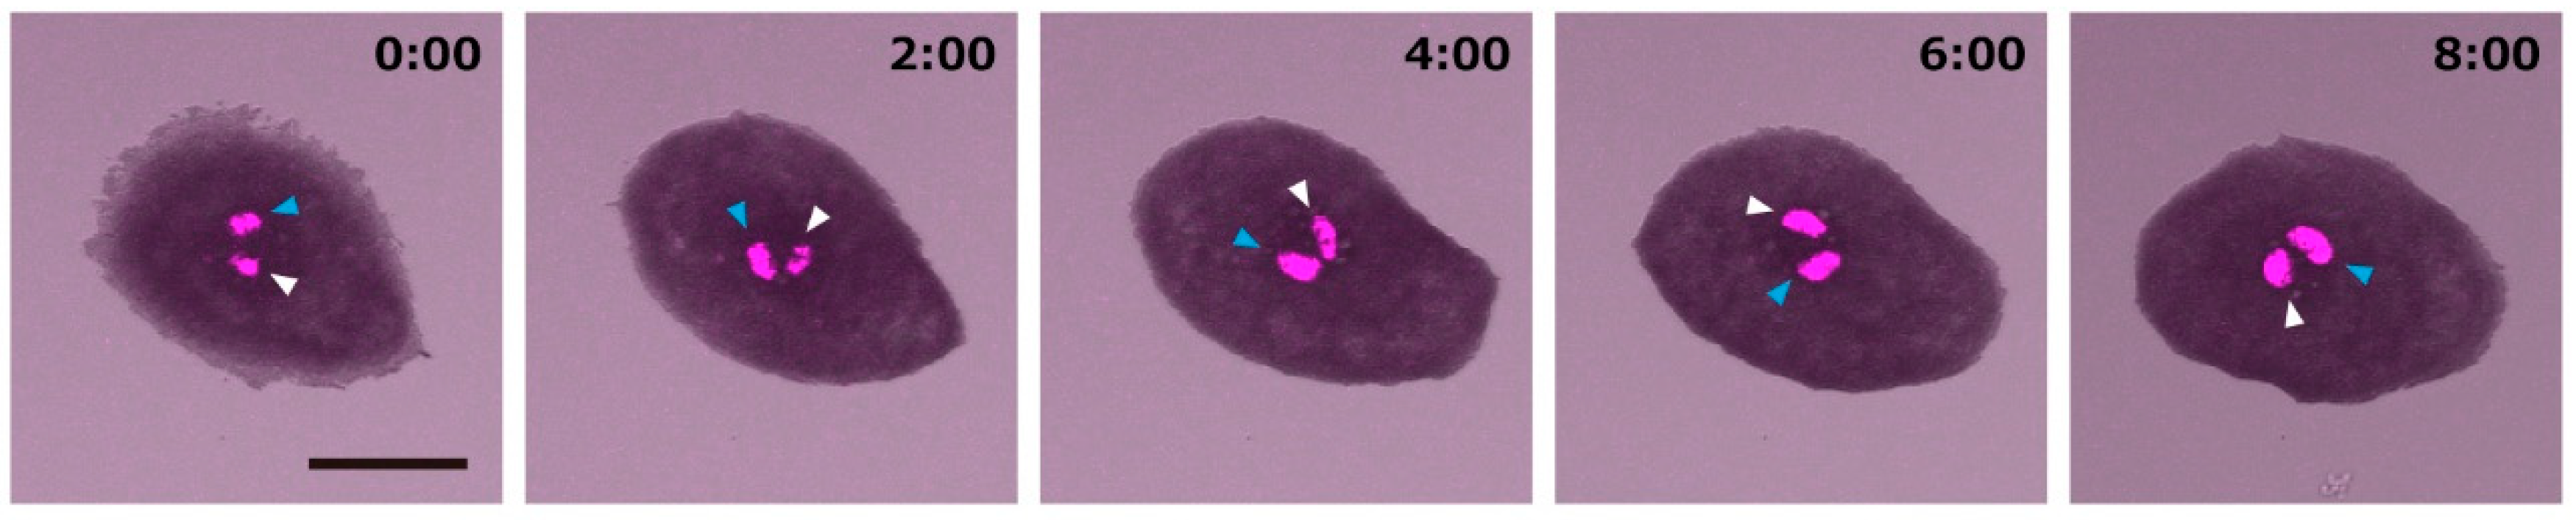
To observe the movement of the pigment cells in detail, these pigment cells were placed separately. The isolated melanophores showed counterclockwise rotation movements (Figure 3), while isolated xanthophores showed minimal movements. The counterclockwise rotation movement of melanophore is inherent to the melanophore because the direction was not changed depending on the type of basement coating (collagen, fibronectin, Poly-L-Lysine, etc.).
2.2. Rotation of Melanophores Regulated by Actin Fibers and Microtubules
It was shown that the counterclockwise rotation movements of melanophores depended on the actin fibers because treatment with cytochalasin D, which inhibits actin polymerization, ceased rotation of melanophores [13]. On the other hand, when melanophores were treated with nocodazole, which inhibits microtubule polymerization, rotation movement was accelerated. In a previous study, actin fibers were shown to be involved in the rotation movement of a growth cone of neurons [5]. The other study showed that microtubules were required in the leftward biased chemotaxis of dHL60 [6]. These studies suggested that these different cytoskeletons were involved in the regulation of cellular chirality. In a melanophore, actin fibers accumulate as a bundle, which runs along cell periphery, while microtubules extend radially from the center near the nuclei (Figure 4a). At the peripheral region, actin fibers and microtubules cross (Figure 4b). Thus, it is possible that actin fibers and microtubules competitively regulate the rotation movement of zebrafish melanophores. The hypothetical model is consistent with the previous studies that showed cytoskeleton inhibitors changed the chirality of cells [3].
2.3. The Function of Chirality of Melanophore during Pigment Pattern Formation
In some previous studies, cell chirality is suggested to be a trigger of left–right asymmetry of the body [7,8,17]. However, there are no differences in the pattern of melanophores between the left and the right side of zebrafish. The previous study of the cell arrangement on the micropatterned ring suggested that various types of cells showed their specific chirality [3]. Therefore, the cell chirality is a rather common property and may not be specific to the cells related to the asymmetric body plan.
Then, what is the physiological function of the chirality of melanophores? As mentioned above, during pigment pattern forming, zebrafish melanophores are excluded from the region dominated by xanthophores through direct interaction movement. In this exclusion, because of the chirality of melanophores, melanophores move to the leftward from xanthophores. Since all the melanophores have the same rotation chirality, all of the melanophores move to the same direction in the exclusion (Figure 5a). The uniform movement of melanophores is assumed to contribute to the parallel stripe pattern. Without the chirality, excluded melanophores would move in random directions that would induce collision between the melanophores and lead to the labyrinth-like stripe pattern (Figure 5b). In this point of view, cell chirality could affect the final pattern of pigment cell arrangement.
Isolated zebrafish melanophores showed cell chirality through their counterclockwise rotation movements. On the other hand, xanthophores do not show obvious chirality because isolated xanthophores showed little movement. However, when a xanthophore was put close to a melanophore, the xanthophore became active and moved toward the right side of the melanophore. Xanthophores become chiral only when interacting with melanophores. The acquisition of cell chirality of xanthophores suggests that cell chirality can be transmitted through the cell interactions. The different chirality between melanophores and xanthophores may also facilitate the separation between these cell groups. Recently, there are some reports that constructed mathematical models that simulate the patterning of the pigment cells [17,18,19,20]. In these models, melanophores and xanthophores are represented as agents that move independently and interact with other agents. Such simulations are considered as kinds of agent base models that are often used to simulate flocks or swarms. In agent base models, each agent behaves as responding to the surrounding condition. Agents also have their own characters, such as velocity, direction, and responding rules. These reports suggest that the chiral bias in the movement of agents affects the pattern of a group of agents.
2.4. Chirality in a Group of Cells Induces the Deformation of Tissue
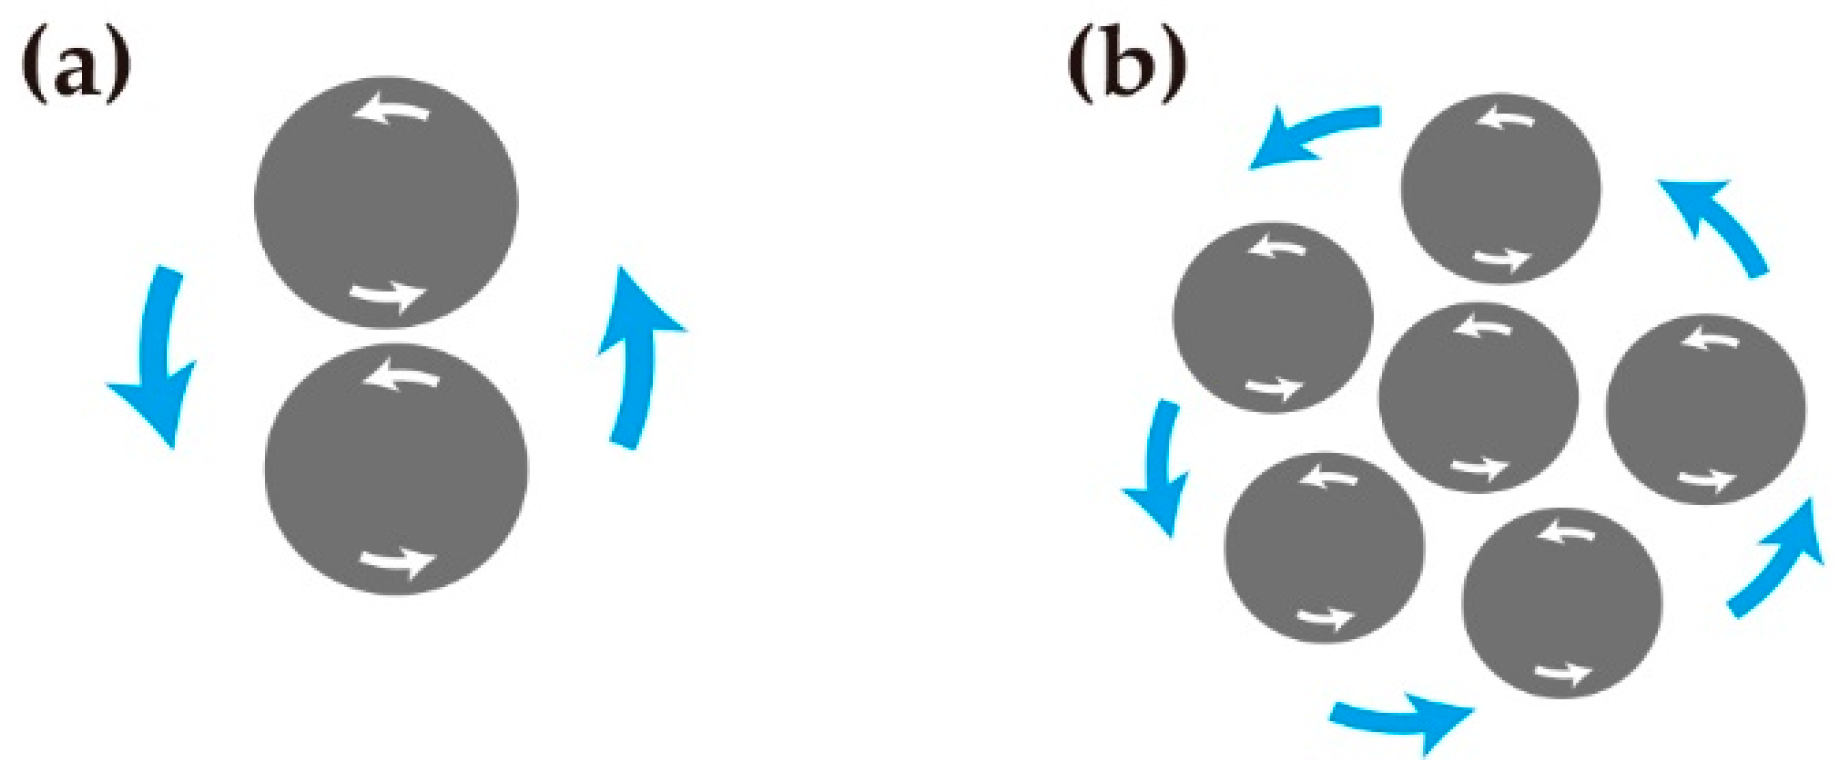
While difference in chirality between cells seems to facilitate the separation of these cells, what would be expected to happen when a group of cells have the same chirality? When two melanophores were put nearby each other, they sometimes showed rotation around each other for a while, as displayed in the drawing spiral (Figure 6a). Zebrafish melanophores were observed to have homophilic tendency in pigment patterning. The spiral movement between melanophores could be a mechanism for gathering the melanophores (Figure 6b).
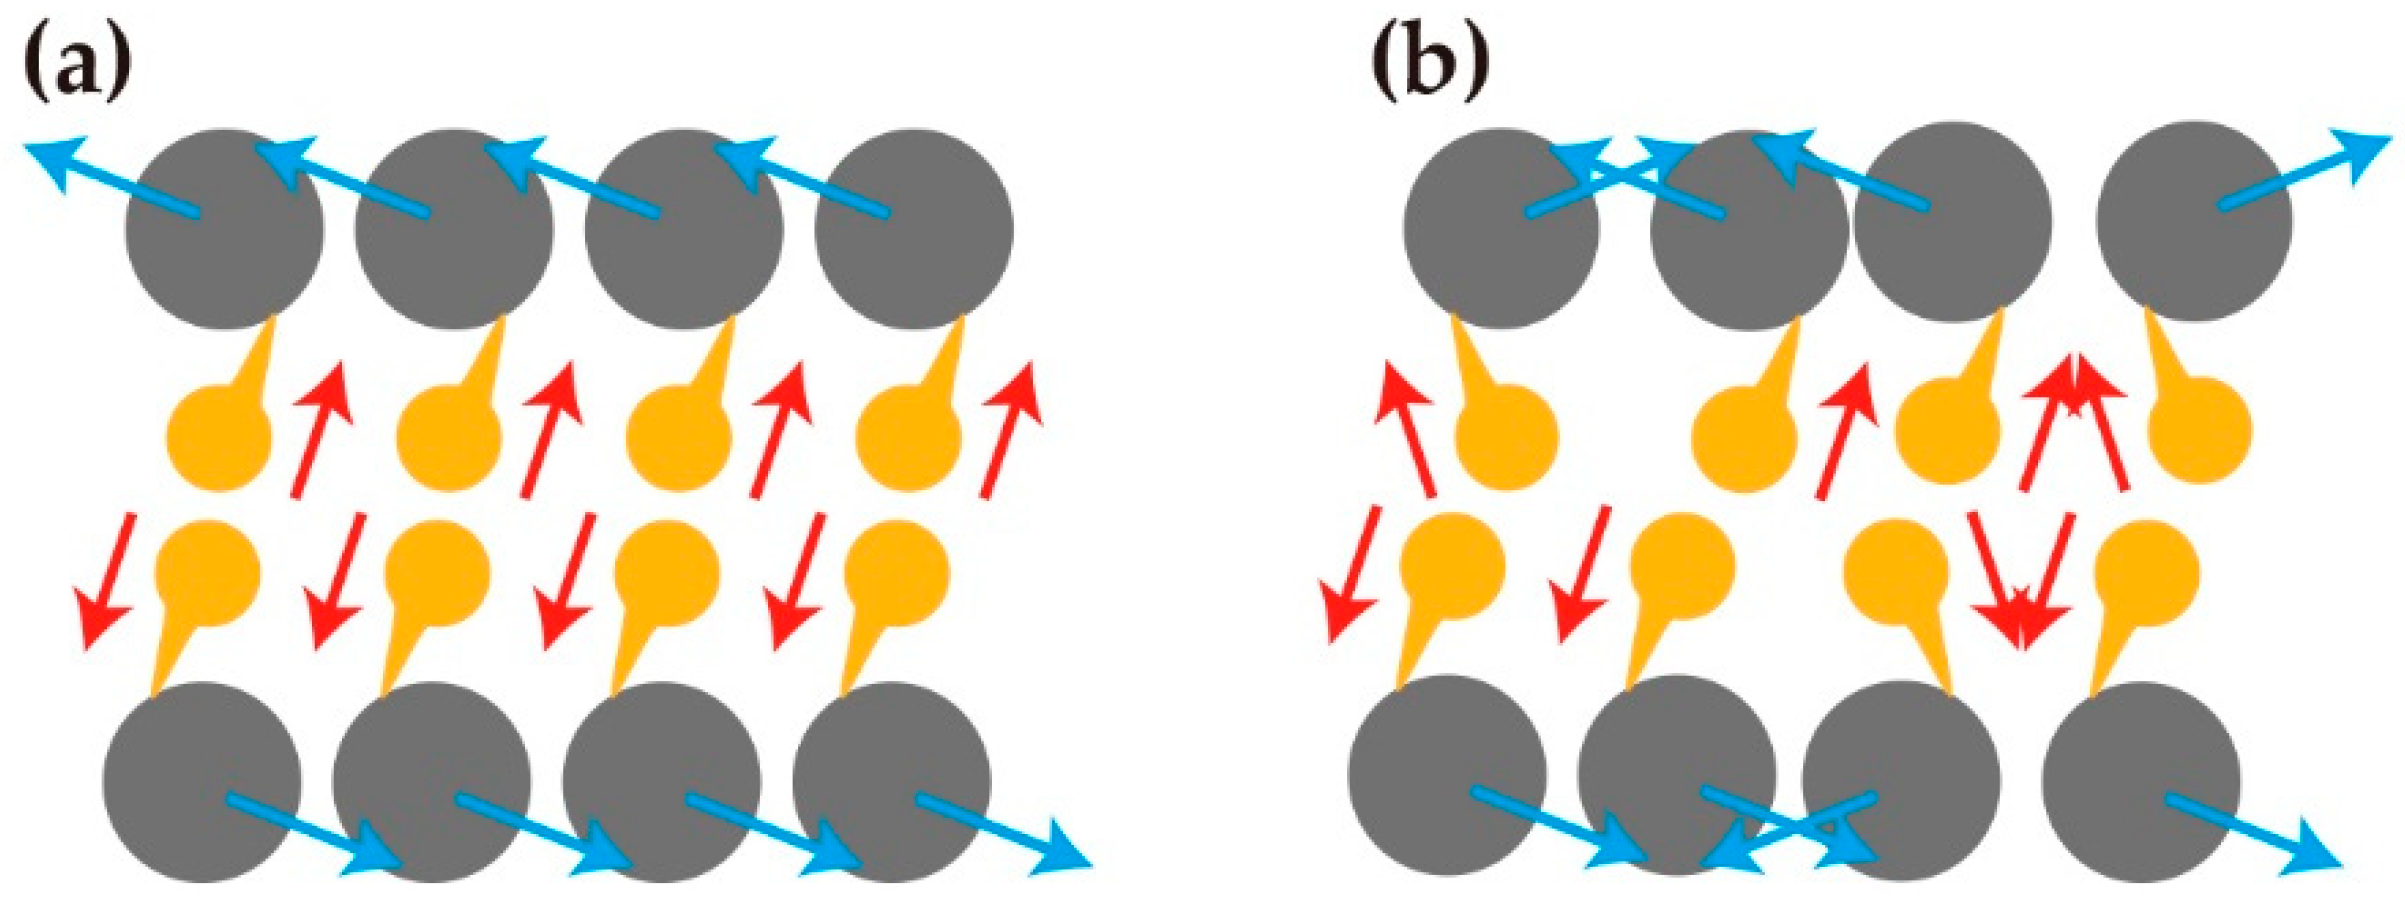
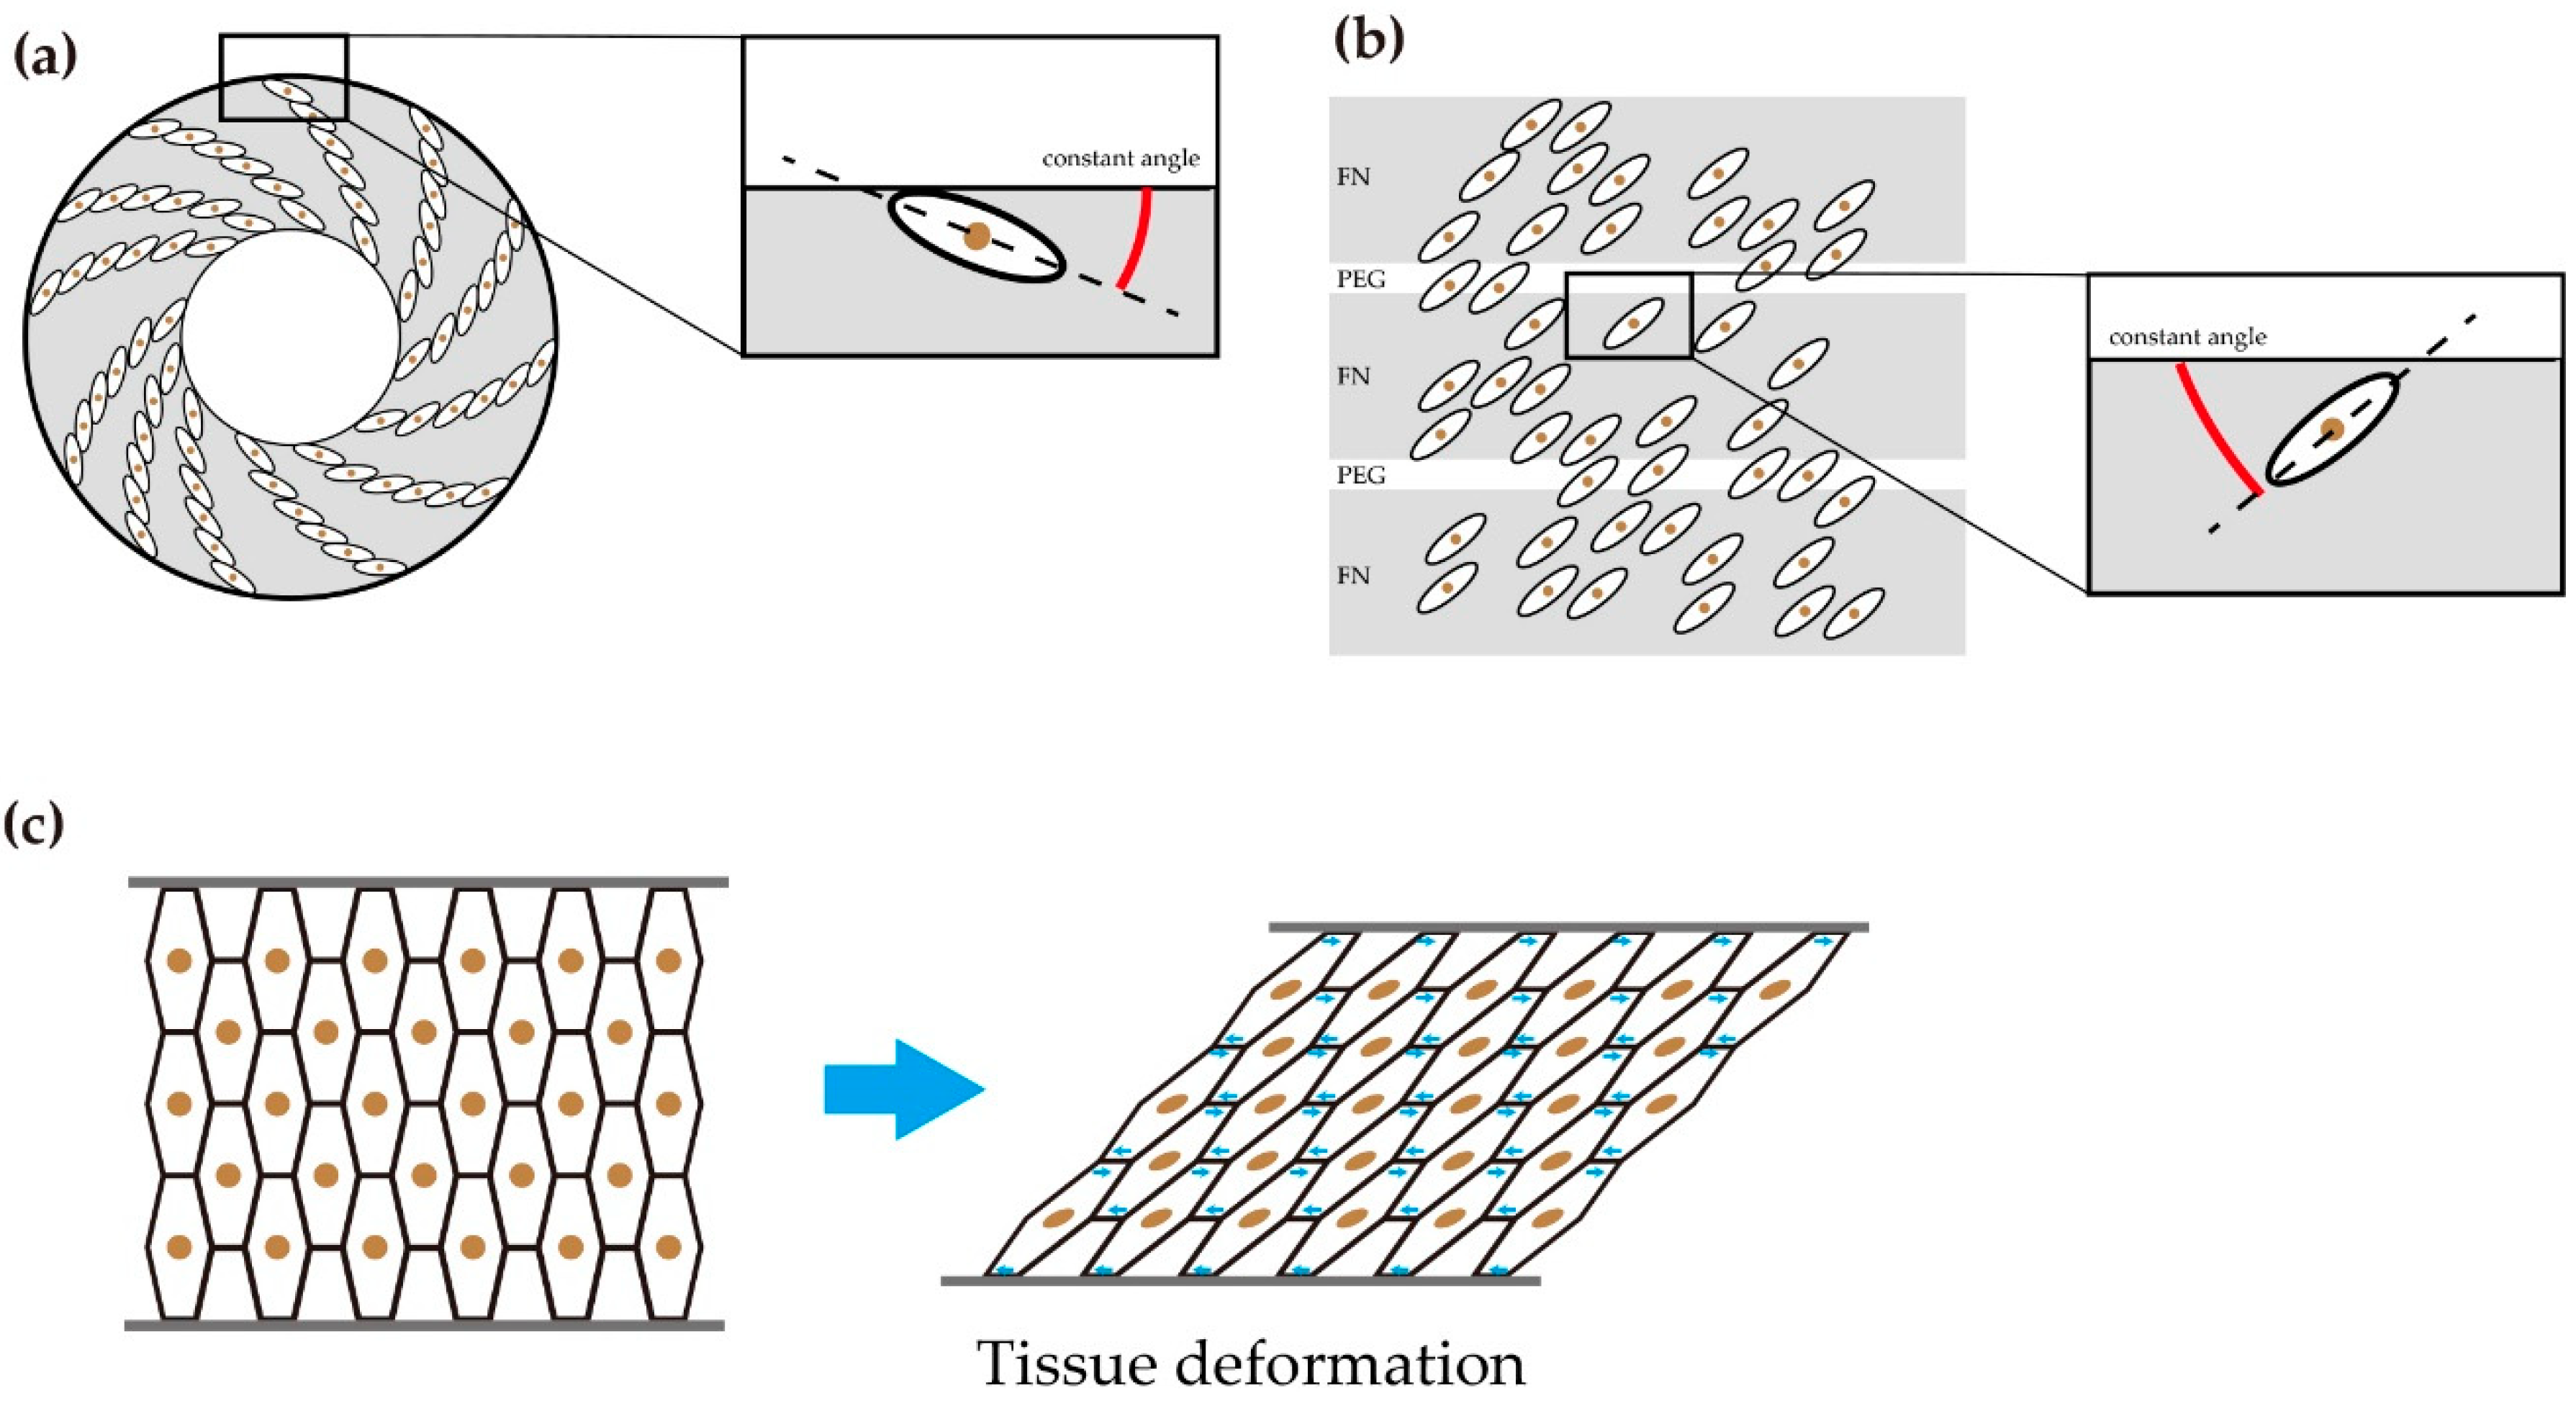
The similar spiral pattern made by a group of cells with the same chirality was reported in cultured cells. When C2C12 cells are cultured in a ring-like microenvironment, each cell is located at a fixed small angle to the ring boundary or the next cell. As a result, a group of C2C12 cells is autonomously aligned in a counter-clockwise spiral pattern (Figure 7a) [6]. Interestingly, the direction of the spiral is specific to the cell line. For example, hUVEC cells (human umbilical vein endothelial cells) generate a clockwise spiral, while C2C12 cells generate a counter-clockwise spiral. Similar autonomous pattern formation was reported in the other microfabricatied environment [12]. When vascular mesenchymal cells (VMC) are cultured on the dish where fibronectin coated adhesive bands and polyethylene glycol coated non-adhesive bands constitute stripes, the cells align in the stripe pattern that have a constant angle to the adhesive and the nonadhesive stripes (Figure 7b). These reports suggested that cells that with inherent chirality are located on the position that have a constant angle to the interface of different adhesion, and this results in autonomous pattern formation. If these cells change the angle after they constitute an adhesive sheet, the sheet deforms (Figure 7c). This type of tissue deformation was reported in the embryonic hindgut of Drosophila melanogaster (fruit fly). Drosophila embryonic hindgut was generated from the epithelial monolayer. The epithelial monolayer invaginated to form a tube-like structure. In this stage, the hindgut was a bilaterally symmetric structure. At a later stage, the cells that constituted the hindgut sheet took a leftward tilted position. As a consequence, the hindgut showed sinistral looping [8].
3. Conclusions
Although there are various cells that show inherent chirality, the physiological function of this cell chirality was not elucidated in full. In a few cases, the cell chirality is considered to be related to the left–right asymmetry of a body plan. In this short review, we reviewed the chirality of zebrafish melanophores, which is not related to the left–right asymmetry. The possible physiological function of the chirality of melanophores is the separation from the xanthophores. At the same time, it suggests that the same chirality in the group of cells could gather the cells. The chirality of melanophores also suggests the importance of cell interaction and adhesion where the chirality works. When cells are adherent to each other, the chirality could be a generator for the tissue deformation by accumulation of the bias through the cell interactions. The molecular mechanism of this cell chirality remains as a future problem, and the mathematical model that explains how the cell chirality affects the tissue formation would also be an interesting future problem.
Author Contributions
H.Y. and S.K. discussed about this theme, and H.Y. mainly wrote this manuscript. All authors have read and agreed to the published version of the manuscript.
Funding
The APC of this manuscript is funded by Grant-in-Aid for Scientific Research on Innovative Areas (A20H056080).
Institutional Review Board Statement
Not applicable.
Informed Consent Statement
Not applicable.
Data Availability Statement
The data that cited in this manuscript are available from the published papers or a corresponding author.
Conflicts of Interest
The authors declare no conflict of interest associated with this manuscript.
References
- Hagmann, J. Pattern formation and handedness in the cytoskeleton of human platelets. Proc. Natl. Acad. Sci. USA 1993, 90, 3280–3283. [Google Scholar] [CrossRef] [PubMed] [Green Version]
- Tee, Y.H.; Shemesh, T.; Thiagarajan, V.; Hariadi, R.F.; Anderson, K.L.; Page, C.; Volkmann, N.; Hanein, D.; Sivaramakrishnan, S.; Kozlov, M.M.; et al. Cellular chirality arising from the self-organization of the actin cytoskeleton. Nat. Cell Biol. 2015, 17, 445–457. [Google Scholar] [CrossRef] [PubMed]
- Wan, L.Q.; Ronaldson, K.; Park, M.; Taylor, G.; Zhang, Y.; Gimble, J.M.; Vunjak-Novakovic, G. Micropatterned mammalian cells exhibit phenotype-specific left-right asymmetry. Proc. Natl. Acad. Sci. USA 2011, 108, 12295–12300. [Google Scholar] [CrossRef] [PubMed] [Green Version]
- Heacock, A.M.; Agranoff, B.W. Clockwise growth of neurites from retinal explants. Science 1977, 198, 64–66. [Google Scholar] [CrossRef] [PubMed]
- Tamada, A.; Kawase, S.; Murakami, F.; Kamiguchi, H. Autonomous right-screw rotation of growth cone filopodia drives neurite turning. J. Cell Biol. 2010, 188, 429–441. [Google Scholar] [CrossRef] [PubMed] [Green Version]
- Xu, J.; Van Keymeulen, A.; Wakida, N.M.; Carlton, P.; Berns, M.W.; Bourne, H.R. Polarity reveals intrinsic cell chirality. Proc. Natl. Acad. Sci. USA 2007, 104, 9296–9300. [Google Scholar] [CrossRef] [PubMed] [Green Version]
- Nonaka, S.; Tanaka, Y.; Okada, Y.; Takeda, S.; Harada, A.; Kanai, Y.; Kido, M.; Hirokawa, N. Randomization of left-right asymmetry due to loss of nodal cilia generating leftward flow of extraembryonic fluid in mice lacking KIF3B motor protein. Cell 1998, 95, 829–837. [Google Scholar] [CrossRef] [Green Version]
- Taniguchi, K.; Maeda, R.; Ando, T.; Okumura, T.; Nakazawa, N.; Hatori, R.; Nakamura, M.; Hozumi, S.; Fujiwara, H.; Matsuno, K. Chirality in planar cell shape contributes to left-right asymmetric epithelial morphogenesis. Science 2011, 333, 339–341. [Google Scholar] [CrossRef] [PubMed]
- Yamanaka, H.; Kondo, S. Rotating pigment cells exhibit an intrinsic chirality. Genes Cells 2015, 20, 29–35. [Google Scholar] [CrossRef] [PubMed]
- Patterson, L.B.; Parichy, D.M. Interactions with iridophores and the tissue environment required for patterning melanophores and xanthophores during zebrafish adult pigment stripe formation. PLoS Genet. 2013, 9, e1003561. [Google Scholar] [CrossRef] [PubMed] [Green Version]
- Volkening, A.; Sandstede, B. Iridophores as a source of robustness in zebrafish stripes and variability in Danio patterns. Nat. Commun. 2018, 9, 3231. [Google Scholar] [CrossRef] [PubMed]
- Inaba, M.; Yamanaka, H.; Kondo, S. Pigment pattern formation by contact-dependent depolarization. Science 2012, 335, 677. [Google Scholar] [CrossRef] [PubMed] [Green Version]
- Yamanaka, H.; Kondo, S. In vitro analysis suggests that difference in cell movement during direct interaction can generate various pigment patterns in vivo. Proc. Natl. Acad. Sci. USA 2014, 111, 1867–1872. [Google Scholar] [CrossRef] [PubMed] [Green Version]
- Irion, U.; Frohnhöfer, H.G.; Krauss, J.; Çolak Champollion, T.; Maischein, H.M.; Geiger-Rudolph, S.; Weiler, C.; Nüsslein-Volhard, C. Gap junctions composed of connexins 41.8 and 39.4 are essential for colour pattern formation in zebrafish. Elife 2014, 3, e05125. [Google Scholar] [CrossRef] [PubMed]
- Usui, Y.; Aramaki, T.; Kondo, S.; Watanabe, M. The minimal gap-junction network among melanophores and xanthophores required for stripe pattern formation in zebrafish. Development 2019, 146. [Google Scholar] [CrossRef] [PubMed]
- Watanabe, M.; Kondo, S. Changing clothes easily: Connexin41.8 regulates skin pattern variation. Pigment Cell Melanoma Res. 2012, 25, 326–330. [Google Scholar] [CrossRef] [PubMed]
- Shibazaki, Y.; Shimizu, M.; Kuroda, R. Body handedness is directed by genetically determined cytoskeletal dynamics in the early embryo. Curr. Biol. 2004, 14, 1462–1467. [Google Scholar] [CrossRef] [PubMed] [Green Version]
- Woolley, T.E.; Maini, P.K.; Gaffney, E.A. Is pigment cell pattern formation in zebrafish a game of cops and robbers? Pigment Cell Melanoma Res. 2014, 27, 686–687. [Google Scholar] [CrossRef] [PubMed] [Green Version]
- Volkening, A.; Sandstede, B. Modelling stripe formation in zebrafish: An agent-based approach. J. R. Soc. Interface 2015, 12. [Google Scholar] [CrossRef] [PubMed] [Green Version]
- Woolley, T.E. Pattern production through a chiral chasing mechanism. Phys. Rev. E 2017, 96, 032401. [Google Scholar] [CrossRef] [PubMed] [Green Version]
Figure 1.
Typical localization of actin fibers and microtubules. Red lines represent actin fibers, and green lines represent microtubules. Most actin fibers localize to cell periphery as bundles. Microtubules extend from center of a cell near the nuclei.
Figure 1.
Typical localization of actin fibers and microtubules. Red lines represent actin fibers, and green lines represent microtubules. Most actin fibers localize to cell periphery as bundles. Microtubules extend from center of a cell near the nuclei.

Figure 2.
(a) A xanthophore (yellow pigment cell) extends pseudopods toward a melanophore (black pigment cell). (b) Typical direction of movement of a xanthophore and a melanophore. A red arrow indicates the direction of the xanthophore. Cyan arrow indicates the direction of the melanophore. Xanthophores move to the right side of the melanophores, while melanophores move leftward from xanthophores.

Figure 3.
Counter clockwise rotation of a melanophore. Zebrafish melanophores were harvested from transgenic zebrafish (Tg: nacre pro histone-H2B-RFP). The melanophores of this transgenic zebrafish expressed red fluorescent protein fused histone. The fused proteins were accumulated in the nucleus, and the nucleus was visualized. The melanophores were cultured under isolated conditions. White and blue arrowheads indicate each one of the two nuclei. Scale bar corresponds to 20 micrometers. The number indicates the time from addition of serum to the medium (hours:minutes).

Figure 4.
Localization of actin fibers and microtubules of rotating zebrafish melanophores. Zebrafish melanophores were harvested from transgenic zebrafish (Tg: nacre pro Lifeact-macherry; Ub pro GFP-MAP4). The melanophores of this transgenic zebrafish expressed mcherry (red fluorescent protein) fused Lifeact protein, which binds to actin fibers, and GFP (green fluorescent protein) fused MAP4 protein, which binds to microtubules. (a) When a melanophore rotates, actin fibers accumulate to the cell periphery as a bundle (white arrow heads). Microtubules extend radially from the center near the nuclei. White bar is a scale bar of 20 μm. (b) Magnified image of dot rectangle in (a). Actin fibers and microtubules are crossing at the cell periphery. White bar is a scale bar of 20 μm.

Figure 5.
The model image of cell separation between melanophores and xanthophores. (a) When the directions of movements of all melanophores and xanthophores are constant, melanophores run from xanthophores in the same direction. (b) When the directions of movements of melanophores and xanthophores are random, the running of melanophores and the chasing of xanthophores are interfered by collision.

Figure 6.
(a) When two melanophores meet, they rotate around each other in counterclockwise direction because of their inherent counterclockwise self-rotation. (b) Hypothetical model of melanophores with unidirectional rotation movement. The group of melanophores rotate around each other, and the movements result in gathering of melanophores.

Figure 7.
(a) Spiral cell arrangement on the ring-shaped micropattern. When mouse myoblast cell line (C2C12) cells were cultured on the ring-shaped micropattern, the cells formed a counter-clockwise spiral pattern. The cells on the edge showed cell alignment with a constant angle against circumferential direction. (b) The cells showed coherent diagonal arrangement on the alternating stripes of cell-adhesive (FN: fibronectin coated) and nonadhesive (PEG: polyethylene glycol coated). The cells showed cell alignment with a constant angle against stripes. (c) Hypothetical model when adherent cells which constitute a tissue rotate in a unidirectional direction. The movements deform each cell shape, which brings tissue deformation.

Publisher’s Note: MDPI stays neutral with regard to jurisdictional claims in published maps and institutional affiliations. |
© 2021 by the authors. Licensee MDPI, Basel, Switzerland. This article is an open access article distributed under the terms and conditions of the Creative Commons Attribution (CC BY) license (http://creativecommons.org/licenses/by/4.0/).
Share and Cite
MDPI and ACS Style
Yamanaka, H.; Kondo, S. Zebrafish Melanophores Suggest Novel Functions of Cell Chirality in Tissue Formation. Symmetry 2021, 13, 130. https://doi.org/10.3390/sym13010130
AMA Style
Yamanaka H, Kondo S. Zebrafish Melanophores Suggest Novel Functions of Cell Chirality in Tissue Formation. Symmetry. 2021; 13(1):130. https://doi.org/10.3390/sym13010130
Chicago/Turabian StyleYamanaka, Hiroaki, and Shigeru Kondo. 2021. "Zebrafish Melanophores Suggest Novel Functions of Cell Chirality in Tissue Formation" Symmetry 13, no. 1: 130. https://doi.org/10.3390/sym13010130
Note that from the first issue of 2016, this journal uses article numbers instead of page numbers. See further details here.