Stable Isotope Mixing Models Are Biased by the Choice of Sample Preservation and Pre-treatment: Implications for Studies of Aquatic Food Webs
 Marc J. Silberberger
 Katarzyna Koziorowska-Makuch
  Karol Kuliński
 Monika Kędra
- Institute of Oceanology, Polish Academy of Sciences, Sopot, Poland
Stable isotope analysis has become one of the most widely used techniques in ecological studies. However, there are still uncertainties about the effects of sample preservation and pre-treatment on the ecological interpretation of stable isotope data and especially on Bayesian stable isotope mixing models. Here, Bayesian mixing models were used to study how three different preservation methods (drying, freezing, formalin) and two pre-treatments (acidification, lipid removal) affect the estimation of the utilized organic matter sources for two benthic invertebrate species (Limecola balthica, Crangon crangon) collected in the Baltic Sea. Furthermore, commonly used mathematical lipid normalization and formalin correction were applied to check if they were able to adjust the model results correctly. Preservation effects were strong on model outcomes for frozen as well as formalin preserved L. balthica samples, but not for C. crangon. Pre-treatment effects varied with species and preservation method and neither lipid normalization nor mathematical formalin correction consistently resulted in the desired model outcomes. Our analysis highlights that particularly small, not significant changes in stable isotope ratios introduced by different preservation and pre-treatments display a so far unrecognized source of error in stable isotope mixing models. We conclude that mathematical correction of benthic invertebrate stable isotopes data should be avoided for Bayesian mixing models and that previously unaddressed effects of sample preservation (especially those arising from preservation by freezing) have potentially biased our understanding of the utilization of organic matter in aquatic food webs.
Introduction
The development of stable isotope analysis (SIA) to study ratios of naturally occurring stable isotopes (SIs) of carbon (δ13C) and nitrogen (δ15N) has advanced the understanding of aquatic ecosystem functioning and in particular the knowledge about trophic interactions (Middelburg, 2014). Although SIA has been successfully applied in ecological studies for over three decades, many uncertainties about the effects of sample preservation and treatment still remain (Lau et al., 2012; Schlacher and Connolly, 2014).
In principal, SIA consists of the complete combustion of dehydrated and pulverized samples in an elemental analyzer and transferring the gaseous products to CO2 and N2, which are subsequently detected in a mass spectrometer allowing for distinguishing between molecules containing 12C and 13C, as well as 14N and 15N. Ship-based sampling and sampling in remote locations, however, seldom allow for immediate sample preparation and analysis. Accordingly, samples must be preserved until the time of analysis. In case of organisms and sediments it is commonly done by freezing, since fluid preservation in formalin and/or ethanol is known to affect SI ratios (Edwards et al., 2002). Such preservation effects are typically strong for δ13C (reported Δδ13C typically from −1 to −2‰), while they are small or insignificant for δ15N (reported Δδ15N typically from −0.5 to 0.5‰) (Lau et al., 2012; Rennie et al., 2012; Turner et al., 2015). These reports are in agreement with the chemical process of formalin preservation, which results in the formation of methylene bridges within or between protein molecules (Thavarajah et al., 2012). Since these bridges contain C originating from formalin, but no N, a change of δ13C toward the δ13C of formalin can be expected. Nonetheless, in an increasing number of studies formalin preserved organisms are measured for SIs, since it allows using community samples collected for other purposes or museum specimens (Chandra et al., 2005; Ozersky et al., 2012). Such studies typically use correction factors to adjust measured SI ratios (e.g., Chandra et al. (2005): addition of 1.28‰ to observed δ13C), although consensus about the appropriate correction has not been reached as the effect may vary with preservation duration, sample treatment, formalin brand, and studied taxa (Edwards et al., 2002; Rennie et al., 2012). Due to the general belief that freezing does not affect SI ratios (Bosley and Wainright, 1999), these correction factors have been established in most cases by comparison of formalin fixed and frozen samples without control for changes in SI ratios that are caused by freezing itself (Edwards et al., 2002; Lau et al., 2012). Some studies, however, found that freezing can have an effect on SI ratios of similar magnitude as preservation in formalin (Feuchtmayr and Grey, 2003; Syväranta et al., 2011). Furthermore, the reported effects of freezing on δ13C in those studies were opposing: according to Feuchtmayr and Grey (2003) freezing lowers δ13C values in zooplankton by approximately 1‰, while Syväranta et al. (2011) found higher δ13C (by approximately 2‰) values in the Asiatic clam (Corbicula fluminea) after freezing. For formalin preservation, however, both studies reported an enrichment in 13C in comparison to dried samples.
Another consideration in SIA is the use of sample pre-treatments to remove carbonates and/or lipids. When studying food webs, scientists are typically interested in organic (and not inorganic) carbon as the δ13C of an organism closely reflects the δ13C of its food (McCutchan et al., 2003). Inorganic carbon structures (e.g., carbonate shells) are strongly enriched in 13C and thus they have higher δ13C in comparison to organic tissues and are routinely removed from samples (Schlacher and Connolly, 2014). This is commonly achieved through treatment with hydrochloric acid (HCl). Such a treatment, however, has been reported to have variable effects on δ15N and therefore analyzing samples in duplicates for δ13C (acidified) and δ15N (non-acidified) is recommended (Schlacher and Connolly, 2014). However, since this increases the total number of analyzed samples many studies that investigate aquatic food webs use acidified samples for both SIs (e.g., Fredriksen, 2003; Kędra et al., 2012; Jankowska et al., 2018).
In contrast, the carbon in lipids originates from the diet of an animal. Nonetheless, chemical lipid removal is common when SIA is used to study aquatic food webs. The reasons behind this are the fast carbon turnover in lipids and their tendency to have lower δ13C in comparison to carbohydrates and proteins (Tieszen et al., 1983; Focken and Becker, 1998), which is likely introducing a strong bias in food web studies when samples with variable lipid content are analyzed. Consequently, chemical lipid removal is recommended when samples with presumably differing lipid content are being analyzed (Pinnegar and Polunin, 1999). Since chemical lipid removal can affect δ15N ratios (Søreide et al., 2006), this approach also requires the preparation of duplicate samples. This is, however, time consuming, increases the total number of analyzed samples, and it is often not possible in studies with small sample sizes (e.g., for benthic invertebrates). Consequently, many authors choose to use a mathematical lipid normalization of δ13C instead, based on the C/N ratio. Particularly, the normalization models of Post et al. (2007) and McConnaughey and McRoy (1979) are widely applied to aquatic invertebrates (Jardine et al., 2003; Coat et al., 2009; Arostegui et al., 2019). Lipid extraction and normalization in vertebrates, however, have shown that lipid normalization models should be tissue-, taxa-, and trophic group-specific (Cloyed et al., 2020) and accordingly it is questionable whether the abovementioned models should be applied so widely to all aquatic invertebrates.
While all above mentioned studies have addressed effects of sample preservation or pre-treatment separately, detailed knowledge about potential interaction effects of preservation and pre-treatment is still missing. Furthermore, our knowledge about preservation and pre-treatment effects on δ13C and δ15N ratios is based on univariate approaches that identify effects and potential corrections for each SI individually. This univariate approach to sample preservation and pre-treatment, however, is in stark contrast to the multivariate approaches that are commonly used to analyze SI data (Jackson et al., 2012; Parnell et al., 2013; Quezada-Romegialli et al., 2018). Particularly the use of Bayesian stable isotope mixing models (SIMMs) to quantify consumer diets have become widely applied (Parnell et al., 2013; Stock et al., 2018). Currently, Bayesian SIMMs provide a flexible modeling framework that allows to account for uncertainty in source data, covariance in tracer values in source and mixture data, and to incorporate categorical or continuous covariates (Parnell et al., 2013). This variety of mixing model parameterizations has been recently unified within the MixSIAR software package (Stock and Semmens, 2016a; Stock et al., 2018), making them easily available to a wide range of users.
So far, knowledge about whether guidelines regarding sample preservation and pre-treatments can introduce biases in SIMM results is missing. Furthermore, it is not known whether lipid normalization and formalin correction can correctly adjust SIMM results to compensate for the lack of chemical lipid removal or the use of formalin preserved samples. However, the outcomes of Bayesian SIMMs are strongly affected by mathematical lipid normalization when compared to lipid intact samples (Arostegui et al., 2019). Although Arostegui et al. (2019) demonstrated that the choice of lipid normalization can affect the result of mixing models, they did not assess whether chemical lipid removal would result in similar model outcomes as lipid normalization.
Therefore, the objectives of the present study were to: (i) quantify how sample preservation and pre-treatment affect carbon and nitrogen SI ratios (δ13C and δ15N), (ii) identify potential interaction effects among preservation and pre-treatment methods, (iii) study how preservation and pre-treatment affect the results of Bayesian mixing models, and (iv) assess whether lipid normalization and mathematical formalin correction should be used to adjust data for the use in such models. To address these objectives, we chose the Gulf of Gdansk (southern Baltic Sea) as study area, and two benthic invertebrate species (Limecola balthica and Crangon crangon) as study objects. We assumed that SI ratios are not affected by oven-drying, but that all other preservation and pre-treatment methods will change δ13C and/or δ15N. We aimed to determine whether an ecological interpretation of data is possible and how the uncertainties of the used methods should be addressed.
Materials and Methods
Study Location and Sample Collection
The sampling site in the Gulf of Gdansk (Figure 1) is characterized by sandy sediments, and year-round relatively stable bottom salinity around 7 (Witek et al., 2003). During times of high freshwater outflow from the close by Vistula river, however, the river plume can extend over the sampling site (Cyberska and Krzymiński, 1988). The vertical extension of the plume varies between 0.5 and 12 m (Grelowski and Wojewódzki, 1996). The bottom water temperature follows a typical seasonal pattern ranging from approximately 4°C in winter to 15°C in late summer. The onset of the spring phytoplankton bloom in the study region typically occurs between February and April, with the phytoplankton biomass peaking in April (Witek et al., 1997). Following the spring bloom, the primary production in the Gulf of Gdansk remains high until October (Witek et al., 1997). However, pelagic community respiration can exceed primary production for short periods in late summer, when water stratification is strong and water transparency is reduced (York et al., 2001). Such conditions have been reported to cause temporary oxygen depletion in bottom water of the Gulf of Gdansk (York et al., 2001).
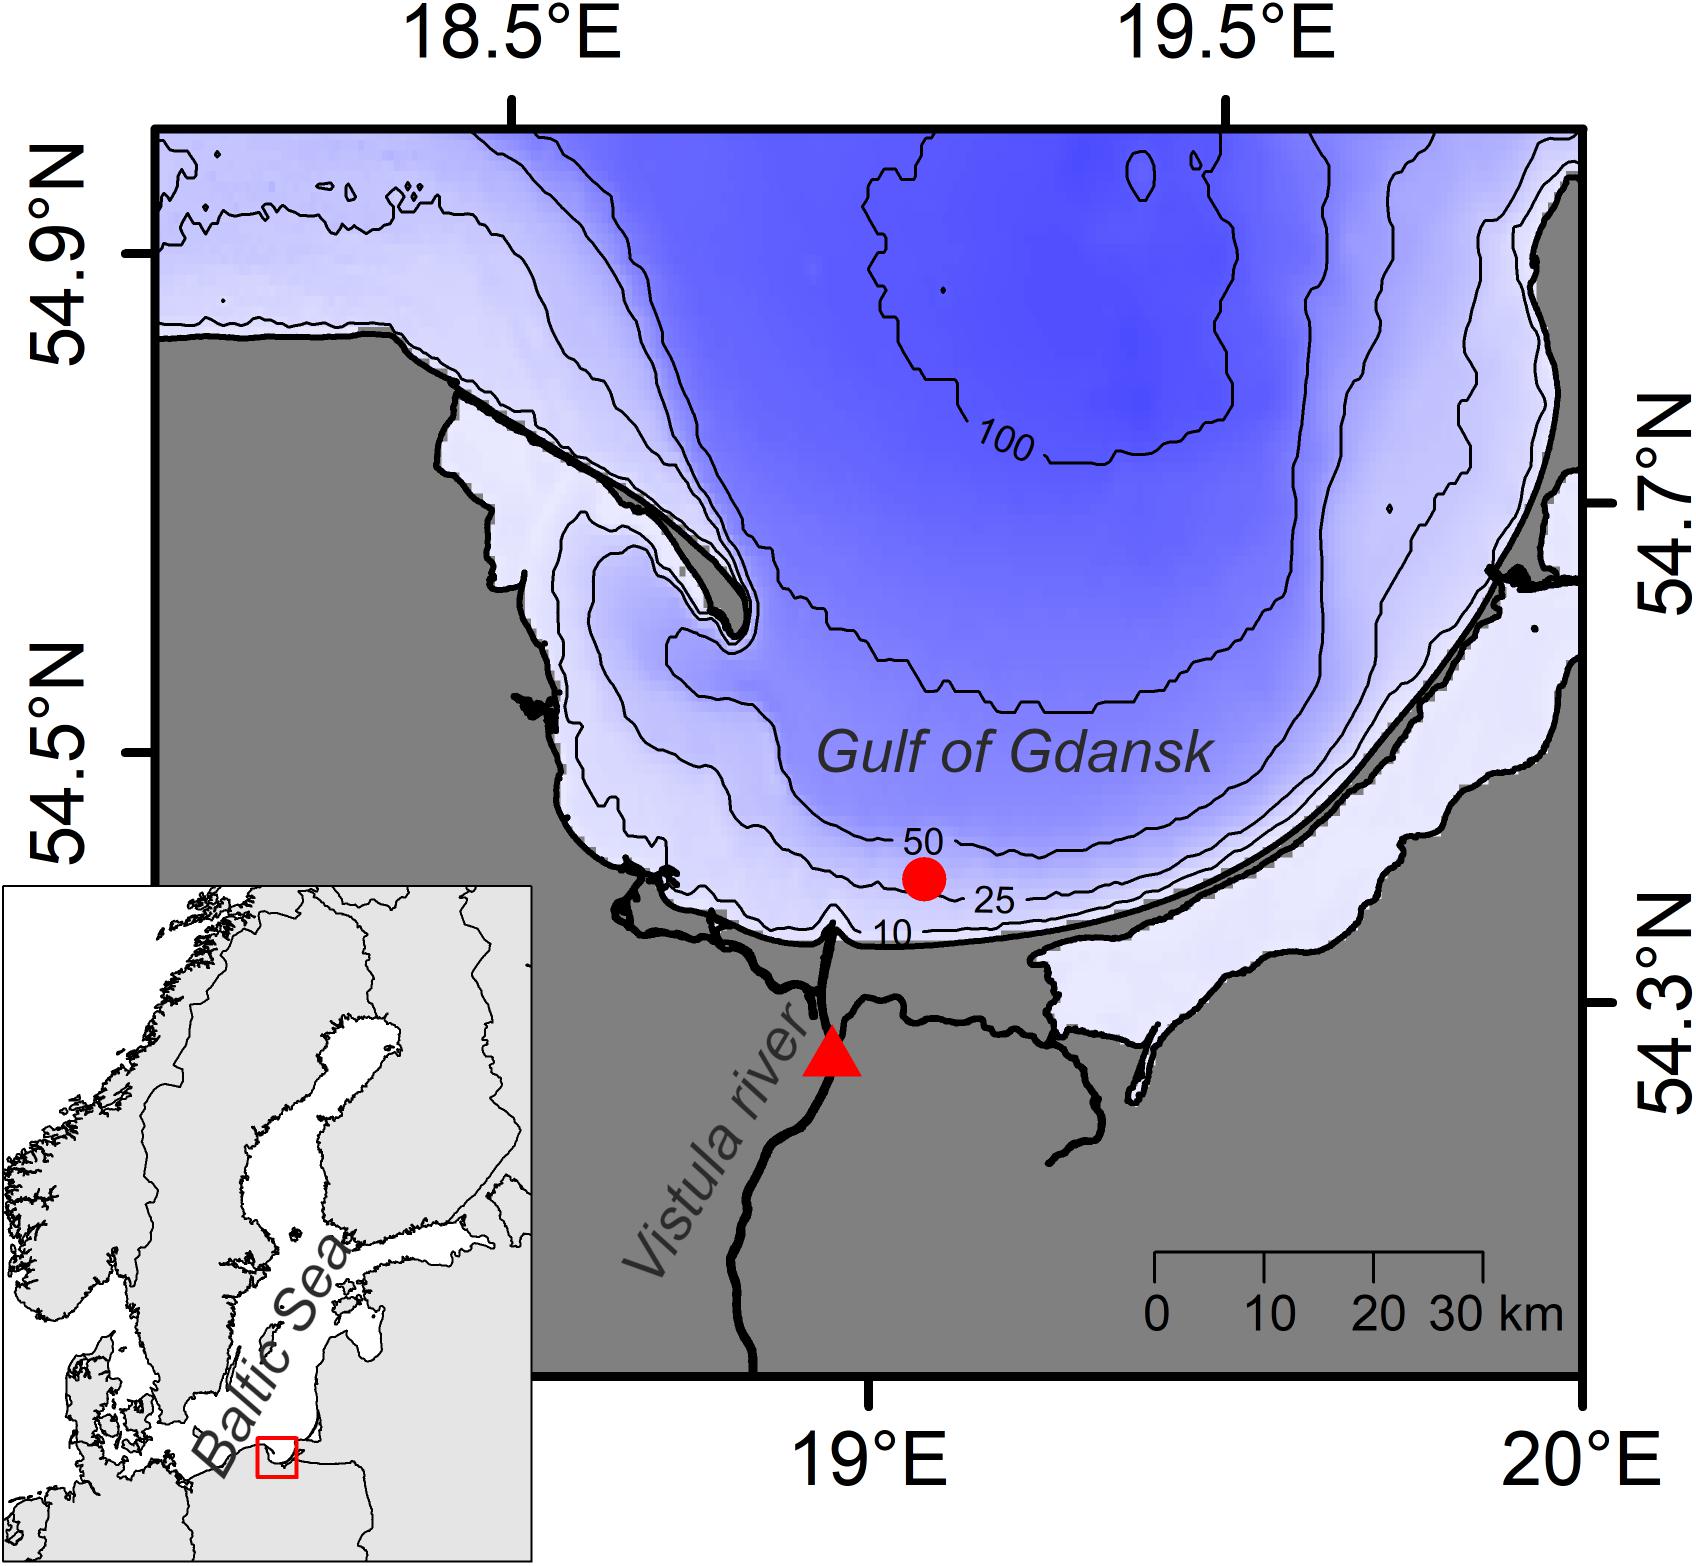
Figure 1. Map of the study area. Sampling locations in the Gulf of Gdansk (circle) and at the Vistula river (triangle) are shown. Inset: Map of the Baltic Sea region with location of the study area indicated.
Samples were collected from s/y Oceania on 24th April 2019 at the study location in the Gulf of Gdansk, southern Baltic Sea (54.40°N, 19.08°E, depth: 32 m; Figure 1). Two dominant benthic species, L. balthica and C. crangon, were chosen as study objects. Both species have a wide distribution in European waters and play an important role in the southern Baltic Sea ecosystem. The bivalve, L. balthica is a primary consumer that has the ability to switch between suspension- and deposit-feeding (Törnroos et al., 2015), while the shrimp C. crangon is a benthic predator (Oh et al., 2001). For each species enough individuals for 60 replicate samples (Figure 2A) were collected by use of a benthic dredge. Specimens were kept alive in filtered seawater for 24 h to allow for gut clearance. Altogether 60 individuals of L. balthica (size: 1–1.5 cm) and 120 individuals of C. crangon (length: 1–1.5 cm) were collected. For each species, the collected material was divided into 3 equal parts, which were subsequently preserved by oven-drying at 60°C on board, freezing at −80°C, and in 10% formalin buffered with borax (Figure 2A). Formalin (supplier Chempur) is an aqueous solution of formaldehyde (36–38%) stabilized with 10–15% methanol to slow down polymerization to paraformaldehyde. Consequently a 10% formalin solution contains approximately 4% formaldehyde and 1% methanol. L. balthica was removed from its shell prior to oven-drying and freezing. Intact individuals were, however, used for formalin preservation, since community samples and museum specimens are typically preserved in that way.
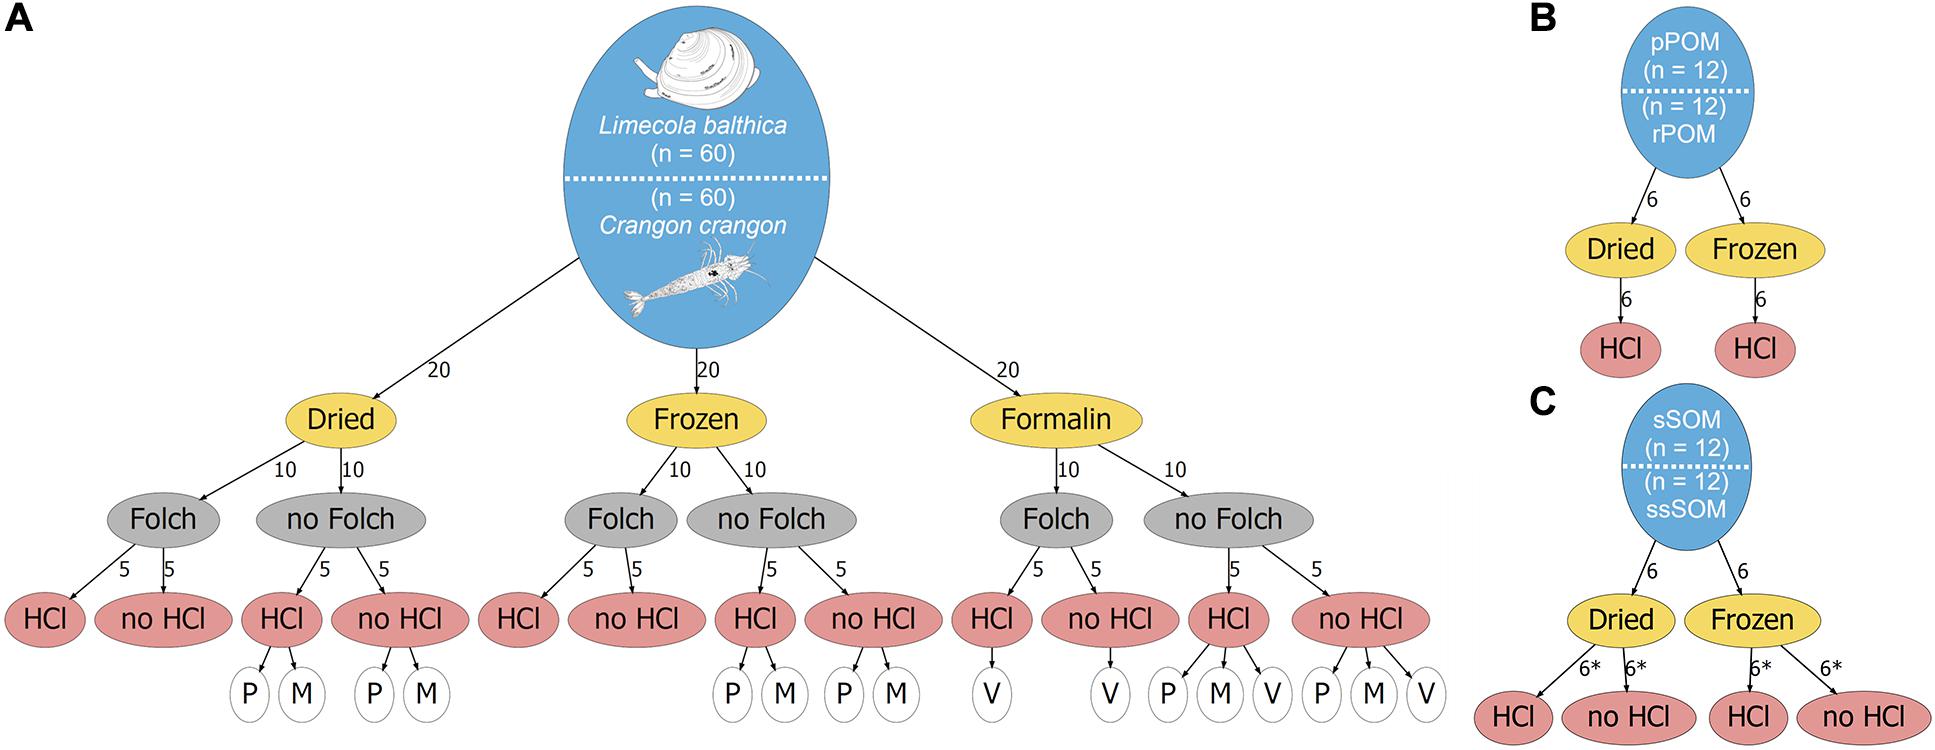
Figure 2. Schematic overview of the study design. The total number of samples for each sample type is given in the blue ellipses for (A) Fauna, (B) POM, and (C) SOM. Preservation methods are given in yellow ellipses, lipid removal in Folch solution is shown in gray ellipses, and acidification with HCl is indicated in red ellipses. Numbers along the arrows indicate the number of samples that were used for a specific treatment. Asterix (*) indicates samples that were analyzed as duplicates. White ellipses in (A) indicate which data was used for various mathematical corrections. P and M indicate lipid normalization according to Post et al. (2007) and McConnaughey and McRoy (1979), respectively. V indicates formalin correction according to Vander Zanden et al. (2003).
Furthermore, potential OM sources of the collected fauna were sampled. Twelve replicate samples of surface sediment (0–1 cm depth) and subsurface sediment (1–3 cm depth) were collected with box corer (sSOM – surface sediment OM; ssSOM – subsurface sediment OM). Half of the samples were dried at 60°C and the remainder frozen at −20°C (Figure 2C). A Niskin bottle was used to collect water from 10 m depth. The sampling depth was selected after a CTD profile showed a slightly elevated temperature (6°C) at the surface and a well-mixed water column with constant salinity (7.5) and temperature (4.5°C) below. A sampling depth well above the sea bottom within the well-mixed zone was chosen to reduce the risk of collecting resuspended sediment with the water. Water was then filtered through pre-combusted and pre-weighed Whatman GF/F filters to collect pelagic particulate OM (pPOM). Additionally, water samples were taken from Vistula River (54.25°N, 18.95°E, Figure 1) on 6th May 2019 to obtain riverine particulate OM (rPOM) samples following the same filtration procedures. Half of pPOM and rPOM samples (filters) were dried at 60°C and the other parts frozen at −20°C (Figure 2B).
Sample Preparation and Analysis
After 6 weeks of preservation, all frozen and formalin preserved samples were dehydrated. This was achieved by oven-drying at 60°C for pPOM and rPOM and freeze-drying for sediments and fauna samples. Dehydration by oven-drying and freeze-drying were considered interchangeable methods since multiple studies have found no effect of drying method on δ13C and δ15N of POM, SOM, and fauna samples (Bosley and Wainright, 1999; Carabel et al., 2006; Bessey and Vanderklift, 2014; Akamatsu et al., 2016), with sample types comparable to the sample types in this study. Accordingly, freeze-drying was used for sediments and fauna as it allows for easier homogenization of these sample types. Organisms preserved in formalin were soaked in water for 6 h. The water was exchanged twice during this time. L. balthica bodies were then removed from their shells prior to dehydration. All samples were then ground to a fine powder with mortar and pestle and kept in a desiccator until further processing.
In the next step lipids were removed from half of each of 3 sets (different preservation methods) of fauna samples (Figure 2A) by extraction in Folch solution [chloroform-methanol 2:1 (v/v)] for 24 h (Søreide et al., 2006). Consecutively extractant was exchanged twice to ensure the majority of lipid was removed. Samples were then air-dried under a fume hood at room temperature.
After weighing the samples into silver capsules, half of them were repeatedly (× 4) treated with 2 M HCl to obtain maximum of combinations for different preservation and pre-treatments methods (Figure 2). After each individual acid wash, samples were oven-dried at 60°C. Similarly, all pPOM and rPOM samples were subject to acidification. Samples for sediment OM were prepared in duplicates with and without acidification.
Samples were analyzed for carbon, nitrogen as well as their SIs (δ13C and δ15N) with an Elemental Analyzer Flash EA 1112 Series interfaced to an Isotopic Ratio Mass Spectrometer IRMS Delta V Advantage (Thermo Electron Corp., Germany). Isotopic ratios, δ13C and δ15N, were corrected against IAEA standards (CO-8 and USGS40 for δ13C and N-1 and USGS40 for δ15N). Laboratory working pure gases (CO2 and N2) of known isotopic composition were used as reference gases during the analysis. SIs measurements are reported in the commonly used delta (δ) notation in parts per thousand (‰) relative to the international standard Vienna Pee Dee Belemnite and atmospheric air for carbon and nitrogen, respectively.
Statistical Analysis
A two-way ANOVA was used to test for differences in isotopic ratios between OM sources (4 levels) and to identify potential preservation effects (2 levels) on the OM sources. To identify differences among fauna samples, a factorial ANOVA with four factors was used: (i) species identity (2 levels), (ii) preservation method (3 levels), (iii) lipid removal (2 levels), and (iv) carbonate removal (2 levels). Shapiro-Wilk test in combination with QQ-plots of the residuals and Levene’s test were used to test for normality and homogeneity of variance, respectively. Three OM samples (1 × rPOMfrozen; 1 × pPOMdried; 1 × ssSOMdried) were identified as extreme outliers that caused a violation of ANOVA assumptions for one of the isotopes. These samples were excluded from the analysis. Post hoc tests of significant factors and interactions of factors were done by Pairwise Comparisons of Estimated Marginal Means with Bonferroni correction applied.
Bayesian SIMMs were run in MixSIAR (Stock et al., 2018) to identify impacts of all combinations of preservation and pre-treatment on the estimated contribution of different OM sources to the diet of the collected fauna. Individual models were run per species-preservation combination, with pre-treatment as covariate (fixed factor with four levels, i.e., all combinations of lipid removal and acidification; Figure 2A). We included three distinct potential OM sources in the model: rPOM, pPOM, and SOM (i.e., surface + subsurface). However, as our results showed, SOM δ15N was significantly affected by freezing and therefore we ran every model twice with two different source data sets: (i) source data set A with dried SOM and (ii) source data set B with frozen SOM.
One key assumption that has to be made for Bayesian SIMMs is the selection of trophic enrichment factors (TEF) (Bond and Diamond, 2011). To ensure the best possible modeling results, TEFs should be selected as predator-prey pair specific as possible (Caut et al., 2009; Planas et al., 2020). Furthermore, a faithful incorporation of TEF variance is essential for model performance when literature-based TEFs are used (Stock and Semmens, 2016b). We assumed a trophic fractionation of 3.4 ± 1‰ for δ15N for each trophic step (Post, 2002). This commonly applied TEF was chosen in our study as it was developed largely on filter-feeding bivalves (pelagic baseline) and grazing snails (littoral baseline) and accordingly it is suitable for L. balthica and other primary consumers in the studied ecosystem. The same trophic fractionation is assumed for the second trophic step from primary consumers to predatory C. crangon, since it compares well with the fractionation of 3.6‰ that has been assumed by Fry (1988) in a community food web study that also included Crangon sp. Furthermore, it is close to an experimentally determined TEF of 3.55‰ for a mysid shrimp, Mysis mixta, that was fed on Artemia (Gorokhova and Hansson, 1999).
For δ13C, we used a scaled trophic fractionation, assuming a TEF of 4 ± 1.3‰ for the first trophic transfer from OM source to primary consumer, and of 0.8 ± 0.5‰ from primary consumers to secondary consumer, i.e., C. crangon. This scaled approach is necessary due to the particularly strong trophic fractionation of δ13C from OM sources to benthic primary consumers, which is consistently observed in marine systems (e.g., Fry and Sherr, 1984; Iken et al., 2010; Nerot et al., 2012). We selected a trophic fractionation of 0.8 ± 0.5‰ as the best estimate for the trophic step from primary consumers to predatory C. crangon, the same as reported for Crangon uritai in comparison to a variety of potential prey species (Antonio et al., 2011). The total TEFs for C. crangon in comparison to OM sources were calculated by summing of the TEFs for the trophic steps from OM source to primary consumer and from primary consumer to C. crangon. Since the studied species required the use of different TEFs (L. balthica: TEFδ13C = 4 ± 1.3‰; TEFδ15N = 3.4 ± 1.0‰; C. crangon: TEFδ13C = 4.8 ± 1.8‰; TEFδ15N = 6.8 ± 2.0‰), the analysis in MixSIAR was performed separately for each species.
All models were run on “extreme” setting (i.e., chain length = 3,000,000; burn = 1,500,000; thin = 500; chains = 3) with an uninformative prior and a multiplicative error term (Stock and Semmens, 2016b). Gelman-Rubin diagnostics and Geweke diagnostics were used to verify if models have converged. Furthermore, posterior distributions of the three chains were visually compared with each other to ensure that all chains produced almost identical results. For pairwise comparisons of posterior distributions within and between models Bhattacharyya’s coefficients (BCs) were calculated (Bhattacharyya, 1943; Rauber et al., 2008). Silverman’s rule of thumb was used to determine the bandwidths for the calculations of BCs (Silverman, 1986). BCs range from 0 (no overlap) to 1 (complete overlap).
The C:N ratio (weight/weight) was used to correct δ13C values of all fauna samples with lipids intact by subjecting them to two separate mathematical lipid normalization models (Figure 2A). For lipid normalization according to Post et al. (2007) all δ13C values from samples with C:N > 3.5 were normalized by the following formula:
For lipid normalization according to McConnaughey and McRoy (1979) all δ13C values from samples with C:N > 4 were subjected to:
Accordingly, samples with C:N < 3.5 and C:N < 4 were not affected by normalization according to Post et al. (2007) and McConnaughey and McRoy (1979), respectively. Two separate factorial ANOVAs (one for each normalization formula) with four factors were conducted: (i) species identity (2 levels), (ii) preservation method (3 levels), (iii) lipid approach (2 levels), and (iv) carbonate removal (2 levels). This allowed testing for differences in δ13C between lipid normalization and samples with chemically removed lipids, while also controlling for potential interaction effects with species identity, preservation method, and acidification.
Furthermore, δ13C of all formalin preserved samples was mathematically corrected by adding 1.28‰ to the original data according to Vander Zanden et al. (2003), which was previously used to study OM cycling in benthic food webs (e.g., Chandra et al., 2005). MixSIAR was then used to assess how the two lipid normalization formulas as well as the formalin correction affect SIMM results.
All statistical analyses were run in R version 3.6.2 (R Development Core Team, 2019), making use of emmeans (Lenth, 2020), MixSIAR (Stock and Semmens, 2016a), and dispRity (Guillerme, 2018) packages.
Since dehydration of samples is an essential step in SIA for all preservation methods, sample preservation through immediate drying was considered the least invasive approach. Consequently, we followed previous studies that considered oven-dried fresh samples as reference (e.g., Feuchtmayr and Grey, 2003; Syväranta et al., 2011). Accordingly, modeling results acquired from dried fauna samples with source data set A (dried SOM) were considered to reflect the diet composition most accurately and strong deviations of other preservation methods from this result were interpreted as poor performance. Pre-treatment effects on SIMMs are described in comparison to each other for each preservation method.
The effect of lipid normalization and formalin correction on SIMM results were evaluated by comparison to the results for original data and the desired outcome. Accordingly, lipid normalized SIMM results (for each preservation and HCl treatment combination) were compared to not normalized as well as lipid removed samples of the same preservation and HCl treatment combination. For formalin correction, model results for each pre-treatment combination of formalin corrected data was compared to results for each preservation method for the same pre-treatment combination.
Results
Preservation and Pre-treatment Effects
Organic Matter Sources
Allochthonous (rPOM) and autochthonous (pPOM, sSOM, ssSOM) OM sources were distinct from each other for both studied isotopes. Two-way ANOVA confirmed a significant difference between OM sources for δ13C [F(3,37) = 2062.89, p < 0.001] and δ15N [F(3,37) = 412.28, p < 0.001]. The following pairwise comparisons identified a significant difference for all pairs of OM sources, except surface and subsurface sediments, for δ13C and δ15N (Figure 3).
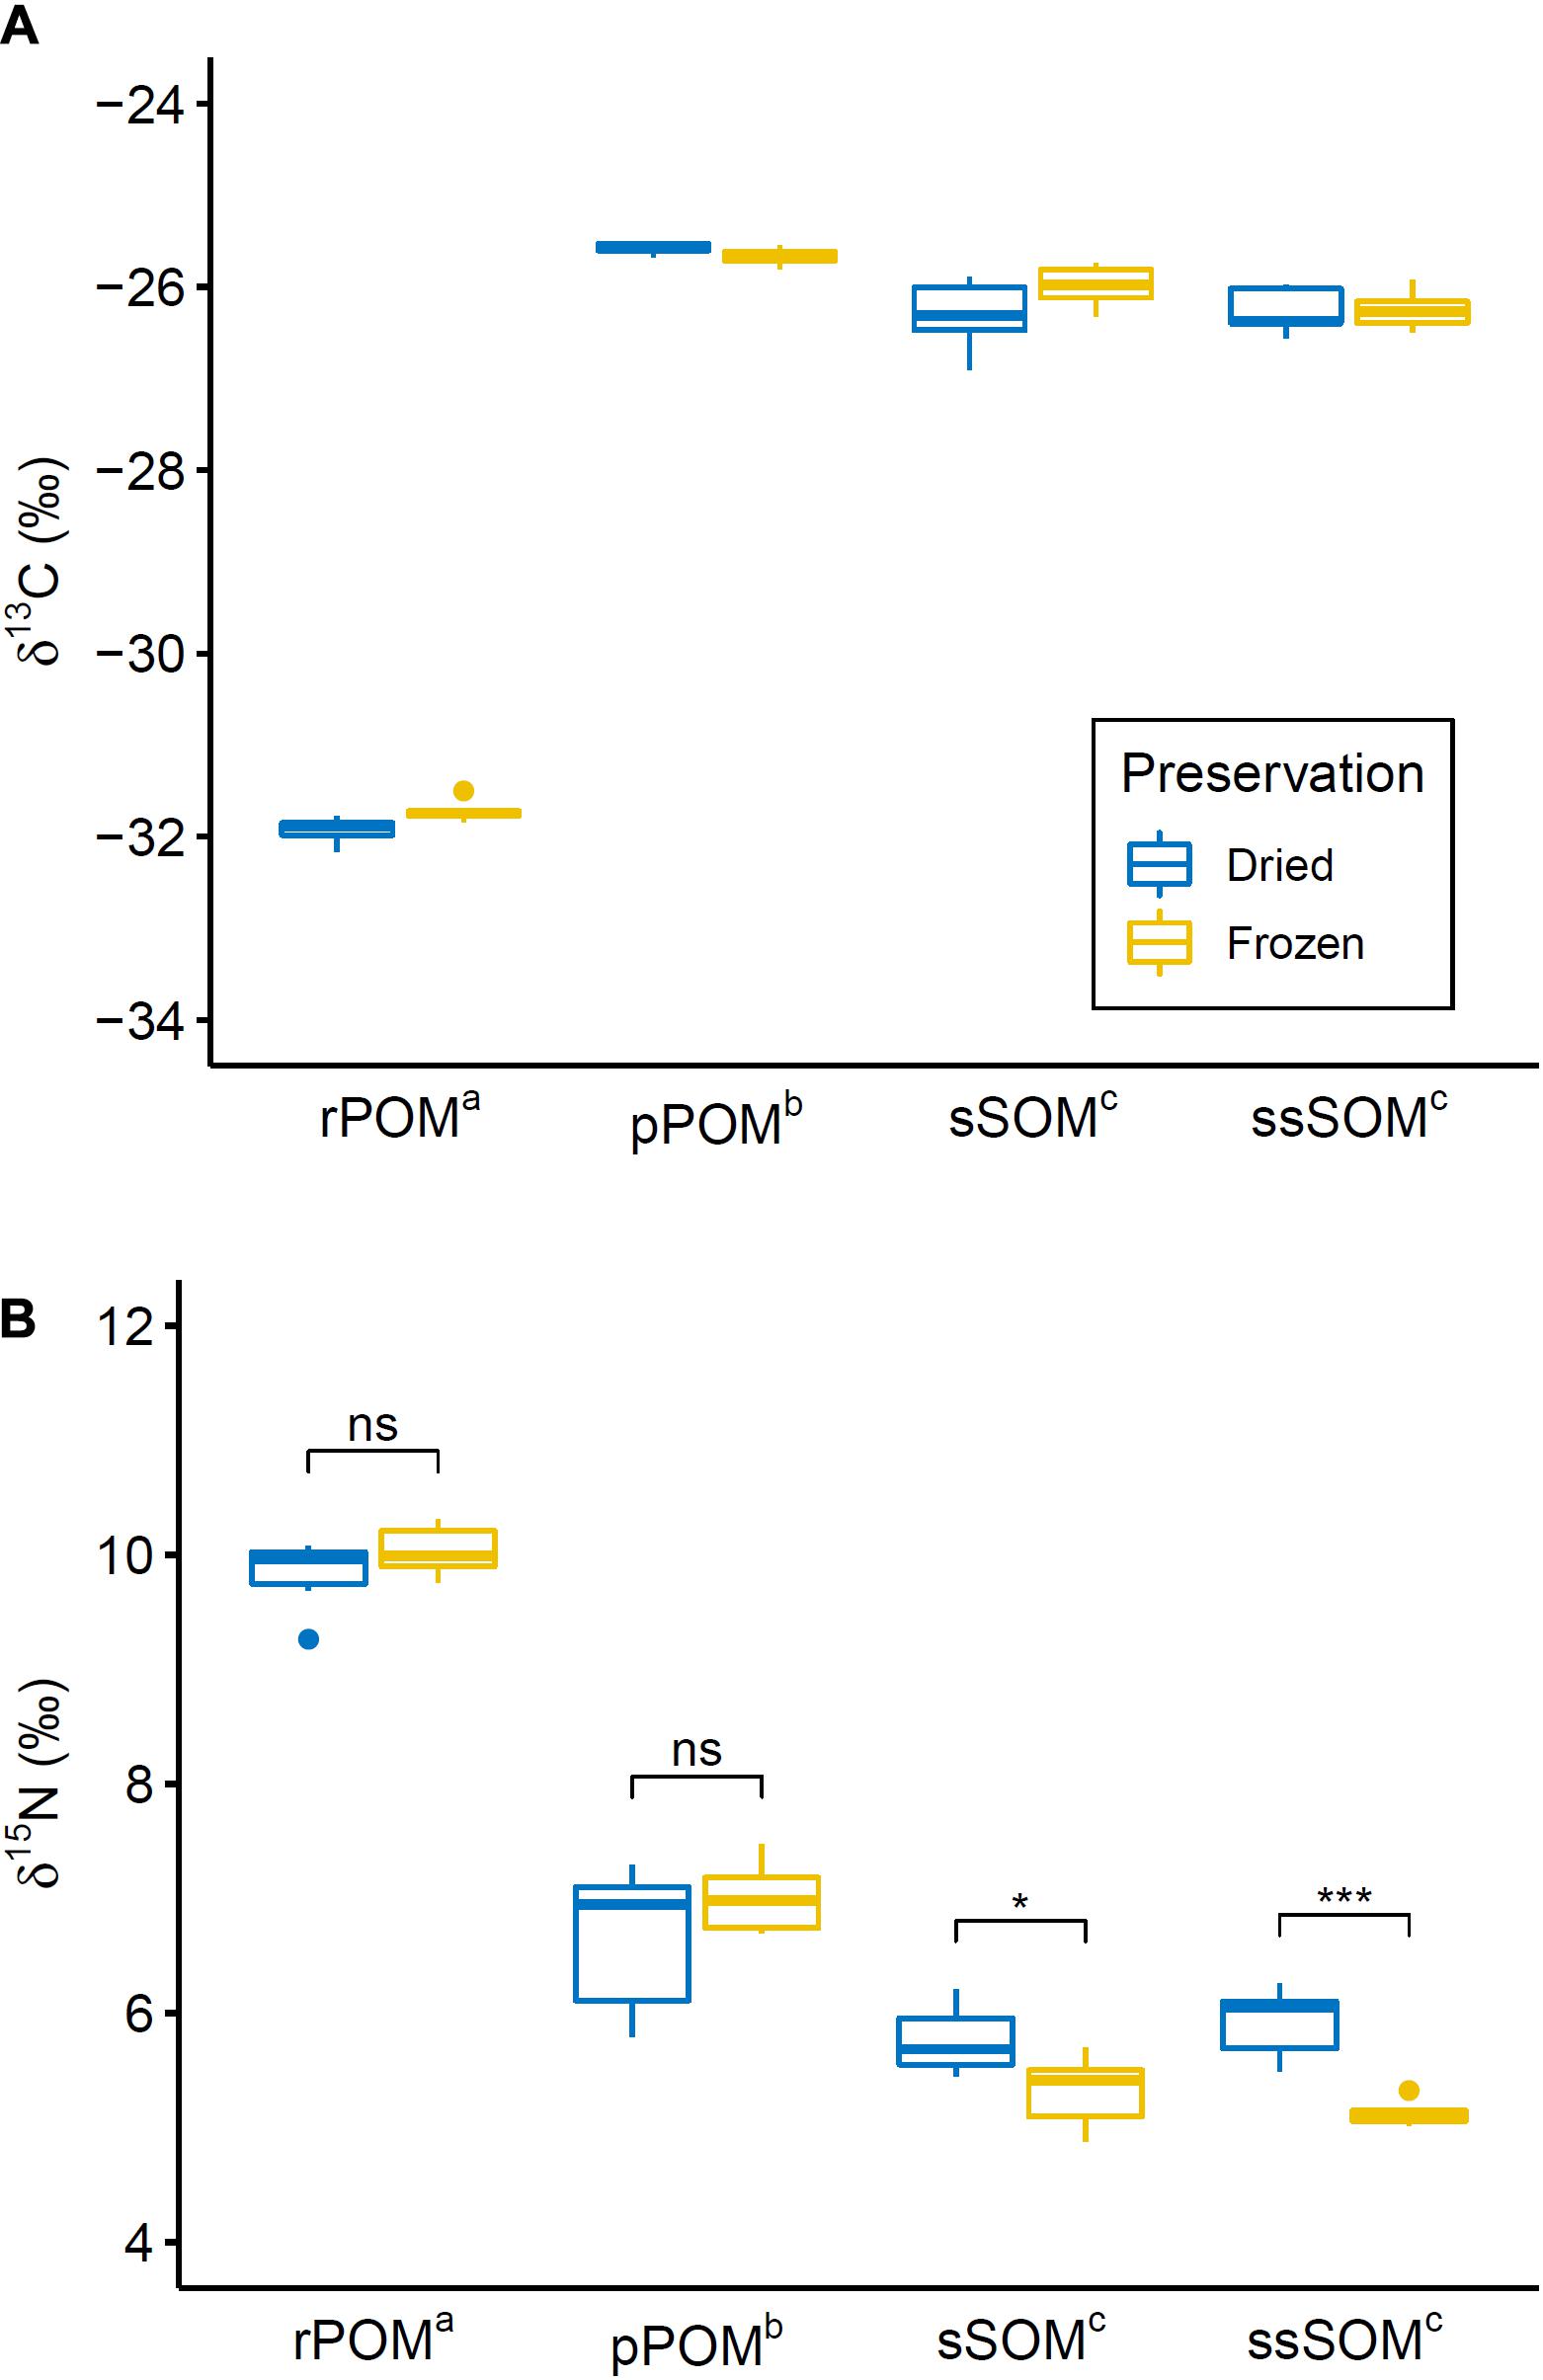
Figure 3. Boxplot showing (A) δ13C and (B) δ15N distribution for differently preserved OM sources through their quartiles. Points indicate weak outliers (i.e., outliers that did not cause violation of ANOVA assumptions). Extreme outliers (rPOMfrozen: δ13C = –33.27, δ15N = 10.49; pPOMdried: δ13C = –26.65, δ15N = 6.11; ssSOMdried: δ13C = –26.44, δ15N = 4.30) that were excluded from the analysis are not represented. Superscript letters indicate significantly different OM sources (i.e., OM sources with same letter are not significantly different from each other). Black brackets in (B) indicate significant interaction effect between organic matter source and preservation method as identified by post hoc test (significance levels: n.s. – not significant; * – p < 0.05; *** – p < 0.001). No brackets are shown in (A) since the interaction effect was not significant according to ANOVA and no post hoc test was conducted.
No effect of preservation method on δ13C of the OM sources was observed. For δ15N, however, a significant interaction effect between OM source and preservation method was identified by two way ANOVA [F(3,37) = 6.92, p < 0.001]. Pairwise comparison revealed that δ15N of sSOM and ssSOM was significantly lower in frozen samples in comparison to samples that were dried (Figure 3). Across all SOM samples, δ15N was on average 0.6‰ lower in frozen samples than in samples that were preserved by drying.
Fauna
Both studied isotopes showed a clear distinction between collected species (Figure 4). Across all preservation and pre-treatments C. crangon was on average enriched by 1.5 and 2.4‰ in 13C and 15N, respectively, in comparison to L. balthica. Overall, δ13C was more variable than δ15N. The total range of δ13C for each species for all treatments exceeded the difference between species and the δ13C range of the two species overlapped (Figure 4), which was not the case for the total range of δ15N.
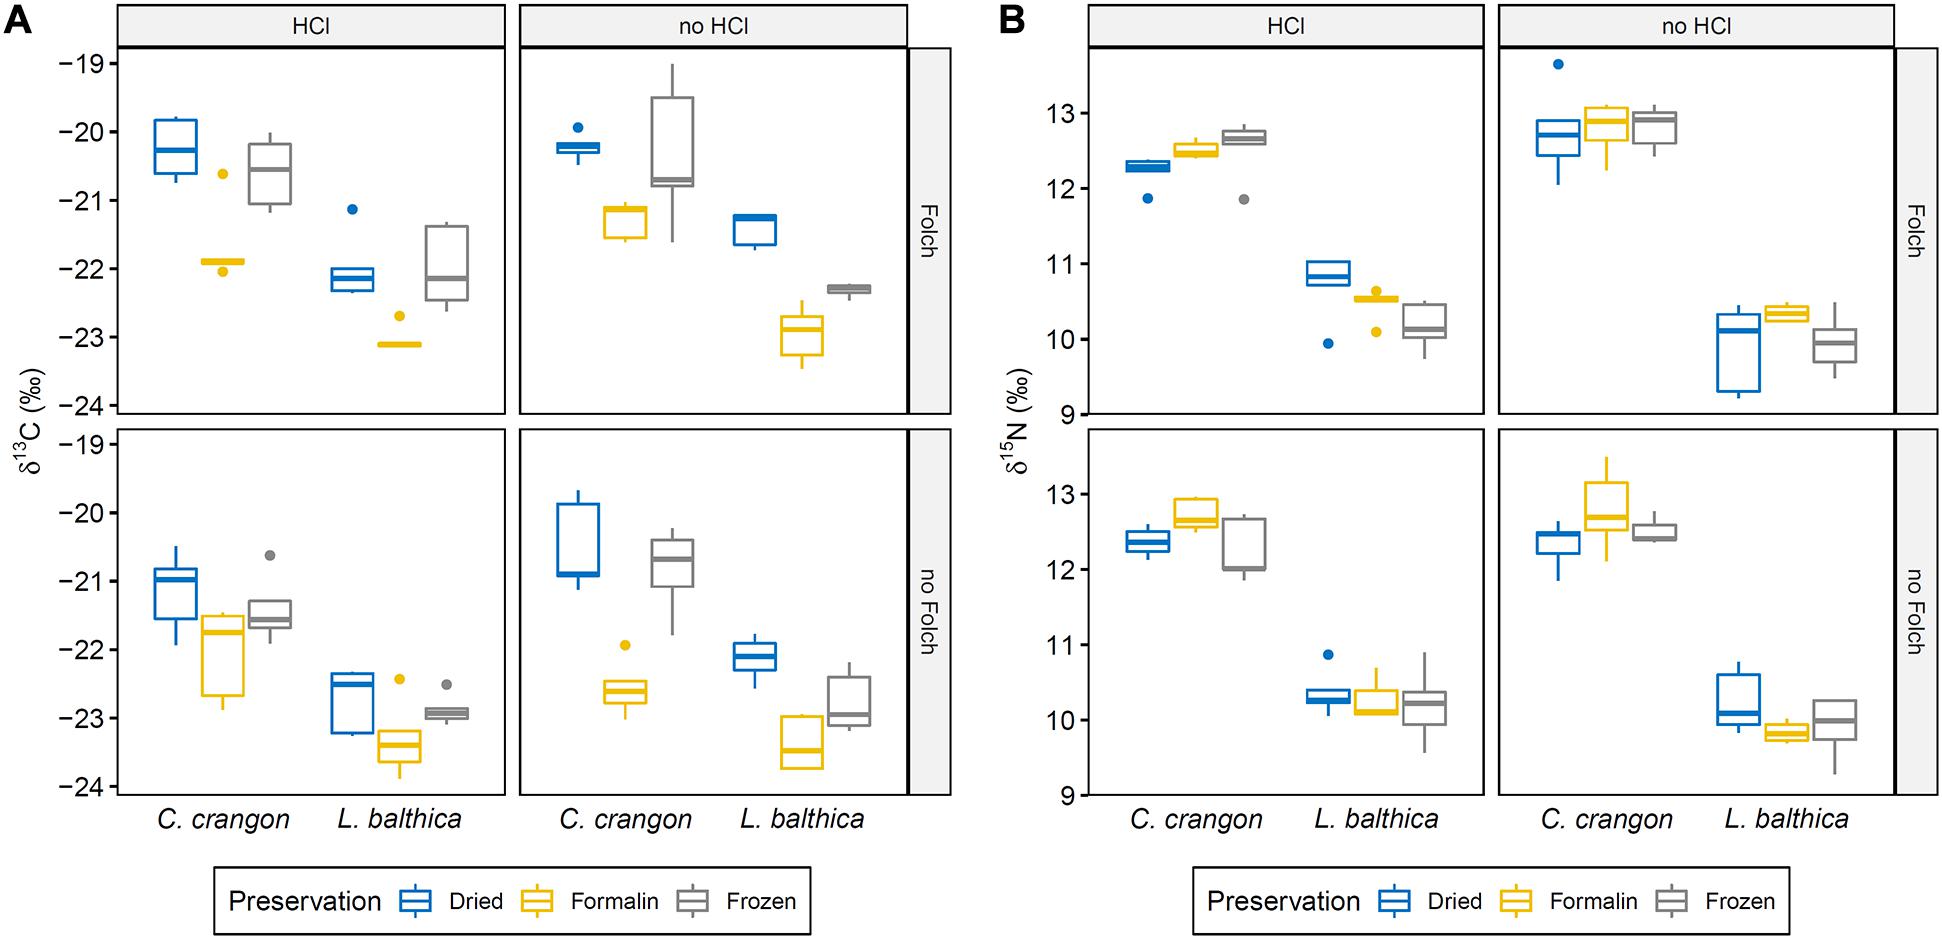
Figure 4. Boxplots showing (A) δ13C and (B) δ15N distribution for all preservation pre-treatment combinations for the two collected faunal species through their quartiles. Pre-treatment abbreviations: HCl – carbonate removal with hydrochloric acid; Folch – Lipid removal with Folch solution. Significant differences between groups are given in Table 1.
In addition to this species effect, a significant effect of preservation and both pre-treatments on δ13C was identified by ANOVA (Table 1). Each of these effects was independent and no interaction effect was identified. Pairwise comparisons showed significantly lower δ13C values after formalin preservation in comparison to drying (p.adj < 0.001) and freezing (p.adj < 0.001). No significant difference between δ13C values of dried and frozen samples was found (p.adj = 0.36).
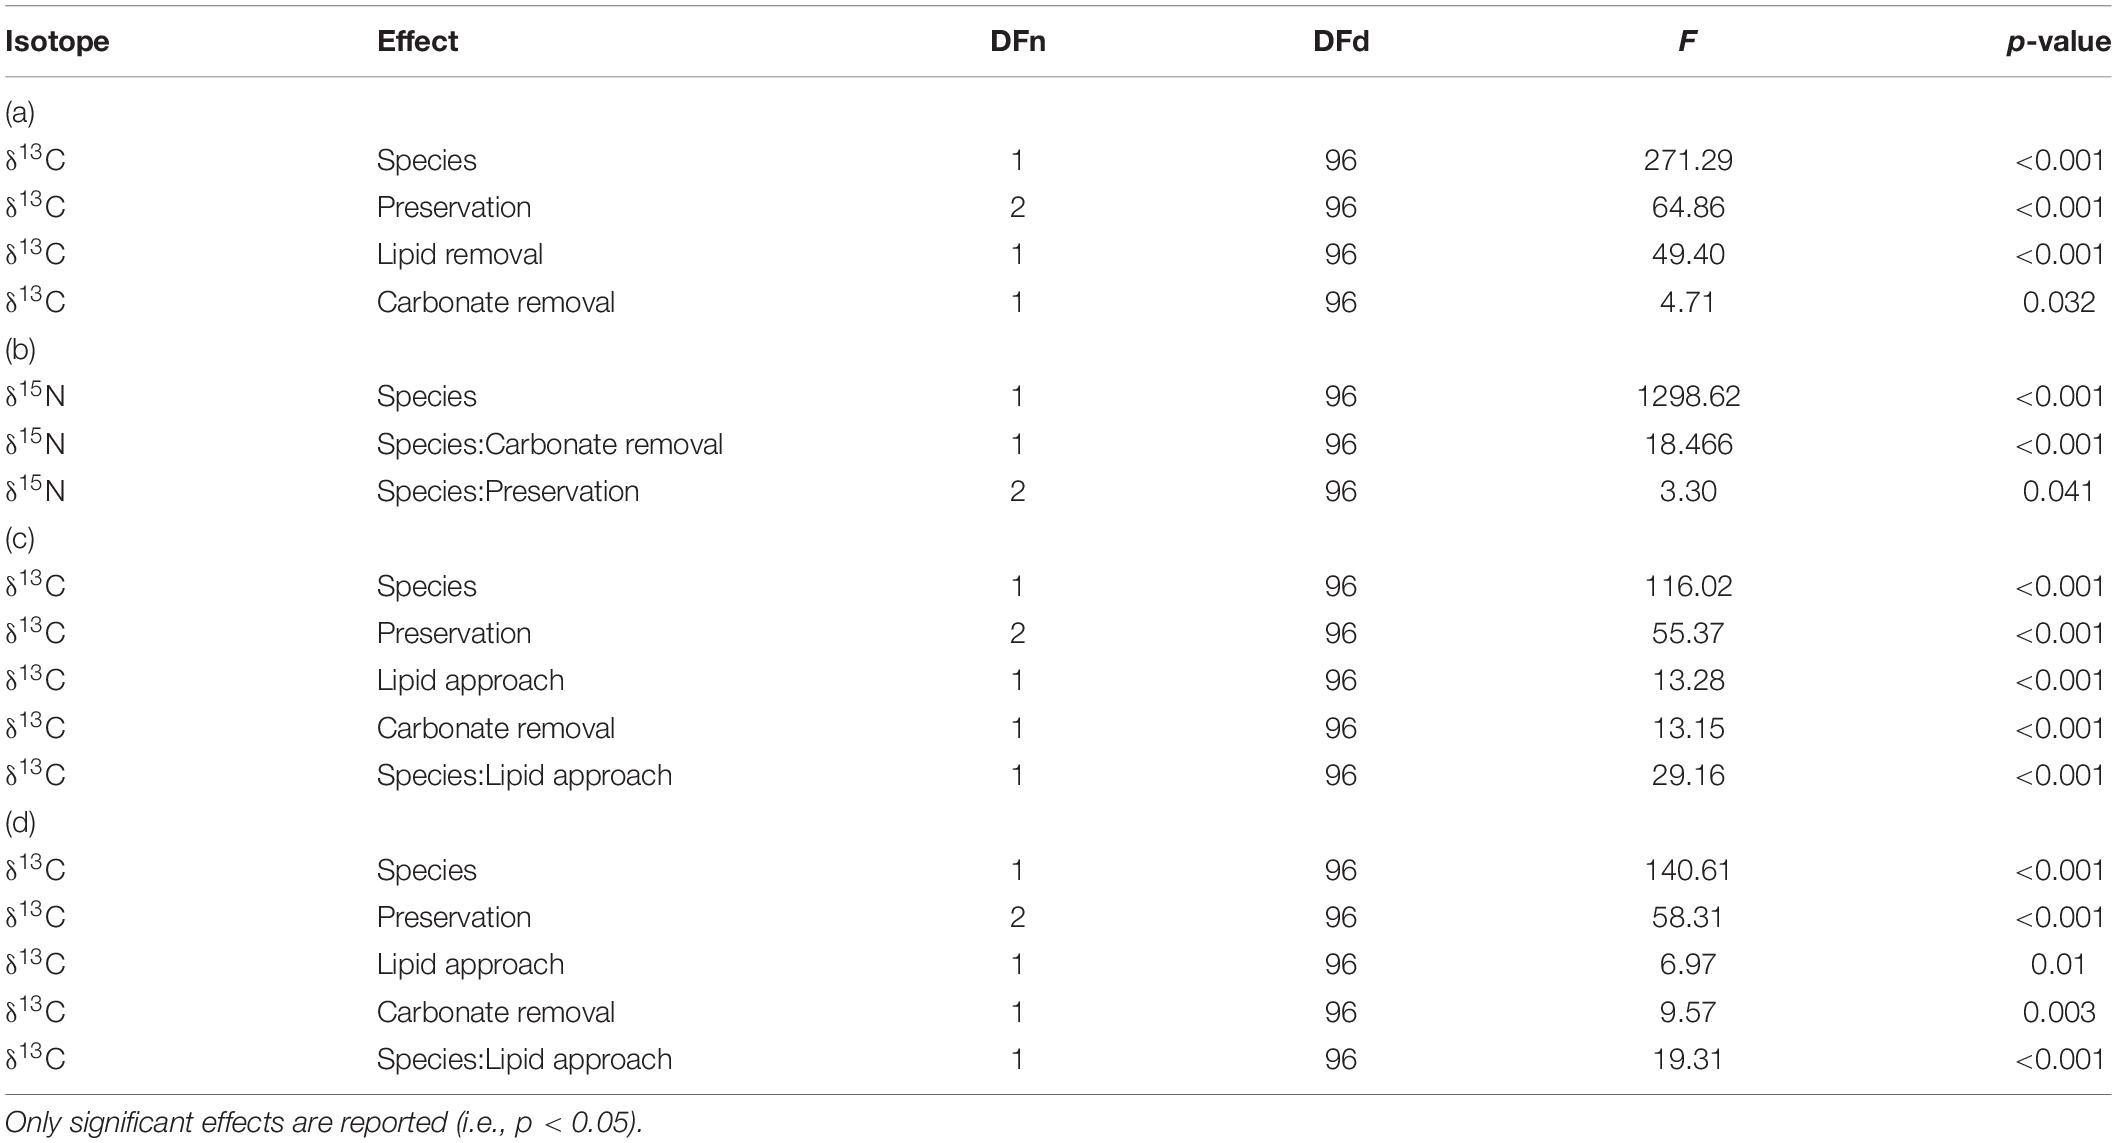
Table 1. Results of factorial ANOVA for preservation and pre-treatment effects on (a) δ13C and (b) δ15N of fauna samples. ANOVA results for δ13C with lipid removed vs. lipid normalized data are given for normalization according to (c) Post et al. (2007), and (d) McConnaughey and McRoy (1979).
For δ15N, ANOVA identified significant interaction effects between species identity and preservation method as well as between species identity and carbonate removal (Table 1). The effect of both interactions on individual δ15N measurements were low. However, post hoc testing showed that sample acidification significantly affected δ15N in both species (p.adjL. balthica < 0.001; p.adjC. crangon = 0.02), while no effect of preservation method was identified as significant. The direction of change after acidification was opposite for both species. Acidification caused an average enrichment of 15N in L. balthica samples by 0.4‰, but a depletion (−0.3‰) in C. crangon samples.
Lipid Normalization
All samples with lipids intact (i.e., samples not treated with Folch solution) had C:N > 3.5 (Table 2) and accordingly all samples were normalized by Post et al. (2007) formula. Most C. crangon samples (24 out of 30) and one L. balthica (out of 30) had a C:N ratio between 3.5 and 4.0 and accordingly McConnaughey and McRoy (1979) lipid normalization was applied only to the remaining 6 C. crangon and 29 L. balthica samples.
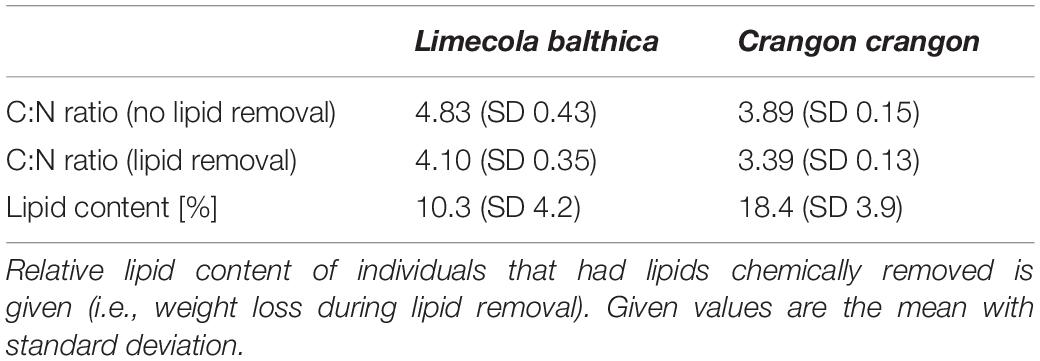
Table 2. C:N ratio (weight/weight) of the studied species with and without chemical lipid removal.
Factorial ANOVA showed that δ13C values after lipid normalization differed significantly between the studied species, preservation methods, and acidification for both normalization formulas (Table 1). Furthermore, neither formula achieved a non-significant result for normalized data vs. chemical lipid removal (i.e., lipid approach in Table 1). In addition to the independent treatment effects, both normalization formulas introduced a significant interaction effect between species identity and lipid approach. This interaction effect was the result of each normalization formula performing well for only one species. Lipid normalization according to Post et al. (2007) performed well for C. crangon, but poor for L. balthica (Figure 5). More accurate lipid normalization of L. balthica was achieved by the formula of McConnaughey and McRoy (1979), which in turn gave worse results for C. crangon than Post et al. (2007).
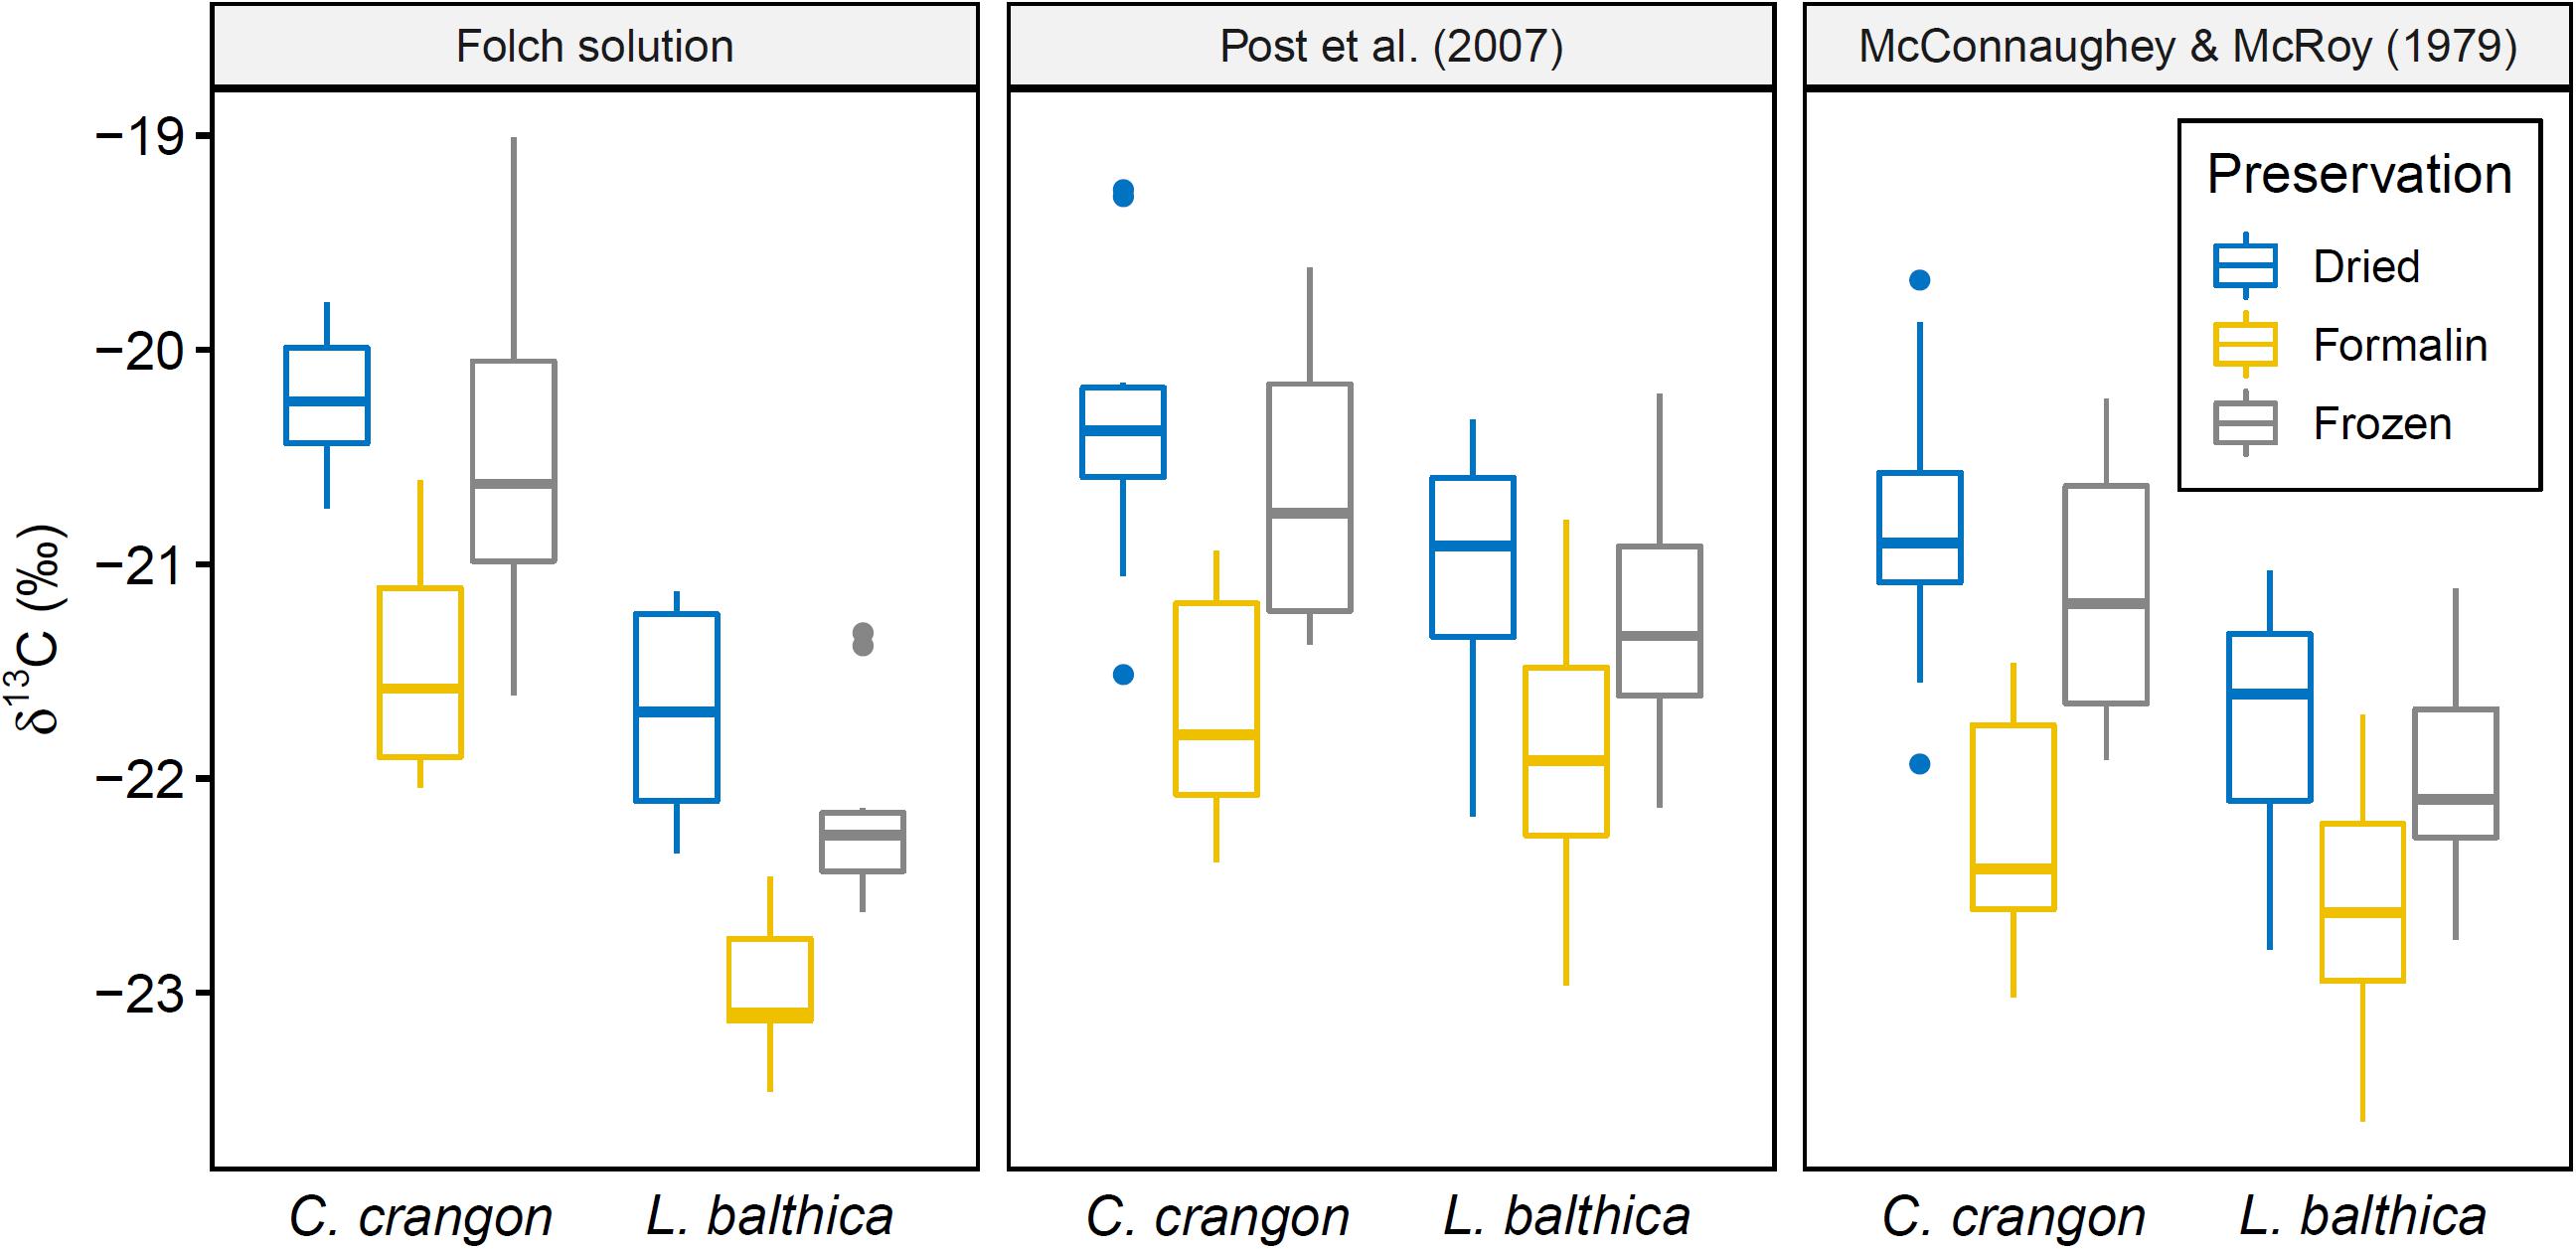
Figure 5. Boxplot showing δ13C distribution of samples with lipids removed chemically (Folch solution) and mathematical lipid normalization according to Post et al. (2007) and McConnaughey and McRoy (1979) of samples not treated with Folch solution. Preservation method is indicated. Acidified and non-acidified samples were combined for this figure.
Bayesian Mixing Models
Preservation and Pre-treatment Effects
Bayesian mixing models for L. balthica indicated a strong preservation effect on the model outcomes, which was further modified by pre-treatment methods (Figure 6 and Supplementary Material A1). For dried fauna pPOM was identified as main OM source across all pre-treatments for both OM source data sets (median BC = 0.01 for comparisons between pPOM and rPOM/SOM across all pre-treatments). However, the estimated pPOM contribution differed considerably between pre-treatments. pPOM contribution differed strongest between L. balthica that was treated with HCl only in comparison to samples that were treated with Folch solution only (BC = 0.55 and 0.57 for source data A and B, respectively). Estimated pPOM contributions were intermediate for samples that received no pre-treatment and samples that were treated with both: Folch solution and HCl. For frozen L. balthica samples the model results suggest a mixed diet of pPOM and SOM (Figure 6). A large overlap (BC > 0.65) between the probability distributions of pPOM and SOM was observed for all pre-treatments when source data A was used in the model. For source data B, the overlap between pPOM and SOM was smaller for L. balthica that was treated with Folch solution (BC = 0.56) and Folch solution and HCl (BC = 0.16). The estimated contribution of SOM was slightly higher for formalin preservation than for freezing. Nonetheless, pPOM and SOM contribution to formalin preserved L. balthica was overall similar to the models for frozen samples for both OM source data sets (Figure 6; median BC = 0.82). The estimated contribution of rPOM, however, (median diet proportion ∼0.2 across all pre-treatments, Figure 6) was higher for formalin than for dried and frozen samples. This difference in rPOM contribution between formalin and dried/frozen samples was particularly strong for samples that were treated with Folch solution (with and without HCl treatment) (median BC = 0.06). In contrast, rPOM probability distributions showed an intermediate overlap (median BC = 0.53) between formalin and dried/frozen L. balthica when no pre-treatment or only HCl was used. For L. balthica, the overlap between model results was large when results based on OM source data A were compared with OM source data B (median BC = 0.92 across all preservation and pre-treatments; Supplementary Table A29).
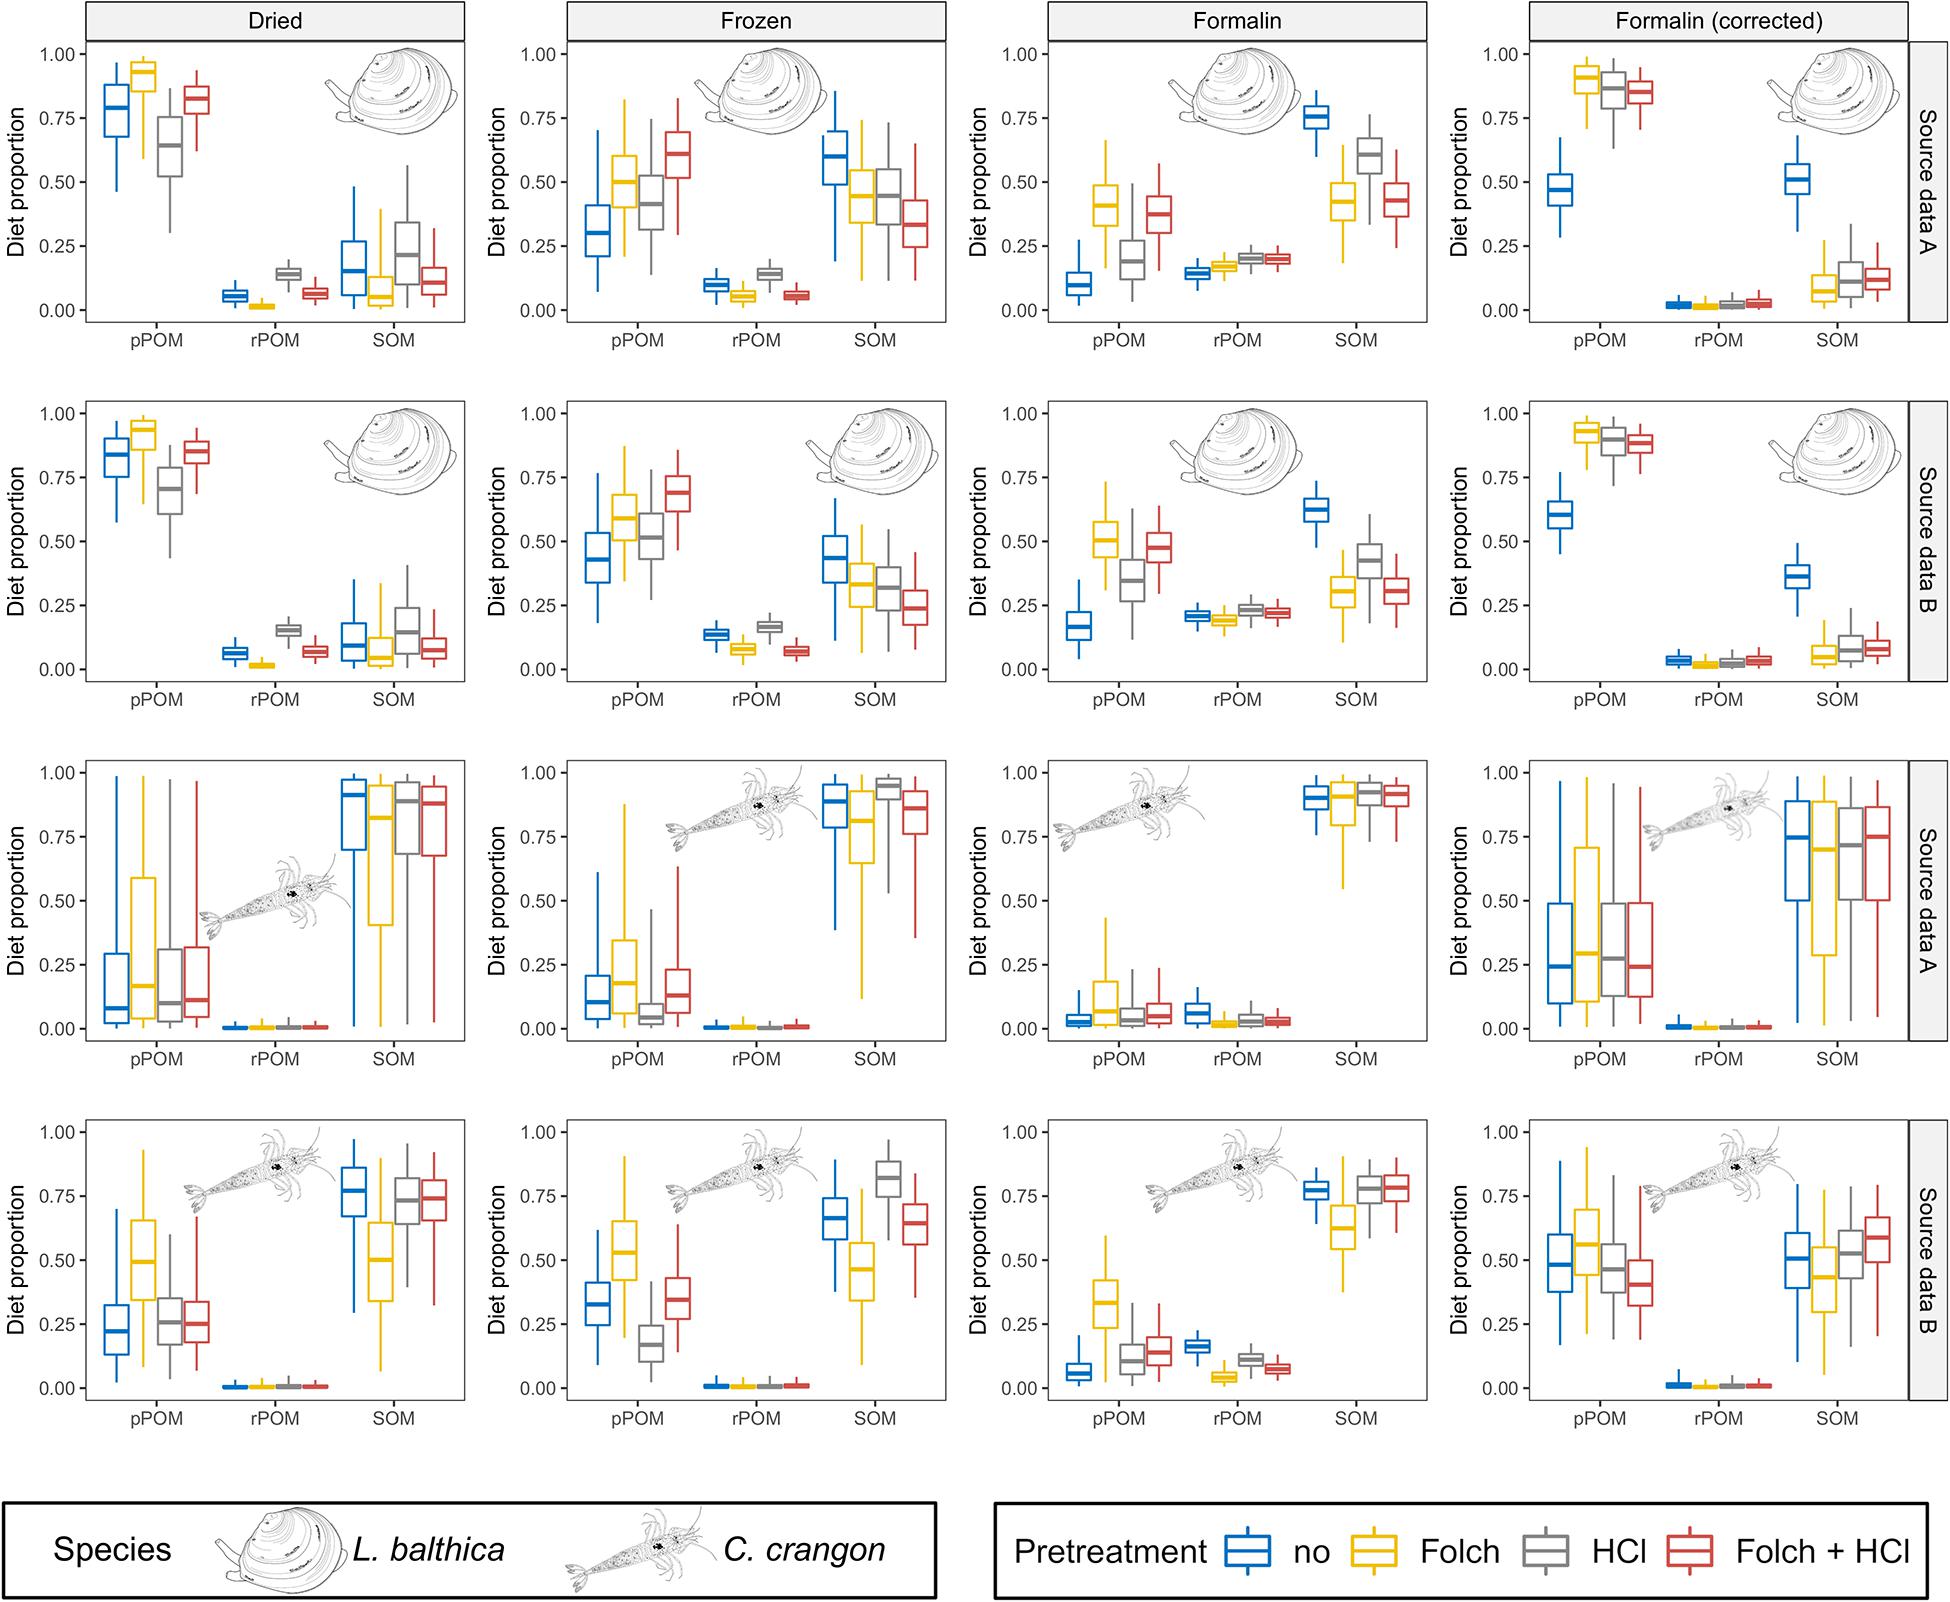
Figure 6. MixSIAR results for dried, frozen, and formalin preserved fauna are shown together with formalin corrected data according to Vander Zanden et al. (2003). Posterior distributions for L. balthica and C. crangon diet proportions (species identity indicated for each model outcome). Source data used in the models are indicated by gray box for each row. Colors indicate the applied pre-treatments. Boxplots depict median (horizontal line) with 50% (box) and 95% credible intervals (vertical line).
In contrast to L. balthica, model results for C. crangon indicated a strong reliance on SOM across all preservation methods when OM source data A was used (Figure 6). The used OM source data, however, had a considerable impact on the model outcome. Across all preservation and pre-treatments, source data set B resulted in an increased contribution of pPOM to C. crangon diet in comparison to source data set A (median BC = 0.77 across all preservation and pre-treatments; Supplementary Table A29). While only a weak preservation effect on the median model results was observed, the width of the probability distributions and accordingly the overlap between pPOM and SOM decreased from dried (median BC = 0.77) to frozen (median BC = 0.43) and further to formalin preserved samples (median BC = 0.01). The effect of sample pre-treatment on C. crangon mixing model results was overall lower than for L. balthica. Only sample pre-treatment with Folch solution and no HCl caused an increased estimated contribution of pPOM (Figure 6). The difference for this increase was low among preservation methods but increased when source data set B was used in the model. HCl treatment caused only minor changes to model outcomes. For samples that received both pre-treatments, however, HCl treatment seems to cancel out the effect of prior treatment with Folch solution.
Mathematically Corrected Data
Formalin correction resulted in a changed model outcome for L. balthica (Figure 6). Modeling results after formalin correction reflected almost exactly the results of dried samples for pre-treatments with Folch solution and Folch solution and HCl for both OM source data sets (median BC = 0.97). For no pre-treatment (median BC = 0.53) or pre-treatment with HCl only (median BC = 0.61), formalin correction made results more similar to dried samples, but the contribution of pPOM was underestimated and overestimated for no pre-treatment and HCl pre-treatment, respectively (Figure 6). Due to the high similarity between frozen and formalin posterior distributions (median BC = 0.68 across all pre-treatments for both OM sources), formalin correction caused an overall greater dissimilarity in comparison to frozen samples (median BC = 0.47 across all pre-treatments for both OM sources).
Formalin correction lead to an increased contribution of pPOM to the diet of C. crangon, making the results most similar to dried C. crangon (Figure 6). However, the median contribution of pPOM was overestimated on average by 0.15 and 0.17 for OM source data A and B, respectively. This strong effect was, however, accompanied by high BC values (median BC = 0.95 and 0.90 for OM source data A and B, respectively), due to the fact that formalin correction caused similarly wide probability distributions as dried samples. Since the median reliance of C. crangon on pPOM was lower for all preservation methods, results after formalin correction differed considerably from all preservation methods.
The effects of mathematical lipid normalization were quite variable (Figure 7 and Supplementary Material A). In contrast to the above described species-specific applicability of the two normalization methods, modeling results for both methods were similar for dried and frozen fauna (Supplementary Figures A5, A6, A12, A13). Only when lipid normalization was applied to formalin preserved samples, modeling results clearly differed between the two methods (Supplementary Figures A7, A14).
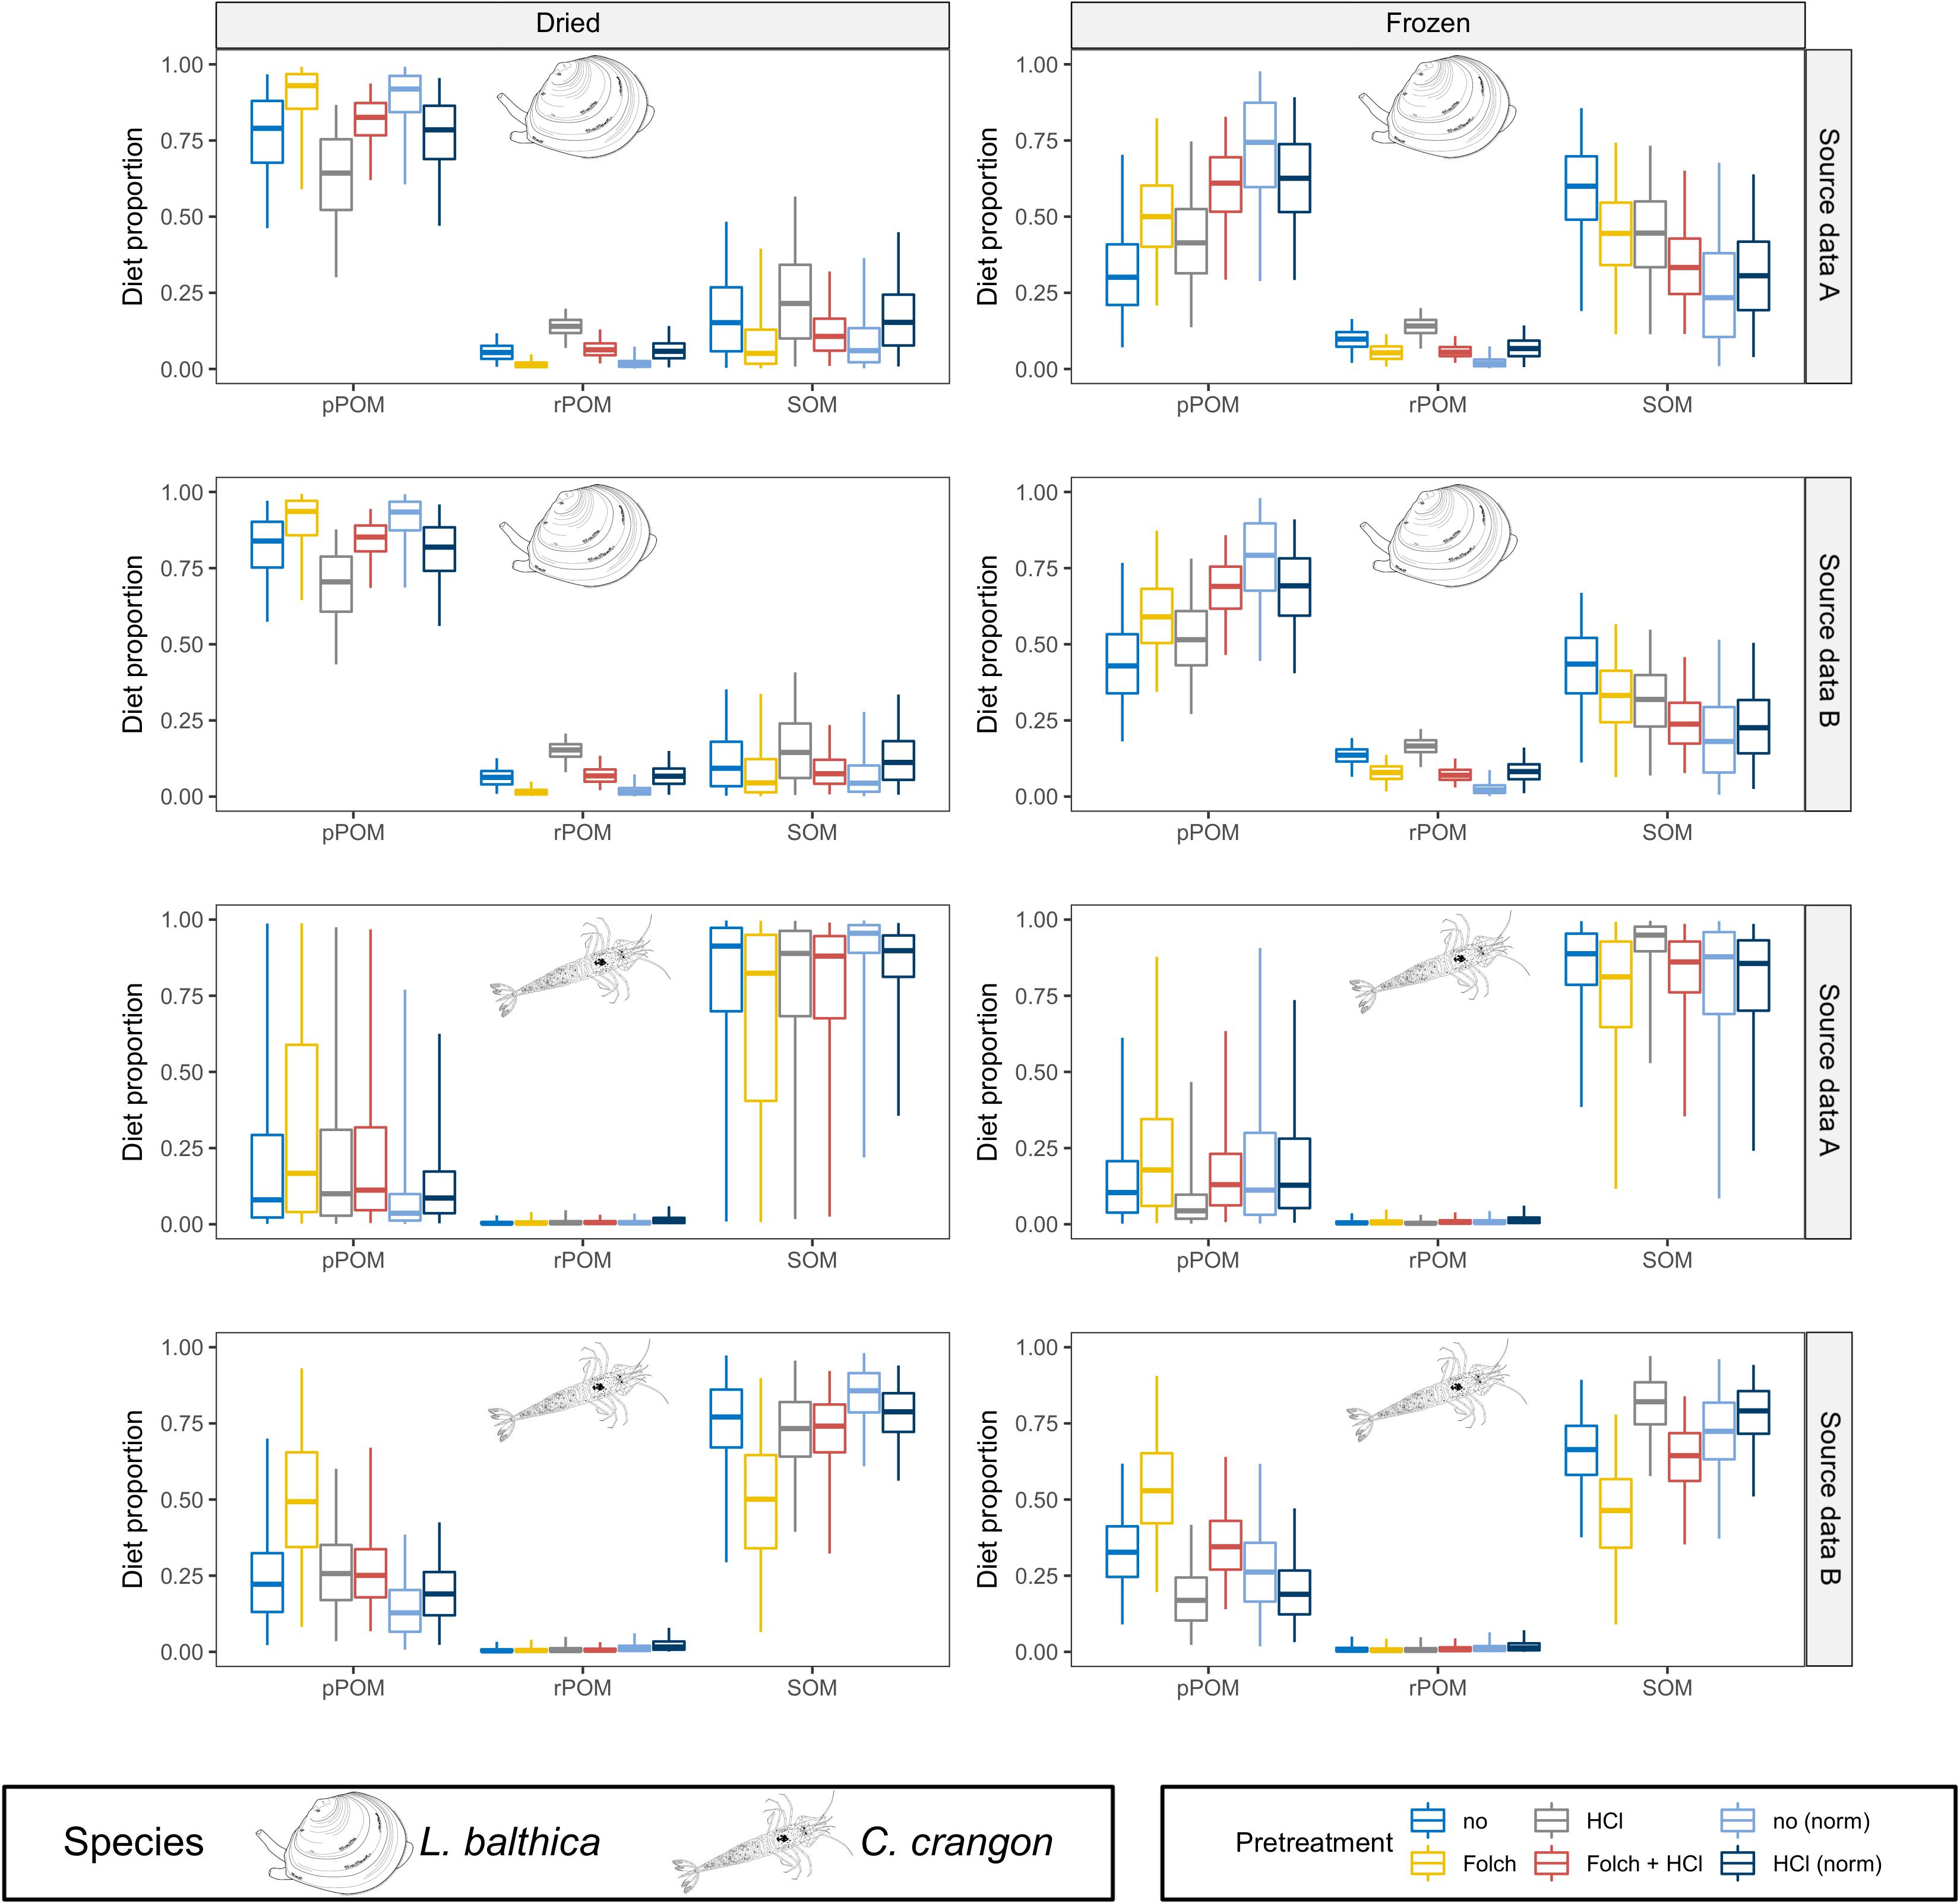
Figure 7. MixSIAR results for lipid normalized data. Posterior distributions for L. balthica [lipid normalized according to McConnaughey and McRoy (1979)] and C. crangon [lipid normalized according to Post et al. (2007)] diet proportions are shown for comparison next to lipid intact and lipid removed samples. Source data used in the models are indicated by gray box for each row. Colors indicate the applied pre-treatments and lipid normalization. Only results for dried and frozen samples are given. Boxplots depict median (horizontal line) with 50% (box) and 95% credible intervals (vertical line).
Modeling results of lipid normalized [according to McConnaughey and McRoy (1979)] dried L. balthica almost perfectly reflected model results of samples that had lipids removed with Folch solution (with and without HCl treatment) (Figure 7; median BC = 0.98). For frozen samples, however, this effect was only achieved for samples treated with HCl (median BC = 0.97). For frozen samples that were not treated with HCl, however, the median BC (0.81) was slightly lower than for the comparison between lipid intact and lipid removed samples (median BC = 0.84). Although these BCs indicate lipid normalized data and lipid intact modeling results being almost equally different from lipid removed samples, the model results between lipid intact and normalized data differed strongly (Figure 7), since the lipid intact model underestimated the contribution of pPOM in comparison to lipid removed samples, while lipid normalized data overestimated the contribution of pPOM. For lipid normalized formalin preserved L. balthica, normalization according to McConnaughey and McRoy (1979) performed better than normalization according to Post et al. (2007) (Supplementary Figures A7, A14). Posterior distributions of pPOM and SOM were improved after normalization according to McConnaughey and McRoy (1979). rPOM contribution estimates, however, were more different from lipid removed samples after lipid normalization.
Lipid normalization [according to Post et al. (2007)] had only a small effect on modeling results for C. crangon and results for lipid normalized data mirrored the results of the original, and not normalized, data (median BC = 0.95 across all preservation and pre-treatments for both OM source data sets). Accordingly, lipid normalization failed to reproduce the increased contribution of pPOM that was found for samples that were treated with Folch solution only (Figure 7).
Discussion
We report diverse effects of different preservation and pre-treatment methods on δ13C and δ15N ratios of the two studied species: L. balthica and C. crangon. The effects of preservation, lipid removal, and carbonate removal were relatively large for δ13C values, while the absolute effect on δ15N values was generally small. This is in agreement with previous studies that consequently highlighted that the methodological approach should be adjusted to optimize δ13C (Søreide et al., 2006; Lau et al., 2012). However, in contrast to previous studies, Bayesian SIMMs were used in this study to assess impacts on the results of data analyses. Modeling results showed that preservation and pre-treatment effects were variable and not directly linked to the strength of the absolute change of δ13C and δ15N signatures. This was highlighted particularly by the contrast between univariate analysis and MixSIAR for L. balthica. While the univariate analysis found no significant difference between dried and frozen L. balthica for both isotopes, the mixing model results suggested a different diet composition. In contrast, the univariate analysis found a significantly lower δ13C in formalin preserved samples in comparison to both, dried and frozen samples. Nonetheless, mixing model results of frozen and formalin preserved samples resembled each other closely. Consequently, small and not significant changes in SI ratios introduced by different preservation and pre-treatments (this study; Lau et al., 2012) display a so far unrecognized source of error in SIMMs. The observed preservation effects were strongest for formalin preserved samples, but also freezing, which is currently thought to be a less invasive preservation method, had a clear impact on modeling results. In addition to effects on fauna’s SI signatures, freezing also affected the δ15N values of SOM, which introduced another alteration of the mixing model result, but only for C. crangon. This effect of freezing is in strong contrast to the current believe that freezing should be used as the best method to preserve samples for SIA (Bosley and Wainright, 1999; Edwards et al., 2002).
Diet Composition of Limecola balthica and Crangon crangon
It is well documented that L. balthica is capable of suspension feeding as well as deposit feeding (Hummel, 1985; Törnroos et al., 2015) and accordingly a reliance on pPOM and SOM seem equally possible. It has, however, been shown that suspension feeding allows for deeper burial than deposit feeding, since the clam does not have to extend its inhalant siphon over the sediment surface (Hummel, 1985; Lin and Hines, 1994). Accordingly, suspension feeding provides better protection from predation and is the preferred feeding mode in situations with abundant food suspended in the water and epibenthic predators, like C. crangon, present (Kamermans and Huitema, 1994; Lin and Hines, 1994). Consequently, a high reliance of L. balthica on pPOM, as indicated by mixing model for dried samples, is likely, since sampling was conducted toward the end of the spring bloom when suspended OM was abundant in the sampling area.
Mixing model results suggest a strong reliance of C. crangon on SOM across all combinations of preservation and pre-treatment methods. The only exception were samples treated with Folch solution (but not with HCl) which showed a trend toward a considerable reliance on pPOM (Figure 6). Furthermore, the reliance of C. crangon on pPOM was around 0.15 higher when source data B (frozen sediment) was used as opposed to source data A (dried sediment). The overall high reliance of C. crangon on SOM is in agreement with previous studies that describe this species as a generalist benthic carnivore (Pihl and Rosenberg, 1984; Oh et al., 2001). For the smaller size classes of C. crangon (similar to the individuals in this study) it is likely that meiofauna constitutes a large proportion of their prey (Pihl and Rosenberg, 1984; Feller, 2006). Meiofaunal taxa are often specialized on consumption of detritus, bacteria or microphytobenthos (Carman and Fry, 2002) and consequently a high indirect reliance of C. crangon on SOM seems likely.
Organic matter from the Vistula river (rPOM) was not identified as a considerable OM source in the diet of both species. Sampling during the spring bloom (rich in marine production) and a long period with low river inflow during winter (low input of rPOM) support such a high reliance of fauna on pPOM and SOM. Nonetheless, it is important to point out that the low contribution of rPOM to the diet cannot be interpreted as an indication that the studied species do not consume rPOM. The reason for this interpretation is related to the fact that both pPOM and SOM that were collected at the study locations are potentially mixtures of autochthonous (marine OM) and allochthonous (rPOM) production (Maksymowska et al., 2000). The study location is influenced by the outflow of Vistula river and accordingly the OM collected at the study location cannot be considered entirely free of rPOM. Consequently, the strong contribution of SOM and pPOM to the diet of C. crangon and L. balthica, respectively, demonstrates that primary consumers do not select for rPOM. However, the preference of L. balthica is for suspended and possibly fresh OM while C. crangon preys on organisms that rely on SOM.
Preservation and Pre-treatment Effects
Mixing model results highlighted that frozen and formalin preserved L. balthica samples performed poorly, in comparison to dried samples. Formalin preservation performed worse than freezing, but the results suggest that both preservation methods should be avoided. Particularly the impact of freezing on modeling outcomes was unexpected, since samples are commonly frozen in other studies that use Bayesian SIMMs (e.g., Jankowska et al., 2018). Our modeling results for frozen acidified L. balthica with source data B (median estimated contribution of SOM: 29%) was similar to results in a previous study in the close-by Puck Lagoon that estimated 29 and 37% contribution of SOM to L. balthica diet during spring (Ziółkowska et al., 2018). Ziółkowska et al. (2018) preserved their samples by freezing and also acidified samples prior to SIA. Consequently, we suggest that the contribution of SOM might be overestimated in their study and the development of a mathematical correction for SIs for frozen samples, similar to the existing corrections for formalin preservation, might seem advisable. However, since freezing causes only small, taxon specific and often not significant changes in SI ratios (this study; Bosley and Wainright, 1999; Wolf et al., 2016) a possible development of any mathematical correction for frozen samples seems unlikely.
The potential mechanisms behind isotopic fractionation due to freezing are not well understood. Most commonly, authors who observed isotopic changes after freezing explain it by a potential damage to cells and tissues that can cause a loss of fluids that are potentially isotopically enriched (Feuchtmayr and Grey, 2003; Syväranta et al., 2011; Wolf et al., 2016). However, no study has measured whether fluids released through freezing and thawing have a different isotopic composition than the remainder of the material (Wolf et al., 2016). Freezing and formalin preservation also affected the mixing model outcome for C. crangon. The magnitude of change, however, was rather low and the choice of preservation method appeared unimportant for this species in the present study.
Since the effect of freezing on SIA is only poorly understood, it is worth re-considering whether freezing could be considered the better “reference” preservation method (de Lecea et al., 2011). Based on studies that suggested no difference between oven-drying and freeze-drying (Bosley and Wainright, 1999; Carabel et al., 2006; Bessey and Vanderklift, 2014; Akamatsu et al., 2016), we chose to freeze-dry frozen and formalin preserved fauna and frozen sediment samples to make the homogenization of the samples easier. In an experiment on the effects of freeze/thaw cycles on SI ratios de Lecea et al. (2011), however, found that oven-drying caused a slight increase of δ13C and δ15N in 6 fish species in comparison to freeze-drying. The authors suggested that this difference can be the result of the loss of volatile and isotopically lighter compounds, such as lipids, urea, or amino acids, during oven-drying. Based on this assumption we would expect higher δ13C and δ15N in dried fauna samples in comparison to frozen samples that were dehydrated by freeze-drying. However, no significant difference between dried and frozen fauna was found and it seems likely that only the freezing prior to oven-drying makes this loss of volatile substances possible. However, we observed a depletion in 15N for freeze-dried (frozen preservation) in comparison to oven-dried SOM, but not for 13C. Whether the loss of volatile compounds could cause such an enrichment in15N depends first of all on the presence of these compounds in SOM. Amino acids can be found in marine sediments, but in much lower concentrations than in fauna or POM (Wang et al., 2018). Accordingly, it is unlikely that a loss of lighter amino acids during oven-drying caused the observed difference in δ15N of SOM. Furthermore, individual amino acids differ in both δ13C and δ15N ratios (e.g., Pollierer et al., 2019) and we assume that the loss of specific amino acids should have caused a change in both isotopes. Consequently, the higher δ15N in dried SOM samples could indicate the breakdown of urea to ammonia and the consecutive loss of the gaseous ammonia (de Lecea et al., 2011). Urea is excreted by fauna and bacteria in sediments (Pedersen et al., 1993). However, urea has a short turnover time (Pedersen et al., 1993) and excretion of ammonia, and not urea, is typically dominating the excretion of excess nitrogen in benthic fauna (Allen and Garrett, 1971). Accordingly, it seems possible, but unlikely that considerable amounts of volatile amino acids or urea could have been present in our SOM samples and that they were lost during the oven-drying process.
In contrast to SOM, we did not observe a significant difference between dried and frozen fauna for either element. This difference in the effect of the frozen treatment between SOM and fauna cannot be explained by the dehydration method, but it could be related to the freezing temperature, since OM and fauna samples were frozen at −20 and −80°C, respectively. Specific fatty acids, proteins, and pigments degrade faster at −20°C than at −80°C (Wasmund et al., 2006; Nazemroaya et al., 2009), even though samples were only stored for 6 weeks. However, such a degradation does not affect SI ratios by itself. Only if there is a fractional loss or addition of C or N compounds from the samples the SI ratios might be changed. The biggest effect of freezing is the breaking of cells due to the freezing water and a following leak of compounds, which can be volatile or be part of water draining out of the samples. Furthermore, if degradation of pigments or proteins at −20°C should cause an enrichment in 15N, the same should have happened to POM samples. POM contains typically a higher fraction of fresh OM than SOM. Accordingly, the potential of degradation of labile compounds during freezing at −20°C to affect SI ratios is higher for POM and not for SOM. However, no difference in SI ratios of dried and frozen POM samples was observed.
Based on these considerations, we think that a potential loss of volatile substances during oven-drying or different freezing temperatures cannot explain the observed enrichment of SOM in 15N and accordingly agree with previous studies (e.g., Feuchtmayr and Grey, 2003; Syväranta et al., 2011) that considered fresh, oven-dried samples as the appropriate preservation method for control treatments.
Limecola balthica tissues were removed from their carbonate shells and the effect of carbonate removal on C. crangon isotopic composition has previously been shown to be non-significant (Jaschinski et al., 2008). Accordingly, HCl treatment has not been considered necessary for the fauna in this study. The effect of HCl treatment on δ13C, δ15N, and modeling outcomes was weaker but more variable than that of lipid removal. Nonetheless, ANOVA showed that both pre-treatments applied in our study had significant effects on at least one isotope for both species. Furthermore, modeling outcomes were affected by both pre-treatments with an interaction between the two pre-treatments for C. crangon. For L. balthica, the effect of treatment with Folch solution and HCl on SIMM results was approximately the additive effect of both individual pre-treatments. In contrast, HCl treatment did not affect mixing model results for C. crangon individually. However, in combination with Folch solution, HCl canceled out the strong effect of Folch solution on modeling results. This interaction of the pre-treatments for C. crangon has not been identified by ANOVA and depicts a strong discrepancy between univariate analysis and mixing model.
Mechanisms behind isotopic fractionation due to acidification are diverse (Schlacher and Connolly, 2014) and accordingly the causes for the isotopic ratios and modeling results in this study are difficult to address. However, the species-specific effect of acidification on δ15N indicate a potential role of chitin in the exoskeleton of crustaceans. Serrano et al. (2008) argued that HCl treatment of crustaceans may cause a shift of δ13C and δ15N through the known C and N loss due to hydrolytic depolymerization and deacetylation of chitin caused by the acidification (Percot et al., 2003). Although this has not been tested (Schlacher and Connolly, 2014), it provides a possible explanation for the species-specific acidification effects observed in this study.
Mathematically Corrected Data
In comparison to dried samples, 13C was depleted after formalin preservation on average by 1.1 and 1.4‰ for L. balthica and C. crangon, respectively. The depletion in comparison to frozen samples was slightly lower with 0.7 and 1.1‰, respectively. Consequently, a greater similarity to dried sample modeling results was expected after formalin preserved samples were corrected by addition of 1.28‰, since average δ13C after correction was within the range of dried samples. This assumption was, however, only met for L. balthica, while C. crangon modeling results overestimated the pPOM contribution after formalin correction. In contrast to the low reliance of C. crangon on pPOM for all preservation methods, the estimated reliance on pPOM increased after formalin correction (Figure 6). Since δ13C values were much closer to dried samples after the correction, the small and insignificant (according to post hoc test) species-specific effect of formalin preservation on δ15N values is likely responsible for the contrasting effect of formalin correction on the model outcomes. δ15N values of formalin preserved L. balthica were on average by less than 0.1‰ higher than for dried samples, and those of C. crangon by 0.3‰. These enrichments were comparable to the majority of formalin induced changes to δ15N reported in the literature (Lau et al., 2012). Our results for C. crangon, however, demonstrate that the correction of δ13C alone cannot compensate for a preservation effect on both SIs, even if the effect on δ15N is small and not significant. For L. balthica, on the other hand, with the preservation effect on δ15N being close to 0, the correction of δ13C achieved an improvement of modeling results by making them similar to results for dried samples.
The main physico-chemical processes of formalin preservation are the diffusion of methylene glycol and small amounts of non-hydrated formaldehyde into the tissue, followed by the covalent binding of the formaldehyde to some amino acids (Thavarajah et al., 2012). This reaction consumes the formaldehyde, shifting the balance between methylene glycol and formaldehyde, and causes more methylene glycol to dehydrate, making new formaldehyde available to bind to amino acids. Following this primary reaction of formaldehyde with an amino acid, a methylene bridge within or between protein molecules is formed in a secondary reaction over a long time (Thavarajah et al., 2012). This reaction is to some extend reversible by transfer of samples into water before sample preparation for SI analysis. However, considerable amounts of formaldehyde remain within the sample and accordingly a shift of δ13C toward the δ13C of the used formalin must be expected. Since formalin does not contain N, no shift in δ15N should be expected due to the described chemical processes of formalin preservation. Indeed Ogawa et al. (2013) demonstrated that formalin preservation does not affect δ15N of individual amino acids in gobiid fish. This observation was recently confirmed for δ15N of the amino acids of 5 fish species that were preserved in formalin and then transferred to ethanol (Chua et al., 2020).
Based on this lack of an effect of formalin fixation on the δ15N values of the molecules involved in the fixation process, one might argue that the sole focus on correcting the δ13C value for formalin preserved samples is justified. However, we argue that preservation in formalin should not be reduced to the chemical processes involved in the formation of methylene bridges between amino acids. It is well known that formalin fixation causes a strong loss of dry weight (range 10 to > 50%) in marine invertebrates (zooplankton and benthos) and fish larvae (Hay, 1984; Johnston and Mathias, 1993; Evgeny, 2003). This dry weight loss is a clear indication that formalin fixation cannot be reduced to the above described chemical processes since this would cause an increased dry weight. The dry weight loss is likely a combination of various co-occurring phenomena. Formalin has a high osmolarity (>1300 mO under standard conditions for 10% buffered formalin as used in this study). While this high osmolarity ensures the rapid diffusion of methylene glycol and formaldehyde into the tissue (Thavarajah et al., 2012), it also causes water to leave cells together with water soluble compounds, like sugars or salts. Further, formalin preservation has been suggested to cause loss of lipids (Jones, 1976), proteins and free amino acids (Hopkins, 1968; Williams and Robins, 1982; Arrington and Winemiller, 2002), or the leaching or fragmentation of mucosal membranes (Hay, 1984). Accordingly, all these compounds can be lost in the formalin solution.
No matter the cause of the dry weight loss, it constitutes a considerable loss of C and N. Accordingly, unless the dry weight is lost with the isotopic ratios of the entire sample, the effect of formalin fixation on SI ratios should not be seen as the result of the addition of isotopically different C from formalin only.
ANOVA results suggest that different lipid normalization formulas for δ13C should be selected for the two studied species. Currently, the common approach to lipid normalization of benthic invertebrates, however, is to apply one formula across all taxa when whole food webs are studied (e.g., Silberberger et al., 2018). This approach is very likely to introduce a considerable bias in such studies, considering how differently L. balthica and C. crangon are affected. Based on our results it has to be concluded that normalization according to Post et al. (2007) should be avoided for bivalves. The data used to develop this normalization formula was largely dominated by fish, but also included multiple arthropod species. In addition, the data contained a single sample of a unionid freshwater mussel. This single sample, however, seems to be an outlier in the data and can be perfectly corrected by the formula of McConnaughey and McRoy (1979) and (Post et al., 2007).
Many bivalve species, including L. balthica, can store energy in the form of glycogen (Wenne and Styczyńska-Jurewicz, 1987; Patterson and Carmichael, 2016). Patterson and Carmichael (2016) showed that high glycogen content in oysters results in C:N ratios greater than 3.5, even when lipid content is low. In contrast to lipids, glycogen is not depleted in 13C (Patterson and Carmichael, 2016). Accordingly, lipid extraction is not necessary and lipid normalization has to be avoided when glycogen is the major form of energy storage. L. balthica (among other bivalve species) is known to store energy in the form of lipids as well as glycogen (Wenne and Styczyńska-Jurewicz, 1987). It is therefore impossible to know whether high C:N ratios are an indication of high lipid or glycogen content. Furthermore, glycogen content can exceed the lipid content in other benthic invertebrate taxa [e.g., the polychete Hediste diversicolor (Durou et al., 2005)]. Consequently, we suggest that lipid normalization of δ13C based on C:N ratios should be abandoned for bivalves and other taxa with potential energy storage other than lipids.
The SIMM results after lipid normalization, however, were improved for L. balthica (exception frozen L. balthica with no pre-treatment), while hardly any effect was observed for C. crangon. Accordingly the presented results only confirmed to a limited extend the results from a previous study that found lipid normalization to affect mixing model outcomes in comparison to lipid intact samples (Arostegui et al., 2019). In contrast to Arostegui et al. (2019), however, the present study was able to compare lipid normalized also with lipid extracted samples. This demonstrated that the lipid normalization of C. crangon failed to correct for the effect lipid removal had on mixing models. As a conclusion at this point, lipid normalization is not advisable for benthic invertebrates when used in mixing models. With regard to the above described uncertainties about potentially high glycogen storage in benthic species and the failure of the lipid normalization to resemble lipid removal effects for C. crangon, chemical lipid removal should be used for benthic invertebrates. This statement, however, should be revisited when progress with species- and tissue-specific lipid normalization models for invertebrates has been made, comparable to the current state for vertebrates (Cloyed et al., 2020).
Methodological Considerations
As described in the methods, the TEFs in the current study have been selected as species specific as possible. While it is never entirely possible to verify TEFs, a comparison of the used TEFs with the average observed differences in stable isotope ratios between OM sources and the two studied species (Table 3) suggests that the chosen values and variance were appropriate. Nonetheless, the possibility remains that a wrong TEF was applied in the current study and as a consequence modeling results would be biased. However, since the same TEFs were applied to all models of the same species, we argue that all models are equally right or wrong, and accordingly the described preservation and pre-treatment effects are true differences.

Table 3. Observed average trophic enrichment of the differently preserved species in comparison to the important OM sources.
Most studies that were used as reference for the selected TEFs used drying (Fry, 1988; Gorokhova and Hansson, 1999; Post, 2002; Antonio et al., 2011) or freezing (Iken et al., 2010; Nerot et al., 2012) for sample preservation. This agrees well with the chosen TEFs being closer to the observed trophic fractionation for dried and frozen fauna than to the observed trophic fractionation for formalin preserved samples. While this observation might suggest that TEFs should be developed for different preservation methods, we consider this a wrong approach as it mixes a natural process with a methodological error. Trophic enrichment of stable isotopes is a natural process that happened prior to sample collection and is therefore independent of any preservation or pre-treatment that is applied after sample collection.
The Bhattacharyya’s coefficient was used for pairwise comparisons between posterior probability distributions of SIMMs. In contrast to previous studies that used a significance level of 0.6 (i.e., BC > 0.6 indicates significant overlap), BCs were only used as a relative measure of overlap between probability distributions and patterns in median BCs were described. The decision for this use was made because the significance level of 0.6 has no clear underlying statistical or biological meaning. It was first introduced by Catry et al. (2009) for the Horn-Morisita Index. As pointed out by the authors, the value of 0.6 was arbitrarily selected and no objective justification for selecting this level was given. Bond and Diamond (2011) then introduced the same significance level for the BC to compare mixing model probability distributions, arguing it is analogous to other indices of dietary overlap (like the Horn-Morisita Index). However, if the significance level was chosen arbitrarily for the Horn-Morisita Index, then it is also arbitrary for BCs. Furthermore, while it is correct that both indices range from 0 (no overlap) to 1 (complete overlap), a clear difference between them exists. The Horn-Morisita Index measures actually observed dietary overlap between two samples. The BC, however, measures the overlap of two probability distributions and not actual dietary overlap. Accordingly, we suggest that BCs should be interpreted for what they are, a measure of overlap between two probability distributions. Consequently, a BC < 0.05 indicates significant different probability distributions and a BC > 0.95 indicates significant similar distributions. All values in between do not allow a statement about significance and should just be interpreted as probability of overlap.
Furthermore, like the Horn-Morisita Index is depending on the categorization of prey items (Diamond, 1983), the BC is strongly dependent on the binning/bandwidth used for its calculation. Previous studies (e.g., Jardine et al., 2015), however, did not report what binning was used and accordingly a fixed significance level is meaningless. In the current study Silverman’s rule of thumb was used to determine the bandwidths for the calculations of BCs (Silverman, 1986).
Conclusion
Our study confirmed the results of previous studies that the absolute preservation and pre-treatment effects on δ13C are high, while effects on δ15N are rather low. The strength of these effects is, however, not directly linked to their influence on the performance of Bayesian mixing models and consequently previously developed guidelines about sample preservation and pre-treatment need to be re-evaluated for this purpose. Furthermore, many observed effects on SI ratios and model performance were species-specific in this study and consequently every preservation and pre-treatment choice (for fauna and OM sources) may bias ecological interpretation. We assume that this has a potentially strong impact in the context of multispecies studies and suggest that future research should address how this might bias studies of whole food webs.
Furthermore, our study has demonstrated that mathematical correction of δ13C for high lipid content or formalin preservation produces variable mixing model results and should be avoided or at least be applied with extreme caution if data is used in Bayesian mixing models. Even if δ13C is corrected adequately, the model outcomes are often not improved and sometimes even worsened. Consequently, we recommend that the overall small, but apparently species-specific preservation and pre-treatment effects on δ15N should not be neglected in ecological studies that use SI ratios to study diet composition or food-web structure.
For future studies, we recommend that researchers (i) preserve samples by oven-drying, (ii) avoid lipid normalization, and (iii) prepare non-acidified duplicate samples for δ15N when data will be used in Bayesian SIMMs. We advise against the use of bulk δ13C and δ15N from formalin preserved museum specimens to reconstruct dietary composition with SIMMs, and suggest that isotopic niche parameters of bulk SI ratios (Le Bourg et al., 2020) or compound specific δ15N of amino acids (Ogawa et al., 2013; Chua et al., 2020) should be considered as these methods seem to be not sensitive to formalin preservation.
Furthermore, we call for increased efforts to improve our understanding on how our methodological choices in SIA affect our interpretation of the data, since the previous focus on quantifying the absolute changes of individual SI ratios does not allow for the ideal method selection.
Data Availability Statement
The raw data supporting the conclusions of this article will be made available by the authors, without undue reservation.
Author Contributions
MS and KK-M carried out the fieldwork and performed the laboratory analyses. MS preformed the statistical analysis and drafted the manuscript. MK acquired funding that made this study possible. All authors designed the research, interpreted the data, provided comments during writing, and proofread the final manuscript.
Funding
This study was funded by Polish National Science Centre, project no. 2017/26/E/NZ8/00496 (COmEBACk). Sample collection was additionally supported through statutory funds of IOPAN. KK-M’s participation in this study was further supported by the Foundation for Polish Science (FNP).
Conflict of Interest
The authors declare that the research was conducted in the absence of any commercial or financial relationships that could be construed as a potential conflict of interest.
Acknowledgments
We want to thank Captain and crew of s/y Oceania. Thanks to P. Makuch, M. Szczepanek, and Z. Borawska for help during sampling. Furthermore, we want to thank B. Szymczycha for guidance for chemical lipid removal and E. Jordà Molina for drawings of species used in the figures. A previous version of this manuscript appears online as a preprint at Biogeosciences Discussions (Silberberger et al., 2020).
Supplementary Material
The Supplementary Material for this article can be found online at: https://www.frontiersin.org/articles/10.3389/fmars.2020.621978/full#supplementary-material
References
Akamatsu, F., Suzuki, Y., Kato, Y., Yoshimizu, C., and Tayasu, I. (2016). A comparison of freeze-drying and oven-drying preparation methods for bulk and compound-specific carbon stable isotope analyses: examples using the benthic macroinvertebrates Stenopsyche marmorata and Epeorus latifolium. Rapid Commun. Mass Spectrom. 30, 137–142. doi: 10.1002/rcm.7421
Allen, J. A., and Garrett, M. R. (1971). The Excretion of ammonia and urea by Mya arenaria L. (Mollusca: Bivalvia). Comp. Biochem. Physiol. Part A Physiol. 39, 633–642. doi: 10.1016/0300-9629(71)90185-X
Antonio, E. S., Kasai, A., Ueno, M., Ishihi, Y., Yokoyama, H., and Yamashita, Y. (2011). Diet shift in the sand shrimp Crangon uritai along the estuary-marine gradient. J. Crustac. Biol. 31, 635–646. doi: 10.1651/10-3424.1
Arostegui, M. C., Schindler, D. E., and Holtgrieve, G. W. (2019). Does lipid-correction introduce biases into isotopic mixing models? Implications for diet reconstruction studies. Oecologia 191, 745–755. doi: 10.1007/s00442-019-04525-4527
Arrington, D. A., and Winemiller, K. O. (2002). Preservation effects on stable isotope analysis of fish muscle. Trans. Am. Fish. Soc. 131, 337–342. doi: 10.1577/1548-86592002131<0337:peosia<2.0.co;2
Bessey, C., and Vanderklift, M. A. (2014). Drying method has no substantial effect on δ 15 N or δ 13 C values of muscle tissue from teleost fishes. Rapid Commun. Mass Spectrom. 28, 265–273. doi: 10.1002/rcm.6780
Bhattacharyya, A. (1943). On a measure of divergence between two statistical populations defined by their probability distributions. Bull. Calcutta Math. Soc. 35, 99–109.
Bond, A. L., and Diamond, A. W. (2011). Recent Bayesian stable-isotope mixing models are highly sensitive to variation in discrimination factors. Ecol. Appl. 21, 1017–1023. doi: 10.1890/09-2409.1
Bosley, K. L., and Wainright, S. C. (1999). Effects of preservatives and acidification on the stable isotope ratios (15N:14N, 13C:12C) of two species of marine animals. Can. J. Fish. Aquat. Sci. 56, 2181–2185. doi: 10.1139/f99-153
Carabel, S., Godínez-Domínguez, E., Verísimo, P., Fernández, L., and Freire, J. (2006). An assessment of sample processing methods for stable isotope analyses of marine food webs. J. Exp. Mar. Bio. Ecol. 336, 254–261. doi: 10.1016/j.jembe.2006.06.001
Carman, K. R., and Fry, B. (2002). Small-sample methods for δ13C and δ15N analysis of the diets of marsh meiofaunal species using natural-abundance and tracer-addition isotope techniques. Mar. Ecol. Prog. Ser. 240, 85–92. doi: 10.3354/meps240085
Catry, T., Ramos, J. A., Jaquemet, S., Faulquier, L., Berlincourt, M., Hauselmann, A., et al. (2009). Comparative foraging ecology of a tropical seabird community of the Seychelles, western Indian Ocean. Mar. Ecol. Prog. Ser. 374, 259–272. doi: 10.3354/meps07713
Caut, S., Angulo, E., and Courchamp, F. (2009). Variation in discrimination factors (Δ15N and Δ13C): the effect of diet isotopic values and applications for diet reconstruction. J. Appl. Ecol. 46, 443–453. doi: 10.1111/j.1365-2664.2009.01620.x
Chandra, S., Vander Zanden, M. J., Heyvaert, A. C., Richards, B. C., Allen, B. C., and Goldman, C. R. (2005). The effects of cultural eutrophication on the coupling between pelagic primary producers and benthic consumers. Limnol. Oceanogr. 50, 1368–1376. doi: 10.4319/lo.2005.50.5.1368
Chua, K. W. J., Liew, J. H., Shin, K., and Yeo, D. C. J. (2020). Effects of ethanol preservation and formalin fixation on amino acid stable isotope analysis (δ13C and δ15N) and its ecological applications. Limnol. Oceanogr. Methods 18, 77–88. doi: 10.1002/lom3.10347
Cloyed, C. S., DaCosta, K. P., Hodanbosi, M. R., and Carmichael, R. H. (2020). The effects of lipid extraction on δ13C and δ15N values and use of lipid-correction models across tissues, taxa and trophic groups. Methods Ecol. Evol. 11, 751–762. doi: 10.1111/2041-210X.13386
Coat, S., Monti, D., Bouchon, C., and Lepoint, G. (2009). Trophic relationships in a tropical stream food web assessed by stable isotope analysis. Freshw. Biol. 54, 1028–1041. doi: 10.1111/j.1365-2427.2008.02149.x
Cyberska, B., and Krzymiński, W. (1988). “Extension of the Vistula river water in the Gulf of Gdańsk,” in Proceedings of the 16th Conference of Baltic Oceanographers, New York, NY.
de Lecea, A. M., Smit, A. J., and Fennessy, S. T. (2011). The effects of freeze/thaw periods and drying methods on isotopic and elemental carbon and nitrogen in marine organisms, raising questions on sample preparation. Rapid Commun. Mass Spectrom. 25, 3640–3649. doi: 10.1002/rcm.5265
Diamond, A. W. (1983). Feeding overlap in some tropical and temperate seabird communities. Stud. Avian Biol. 8, 24–46.
Durou, C., Mouneyrac, C., and Amiard-Triquet, C. (2005). Tolerance to metals and assessment of energy reserves in the polychaete Nereis diversicolor in clean and contaminated estuaries. Environ. Toxicol. 20, 23–31. doi: 10.1002/tox.20074
Edwards, M. S., Turner, T. F., and Sharp, Z. D. (2002). Short- and long-term effects of fixation and preservation on stable isotope values (δ13C, δ15N, δ34S) of fluid-preserved museum specimens. Copeia 4, 1106–1112. doi: 10.2307/1448532
Evgeny, P. (2003). Correction of zooplankton and benthos biomass underestimations from formaldehyde-preserved samples. Arch. Fish. Mar. Res. 50, 141–148.
Feller, R. J. (2006). Weak meiofaunal trophic linkages in Crangon crangon and Carcinus maenus. J. Exp. Mar. Bio. Ecol. 330, 274–283. doi: 10.1016/j.jembe.2005.12.033
Feuchtmayr, H., and Grey, J. (2003). Effect of preparation and preservation procedures on carbon and nitrogen stable isotope determinations from zooplankton. Rapid Commun. Mass Spectrom. 17, 2605–2610. doi: 10.1002/rcm.1227
Focken, U., and Becker, K. (1998). Metabolic fractionation of stable carbon isotopes: implications of different proximate compositions for studies of the aquatic food webs using δ13C data. Oecologia 115, 337–343. doi: 10.1007/s004420050525
Fredriksen, S. (2003). Food web studies in a Norwegian kelp forest based on stable isotope (δ13C and δ15N) analysis. Mar. Ecol. Prog. Ser. 260, 71–81. doi: 10.3354/meps260071
Fry, B. (1988). Food web structure on Georges Bank from stable C, N, and S isotopic compositions. Limnol. Oceanogr. 33, 1182–1190. doi: 10.4319/lo.1988.33.5.1182
Fry, B., and Sherr, E. B. (1984). δ13C Measurements as indicators of carbon flow in marine and freshwater ecosystems. Contrib. Mar. Sci. 27, 13–47. doi: 10.1007/978-1-4612-3498-2_12
Gorokhova, E., and Hansson, S. (1999). An experimental study on variations in stable carbon and nitrogen isotope fractionation during growth of Mysis mixta and Neomysis integer. Can. J. Fish. Aquat. Sci. 56, 2203–2210. doi: 10.1139/f99-149
Grelowski, A., and Wojewódzki, T. (1996). The impact of the Vistula river on the hydrological conditions in the Gulf of Gdańsk in 1994. Bull. Sea Fish. Inst. 137, 23–33.
Guillerme, T. (2018). dispRity: a modular R package for measuring disparity. Methods Ecol. Evol. 9, 1755–1763. doi: 10.1111/2041-210X.13022
Hay, D. E. (1984). Weight loss and change of condition factor during fixation of Pacific herring, Clupea harengus pallasi, eggs and larvae. J. Fish Biol. 25, 421–433. doi: 10.1111/j.1095-8649.1984.tb04889.x
Hopkins, T. L. (1968). Carbon and nitrogen content of fresh and preserved Nematoscelis dijficilis, a euphausiid crustacean. ICES J. Mar. Sci. 31, 300–304. doi: 10.1093/icesjms/31.3.300
Hummel, H. (1985). Food intake of Macoma balthica (mollusca) in relation to seasonal changes in its potential food on a tidal flat in the Dutch Wadden Sea, Netherlands. J. Sea Res. 19, 52–76. doi: 10.1016/0077-7579(85)90043-90042
Iken, K., Bluhm, B., and Dunton, K. (2010). Benthic food-web structure under differing water mass properties in the southern Chukchi Sea. Deep. Res. Part II Top. Stud. Oceanogr. 57, 71–85. doi: 10.1016/j.dsr2.2009.08.007
Jackson, M. C., Donohue, I., Jackson, A. L., Britton, J. R., Harper, D. M., and Grey, J. (2012). Population-level metrics of trophic structure based on stable isotopes and their application to invasion ecology. PLoS One 7:e031757. doi: 10.1371/journal.pone.0031757
Jankowska, E., De Troch, M., Michel, L. N., Lepoint, G., and Włodarska-Kowalczuk, M. (2018). Modification of benthic food web structure by recovering seagrass meadows, as revealed by trophic markers and mixing models. Ecol. Indic. 90, 28–37. doi: 10.1016/j.ecolind.2018.02.054
Jardine, C. B., Bond, A. L., Davidson, P. J. A., Butler, R. W., and Kuwae, T. (2015). Biofilm consumption and variable diet composition of Western Sandpipers (Calidris mauri) during migratory stopover. PLoS One 10:e0124164. doi: 10.1371/journal.pone.0124164
Jardine, T. D., McGeachy, S. A., Paton, C. M., Savoie, M., and Cunjak, R. A. (2003). Stable isotopes in aquatic systems: sample preparation, analysis, and interpretation. Fish. Aquat. Sci. 2656, 1–39.
Jaschinski, S., Hansen, T., and Sommer, U. (2008). Effects of acidification in multiple stable isotope analyses. Limnol. Oceanogr. Methods 6, 12–15. doi: 10.4319/lom.2008.6.12
Johnston, T. A., and Mathias, J. A. (1993). Length reduction and dry weight loss in frozen and formalin-preserved larval walleye, Stizostedion vitreum (Mitchill). Aquac. Res. 24, 365–371. doi: 10.1111/j.1365-2109.1993.tb00558.x
Jones, D. (1976). “Chemistry of fixation and preservation with aldehydes,” in Zooplankton Fixation and Preservation, ed. H. F. Steedman (Paris: The Unesco Press), 155–174.
Kamermans, P., and Huitema, H. J. (1994). Shrimp (Crangon crangon L.) browsing upon siphon tips inhibits feeding and growth in the bivalve Macoma balthica (L.). J. Exp. Mar. Bio. Ecol. 175, 59–75. doi: 10.1016/0022-0981(94)90176-90177
Kędra, M., Kuliński, K., Walkusz, W., and Legezyńska, J. (2012). The shallow benthic food web structure in the high Arctic does not follow seasonal changes in the surrounding environment. Estuar. Coast. Shelf Sci. 114, 183–191. doi: 10.1016/j.ecss.2012.08.015
Lau, D. C. P., Leung, K. M. Y., and Dudgeon, D. (2012). Preservation effects on C/N ratios and stable isotope signatures of freshwater fishes and benthic macroinvertebrates. Limnol. Oceanogr. Methods 10, 75–89. doi: 10.4319/lom.2012.10.75
Le Bourg, B., Lepoint, G., and Michel, L. N. (2020). Effects of preservation methodology on stable isotope compositions of sea stars. Rapid Commun. Mass Spectrom. 34:e8589. doi: 10.1002/rcm.8589
Lenth, R. (2020). emmeans: Estimated Marginal Means, aka Least-Squares Means. R package version 1.5.2–1. Avilable online at: https://CRAN.R-project.org/package=emmeans
Lin, J., and Hines, A. H. (1994). Effects of suspended food availability on the feeding mode and burial depth of the baltic clam, Macoma balthica. Oikos 69, 28–36. doi: 10.2307/3545280
Maksymowska, D., Richard, P., Piekarek-Jankowska, H., and Riera, P. (2000). Chemical and isotopic composition of the organic matter sources in the Gulf of Gdansk (Southern Baltic Sea). Estuar. Coast. Shelf Sci. 51, 585–598. doi: 10.1006/ecss.2000.0701
McConnaughey, T., and McRoy, C. P. (1979). Food-web structure and the fractionation of carbon isotopes in the Bering Sea. Mar. Biol. 53, 257–262. doi: 10.1007/BF00952434
McCutchan, J. H., Lewis, W. M., Kendall, C., and McGrath, C. C. (2003). Variation in trophic shift for stable isotope ratios of carbon, nitrogen, and sulfur. Oikos 102, 378–390. doi: 10.1034/j.1600-0706.2003.12098.x
Middelburg, J. J. (2014). Stable isotopes dissect aquatic food webs from the top to the bottom. Biogeosciences 11, 2357–2371. doi: 10.5194/bg-11-2357-2014
Nazemroaya, S., Sahari, M. A., and Rezaei, M. (2009). Effect of frozen storage on fatty acid composition and changes in lipid content of Scomberomorus commersoni and Carcharhinus dussumieri. J. Appl. Ichthyol. 25, 91–95. doi: 10.1111/j.1439-0426.2008.01176.x
Nerot, C., Lorrain, A., Grall, J., Gillikin, D. P., Munaron, J. M., Le Bris, H., et al. (2012). Stable isotope variations in benthic filter feeders across a large depth gradient on the continental shelf. Estuar. Coast. Shelf Sci. 96, 228–235. doi: 10.1016/j.ecss.2011.11.004
Ogawa, N. O., Chikaraishi, Y., and Ohkouchi, N. (2013). Trophic position estimates of formalin-fixed samples with nitrogen isotopic compositions of amino acids: an application to gobiid fish (Isaza) in Lake Biwa, Japan. Ecol. Res. 28, 697–702. doi: 10.1007/s11284-012-0967-z
Oh, C., Hartnoll, R., and Nash, R. (2001). Feeding ecology of the common shrimp Crangon crangon in Port Erin Bay, Isle of Man, Irish Sea. Mar. Ecol. Prog. Ser. 214, 211–223. doi: 10.3354/meps214211
Ozersky, T., Evans, D. O., and Barton, D. R. (2012). Invasive mussels alter the littoral food web of a large lake: stable isotopes reveal drastic shifts in sources and flow of energy. PLoS One 7:e051249. doi: 10.1371/journal.pone.0051249
Parnell, A. C., Phillips, D. L., Bearhop, S., Semmens, B. X., Ward, E. J., Moore, J. W., et al. (2013). Bayesian stable isotope mixing models. Environmetrics 24, 387–399. doi: 10.1002/env.2221
Patterson, H. K., and Carmichael, R. H. (2016). The effect of lipid extraction on carbon and nitrogen stable isotope ratios in oyster tissues: implications for glycogen-rich species. Rapid Commun. Mass Spectrom. 30, 2594–2600. doi: 10.1002/rcm.7759
Pedersen, H., Lomstein, B. A., and Blackburn, T. H. (1993). Evidence for bacterial urea production in marine sediments. FEMS Microbiol. Ecol. 12, 51–59. doi: 10.1111/j.1574-6941.1993.tb00016.x
Percot, A., Viton, C., and Domard, A. (2003). Optimization of chitin extraction from shrimp shells. Biomacromolecules 4, 12–18. doi: 10.1021/bm025602k
Pihl, L., and Rosenberg, R. (1984). Food selection and consumption of the shrimp Crangon crangon in some shallow marine areas in western Sweden. Mar. Ecol. Prog. Ser. 15, 159–168. doi: 10.3354/meps015159
Pinnegar, J. K., and Polunin, N. V. C. (1999). Differential fractionation of δ13C and δ15N among fish tissues: implications for the study of trophic interactions. Funct. Ecol. 13, 225–231. doi: 10.1046/j.1365-2435.1999.00301.x
Planas, M., Chamorro, A., Paltrinieri, A., Campos, S., Jiménez, A., Nedelec, K., et al. (2020). Effect of diet on breeders and inheritance in syngnathids: application of isotopic experimentally derived data to field studies. Mar. Ecol. Prog. Ser. 650, 107–123. doi: 10.3354/meps13315
Pollierer, M. M., Larsen, T., Potapov, A., Brückner, A., Heethoff, M., Dyckmans, J., et al. (2019). Compound-specific isotope analysis of amino acids as a new tool to uncover trophic chains in soil food webs. Ecol. Monogr. 89, 1–24. doi: 10.1002/ecm.1384
Post, D. M. (2002). Using stable isotopes to estimate trophic position: models, methos, and assumptions. Ecology 83, 703–718. doi: 10.2307/3071875
Post, D. M., Layman, C. A., Arrington, D. A., Takimoto, G., Quattrochi, J., and Montaña, C. G. (2007). Getting to the fat of the matter: models, methods and assumptions for dealing with lipids in stable isotope analyses. Oecologia 152, 179–189. doi: 10.1007/s00442-006-0630-x
Quezada-Romegialli, C., Jackson, A. L., Hayden, B., Kahilainen, K. K., Lopes, C., and Harrod, C. (2018). tRophicPosition, an r package for the Bayesian estimation of trophic position from consumer stable isotope ratios. Methods Ecol. Evol. 9, 1592–1599. doi: 10.1111/2041-210X.13009
R Development Core Team (2019). R: A Language and Environment for Statistical Computing. Vienna: R Foundation for Statistical Computing.
Rauber, T. W., Braun, T., and Berns, K. (2008). Probabilistic distance measures of the Dirichlet and Beta distributions. Pattern Recognit. 41, 637–645. doi: 10.1016/j.patcog.2007.06.023
Rennie, M. D., Ozersky, T., and Evans, D. O. (2012). Effects of formalin preservation on invertebrate stable isotope values over decadal time scales. Can. J. Zool. 90, 1320–1327. doi: 10.1139/z2012-101
Schlacher, T. A., and Connolly, R. M. (2014). Effects of acid treatment on carbon and nitrogen stable isotope ratios in ecological samples: a review and synthesis. Methods Ecol. Evol. 5, 541–550. doi: 10.1111/2041-210X.12183
Serrano, O., Serrano, L., Mateo, M. A., Colombini, I., Chelazzi, L., Gagnarli, E., et al. (2008). Acid washing effect on elemental and isotopic composition of whole beach arthropods: implications for food web studies using stable isotopes. Acta Oecol. 34, 89–96. doi: 10.1016/j.actao.2008.04.002
Silberberger, M. J., Koziorowska-Makuch, K., Kuliński, K., and Kędra, M. (2020). Sample preservation and pre-treatment in stable isotope analysis: implications for the study of aquatic food webs. Biogeosci. Discuss [preprint]. doi: 10.5194/bg-2020-2199
Silberberger, M. J., Renaud, P. E., Kröncke, I., and Reiss, H. (2018). Food-web structure in four locations along the European shelf indicates spatial differences in ecosystem functioning. Front. Mar. Sci. 5:119. doi: 10.3389/fmars.2018.00119
Silverman, B. W. (1986). Density Estimation for Statistics and Data Analysis. Boca Raton, FL: CRC press.
Søreide, J. E., Tamelander, T., Hop, H., Hobson, K. A., and Johansen, I. (2006). Sample preparation effects on stable C and N isotope values: a comparison of methods in Arctic marine food web studies. Mar. Ecol. Prog. Ser. 328, 17–28. doi: 10.3354/meps328017
Stock, B. C., Jackson, A. L., Ward, E. J., Parnell, A. C., Phillips, D. L., and Semmens, B. X. (2018). Analyzing mixing systems using a new generation of Bayesian tracer mixing models. PeerJ 6:e5096. doi: 10.7717/peerj.5096
Stock, B. C., and Semmens, B. X. (2016a). MixSIAR GUI User Manual. Version 3.1. Available online at: https://github.com/brianstock/MixSIAR doi: 10.5281/zenodo.1209993
Stock, B. C., and Semmens, B. X. (2016b). Unifying error structures in commonly used biotracer mixing models. Ecology 97, 2562–2569. doi: 10.1002/ecy.1517
Syväranta, J., Martino, A., Kopp, D., Céréghino, R., and Santoul, F. (2011). Freezing and chemical preservatives alter the stable isotope values of carbon and nitrogen of the Asiatic clam (Corbicula fluminea). Hydrobiologia 658, 383–388. doi: 10.1007/s10750-010-0512-514
Thavarajah, R., Mudimbaimannar, V. K., Elizabeth, J., Rao, U. K., and Ranganathan, K. (2012). Chemical and physical basics of routine formaldehyde fixation. J. Oral Maxillofac. Pathol. 16, 400–405. doi: 10.4103/0973-029X.102496
Tieszen, L. L., Boutton, T. W., Tesdahl, K. G., and Slade, N. A. (1983). Fractionation and turnover of stable carbon isotopes in animal tissues: implications for δ13C analysis of diet. Oecologia 57, 32–37. doi: 10.1007/BF00379558
Törnroos, A., Nordström, M. C., Aarnio, K., and Bonsdorff, E. (2015). Environmental context and trophic trait plasticity in a key species, the tellinid clam Macoma balthica L. J. Exp. Mar. Bio. Ecol. 472, 32–40. doi: 10.1016/J.JEMBE.2015.06.015
Turner, T. F., Krabbenhoft, T. J., Collyer, M. L., Krabbenhoft, C. A., Edwards, M. S., and Sharp, Z. D. (2015). Retrospective stable isotope analysis reveals ecosystem responses to river regulation over the last century. Ecology 96, 3213–3226. doi: 10.1890/14-1666.1
Vander Zanden, M. J., Chandra, S., Allen, B. C., Reuter, J. E., and Goldman, C. R. (2003). Historical food web structure and restoration of native aquatic communities in the Lake Tahoe (California-Nevada) basin. Ecosystems 6, 274–288. doi: 10.1007/s10021-002-0204-207
Wang, K., Chen, J., and Jin, H. (2018). Characteristics of amino acids in the surface sediments of the Changjiang Estuary, China. Data Br. 19, 1030–1032. doi: 10.1016/j.dib.2018.05.079
Wasmund, N., Topp, I., and Schories, D. (2006). Optimising the storage and extraction of chlorophyll samples. Oceanologia 48, 125–144.
Wenne, R., and Styczyńska-Jurewicz, E. (1987). Gross biochemical composition of the bivalve Macoma balthica from the Gulf of Gdańsk (Southern Baltic). Mar. Biol. 96, 73–78. doi: 10.1007/BF00394839
Williams, R., and Robins, D. B. (1982). Effects of preservation on wet weight, dry weight, nitrogen and carbon contents of Calanus helgolandicus (Crustacea: Copepoda). Mar. Biol. 71, 271–281. doi: 10.1007/BF00397044
Witek, Z., Humborg, C., Savchuk, O., Grelowski, A., and Łysiak-Pastuszak, E. (2003). Nitrogen and phosphorus budgets of the Gulf of Gdańsk (Baltic Sea). Estuar. Coast. Shelf Sci. 57, 239–248. doi: 10.1016/S0272-7714(02)00348-347
Witek, Z., Ochocki, S., Maciejowska, M., Pastuszak, M., Nakonieczny, J., Podgorska, B., et al. (1997). Phytoplankton primary production and its utilization by the pelagic community in the coastal zone of the Gulf of Gdansk (southern Baltic). Mar. Ecol. Prog. Ser. 148, 169–186. doi: 10.3354/meps148169
Wolf, J. M., Johnson, B., Silver, D., Pate, W., and Christianson, K. (2016). Freezing and fractionation: effects of preservation on carbon and nitrogen stable isotope ratios of some limnetic organisms. Rapid Commun. Mass Spectrom. 30, 562–568. doi: 10.1002/rcm.7488
York, J. K., Witek, Z., Labudda, S., and Ochocki, S. (2001). Comparison of primary production and pelagic community respiration rates in the coastal zone of the Gulf of Gdańsk. Oceanologia 43, 365–370.
Keywords: δ13C, δ15N, lipid removal, carbonate removal, estuary, Baltic Sea, Limecola balthica, Crangon crangon
Citation: Silberberger MJ, Koziorowska-Makuch K, Kuliński K and Kędra M (2021) Stable Isotope Mixing Models Are Biased by the Choice of Sample Preservation and Pre-treatment: Implications for Studies of Aquatic Food Webs. Front. Mar. Sci. 7:621978. doi: 10.3389/fmars.2020.621978
Received: 27 October 2020; Accepted: 17 December 2020;
Published: 13 January 2021.
Edited by:
Dongyan Liu, East China Normal University, ChinaReviewed by:
Naoto F. Ishikawa, Japan Agency for Marine-Earth Science and Technology (JAMSTEC), JapanYujue Wang, Yantai Institute of Coastal Zone Research (CAS), China
Naohiko Ohkouchi, Japan Agency for Marine-Earth Science and Technology (JAMSTEC), Japan
Copyright © 2021 Silberberger, Koziorowska-Makuch, Kuliński and Kędra. This is an open-access article distributed under the terms of the Creative Commons Attribution License (CC BY). The use, distribution or reproduction in other forums is permitted, provided the original author(s) and the copyright owner(s) are credited and that the original publication in this journal is cited, in accordance with accepted academic practice. No use, distribution or reproduction is permitted which does not comply with these terms.
*Correspondence: Marc J. Silberberger, marcs@iopan.pl