Article

Demonstrating Commercial Hollow Fibre Membrane Contactor Performance at Industrial Scale for Biogas Upgrading at a Sewage Treatment Works

1
Cranfield Water Science Institute, Cranfield University, Bedfordshire MK43 0AL, UK
2
Northumbrian Water, Boldon House, Pity Me, Durham DH1 5FJ, UK
3
Anglian Water, Thorpewood House, Peterborough PE3 6SR, UK
4
Severn Trent Water, Coventry CV1 2LZ, UK
*
Author to whom correspondence should be addressed.
Water 2021, 13(2), 172; https://doi.org/10.3390/w13020172
Submission received: 12 November 2020 / Revised: 11 December 2020 / Accepted: 14 December 2020 / Published: 13 January 2021
(This article belongs to the Special Issue Enhancement of Anaerobic Digestion for Energy and Resource Recovery)

Abstract

:
Hollow fibre membrane contactor (HFMC) technology has been developed for CO2 absorption primarily using synthetic gas, which neglects the critical impact that trace contaminants might have on separation efficiency and robustness in industrial gases. This study, therefore, commissioned a demonstration-scale HFMC for CO2 separation at a full-scale anaerobic digester facility to evaluate membrane integrity over six months of operation on real biogas. The CO2 capture efficiency identified using real biogas was benchmarked at comparable conditions on synthetic gas of an equivalent partial pressure, and an equivalent performance identified. Two HFMC were subsequently compared, one with and one without a pre-treatment stage that targeted particulates, volatile organic compounds (VOCs) and humidity. Similar CO2 separation efficiency was again demonstrated, indicating limited impact within the timescale evaluated. However, gas phase pre-treatment is advised in order to ensure robustness in the long term. Over longer-term operation, a decline in CO2 separation efficiency was observed. Membrane autopsy identified shell-side deposition, where the structural morphology and confirmation of amide I and II groups, indicated biofouling. Separation efficiency was reinstated via chemical cleaning, which demonstrated that proactive maintenance could minimise process risk.

1. Introduction

Anaerobic Digestion (AD) at wastewater treatment works (WWTW) can recover 34% of the initial energy of raw wastewater as biogas [1]. When upgraded to biomethane (≥98% CH4), it is an energy-dense renewable heat source [2,3,4]. In the UK by the end of 2017, around 90 sites were producing biomethane, which was primarily facilitated through gas-liquid absorption columns at larger wastewater treatment installations [5,6]. Absorption columns are energy-intensive, requiring up to 0.3 kWh Nm−3 biogas [7] and suffer from flooding, channelling and entrainment, which limits their operational range [8]. Hollow fibre membrane contactors (HFMC) are a promising alternative to gas-liquid absorption as the membrane extends the range of operating conditions that can be applied, due to imparting a phase change between the liquid and gas, which eliminates flooding and entrainment [8,9,10]. The increased interfacial area also introduces a 15-fold process intensification into the absorption column [11,12], reducing the process footprint, capital cost and energy demand.
Whilst much of the HFMC development has been undertaken on synthetic gases, several authors have sought to validate their robustness in an industrial setting with the use of real gases, with particular emphasis on their application to post-combustion carbon capture storage (CCS) [13]. Pilot plant trials by Kværner Process Systems demonstrated sustained module performance for 7000 h across eight modules employing polytetrafluoroethylene (PTFE) fibres, with the longest-running module operating for 5000 h [14] on real industrial flue gas from natural gas combustion [15], which evidenced weight, footprint, operational and capital cost reduction versus packed columns [14,16]. Comite et al. [17] applied HFMC to prefiltered industrial flue gases from a coal-fired power station and reported mass transfer data comparable to that derived on synthetic gas, which supports observations of Klaassen et al. [18] who did not observe a reduction in mass transfer over an operating period of 12 months on flue gas. Whilst successful, these examples primarily studied application to gases derived from natural gas combustion, or prefiltered gases where particulates could be expectedly limited. Biogas can be conceived as a more complex gas mixture containing a broad spectrum of trace contaminants including siloxanes, organic halides, microorganisms, terpenes, aldehydes and ketones, ammonia, particulates, pesticides, pharmaceuticals and moisture [19,20,21,22,23]. The introduction of such a complex mixture of trace determinants can be expected to increase the risk of membrane fouling or capillary wetting [24].
Particulate fouling was experienced for a polypropylene HFMC applied to unfiltered flue gas [25], the authors reporting a visible build-up of fly ash on the membrane after 60 h of operation [25], which accords with observations from another study [26,27,28]. Several studies using both PTFE and PP HFMC have also inferred that gas phase fouling degraded mass transfer when applied to gas comprised of SO2, fine particulates, H2O and CO2 [26,28]. Consequently, whilst several studies report positively on the long-term demonstration in an industrial setting, evidence of deterioration in mass transfer during operation reported by other researchers, suggest there is some discontinuity in the literature, likely due to the changes in the composition of the gas. This is particularly important for biogas, since the gas is ostensibly more complex, yet the evaluation of commercially available membranes for biogas in an industrial setting has been studied significantly less. To our knowledge, Vogler et al. [29] are the only authors to report on the stability of HFMC for biogas upgrading in an industrial setting. Their system comprised potable water as the absorbent and pre-treatment using a carbon filter [29]. An important distinction between flue gas and biogas is also the risk of liquid side fouling by the absorption fluid, which has been observed to block packing media in classical gas-liquid absorption columns due to biological fouling introduced through regrowth, despite the deployment of potable water as the absorption solvent [23]. This study proposes to complement and build upon the limited existing literature on real gases, through implementing a demonstration-scale HFMC system within a full-scale anaerobic digestion facility in order to determine technology robustness for CO2 separation on real biogas. The specific objectives of the study are to: (i) evaluate the effect of gas-phase contaminants on HFMC robustness through the inclusion and gradual removal of multi-media prefiltration (activated carbon, a molecular sieve and a desiccant) which immediately protects the membrane from particulates, volatile organics and moisture; (ii) evidence the (in)significance of the liquid phase to sustaining the mass transfer of CO2 from real gas; and (iii) determine the recoverability of membrane performance through standard cleaning protocols, following fouling.

2. Materials and Methods

2.1. Experimental Set-Up

Biogas (CO2: 34%–39%) produced on-site at an anaerobic digester was redirected from the primary biogas pipeline to the HFMC system post chiller (Figure 1) and gas booster, which removed ‘free water’ from the gas phase and increased gas pressure to 75 mBar. Due to the low gas pressure following prefiltration (<60 mBar), the gas flow rate was maintained using an inline double-acting flow control valve (F.lli Tognella Spa, Rome, Italy) and manually corrected according to the inlet ST75V Mass Flow Meter (3.4–30 L min−1, error ± 1.5, Fluid Components International LLC., San Marcos, CA, USA). Gas prefiltration was achieved using VACU-GUARD 150 (Whatman International Ltd., Maidstone, UK) inline filters comprised of activated carbon/PTFE membrane (AC) for particulate and siloxane removal, anhydrous calcium sulphate/PTFE membrane (ACS) for gas drying and Silica-Alumina zeolite/PTFE membrane (SAZ) as a molecular sieve. Gas and liquid pressure were measured using PX319 series pressure transducers (0–10 BarG, Omega Engineering Ltd., Manchester, UK). Unfiltered or prefiltered biogas flowed on the lumen side of the transverse flow HFMC. The EXF Series 2.5 × 8 inch 3M Liqui-Cel HFMC module (3M Industrial Group, Charlotte, NC, USA) comprised of 10200 microporous polypropylene X-50 fibres, with an outer diameter, inner diameter and fibre length of 300 μm, 240 μm, and 0.16 m respectively. The surface area of each module was 1.2 m2 based on internal fibre diameter [30].
Potable water was stored in a 1 m3 IBC tank and applied as an absorbent to the shell side (0.6–9.5 L min−1) in counter-current mode using a centrifugal pump (SP5/A, Lowara, Xylem Water Solutions UK Ltd., Axminster, UK). The liquid flow rate was measured using a FMG90 series electromagnetic flowmeter (Omega Engineering Ltd., Manchester, UK). On-site biogas upgrading was undertaken in a non-controlled environment where ambient temperature (0–30 °C), gas-phase pressure (0–80 mBar) and gas-phase composition (60–63% CH4 v/v) all varied. Two identical modules were used to separately study the impact of prefiltration on the gas phase, and the impact of water source on membrane fouling (potable, de-ionised water). To benchmark HFMC performance before and after CO2 separation from real biogas, the HMFC was tested using synthetic biogas (50/50 and 60/40 CH4/CO2) by mixing methane (CH4, 99.995%) and carbon dioxide (99.7%) (BOC gases, Ipswich, UK) using mass flow controllers with two prescribed flow rate ranges (0.01–1.0 L min−1 and 0.2–20 L min−1, Roxspur Measurement and Control Ltd., Sheffield, UK) to provide a combined flow rate between 0.05 and 3.5 L min−1 at a feed pressure comparable to the real biogas. Absorption solvent (potable water or de-ionised water (15 MΩ)), was stored in an 85 L PVC storage tank. Experimentation on synthetic biogas was undertaken in a temperature-controlled environment (20 °C) with a third module that had been subject to 150 combined hours of on-site biogas upgrading over a period of 150 days, using potable water and de-ionised water to investigate the impact of absorbent on membrane performance. Shell side membrane chemical cleaning was undertaken according to manufacturer guidelines [31] and consisted of a hydraulic cleaning step (75 min contact time, de-ionised water), a biological cleaning step (120 min contact time, 4% (w/w) NaOH) a second hydraulic clean (15 min contact time, de-ionised water), an inorganic cleaning step (120 min contact time, 3% (w/w) HCl), a final hydraulic cleaning step (75 min contact time, de-ionised water) followed by a 90 min gas drying step.

2.2. Experimental Analysis

Gas composition was determined using inline infrared CO2 and CH4 analysers (BCP-CO2 or BCP-CH4, accuracy <0.5% full-scale, Bluesens gas sensor GmbH, Herten, Germany). Outlet gas flow rate was measured by a QuadraTherm 640i series inline mass flow meter (1–30 L min−1, error ± 1.25%, Sierra Instruments, Monterey, CA, USA) utilising the QMix function to account for changing composition. Carbon dioxide removal was analysed through mass balance [32]:
η C O 2   =   [ ( Q G , i n × C G , i n ) ( Q G , o u t × C G , o u t ) ] ( Q G , i n × C G , i n )
where ηCO2 is the dimensionless CO2 capture ratio, QG,in and QG,out are inlet and outlet gas flow rates respectively (m3 s−1), and CG,in and CG,out are inlet and outlet gas-phase concentrations respectively (mol m−3). All gas mass flow data were standardised using normalised units (NL min−1). When varying the L/G ratio, absorbent flow rate (QL) was fixed between 0.2 and 8 L min−1, at each fixed QL, QG was fixed between 0.05 and 7 L min−1. When maintaining a constant L/G at 0.29, QL was fixed at 1 L min−1 and QG at 3.5 L min−1. A GC-MS suite of analytes comprising a range of trace volatile organic compounds (VOCs), total petroleum hydrocarbons (TPH) and gravimetric moisture analysis of raw biogas and prefiltered biogas was undertaken by Lucideon (Lucideon Ltd., Stoke-on-Trent, UK) using a UKAS accredited methodology. Gas samples were collected in 0.5 L Tedlar bags and activated carbon tubes exposed to 15 L (250 mL min−1) of the sample gas. Moisture content was assessed using gravimetric analysis of pre-weighed silica beads exposed to 15 L (250 mL min−1) of the sample gas. Surface fouling was assessed through solvent extraction (dichloromethane) of volatile organic compounds and GC-MS analysis, undertaken by Northumbrian Water Scientific Services (NWSS, Tyne and Wear, UK) using a UKAS accredited methodology. Fourier transform infrared spectroscopy (Bruker Vertex 70, Bruker UK Limited, Coventry, UK) was used to characterise the functional groups within the fouling layer which was complemented by environmental scanning electron microscopy (ESEM) and energy-dispersive X-ray spectroscopy (EDX) (XL30 ESEM-FEG, Philips/FEI (part of ThermoFisher Scientific, Hillsboro, OR, USA) to determine bound inorganic compounds.

3. Results

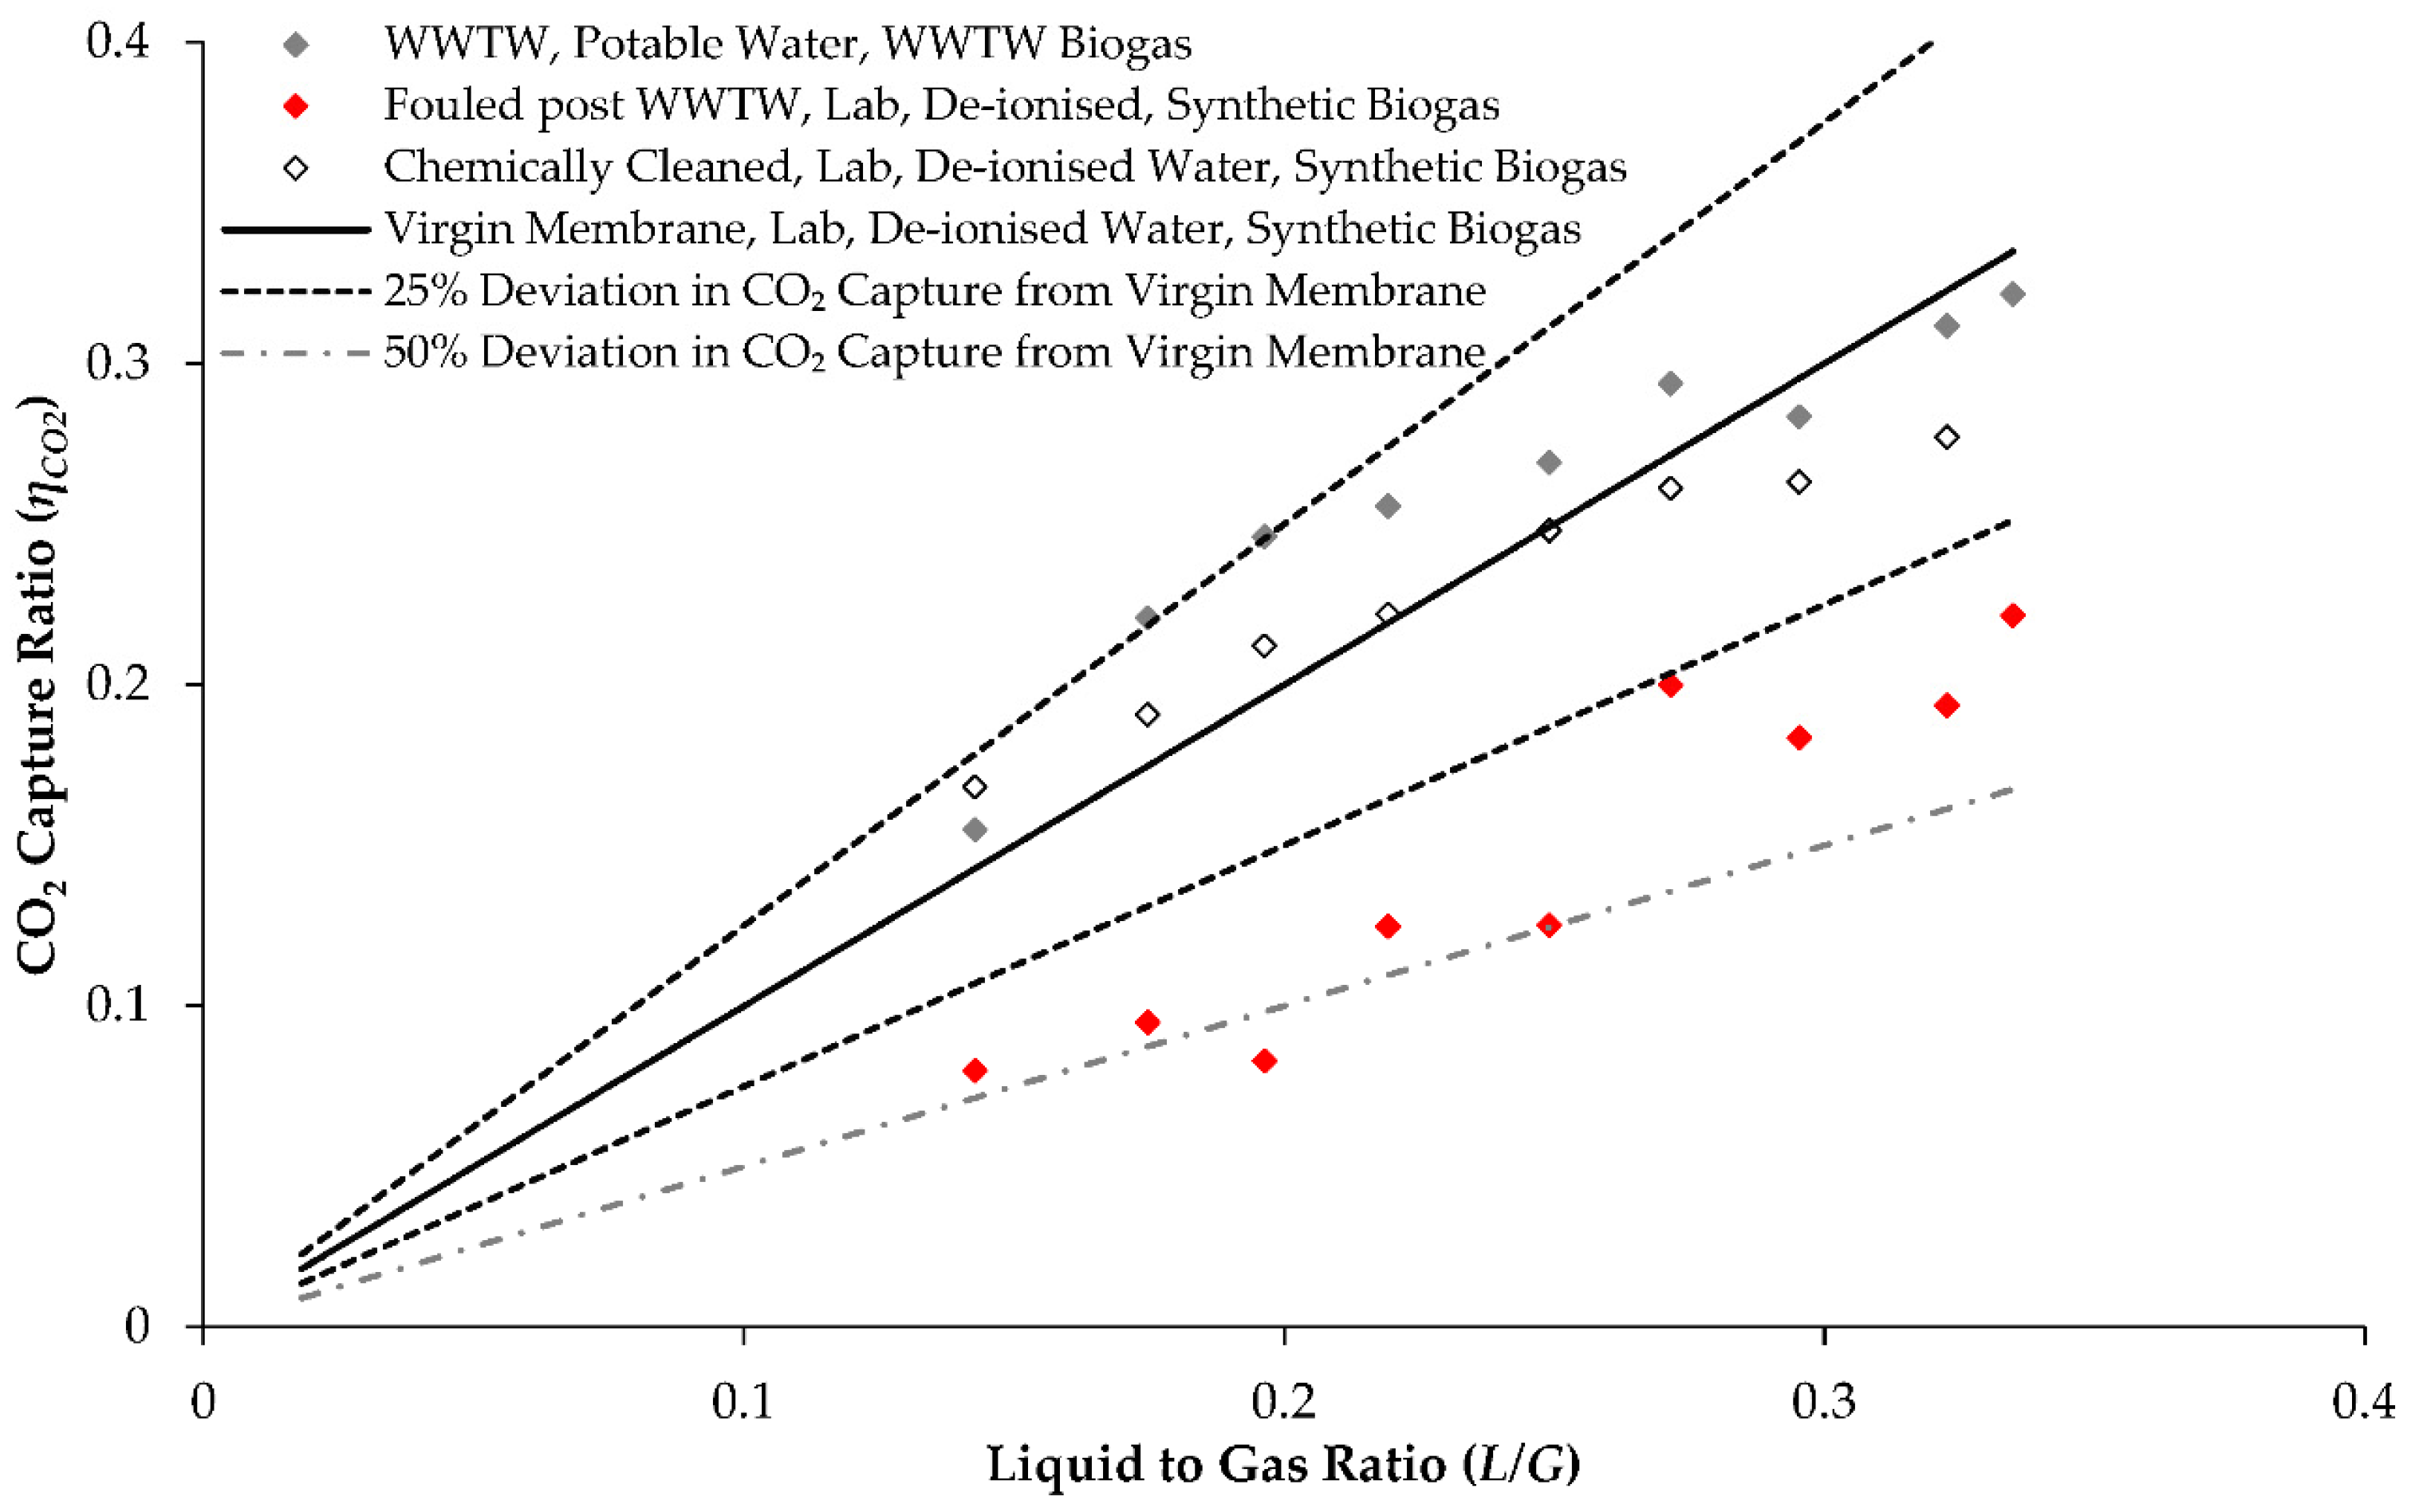
3.1. Operational Characteristics

The inlet biogas pressure fixed the gas flow rate to the HFMC, which measured between 10 mBar (QG, 3.5 L min−1) and 33 mBar (QG, 7 L min−1). For these gas flow rates, the practicable liquid flow rate range was between 0.5 and 9.5 L min−1 corresponding to a liquid-to-gas ratio (L/G ratio) of between 0.2 and 2.7 (Figure 2). The CO2 capture ratio (ηCO2) was characterised on-site for prefiltered biogas using potable water as the absorption solvent (Figure 2). As the L/G was increased, an increase in ηCO2 was determined. This was comparable to the response observed for synthetic biogas, but a higher ηCO2 was determined on-site for prefiltered biogas when compared over the same operating range. The average absorbent temperature was 14 °C when on-site, compared to 20 °C when in the laboratory. Consequently, a discrete dataset collected on-site for an absorbent temperature of 20 °C was compared to laboratory data (Figure 2, Inset). A t-test for independent samples yielded t = 0.7, which was markedly below tcritical (2.1, p-value 0.5), indicating data from real and synthetic biogas is comparable.
A HFMC module was operated for an extended period of 115 days at a fixed L/G ratio of 0.29 (QG, 3.5 L min−1; QL, 1 L min−1). During this period, the HFMC was permanently in contact with the absorbent solution and achieved 76 h of cumulative biogas upgrading (Figure 3a). Gaps in data represent time where data were not collected due to periods of non-continuous reporting. After 35 h operation of another HFMC module, gas prefiltration was removed and the membrane subject to approximately 12.5 h operation without prefiltration, equivalent to a gas loading of 2625 L (2188 L m−2) (Figure 2). During this phase, ηCO2 recorded without prefiltration was similar to that recorded with prefiltration installed. Over the full duration, an average ηCO2 of 0.17 was determined up to day 115, for the HFMC with prefiltration, after which a progressive decline in ηCO2 to 0.08 was observed.

3.2. Gas-Phase Characteristics

Trace contaminants were measured through GC-MS analysis (Table 1), which demonstrated considerable concentrations of VOCs (320 mg m−3) and total petroleum hydrocarbons (TPH, 187 mg m−3) within the inlet biogas. Trace contaminant characterisation between discrete prefiltration stages showed that the Silica-Alumina Zeolite (SAZ) molecular sieve was the most effective pre-treatment stage. Solvent extraction of this media, evidenced primary adsorption of octamethylcyclotetrasiloxane (D4) and decamethylcyclopentasiloxane (D5), which are members of the siloxane family, C12–C14 hydrocarbons, sulphur compounds, terpenes and alcohols.
Following a reduction in ηCO2 observed on-site after 115 days operation, laboratory evaluation was undertaken to determine whether this could be accounted for by condensation mechanisms on the gas side, where gas moisture content for the inlet biogas approached the dewpoint (~17–19.7 g m−3). The fouled membrane was dried by passing 90 L of CO2 through the fibre lumen and then subjected to the same hydrodynamic conditions as used on-site, but using synthetic biogas of equivalent concentration (an industrially dry gas) and potable water as the solvent (Figure 4). Comparison of the fouled membrane under site conditions with operation on synthetic biogas demonstrated comparable ηCO2, which confirmed a change in module performance rather than gas-phase capillary wetting to be the dominant mechanism for the decline on CO2 separation efficiency.

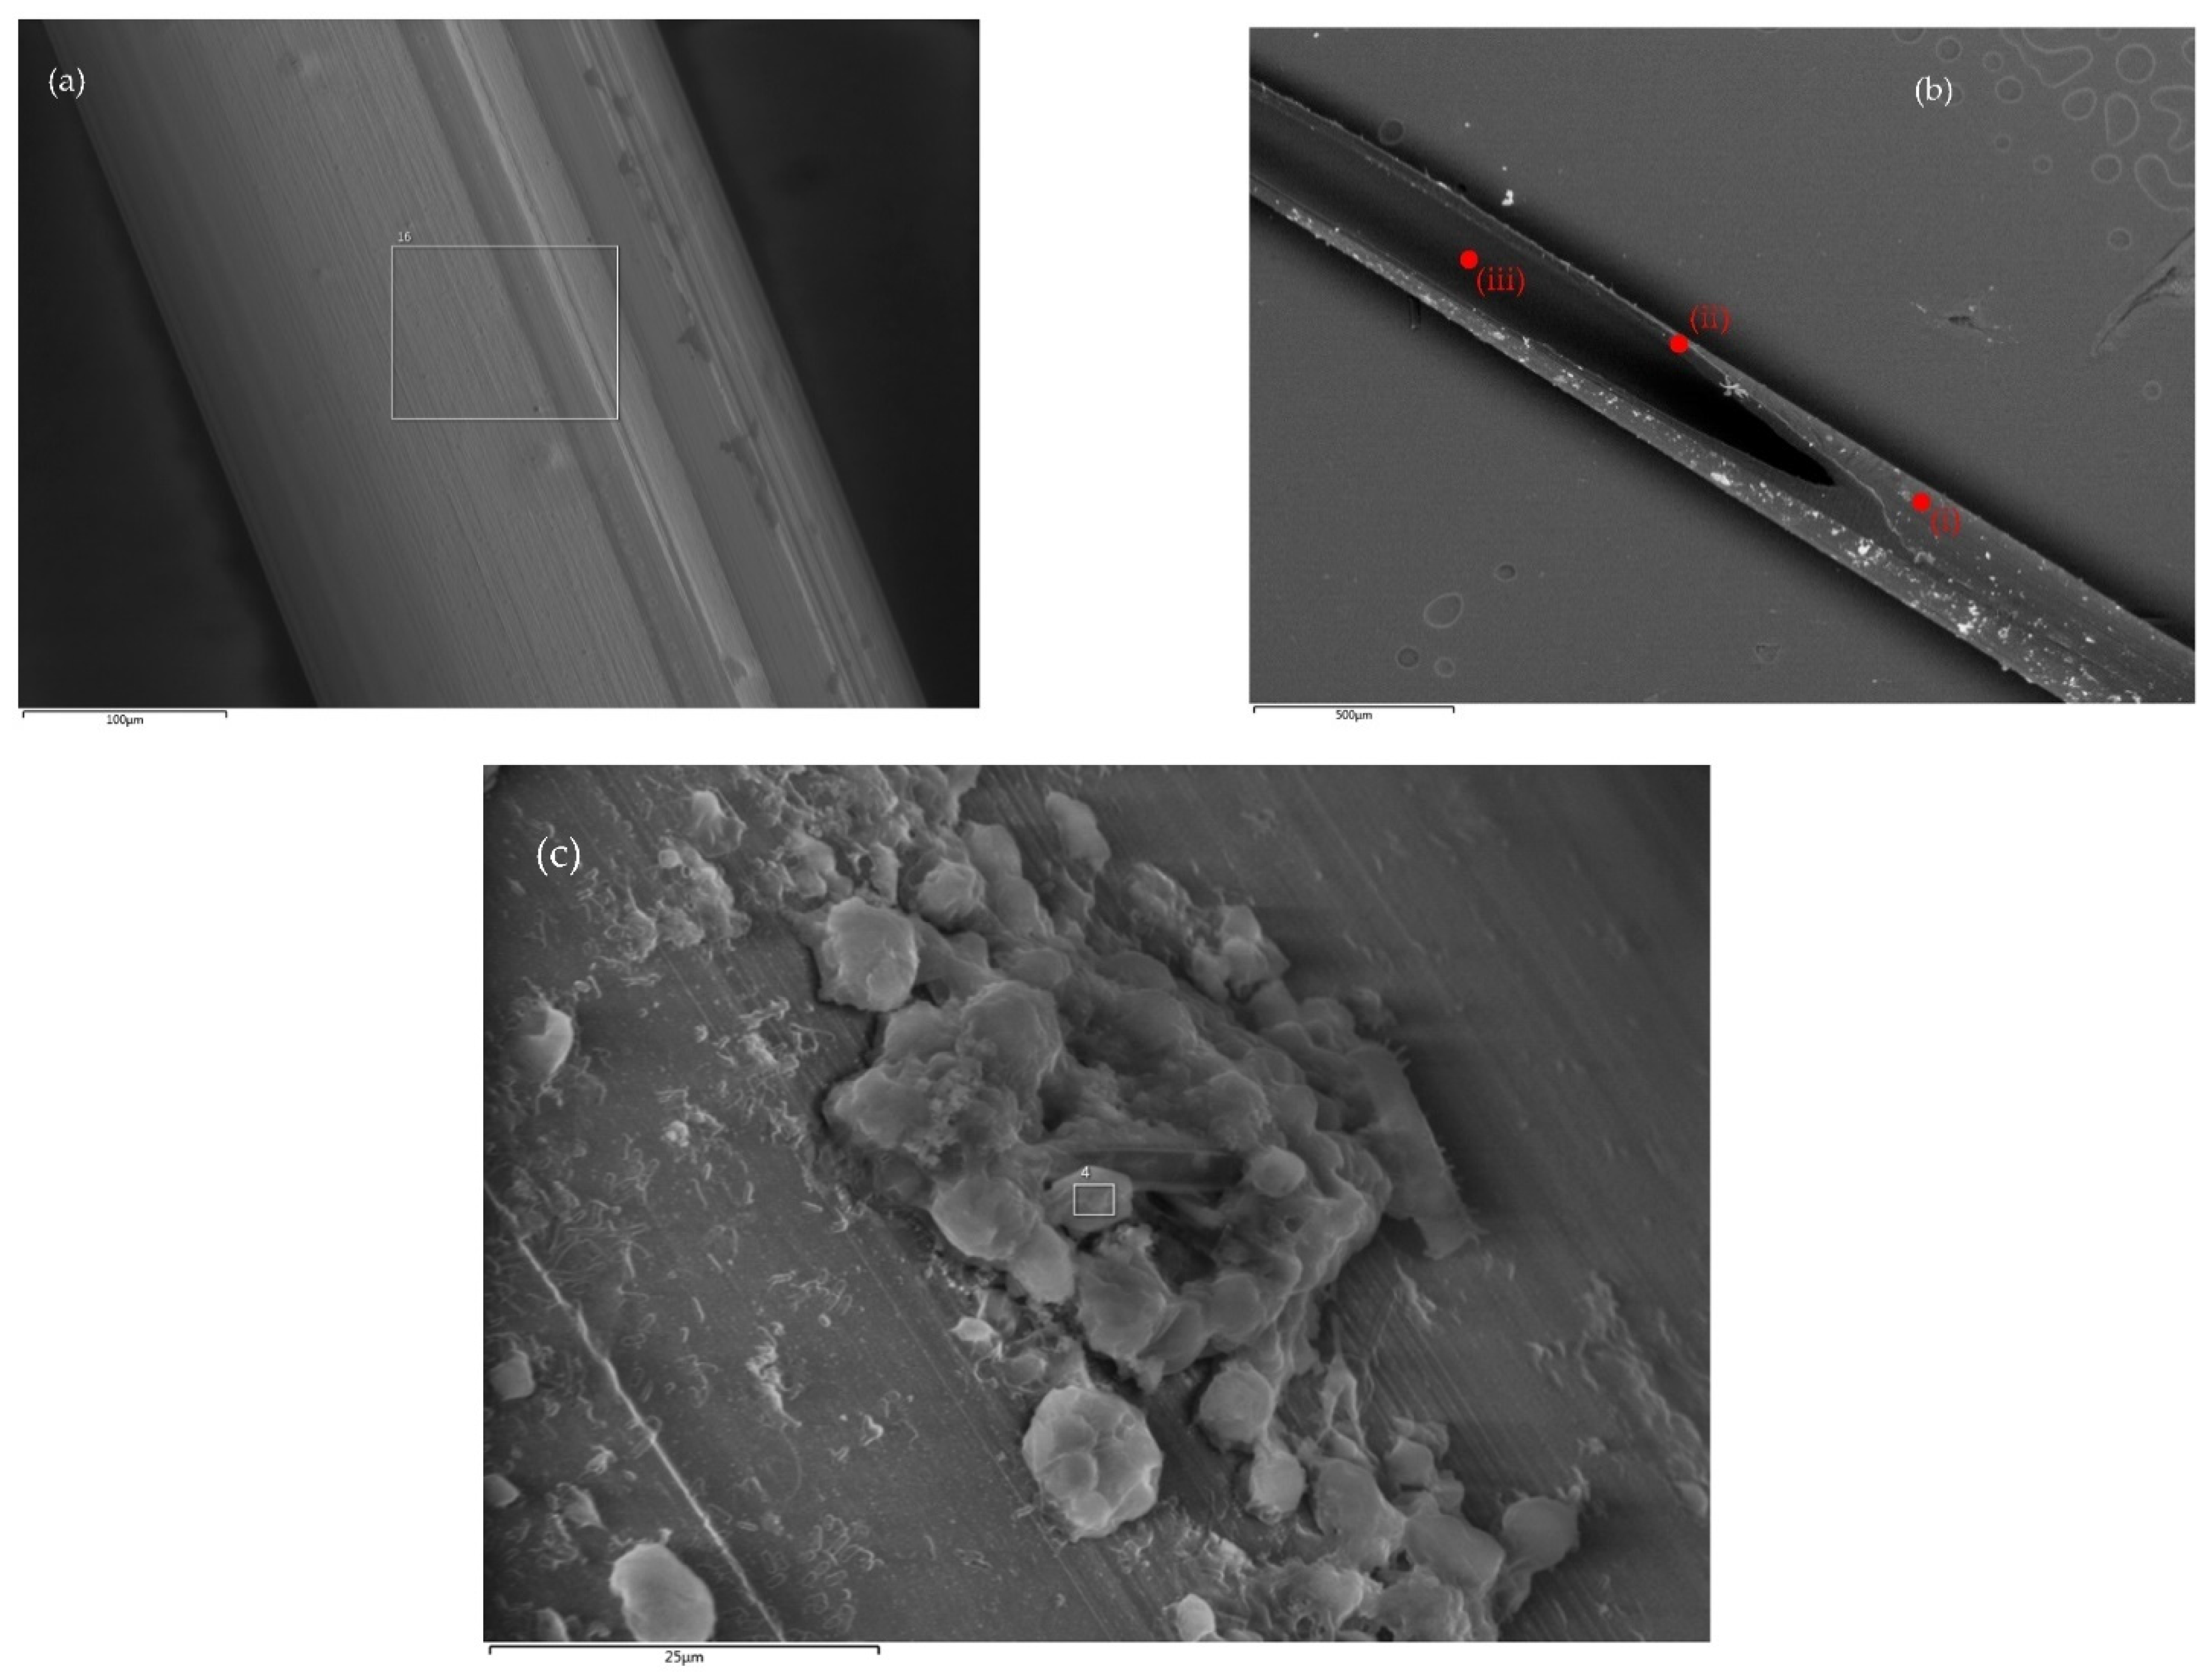
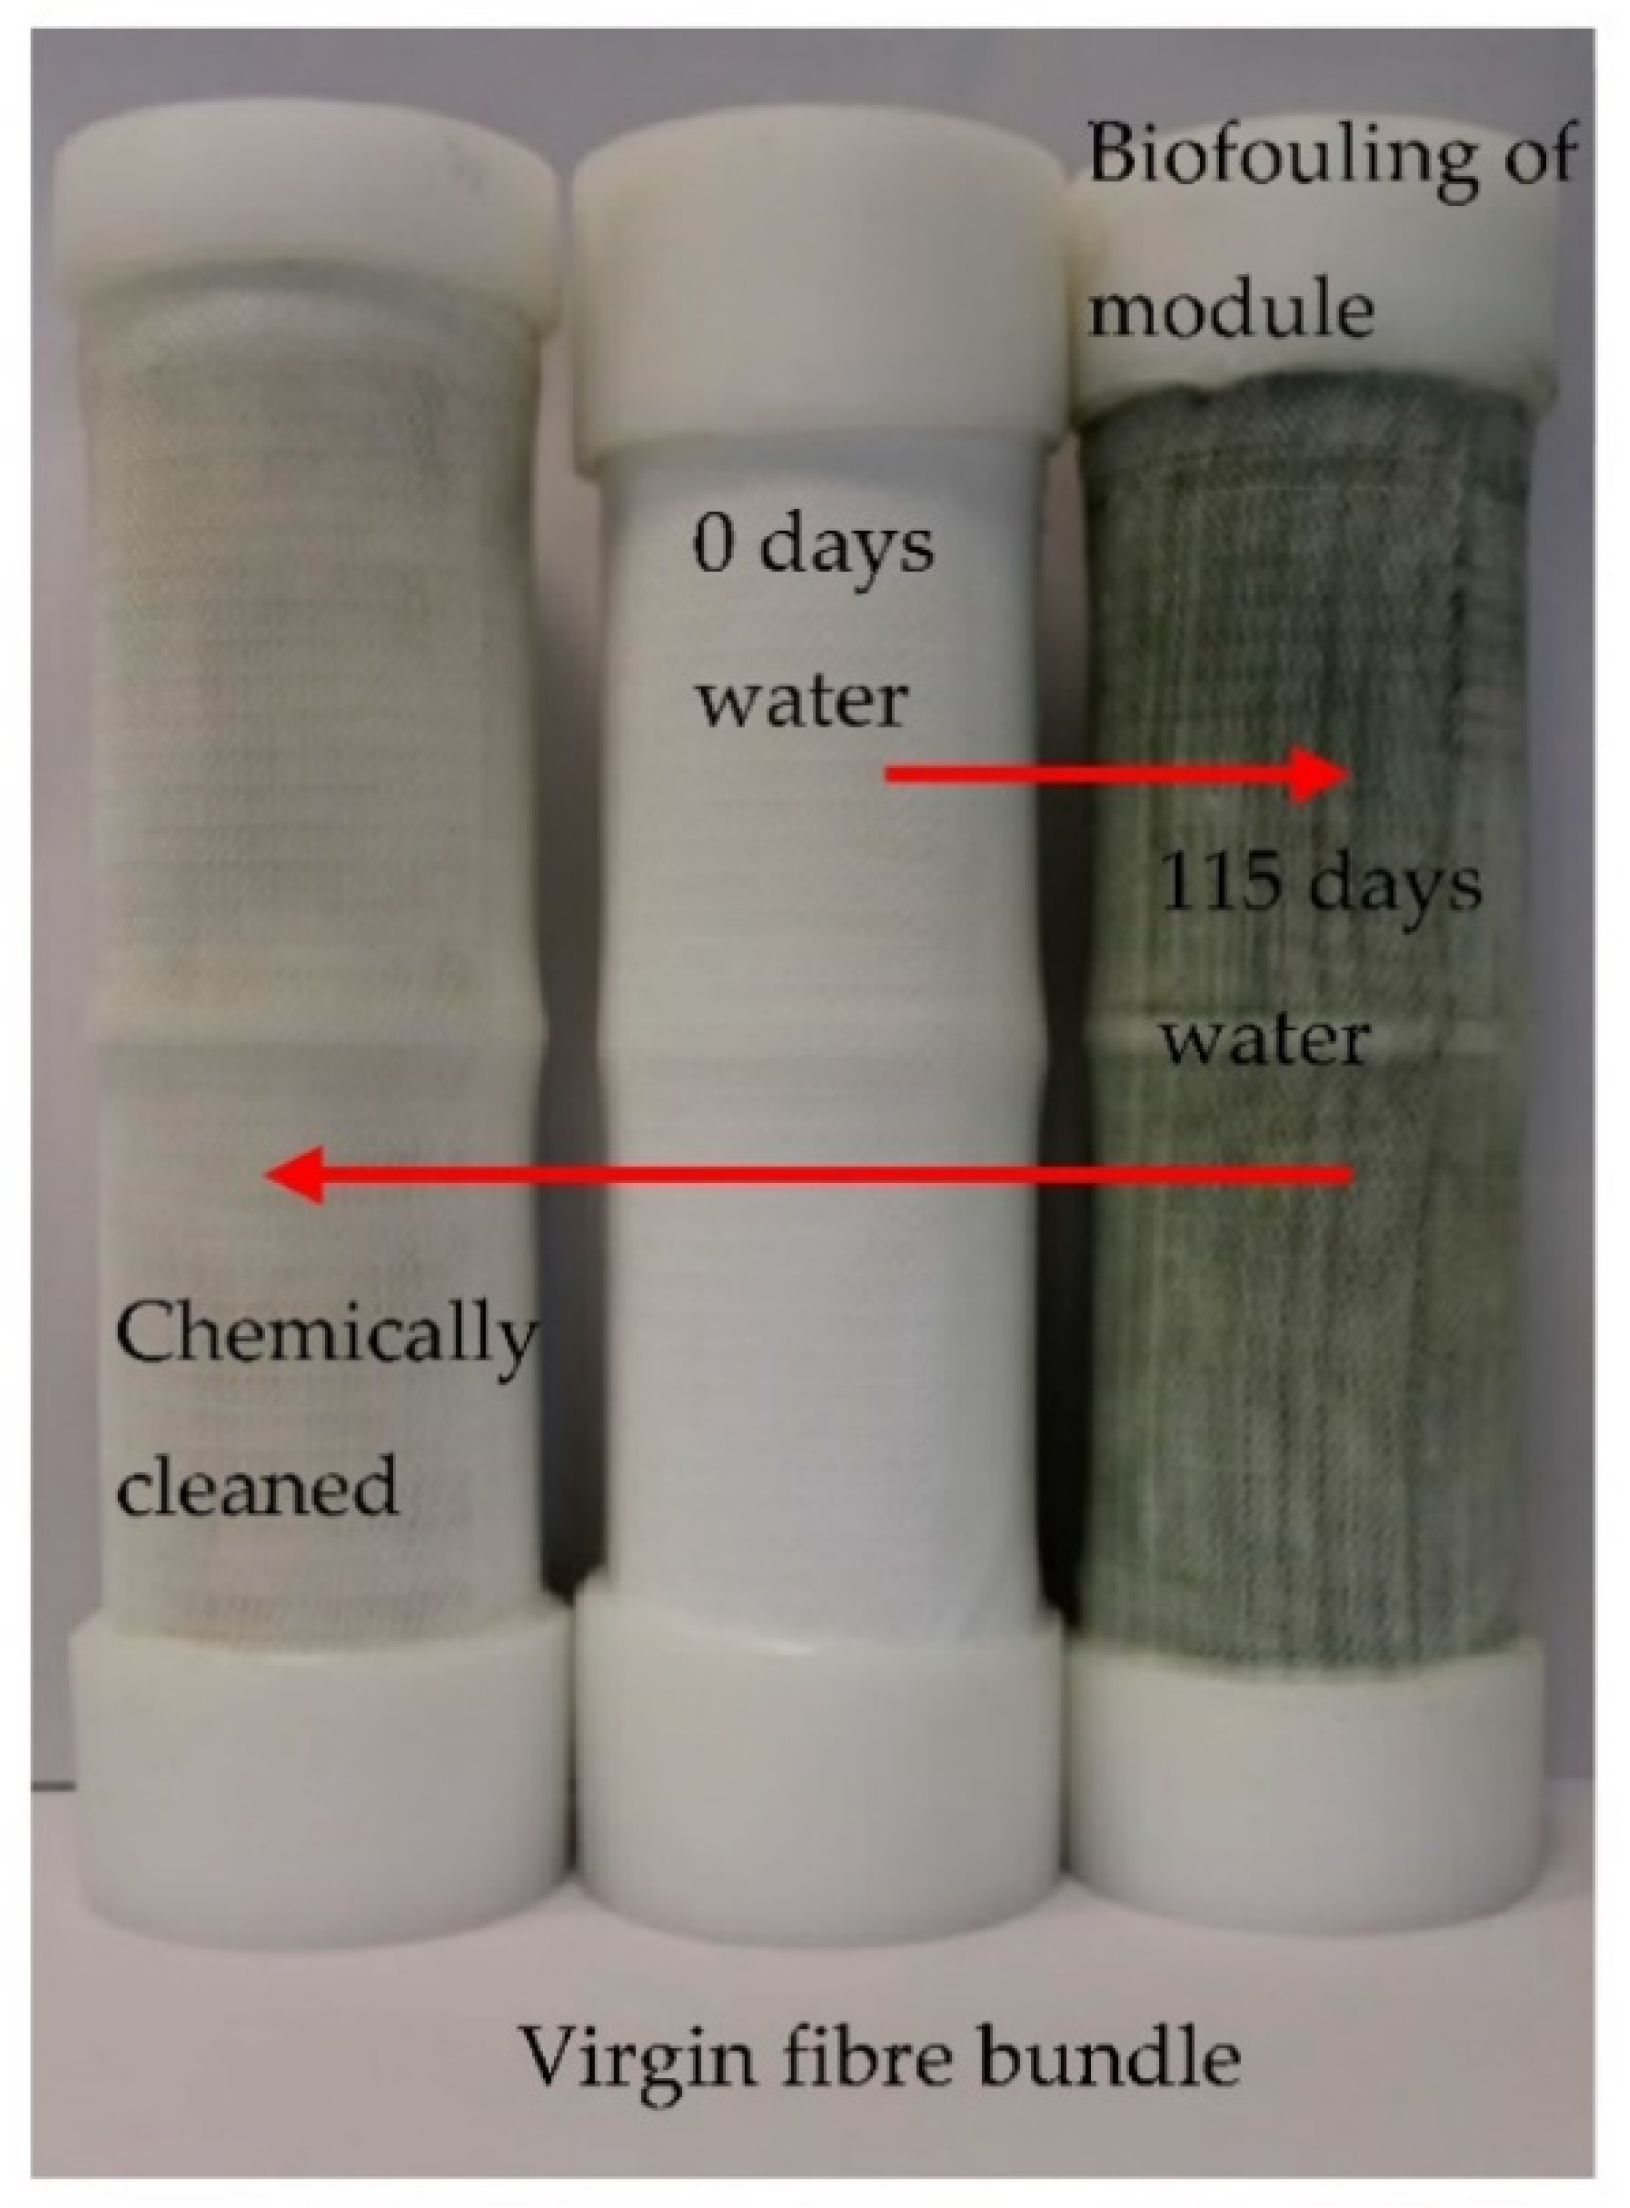
3.3. Hollow Fibre Membrane Contactor Fouling Diagnostics

Detailed foulant characterisation was first undertaken using ESEM, where the lumen-side and shell-side of the membrane were both inspected (Figure 5). No particle deposition was evident within the hollow-fibre lumen (example Figure 5b(iii)) where biogas was introduced. This is supported by the FTIR spectra (Figure 6) where no evidence for the adsorption of siloxanes (Si-O bond, 1150–1000 cm−1), carbon disulphide (C-S bond, 700–600 cm−1), or aromatic hydrocarbons was evidenced (C-H bond, 900–690 cm−1) [33]. However, considerable deposition was noted on the shell-side of the hollow fibre membranes, where the absorbent circulated (Figure 5).
FTIR analysis of the surface deposition (Figure 6) evidenced two peaks that were distinct from the virgin membrane, and polypropylene reference standards at 1540 cm−1 and 1650 cm−1, which are coincident with the amide II and amide I bands respectively, which are two major bands of the infrared protein spectrum. The amide I band is often associated with C=O bond, which relates to backbone conformation of the protein, whilst amide II is indicative of N-H bending and C-N stretching vibration [34]. This is indicative of organic biofouling of the shell-side. To support this assertion, the turbidity of absorbent used for the HFMC (after five days storage) had a turbidity of 29 NTU, compared to potable water stored for the same period that had not been used for biogas upgrading (1.4 NTU), and is complemented by the visual evidence of a green biofouling layer formed at the membrane-absorbent interface (Figure 7). The impact of biofouling on CO2 separation performance was evidenced by comparing ηCO2 data from the virgin HFMC first operated on real biogas for biogas upgrading, to that of a virgin HFMC operated on synthetic biogas and finally, HFMC data following 115 days operation (with prefiltration) (Figure 8). The fouled HFMC records ηCO2 between 25% and 50% of the virgin HFMC (Figure 8). However, once subject to one chemical cleaning intervention of the shell-side, a visible reduction in biofouling was evident (Figure 7). Efficacy of the chemical clean was confirmed by FTIR analysis of the chemically cleaned fibres, which indicated an absence of the amide I and amide II peaks, associated with protein fouling. The impact of this focused intervention (Figure 8) illustrated that it was possible to recover to the expected ηCO2 using chemical cleaning to target biofouling.

4. Discussion

In this study, consistent CO2 mass transfer was identified for HFMC technology when applied to real biogas in an industrial setting, and during a period of steady-state operation, the response in CO2 capture ratio was comparable to that of synthetic biogas with an equivalent composition (Figure 2). Slight discrimination in responsiveness (the slope identified between L/G ratio and ηCO2) was identified between the synthetic and real data which can be accounted for by the complex and dynamic physical chemistry of both phases in an industrial environment (e.g., density, viscosity, diffusivity and solubility). Importantly, this is in contradiction to observations from HFMC applied to industrial flue gases [25,26,28], where gas phase contaminants, were identified to contribute to fouling, resulting in a loss of CO2 flux within comparatively short timeframes. Three gas-phase mechanisms are thought to reduce CO2 flux during industrial operation: accumulation of particulate matter (channel clogging), surface adsorption [26,28] and capillary wetting [24,36]. Particulate accumulation was observed on the gas-side of a HFMC after 7 h exposure to unfiltered industrial flue gas from a coal-fired power station [26,27,28]. Whilst gas-phase particulates were not explicitly characterised in this study; no particle deposition was observed in the lumen using FESEM following over 76 h exposure (Figure 5b(iii)). This could be attributed to the lower particulate concentration thought to be present in biogas [37], which is supported by the limited impact exhibited when prefiltration was removed (Figure 3). However, some particulate deposition was noted on the prefiltration media, which could indicate the importance of preconditioning industrial gases before use. Trace biogas componential analysis was comparable to the literature on sewage biogas in concentration and speciation [20,21,22]. The trace siloxanes (D4 and D5) and VOCs identified, possess high octanol-water partitioning coefficients which increase the probability for adsorption to hydrophobic substrates [38]. Surface characterisation by FTIR analysis was unable to determine bond energies characteristic of these compounds on the membrane surface (Figure 6) [33]. This was accounted for by the efficacy of preconditioning with the molecular sieve, which reduced VOCs and TPHs by 69% and 81% respectively. It should be noted that this nevertheless indicates breakthrough of these compounds through the preconditioning filters, which would imply that other mechanisms such as residence time in the HFMC, in addition to functional characteristics of the membrane surface [39], may also be important in determining the probability for adsorption to the polypropylene hollow fibre membranes. Whilst biogas moisture content approached the dew point of the gas phase; membrane drying did not improve the ηCO2 (Figure 4). Gas drying has previously been identified as an effective strategy for the recovery of HFMCs that have undergone progressive wetting over a period of 7 d operation [40,41] and would indicate that capillary wetting was not the primary mechanism for the reduction in CO2 separation efficiency. Upstream preconditioning with the chiller, may have contributed to this since it is employed to reduce the ‘free water’ concentration of the gas phase to reduce the risk of condensation. Biogas installations typically also comprise of adsorption technology, which may increase robustness if placed upstream of HFMC technology. Importantly, since preconditioning requirements are aligned to those of existing combined heat and power and biogas upgrading installations, the cost of ancillary engineering will not increase through the adoption of HFMC technology.
Evidence for biofouling on the shell-side of the membrane was provided through FTIR analysis, which indicated protein deposition (Figure 6), and FESEM where the presence of an organic foulant layer was shown (Figure 5), which we suggest is the primary mechanism for the 50% reduction in CO2 flux (Figure 8). Biological fouling has been previously reported within absorption columns for biogas upgrading, deleteriously affecting CO2 mass transfer through channelling, owing to the growth of methanotrophs (type I and II), gram-negative bacteria, gram-positive bacteria, actinomyces and fungi [23]. Whilst potable water was used as the absorbent the disinfection residual is quickly consumed, permitting colonisation. Biological growth was also evidenced in this study through the increased turbidity in the absorbent, which can lead to fibre clogging on the shell-side, subsequently introducing shell-side channelling which dissipates mass transfer [42,43] and is consistent to the observations of Vogler et al. [29]. Due to the adsorptive potential of biopolymers which can possess strong lipophilic affinity, desorption can expectedly be thermodynamically unfavourable; thus, chemical cleaning methods are preferred to physical methods [43,44]. Polypropylene does not favour oxidants [44] due to their impact upon fibre tensile strength and elongation values [31]. In this study, an alkali-acid chemical cleaning cycle was therefore used and demonstrated almost complete flux recovery, indicating the organic fraction to be strongly reversible (Figure 7 and Figure 8). Comparable biofouling effects observed in full-scale packed columns (the incumbent biogas upgrading technology), result in downtime for reactive maintenance of up to two weeks, which limits asset availability and reduces profitability [23]. Due to the significant reduction in process scale enabled by HFMC, and the relatively low cost of membrane installations [45,46], a duty-standby HFMC system could be implemented to enable the introduction of scheduled proactive maintenance (regular chemical cleaning), to reduce the risk of biofouling through more frequent intervention, whilst ensuring 100% asset availability.

5. Conclusions

In this study, a transverse flow HFMC has been demonstrated for biogas upgrading on real biogas. Mass transfer characterisation, complemented with membrane autopsy, evidenced that HFMCs are robust to impurities within industrially produced biogas. This was confirmed through benchmarking the same HFMC modules with synthetic biogas in a laboratory environment that evidenced comparable CO2 separation performance for equivalent operating conditions, indicating that HFMC should be scalable from laboratory data, similar to observations for flue gas [17,25]. Operation without prefiltration did not deleteriously impact gas separation efficiency, which is dissimilar to the experience of operating HFMC on industrial flue gases, possibly due to the lower particle concentration. Nevertheless, upstream gas conditioning is recommended to improve robustness, and as this technology is often applied to standard biogas facilities, should not entail additional cost. Shell-side biofouling reduced CO2 separation efficiency in the longer-term. This is comparable to clogging problems experienced for water scrubbers presently used for biogas upgrading. Chemical cleaning effectively reversed fouling, which could be introduced proactively to enhance resilience. The low feed gas pressures experienced on-site limited the gas flowrate, which made high CO2 capture efficiency difficult to achieve. Technology scale-up will inevitably require pre-pressurisation similar to packed columns (around 7 BarG), the success of which has been demonstrated [11,43,47] and would guarantee the process intensification promised by HFMC technology at full scale and demanding considerably lower pressure drops [17,25,29,48,49,50]. For reference, Vogler et al. [29] evaluated HFMC in an absorption-desorption arrangement at a similar feed pressure to this study (<100 mBar) [29]. Despite the low pressure, the authors reported an energy requirement of 0.3 kWh Nm−3 raw biogas which is comparable to the 0.23–0.3 kWh Nm−3 reported for gas-liquid absorption columns, indicating that further energy savings can be realised with HFMC through pressurisation [7] making its development toward implementation an exciting proposition.

Author Contributions

Conceptualisation, S.H. and E.M.; methodology, S.H.; formal analysis, S.H.; investigation, S.H.; resources, S.H., E.M., A.M., T.R. and D.H.; writing—original draft preparation, S.H.; writing—review and editing, E.M. and M.P.; supervision, E.M. and M.P.; funding acquisition, E.M., M.P., A.M., A.B. and P.V. All authors have read and agreed to the published version of the manuscript.

Funding

The authors would like to thank Anglian Water, Northumbrian Water and Severn Trent Water for their practical and financial support. We are also grateful for funding from the Engineering and Physical Sciences Research Council (EPSRC), which was provided through the STREAM Industrial Doctorate Centre.

Data Availability Statement

Data from this article is directly available through this doi:10.17862/cranfield.rd.13560350.

Conflicts of Interest

The authors declare no conflict of interest.

References

  1. Silvestre, G.; Fernández, B.; Bonmatí, A. Significance of anaerobic digestion as a source of clean energy in wastewater treatment plants. Energy Convers. Manag. 2015, 101, 255–262. [Google Scholar] [CrossRef]
  2. Thrän, D.; Billig, E.; Daniel-Gromke, J.; Ponitka, J.; Seiffert, M.; Persson, T.; Svensson, M.; Balswin, J.; Kranzl, L.; Schipfer, F.; et al. Biomethane Status and Factors Affecting Market Development and Trade. 2014. Available online: https://www.ieabioenergy.com/publications/biomethane-status-and-factors-affecting-market-development-and-trade/ (accessed on 10 January 2019).
  3. Anaerobic Digestion and Biogas Association (ADBA). Anaerobic Digestion Market Report. London. 2015. Available online: http://adbioresources.org/library/market-report-july-2015 (accessed on 10 January 2019).
  4. Connor, P.M.; Xie, L.; Lowes, R.; Britton, J.; Richardson, T. The development of renewable heating policy in the United Kingdom. Renew. Energy 2015, 5, 733–744. [Google Scholar] [CrossRef]
  5. IPPT Associates United Kingdom Anaerobic Digestion Market Report. 2017. Available online: https://anaerobic-digestion.com/downloads/free-downloads/uk-anaerobic-digestion-market-report-2017 (accessed on 9 January 2019).
  6. Baldwin, J. UK Biomethane Market: Market Update and the Capacity Question. 2017. Available online: http://www.cngservices.co.uk/images/BiomethaneDay/2017/John-Baldwin--%0AUK-Biomethane-Market--the-Capacity-Question.pdf (accessed on 10 January 2019).
  7. Bauer, F.; Hulteberg, C.; Persson, T.; Tamm, D. Biogas Upgrading—Review of Commercial Technologies. 2013. Available online: http://www.sgc.se/ckfinder/userfiles/files/SGC270.pdf (accessed on 10 January 2019).
  8. Cui, Z.; DeMontigny, D. Part 7: A review of CO2 capture using hollow fiber membrane contactors. Carbon Manag. 2014, 4, 69–89. [Google Scholar] [CrossRef]
  9. Heile, S.; Rosenberger, S.; Parker, A.; Jefferson, B.; McAdam, E.J. Establishing the suitability of symmetric ultrathin wall polydimethylsiloxane hollow-fibre membrane contactors for enhanced CO2 separation during biogas upgrading. J. Memb. Sci. 2014, 452, 37–45. [Google Scholar] [CrossRef]
  10. Elhajj, J.; Al-hindi, M.; Azizi, F. A Review of the Absorption and Desorption Processes of Carbon Dioxide in Water Systems. Ind. Eng. Chem. Res. 2014, 53, 2–22. [Google Scholar] [CrossRef]
  11. Belaissaoui, B.; Claveria-Baro, J.; Lorenzo-Hernando, A.; Albarracin, D.; Chabanon, E.; Castel, C.; Rode, S.; Roizard, D.; Favre, E. Potentialities of a dense skin hollow fiber membrane contactor for biogas purification by pressurized water absorption. J. Memb. Sci. 2016, 513, 236–249. [Google Scholar] [CrossRef]
  12. Zaidiza, D.A.; Belaissaoui, B.; Rode, S.; Favre, E. Intensification potential of hollow fiber membrane contactors for CO2 chemical absorption and stripping using monoethanolamine solutions. Sep. Purif. Technol. 2017, 188, 38–51. [Google Scholar] [CrossRef]
  13. Zhao, S.; Feron, P.H.M.; Deng, L.; Favre, E.; Chabanon, E.; Yan, S.; Hou, J.; Chen, V.; Qi, H. Status and progress of membrane contactors in post-combustion carbon capture: A state-of-the-art review of new developments. J. Memb. Sci. 2016, 511, 180–206. [Google Scholar] [CrossRef]
  14. Falk-Pedersen, O.; Grønvold, M.S.; Nøkleby, P.; Bjerve, F.; Svendsen, H.F. CO2 Capture with Membrane Contactors. Int. J. Green Energy 2004, 2, 157–165. [Google Scholar] [CrossRef]
  15. Falk-Pedersen, O.; Bjerve, Y.; Glittum, G.; Rønning, S. Separation of Carbon Dioxide from Offshore Gas Turbine Exhaust. Energy Convers. Manag. 1995, 36, 393–396. [Google Scholar] [CrossRef]
  16. Herzog, H.; Falk-pedersen, O. The Kvaerner membrane contactor: Lessons from a case study in how to reduce capture costs. In Proceedings of the 5th International Conference on Greenhouse Gas Control Technologies, Cairns, Australia, 13–16 August 2000; pp. 121–125. [Google Scholar]
  17. Comite, A.; Costa, C.; Demartini, M.; Di, R.; Oliva, M. Exploring CO2 capture from pressurized industrial gaseous effluents in membrane contactor-based pilot plant. Int. J. Greenh. Gas Control 2017, 67, 60–70. [Google Scholar] [CrossRef]
  18. Klaassen, R. Achieving flue gas desulphurization with membrane gas absorption. Filtr. Sep. 2003, 40, 26–28. [Google Scholar] [CrossRef]
  19. Noble, G.L.; Broomhall, D.; Maple, M.; Shelenko, L.; Truong, J. Hazards Arising from the Conveyance and Use of Gas from Non-Conventional Sources (NCS). 2011. Available online: http://www.hse.gov.uk/research/rrpdf/rr882.pdf (accessed on 10 January 2019).
  20. Arrhenius, K.; Johansson, U. Characterisation of Contaminants in Biogas before and after Upgrading to Vehicle Gas. 2012. Available online: http://www.sgc.se/ckfinder/userfiles/files/SGC246_eng.pdf (accessed on 15 January 2019).
  21. Rasi, S.; Veijanen, A.; Rintala, J. Trace compounds of biogas from different biogas production plants. Energy 2007, 32, 1375–1380. [Google Scholar] [CrossRef]
  22. Rasi, S.; Läntelä, J.; Rintala, J. Trace compounds affecting biogas energy utilization—A review. Energy Convers. Manag. 2011, 52, 3369–3375. [Google Scholar] [CrossRef]
  23. Håkansson, A. Preventing Microbial Growth on Pall-Rings When Upgrading Biogas Using Absorption with Water Wash. 2006. Available online: http://www.sgc.se/ckfinder/userfiles/files/SGC166.pdf (accessed on 20 November 2018).
  24. Yu, H.; Thé, J.; Tan, Z.; Feng, X. Modeling SO2 absorption into water accompanied with reversible reaction in a hollow fiber membrane contactor. Chem. Eng. Sci. 2016, 156, 136–146. [Google Scholar] [CrossRef]
  25. Scholes, C.A.; Qader, A.; Stevens, G.W.; Kentish, S.E. Membrane Gas-Solvent Contactor Pilot Plant Trials of CO2 Absorption from Flue Gas. Sep. Sci. Technol. 2014, 49, 2449–2458. [Google Scholar] [CrossRef]
  26. Zhang, L.; Qu, R.; Sha, Y.; Wang, X.; Yang, L. Membrane gas absorption for CO2 capture from flue gas containing fine particles and gaseous contaminants. Int. J. Greenh. Gas Control 2015, 33, 10–17. [Google Scholar] [CrossRef]
  27. Zhang, L.; Hu, B.; Song, H.; Yang, L.; Ba, L. Colloidal Force Study of Particle Fouling on Gas Capture Membrane. Sci. Rep. 2017, 7, 1–11. [Google Scholar] [CrossRef] [Green Version]
  28. Zhang, L.; Li, J.; Zhou, L.; Liu, R.; Wang, X.; Yang, L. Fouling of Impurities in Desulfurized Flue Gas on Hollow Fiber Membrane Absorption for CO2 Capture. Ind. Eng. Chem. Res. 2016, 55, 8002–8010. [Google Scholar] [CrossRef]
  29. Vogler, S.; Braasch, A.; Buse, G.; Hempel, S.; Schneider, J.; Ulbricht, M. Biogas conditioning using hollow fiber membrane contactors. Chem. Ing. Tech. 2013, 85, 1254–1258. [Google Scholar] [CrossRef]
  30. Sengupta, A.; Peterson, P.A.; Miller, B.D.; Schneider, J.; Fulk, C.W. Large-scale application of membrane contactors for gas transfer from or to ultrapure water. Sep. Purif. Technol. 1998, 14, 189–200. [Google Scholar] [CrossRef]
  31. Liqui-Cel. Cleaning Guidelines. 2013, pp. 1–24. Available online: https://www.3m.com/3M/en_US/liquicel-us/resources/operating-and-technical-guides/ (accessed on 5 February 2016).
  32. Chabanon, E.; Roizard, D.; Favre, E. Modeling strategies of membrane contactors for post-combustion carbon capture: A critical comparative study. Chem. Eng. Sci. 2013, 87, 393–407. [Google Scholar] [CrossRef]
  33. Hepburn, C.A.; Vale, P.; Brown, A.S.; Simms, N.J.; McAdam, E.J. Development of on-line FTIR spectroscopy for siloxane detection in biogas to enhance carbon contactor management. Talanta 2015, 141, 128–136. [Google Scholar] [CrossRef] [PubMed] [Green Version]
  34. Zarebska, A.; Amor, Á.C.; Ciurkot, K.; Karring, H.; Thygesen, O.; Andersen, T.P.; Hägg, M.B.; Christensen, K.V.; Norddahl, B. Fouling mitigation in membrane distillation processes during ammonia stripping from pig manure. J. Memb. Sci. 2015, 484, 119–132. [Google Scholar] [CrossRef]
  35. Luján-Facundo, M.J.; Mendoza-Roca, J.A.; Cuartas-Uribe, B.; Álvarez-Blanco, S. Evaluation of cleaning efficiency of ultrafiltration membranes fouled by BSA using FTIR-ATR as a tool. J. Food Eng. 2015, 163, 1–8. [Google Scholar] [CrossRef]
  36. Mahmud, H.; Kumar, A.; Narbaitz, R.M.; Matsuura, T. A study of mass transfer in the membrane air-stripping process using microporous polyproplylene hollow fibers. J. Memb. Sci. 2000, 179, 29–41. [Google Scholar] [CrossRef] [Green Version]
  37. Högström, R.; Vesala, H.; Heinonen, M. Particulate content of biogas. In Proceedings of the 18th International Congress of Metrology, Paris, France, 19–21 September 2017; p. 08002. [Google Scholar] [CrossRef] [Green Version]
  38. Xu, L.; Shi, Y.; Liu, N.; Cai, Y. Methyl siloxanes in environmental matrices and human plasma/fat from both general industries and residential areas in China. Sci. Total Environ. 2015, 505, 454–463. [Google Scholar] [CrossRef]
  39. Hepburn, C.A.; Martin, B.D.; Simms, N.; McAdam, E.J. Characterization of full-scale carbon contactors for siloxane removal from biogas using online Fourier transform infrared spectroscopy. Environ. Technol. 2015, 36, 178–187. [Google Scholar] [CrossRef]
  40. Mavroudi, M.; Kaldis, S.P.; Sakellaropoulos, G.P. A study of mass transfer resistance in membrane gas-liquid contacting processes. J. Memb. Sci. 2006, 272, 103–115. [Google Scholar] [CrossRef]
  41. Fougerit, V.; Pozzobon, V.; Pareau, D.; Théoleyre, M.; Stambouli, M. Gas-liquid absorption in industrial cross-flow membrane contactors: Experimental and numerical investigation of the influence of transmembrane pressure on partial wetting. Chem. Eng. Sci. 2017, 170, 561–573. [Google Scholar] [CrossRef]
  42. D’Souza, N.M.; Mawson, A.J. Membrane cleaning in the dairy industry: A review. Crit. Rev. Food Sci. Nutr. 2005, 45, 125–134. [Google Scholar] [CrossRef] [PubMed]
  43. Shi, X.; Tal, G.; Hankins, N.P.; Gitis, V. Fouling and cleaning of ultrafiltration membranes: A review. J. Water Process. Eng. 2014, 1, 121–138. [Google Scholar] [CrossRef]
  44. Porcelli, N.; Judd, S. Chemical cleaning of potable water membranes: A review. Water Res. 2010, 71, 137–143. [Google Scholar] [CrossRef] [Green Version]
  45. Boributh, S.; Rongwong, W.; Assabumrungrat, S.; Laosiripojana, N.; Jiraratananon, R. Mathematical modeling and cascade design of hollow fiber membrane contactor for CO2 absorption by monoethanolamine. J. Memb. Sci. 2012, 401–402, 175–189. [Google Scholar] [CrossRef]
  46. Boributh, S.; Assabumrungrat, S.; Laosiripojana, N.; Jiraratananon, R. Effect of membrane module arrangement of gas-liquid membrane contacting process on CO2 absorption performance: A modeling study. J. Memb. Sci. 2011, 372, 75–86. [Google Scholar] [CrossRef]
  47. Bauer, F.; Persson, T.; Hulteberg, C.; Tamm, D. Biogas upgrading—Technology overview, comparison and perspectives for the future. Biofuels. Bioprod. Biorefin. 2013, 7, 499–511. [Google Scholar] [CrossRef]
  48. Belaissaoui, B.; Favre, E. Evaluation of a dense skin hollow fiber gas-liquid membrane contactor for high pressure removal of CO2 from syngas using Selexol as the absorbent. Chem. Eng. Sci. 2018, 184, 186–199. [Google Scholar] [CrossRef]
  49. Dindore, V.Y.; Brilman, D.W.F.; Feron, P.H.M.; Versteeg, G.F. CO2 absorption at elevated pressures using a hollow fiber membrane contactor. J. Memb. Sci. 2004, 235, 99–109. [Google Scholar] [CrossRef] [Green Version]
  50. Belaissaoui, B.; Favre, E. Novel dense skin hollow fiber membrane contactor based process for CO2 removal from raw biogas using water as absorbent. Sep. Purif. Technol. 2018, 193, 112–126. [Google Scholar] [CrossRef]
Figure 1. Schematic of experimental set up used for determining CO2 capture under differing L/G set points and integration with existing absorption column upgrading system on-site at a wastewater treatment works (WWTW).
Water 13 00172 g001
Figure 2. Comparison between CO2 separation observed with a hollow fibre membrane contactor (HFMC) for synthetic and WWTW derived biogas. On-site: Absorbent, potable water, 14 °C; QG was fixed between 0.05 and 7 L min−1, QL was then varied between 0.1 and 9.5 L min−1 for each QG. Lab operation: Absorbent, potable or DI water, 20 °C; QG and QL varied across equivalent coordinates. Inset: absorbent temperature is on-site is comparable to laboratory conditions, 20 °C; 40/60 CO2/CH4 for both lab and WWTW operation.
Water 13 00172 g002
Figure 3. Long-term CO2 separation performance for biomethane production from HFMC technology using potable water: (a) with prefiltration; and (b) comparing ηCO2 before and after prefilter removal. For (a) x-axis error bars are the time period over which the data is collected; y-axis is the mean and standard deviation of ηCO2 over the discrete period measured. For (b) box edges, 25th and 75th percentile; centre line, median; whiskers, min. and max.; n = 17).
Water 13 00172 g003
Figure 4. The impact of membrane drying on the recovery of HFMC CO2 separation performance, to determine the role of capillary wetting on membrane operation. QG, 3.5 L min−1; QL, ranging 0.1–9.5 L min−1.
Water 13 00172 g004
Figure 5. Field emission scanning electron microscopy of fibres extracted from HFMC modules: (a) virgin fibre exposed to synthetic biogas and potable water only; (b) fouled fibre—(i) fibre shell-side, (ii) fibre wall, (iii) fibre lumen-side; (c) shell side of fouled fibres using high magnification image (25 µm scale) to evidence extensive shell-side fibre surface fouling.
Water 13 00172 g005
Figure 6. FTIR spectra detailing surface bound functional groups present on polypropylene (PP) hollow fibres pre and post shell-side chemical clean. Additional peaks at 1542 cm−1 and 1647 cm−1 are attributed to amide II and amide I stretches respectively [34] whilst the stretch from 3100 cm−1 downwards is attributed to water [35]. Inset: Close up of spectra between 1500 and 1700 cm−1.
Water 13 00172 g006
Figure 7. Fouling during dispersive, absorption column and non-dispersive, HFMC gas-liquid contacting. The left-hand photograph of liquid-phase fouling shows from left to right: a chemically cleaned, unused, and fouled membrane, respectively.
Water 13 00172 g007
Figure 8. Performance recovery parity of a fouled membrane after chemical cleaning of the membrane shell. Gas flow rate (QG) was fixed at 3.5 L m−1 and liquid flow rate (QL) varied between 0.5 and 1.2 L m−1, inlet gas comprised 60/40 CO2/CH4 and PG 0.5 BarG and potable water at 20 °C. Straight lines represent synthetic data from virgin membrane for comparison; deviations plotted from this data to indicate the impact of fouling and subsequently cleaning of the module.
Water 13 00172 g008
Table 1. GC-MS analysis and moisture content of biogas pre and post-filtration.
WWTW Biogas+ACS 1+ACS, +SAZ 2SAZ 3
Compoundmg m−3mg m−3mg m−3mg kg−1
Carbon Disulphide3.34.2<1-
Total Organo-Sulphur Compounds 5.34.2<1-
Total Volatile Organic Compounds 320256<100 4-
Total Petroleum Hydrocarbons18711735.1-
Cyclic Octatomic Sulphur---2.5
Octamethylcyclotetrasiloxane (D4)---1.8
Decamethylcyclopentasiloxane (D5)---10
Terpenes---4.93
3,7-Dimethyl-3-octanol---2.6
Total C12-C14 Hydrocarbons---27
- Not recorded. 1 Anhydrous Calcium Sulphate 2 Silico Aluminate Zeolite. 3 Analysis of biogas compounds bound to 300 g SAZ prefiltration media. 4 Limit of detection.
Publisher’s Note: MDPI stays neutral with regard to jurisdictional claims in published maps and institutional affiliations.

