Geospatial Open Data Usage and Metadata Quality


1
Institute for Applied Mathematics and Information Technologies National Research Council, 16149 Genoa, Italy
2
Instituto Nacional de Pesquisas Espaciais, Sao Jose dos Campos 12230-081, Brazil
*
Author to whom correspondence should be addressed.
ISPRS Int. J. Geo-Inf. 2021, 10(1), 30; https://doi.org/10.3390/ijgi10010030
Submission received: 27 November 2020
/
Revised: 29 December 2020
/
Accepted: 11 January 2021
/
Published: 13 January 2021
(This article belongs to the Special Issue Geospatial Metadata)
Abstract
:The Open Government Data portals (OGD), thanks to the presence of thousands of geo-referenced datasets, containing spatial information are of extreme interest for any analysis or process relating to the territory. For this to happen, users must be enabled to access these datasets and reuse them. An element often considered as hindering the full dissemination of OGD data is the quality of their metadata. Starting from an experimental investigation conducted on over 160,000 geospatial datasets belonging to six national and international OGD portals, this work has as its first objective to provide an overview of the usage of these portals measured in terms of datasets views and downloads. Furthermore, to assess the possible influence of the quality of the metadata on the use of geospatial datasets, an assessment of the metadata for each dataset was carried out, and the correlation between these two variables was measured. The results obtained showed a significant underutilization of geospatial datasets and a generally poor quality of their metadata. In addition, a weak correlation was found between the use and quality of the metadata, not such as to assert with certainty that the latter is a determining factor of the former.
1. Introduction
The Open Data (OD) movement is playing an important role in the geospatial sector, by introducing a paradigm shift in the supply and use of geodata that is provided for free, in a machine-readable format and with minimal restrictions on reuse [1,2]. By way of example, this is the case of the enormous amount of satellite data made available, openly, by the EU Copernicus program (https://www.copernicus.eu/it). Over recent years, thousands of OD datasets have been released on the web by governments and public institutions through Open Government Data (OGD) portals at national and international levels (e.g., data.gov.uk, data.gov, and europeandataportal.eu). These portals aim to provide accurate, consistent, and authoritative resources for generating “added value” both economic and social [3,4]. The European report “Creating value through open data” [5] anticipated significant benefits from the reuse of OD, including an increase in the number of users, the number and diversity of commercial applications, with a positive impact on economic growth, and a greater ability to face social or environmental challenges.
The geospatial sector was one of the early sectors to progress significantly in opening data. As early as 2011, the Open Data for Resilience Initiative (https://opendri.org/) started to apply the OD practices to face vulnerability to natural hazards and the impacts of climate change. Currently, examples of Geospatial OGD (GOGD) are provided by international initiatives, such as the European Union’s Copernicus Programme for Earth Observation supported by the European Space Agency who delivers a growing volume of satellite data in real time for monitoring the earth ecosystem, or by national initiatives (e.g., national OD portals) which provide data related to citizens’ activities (e.g., data from traffic, transportation, socio-economic statistics). Geospatial OD can be classified according to their providers into three typologies: collaboratively contributed OD (e.g., voluntary data [6], OpenStreetMap), authoritative OD, and scientific OD [1]. The majority of OGD strongly relates to geospatial information (e.g., transit routes, building permits, jurisdiction address).
Although the literature recognizes the undoubted advantages of OD, there are still various barriers in the publication and use of OD regarding data providers (unwilling to publish their data) or data users (unable to use data easily in practice) [7,8]. As observed by Jansen et al. [9], OGD is of limited value if is not used. Aimed at understanding the use of OGD portals, in our previous work [10], based on an experimental evaluation of the usage of a set of five OGD portal datasets, we concluded that they are largely underused pointing out that this issue requires further exploration to analyze possible affecting factors.
Metadata (data about the data) play a crucial role in the OGD portals to facilitate user access and reuse through search and filtering capabilities [11,12]. Several metadata standards have been proposed to facilitate data circulation among different communities and software systems. For instance, W3C recommends standard vocabularies such as RDF (https://www.w3.org/RDF/), DCAT (https://www.w3.org/ns/dcat) to facilitate interoperability between data catalogues on the web [13,14], its extension DCAT-AP (https://joinup.ec.europa.eu/solution/dcat-application-profile-data-portals-europe) for describing public sector datasets in Europe and GeoDCAT-AP (https://joinup.ec.europa.eu/solution/geodcat-application-profile-data-portals-europe/about) for the representation of geographic metadata in the European INSPIRE (like ISO, e.g., ISO/TC211) (https://www.iso.org/committee/54904/x/catalogue/) [15], and OGC [16]. The availability of these standards alone, however, does not guarantee automatically that appropriate metadata are produced and associated with the corresponding datasets. Several factors, such as lack of skills by metadata providers, or the lack of well-designed metadata editors, can hamper the productions of good metadata, thus impeding the reuse of OGD [11,17]. This fact is well attested to by several studies aimed at assessing and monitoring OGD portals’ performance as well as the quality of their metadata [13,14,18,19,20,21]. In particular, Neumaier et al. [14] developed a metadata quality framework for assessing OGD portals based on various platforms. Based on the mapping from the different metadata schemes of the portal platforms to the W3C DCAT metadata, they implement seventeen metrics to assess the OGD portal metadata quality at the dataset level. We leverage that framework to assess the metadata quality of a sample of GOGD datasets.
Considering the relevance of GOGD, the present study aims at investigating their usage, the quality of their metadata, and the existence of a possible relationship between them. Our analysis is based on a sample of six national and international OGD portals, amounting to more than 160,000 geospatial datasets whose metadata have been programmatically collected and analyzed to gather usage and quality information. As a first contribution, this work documents GOGD usage trends. Our findings agree with our previous study [10], revealing that most of the datasets are rarely viewed and downloaded. The second contribution is the evaluation of GOGD metadata quality, based on the framework presented in [14]. With one exception, the assessment yielded low-medium overall quality mean values for the portals considered. As the final contribution, the analysis of the relationship between GOGD datasets’ usage and their metadata quality showed a mild correlation between the two variables (and not in all cases). In our opinion, this does not confirm the fact that the quality of the metadata can certainly affect the geospatial datasets usage.
2. Background
2.1. Geospatial Open Data, Opportunities, and User Needs
In the Geospatial domain, the OD paradigm offers the opportunity to promote the democratization of geographical information, the transparency governments and institutions [22], as well as social, economic, and environmental opportunities. The European Data Portal provides insights of numerous examples of applications that use geospatial OD to deliver services to citizens (https://www.europeandataportal.eu/en/using-data/use-cases, last accessed: 20 July 2020). Traditionally, accessing government geodata were a complicated and expensive process, due to proprietary software and data. The provision of government data as open represents a significant change to the user who can access data typically provided for free with minimal restrictions on reuse [8,23]. Coetze et al. [1] provide an outlook about how, in the last few decades, the geospatial domain has increasingly adopted OD, the significant advances in this regard, and how openness has changed how geospatial data are collected, processed, analyzed, and visualized.
The success of OD ecosystems largely depends on identifying barriers and key features, implementation challenges, datasets usage trends, and impact cases of their adoption [24,25,26,27]. Gonzalez et al. [28] provide a systematic literature review on OGD identifying a multitude of implicit relations between four factors of OGD utilization: the different types of utilization, the effects of utilization, the key conditions, and the different users. Such a relationship may help to understand whether and how the promise of OGD benefits can be fulfilled. The ease of use, usefulness, as well as transparency, participation, and collaboration expectancies significantly determine the Citizens’ intention to use OGD [29]. Concerning the reuse of open geodata, Degbelo et al. [30] review existing literature on smart and open cities, and identify key challenges and opportunities taking a citizen-centric perspective. Empowering citizens to take full advantage of available OD is a promising way to foster innovation and citizens-centric solutions for cities. Johnson et al. [2] analyze the economic and civil barriers, and propose using civic hackathons as a new way for local government–citizen interaction. Benitez et al. [31] highlight that the most relevant issues hindering data reuse concern outdated data, difficulty to access, misinterpretation, and misuse of data and their terms of use. They suggest a taxonomy of these barriers for Colombia and Spain. Menitez-Paez et al. [32] suggest a conceptual framework to help local authorities re-define their current OD strategies and improve re-usability levels in light of user requirements. Ruijer et al. [33] provide a concrete study on the use of OGD based on collaborative initiatives between civil servants and citizens: they highlight the need for a shared cognitive framework to understand OD as well as the need for high-quality data sets.
In addition to the above solutions based primarily on direct user involvement, Degbelo [34] introduces a preliminary taxonomy for OD user needs, which can help data providers to design “demand-driven” portals, and to implement evaluation tools for facilitating data reuse. User needs are regarded as fundamental to produce accurate documentation capable of supporting the information search activity [35]. Zhu et al. [36] evaluate 34 US municipal Open Data portals with a ’User Interaction Framework’ defining an overall performance score. Their results showed that portals perform well in terms of providing access, but not so well in helping users understand and engage with data. Authors observe that portals’ platforms need to be improved to achieve more user engagement and participation, suggesting that “more research is needed to understand who uses the portals and the data, and for what purposes”. The present work sought to answer a different, although related, quantitative question: “Which is the GOGD portals usage trend, measured as the number of geospatial datasets viewed (and downloaded) by users?”.
2.2. OGD Portals Quality Assessment
Through specific software platforms, the managers of the OGD portals make public data available according to the release policies in force in their administrations. Among the platforms adopted in OGD portals, the open-source CKAN and the commercial Socrata stand out in number [20,37]. These platforms provide metadata ecosystems, data management systems, search, and browsing facilities as well as APIs with which it is possible to programmatically query the portals to download both metadata and datasets [37]. However, the various software frameworks provide their metadata schemas and different ways of content visualization [7,8,38,39]. For example, all portals based on Socrata present the contents of the datasets in tabular form, while, in CKAN, the user accesses the dataset content only by downloading one or more files in the desired formats. Socrata always displays usage data while in CKAN only upon the choice of portal managers.
Basic OGD portal features such as keyword search and filtering by metadata terms (e.g., theme category, data types, format, and license) aimed at improving data accessibility. Good quality metadata are therefore of paramount importance to support the discovery and access of GOGD datasets, and their re-use. Several studies have investigated OGD portal performance and the quality of their metadata [8,12,13,14,18,19,20,22,40,41]. Some of their solutions are based on the Five Star Model for Linked Open Data (https://www.w3.org/DesignIssues/LinkedData.html) as suggested by Tim Berners-Lee [21,42], as well as on the Eight Open Government Data Principles (https://public.resource.org/8_principles.html). For example, the Metadata Quality Assurance (MQA) tool available in the European Data Portal provides the metadata validation against the Linked Data specification DCAT-AP to increase OD interoperability and accessibility, and periodically executes quality checks of the metadata against various indicators derived from FAIR (https://www.go-fair.org/fair-principles/) principles [21]. Nevertheless, the tool is limited to investigate exclusively the metadata collected in the European Data Portal. Wilkinson et al., based on the FAIR principles [43], have designed a framework [44] and developed a “FAIR Evaluation Services tool” implementing 22 metrics, for assessing the compliance of a Web resource with those principles. Through this tool, users can choose to select all 22 FAIR metrics, or one of the four subgroups, for assessing the FAIRness of a given (Web) resource. Aiming at using this tool for our experimental analysis, we tested it on several datasets of different OGD portals. However, as we measured response times of at least 5 min with peaks of 30 min or more, for assessing a single dataset, we rejected the initial hypothesis of using the FAIR tool, due to the great number of datasets in our sample. The “Open Data Portal Watch” [14], a metadata quality assessment and monitoring framework, processes hundreds of OGD portals mapping their metadata to DCAT and assessing a quite large set of dimensions/metrics independently from the publishing platforms (CKAN, Socrata, and OpenDataSoft). To assess the quality of the datasets’ metadata of our OGD portals sample, we relied on this framework implementation that we tailored for retrieving datasets’ usage information and produce analytics.
Moreover, some international initiatives focused on the evaluation and ranking of OGD portals under different perspectives. The Global Open Data Index (GODI) (https://index.okfn.org), developed by the Open Knowledge International, tracks the state of OGD, identifying the countries that are publishing data in the right and in a timely way. The OURdata Index (http://www.oecd.org/gov/digital-government/ourdata-index-policy-paper-2020.pdf), developed by the Organisation for Economic Co-operation and Development, assesses governments’ efforts to implement OD in the three critical areas Openness, Usefulness, and Re-usability. The OpenDataMonitor (https://opendatamonitor.eu) provides an overview of the EU OD landscape providing visualizations on the EU level and for different catalogues. The Open Data Barometer (https://opendatabarometer.org), developed by the World Wide Web Foundation provides a snapshot of OGD practices focusing on OD readiness, implementation, and emerging impacts. All of these activities highlight that important improvement should be made to enhance openness, interoperability, and usability in many countries with few exceptions for UK, Canada, and the US renowned for the maturity of their OGD ecosystems.
Notwithstanding the numerous initiatives and studies aimed at analyzing OGD portals performance and the quality of their metadata, little has been done to (quantitatively) analyze their actual use. As far as we know, nor the relationship between the quality of OGD metadata and their usage has been empirically investigated. Much less has been done with regard to geospatial datasets.
3. Materials and Methods
To evaluate the use of GOGD and the quality of their metadata, we started by considering most of the national OGD portals present today. We added some international portals, to supply a more heterogeneous coverage of portals with different administrative systems. Among them, we selected those which present ed usage information, mainly the number of views and downloads of the datasets, and provided the APIs for the programmatic retrieval of this information. As regards the analysis of the quality of the metadata downloaded via API, we resorted to the technological framework proposed in [14], integrating and extending it to select, among all the datasets of each portal, only those explicitly characterized by geospatial information.
3.1. Open Data Portal Identification
We considered two types of OGD portals based on their administrative coverage: national and international. As for the former, we started by examining the 94 national portals classified by the GODI index in 2016/2017 and four portals from other countries (Korea, Spain, Ireland, Estonia) not considered in GODI but included in the OECD OURdata Index-based classification performed both in 2017 than in 2019. The portals were analyzed to select those that provided view and download metrics; first of all, at the Web portal level, and, from these, the ones that provide d API to automatically retrieve these usage values. This selection led to the identification of eight national portals: US, Colombia, Ireland, Slovenia, Poland, France, Latvia, and Puerto Rico. From these, we kept a portal subset that publishes a percentage of geospatial datasets of at least 5% on the total and in the order of several hundred. This led to the identification of three portals: US, Colombia, and Ireland portals. We excluded Latvia and Puerto Rico because of the low number of overall datasets, respectively 336 and 178. We ruled out Slovenia as no category refers explicitly to geodata sets, and the dataset formats mainly refer to the PCAXIS format (98%) used for statistical information. Even the Polish portal does not provide any data category explicitly targeted for geodata and publishes very few datasets with geodata formats (https://gisgeography.com/gis-formats/), e.g., there are only six datasets in shape format (i.e., ‘.shp’) commonly used for vector spatial data, and six in ‘.jpg’ format used for raster maps. The distribution of datasets with respect to the formats shows a prevalence for html, xls, xlsx, and csv (90%) followed by several other formats with few numbers. We neither included the French portal, although it publishes more than half of its datasets according to the ‘.shp’ format (20,858 out of 39,412 total datasets), as a preliminary statistic showed that just a very few of these datasets are viewed at least once. More precisely, the 3rd quartile is equal to 1, and even the 95th percentile is equal to seven views (amounting about 1000 datasets, circa 2.5% of the total). To balance the national and international portals ratio of our sample, and keeping the same design objectives (i.e., percentage on the total and numerosity of geospatial datasets), we selected three international portals that we deem of public utility and significant interest, even for the heterogeneity of these portals in three thematic sectors: aerospace, legislative, and humanitarian. This heterogeneity can bring to light differences or similarities in user behavior, in principle, with different interests and needs. The Humanitarian Data Exchange portal (HDX) managed by UN-OCHA aims at sharing data on humanitarian crises in different countries. The European Union Open Data Portal (EUODP) gives access to open data published by EU institutions and bodies. The NASA portal collects and makes publicly available about 10,000 NASA datasets, aggregating data harvested from different archives (e.g., Planetary Data System, National Oceanographic, and Atmospheric Agency). All of these portals allow the retrieval of usage data via API.
From the six portals previously identified, we extracted those datasets somehow identifiable as containing geospatial information. This skimming has been based on the specific filtering criteria provided by each portal, applying the category filters, where available, or the ones on the dataset type or format. In the case of the US, Colombia, HDX, and NASA portals, we considered the categorical terms “geospatial”, “map”, “geodata”, and “Earth Sciences”, respectively. When the category was not explicitly present, the geospatial datasets were selected based on the data format, for example by filtering the data available in geoJSON, KML, WFS, GML, and WMS formats, for the Irish portal; or, by keywords, i.e., “geographic”, “orthoimage”, and “geospatial data” for EUODP. Data collection was conducted in December 2019. These data provide a snapshot of the overall usage of the datasets of the six portals, in terms of total Views and Downloads, up to that moment. We have provided the metadata of all the datasets of these portals along with the usage and the evaluated quality values as Open Data in the OD Zenodo repository [45].
The selection outcome is shown in Table 1.
As it can be seen from Table 1, the percentage of retrieved geospatial datasets with respect to the total varies from portals: from about 60% of US to about 5% for Colombia, with a percentage of 50% considering the overall number of datasets of the six portals in our sample.
3.2. Usage Metrics
From the analysis of the portals aimed at selecting those that make information available on the use of datasets, it was clear that, when present, two values are mainly displayed: the number of views and, sometimes, the number of downloads. Therefore, our analysis of GOGD usage trends was based on these two usage metrics [46,47]. With Views, we mean “the total number of times the page of a dataset was loaded in users’ browsers” and by Downloads “the total number of users’ requests for retrieving the full content of a particular dataset” [48]. These total usage values can be returned by portal APIs and can be found, along with other dataset metadata, on the dataset access page. The CKAN and Socrata platforms can return, according to the methods discussed in the next section; these two values via the APIs retrieve the metadata associated with the portals’ datasets.
3.3. Usage Metric Retrieval
The portals’ usage data were retrieved by exploiting the metadata discovery APIs provided by the CKAN and Socrata portals’ platforms. Metadata content was extracted and stored in a PostgreSQL database for subsequent analysis. All code was written in Python, also for easier integration with the third-party quality assessment platform code adopted (see the next section). We summarize hereafter the main features relating to the interaction with these APIs.
The information related to the number of views for a dataset can be obtained through CKAN API, extracting the content of a specific field called tracking_summary (from version 2.7.3, the package_show API call does not return the tracking_summary, keys in the dataset, or resources by default anymore), which in turn contains a pair of values total and recent (i.e., Views in the last 14 days). Given our definition of Views, we took the total value to assess the usage of a CKAN dataset. These values are returned only if allowed by the portal managers at server-side. By cycling on the whole list of datasets of the portal, the overall views situation may be recovered. Indeed, CKAN APIs only returns dataset Views and not Downloads information. A portal such as the Humanitarian Data Exchange (HDX), based on an extension to CKAN, also returns downloads along with the views numbers.
Compared to the CKAN APIs, the RESTful Socrata Open Data API (SODA (https://dev.socrata.com/)) retrieves a smaller set of metadata fields compared to the one retrieved by CKAN. For instance, the downloadable formats of dataset content are not reported. However, conversely to CKAN, the metadata returned by SODA also include the total number of downloads (download_count) along with the total number of views (page_views) that exactly correspond to our metrics Views and Downloads.
3.4. GOGD Metadata Quality Assessment
Data quality is “a multifaceted concept” involving several dimensions [49], where a quality dimension can be seen as a set of “quality attributes that represents a single aspect or construct of data quality” [50]. A quality metric serves to measure a specific aspect of a given dimension. Quality dimensions and metrics are central at evaluating whether a piece of data meets the information users’ needs [34] in a specific situation [51]. For the metadata quality assessment of the OGD portals sample, we relied on the ‘Open Data Portal Watch’ platform code (https://github.com/sebneu/portalwatch), based on the methodology and metrics defined in [14]. This platform maps the datasets’ metadata, retrieved by various portals APIs, to the DCAT W3C standard, and implements 17 quality metrics to assess the compliance of ingested metadata with DCAT requirements. Such metrics relate to three quality dimensions: (i) Existence: “do specific metadata fields exist?”; (ii) Conformance: “do metadata values adhere to a certain format?”; (iii) Data Open: “may the specified format and license information classify a dataset as open?”. The eight Existence metrics evaluate if metadata supply useful information to discover (i.e., is there a dataset description, a title, some keywords?) and access (i.e., are there URIs to access and download?) the associated dataset, to contact the owner or the publisher. The presence of license information, as well as the dates of creation and modification of the metadata and of the dataset, are also evaluated. The Preservation metric assesses the availability of metadata information regarding the format, size, and the update frequency of the datasets. The Spatial and Temporal metrics (declared and implemented only in the framework code) ascertain if some spatial (e.g., polygon, shape, …) or temporal (e.g., start or end of the period of the time covered by the dataset) information exists, following the Spatial Data on the Web Best Practices (SDW) (https://www.w3.org/TR/sdw-bp) published by the joint W3C-OGC working group. The six Conformance metrics assess the syntactical validity of the access URI, the contact email address and URI, and the date format; the license conformance is checked by analyzing a list of license descriptions provided by the Open Definition (https://licenses.opendefinition.org/licenses/groups/all.json), and the validity of the file format is checked against a list of registered formats and media types supplied by IANA (http://www.iana.org/assignments/media-types/media-types.xhtml). As to the three Data Open metrics, they ascertain the datasets compliance to the Open (Knowledge) Definition (http://opendefinition.org/od/2.1/en/), assessing if the datasets are supplied in a machine-readable and open format, and according to an open license.
The quality assessment was carried out on each portals’ geospatial datasets, resulting in a single, boolean, or floating (in the [0,1] range), value for each metric. For each dataset, after converting boolean values into 0 and 1, we aggregated the 17 metrics according to the Simple Additive Weighting (SAW) decision-making method, by assigning equal weight () to every metric, thus resulting in a dataset overall metadata quality value , .
The ‘Open Data Portal Watch’ platform code was integrated with our usage extraction code and extended to elaborate and produce analytics and reporting.
We point out that, to give an image as analytical as possible of the quality of the portals and their use, the quality assessment that we have carried out is intrinsically objective (aka structural), measurable through impartial physical characteristics (e.g., item counts, ratios) of the OGD portals. It has ignored subjective (aka contextual) aspects, capable of taking into account users’ needs and purposes and informing their usage choices [52], but which cannot be measured by the type of experimental investigation such as that proposed by us that programmatically evaluates a large number of datasets belonging to different public administrations and organizations, based on the metadata they supply.
4. Results
The analysis carried out on the portals listed in Table 1 focused on two aspects: the geospatial datasets usage trends, measured as the number of Views and Downloads, and their metadata quality.
4.1. Geospatial Open Data Usage
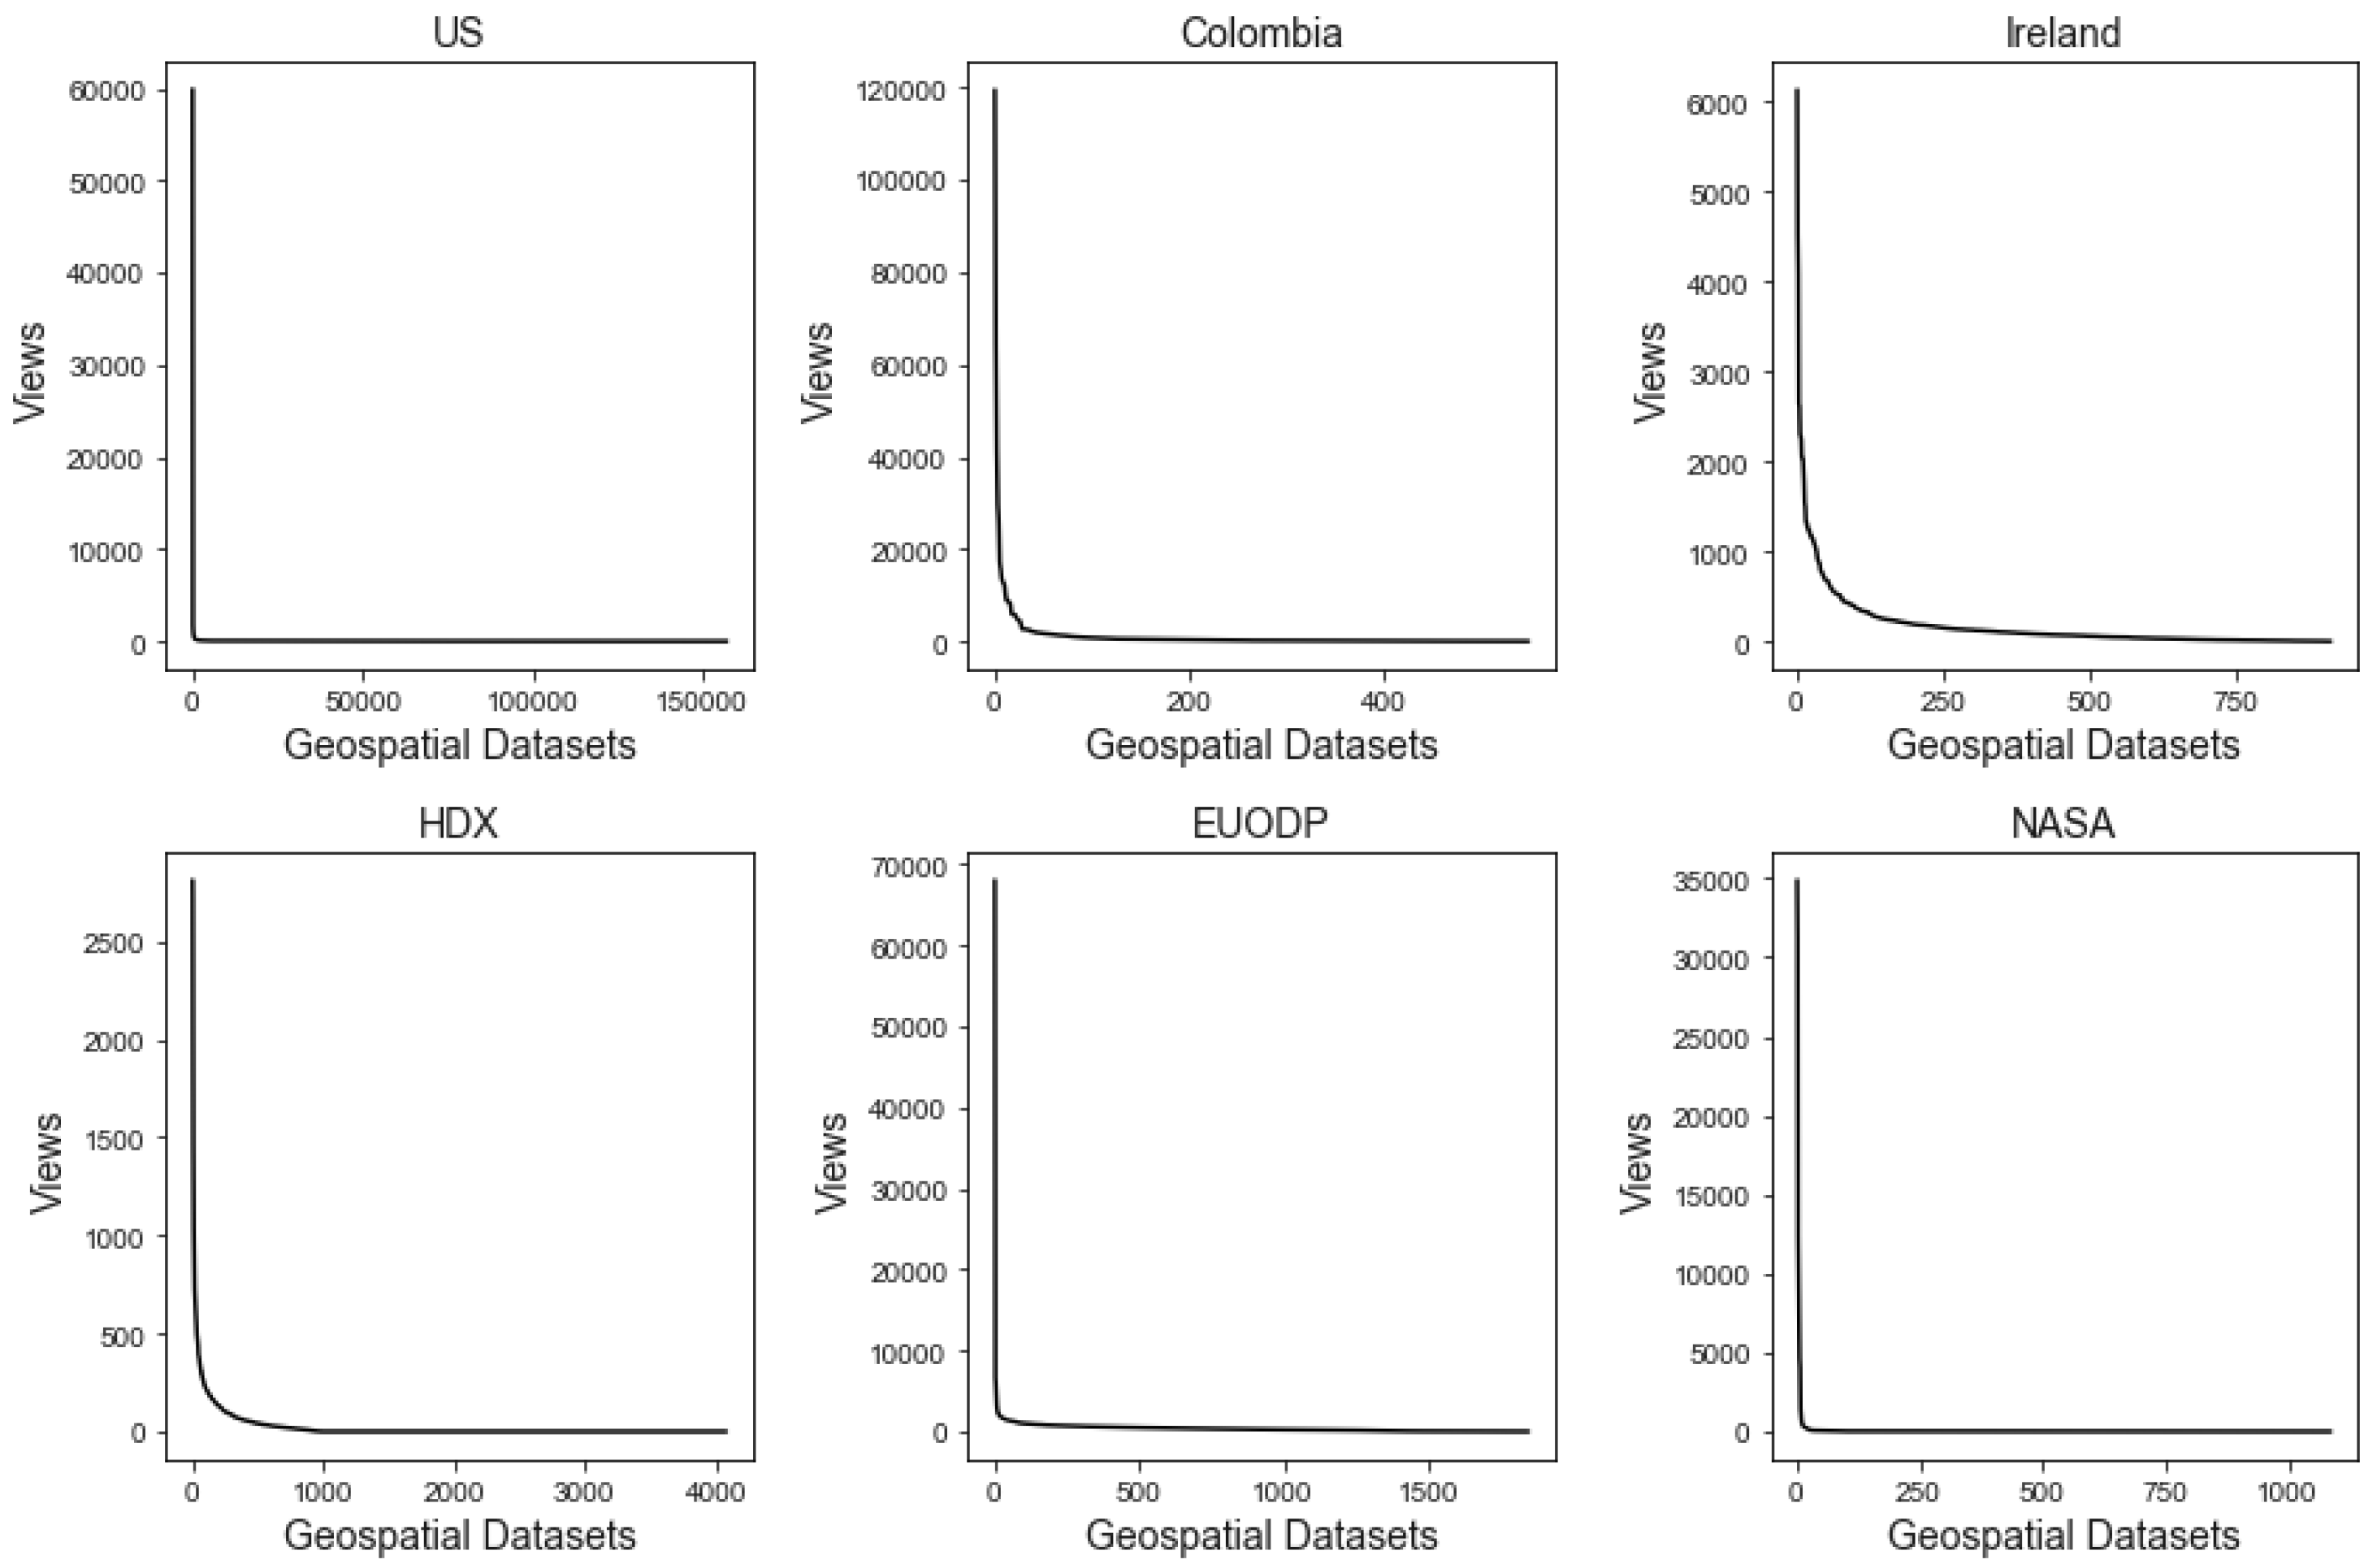
Figure 1 shows the Views frequencies for the geospatial datasets of the six portals considered, accounting for the total views up to December 2019.
All curves follow a heavy-tailed distribution with a high frequency of use focused on very few datasets, and most of them with an extremely low frequency.
The descriptive statistics in Table 2 give further confirmation and help us highlight some differences between the portals, despite the common general trend. The very low usage values in all the statistics of the USA, HDX, and NASA portals are particularly surprising. The first two quartiles show that almost 50% of their datasets are barely viewed (with the highest median equal 15 for the US portal), and another 25% just more visited (with the highest third quartile of 22 for the US). This fact is particularly unexpected in the case of the US considering the size of its population, as well as of its portal that has grown to over 200,000 datasets provided by hundreds of data sources, and its full-blown tradition of attention to OD, which quickly turned it into an open data government flagship initiative and set an example for other government data catalogues that have been open worldwide since 2009. In addition, the case of NASA is surprising considering the potential interest of its datasets for the whole scientific community. In this case, one reason may be that several datasets from the calibration/validation activities are made available either on NASA’s portal, but can also be accessed from multiple platforms, for example, through mission-specific pages, or through portals such as ‘Appears’ (https://lpdaacsvc.cr.usgs.gov/appeears), ‘earthdata’ (https://search.earthdata.nasa.gov), or ‘NOAA’ (https://www.ncdc.noaa.gov/cdo-web), all of which provide advanced geospatial visualization and downloading features, for the very same dataset, in many cases. This fact may distribute the views/download counts amongst each portal. Instead, the extremely low values for HDX can be explained by the fact that its number of published datasets doubled in about nine months, as we noticed comparing the values collected in late March 2019, in our previous work [10], to the one available at the end of December 2019. For this reason, it is logical to expect that more than half of these datasets have had little time to be viewed by users. To this consideration, however, it should be added that the previous sample also gave extremely reduced usage values. The other three portals are much better, showing values for the three quartiles of even two orders of magnitude higher. The portals of Colombia and that of the European Union stand out in this sense.
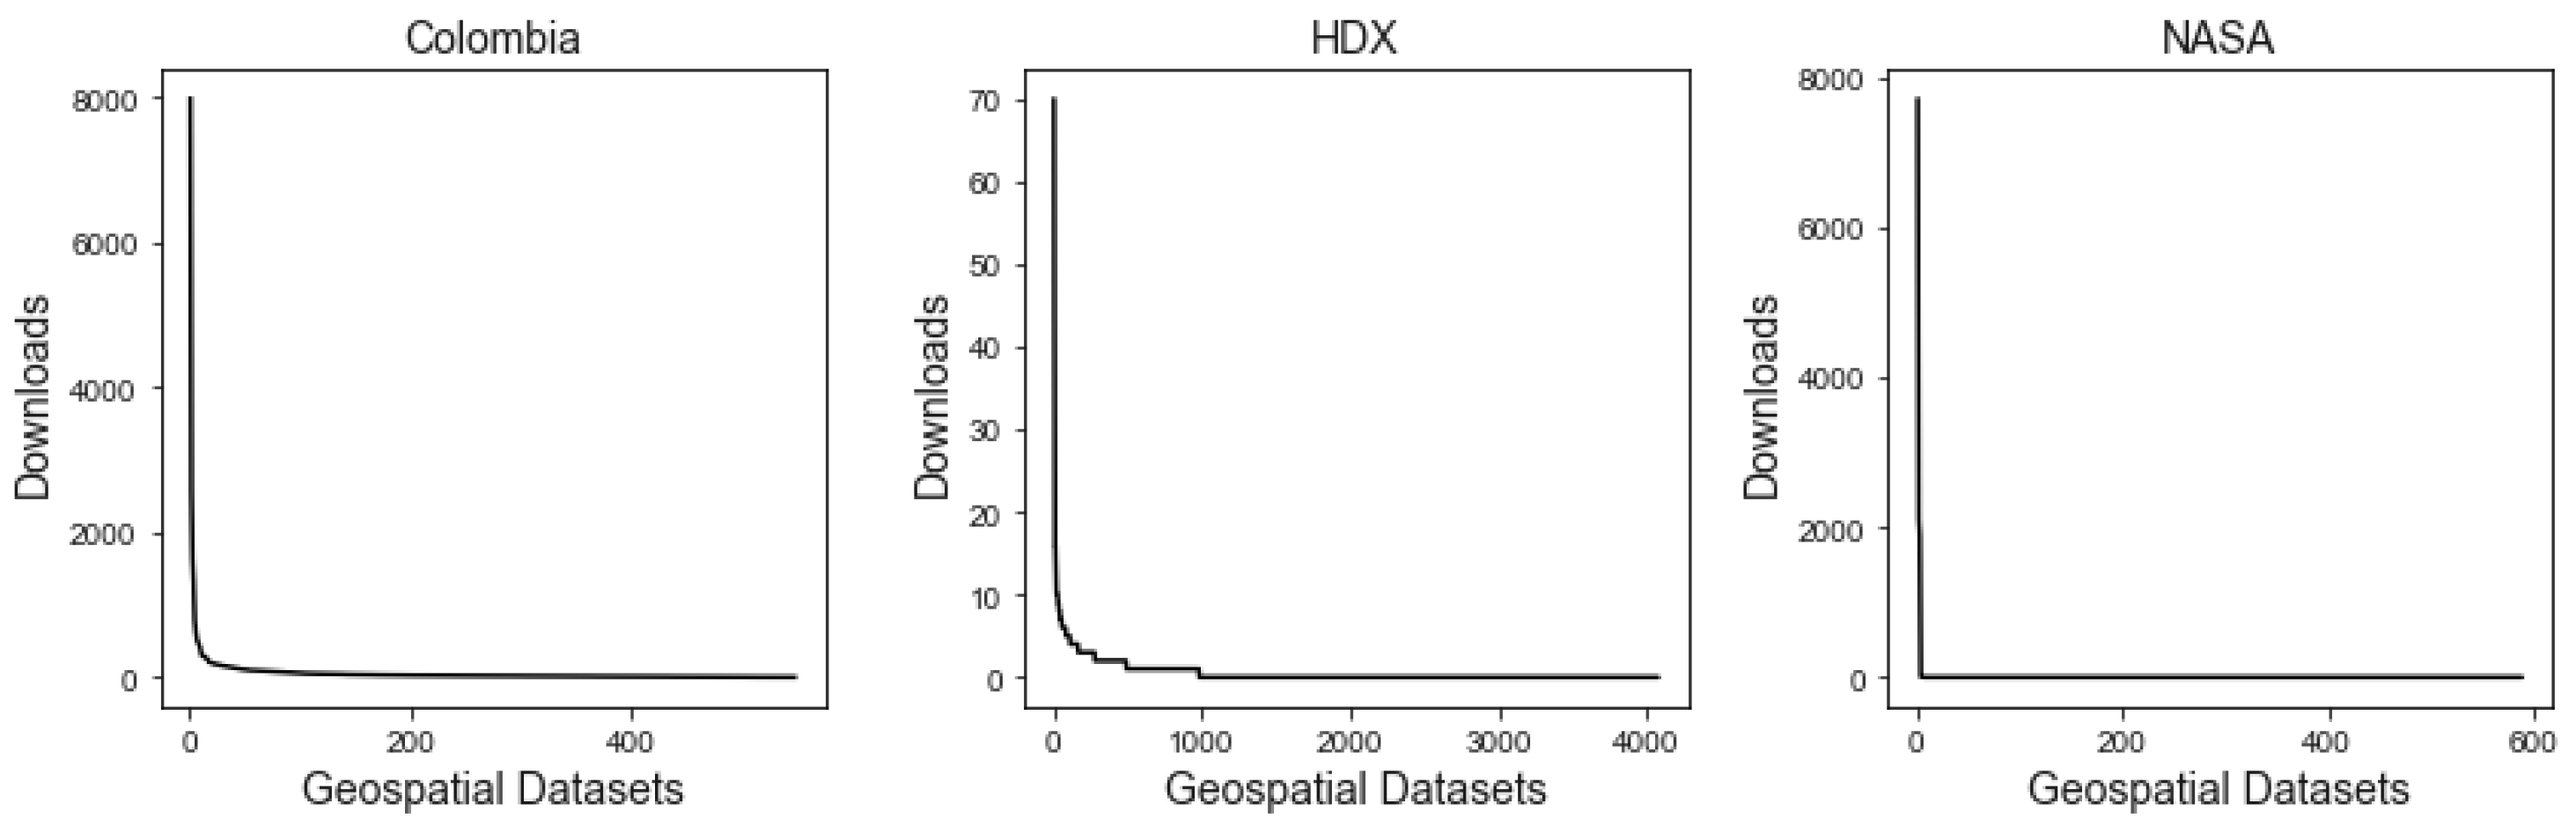
As regards the downloads’ distribution indicator, as it is returned by the APIs only for Colombia, HDX and NASA portals, we report in Figure 2 and Table 3 just the distribution curves and the statistics for these three portals, accounting for the total downloads up to December 2019.
Comparing these plots and data with the one related to the number of Views (Figure 1 and Table 2), the mean Downloads numbers are considerably less than the number of Views, and, in the case of the two international portals, Downloads numbers are 0 for all three quartiles, the Downloads’ mean values are respectively of 64 (std 373) for Colombia (by contrast with a mean of 1251 Views), 0.6 (std 2.2) for HDX (by contrast with a mean of 25 Views), and 19 (std 338) for NASA (by contrast with a mean of 113 Views). For the two Socrata-based portals (i.e., Colombia and NASA), and, in particular, for the Colombia one, the difference between views and downloads could be caused by the fact that Socrata shows the entire dataset content in tabular form. We believe that such an availability can reduce the users’ need to further download the datasets, once they have already entirely visualized their content. Moreover, the reduced number of Downloads of NASA datasets can be explained similarly to what was observed for the Views, i.e., the different number of portals that publish the same dataset. As to the extremely low mean Downloads numbers (0.6) of HDX, as for the Views number, we believe that is because more than half of the portal datasets have been published just in the last few months.
Considering that the number of Downloads can indicate a greater interest of users towards the dataset than the number of Views, and its potential re-use in some reworking or analysis, it is rather regrettable that only three portals, out of the six of our sample, contain this information. Having the Downloads numbers for the whole portals sample would allow us to provide a more comprehensive view of the users’ behavior.
4.2. Geospatial Open Data Metadata Quality
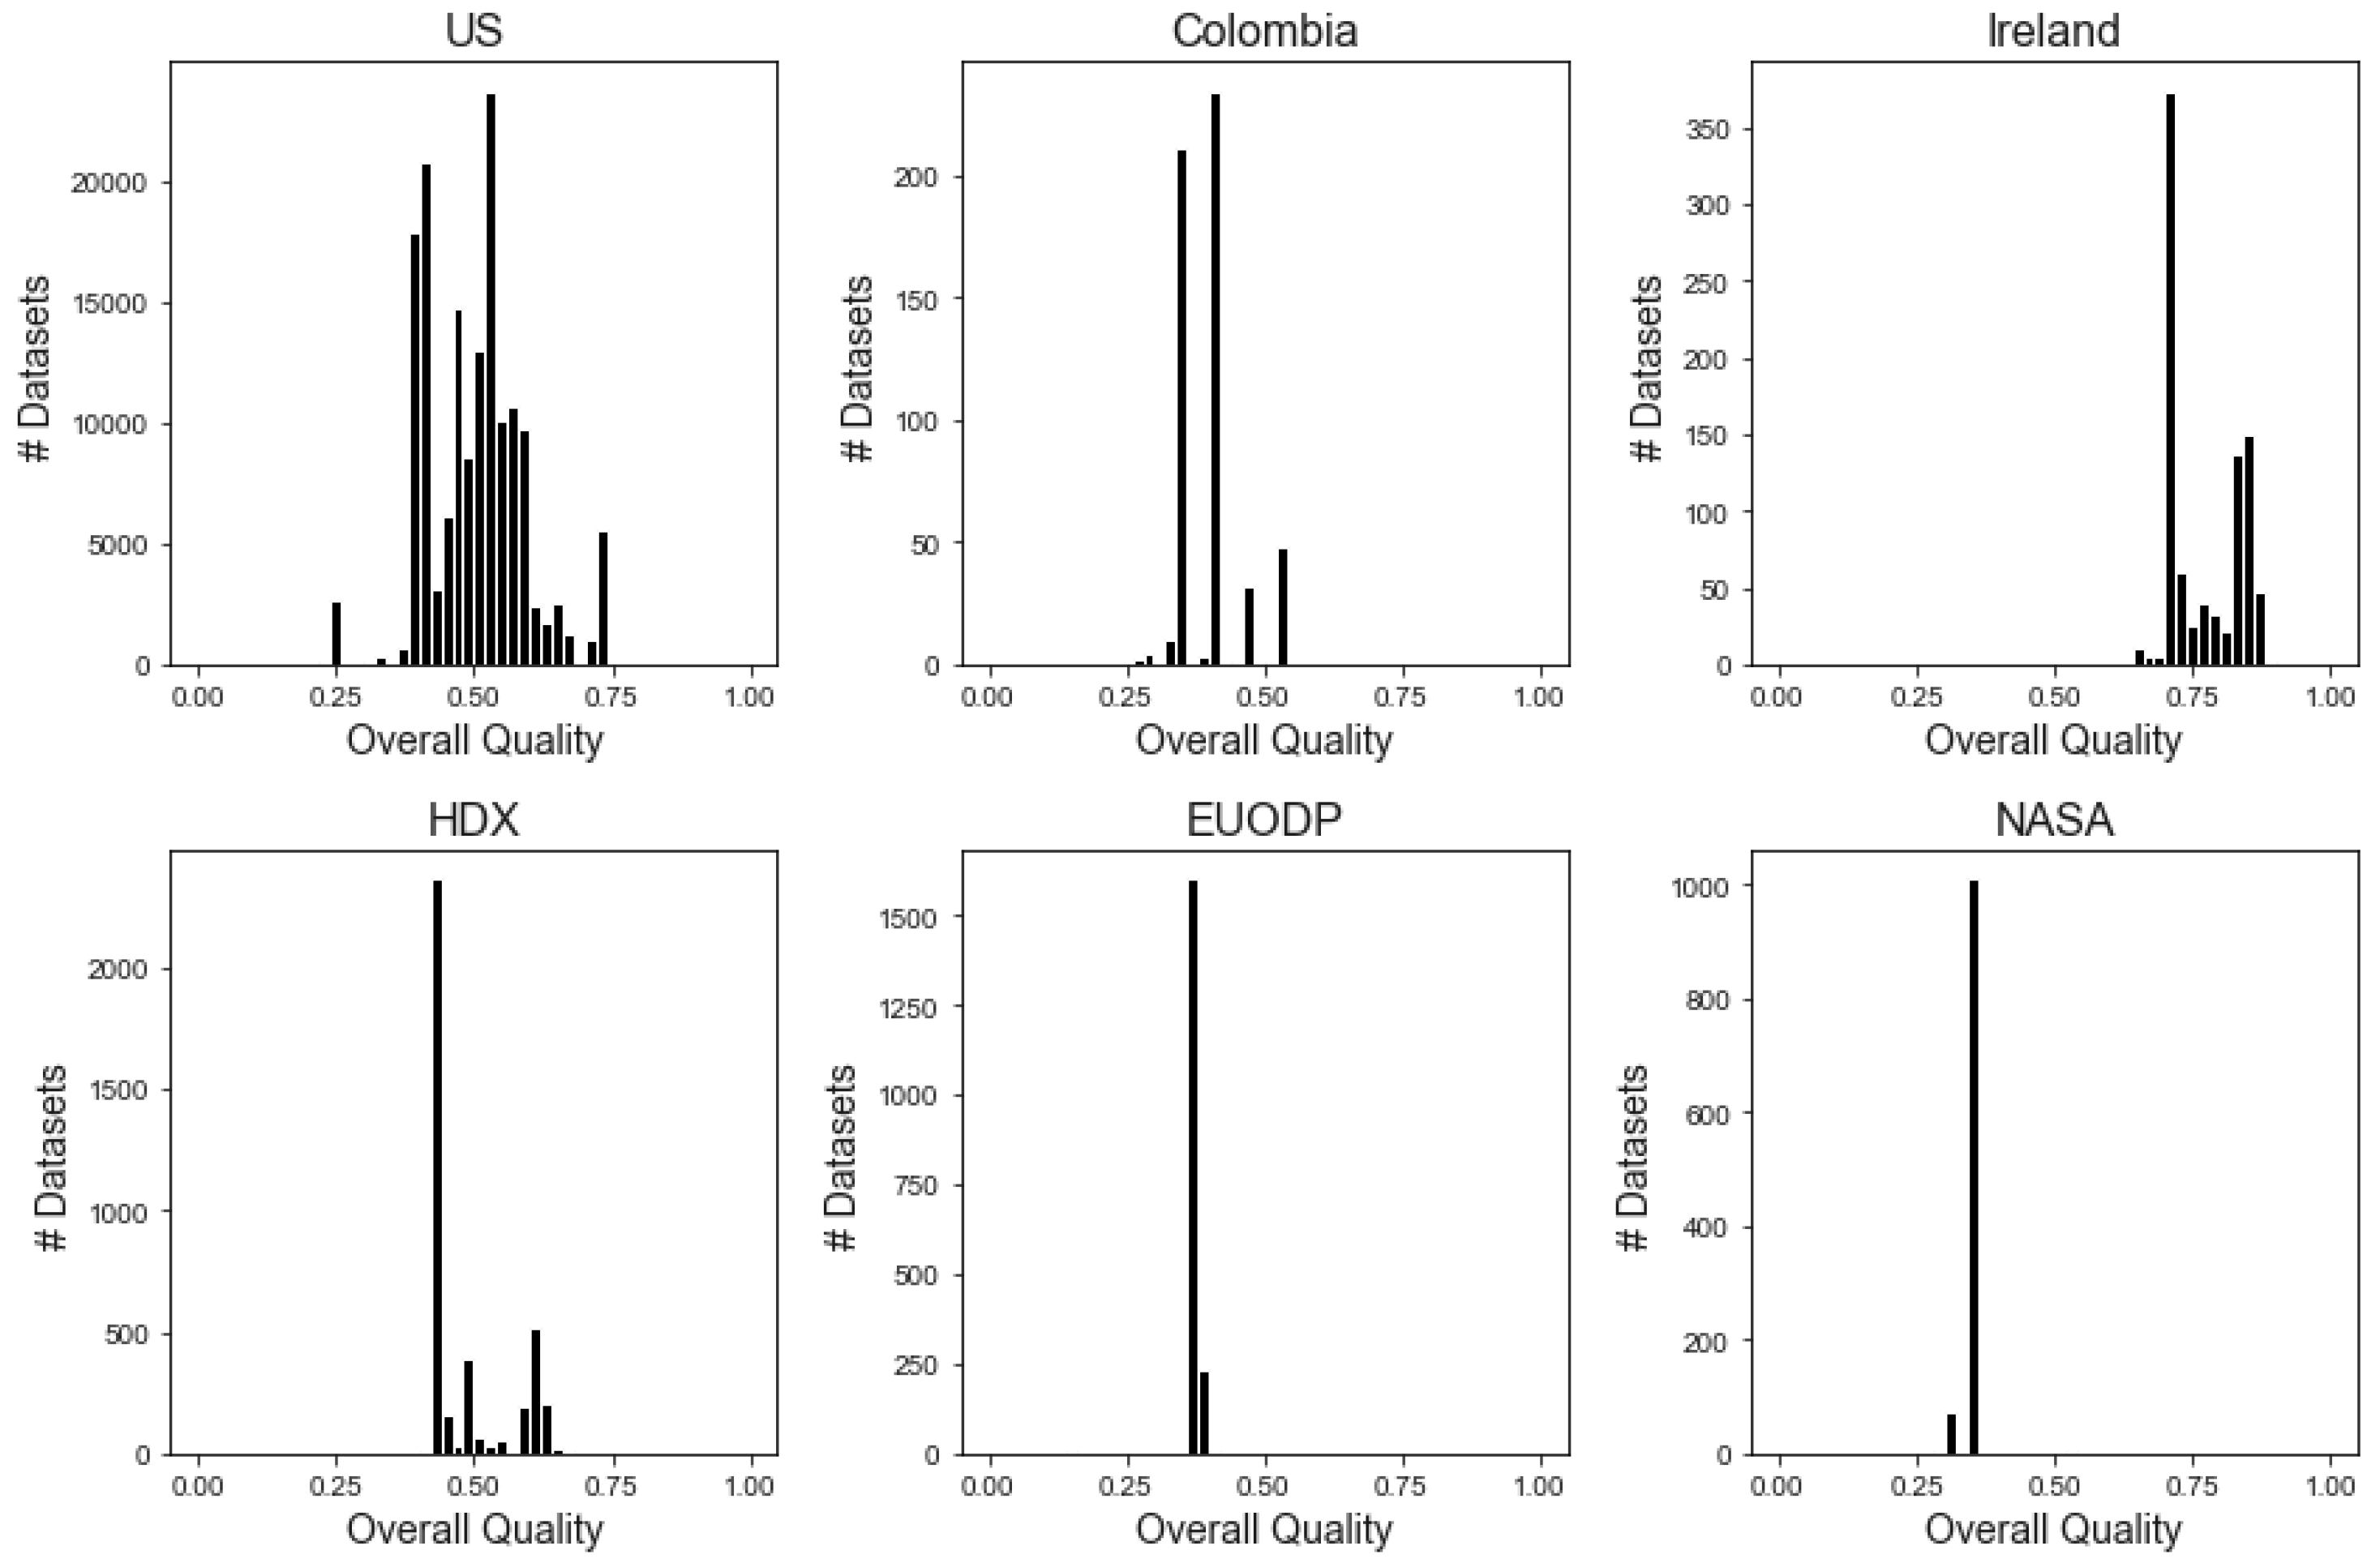
The histograms in Figure 3 and the descriptive statistics in Table 4 report the metadata overall quality profiles of the geospatial datasets of our sample portals.
Except for Ireland, and partly for the US, the other five portals show overall quality median values under 0.5. In the case of the two Socrata-based portals (i.e., Colombia and NASA), these low values can be attributed to the fact that the metadata returned by the Socrata API contain less information than that provided by CKAN. For example, Socrata’s metadata do not contain information about the format of downloadable files. This absence means that the three metrics that evaluate the existence, conformance and openness of the datasets format, i.e., Preservation, FileFormat, and MachineRead, always return a value of 0, as shown in Table 5, which provides detailed statistics of the mean values of the 17 quality metrics, and three quality dimensions. This aspect is particularly curious, considering that Socrata allows users to download datasets in different formats, thereby fully adhering to one of the main recommendations of the OD paradigm (https://opengovdata.org/).
However, the difference between the higher metadata quality values obtained by the Irish portal and those of the other three CKAN-based portals is puzzling, considering that the metadata returned is, in principle, the same. The difference in quality values, in this case, may be due to the different attention paid by the dataset providers in compiling the different fields of the metadata. For example, if we analyze two datasets from the IE and US portals, whose overall metadata quality values are close to the median, respectively of 0.74 and 0.51, and examining the 17 scores reported by the individual metrics, we find some differences, both syntactic and semantic, in the two cases. Among others, for example, the Irish dataset contains the author’s e-mail address expressed in a well-formed way, while in the US dataset the e-mail address contains a “null” value. Furthermore, while in the first case the license is declared to be of the open type “https://creativecommons.org/licenses/by/4.0/”, in the second case, it is “http://www.usa.gov/publicdomain/label/1.0/”—thus in the public domain for the US but not worldwide. We can see from Table 5 that such differences exist for all the datasets of the two portals, both for the first metric, ContactURL, and, for the second, OpenLicense, with mean values respectively of 0.06 (US) and 0.97 (Ireland), and of 0 (US) and 0.99 (Ireland).
More generally, looking at the Open Data dimension, Table 5 shows that with the sole exception of Ireland and, partly, of the US and HDX, the other portals seem to overlook the importance to fully adhere to the OD principles, as they do not supply a large part of their datasets according to open and readable formats and through open licenses. As for the other two dimensions, we note first that Existence obtains rather high mean values for three portals: US (0.67), Ireland (0.76), and HDX (0.66), followed by EUODP (0.54), Colombia (0.49), and NASA (0.38). The metrics that seem to have the greatest negative influence on this dimension are precisely those more specific to geospatial data, i.e., Spatial and Temporal, since, in particular, Socrata-based portals do not return this type of metadata. The mean Conformance values are for four out of six portals lower than those of Existence, indicating for these portals a possible lack of care, or inattention, in compiling the information in the metadata fields, even when these are present. An obvious case concerns the email address, measured by ContactEmail, that seems accurate (i.e., well-formed) for almost all the datasets of Ireland, NASA, and about two-thirds of the Colombian ones, while of very low quality for the other three portals.
5. Discussion
The first goal of this study was to provide a snapshot of the use of geospatial datasets by examining a sample of six OGD portals. The results revealed, albeit with some differences between the portals, a common trend: most of these data remain unexplored (Section 4.1). The second objective, aimed at assessing the quality of the metadata of these datasets, highlighted that this quality is below the sufficiency for five out of six portals. We have noted how these differences can be traced in part by the choice of the platform adopted, which can limit the completeness of the metadata, in part by the choices of the data providers when compiling the metadata associated with the provided datasets (Section 4.2). In this section, we try to analyze if and how these results are related to each other, answering the research question: “Does metadata quality affect GOGD usage?”. We also critically discuss some aspects related to the choice of indicators for measuring the use of datasets, and the publication practices of these indicators by OGD portal managers.
5.1. GOGD Metadata Quality vs. Usage
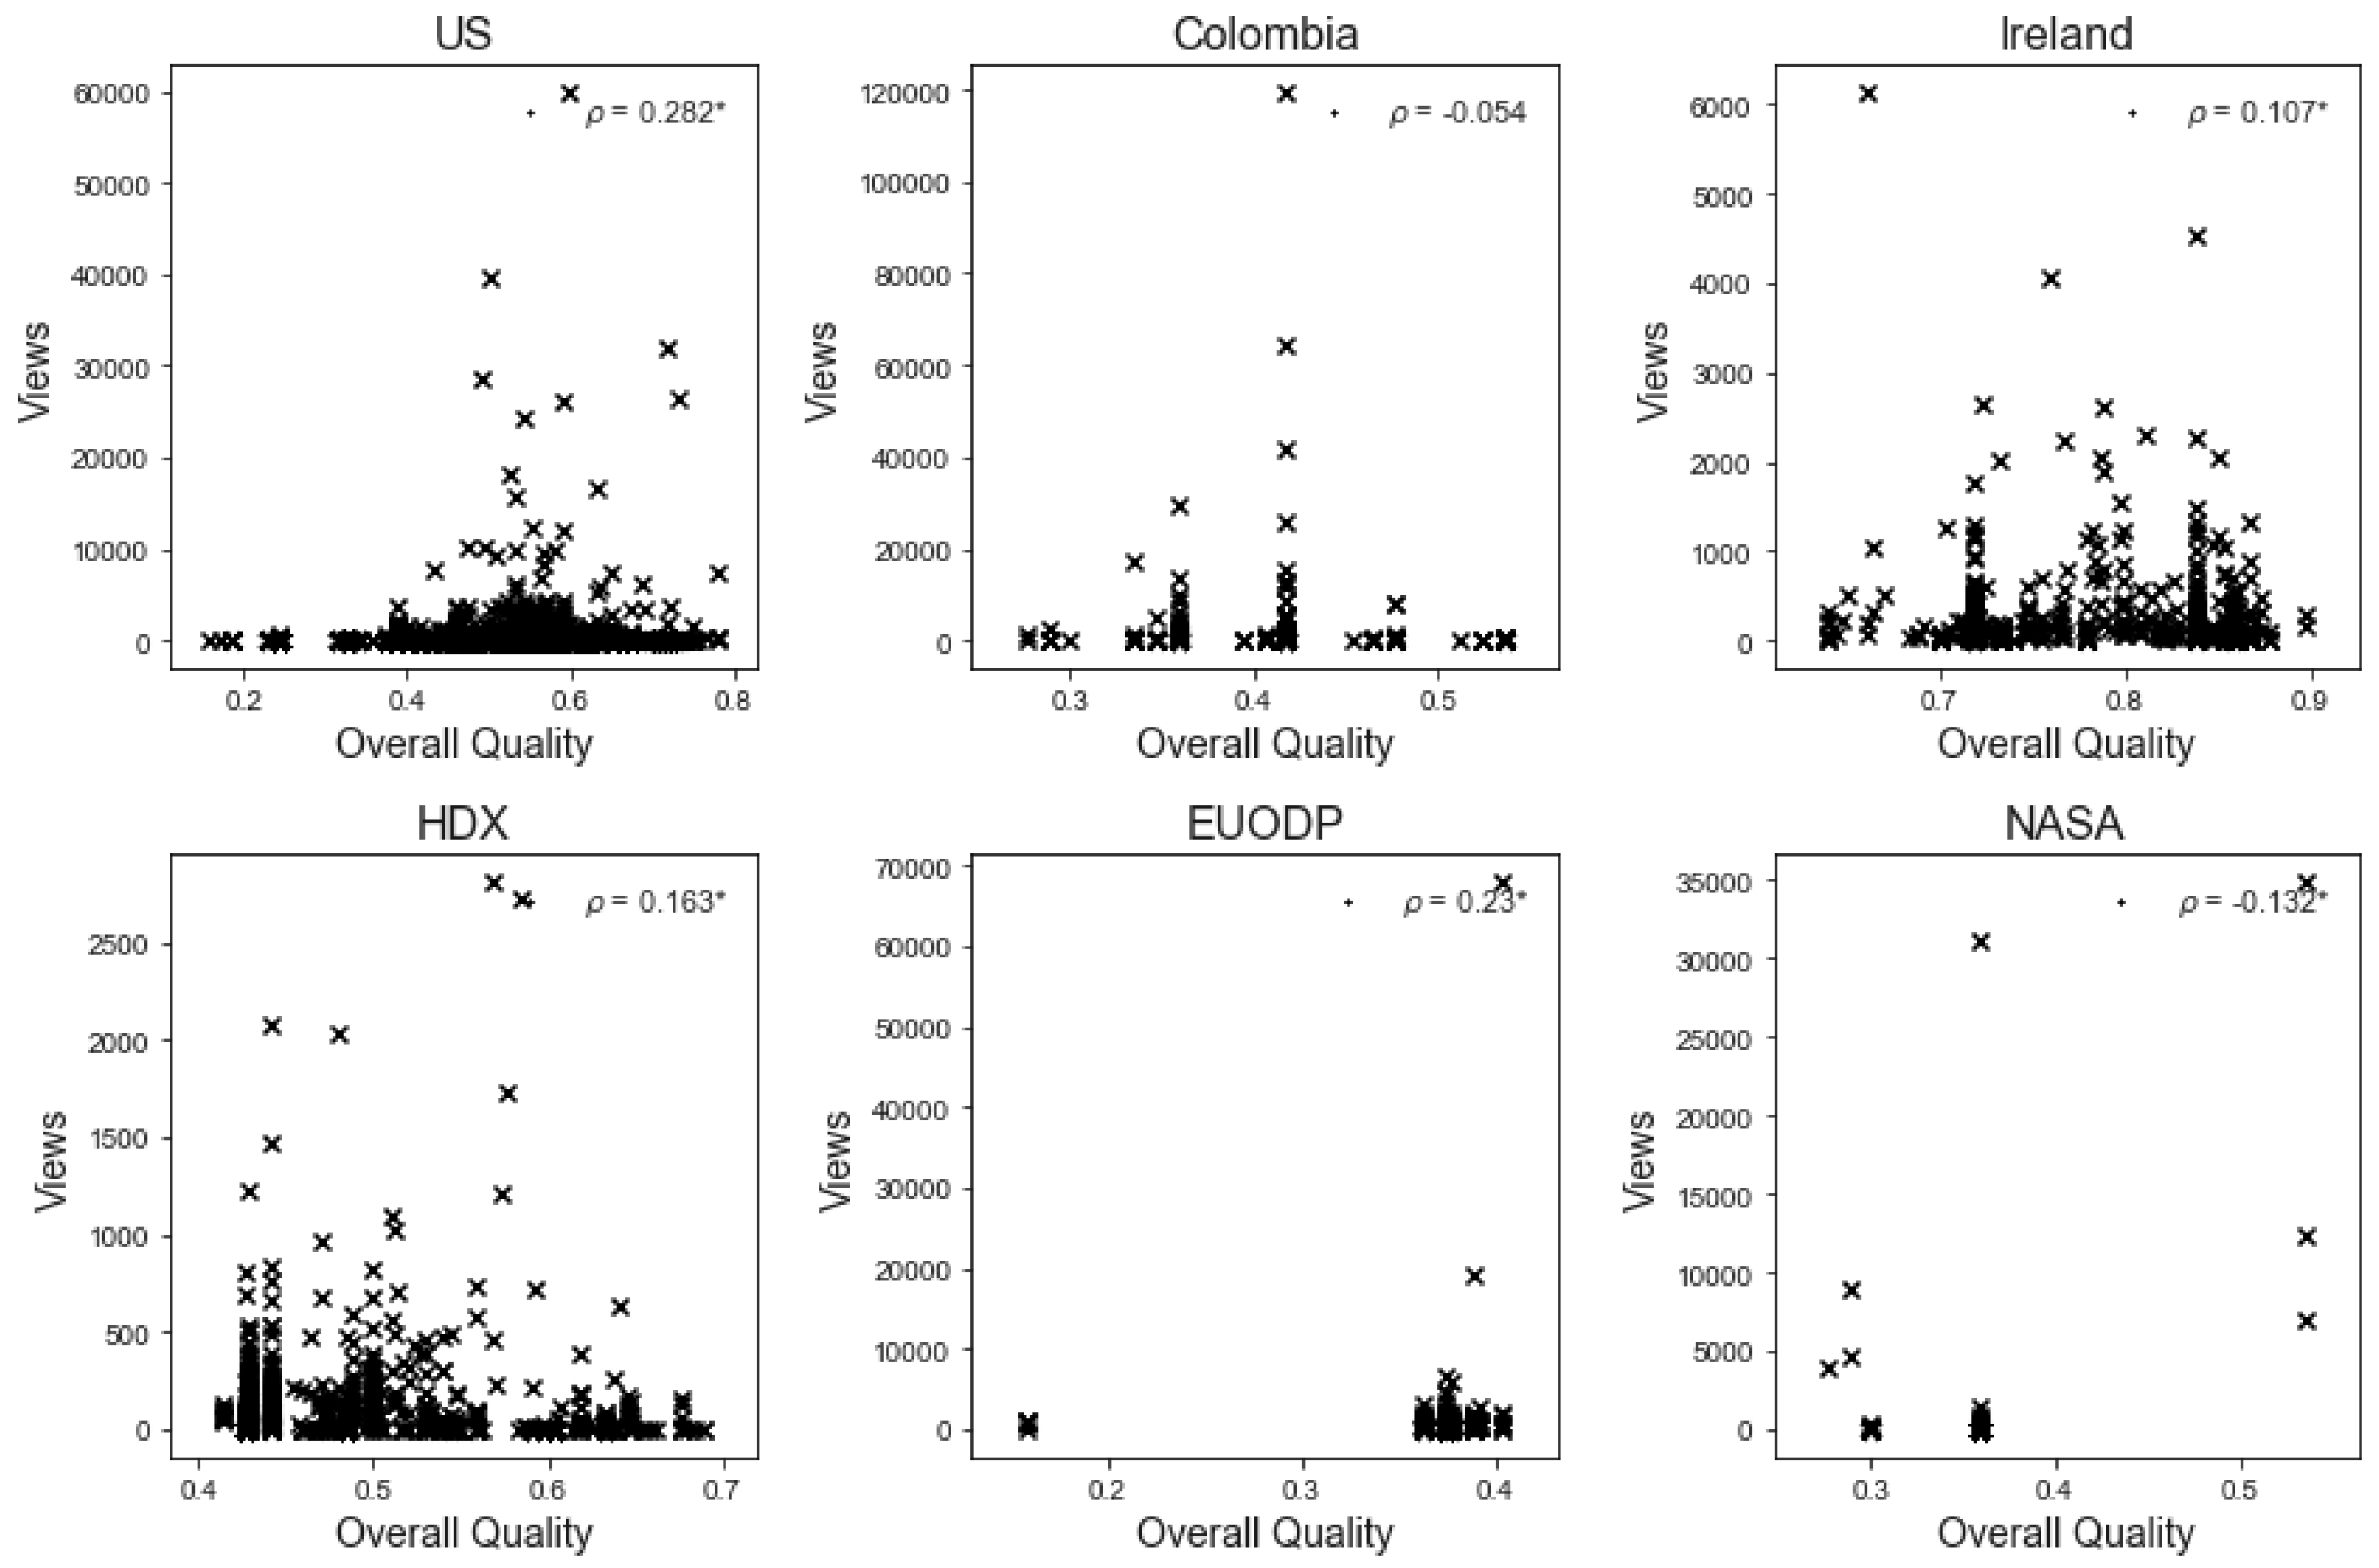
To answer the Research Question: “Does metadata quality affect GOGD usage?”, we analyzed the correlation between the number of datasets’ views and their metadata quality, employing test statistics. Considering that the frequencies of datasets’ views do not follow a normal distribution (see Figure 1), we excluded the Pearson test, generally used to analyze the correlation between variables, and resorted to Spearman’s rho non-parametric test. We first applied Spearman to the whole datasets of our sample, independently by their portals, and obtained a rho value with indicating a small, even if significant, correlation between geospatial datasets’ views and their metadata quality. To test if this correlation trend also subsists for each portal individually, we applied Spearman rho on each portal. The results, plotted in the scatter-plots in Figure 4, almost agree with the overall test value, although, in the case of Colombia, no significant correlation was found. Four out of six portals reveal a positive correlation, while for the NASA portal a low negative value is obtained. The US and EUODP portals show the highest rho values, i.e., 0.28 and 0.23, that are generally considered small-medium correlation values [53].
Rather than the overall correlation result, largely influenced by the fact that most of the sample datasets belong to the United States portal, the results at the portal-level (see also Table 6) tell us to carefully formulate the answer to our research question. The difference between the correlation values in the various portals, the alternative signs, and the low to medium-low rho values, are factors that prevent us from concluding that, certainly, the overall quality of the metadata are always decisive in influencing its use. To get further insights, we also checked the correlations between Views and each single quality dimension. Table 6 shows that, for each portal, the values and signs of one dimension with respect to the others varied, and also, in this case, it is not possible to derive a common trend. We can just notice the prevalence of the Existence dimension on the other two, which can explain the overall positive correlation, especially for the US and HDX portals. Even the negative correlation values obtained from the two other dimensions, in the five significant cases out of six, would seem to suggest surprisingly, albeit with very low absolute values, that the less the metadata are accurate and compliant with the OD principles, the more the dataset is seen by the users.
It is interesting to note at this point that, as noted by Bates [17], if the low quality of the metadata can affect of the scarce use of the data, other factors, also of a social, political, and not only technological nature, can come into play, and deserve to be studied. In fact, like many other authors, we have provided an objective view of the quality of the metadata, which, although fundamental to frame the problem of the quality of the OGD portals, cannot alone answer why users use these portals or not. As we observed in our previous work [51], data quality assessment is a context-dependent task that deals with asserting the importance of some dimensions to others. It generally involves providing judgments on some dimensions that cannot quantitatively be measured just by a procedure, but that require qualitative assertions on their importance for a given scenario. At the center of this activity, there should always be the user and her purpose and needs. Indeed, as noted by Degbelo [34], metadata needed for relevance assessment are not the same as for usability assessment, or for trustworthiness assessment or the assessment of re-use potential.
5.2. Measuring OGD Usage
Our findings on the usage of OGD portals highlight a general trend: the majority of the published datasets are rarely accessed by users. However, the number of dataset views and downloads, i.e., the usage metric at the basis of our analysis, although supplying an important usage indicator, cannot gauge the indirect users, i.e., those who use data indirectly processed by third-party applications [23]. Indeed, in some cases, specific portals sections may list these applications, with the indication of the datasets involved. However, this information is not generally provided in the dataset’s metadata. More useful to measure the impact of a dataset, but even more difficult to record, should be the number of users of each application reusing it. It would, therefore, be advisable for portal managers to associate with datasets, at least the first type of information: how many applications reuse it. This solution would help users not only to know the provenance of the original data but to make the products of these applications more reliable [52].
Although the availability of indirect indicators can provide more complete feedback on the impact of the datasets, there is no doubt that direct measures such as we have adopted provide useful information on the datasets’ popularity both to other potential users, when they have to choose which datasets can be more suitable for their needs, and to the managers of the portals themselves [54]. As observed by one of them in fact “We look at the total number of datasets that are out there, what we are offering up. We count visit clicks, and, lastly, we look at how many downloads are actually being done off the OD portal” [55].
5.3. Scarcity of Usage Information
A critical aspect that emerged from our study concerns the rarity of information on the use of datasets, already at the Web visualization level, and even more at the metadata level made available by the API. As for the first level of information, we have noticed that only 15 (out of 98) national OGD portals provide this data. In addition, just eight of them supply usage information in the metadata that is returned by portal APIs. This lack of usage data may, in principle, have hindered a broader analysis of the use of the OGD portals and the causes that determine it. However, despite this limitation, we have found that the usage trends of all the portals, both national and international, essentially agree. It seemed surprising to us that the Chief Data Managers of the national portals seem to underestimate the importance of divulging the popularity of their datasets. Indeed, the release of indicators such as Views and Downloads could serve to draw users’ attention to the datasets published on their portal, rather than to those available on competing portals [37]. This information on the “popularity” of the datasets could be used similarly to those present on social media or web economy platforms to attract users/customers, also improving customer service [56].
6. Conclusions and Future Works
Thanks to the diffusion of OGD portals, a huge amount of open geospatial datasets is now available to develop applications and to meet the information needs of citizens and organizations all around the world. To ensure this potential, these data must be effectively reusable. One factor considered to hinder the dissemination of GOGD datasets is the poor quality of the metadata associated with them. However, there are no studies in the literature that quantitatively validate the relationship between data reuse and metadata quality. This work aims to provide an updated analysis of the use of geospatial datasets, the quality of their metadata, and the possible relationship between these two parameters. Our experimental analysis revealed three main results. First of all, most of the geospatial datasets are scarcely viewed and downloaded. As to the evaluation of GOGD metadata, applying an objective quality assessment methodology resulted in low-medium quality values for almost all the portals considered, with the main exception of Ireland for all the dimensions, and partly to US, HDX, and NASA for specific dimensions. As the final contribution, we found a mild correlation between datasets’ usage and their metadata quality, not completely sustaining the literature perception that metadata quality is of paramount importance for GOGD dataset reuse.
Based on these evaluations, and according to the literature, we recommend portal managers to constantly monitor the use of the published datasets through, at least, basic metrics such as numbers of views and downloads. Having timely information on the success of individual datasets can better direct their publication efforts in specific sectors of the public data. A second recommendation relates to the preparedness of the geospatial datasets’ metadata. Although the quality of the metadata does not seem to fully explain the datasets’ usage, our analysis suggests that more attention to conformance and openness requirements, currently fairly neglected, could, in principle, increase the datasets’ reuse.
One limitation of this work is due to the reduced number of portals of our sample, resulting from the selection steps discussed in Section 3.1. For this reason, the outcome of this study can not be generalized without some care. In fact, as discussed in the Background, open data have different stages of maturity in different portals, and several impeding factors may hinder users in terms of full benefit from their potentials. However, even if involving just six portals, the composite nature of our sample, both in the size of its portals and in the administrative and territorial coverage, can lead to assuming that a quite similar usage and metadata quality trends can be found also in other OGD portals. This can be the first direction for future works. We also suggest to deepen the study by investigating other impeding factors, also of a social, political, and not only technological nature, that can also come into play and deserve to be studied.
Author Contributions
Conceptualization, Alfonso Quarati; Methodology, Alfonso Quarati and Monica De Martino; Software, Alfonso Quarati; Writing—original draft, Alfonso Quarati and Monica De Martino; Writing—review and editing, Sergio Rosim. All authors have read and agreed to the published version of the manuscript.
Funding
This research received no external funding.
Institutional Review Board Statement
Not applicable.
Informed Consent Statement
Not applicable.
Data Availability Statement
The data used to support the findings of this study are available from the corresponding author upon request.
Conflicts of Interest
The authors declare no conflict of interest.
References
- Coetzee, S.; Ivánová, I.; Mitasova, H.; Brovelli, M. Open geospatial software and data: A review of the current state and a perspective into the future. ISPRS Int. J. Geo-Inf. 2020, 9, 90. [Google Scholar] [CrossRef] [Green Version]
- Johnson, P.A.; Sieber, R.; Scassa, T.; Stephens, M.; Robinson, P. The cost (s) of geospatial open data. Trans. GIS 2017, 21, 434–445. [Google Scholar] [CrossRef] [Green Version]
- Viscusi, G.; Castelli, M.; Batini, C. Assessing social value in open data initiatives: A framework. Future Internet 2014, 6, 498–517. [Google Scholar] [CrossRef]
- Charalabidis, Y.; Loukis, E.; Alexopoulos, C. Evaluating Second Generation Open Government Data Infrastructures Using Value Models. In Proceedings of the 2014 47th Hawaii International Conference on System Sciences, Waikoloa, HI, USA, 6–9 January 2014; pp. 2114–2126. [Google Scholar] [CrossRef]
- Carrara, W.; Chan, W.S.; Fischer, S.; Steenbergen, E.V. Creating Value Through Open Data: Study on the Impact of Re-Use Of Public Data Resources. European Commission: European Union. 2015. Available online: https://www.europeandataportal.eu/sites/default/files/edp_creating_value_through_open_data_0.pdf (accessed on 30 December 2020).
- Quarati, A.; Clematis, A.; Roverelli, L.; Zereik, G.; D’Agostino, D.; Mosca, G.; Masnata, M. Integrating heterogeneous weather-sensors data into a smart-city app. In Proceedings of the 2017 International Conference on High Performance Computing & Simulation (HPCS), Genoa, Italy, 17–21 July 2017; pp. 152–159. [Google Scholar]
- Beno, M.; Figl, K.; Umbrich, J.; Polleres, A. Perception of Key Barriers in Using and Publishing Open Data. JeDEM e J. eDemocracy Open Gov. 2017, 9, 134–165. [Google Scholar] [CrossRef] [Green Version]
- Umbrich, J.; Neumaier, S.; Polleres, A. Quality Assessment and Evolution of Open Data Portals. In Proceedings of the 2015 3rd International Conference on Future Internet of Things and Cloud, Rome, Italy, 24–26 August 2015; pp. 404–411. [Google Scholar]
- Janssen, M.; Charalabidis, Y.; Zuiderwijk, A. Benefits, adoption barriers and myths of open data and open government. Inf. Syst. Manag. 2012, 29, 258–268. [Google Scholar] [CrossRef] [Green Version]
- Quarati, A.; De Martino, M. Open government data usage: A brief overview. In Proceedings of the 23rd International Database Applications & Engineering Symposium, IDEAS 2019, Athens, Greece, 10–12 June 2019; Desai, B.C., Anagnostopoulos, D., Manolopoulos, Y., Nikolaidou, M., Eds.; ACM: New York, NY, USA, 2019; pp. 1–8. [Google Scholar] [CrossRef]
- Sadiq, S.; Indulska, M. Open data: Quality over quantity. Int. J. Inf. Manag. 2017, 37, 150–154. [Google Scholar] [CrossRef]
- Van der Waal, S.; Węcel, K.; Ermilov, I.; Janev, V.; Milošević, U.; Wainwright, M. Lifting open data portals to the data web. In Linked Open Data–Creating Knowledge Out of Interlinked Data; Springer: Cham, Switzerland, 2014; pp. 175–195. [Google Scholar]
- Machova, R.; Lnenicka, M. Evaluating the Quality of Open Data Portals on the National Level. J. Theor. Appl. Electron. Commer. Res. 2017, 12, 21–41. [Google Scholar] [CrossRef] [Green Version]
- Neumaier, S.; Umbrich, J.; Polleres, A. Automated Quality Assessment of Metadata Across Open Data Portals. J. Data Inf. Qual. 2016, 8, 1–29. [Google Scholar] [CrossRef]
- Brodeur, J.; Coetzee, S.; Danko, D.; Garcia, S.; Hjelmager, J. Geographic Information Metadata—An Outlook from the International Standardization Perspective. ISPRS Int. J. Geo-Inf. 2019, 8, 280. [Google Scholar] [CrossRef] [Green Version]
- Tagliolato, P.; Cristiano, F.; Oggioni, A.; Paola, C. Semantic Profiles for Easing SensorML Description: Review and Proposal. ISPRS Int. J. Geo-Inf. 2019, 8, 340. [Google Scholar] [CrossRef] [Green Version]
- Bates, J. The politics of data friction. J. Doc. 2017, 74. [Google Scholar] [CrossRef]
- Reiche, K.; Hofig, E. Implementation of metadata quality metrics and application on public government data. In Proceedings of the 2013 IEEE 37th Annual Computer Software and Applications Conference Workshops, Kyoto, Japan, 22–26 July 2013; pp. 236–241. [Google Scholar] [CrossRef]
- Oliveira, M.I.S.; de Oliveira, H.R.; Oliveira, L.A.; Lóscio, B.F. Open Government Data Portals Analysis: The Brazilian Case. In Proceedings of the 17th International Digital Government Research Conference on Digital Government Research; ACM: New York, NY, USA, 2016; pp. 415–424. [Google Scholar] [CrossRef]
- Kubler, S.; Robert, J.; Neumaier, S.; Umbrich, J.; Traon, Y.L. Comparison of metadata quality in open data portals using the Analytic Hierarchy Process. Gov. Inf. Q. 2018, 35, 13–29. [Google Scholar] [CrossRef]
- Kirstein, F.; Dittwald, B.; Dutkowski, S.; Glikman, Y.; Schimmler, S.; Hauswirth, M. Linked Data in the European Data Portal: A Comprehensive Platform for Applying DCAT-AP; Electronic Government; Lindgren, I., Janssen, M., Lee, H., Polini, A., Rodríguez Bolívar, M.P., Scholl, H.J., Tambouris, E., Eds.; Springer International Publishing: Cham, Switzerland, 2019; pp. 192–204. [Google Scholar]
- Lourenço, R.P. An analysis of open government portals: A perspective of transparency for accountability. Gov. Inf. Q. 2015, 32, 323–332. [Google Scholar] [CrossRef]
- Safarov, I.; Meijer, A.; Grimmelikhuijsen, S. Utilization of open government data: A systematic literature review of types, conditions, effects and users. Inf. Polity 2017, 22, 1–24. [Google Scholar] [CrossRef] [Green Version]
- Donker, F.; van Loenen, B. How to assess the success of the open data ecosystem? Int. J. Digit. Earth 2017, 10, 284–306. [Google Scholar] [CrossRef] [Green Version]
- Virkar, S.; Pereira, G.V. Exploring Open Data State-of-the-Art: A Review of the Social, Economic and Political Impacts. In Proceedings of the International Conference on Electronic Government—EGOV, Krems, Austria, 3–5 September 2018. [Google Scholar]
- Crusoe, J.; Simonofski, A.; Clarinval, A.; Gebka, E. The Impact of Impediments on Open Government Data Use: Insights from Users. In Proceedings of the 2019 13th International Conference on Research Challenges in Information Science (RCIS), Brussels, Belgium, 29–31 May 2019; pp. 1–12. [Google Scholar]
- Beno, M.; Figl, K.; Umbrich, J.; Polleres, A. Open Data Hopes and Fears: Determining the Barriers of Open Data. In Proceedings of the 2017 Conference for E-Democracy and Open Government (CeDEM), Krems, Austria, 17–19 May 2017; pp. 69–81. [Google Scholar]
- Gonzalez-Zapata, F.; Heeks, R. The multiple meanings of open government data: Understanding different stakeholders and their perspectives. Gov. Inf. Q. 2015, 32, 441–452. [Google Scholar] [CrossRef]
- Wirtz, B.W.; Weyerer, J.C.; Rösch, M. Open government and citizen participation: An empirical analysis of citizen expectancy towards open government data. Int. Rev. Adm. Sci. 2019, 85, 566–586. [Google Scholar] [CrossRef]
- Degbelo, A.; Granell, C.; Trilles, S.; Bhattacharya, D.; Casteleyn, S.; Kray, C. Opening up smart cities: Citizen-centric challenges and opportunities from GIScience. ISPRS Int. J. Geo-Inf. 2016, 5, 16. [Google Scholar] [CrossRef] [Green Version]
- Benitez-Paez, F.; Degbelo, A.; Trilles, S.; Huerta, J. Roadblocks Hindering the Reuse of Open Geodata in Colombia and Spain: A Data User’s Perspective. ISPRS Int. J. Geo-Inf. 2018, 7, 6. [Google Scholar] [CrossRef] [Green Version]
- Menitez-Paez, F.; Comber, A.; Trilles, S.; Huerta, J. Creating a conceptual framework to improve the re-usability of open geographic data in cities. Trans. GIS 2018, 22, 806–822. [Google Scholar] [CrossRef] [Green Version]
- Ruijer, E.; Grimmelikhuijsen, S.; van den Berg, J.; Meijer, A. Open data work: Understanding open data usage from a practice lens. Int. Rev. Adm. Sci. 2020, 86, 3–19. [Google Scholar] [CrossRef]
- Degbelo, A. Open Data User Needs: A Preliminary Synthesis. In Companion Proceedings of the Web Conference 2020; Association for Computing Machinery: New York, NY, USA, 2020; pp. 834–839. [Google Scholar] [CrossRef]
- Koesten, L.M.; Kacprzak, E.; Tennison, J.F.A.; Simperl, E. The Trials and Tribulations of Working with Structured Data: A Study on Information Seeking Behaviour. In Proceedings of the 2017 CHI Conference on Human Factors in Computing Systems, Denver, CO, USA, 6–11 May 2017; Association for Computing Machinery: New York, NY, USA, 2017; pp. 1277–1289. [Google Scholar] [CrossRef] [Green Version]
- Zhu, X.; Freeman, M.A. An Evaluation of U.S. Municipal Open Data Portals: A User Interaction Framework. J. Assoc. Inf. Sci. Technol. 2018, 70, 27–37. [Google Scholar] [CrossRef] [Green Version]
- Sasse, T.; Smith, A.; Broad, E.; Tennison, J.; Wells, P.; Atz, U. Recommendations for Open Data Portals: From Setup to Sustainability; Publications Office of the European Union: Luxemburg, 2017. [Google Scholar]
- Lnenicka, M. An In-Depth Analysis of Open Data Portals as an Emerging Public E-Service. Int. J. Hum. Soc. Sci. 2015, 9, 589–599. [Google Scholar]
- Sáez Martín, A.; Rosario, A.H.D.; Pérez, M.D.C.C. An international analysis of the quality of open government data portals. Soc. Sci. Comput. Rev. 2016, 34, 298–311. [Google Scholar] [CrossRef]
- De Martino, M.; Rosim, S.; Quarati, A. Hydrographic Datasets in Open Government Data Portals: Mitigation of Reusability Issues Through Provenance Documentation. In Proceedings of the Metadata and Semantic Research—13th International Conference MTSR, 2019, Rome, Italy, 28–31 October 2019; Volume 1057, pp. 307–319. [Google Scholar] [CrossRef]
- Zuiderwijk, A.; Janssen, M.; Susha, I. Improving the speed and ease of open data use through metadata, interaction mechanisms, and quality indicators. J. Org. Comput. Electron. Commer. 2016, 26, 116–146. [Google Scholar] [CrossRef]
- Höchtl, J.; Reichstädter, P. Linked Open Data: A Means for Public Sector Information Management. In Proceedings of the Second International Conference on Electronic Government and the Information Systems Perspective, Toulouse, France, 29 August–2 September 2011; Springer: Berlin/Heidelberg, Germay, 2011; pp. 330–343. [Google Scholar]
- Wilkinson, M.D.; Dumontier, M.; Aalbersberg, I.J.; Appleton, G.; Axton, M.; Baak, A.; Blomberg, N.; Boiten, J.W.; da Silva Santos, L.B.; Bourne, P.E.; et al. The FAIR Guiding Principles for scientific data management and stewardship. Sci. Data 2016, 3. [Google Scholar] [CrossRef] [Green Version]
- Wilkinson, M.D.; Sansone, S.A.; Schultes, E.; Doorn, P.; Bonino da Silva Santos, L.O.; Dumontier, M. A design framework and exemplar metrics for FAIRness. bioRxiv 2017. [Google Scholar] [CrossRef] [Green Version]
- Quarati, A.; De Martino, M. Dataset Relating a Study on Geospatial Open Data Usage and Metadata Quality. Zenodo 2020. [Google Scholar] [CrossRef]
- Ubaldi, B. Open Government Data; OECD: Paris, France, 2013; Volume 22. [Google Scholar]
- Boudreau, C. Reuse of open data in Quebec: From economic development to government transparency. Int. Rev. Adm. Sci. 2020. [Google Scholar] [CrossRef]
- COUNTER. The COUNTER Code of Practice, Release 5. In Performance Measurement and Metrics; COUNTER, 25: Winchester, UK, 2019. [Google Scholar]
- Batini, C.; Scannapieco, M. Data and Information Quality—Dimensions, Principles and Techniques. In Data-Centric Systems and Applications; Springer: Cham, Switzerland, 2016. [Google Scholar] [CrossRef]
- Wang, R.Y.; Strong, D.M. Beyond Accuracy: What Data Quality Means to Data Consumers. J. Manag. Inf. Syst. 1996, 12, 5–33. [Google Scholar] [CrossRef]
- Quarati, A.; Albertoni, R.; Martino, M.D. Overall quality assessment of SKOS thesauri: An AHP-based approach. J. Inf. Sci. 2017, 43, 816–834. [Google Scholar] [CrossRef]
- Albertoni, R.; De Martino, M.; Quarati, A. Documenting Context-based Quality Assessment of Controlled Vocabularies. IEEE Trans. Emerg. Top. Comput. 2018. [Google Scholar] [CrossRef]
- Khalilzadeh, J.; Tasci, A.D. Large sample size, significance level, and the effect size: Solutions to perils of using big data for academic research. Tour. Manag. 2017, 62, 89–96. [Google Scholar] [CrossRef]
- Konkiel, S.; Scherer, D. New Opportunities for Repositories in the Age of Altmetrics. Bull. Assoc. Inf. Sci. Technol. 2013, 39, 22–26. [Google Scholar] [CrossRef] [Green Version]
- Stone, A. Are Open Data Efforts Working? Government Technology, 1 March 2018. [Google Scholar]
- Joseph, R.C.; Johnson, N.A. Big Data and Transformational Government. IT Prof. 2013, 15, 43–48. [Google Scholar] [CrossRef]
Figure 1.
Number of Views distributions for the geospatial datasets of the National and the international OGD portals (total views up to December 2019).
Figure 1.
Number of Views distributions for the geospatial datasets of the National and the international OGD portals (total views up to December 2019).

Figure 2.
Number of Downloads distributions for the geospatial datasets of the Colombia, HDX, and NASA portals (up to December 2019).
Figure 2.
Number of Downloads distributions for the geospatial datasets of the Colombia, HDX, and NASA portals (up to December 2019).

Figure 3.
Overall metadata quality distributions.

Figure 4.
Correlation between overall metadata quality and the number of GOGD datasets’ views for the selected portals. Spearman’s values with postfixed with *.
Figure 4.
Correlation between overall metadata quality and the number of GOGD datasets’ views for the selected portals. Spearman’s values with postfixed with *.


Table 1.
The demographic characteristics of the national and international OGD portals. The software platform adopted and the usage metrics available V (View), D (Downloads) are reported.
Table 1.
The demographic characteristics of the national and international OGD portals. The software platform adopted and the usage metrics available V (View), D (Downloads) are reported.
| Country | Portal | #Datasets | #Geo_Datasets | Platform | Metrics |
|---|---|---|---|---|---|
| U.S. | data.gov | 261,514 | 157,064 | CKAN | V |
| Colombia | datos.gov.co | 9795 | 549 | Socrata | V, D |
| Ireland | data.gov.ie | 9598 | 914 | CKAN | V |
| HDX | data.humdata.org | 17,325 | 4080 | CKAN | V, D |
| EUODP | data.europa.eu | 14,058 | 1847 | CKAN | V |
| NASA | data.nasa.gov | 9664 | 1087 | Socrata | V, D |
Table 2.
Descriptive Usage Statistics: number of Views (up to December 2019).
| Mean | std | Min | 25% | 50% | 75% | Max | |
|---|---|---|---|---|---|---|---|
| US | 22 | 277 | 0 | 1 | 15 | 22 | 59,838 |
| Colombia | 1251 | 6478 | 57 | 107 | 218 | 526 | 119,418 |
| Ireland | 183 | 415 | 0 | 20 | 68 | 167 | 6135 |
| HDX | 25 | 115 | 0 | 0 | 0 | 0 | 2811 |
| EUODP | 411 | 1691 | 0 | 71 | 259 | 513 | 68,030 |
| NASA | 113 | 1516 | 6 | 7 | 9 | 13 | 34,879 |
Table 3.
Descriptive Usage Statistics: number of Downloads (up to December 2019).
| Mean | std | Min | 25% | 50% | 75% | Max | |
|---|---|---|---|---|---|---|---|
| Colombia | 64 | 373 | 0 | 8 | 19 | 40 | 7980 |
| HDX | 0.6 | 2.2 | 0 | 0 | 0 | 0 | 70 |
| NASA | 19 | 338 | 0 | 0 | 0 | 0 | 7708 |
Table 4.
Overall metadata quality descriptive statistics.
| Mean | std | Min | 25% | 50% | 75% | Max | |
|---|---|---|---|---|---|---|---|
| US | 0.49 | 0.09 | 0.15 | 0.41 | 0.51 | 0.54 | 0.77 |
| Colombia | 0.40 | 0.05 | 0.27 | 0.35 | 0.41 | 0.41 | 0.53 |
| Ireland | 0.77 | 0.06 | 0.64 | 0.71 | 0.74 | 0.83 | 0.89 |
| HDX | 0.47 | 0.07 | 0.41 | 0.42 | 0.43 | 0.53 | 0.68 |
| EUODP | 0.37 | 0.01 | 0.15 | 0.37 | 0.37 | 0.38 | 0.40 |
| NASA | 0.35 | 0.01 | 0.27 | 0.35 | 0.35 | 0.35 | 0.53 |
Table 5.
Mean values of metadata quality dimensions (in bold) and metrics for the six OGD portals. We followed the nomenclature in Neumaier et al. [14] for dimensions and metrics names, except for Spatial and Temporal, declared and implemented only in the framework code. The last row reports the means overall quality for each portal.
| Dimensions | Metrics | Portals | |||||
|---|---|---|---|---|---|---|---|
| US | Colombia | Ireland | HDX | EUODP | NASA | ||
| Existence | 0.67 | 0.49 | 0.76 | 0.66 | 0.54 | 0.38 | |
| Access | 0.98 | 1 | 1 | 1 | 0.99 | 1 | |
| Discovery | 0.73 | 0.56 | 0.9 | 0.96 | 0.53 | 0.59 | |
| Contact | 1.0 | 1 | 1 | 1 | 1 | 1 | |
| Rights | 0.49 | 0.90 | 1 | 1 | 0.99 | 0 | |
| Preservation | 0.42 | 0 | 0.53 | 0.36 | 0.24 | 0 | |
| Date | 0.74 | 0.5 | 0.76 | 1 | 0.57 | 0.5 | |
| Spatial | 0.98 | 0 | 0.47 | 0 | 0 | 0 | |
| Temporal | 0 | 0 | 0.44 | 0 | 0 | 0 | |
| Conformance | 0.44 | 0.46 | 0.77 | 0.40 | 0.33 | 0.65 | |
| AccessURL | 0.99 | 1 | 1 | 1 | 1 | 1 | |
| ContactEmail | 0.06 | 0.65 | 0.97 | 0.10 | 0 | 0.93 | |
| ContactURL | 0 | 0 | 0 | 0 | 0 | 0 | |
| DateFormat | 0.99 | 1 | 1 | 1 | 1 | 1 | |
| License | 0.09 | 0.16 | 0.99 | 0.19 | 0 | 1 | |
| FileFormat | 0.49 | 0 | 0.66 | 0.10 | 0 | 0 | |
| Open Data | 0.24 | 0.05 | 0.79 | 0.13 | 0 | 0 | |
| OpenFormat | 0.56 | 0 | 0.82 | 0.10 | 0 | 0 | |
| MachineRead | 0.15 | 0 | 0.56 | 0.11 | 0 | 0 | |
| OpenLicense | 0 | 0.16 | 0.99 | 0.19 | 0 | 0 | |
| Overall Quality | 0.49 | 0.40 | 0.77 | 0.47 | 0.37 | 0.35 | |
Table 6.
Correlation values between number of Views and overall metadata quality (omq), and the three quality dimensions for the selected portals. Spearman’s values with postfixed with *.
Table 6.
Correlation values between number of Views and overall metadata quality (omq), and the three quality dimensions for the selected portals. Spearman’s values with postfixed with *.
| omq | Existence | Conformance | Open Data | |
|---|---|---|---|---|
| US | 0.282 * | 0.361 * | −0.263 * | −0.107 * |
| Colombia | −0.054 | −0.077 | - | - |
| Ireland | 0.107 * | 0.123 * | −0.108 * | 0.151 * |
| HDX | 0.163 * | 0.369 * | −0.082 * | −0.123 * |
| EUODP | 0.23 * | 0.23 * | - | - |
| NASA | 0.132 * | 0 | - | - |
Publisher’s Note: MDPI stays neutral with regard to jurisdictional claims in published maps and institutional affiliations. |
© 2021 by the authors. Licensee MDPI, Basel, Switzerland. This article is an open access article distributed under the terms and conditions of the Creative Commons Attribution (CC BY) license (http://creativecommons.org/licenses/by/4.0/).
Share and Cite
MDPI and ACS Style
Quarati, A.; De Martino, M.; Rosim, S. Geospatial Open Data Usage and Metadata Quality. ISPRS Int. J. Geo-Inf. 2021, 10, 30. https://doi.org/10.3390/ijgi10010030
AMA Style
Quarati A, De Martino M, Rosim S. Geospatial Open Data Usage and Metadata Quality. ISPRS International Journal of Geo-Information. 2021; 10(1):30. https://doi.org/10.3390/ijgi10010030
Chicago/Turabian StyleQuarati, Alfonso, Monica De Martino, and Sergio Rosim. 2021. "Geospatial Open Data Usage and Metadata Quality" ISPRS International Journal of Geo-Information 10, no. 1: 30. https://doi.org/10.3390/ijgi10010030
Note that from the first issue of 2016, this journal uses article numbers instead of page numbers. See further details here.