Assessing the Relationship between Verbal and Nonverbal Cognitive Abilities Using Resting-State EEG Functional Connectivity

 , , and
Abstract
:1. Introduction
2. Materials and Methods
2.1. Participants
2.2. EEG Procedure
2.3. Intelligence Testing (Measures of Cognitive Abilities)
2.4. EEG Data Acquisition and Pre-Processing
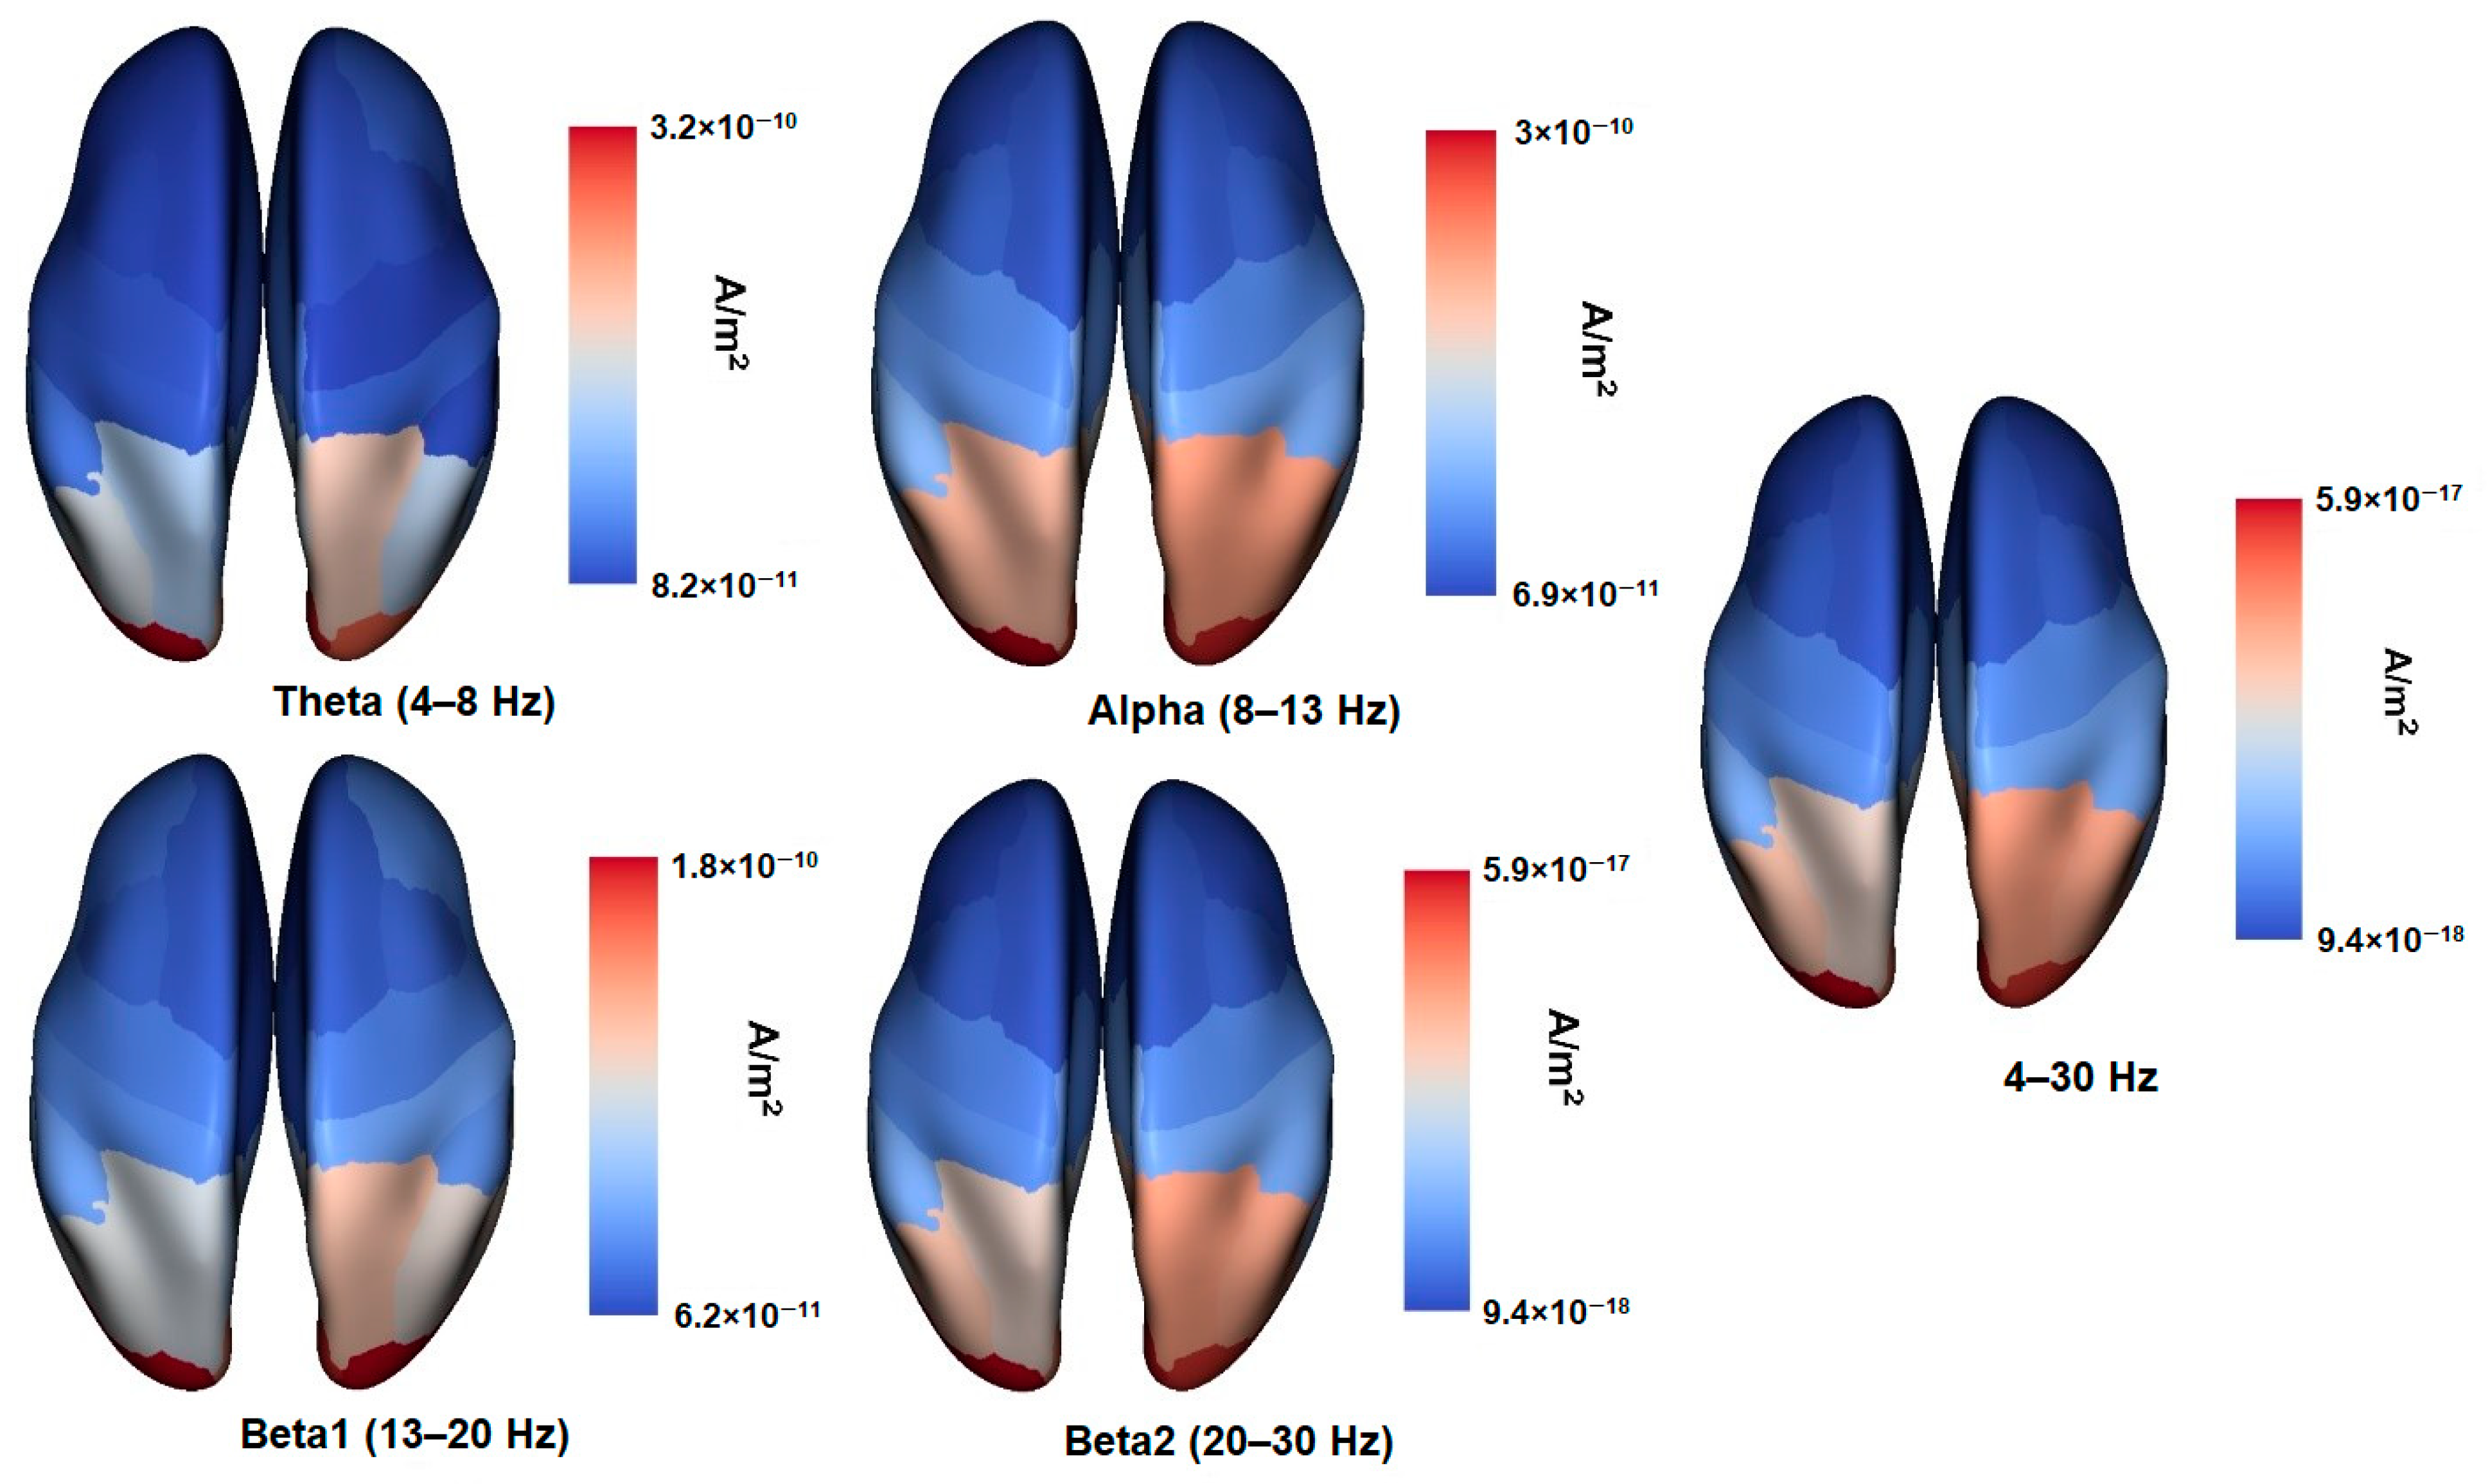
2.5. Source Reconstruction
2.6. Synchronization Measures
2.7. Graph Analysis
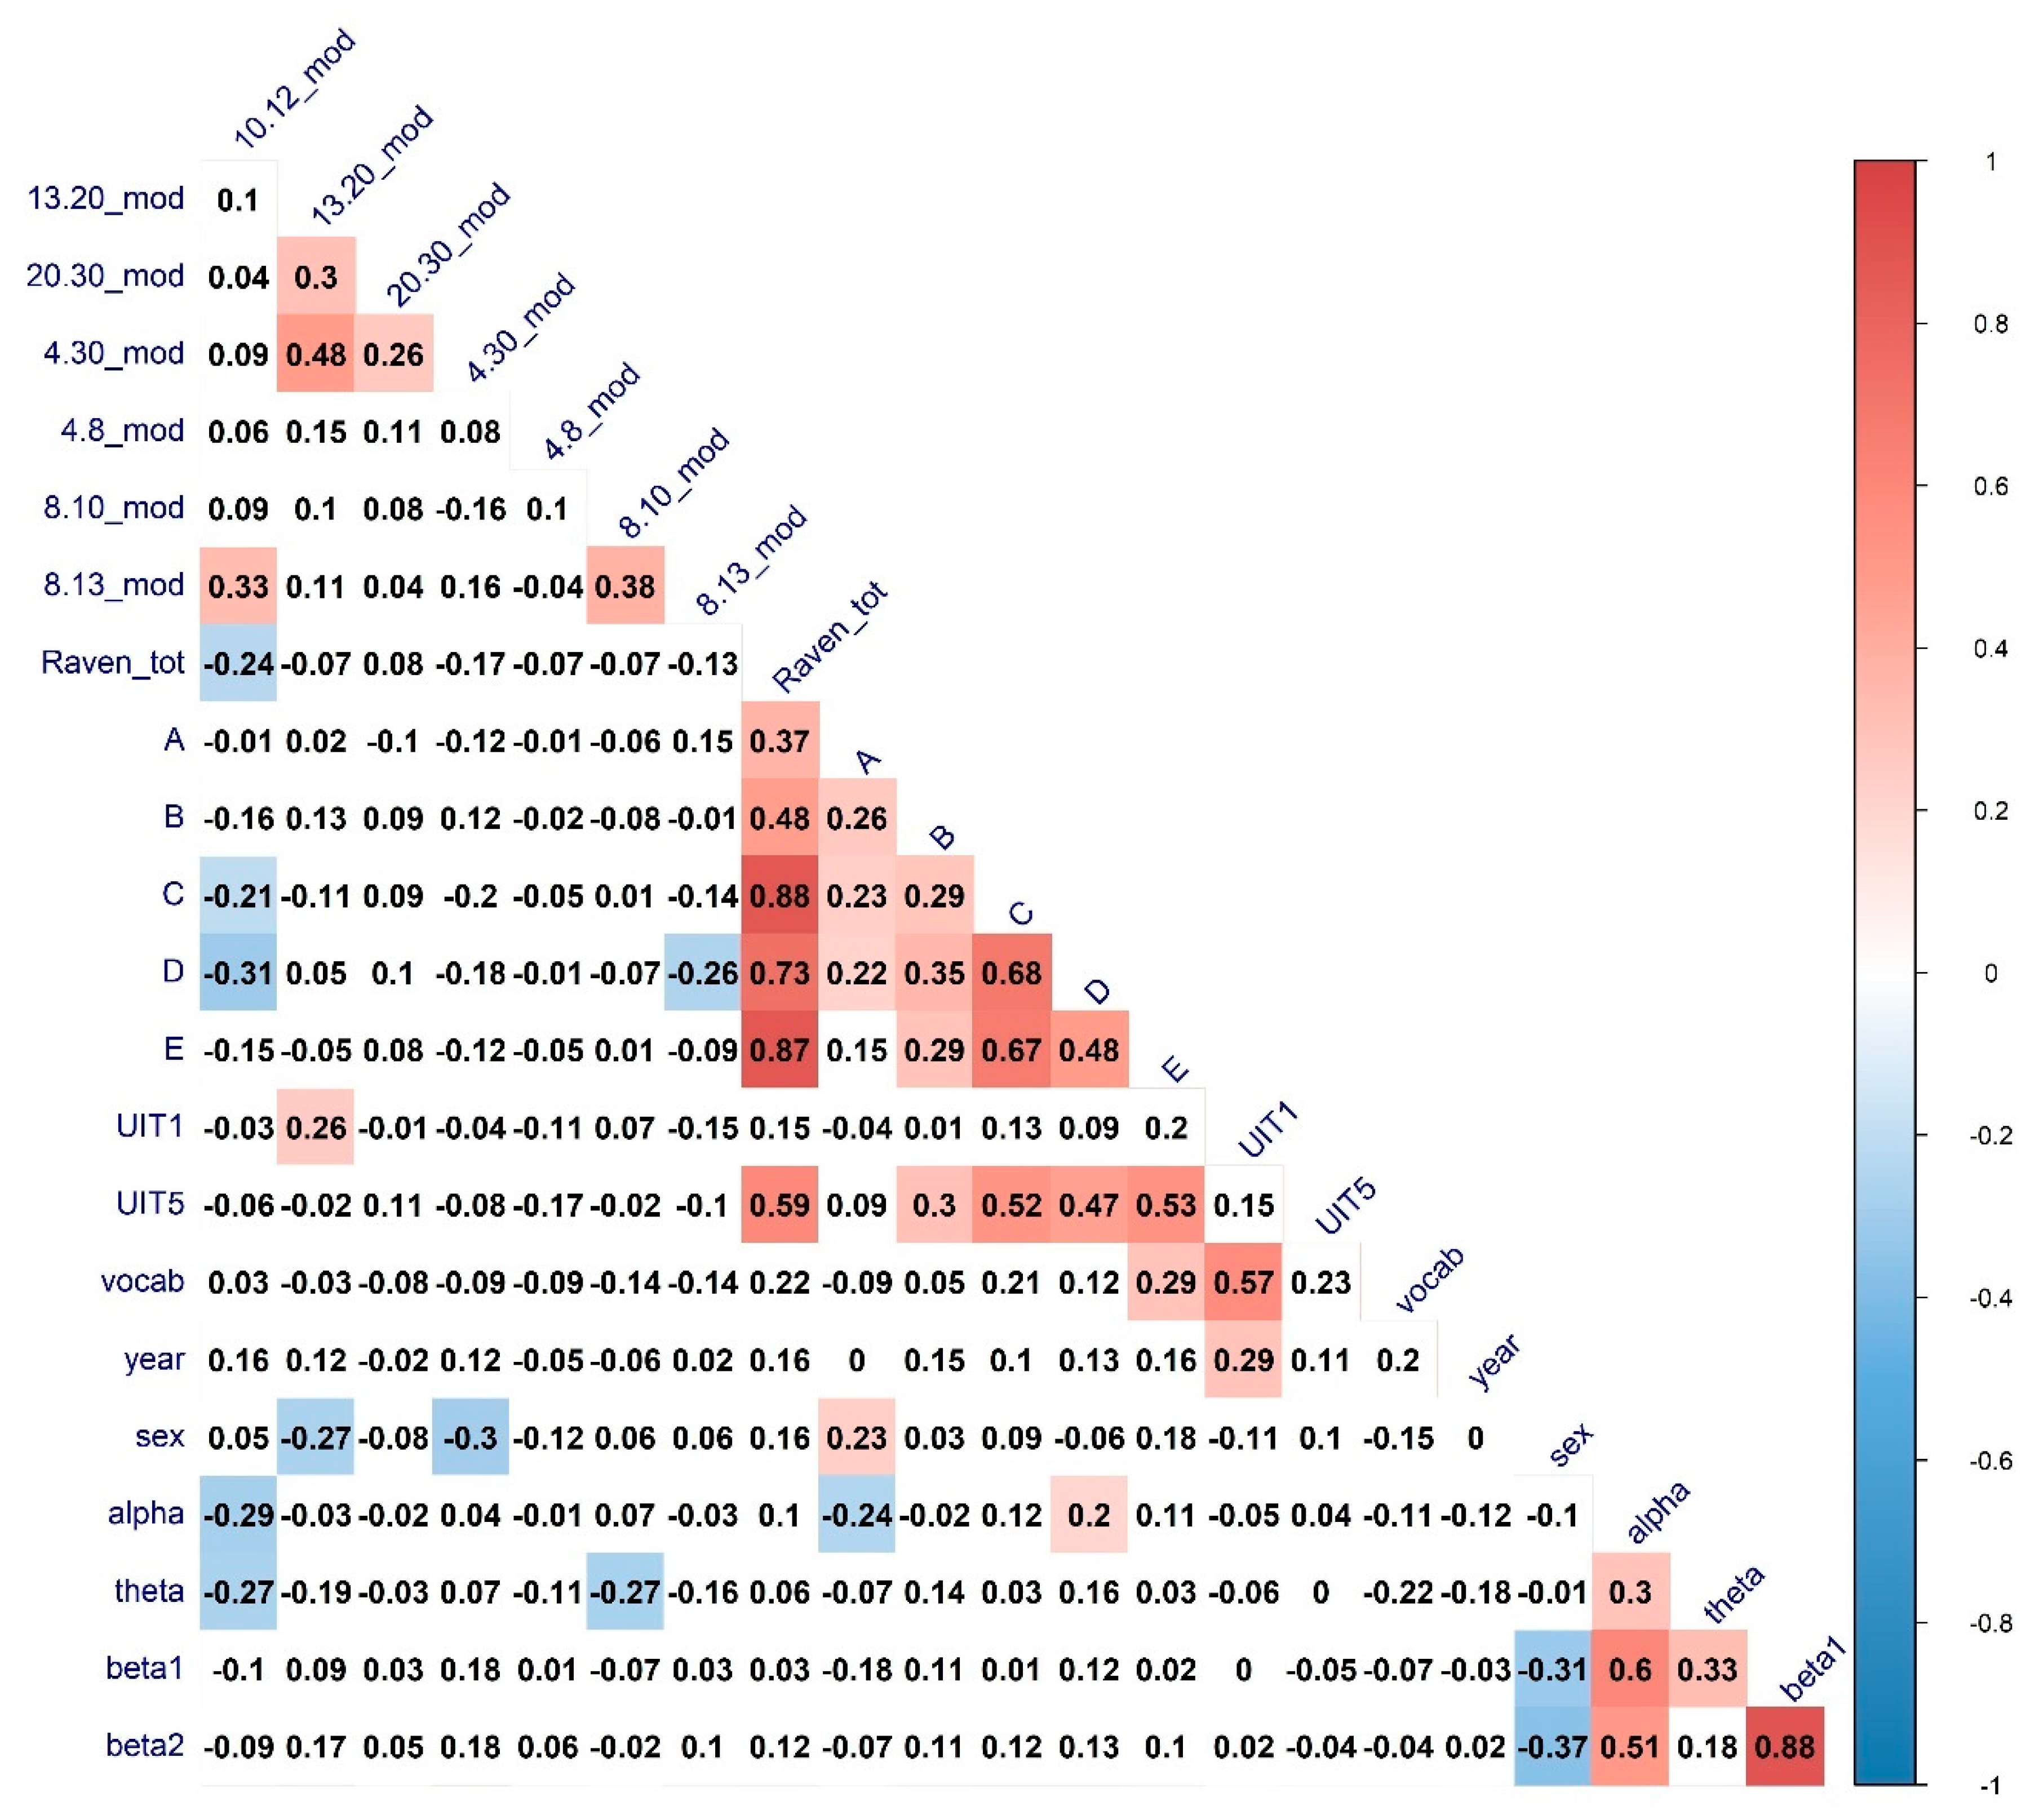
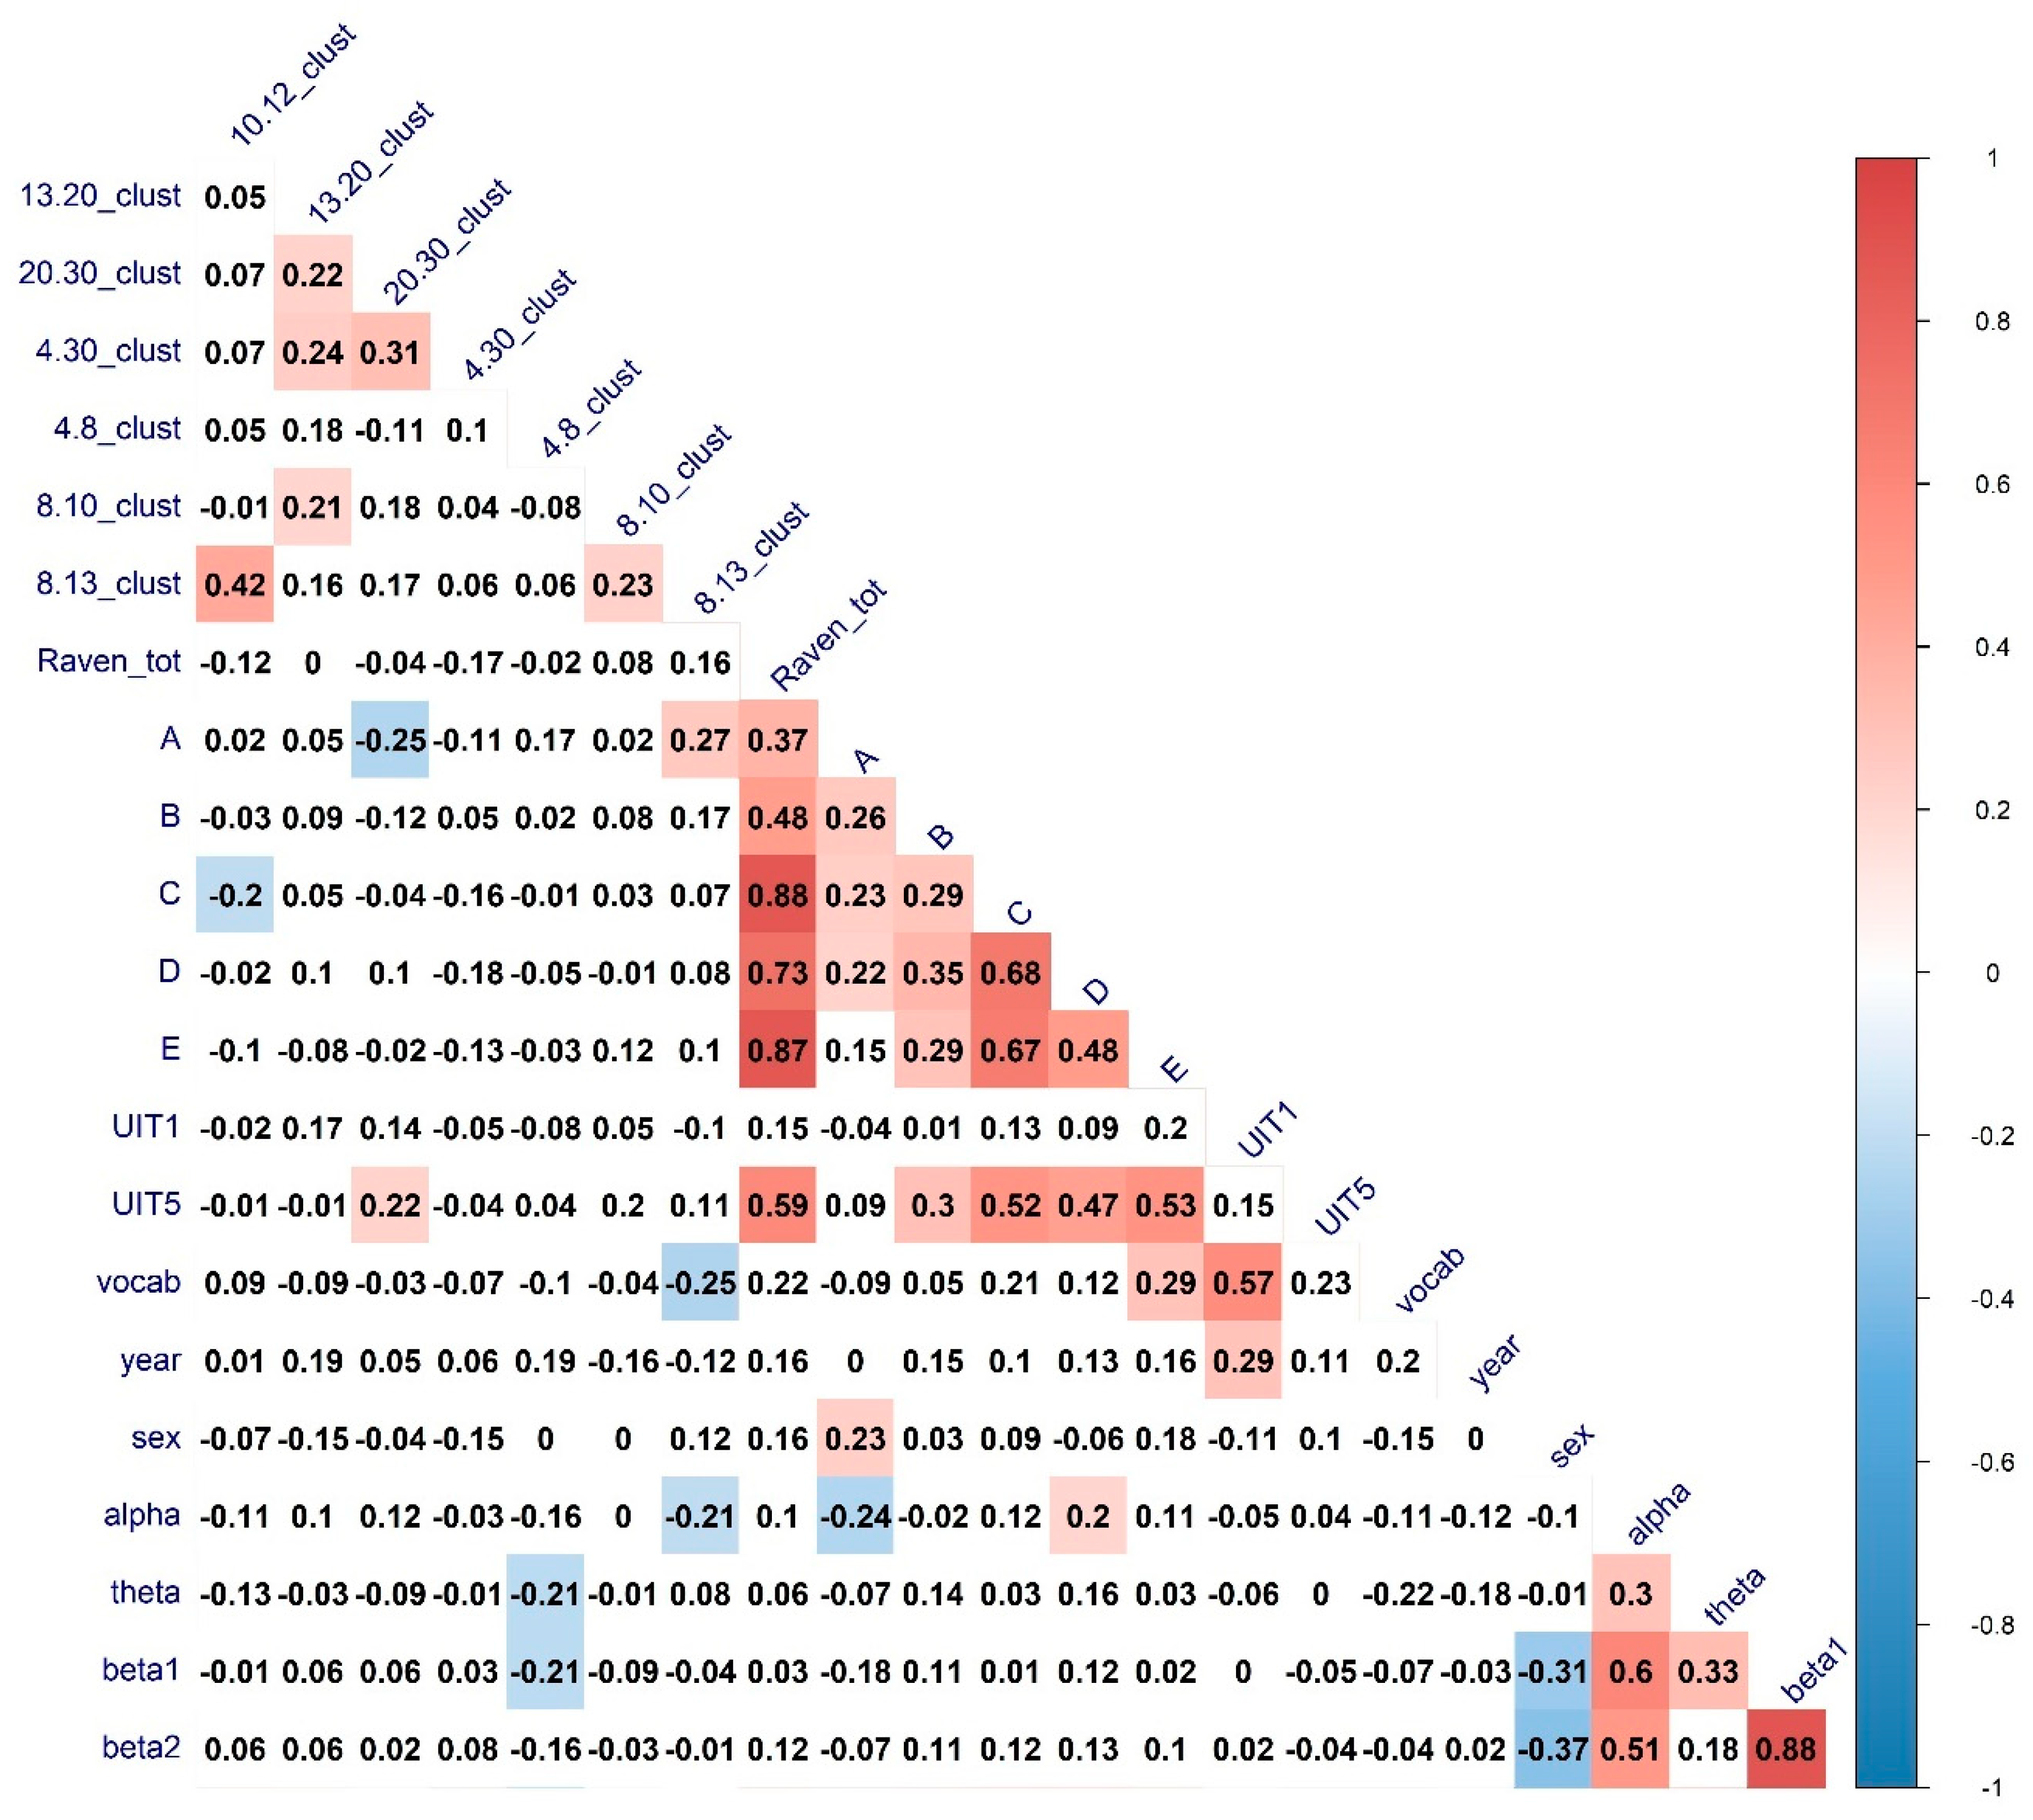
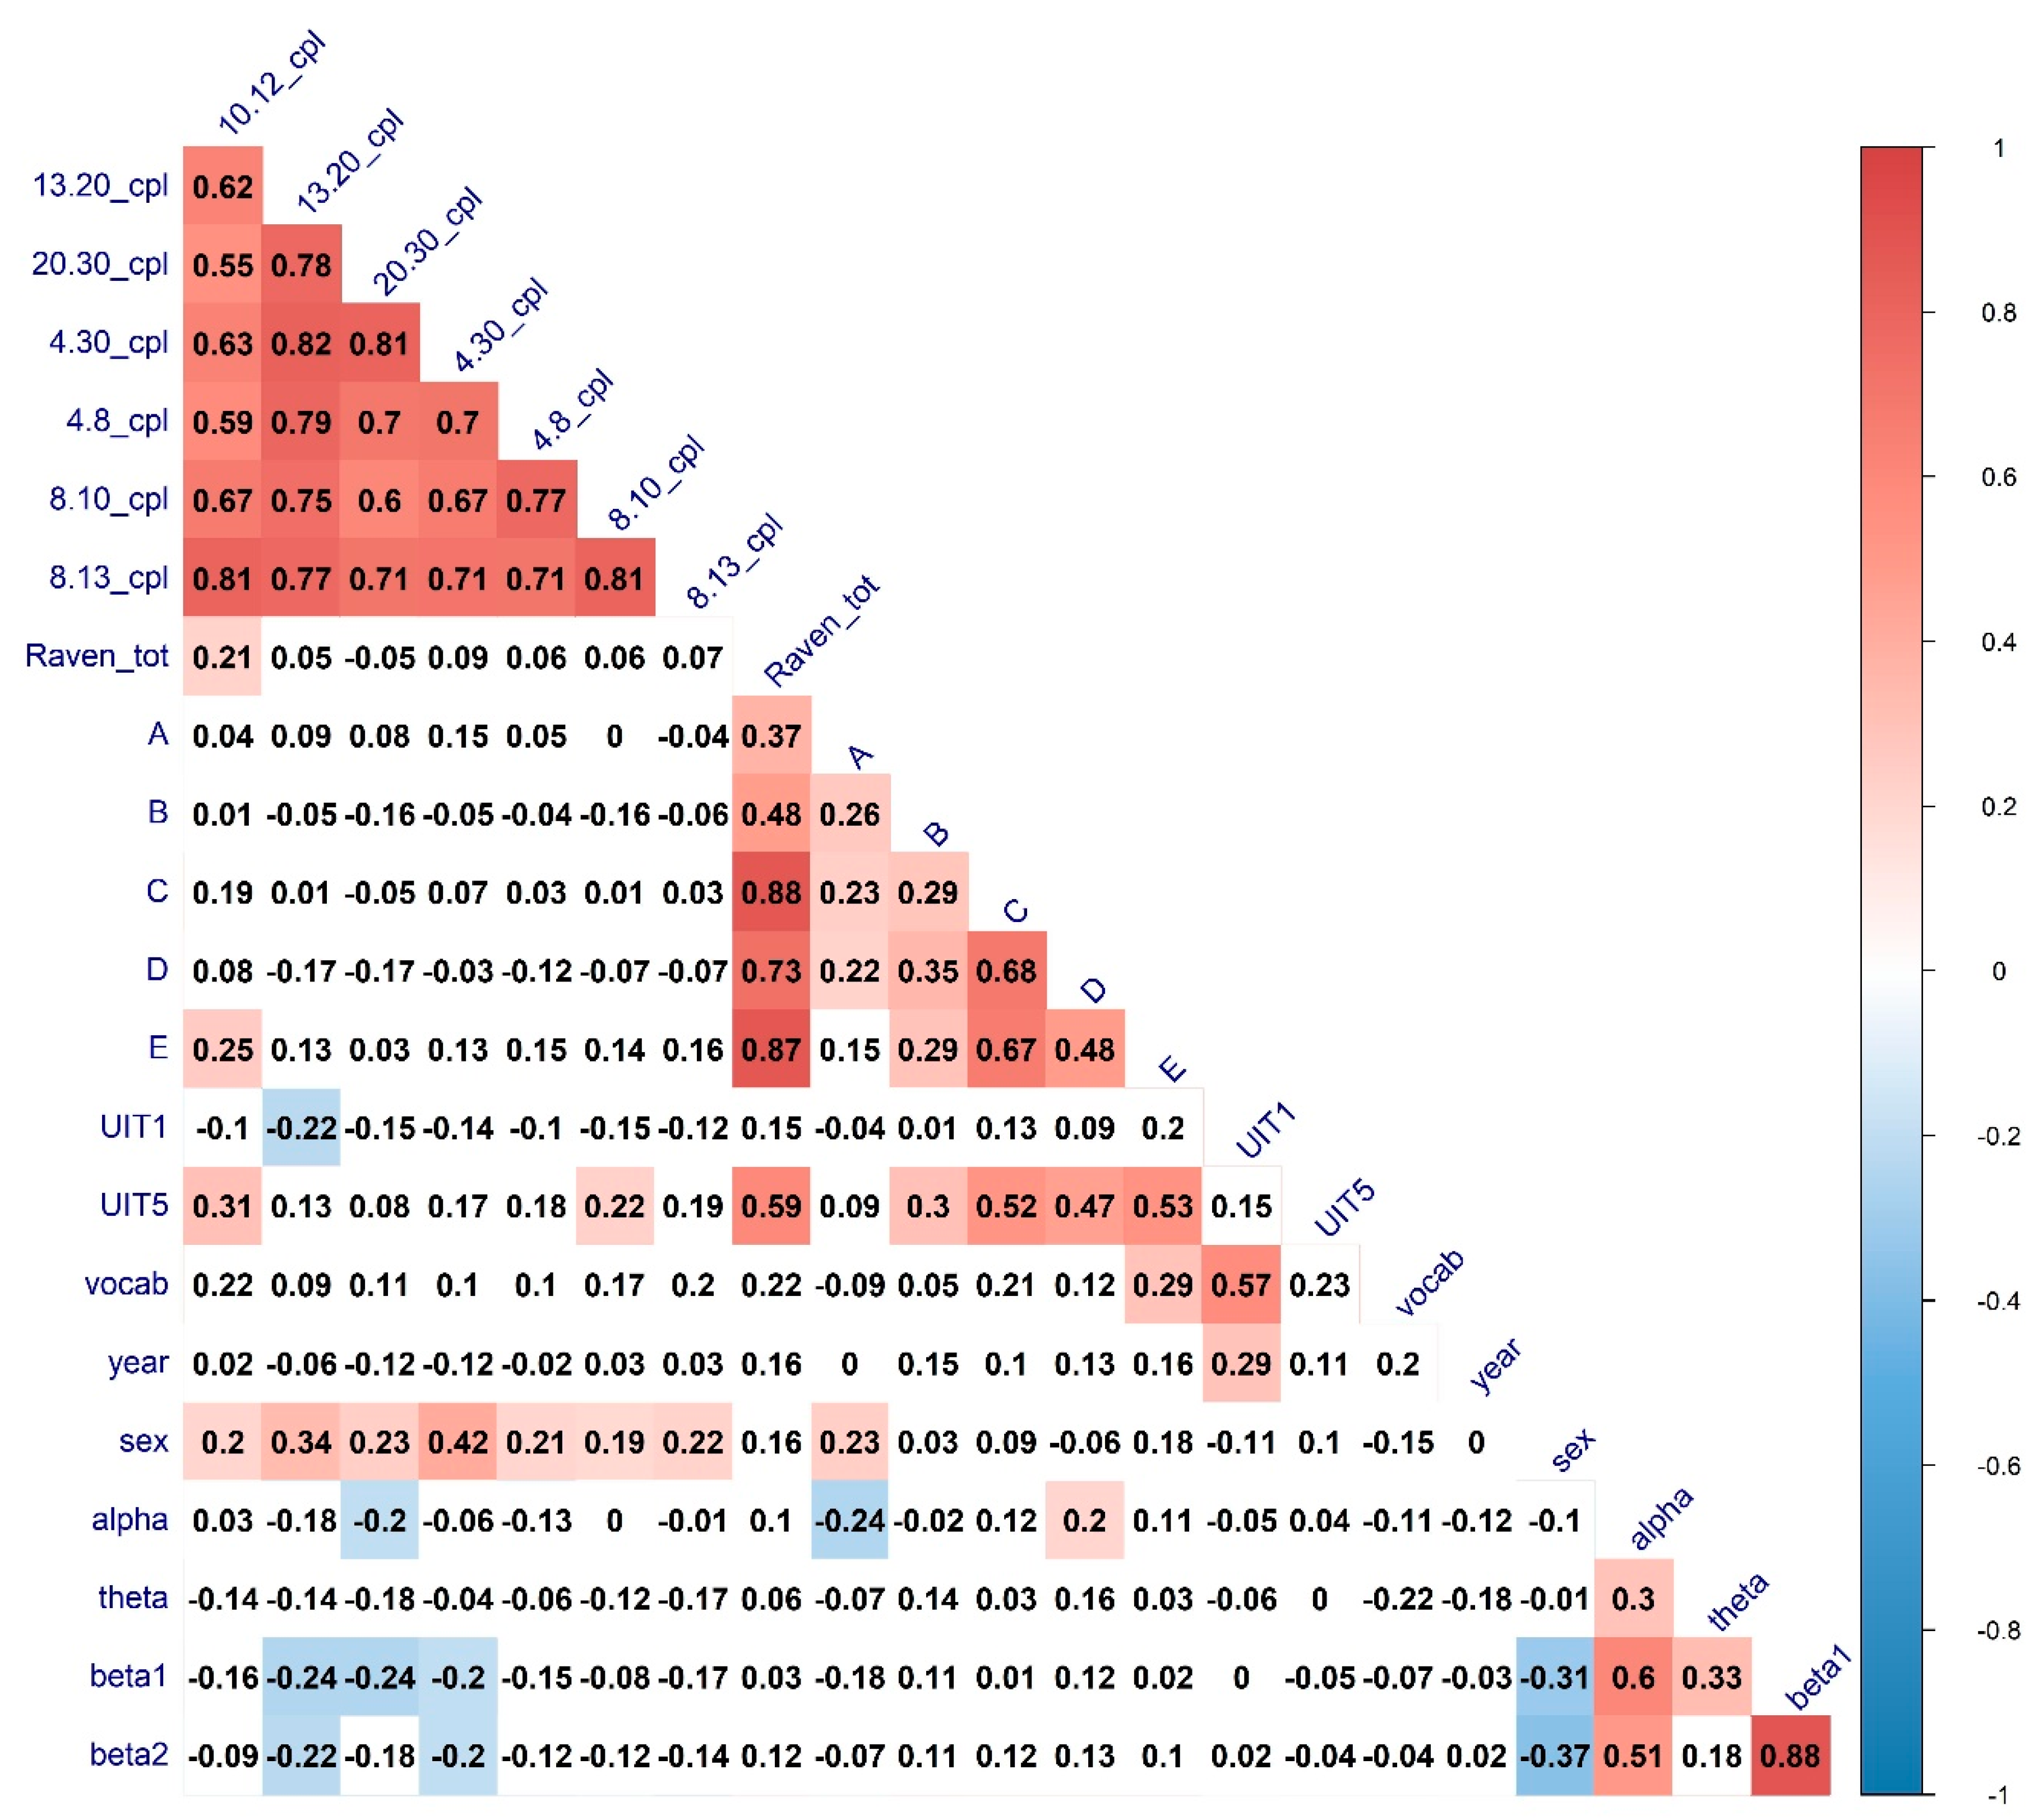
2.8. Statistical Analysis
3. Results
3.1. The Relationship between Verbal and Non-Verbal Abilities and Large-Scale Topological Network Characteristics
3.2. The Relationship between Verbal and Non-Verbal Abilities and Nodal Connectivity Measures
4. Discussion
Limitations
5. Conclusions
Supplementary Materials
Author Contributions
Funding
Institutional Review Board Statement
Informed Consent Statement
Data Availability Statement
Conflicts of Interest
References
- Gottfredson, L.S. Hans Eysenck’s theory of intelligence, and what it reveals about him. Pers. Individ. Differ. 2016, 103, 116–127. [Google Scholar] [CrossRef]
- Adetula, G.A. Emotional, social, and cognitive intelligence as predictors of job performance among law enforcement agency personnel. J. Appl. Secur. Res. 2016, 11, 149–165. [Google Scholar] [CrossRef]
- Firkowska-Mankiewicz, A. Intelligence (IQ) as a predictor of life success. Int. J. Sociol. 2002, 32, 25–43. [Google Scholar] [CrossRef]
- Mendoza, H.; Hontiveros, E. Academic achievement, emotional intelligence and fluid intelligence as predictors of intrinsic career success of graduate students: Basis for career development program. Asian J. Soc. Sci. Humanit. 2017, 6, 9–20. [Google Scholar]
- Duncan, J. The structure of cognition: Attentional episodes in mind and brain. Neuron 2013, 80, 35–50. [Google Scholar] [CrossRef] [PubMed] [Green Version]
- Takeuchi, H.; Taki, Y.; Sassa, Y.; Hashizume, H.; Sekiguchi, A.; Fukushima, A.; Kawashima, R. Brain structures associated with executive functions during everyday events in a non-clinical sample. Brain Struct. Funct. 2013, 218, 1017–1032. [Google Scholar] [CrossRef] [PubMed] [Green Version]
- Jung, J.; Visser, M.; Binney, R.J.; Ralph, M.A.L. Establishing the cognitive signature of human brain networks derived from structural and functional connectivity. Brain Struct. Funct. 2018, 223, 4023–4038. [Google Scholar] [CrossRef] [PubMed] [Green Version]
- Deary, I.J.; Penke, L.; Johnson, W. The neuroscience of human intelligence differences. Nat. Rev. Neurosci. 2010, 11, 201–211. [Google Scholar] [CrossRef] [PubMed]
- Sporns, O. Networks of the Brain; MIT Press: Cambridge, MA, USA, 2010; ISBN 9780262014694. [Google Scholar]
- Bertolero, M.A.; Bassett, D.S. On the nature of explanations offered by network science: A perspective from and for practicing neuroscientists. Top. Cogn. Sci. 2020, 12, 1272–1293. [Google Scholar] [CrossRef]
- Barbey, A.K. Network neuroscience theory of human intelligence. Trends Cogn. Sci. 2018, 22, 8–20. [Google Scholar] [CrossRef] [Green Version]
- Rubinov, M.; Sporns, O. Complex network measures of brain connectivity: Uses and interpretations. Neuroimage 2010, 52, 1059–1069. [Google Scholar] [CrossRef] [PubMed]
- Tononi, G.; Sporns, O.; Edelman, G.M. A measure for brain complexity: Relating functional segregation and integration in the nervous system. Proc. Natl. Acad. Sci. USA 1994, 91, 5033–5037. [Google Scholar] [CrossRef] [PubMed] [Green Version]
- Deco, G.; Tononi, G.; Boly, M.; Kringelbach, M.L. Rethinking segregation and integration: Contributions of whole-brain modelling. Nat. Rev. Neurosci. 2015, 16, 430–439. [Google Scholar] [CrossRef]
- Haier, R.J.; Siegel, B.V., Jr.; Nuechterlein, K.H.; Hazlett, E.; Wu, J.C.; Paek, J.; Brouning, H.L.; Buchsbaum, M.S. Cortical glucose metabolic rate correlates of abstract reasoning and attention studied with positron emission tomography. Intelligence 1988, 12, 199–217. [Google Scholar] [CrossRef]
- Achard, S.; Salvador, R.; Whitcher, B.; Suckling, J.; Bullmore, E.D. A resilient, low-frequency, small-world human brain functional network with highly connected association cortical hubs. J. Neurosci. 2006, 26, 63–72. [Google Scholar] [CrossRef]
- He, Y.; Chen, Z.J.; Evans, A.C. Small-world anatomical networks in the human brain revealed by cortical thickness from MRI. Cereb. Cortex 2007, 17, 2407–2419. [Google Scholar] [CrossRef] [PubMed] [Green Version]
- Iturria-Medina, Y.; Sotero, R.C.; Canales-Rodríguez, E.J.; Alemán-Gómez, Y.; Melie-García, L. Studying the human brain anatomical network via diffusion-weighted MRI and Graph Theory. Neuroimage 2008, 40, 1064–1076. [Google Scholar] [CrossRef]
- Watts, D.J.; Strogatz, S.H. Collective dynamics of ‘small world’ networks. Nature 1998, 393, 440–442. [Google Scholar] [CrossRef]
- Sporns, O. Small-world connectivity, motif composition, and complexity of fractal neuronal connections. Biosystems 2006, 85, 55–64. [Google Scholar] [CrossRef]
- Stam, C.V.; van Straaten, E.C.W. The organization of physiological brain networks. Clin. Neurophysiol. 2012, 123, 1067–1087. [Google Scholar] [CrossRef]
- Finn, E.S.; Shen, X.; Scheinost, D.; Rosenberg, M.D.; Huang, J.; Chun, M.M.; Papademetris, X.; Constable, R.T. Functional connectome fingerprinting: Identifying individuals using patterns of brain connectivity. Nat. Neurosci. 2015, 18, 1664–1671. [Google Scholar] [CrossRef] [PubMed]
- Li, S.; Hu, N.; Zhang, W.; Tao, B.; Dai, J.; Gong, Y.; Tan, Y.; Cai, D.; Lui, S. Dysconnectivity of Multiple Brain Networks in Schizophrenia: A Meta-Analysis of Resting-State Functional Connectivity. Front. Psychiatry 2019, 10, 482. [Google Scholar] [CrossRef] [PubMed] [Green Version]
- Markett, S.; Weber, B.; Voigt, G.; Montag, C.; Felten, A.; Elger, C. Intrinsic connectivity networks and personality: The temperament dimension harm avoidance moderates functional connectivity in the resting brain. Neuroscience 2013, 240, 98–105. [Google Scholar] [CrossRef] [PubMed]
- Beaty, R.E.; Kenett, Y.N.; Christensen, A.P.; Rosenberg, M.D.; Benedek, M.; Chen, Q.; Fink, A.; Qiu, J.; Kwapil, T.R.; Kane, M.J.; et al. Robust prediction of individual creative ability from brain functional connectivity. Proc. Natl. Acad. Sci. USA 2018, 115, 1087–1092. [Google Scholar] [CrossRef] [PubMed] [Green Version]
- van den Heuvel, M.P.; Stam, C.J.; Kahn, R.S.; Pol, H.E.H. Efficiency of functional brain networks and intellectual performance. J. Neurosci. 2009, 29, 7619–7624. [Google Scholar] [CrossRef] [Green Version]
- Song, M.; Liu, Y.; Zhou, Y.; Wang, K.; Yu, C.; Jiang, T. Default network and intelligence difference. IEEE Trans. Auton. Ment. Dev. 2009, 1, 101–109. [Google Scholar] [CrossRef]
- Schultz, D.H.; Cole, M.W. Higher intelligence is associated with less task-related brain network reconfiguration. J. Neurosci. 2016, 36, 8551–8561. [Google Scholar] [CrossRef]
- Saxe, G.N.; Calderone, D.; Morales, L.J. Brain entropy and human intelligence: A resting-state fMRI study. PLoS ONE 2018, 13, e0191582. [Google Scholar] [CrossRef]
- Kruschwitz, J.D.; Waller, L.; Daedelow, L.S.; Walter, H.; Veer, I.M. General, crystallized and fluid intelligence are not associated with functional global network efficiency: A replication study with the human connectome project 1200 data set. Neuroimage 2018, 171, 323–331. [Google Scholar] [CrossRef]
- Langer, N.; Pedroni, A.; Gianotti, L.R.R.; Hänggi, J.; Knoch, D.; Jäncke, L. Functional brain network efficiency predicts intelligence. Hum. Brain Mapp. 2012, 33, 1393–1406. [Google Scholar] [CrossRef]
- Zakharov, I.; Tabueva, A.; Adamovich, T.; Kovas, Y.; Malykh, S. Alpha Band Resting-State EEG Connectivity Is Associated with Non-verbal Intelligence. Front. Hum. Neurosci. 2020, 14, 10. [Google Scholar] [CrossRef] [PubMed] [Green Version]
- Logothetis, N.K. What we can do and what we cannot do with fMRI. Nature 2008, 453, 869–878. [Google Scholar] [CrossRef] [PubMed]
- Fries, P. Rhythms for cognition: Communication through coherence. Neuron 2015, 88, 220–235. [Google Scholar] [CrossRef] [PubMed] [Green Version]
- Palva, S.; Palva, J.M. Functional roles of alpha-band phase synchronization in local and large-scale cortical networks. Front. Psychol. 2011, 2, 204. [Google Scholar] [CrossRef] [PubMed] [Green Version]
- Sockeel, S.; Schwartz, D.; Pélégrini-Issac, M.; Benali, H. Large-scale functional networks identified from resting-state EEG using spatial ICA. PLoS ONE 2016, 11, e0146845. [Google Scholar] [CrossRef] [PubMed]
- Sasai, S.; Koike, T.; Sugawara, S.K.; Hamano, Y.H.; Sumiya, M.; Okazaki, S.; Takahashi, H.K.; Taga, G.; Sadato, N. Frequency-specific task modulation of human brain functional networks: A fast fMRI study. NeuroImage 2020, 224, 117375. [Google Scholar] [CrossRef]
- Nentwich, M.; Ai, L.; Madsen, J.; Telesford, Q.K.; Haufe, S.; Milham, M.P.; Parra, L.C. Functional connectivity of EEG is subject-specific, associated with phenotype, and different from fMRI. NeuroImage 2020, 218, 117001. [Google Scholar] [CrossRef]
- Dawson, M. Verbal Intelligence. In Encyclopedia of Autism Spectrum Disorders; Volkmar, F.R., Ed.; Springer: New York, NY, USA, 2013. [Google Scholar] [CrossRef]
- Linn, M.C.; Petersen, A.C. Emergence and characterisation of sex differences in spatial ability: A meta-analysis. Child Dev. 1985, 56, 1479–1498. [Google Scholar] [CrossRef]
- Johnson, W.; Bouchard, T.J., Jr. The structure of human intelligence: It’s verbal, perceptual, and image rotation (VPR), not fluid crystallized. Intelligence 2005, 33, 393–416. [Google Scholar] [CrossRef]
- Pamplona, G.S.; Santos Neto, G.S.; Rosset, S.R.; Rogers, B.P.; Salmon, C.E. Analyzing the association between functional connectivity of the brain and intellectual performance. Front. Hum. Neurosci. 2015, 9, 61. [Google Scholar] [CrossRef] [Green Version]
- Fink, A.; Neubauer, A.C. EEG alpha oscillations during the performance of verbal creativity tasks: Differential effects of sex and verbal intelligence. Int. J. Psychophysiol. 2006, 62, 46–53. [Google Scholar] [CrossRef]
- Raven, J.; Court, J. Raven’s Progressive Matrices and Vocabulary Scales; Oxford Psychologists Press: Oxford, UK, 1998. [Google Scholar]
- Maslennikova, E.P.; Feklicheva, I.V.; Esipenko, E.A.; Sharafieva, K.R.; Ismatullina, V.I.; Golovin, G.V.; Miklashevskiy, A.A.; Chipeeva, N.A.; Soldatova, E.L. Vocabulary Size as a Verbal Intelligence Index: Application of the Express Methods of an Estimating Vocabulary Size. Vestn. Yuzhno-Ural. Gos. Univ. Seriya Psikhologiya 2017, 10, 63–69. [Google Scholar] [CrossRef]
- Bajteryakova, E.Y.U.; Baturin, N.A.; Kurganskij, N.A. Diagnostic complex for studying the level and structure of intelligence as the basis of educational monitoring. Zhurnal Prakt. Psihol. 1996, 4, 16–27. (In Russian) [Google Scholar]
- Baturin, N.A.; Kurganskij, N.A. Universal method for studying the level and structure of intelligence. Vopr. Psykhologii 2005, 5, 131–139. (In Russian) [Google Scholar]
- Jas, M.; Engemann, D.A.; Bekhti, Y.; Raimondo, F.; Gramfort, A. Autoreject: Automated artifact rejection for MEG and EEG data. NeuroImage 2017, 159, 417–429. [Google Scholar] [CrossRef] [Green Version]
- Fraschini, M.; Demuru, M.; Crobe, A.; Marrosu, F.; Stam, C.J.; Hillebrand, A. The effect of epoch length on estimated EEG functional connectivity and brain network organisation. J. Neural. Eng. 2016, 13, 036015. [Google Scholar] [CrossRef]
- Gramfort, A.; Luessi, M.; Larson, E.; Engemann, D.A.; Strohmeier, D.; Brodbeck, C.; Parkkonen, L.; Hämäläinen, M.S. MNE software for processing MEG and EEG data. Neuroimage 2014, 86, 446–460. [Google Scholar] [CrossRef] [Green Version]
- Desikan, R.S.; Ségonne, F.; Fischl, B.; Quinn, B.T.; Dickerson, B.C.; Blacker, D.; Buckner, R.L.; Dale, A.M.; Maguire, R.P.; Hyman, B.T. An automated labeling system for subdividing the human cerebral cortex on MRI scans into gyral based regions of interest. NeuroImage 2006, 31, 968–980. [Google Scholar] [CrossRef]
- Vinck, M.; van Wingerden, M.; Womelsdorf, T.; Fries, P.; Pennartz, C.M.A. The pairwise phase consistency: A bias-free measure of rhythmic neuronal synchronization. NeuroImage 2010, 51, 112–122. [Google Scholar] [CrossRef] [PubMed]
- Hardmeier, M.; Hatz, F.; Bousleiman, H.; Schindler, C.; Stam, C.J.; Fuhr, P. Reproducibility of functional connectivity and graph measures based on the phase lag index (PLI) and weighted phase lag index (wPLI) derived from high resolution EEG. PLoS ONE 2014, 9, e108648. [Google Scholar] [CrossRef] [Green Version]
- Shahbazi, F.; Ewald, A.; Ziehe, A.; Nolte, G. Constructing surrogate data to control for artifacts of volume conduction for functional connectivity measures. In 17th International Conference on Biomagnetism Advances in Biomagnetism—Biomag 2010, Dubrovnik, Croatia, 28 March–1 April 2010; Supek, S., Sušac, A., Eds.; Springer: Berlin/Heidelberg, Germany, 2010; pp. 207–210. [Google Scholar]
- Hagberg, A.; Swart, P.; Schult, D. Exploring network structure, dynamics, and function using networkx. In Proceedings of the 7th Python in Science Conference, Pasadena, CA, USA, 19–24 August 2008. [Google Scholar]
- Benjamini, Y.; Hochberg, Y. Controlling the false discovery rate: A practical and powerful approach to multiple testing. J. R. Stat. Soc. Ser. B Stat. Methodol. 1995, 57, 289–300. [Google Scholar] [CrossRef]
- Bååth, R. Bayesian First Aid: A Package that Implements Bayesian Alternatives to the Classical * test Functions in R. In Proceedings of the UseR! 2014—the International R User Conference, Los Angeles, CA, USA, 30 June–3 July 2014; p. 2. [Google Scholar]
- R Core Team. R: A Language and Environment for Statistical Computing; R Foundation for Statistical Computing: Vienna, Austria, 2018. [Google Scholar]
- Jung, R.E.; Haier, R.J. The Parieto-Frontal Integration Theory (P-FIT) of intelligence: Converging neuroimaging evidence. Behav. Brain Sci. 2007, 30, 135. [Google Scholar] [CrossRef] [PubMed]
- Avena-Koenigsberger, A.; Misic, B.; Sporns, O. Communication dynamics in complex brain networks. Nat. Rev. Neurosci. 2018, 19, 17–33. [Google Scholar] [CrossRef] [PubMed]
- Gignac, G.E.; Szodorai, E.T. Effect size guidelines for individual differences researchers. Pers. Individ. Differ. 2016, 102, 74–78. [Google Scholar] [CrossRef]
- Kocevar, G.; Suprano, I.; Stamile, C.; Hannoun, S.; Fourneret, P.; Revol, O.; Nusbaum, F.; Sappey-Marinier, D. Brain structural connectivity correlates with fluid intelligence in children: A DTI graph analysis. Intelligence 2019, 72, 67–75. [Google Scholar] [CrossRef]
- Klimesch, W. EEG alpha and theta oscillations reflect cognitive and memory performance: A review and analysis. Brain Res. Rev. 1999, 29, 169–195. [Google Scholar] [CrossRef]
- Strijkstra, A.M.; Beersma, D.G.; Drayer, B.; Halbesma, N.; Daan, S. Subjective sleepiness correlates negatively with global alpha (8–12 Hz) and positively with central frontal theta (4–8 Hz) frequencies in the human resting awake electroencephalogram. Neurosci. Lett. 2003, 340, 17–20. [Google Scholar] [CrossRef]
- Oken, B.S.; Salinsky, M.C.; Elsas, S. Vigilance, alertness, or sustained attention: Physiological basis and measurement. Clin. Neurophysiol. 2006, 117, 1885–1901. [Google Scholar] [CrossRef] [Green Version]
- Jensen, O.; Mazaheri, A. Shaping functional architecture by oscillatory alpha activity: Gating by inhibition. Front. Hum. Neurosci. 2010, 4, 186. [Google Scholar] [CrossRef] [Green Version]
- Benedek, M.; Bergner, S.; Könen, T.; Fink, A.; Neubauer, A.C. EEG alpha synchronization is related to top-down processing in convergent and divergent thinking. Neuropsychologia 2011, 49, 3505–3511. [Google Scholar] [CrossRef] [Green Version]
- Kang, J.S.; Ojha, A.; Lee, G.; Lee, M. Difference in brain activation patterns of individuals with high and low intelligence in linguistic and visuo-spatial tasks: An EEG study. Intelligence 2017, 61, 47–55. [Google Scholar] [CrossRef]
- Doppelmayr, M.; Klimesch, W.; Stadler, W.; Pöllhuber, D.; Heine, C. EEG alpha power and intelligence. Intelligence 2002, 30, 289–302. [Google Scholar] [CrossRef]
- Wang, L.; Song, M.; Jiang, T.; Zhang, Y.; Yu, C. Regional homogeneity of the resting-state brain activity correlates with individual intelligence. Neurosci. Lett. 2011, 488, 275–278. [Google Scholar] [CrossRef] [PubMed]


| Mean | Sd | Median | Min | Max | Skew | Kurtosis | |
|---|---|---|---|---|---|---|---|
| Total | 49.89 | 6.59 | 51.00 | 21.00 | 60.00 | −1.47 | 3.27 |
| A | 11.47 | 1.24 | 12.00 | 2.00 | 12.00 | −5.19 | 34.21 |
| B | 11.07 | 1.45 | 11.00 | 2.00 | 12.00 | −3.32 | 15.86 |
| C | 9.99 | 1.87 | 11.00 | 3.00 | 12.00 | −1.05 | 0.99 |
| D | 9.89 | 1.59 | 10.00 | 3.00 | 12.00 | −1.52 | 3.82 |
| E | 7.59 | 2.53 | 8.00 | 2.00 | 12.00 | −0.36 | −0.53 |
| Vocab | 65.84 | 15.27 | 67.00 | 19.00 | 92.00 | −0.76 | 0.55 |
| Aw | 8.92 | 3.37 | 9.00 | 0.00 | 15.00 | −0.53 | 0.34 |
| Conc | 10.67 | 3.59 | 11.00 | 0.00 | 16.00 | −0.71 | −0.11 |
| EEG Band | Mean | Sd | Median | Min | Max | Skew | Kurtosis |
|---|---|---|---|---|---|---|---|
| 10–12 Hz | 0.27 | 0.06 | 0.25 | 0.18 | 0.42 | 0.83 | −0.16 |
| 13–20 Hz | 0.26 | 0.06 | 0.24 | 0.19 | 0.44 | 0.84 | −0.09 |
| 20–30 Hz | 0.27 | 0.06 | 0.25 | 0.19 | 0.46 | 0.86 | 0.05 |
| 4–30 Hz | 0.27 | 0.06 | 0.25 | 0.19 | 0.44 | 0.79 | −0.22 |
| 4–8 Hz | 0.26 | 0.06 | 0.25 | 0.18 | 0.42 | 0.8 | −0.25 |
| 8–10 Hz | 0.26 | 0.06 | 0.25 | 0.18 | 0.42 | 0.74 | −0.21 |
| 8–13 Hz | 0.27 | 0.06 | 0.25 | 0.19 | 0.43 | 0.77 | −0.27 |
| EEG Band | Mean | Sd | Median | Min | Max | Skew | Kurtosis |
|---|---|---|---|---|---|---|---|
| 10–12 Hz | 0.19 | 0.03 | 0.19 | 0.13 | 0.40 | 2.46 | 15.20 |
| 13–20 Hz | 0.26 | 0.03 | 0.27 | 0.17 | 0.37 | −0.59 | 1.20 |
| 20–30 Hz | 0.27 | 0.04 | 0.28 | 0.13 | 0.40 | −0.90 | 2.31 |
| 4–30 Hz | 0.32 | 0.05 | 0.33 | 0.18 | 0.41 | −1.13 | 0.99 |
| 4–8 Hz | 0.24 | 0.03 | 0.24 | 0.16 | 0.39 | 1.46 | 12.04 |
| 8–10 Hz | 0.20 | 0.03 | 0.20 | 0.14 | 0.39 | 2.50 | 16.21 |
| 8–13 Hz | 0.23 | 0.03 | 0.23 | 0.14 | 0.38 | 0.48 | 3.55 |
| EEG Band | Mean | Sd | Median | Min | Max | Skew | Kurtosis |
|---|---|---|---|---|---|---|---|
| 10–12 Hz | 0.10 | 0.01 | 0.10 | 0.07 | 0.13 | 0.22 | −0.05 |
| 13–20 Hz | 0.09 | 0.01 | 0.09 | 0.07 | 0.12 | 0.72 | 0.36 |
| 20–30 Hz | 0.09 | 0.01 | 0.09 | 0.06 | 0.13 | 0.60 | 0.93 |
| 4–30 Hz | 0.09 | 0.01 | 0.09 | 0.07 | 0.12 | 0.61 | 0.65 |
| 4–8 Hz | 0.09 | 0.01 | 0.09 | 0.06 | 0.12 | 0.43 | 1.22 |
| 8–10 Hz | 0.10 | 0.01 | 0.09 | 0.07 | 0.13 | 0.53 | −0.31 |
| 8–13 Hz | 0.09 | 0.01 | 0.09 | 0.06 | 0.11 | 0.01 | −0.44 |
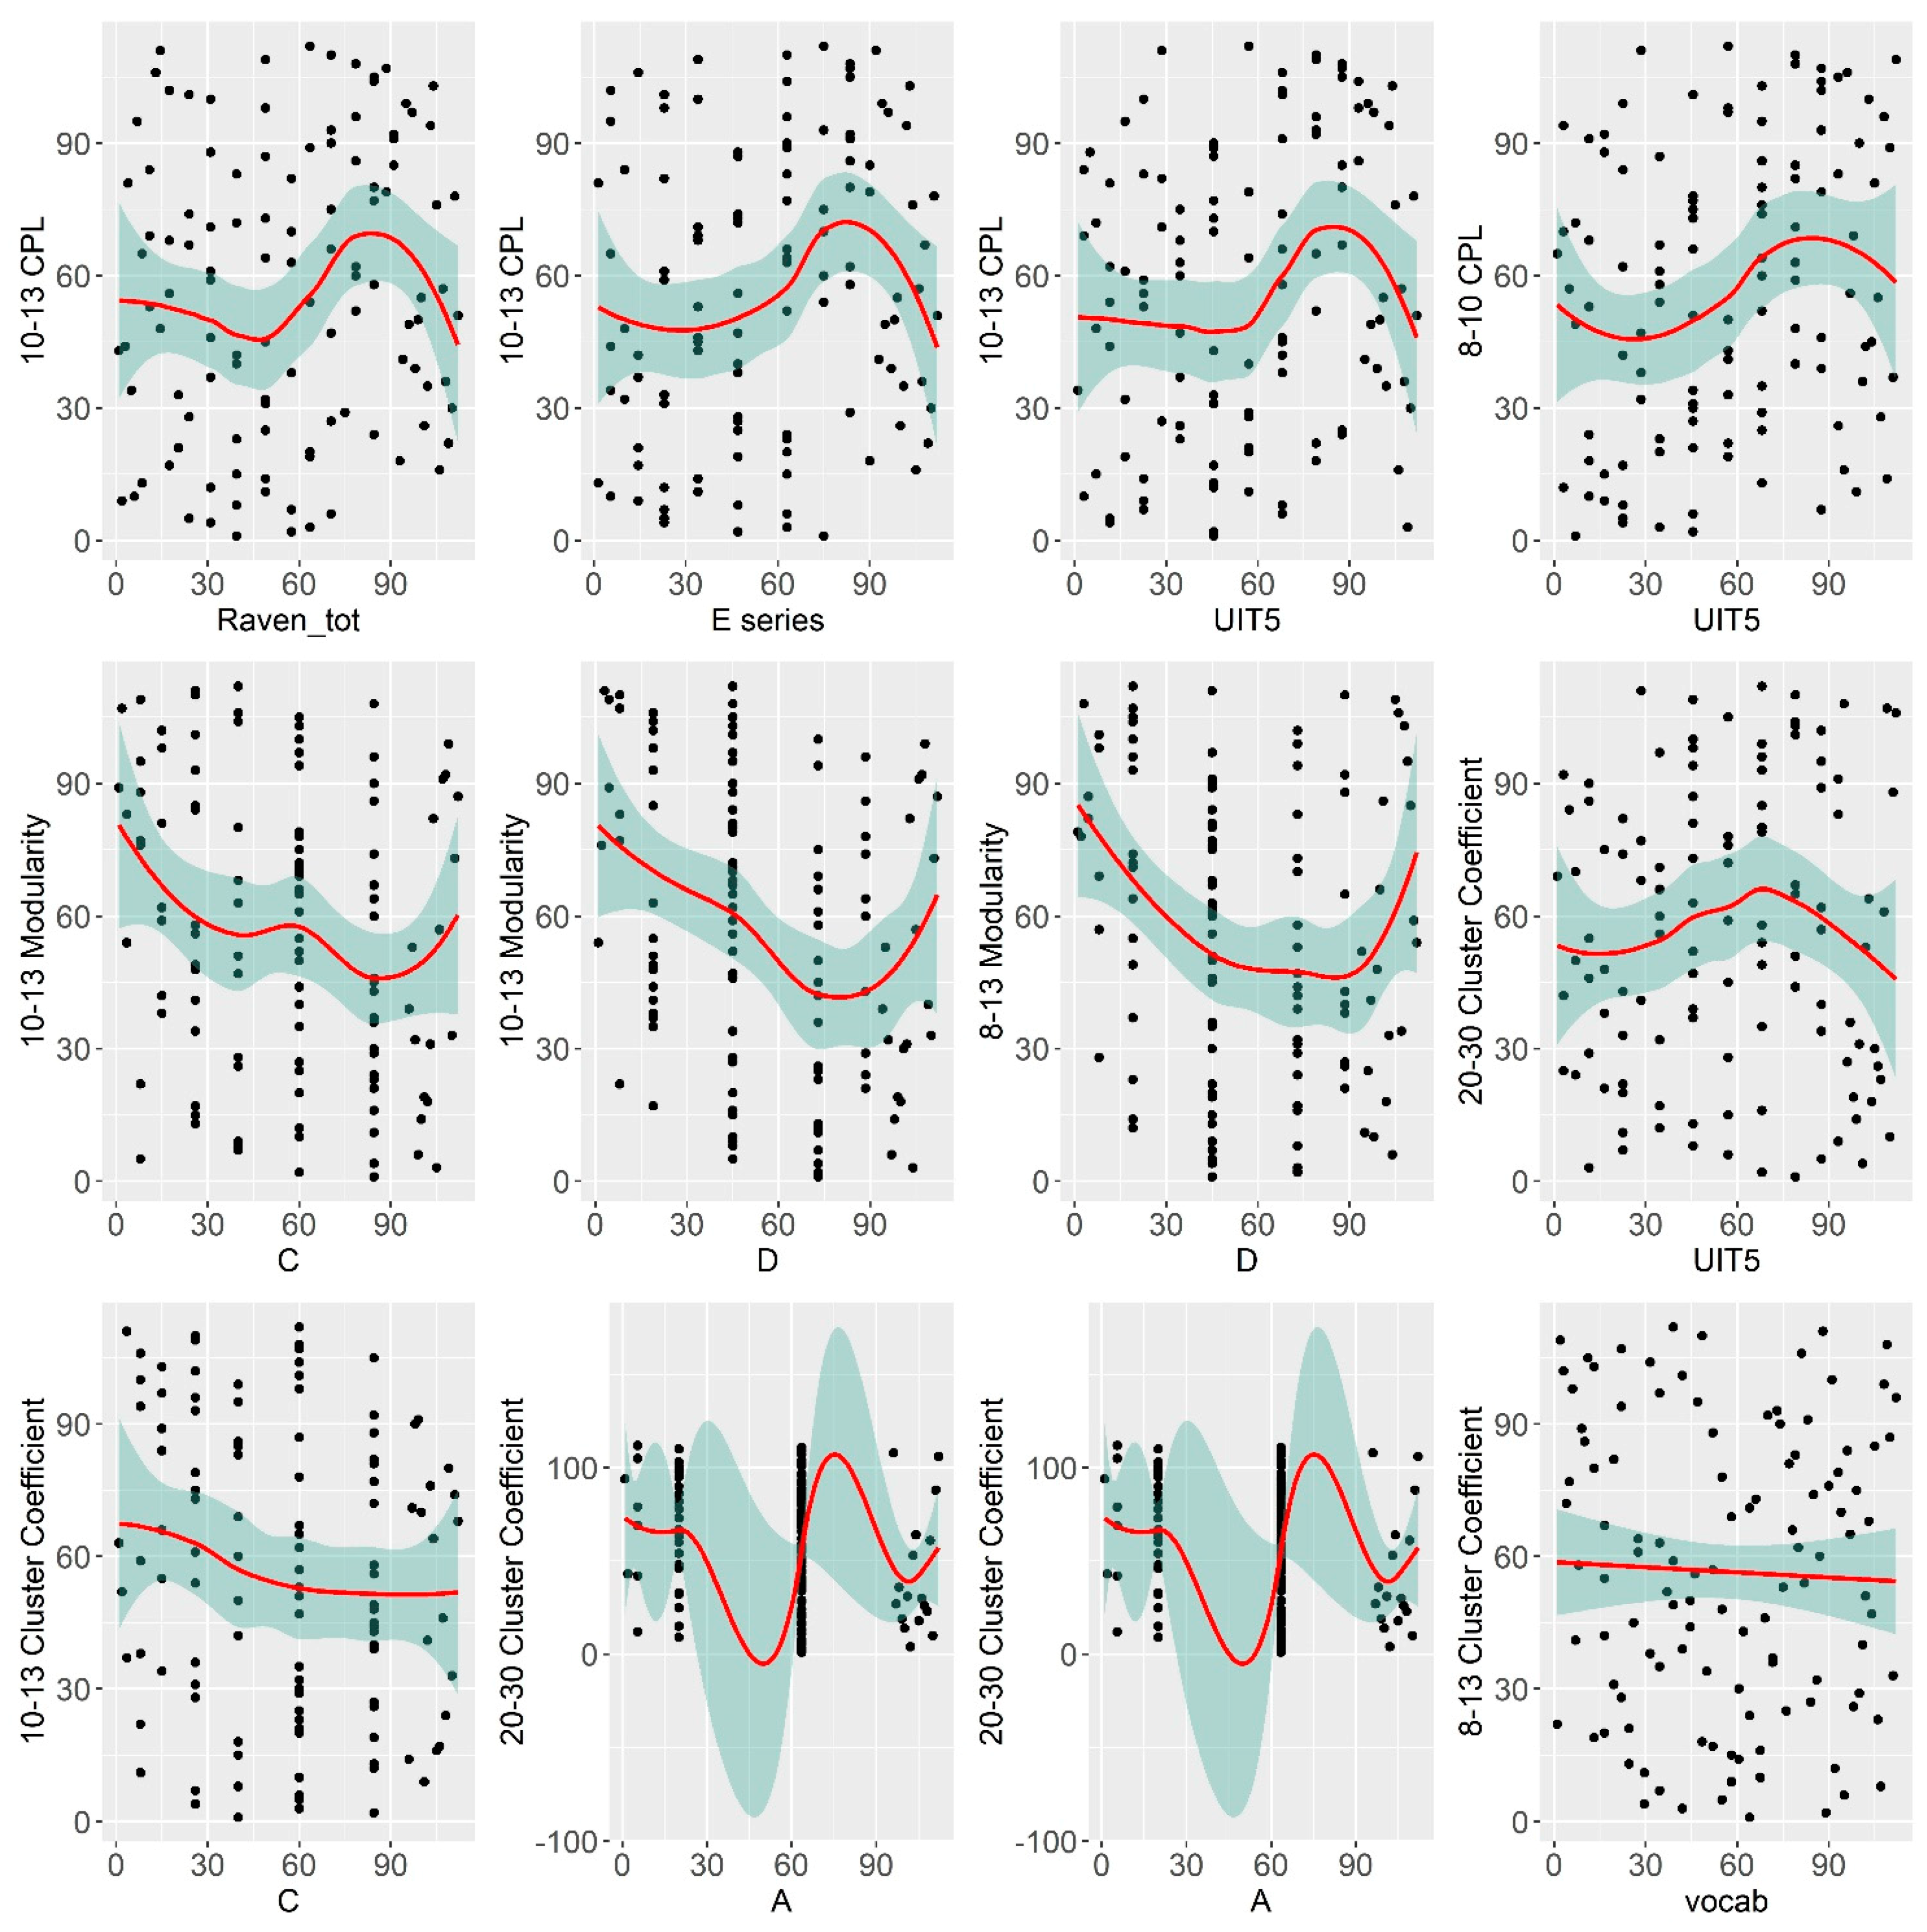
| Variable | Correlate | Regressor | R Estimate | p-Value |
|---|---|---|---|---|
| Raven total | 10–12 CPL | Sex | 0.21 * | 0.04 |
| Raven total | 10–12 Modularity | Alpha & Theta power | −0.24 * | 0.02 |
| A series | 8–13 Clust. Coef. | Alpha power | 0.16 | 0.11 |
| C series | 10–12 Modularity | Alpha & Theta power | −0.22 * | 0.02 |
| D series | 10–12 Modularity | Alpha & Theta power | −0.26 * | 0.01 |
| E series | 10–12 CPL | Sex | 0.22 * | 0.03 |
| UIT1 | 13–20 CPL | Sex | −0.02 | 0.8 |
| UIT1 | 13–20 Mod | Sex | 0.13 | 0.2 |
| UIT5 | 10–12 CPL | Sex | 0.28 ** | 0.005 |
| UIT5 | 8–10 CPL | Sex | 0.28 ** | 0.006 |
| MyVocab | 8–13 Clust. Coef. | Alpha power | −0.29 ** | 0.001 |
Publisher’s Note: MDPI stays neutral with regard to jurisdictional claims in published maps and institutional affiliations. |
© 2021 by the authors. Licensee MDPI, Basel, Switzerland. This article is an open access article distributed under the terms and conditions of the Creative Commons Attribution (CC BY) license (http://creativecommons.org/licenses/by/4.0/).
Share and Cite
Feklicheva, I.; Zakharov, I.; Chipeeva, N.; Maslennikova, E.; Korobova, S.; Adamovich, T.; Ismatullina, V.; Malykh, S. Assessing the Relationship between Verbal and Nonverbal Cognitive Abilities Using Resting-State EEG Functional Connectivity. Brain Sci. 2021, 11, 94. https://doi.org/10.3390/brainsci11010094
Feklicheva I, Zakharov I, Chipeeva N, Maslennikova E, Korobova S, Adamovich T, Ismatullina V, Malykh S. Assessing the Relationship between Verbal and Nonverbal Cognitive Abilities Using Resting-State EEG Functional Connectivity. Brain Sciences. 2021; 11(1):94. https://doi.org/10.3390/brainsci11010094
Chicago/Turabian StyleFeklicheva, Inna, Ilya Zakharov, Nadezda Chipeeva, Ekaterina Maslennikova, Svetlana Korobova, Timofey Adamovich, Victoria Ismatullina, and Sergey Malykh. 2021. "Assessing the Relationship between Verbal and Nonverbal Cognitive Abilities Using Resting-State EEG Functional Connectivity" Brain Sciences 11, no. 1: 94. https://doi.org/10.3390/brainsci11010094