Article

Comparison of Smoothing Filters’ Influence on Quality of Data Recorded with the Emotiv EPOC Flex Brain–Computer Interface Headset during Audio Stimulation

by
Natalia Browarska
1,
Aleksandra Kawala-Sterniuk
1,*,
Jaroslaw Zygarlicki
1,
Michal Podpora
1,
Mariusz Pelc
1,2,
Radek Martinek
3 and
Edward Jacek Gorzelańczyk
4,5,6
1
Faculty of Electrical Engineering, Automatic Control and Informatics, Opole University of Technology, 45-758 Opole, Poland
2
Department of Computing and Information Systems, University of Greenwich, London SE10 9LS, UK
3
Department of Cybernetics and Biomedical Engineering, FEECS, VSB-Technical University Ostrava, 708 00 Ostrava-Poruba, Czech Republic
4
Department of Theoretical Basis of BioMedical Sciences and Medical Informatics, Nicolaus Copernicus University, Collegium Medicum, 85-067 Bydgoszcz, Poland
5
Institute of Philosophy, Kazimierz Wielki University, 85-092 Bydgoszcz, Poland
6
Outpatient Addiction Treatment, Babinski Specialist Psychiatric Healthcare Center, 91-229 Lodz, Poland
*
Author to whom correspondence should be addressed.
Brain Sci. 2021, 11(1), 98; https://doi.org/10.3390/brainsci11010098
Submission received: 7 December 2020 / Revised: 2 January 2021 / Accepted: 8 January 2021 / Published: 13 January 2021

Abstract

:
Off-the-shelf, consumer-grade EEG equipment is nowadays becoming the first-choice equipment for many scientists when it comes to recording brain waves for research purposes. On one hand, this is perfectly understandable due to its availability and relatively low cost (especially in comparison to some clinical-level EEG devices), but, on the other hand, quality of the recorded signals is gradually increasing and reaching levels that were offered just a few years ago by much more expensive devices used in medicine for diagnostic purposes. In many cases, a well-designed filter and/or a well-thought signal acquisition method improve the signal quality to the level that it becomes good enough to become subject of further analysis allowing to formulate some valid scientific theories and draw far-fetched conclusions related to human brain operation. In this paper, we propose a smoothing filter based upon the Savitzky–Golay filter for the purpose of EEG signal filtering. Additionally, we provide a summary and comparison of the applied filter to some other approaches to EEG data filtering. All the analyzed signals were acquired from subjects performing visually involving high-concentration tasks with audio stimuli using Emotiv EPOC Flex equipment.

Graphical Abstract

1. Introduction

The investigation of brain waves with the implementation of the EEG (electroencephalography) data is very useful, as it can help understanding human mental condition such as stress, burnout exhaustion, or mental fatigue [1,2,3,4,5]. It can also provide information regarding the health condition of the tested subjects without the need of surgical intervention [6]. This is because electroencephalography is a noninvasive medical technique introduced in 1875 by Richard Caton [1].
The authors of this work (as a part of a larger project) carried out a series of experiments with the implementation of an inexpensive EEG headset—Emotiv EPOC Flex [7,8]. The quality of the data acquired using this headset strongly differs from those obtained from the clinical amplifiers. The experiments were initially performed in order to check the influence of various sounds (audio stimuli) on human concentration capabilities during performance of various visually stimulated tasks.vData obtained for this study purpose is of particular character, as the Emotiv headsets usually preprocesses the recorded data, which results with some information removal from the obtained signal [7,9]. The device uses 5-th order Sinc filter—0.5–45 Hz and Notch filters (at 50 and 60 Hz) for the power disturbances removal [7].
In [10], the authors focused on design, development, and testing of various smoothing filters of clinical quality data. For these study purposes they decided to implement similar filters, but on data recorded with the customer-grade, inexpensive, off-the-shelf BCI-headset—Emotiv EPOC Flex. As it was mentioned above, the obtained data quality differs from the one from clinical signals, which affected the choice of the applied filtering. Implementation of smoothing filtering usually positively affects the quality of EEG data, as it makes them more legible for potential diagnostic purposes and does not affect their content [10,11,12].

1.1. Study Background

It is claimed that the human brain is the most complicated human organ and can be compared to a very powerful and complex supercomputer [13,14,15]. Until today, no one was able to recreate and simulate successfully its entire structure. Nowadays, both medicine and information technology are dynamically developed. One of the exemplary results of this collaboration are Brain–Computer Interfaces (BCIs), especially those based on electroencephalography examination. The main aim for implementation of the BCI systems is to entirely replace muscle engagement for controlling external devices, such as computers, intelligent home systems, computer games, and applications, or to support solutions for people using wheelchairs, neuroprostheses, speech prosthesis, and exoskeletons [9,15,16,17,18].
A significant number of people listen to music during everyday activities while driving a car, doing sports, working, studying, and leisure time. It is a good way to enhance listeners’ mood, to relax, reduce stress, relieve tension, or even increase focus [19]. It is clearly visible at the physiological system of the human body at the frequencies of theta and alpha [20]. Moreover, background music is commonly used in public spots, such as restaurants, hotels, offices shops, banks, or shops [21,22,23]. It affects people’s behavior, in particular their concentration level while doing various tasks. This is one of the reasons why we decided to carry out a series of experiments, where participants were influenced with the audio stimuli.
A natural consequence of the experiments’ range was selection of the method—we decided to use electroencephalography (EEG) as a noninvasive method of signal acquisition [9,15,17]. It enables measurement of field potential in the space around neurons, which results in recording of the electrical activity of the brain [15,16,17]. The appropriate electrodes location on the scalp surface plays a crucial role in the signal acquisition process. The EEG channels are placed on the scalp surface in accordance with the 10–20 system [15]. The EEG signal can be characterized with a high time activity about 1 [ms], also its amplitude and frequency are inconstant. Moreover, the EEG waveform is never a simple harmonic signal [15,17].
The most popular method for the EEG frequency ranges classification is the use of Greek letters: Alpha ( α —8–12 Hz), Beta ( β —13–30 Hz), Delta ( δ < 4 Hz), Gamma ( γ > 30 Hz), Theta ( θ —4–7 Hz), and Mu—similar to alpha ( μ —8–12 Hz, which strictly depend on the activity the brain performance [3,8,9,11,24,25,26].
The above-mentioned frequency ranges reflect the rhythmic activity and state of the brain and are linked to various functions such as motor, sensory, or cognition [8]. The lowest rhythm—delta—occurs in a deep sleep state and it is also typical for brain damage in case of young people [27,28]. The theta waves relate to intense emotions, dreams, and meditation [28,29,30,31]. The alpha waves are associated with relaxation (especially with eyes closed). The beta rhythm is typical for everyday activities but it can be also related to the influence of certain drugs, such as diazepam and zolpidem [32,33]. Finally, the gamma waves are associated with awareness, problem-solving, and perception [28].
It is important to mention that it is possible to find significant differences in EEG recordings in relation with the patients’ emotional intelligence, where high emotional intelligent individuals showed less desynchronization in the upper alpha band and more left hemispheric theta desynchronization [30,31,34].

1.2. Signal Processing of EEG Data

The electroencephalogram data is a result of electrical activity of brain measurement [11,15,16]. It has three important features which determine the process of its acquisition and analysis:
  • low amplitude,
  • strong non-stationary character, and
  • narrow range of frequency band.
The analog signal is acquired using noninvasive EEG sensors placed on the human scalp. Its amplitude is approximately several dozen micro-volts, which enforce signal quantization and discretization on the level of several thousand (V/V) [35]. Due to the low amplitude level, recording the EEG signal is a difficulty [11]. Furthermore, a relatively small, electromagnetic interference near the electroencephalogram affects the signal. Thus, signal conditioning systems in EEG-recording devices are equipped with additional systems, which eliminate distortions during the filtering process. This method might, however, distort and/or exclude diagnostic information from the analyzed signal. It is clearly visible, in particular with the application of the inexpensive consumer-grade devices. The interference frequently occurs in the recorded EEG signal and may cause significant problems with the data interpretation [10,11,15,16].
The strong non-stationary character of the EEG signal makes the overall data analysis a very challenging task [9,10,15]. Therefore, it can be useful to apply various signal processing methods such as the well-known Fourier transform, which averages the spectrum of the signal. Additionally, it is possible to observe a spectrum blur effect due to the lack of synchronization of the analyzed signal’s components, which complicates the process of proper analysis of the EEG data. For this reason, a very popular, although also a very simple, Fourier transform is not frequently applied for the purpose of the EEG signals’ analysis. More popular method is a short-term Fourier transform (STFTT), where duration of the time-shifting analysis window is minimized, which results in a loss of resolution in the frequency domain. However, the effect of blurring and averaging the spectrum is still visible; thus, the research and application of alternative methods of EEG signal analysis in the time-frequency domain, such as wavelet analysis and/or Cohen-class transformations are more applicable [11,35].
The third feature of the EEG signal is the narrow frequency band. It is advantageous for the development of EEG signal acquisition systems. The bandwidth lower than the basic harmonic frequency of the power network signal (50 Hz in Europe, 60 Hz in the United States) allows effective filtering of source interference.

2. Materials and Methods

For this study purposes, the authors of this work decided to carry out all measurements with the implementation of the Emotiv EPOC Flex device with gel-based sensors (illustrated with Figure 1). The EPOC Flex is a 32 channel EEG-based Brain–Computer Interface. It is an inexpensive, consumer-grade, high market availability EEG device [7]. It delivers configurable channels location on a standard 32 channel 10–20 map and 0.51 μV EEG Resolution. This customer-grade EEG with “Ag” sensors allows recording signals and is mainly dedicated to academic research, however, these signals are not totally raw, but preprocessed and do not contain full information [7,15]. Some sources, however, claimed Emotiv Flex to provide clinical quality of data [36].
For this study’s purposes, the electrodes were placed in accordance with the 10–20 system in locations illustrated with Figure 2. For this study’s purposes 32 sensors were applied: (Cz, Fz, Fp1, F7, F3, FC1, C3, FC5, FT9, T7, TP9, CP5, CP1, P3, P7, O1, Pz, Oz, O2, P8, P4, CP2, CP6, TP10, FC6, C4, FC2, F4, F8, and Fp2)—marked with a green color in Figure 2, where the referencing electrodes were marked with black [7]. The authors of this paper decided to focus on analysis of data obtained from six channels only: F3, F4, C3, C4, P3, and P4 marked with the red color in Figure 2.
The choice for a limited amount of electrodes has been done carefully, based on not only authors’ professional experience, but also on thorough literature study. As it was mentioned above, analysis of biomedical data, in particular EEG, is a very challenging task [9,10,15,35]. Having a large number of EEG channels makes the whole data analysis process more complex, which can be eased by inter alia selection of only those necessary channels [37,38,39,40]. It also allows reducing the set up time [37,41]. Moreover, using less channels enables to make the BCI systems more compact [38]. Very limited number of channels (only two) is applied in inter alia polysomnography studies, where EEG data is one of the analysed. So far, such an amount of electrodes seems to be enough for research or medical purposes [41]. The use of six channels only in BCI applications can be found in numerous studies and it has been proven to provide similar to the expanded channel sets performance [42,43,44,45,46]. In [43] 6-channel system was compared to the one with 19 electrodes for the benefit of a system with fewer electrodes. The authors of this work decided to choose symmetrically-located electrodes in order to cover frontal, central and paternal lobes.

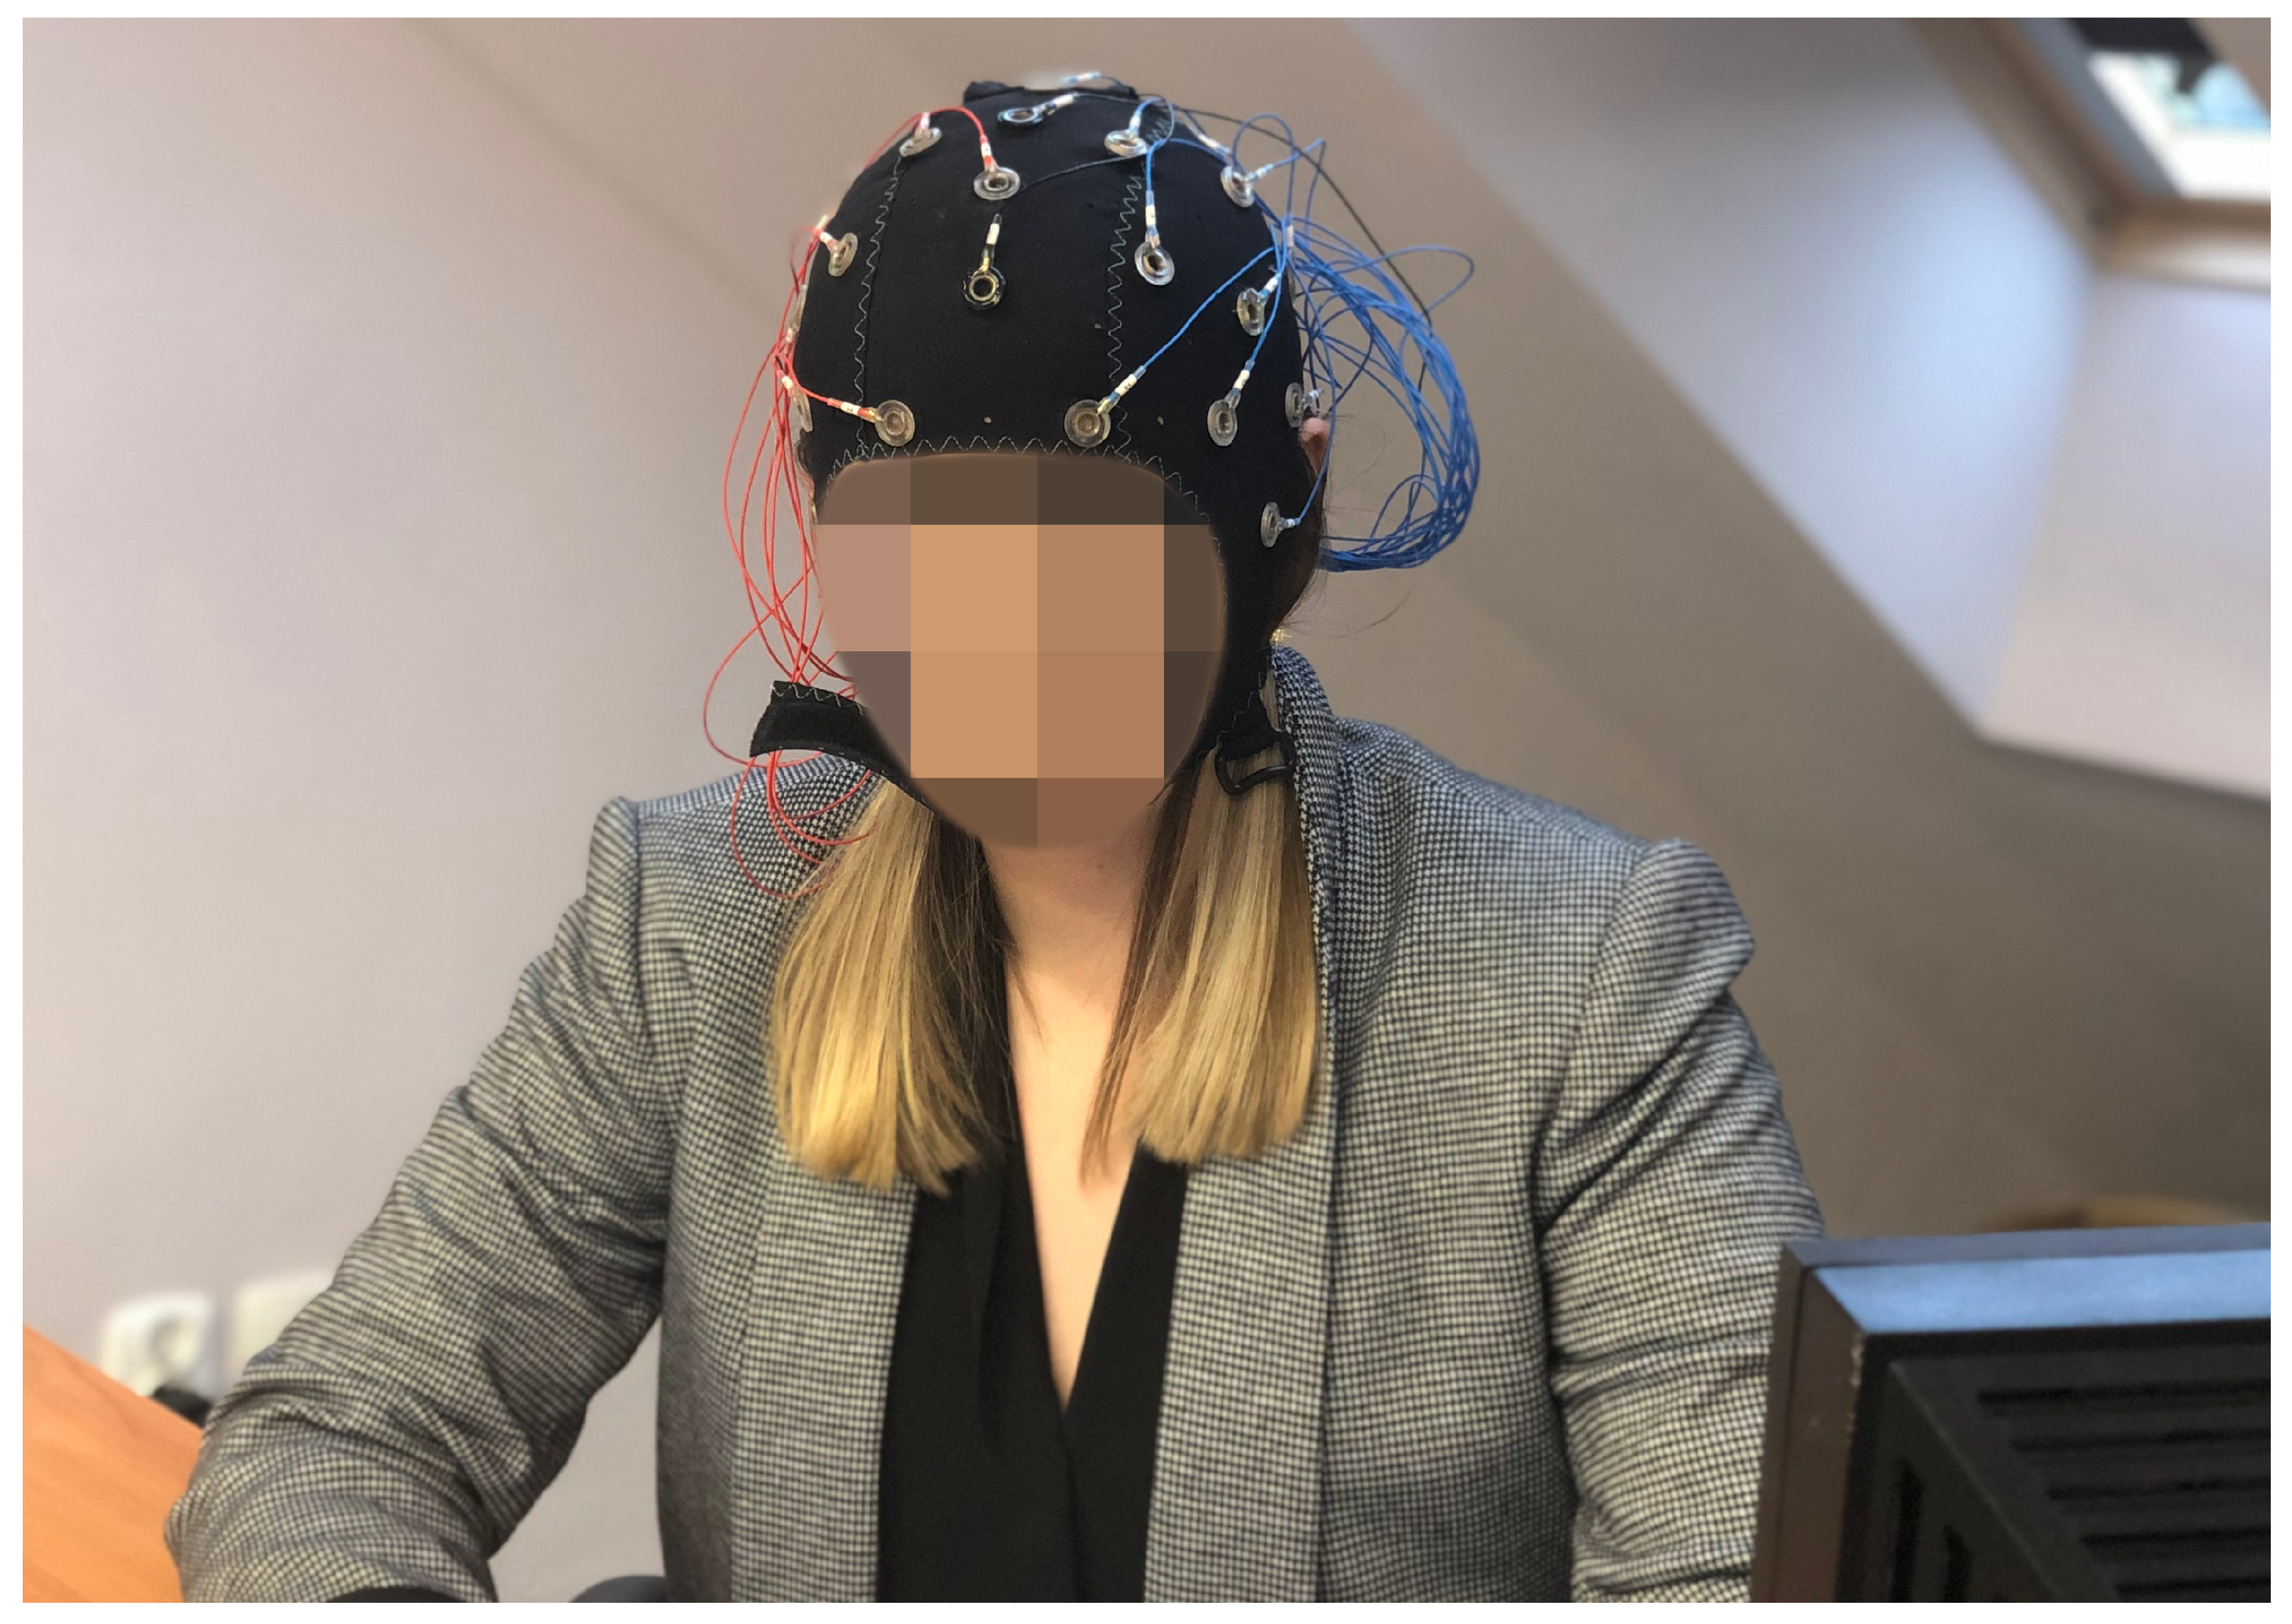
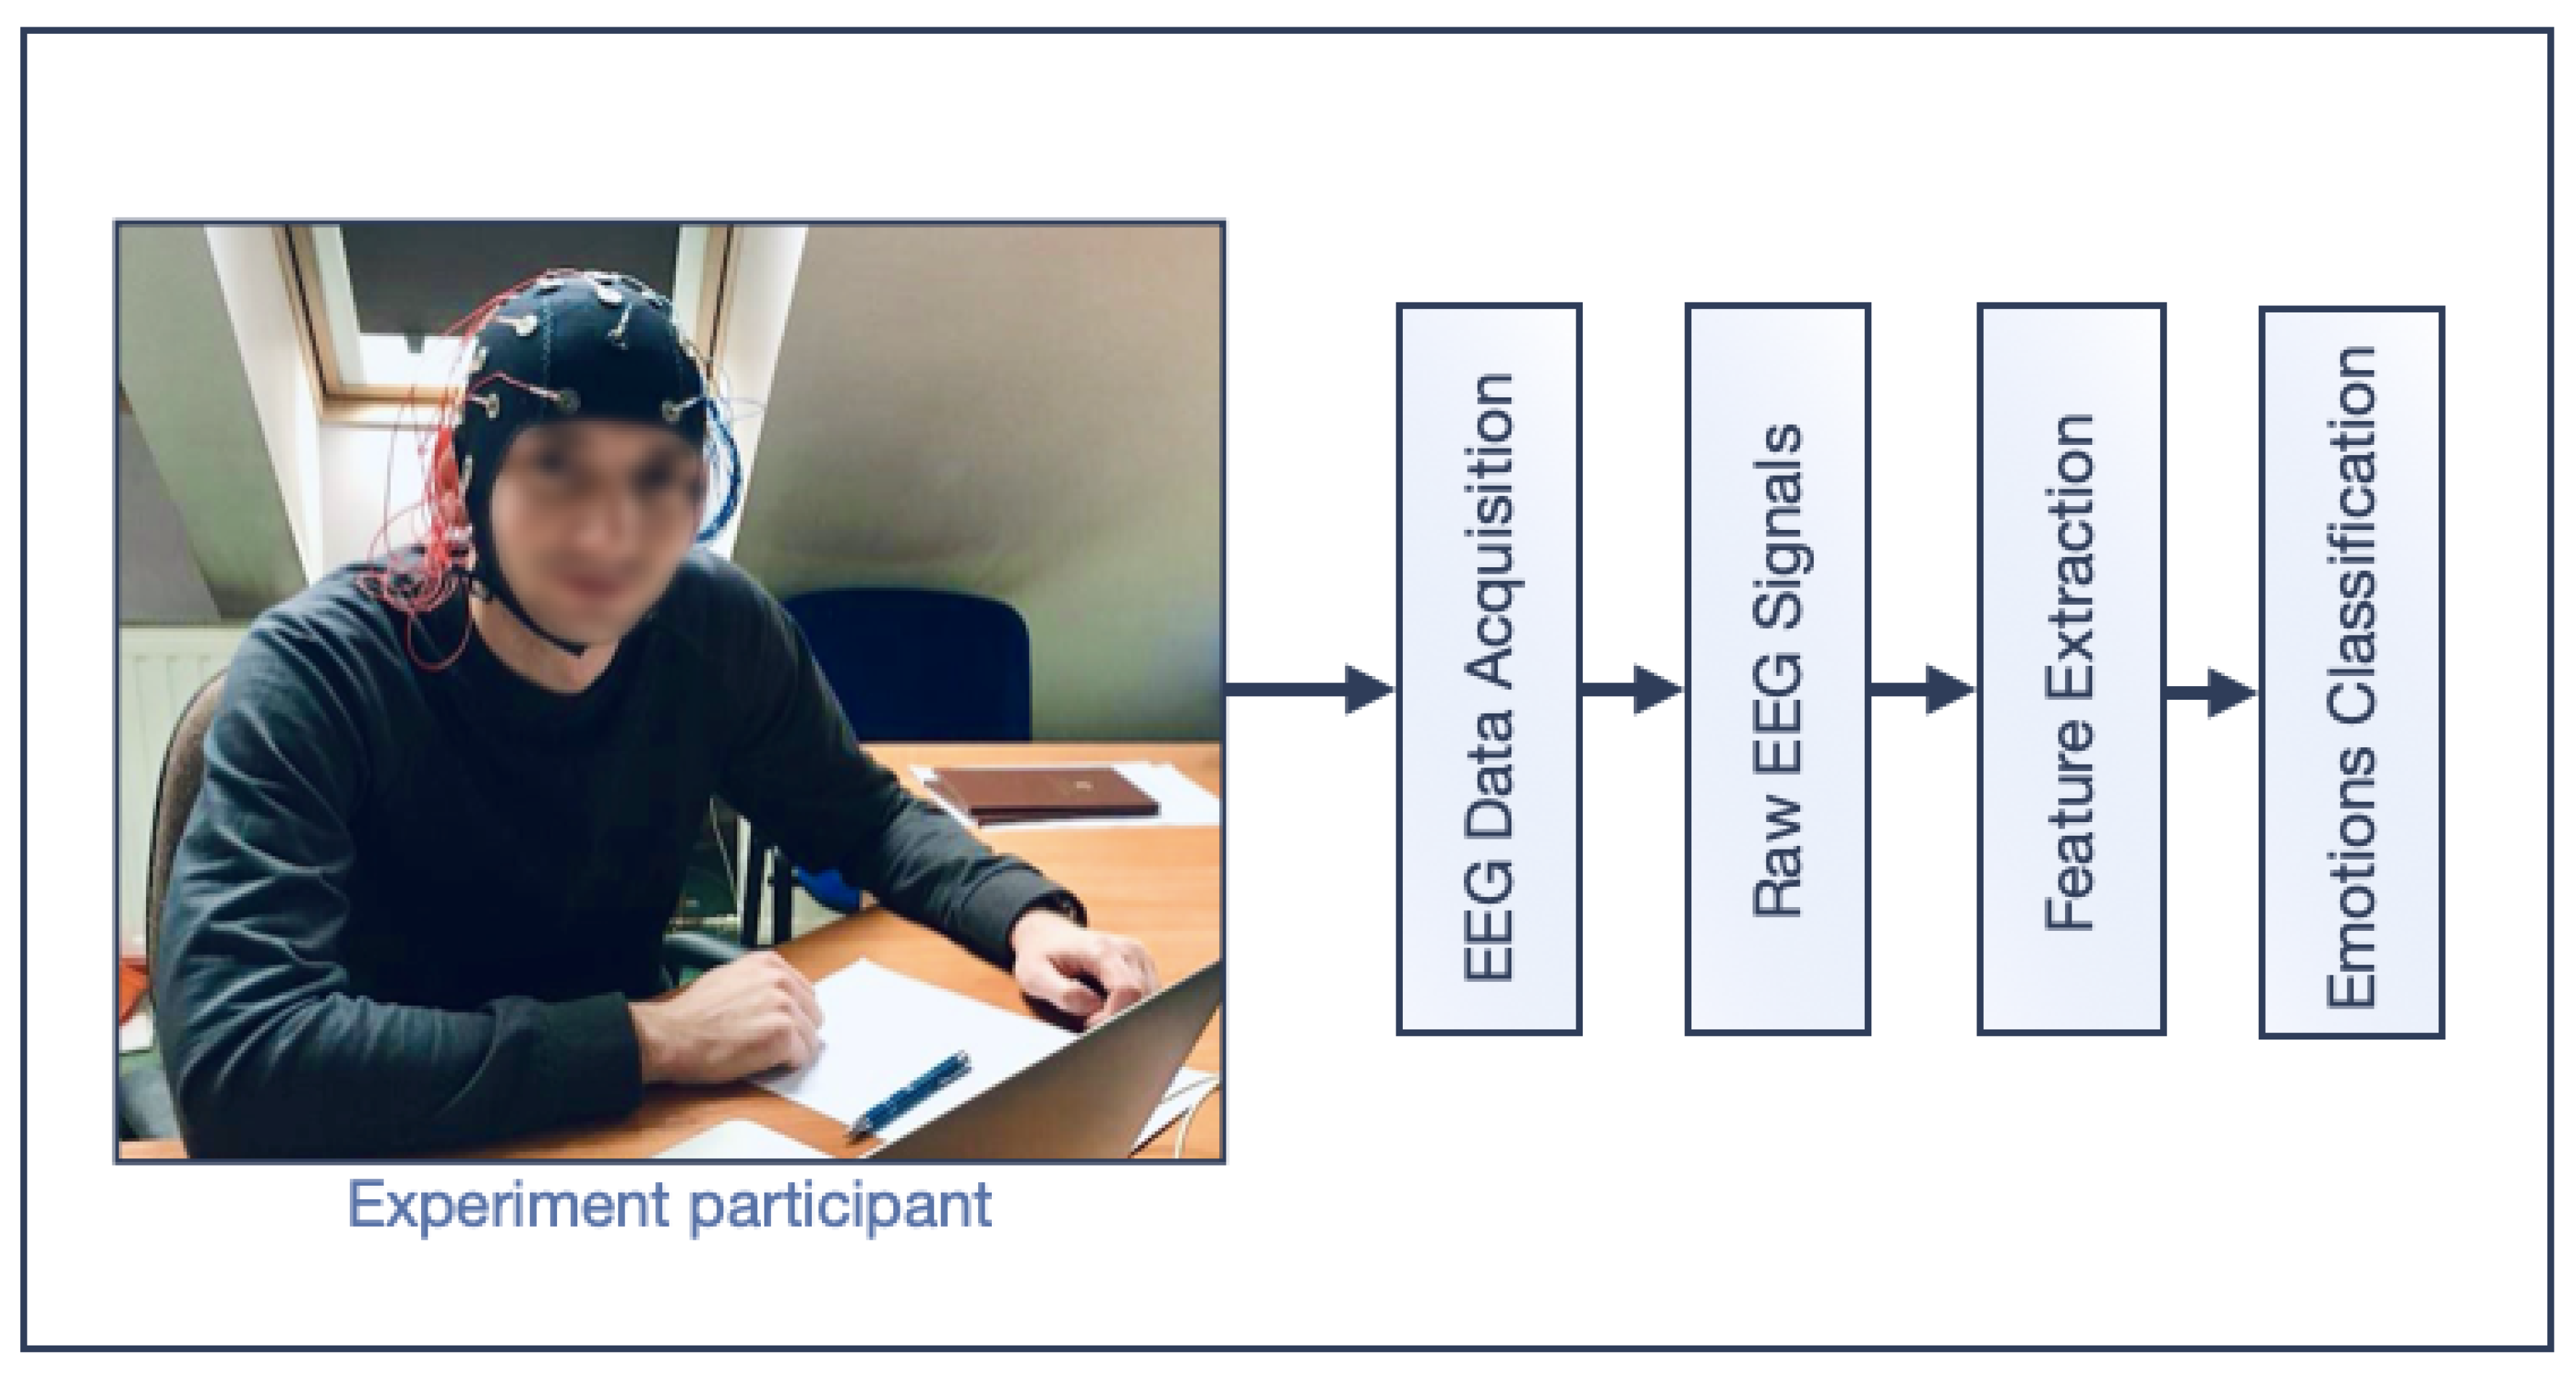
2.1. Carried out Experiments

For this study’s purposes, a series of experiments was carried out and will be in detail presented in further part of this work. Key information regarding patients was taken into account such as age, gender, physical, and mental condition [25]. The purpose of the experiment was to examine the influence of ambient music—an audio stimulation, during logical task performance—simply ERP visual task—word search. The authors prepared three scenarios in order to test the impact of selected sounds on the examined group:
  • without an audio stimulation,
  • with distracting sounds, and
  • with concentration stimulating sounds.
Each of the three tasks was preceded by the ambient sounds of nature due to the expected relaxing/calm state before the next phase. For each test stimuli was shown to the patient at the same time, while the EEG data was recorded. A detailed scenario is described in the Table 1.
Classifications of cognitive and emotional states based on bio-signals have been analyzed in many scientific papers, in particular regarding analysis of EEG data (see, inter alia, in [11,47,48]) and is planned to be expanded in future work of authors of the hereof paper.
There are many different types of devices, which enable recording of EEG signals and brain activities. These devices differ in their design, price, and availability, but mainly in the type of applied and the number of electrodes they have [2,11]. It is also medically proven that different parts of the brain are responsible for controlling specific activities, actions, or mental states [2,15].
The experiments were carried out in the laboratory environment. The stimuli view was displayed on an LCD monitor (19-inch, BENQ) with a 60 Hz refreshing rate. Stereo headphones (JBL) were used and the sound volume was set at a fixed and comfortable level. The participants watched and listened to 30 min of audio-video material. The workstation is shown in Figure 3. The experiment lasted for approximately 50 min including 20 min for Emotiv Flex setup, in accordance with the scenario presented in Table 1.
During the experiment, patients were doing logical exercises, such as easy crosswords. The purpose of this test, prepared by authors, was to trigger the patient’s concentration. It was also attempted to check the accuracy of the solved test. Ten participants (2 females; 8 males) with an age average of 34.8 (from 22 to 48 years) participated in the experiment as volunteers. All of them fulfilled following exclusion criteria:
  • report of any physical or mental health problems,
  • use any medication, and
  • problems with sleep.
The participants were among the members of research team and have given their oral and written consents to take part in this study, see Table 2):
  • age,
  • gender,
  • drugs taken, and
  • their current mood (mental condition) in 0 to 10 scale.

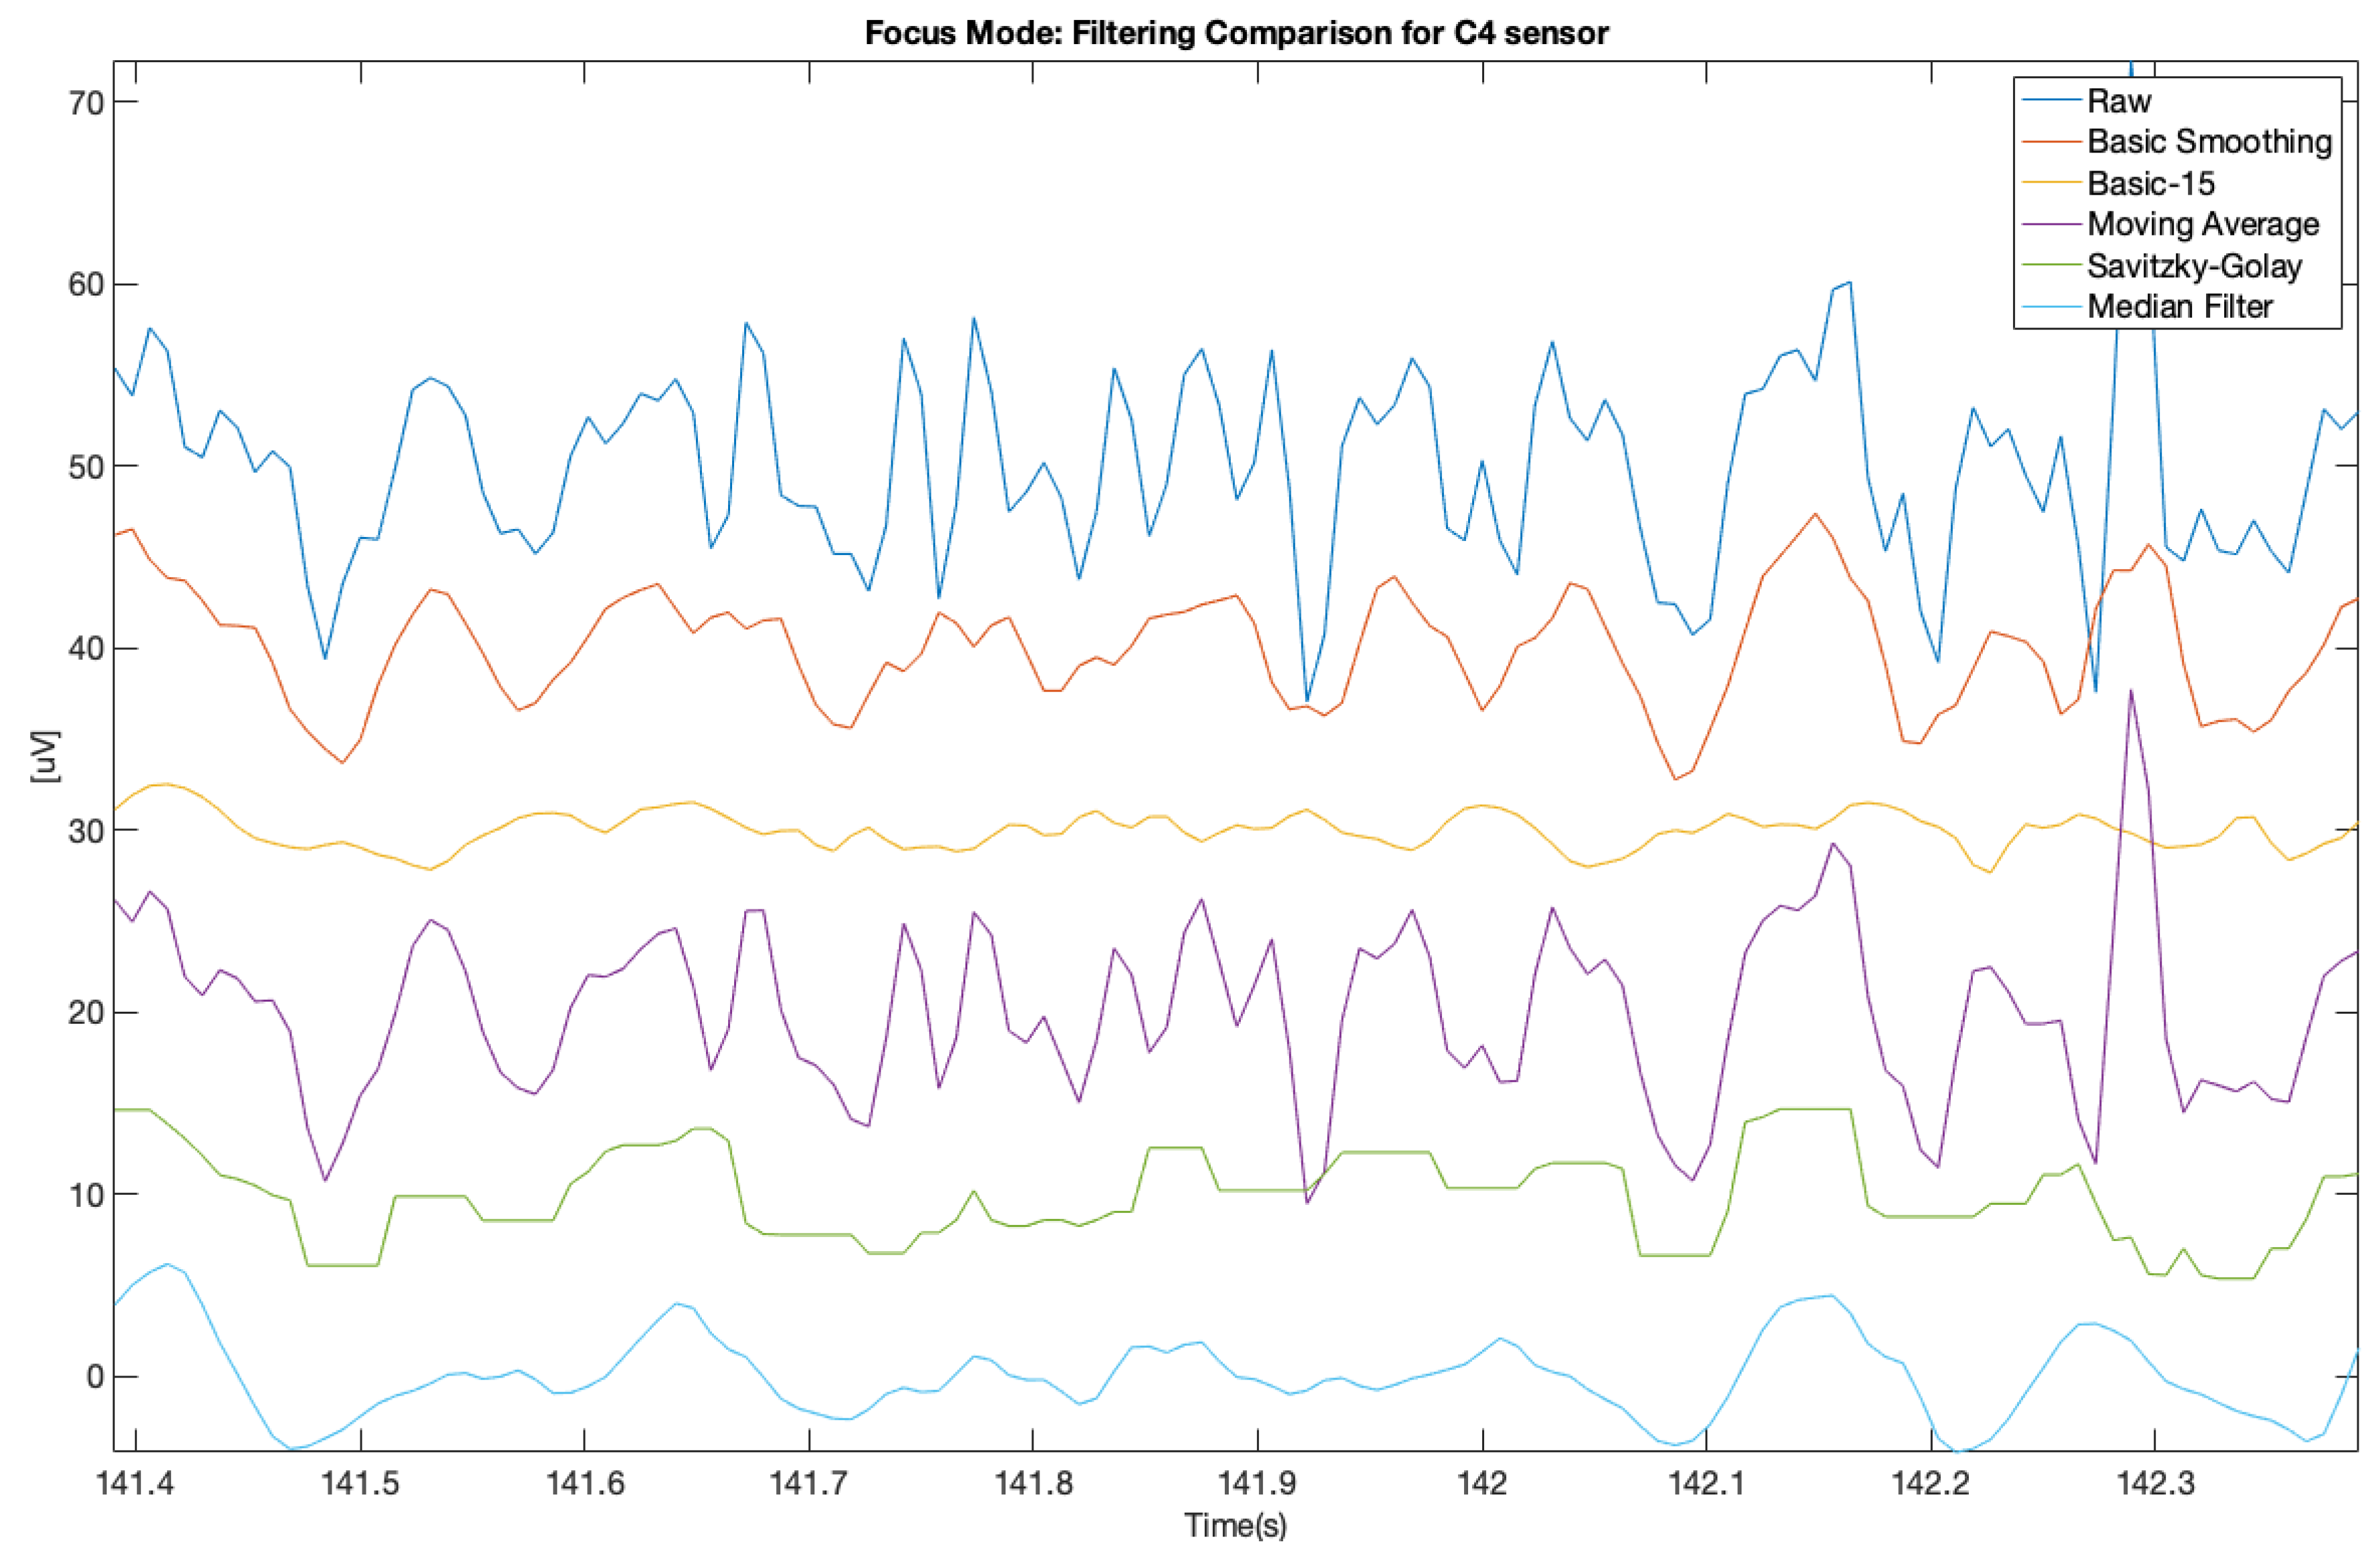
2.2. Performed Data Analysis

As it was mentioned above, the study was carried out with the participation of ten healthy volunteers in accordance with the scheme illustrated with the Figure 4.
In order to make the obtained data more legible the authors decided to apply and compare various smoothing filters. As the data is initially preprocessed by the device itself (0.5–45 Hz, 5-th order Sinc filter) it was very challenging to choose appropriate filters, as the data for analysis did not contain full information. It was not raw, clinical-level data. Due to the blinking artifact, the data was filtered with a high-pass 4-th order Butterworth filter, with the cut-off frequency of 4 Hz. The very first step involved baseline removal [49]. For this study’s purposes, various smoothing filters were applied at the initial stage in order to improve the quality of the analyzed data. As the data have already been preprocessed during recording, they did not contain full information.
The whole signal processing procedure was carried out in Matlab 2017b software (Curve Fitting Toolbox, Signal Processing Toolbox, DSP System Toolbox) from MathWorks (Natick, MA, USA). The analyzed data were recorded from the six following locations: F 3 , F 4 , C 3 , C 4 , P 3 , and P 4 , which represent the following locations of the brain: “frontal”, “central”, and “peripheral”, which were chosen by the authors of this work based on their wide research experience as the most optimal for this study purposes.
Based on authors’ previous experience with clinical data and smoothing filtering, which was in detail described in [10], it was attempted to apply similar filters (same parameters) but on data that did not contain full information (as it was mentioned above). Smoothing filtering has a wide applicability in analysis of EEG data, which can be seen in [11,50,51,52,53,54]. The authors of this work applied five different smoothing filters, including the following [10]:
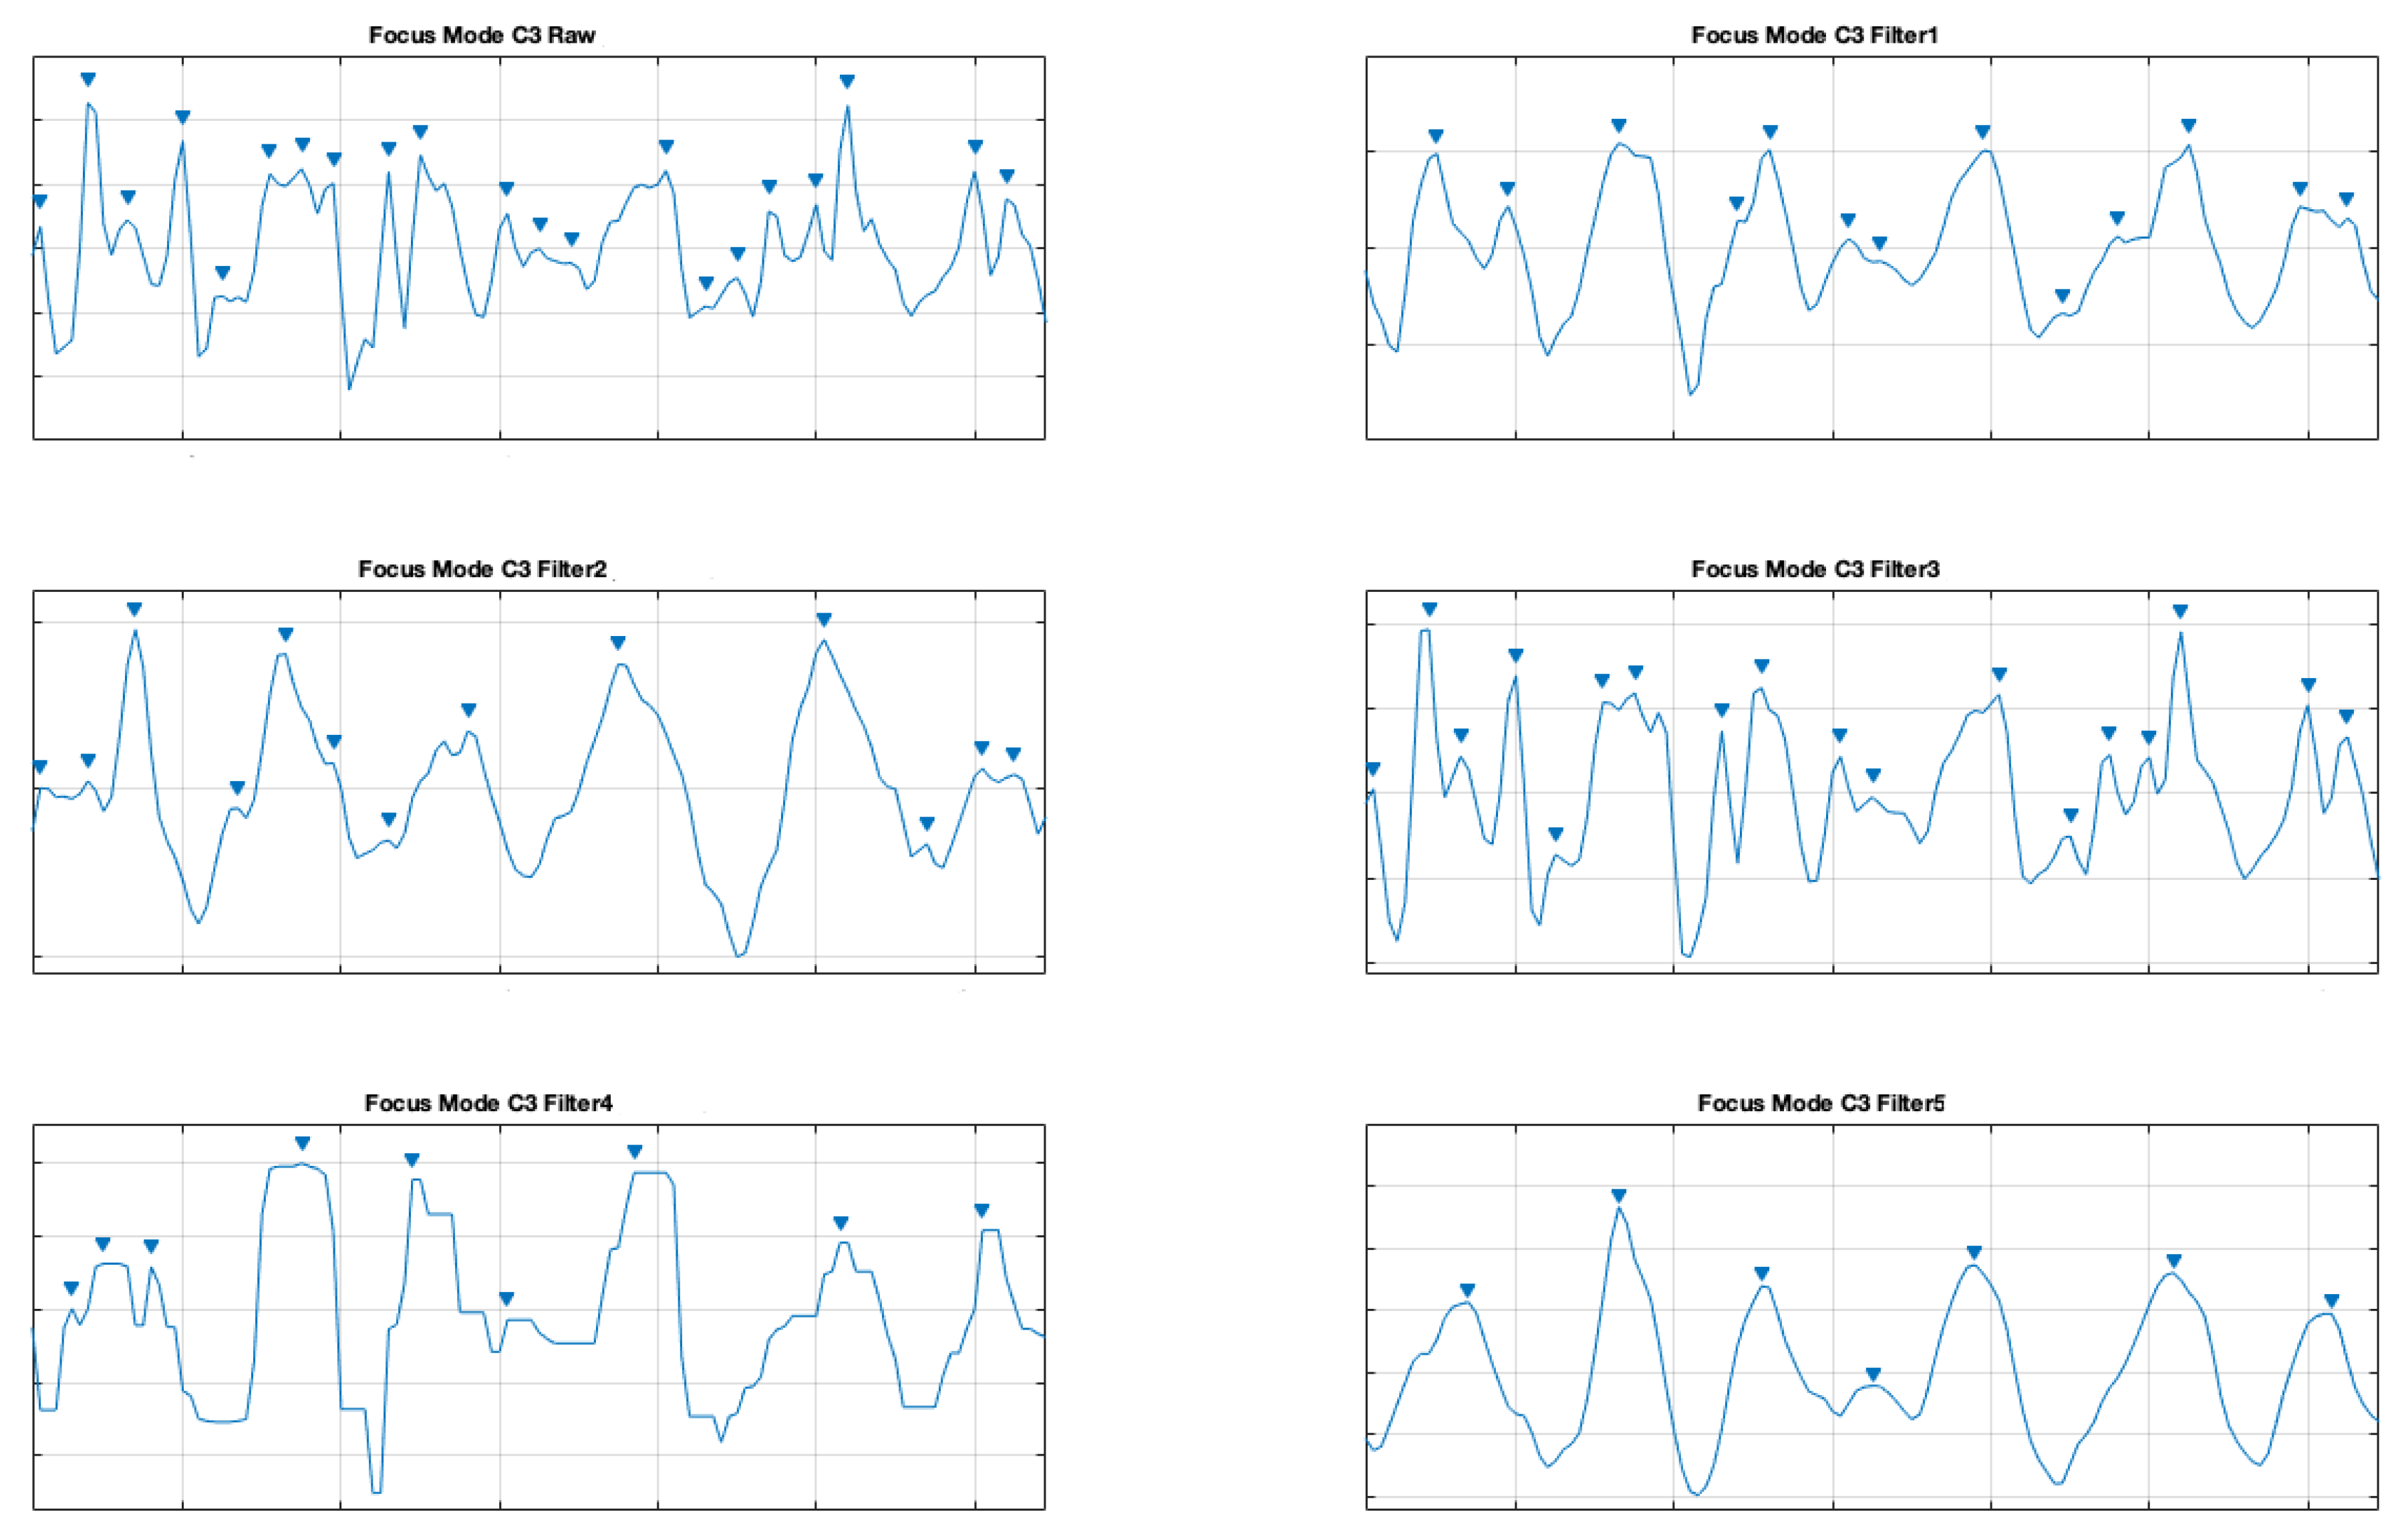
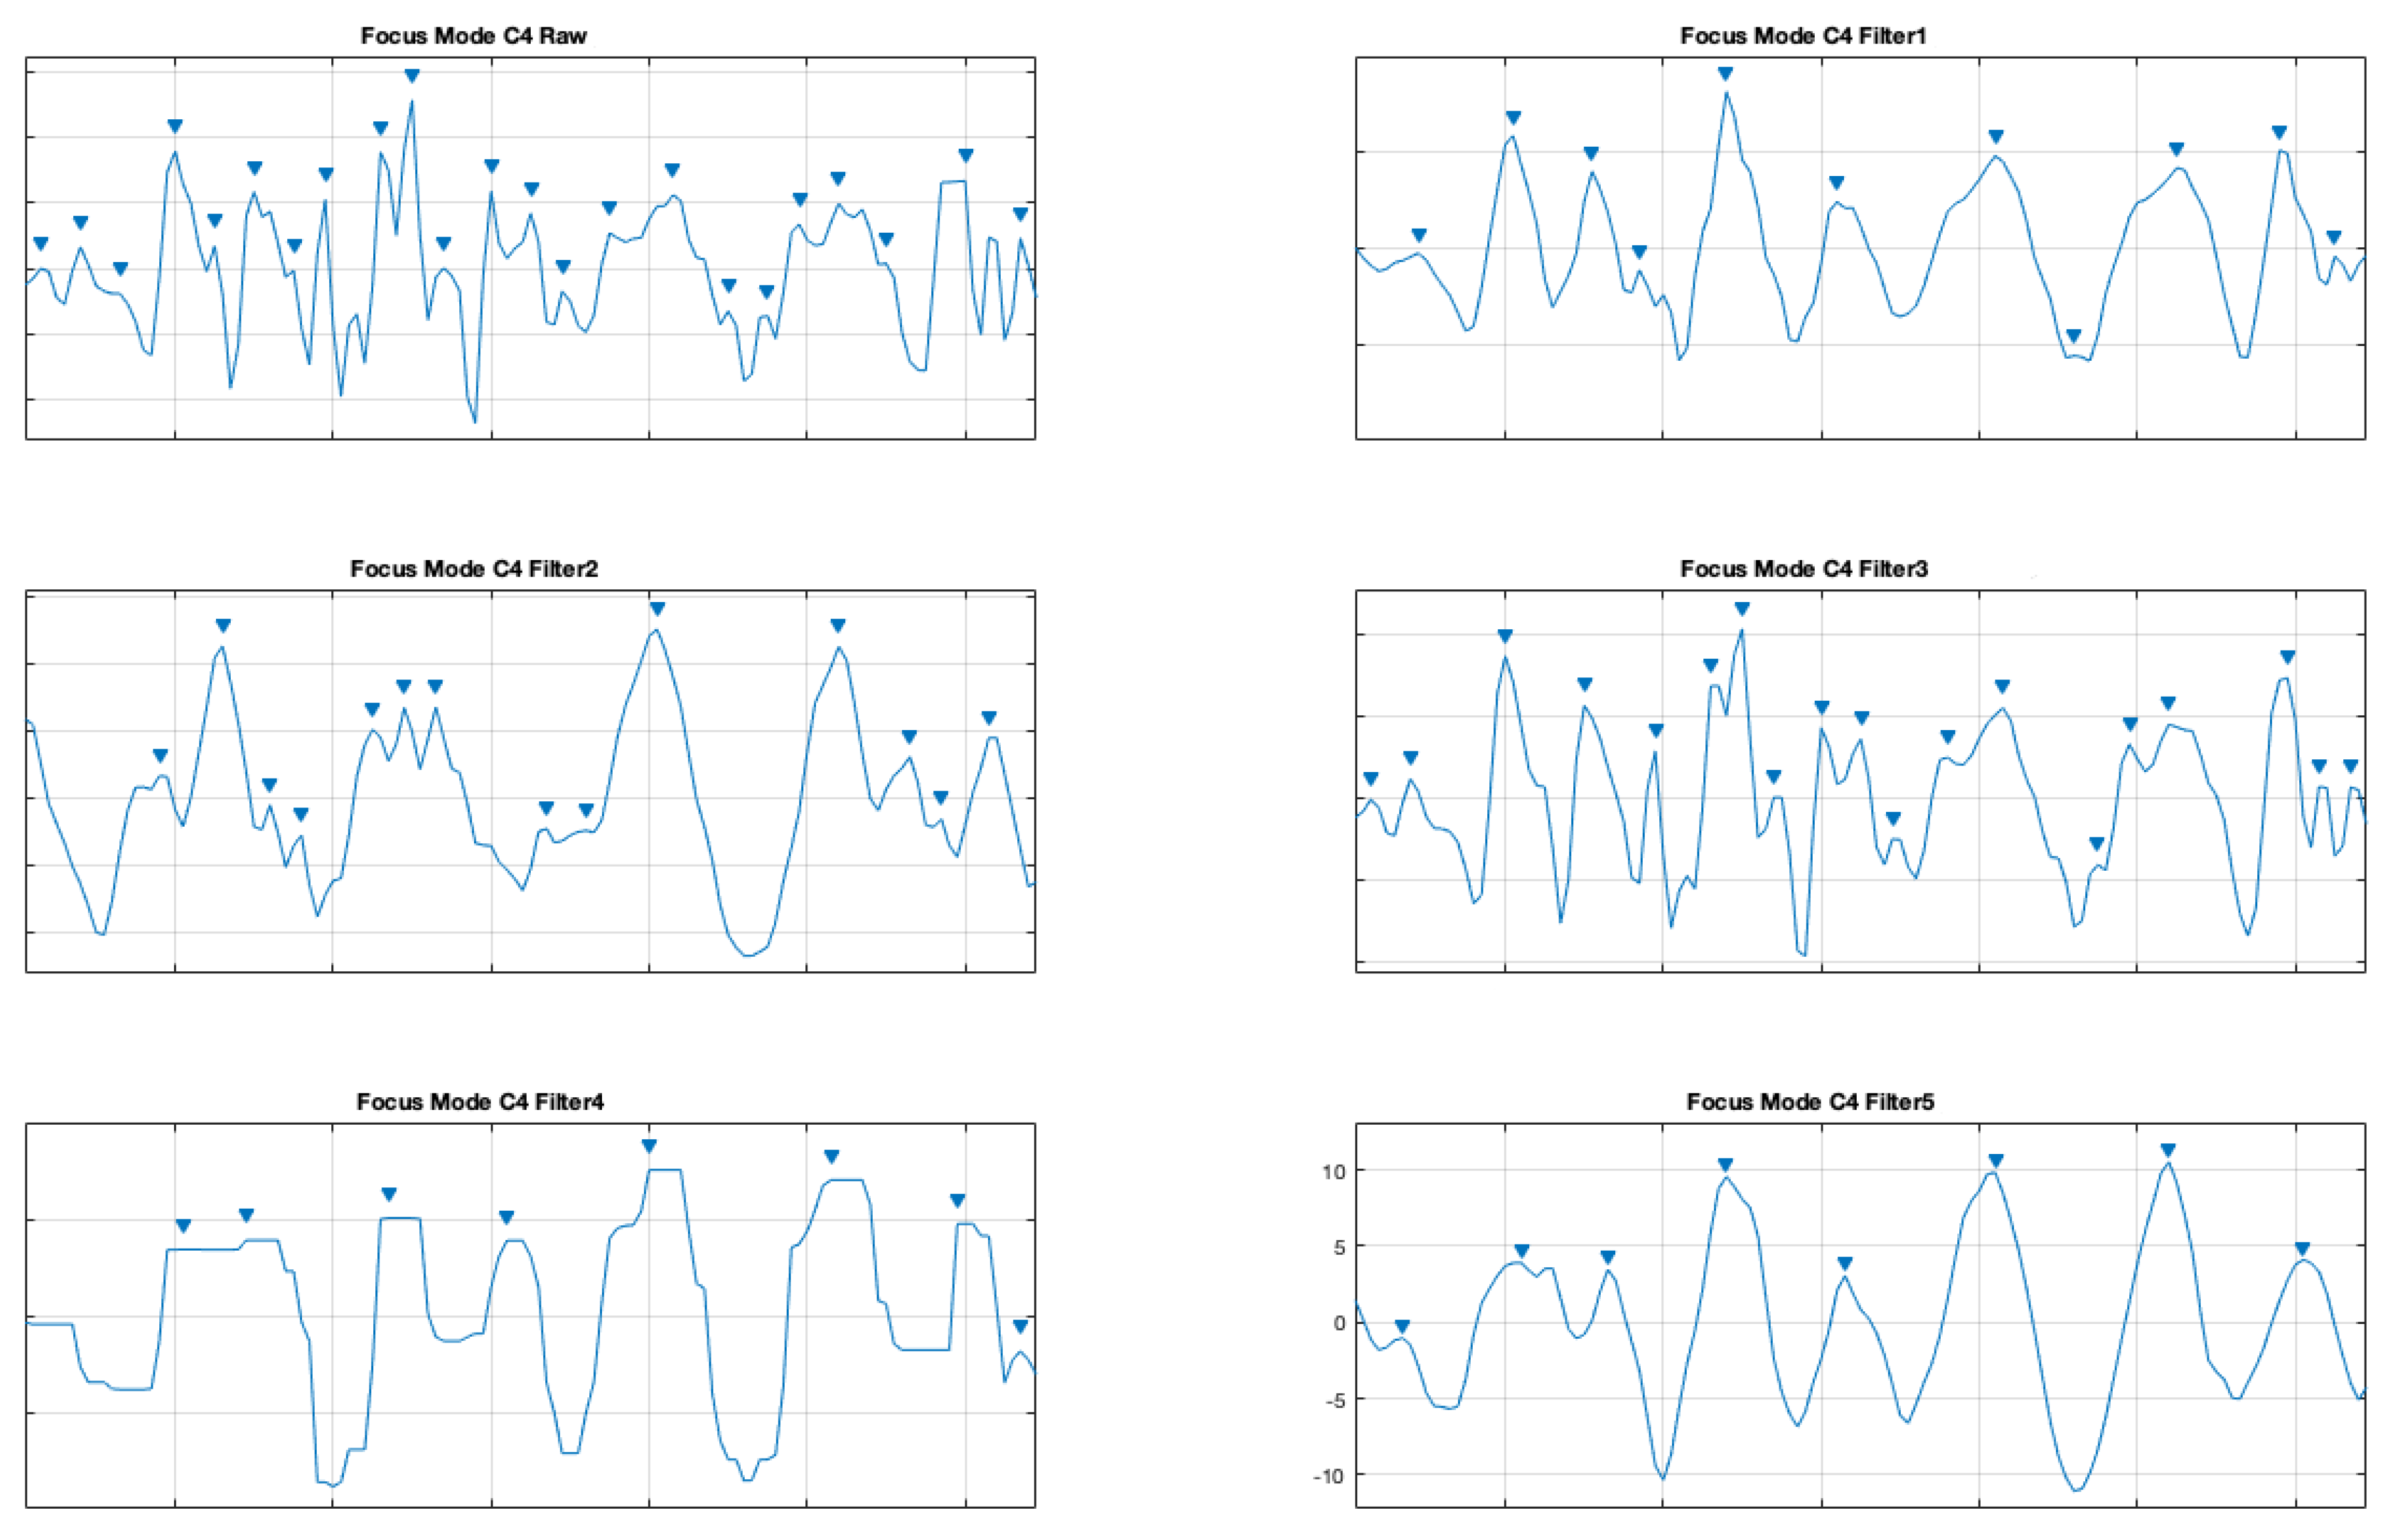
  • Filter 1—classic moving average “smooth” filter with defined by default smoothing parameter (span) set to 5,
  • Filter 2—classic moving average “smooth” filter with defined smoothing parameter (span) set to 15,
  • Filter 3—classic moving average “smooth” filter of the 2nd order, which uses Savitzky–Golay filter as a method,
  • Filter 4—9th order one-dimensional median filter,
  • Filter 5—Savitzky–Golay FIR smoothing filter of the 4th order and 27 frame length.
As it was described in detail in [10] the “smooth” filter is a classic moving average filter, which works in a way that it replaces each data point with the average of the neighbor data points. Its work is similar to the low-pass filtering [10,35]. Moreover, it smooths the data in the column vector y using a moving average filter. Results are returned in the column vector yy, as shown with the (1) and (2). The default span for the moving average, as it was mentioned above, is 5 (for Filter 1) and the defined one (for Filter 2–15).
y y = s m o o t h ( y ) ;
Furthermore, the first few elements of the above mentioned y y can be given by
y y ( 1 ) = y ( 1 ) y y ( 2 ) = ( y ( 1 ) + y ( 2 ) + y ( 3 ) ) / 3 y y ( 3 ) = ( y ( 1 ) + y ( 2 ) + y ( 3 ) + y ( 4 ) + y ( 5 ) ) / 5 y y ( 4 ) = ( y ( 2 ) + y ( 3 ) + y ( 4 ) + y ( 5 ) + y ( 6 ) ) / 5
The applied Filter 3 is also a moving average filter, however, this time its coefficients were determined with an unweighted linear least-squares regression and a polynomial model of specified degree, which is default 2. It is the simplest Savitzky–Golay filter.
The median filter, which was applied as Filter 4 is a nonlinear, one-dimensional filter, where the mean value of a sequence (of values in the ascending order of data) of the processed point and its surroundings is measured. The output signal consists of the individual median values of all the windows applied. The chosen order of the filter was 9 [10,55].
The last one tested filter (Filter 5) was Savitzky–Golay filter, which is a least-square digital polynomial filter, which smooths the fluctuations and increases the signal–noise ratio (SNR) without significantly distorting the data [10,56]. It is a Finite Impulse Response (FIR) filter, where its order must be less than frame length ( b = s g o l a y ( o r d e r , f r a m e l e n ) ). In the case of (3)
o r d e r = f r a m e l e n 1
no smoothing is carried out. The applied parameters for the Filter 5 were as follows [10],
  • order: 4th and
  • frame length (framelen): 27.
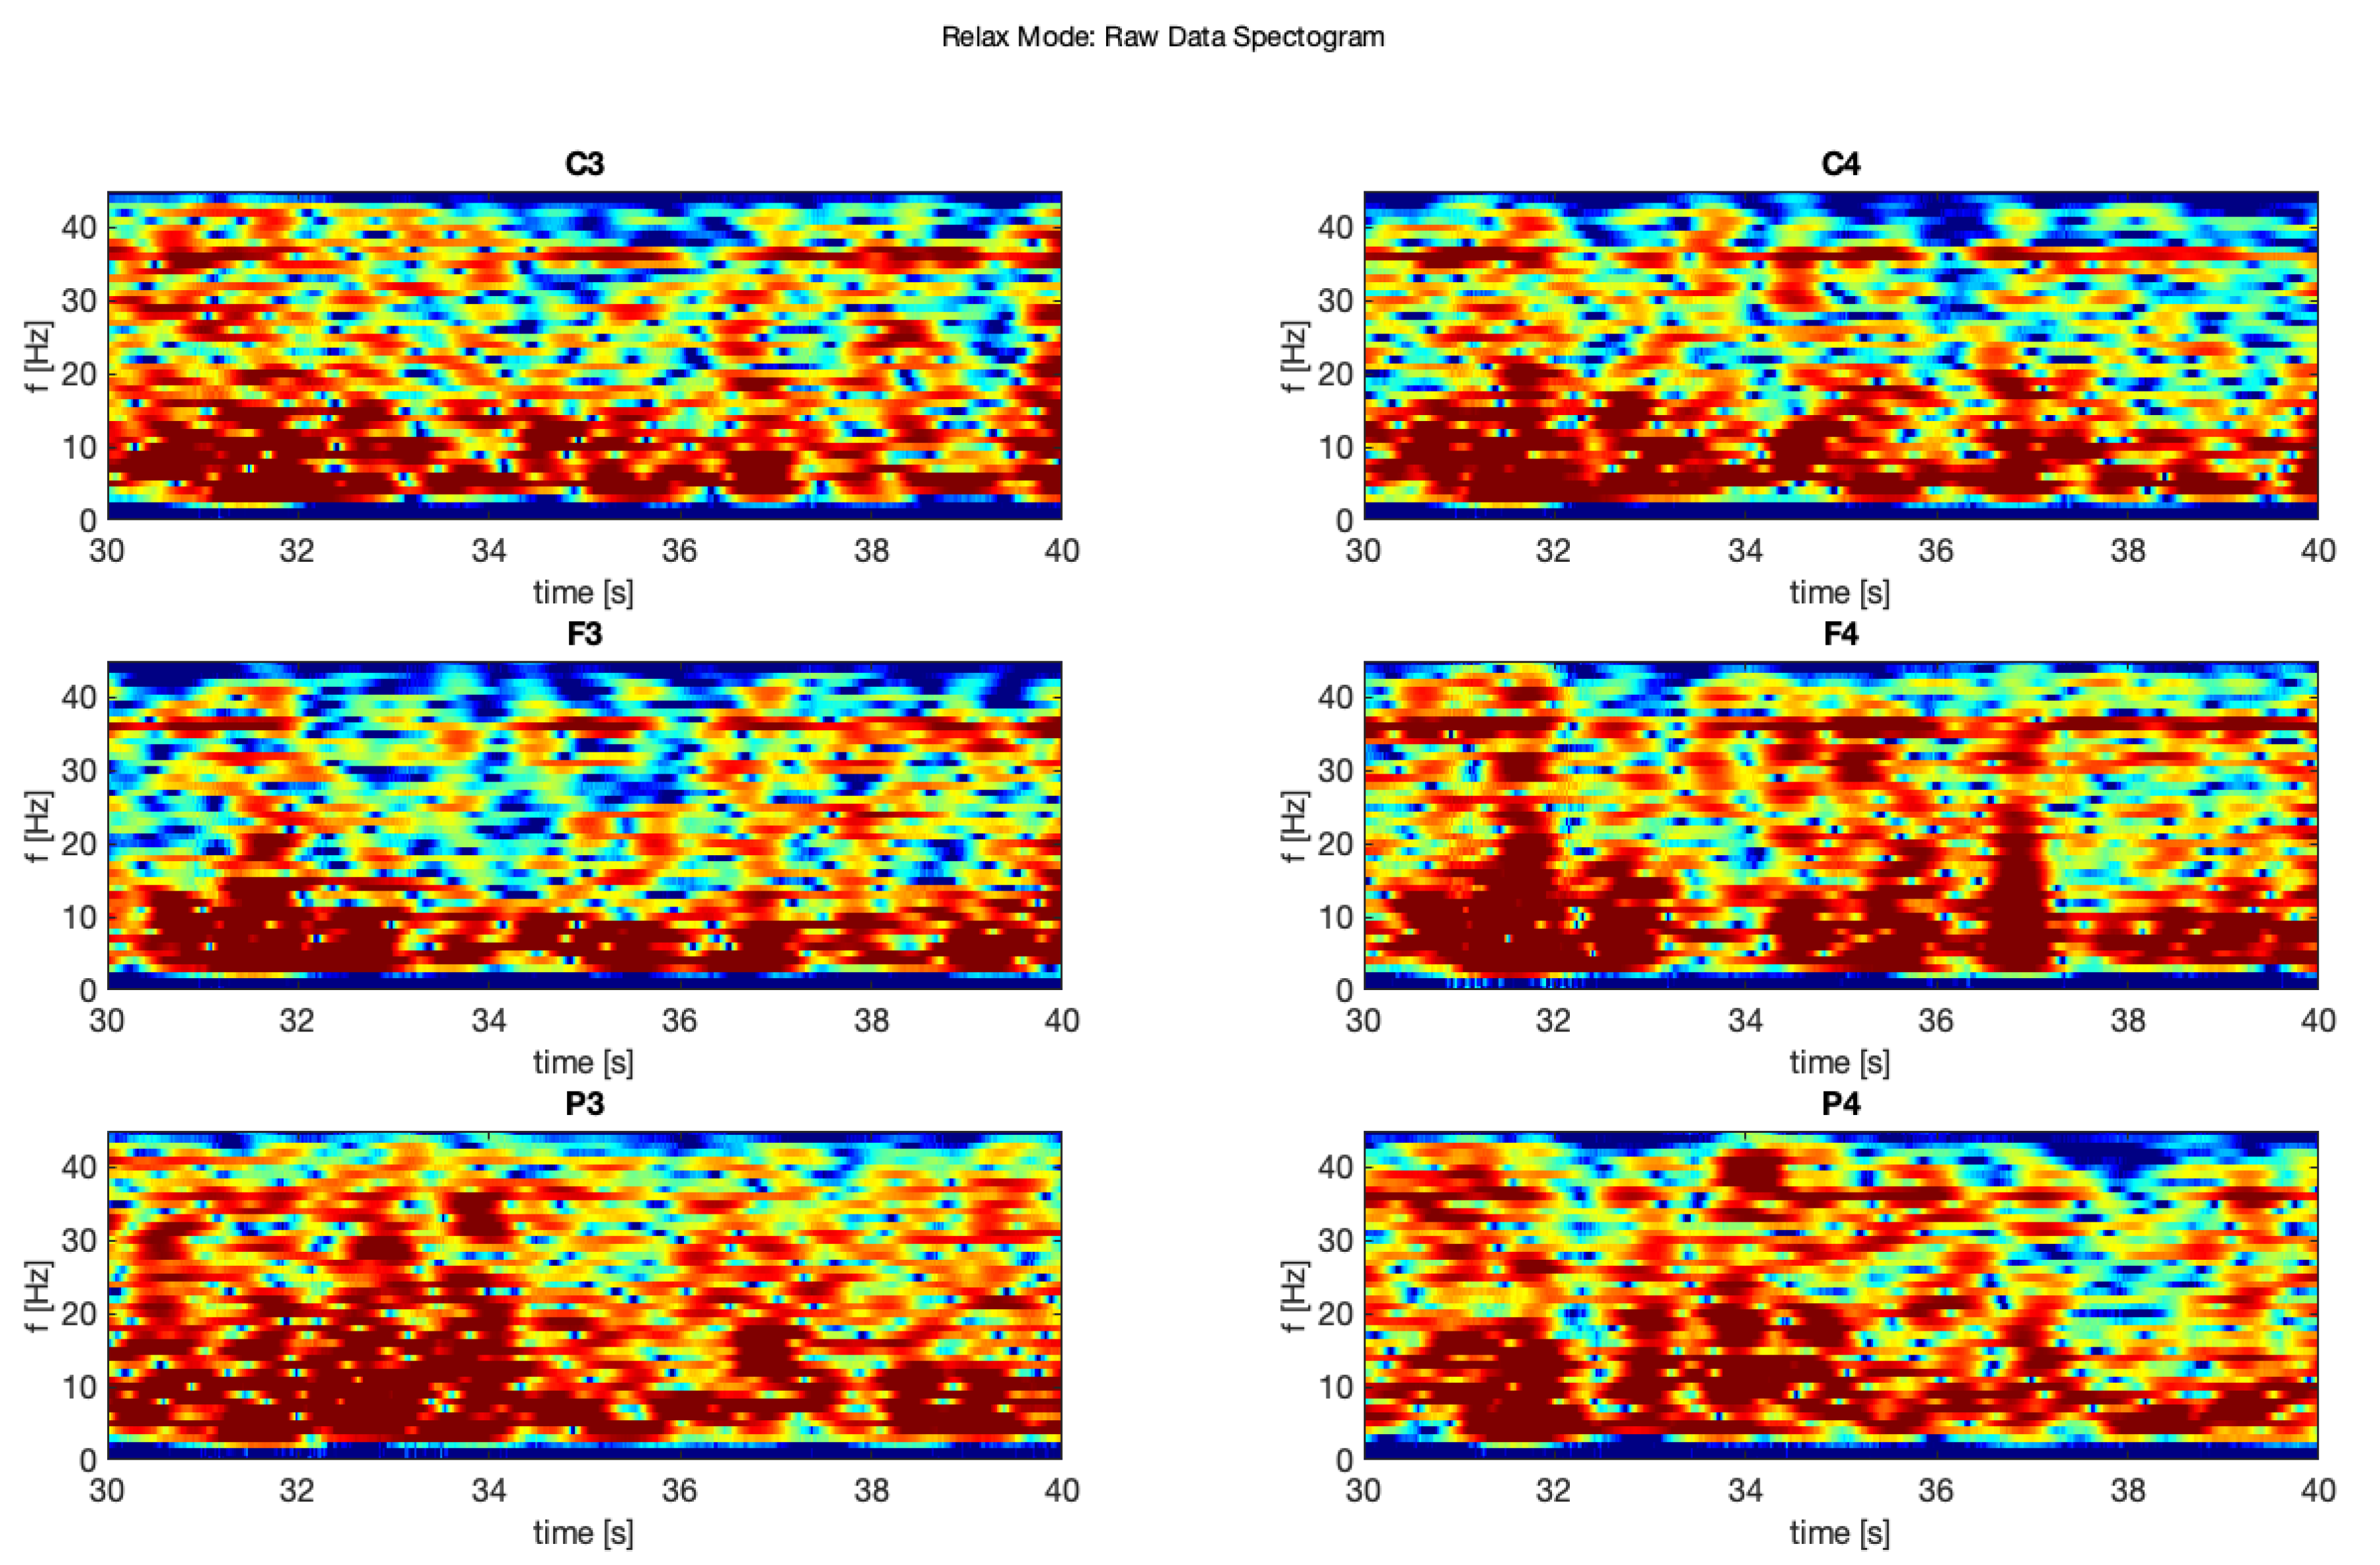
3. Results

In this study, we chose two signal samples in order to perform further analysis. The first sample (Figure 5 shows raw signal recorded during relax mode for each of the applied six electrodes F3, F4, C3, C4, P3, and P4), where it is possible to see clear “alpha” wave on the 1 s sample.
The next phase of this experiment involved focusing on mental tasks when 14 Hz stimulating sound was applied. In Figure 6, it is possible to observe in the data from the same subject, recorded during this phase, significant density of the brainwaves, which corresponds with the higher cognitive brain functioning and with clearly visible “beta” waves. The frequency of the above mentioned 14 Hz audio stimulation was chosen to force the brain to work in the beta range of the lower low-beta band (12–15 Hz). It was also the lowest limit frequency of the audio path of the applied sound-set.
In order to improve the data quality, we applied various smoothing filters, which were also applied in another study [10] (on different types of data from a clinical setting). The applied filters were also described above. The presented samples are for the electrodes C3 and C4, which represents central location on the scalp. The Figure 7 and Figure 8 show a comparison of the raw signal and the five applied smoothing filters for the relax mode.
The same was done for the electrodes C3 and C4 for the focus mode (see Figure 9 and Figure 10).
It is clearly visible that the 3rd filter (moving average) is the proper one for this purpose, unlike in [10]. Other filters removed too much crucial information from these samples and flattered the characteristic “peaks” in the EEG signal. Similar situation is visible at 10 s sample on spectrograms (Figure 11, Figure 12, Figure 13, Figure 14, Figure 15 and Figure 16). At first it was presented in Figure 11 and Figure 12.
Below was presented a comparison of raw signal and five smoothing filters (see Figure 13 and Figure 14) for electrodes C3 and C4 recorded during relax mode.
Moreover, the same comparison for the electrodes C3 and C4 for the focus mode (Figure 15 and Figure 16).
Due to the fact that visual estimation of signal filtering quality is insufficient, the authors have decided to implement the filtering efficiency rating criteria based on pointing characteristic “peaks” of the EEG signal.
The digital input signal, sample by sample, was sent to the First In First Out (FIFO) queue, in which the values of the three consecutive samples with the numbers 1, 2, and 3 were compared. In case the value of sample 2 is greater than the value of samples 1 and 3, the time instant at which the sample 2 occurred is remembered as the time of the new peak occurrence and the value of sample 2 becomes new peak provided that the time interval between the current peak and the previous peak satisfies the frequency condition. The frequency condition is defined by the sampling frequency of the analyzed signal fs and the upper cut-off frequency of the band of the recorded EEG signal—fg. The signal sampling frequency was 128 Hz and the upper limit frequency of the signal band was 30 Hz. The frequency condition here defines the minimum distance expressed in samples between the recorded peaks on the basis of the relationship: (4). All analyzed EEG wave-forms were tested on the basis of the presented algorithm.
w = r o u n d f s f g 1 = r o u n d 128 Hz 30 Hz = 3
Figure 17, Figure 18, Figure 19 and Figure 20 (same—1 s samples as on Figure 7, Figure 8, Figure 9 and Figure 10) was shown visually how this script works. This method also confirms that moving average filter (Filter 3) gave the best results.
In order to make the obtained results more reliable, we decided to compare the same 10 s samples as those illustrated with the spectrograms (Figure 13, Figure 14, Figure 15 and Figure 16) both for relax and focus modes for channels C3 and C4 and counted every “peak” on this signal samples for raw and filtered signals.
For this purpose, the below Equation (5) can be applied,
F e a t u r e C o v e r a g e = P e a k s F i l t e r e d S i g n a l P e a k s R a w S i g n a l 100 %
Results of this filter comparison were shown on bar graphs illustrated with the Figure 21.
This study confirms the best compatibility of applying moving average filter (Filter 3) with average peak coverage for every sample—91.14%. Second best result achieved basic smoothing filter (Filter 1)—65.16% and the third was Filter 2 with the score of 64.92% of feature coverage. The Filter 5 gained 48.42% and Filter 4 gave the worse result of 43.06% as shown in Table 3.

4. Discussion

The data were recorded with the Emotiv EPOC Flex EEG headset and the sampling rate was only 128 Hz. It is typical for all Emotiv products to generate “spikes” visible in the time-domain figures. It also happened during previous studies on data recorded with the implementation of Emotiv EPOC EEG [9,15]. This was also a reason for decision on using smoothing filtering. Due to the fact that the data has already been pre-processed during recording—it did not contain full information.
One of the key factors leading the authors to this research was is the great popularity of the Emotiv EPOC Flex headset (as well as other “consumer-grade” products) among young researchers, which tend to believe that the acquired signal is reliable. There is not only a need to remind them that the signal is already preprocessed when they believe it is “raw” data, but also remind them that this equipment does not offer “clinical quality” EEG data [57,58,59].
The filters applied in this work seem to be basic, but they are not only off-the-shelf filters. All the filters were chosen carefully, their parameters were thoroughly adjusted after performance of numerous studies (see in [10,60] and tests. Implementation of similar (but not the same) smoothing filters for the purpose of analysis of biomedical data can be found in inter alia the following positions (which are very recent) [61,62,63,64]. A little bit similar study, where only Savitzky–Golay filters (but with different parameters) were applied was described in [65], but no other smoothing filters were neither applied nor compared. It is because in most of the literature positions comparison of various types of smoothing filters is not present and they focus mainly on one filter type, at most—Savitzky-Golay. Furthermore, the choice of filtering parameters (window and frame) differs from the one used by the authors of this work.
Previous studies of some of the authors of this work (see in [10]) proved that using smoothing filters can significantly improve the legibility of the analyzed data and the most promising results were obtained while using Savitzky–Golay filters. In this case, however, the best results are obtained using moving average (Filter 3), where the coverage spikes accuracy was 91.14%. It is probably because of the data quality and applied equipment (Emotiv EPOC Flex), which is less precised than clinical appliances.
It is also important to state that processing EEG data acquired with two different hardware devices (clinical- and consumer-grade) can lead to different results. For this reason the authors have investigated the application of smoothing filters to “clinical quality” EEG data in one publication (see in [10]), and for this study purposes they decided to investigate the application of smoothing filters to “consumer-grade” hardware-acquired EEG data. The authors’ intention was to pinpoint that the “consumer-grade” equipment should be considered separately, and the pursuit of the optimal smoothing filter for an application should be done wisely and while remembering that the “consumer-grade” equipment does not provide “real” raw data [58,66].
It is important to mention that the very first aim of this work was the acquisition of the applied data set to distinguish appropriate EEG signals’ features during audio stimulation tasks and then a comparison of 3 different mental states, depending on subjects’ alertness, affected with different ambiance sounds. We also wanted to develop a method for the “focus” state feature extraction using artificial intelligence algorithms; however, when starting the data preprocessing using smoothing filters applied in our previous analyses on EEG clinical data, the results were unsatisfactory. Thus, we realized that there is a significant difference between filtering the signal acquired using the high-quality clinical appliance and the one with the low-cost consumer-grade BCIs [10,67].
Based on our previous experiences and on the findings in this work, we have decided to carry out a comparison of smoothing filters on signals recorded from the Emotiv EPOC Flex device in order to make further signal analysis reliable and efficient. We have also decided to create a novel criteria method which compares the number of characteristic “peaks” in the analyzed EEG signal after filter application.

5. Conclusions and Future Work

To sum it all up, the thorough literature study did not find any papers regarding comparison of the smoothing filters (various types) the way this has been done in this paper. We were strongly motivated to find an efficient and useful smoothing filter (not only for processing medical-quality EEG data, but also for the data provided by a cheaper consumer-grade EEG hardware). We have evaluated some of the popular filtering approaches as well as we have included a smoothing filter implemented using the Savitzky–Golay filter. While the thorough literature study did not find any papers that would compare various types of smoothing filters for EEG data the way this has been done in this paper, we decided to share the results of this research. The comparison was presented within the paper and depicted in numerous easy-to-interpret figures. The novelty of the research presented in this paper and the proposed approach lies on
1.
the parameters of the filters chosen for good performance when using on EEG data and
2.
testing and comparison of various types of smoothing filters.
Issues discussed in this paper have great potential for further research, which is going to be thoroughly expanded in the near future. We are also working on a method for reducing EEG signal interference—shielding hardware, when using consumer-grade BCIs. Audio stimulation can have strong impact on the examined EEG signal. Those methods can also help to explain the role of cortico-subcortical loops not only in the perspective of physiological control of the majority of sensory-cognitive, emotional, and psycho-motor functions, but also in the explanation of mental disease pathophysiology and the brain structures of the mind [68].
Further research plans include study protocol improvement, which—based on authors’ experience—was too long and might have caused some frustrations among subjects participating in this study (see in [15]).
As of now, the evaluation of the tested methods is mostly based on authors’ expertise and long-time experience with bio-signals acquisition and processing, it is planned (and currently at the implementation stage) to apply expert methods based on policy-based computing (this also includes fuzzy logic reasoning) [69,70,71,72,73,74].
The next study will include simultaneous testing of patients’ attention using proper methods, such as the Wisconsin Card Sorting Test (WCST) [75], Iowa Gambling Task (IGT) [76], or Stroop Test [77]. For this reason it is necessary to involve some experienced medical professionals (e.g., psychiatrists) in order to discuss the obtained results.
Last but not least, we also would like to develop real-time systems based on noninvasive consumer-grade BCI devices. In this field, the application of the proper method for biomedical data filtering and processing will be necessary, as well as neural networks application—especially pattern recognition algorithms for mental state/emotion recognition. Thorough literature background is being carried out [78,79].

Author Contributions

Conceptualization, N.B., J.Z., and A.K.-S.; methodology, N.B., A.K.-S., M.P. (Mariusz Pelc), and J.Z.; software, N.B., A.K.-S., and J.Z.; validation, N.B., A.K.-S., M.P. (Michal Podpora), M.P., R.M., and J.Z.; formal analysis, N.B., A.K.-S., M.P. (Mariusz Pelc), R.M., and J.Z.; investigation, N.B., A.K.-S., M.P. (Mariusz Pelc), R.M., M.P. (Michal Podpora), and J.Z.; resources, N.B, A.K.-S., E.J.G., and J.Z.; data curation, N.B., A.K.-S., and E.J.G.; writing—original draft preparation, N.B., M.P. (Mariusz Pelc), A.K.-S., M.P. (Michal Podpora), and J.Z.; writing—review and editing, N.B., A.K.-S., M.P. (Michal Podpora), M.P. (Mariusz Pelc), R.M., E.J.G., and J.Z.; visualization, N.B., A.K.-S., M.P. (Michal Podpora), M.P., and J.Z.; supervision, N.B., A.K.-S., E.J.G., M.P., and J.Z.; project administration, N.B., A.K.-S., and J.Z.; funding acquisition, A.K.-S., R.M., and J.Z. All authors have read and agreed to the published version of the manuscript.

Funding

This paper was partially supported by the Ministry of Education of the Czech Republic (Project No. SP2020/156).

Institutional Review Board Statement

The study was conducted according to the guidelines of the Declaration of Helsinki, and approved by the Bioethics Committee of the Nicolaus Copernicus University in Torun—Collegium Medicum in Bydgoszcz, Poland (protocol code no. KB 416/2008, from the 17 September 2008, valid till 31 December 2020).

Informed Consent Statement

Informed consent was obtained from all subjects involved in the study.

Data Availability Statement

Data available upon request.

Conflicts of Interest

The authors declare no conflict of interest.

Abbreviations

The following abbreviations are used in this manuscript:
BCIBrain–Computer Interfaces
EEGelectroencephalography
DSPdigital signal processing
CNScentral nervous system
S-GSavitzky–Golay filter
WCSTWisconsin Card Sorting Test
IGTIowa Gambling Task
FIFOFirst In, First Out

References

  1. Jebelli, H.; Hwang, S.; Lee, S. EEG signal-processing framework to obtain high-quality brain waves from an off-the-shelf wearable EEG device. J. Comput. Civ. Eng. 2018, 32, 04017070. [Google Scholar] [CrossRef]
  2. Al-Shargie, F.; Kiguchi, M.; Badruddin, N.; Dass, S.C.; Hani, A.F.M.; Tang, T.B. Mental stress assessment using simultaneous measurement of EEG and fNIRS. Biomed. Opt. Express 2016, 7, 3882–3898. [Google Scholar] [CrossRef] [PubMed] [Green Version]
  3. Kaur, B.; Singh, D.; Roy, P.P. EEG based emotion classification mechanism in BCI. Procedia Comput. Sci. 2018, 132, 752–758. [Google Scholar] [CrossRef]
  4. Jatupaiboon, N.; Pan-ngum, S.; Israsena, P. Real-time EEG-based happiness detection system. Sci. World J. 2013, 2013, 618649. [Google Scholar] [CrossRef] [PubMed]
  5. Al-Shargie, F.; Tang, T.B.; Badruddin, N.; Kiguchi, M. Towards multilevel mental stress assessment using SVM with ECOC: An EEG approach. Med. Biol. Eng. Comput. 2018, 56, 125–136. [Google Scholar]
  6. Namazi, H. Information-Based Classification of Electroencephalography (EEG) Signals for Healthy Adolescents and Adolescents with Symptoms of Schizophrenia. Fluct. Noise Lett. 2020, 2050033. [Google Scholar] [CrossRef]
  7. Emotiv. Emotiv Flex Website. 2020. Available online: https://www.emotiv.com/epoc-flex (accessed on 28 October 2020).
  8. Sawangjai, P.; Hompoonsup, S.; Leelaarporn, P.; Kongwudhikunakorn, S.; Wilaiprasitporn, T. Consumer grade EEG Measuring Sensors as Research Tools: A Review. IEEE Sens. J. 2019, 20, 3996–4024. [Google Scholar] [CrossRef]
  9. Kawala-Janik, A.; Pelc, M.; Podpora, M. Method for EEG signals pattern recognition in embedded systems. Elektron. Elektrotechnika 2015, 21, 3–9. [Google Scholar] [CrossRef] [Green Version]
  10. Kawala-Sterniuk, A.; Podpora, M.; Pelc, M.; Blaszczyszyn, M.; Gorzelanczyk, E.J.; Martinek, R.; Ozana, S. Comparison of smoothing filters in analysis of EEG data for the medical diagnostics purposes. Sensors 2020, 20, 807. [Google Scholar] [CrossRef] [Green Version]
  11. Cimtay, Y.; Ekmekcioglu, E. Investigating the use of pretrained convolutional neural network on cross-subject and cross-dataset EEG emotion recognition. Sensors 2020, 20, 2034. [Google Scholar] [CrossRef] [Green Version]
  12. Kurapa, A.; Rathore, D.; Edla, D.R.; Bablani, A.; Kuppili, V. A Hybrid Approach for Extracting EMG signals by Filtering EEG Data for IoT Applications for Immobile Persons. Wirel. Pers. Commun. 2020, 114, 3081–3101. [Google Scholar] [CrossRef]
  13. Epstein, R. The empty brain. Aeon May 2016, 18, 2016. [Google Scholar]
  14. Hassan, M.A.; Rizvi, Q.M. Computer Vs Human Brain: An Analytical Approach and Overview. Computer 2019, 6, 580–583. [Google Scholar]
  15. Kawala-Janik, A. Efficiency Evaluation of External Environments Control Using Bio-Signals. Ph.D. Thesis, University of Greenwich, London, UK, 2013. [Google Scholar]
  16. Stach, T.N.; Kawala-Janik, A. Initial Study on Using Emotiv EPOC+ Neuroheadset as a Control Device for Picture Script-Based Communicators. IFAC-PapersOnLine 2018, 51, 180–184. [Google Scholar] [CrossRef]
  17. Browarska, N.; Stach, T. System to Communicate Disabled People with Environment Using Brain-Computer Interfaces. In Proceedings of the International Scientific Conference BCI 2018 Opole, Opole, Poland, 13–14 March 2018; pp. 150–157. [Google Scholar]
  18. Cherng, F.Y.; Lee, Y.C.; King, J.T.; Lin, W.C. Measuring the Influences of Musical Parameters on Cognitive and Behavioral Responses to Audio Notifications Using EEG and Large-scale Online Studies. In Proceedings of the 2019 CHI Conference on Human Factors in Computing Systems, Scotland, UK, 4–9 May 2019; pp. 1–12. [Google Scholar]
  19. Sakharov, D.; Davydov, V.; Pavlygina, R. Intercentral relations of the human EEG during listening to music. Hum. Physiol. 2005, 31, 392–397. [Google Scholar] [CrossRef]
  20. Dey, A.; Palit, S.K.; Bhattacharya, D.; Tibarewala, D.; Das, D. Study of the effect of music on central nervous system through long term analysis of EEG signal in time domain. Int. J. Eng. Sci. Emerg. Technol. 2013, 5, 59–67. [Google Scholar]
  21. Bitner, M.J. Servicescapes: The impact of physical surroundings on customers and employees. J. Mark. 1992, 56, 57–71. [Google Scholar] [CrossRef]
  22. Koelsch, S.; Siebel, W.A. Towards a neural basis of music perception. Trends Cogn. Sci. 2005, 9, 578–584. [Google Scholar] [CrossRef] [Green Version]
  23. Koelsch, S. Neural substrates of processing syntax and semantics in music. In Music That Works; Springer: Berlin/Heidelberg, Germany, 2009; pp. 143–153. [Google Scholar]
  24. Herrmann, C.S.; Grigutsch, M.; Busch, N.A. 11 EEG oscillations and wavelet analysis. In Event-Related Potentials: A Methods Handbook; The MIT Press: Cambridge, MA, USA, 2005; p. 229. [Google Scholar]
  25. Teplan, M.; Krakovska, A.; Štolc, S. EEG responses to long-term audio—Visual stimulation. Int. J. Psychophysiol. 2006, 59, 81–90. [Google Scholar] [CrossRef]
  26. Sasaki, M.; Iversen, J.; Callan, D.E. Music Improvisation is Characterized by Brain Related Increased Beta Band EEG. Front. Hum. Neurosci. 2019, 13, 435. [Google Scholar] [CrossRef]
  27. Spironelli, C.; Angrilli, A. EEG delta band as a marker of brain damage in aphasic patients after recovery of language. Neuropsychologia 2009, 47, 988–994. [Google Scholar] [CrossRef] [PubMed]
  28. Kołodziej, M.; Majkowski, A.; Rak, R. A new method of feature extraction from EEG signal for brain-computer interface design. Przegląd Elektrotechniczny 2010, 86, 35–38. [Google Scholar]
  29. Bekkedal, M.Y.; Rossi, J., III; Panksepp, J. Human brain EEG indices of emotions: Delineating responses to affective vocalizations by measuring frontal theta event-related synchronization. Neurosci. Biobehav. Rev. 2011, 35, 1959–1970. [Google Scholar] [CrossRef] [PubMed]
  30. Alarcao, S.M.; Fonseca, M.J. Emotions recognition using EEG signals: A survey. IEEE Trans. Affect. Comput. 2017, 10, 374–393. [Google Scholar] [CrossRef]
  31. Zhuang, N.; Zeng, Y.; Tong, L.; Zhang, C.; Zhang, H.; Yan, B. Emotion recognition from EEG signals using multidimensional information in EMD domain. BioMed. Res. Int. 2017, 2017. [Google Scholar] [CrossRef] [PubMed]
  32. van Lier, H.; Drinkenburg, W.H.; Van Eeten, Y.J.; Coenen, A.M. Effects of diazepam and zolpidem on EEG beta frequencies are behavior-specific in rats. Neuropharmacology 2004, 47, 163–174. [Google Scholar] [CrossRef]
  33. Yoshimura, M.; Koenig, T.; Irisawa, S.; Isotani, T.; Yamada, K.; Kikuchi, M.; Okugawa, G.; Yagyu, T.; Kinoshita, T.; Strik, W.; et al. A pharmaco-EEG study on antipsychotic drugs in healthy volunteers. Psychopharmacology 2007, 191, 995–1004. [Google Scholar] [CrossRef] [Green Version]
  34. Jaušovec, N.; Jaušovec, K.; Gerlič, I. Differences in event-related and induced EEG patterns in the theta and alpha frequency bands related to human emotional intelligence. Neurosci. Lett. 2001, 311, 93–96. [Google Scholar] [CrossRef]
  35. Zieliński, T.P. Cyfrowe Przetwarzanie Sygnałów: Od Teorii Do Zastosowań; Wydawnictwa Komunikacji ączności: Warszawa, Poland, 2005. [Google Scholar]
  36. Williams, N.S.; McArthur, G.M.; de Wit, B.; Ibrahim, G.; Badcock, N.A. A validation of Emotiv EPOC Flex saline for EEG and ERP research. PeerJ 2020, 8, e9713. [Google Scholar] [CrossRef]
  37. Alotaiby, T.; Abd El-Samie, F.E.; Alshebeili, S.A.; Ahmad, I. A review of channel selection algorithms for EEG signal processing. EURASIP J. Adv. Signal Process. 2015, 2015, 66. [Google Scholar] [CrossRef] [Green Version]
  38. Kwon, J.; Shin, J.; Im, C.H. Toward a compact hybrid brain-computer interface (BCI): Performance evaluation of multi-class hybrid EEG-fNIRS BCIs with limited number of channels. PLoS ONE 2020, 15, e0230491. [Google Scholar] [CrossRef] [PubMed] [Green Version]
  39. Gurve, D.; Delisle-Rodriguez, D.; Romero-Laiseca, M.; Cardoso, V.; Loterio, F.; Bastos, T.; Krishnan, S. Subject-specific eeg channel selection using non-negative matrix factorization for lower-limb motor imagery recognition. J. Neural Eng. 2020, 17, 026029. [Google Scholar] [CrossRef] [PubMed]
  40. Ge, Q.; Lin, Z.C.; Gao, Y.X.; Zhang, J.X. A Robust Discriminant Framework Based on Functional Biomarkers of EEG and Its Potential for Diagnosis of Alzheimer’s Disease. Healthcare 2020, 8, 476. [Google Scholar] [CrossRef] [PubMed]
  41. Fernandez-Blanco, E.; Rivero, D.; Pazos, A. Convolutional neural networks for sleep stage scoring on a two-channel EEG signal. Soft Comput. 2020, 24, 4067–4079. [Google Scholar] [CrossRef]
  42. Xu, M.; Qi, H.; Ma, L.; Sun, C.; Zhang, L.; Wan, B.; Yin, T.; Ming, D. Channel selection based on phase measurement in P300-based brain-computer interface. PLoS ONE 2013, 8, e60608. [Google Scholar] [CrossRef] [Green Version]
  43. Krusienski, D.J.; Sellers, E.W.; McFarland, D.J.; Vaughan, T.M.; Wolpaw, J.R. Toward enhanced P300 speller performance. J. Neurosci. Methods 2008, 167, 15–21. [Google Scholar] [CrossRef] [Green Version]
  44. Liu, Y.; Zhou, Z.; Hu, D. Gaze independent brain—Computer speller with covert visual search tasks. Clin. Neurophysiol. 2011, 122, 1127–1136. [Google Scholar] [CrossRef]
  45. Xue, J.Z.; Zhang, H.; Zheng, C.X.; Yan, X.G. Wavelet packet transform for feature extraction of EEG during mental tasks. In Proceedings of the 2003 International Conference on Machine Learning and Cybernetics (IEEE Cat. No. 03EX693); IEEE: Piscataway, PA, USA, 2003; Volume 1, pp. 360–363. [Google Scholar]
  46. Mahato, S.; Goyal, N.; Ram, D.; Paul, S. Detection of Depression and Scaling of Severity Using Six Channel EEG Data. J. Med. Syst. 2020, 44, 1–12. [Google Scholar] [CrossRef]
  47. Picard, R.W.; Vyzas, E.; Healey, J. Toward machine emotional intelligence: Analysis of affective physiological state. IEEE Trans. Pattern Anal. Mach. Intell. 2001, 23, 1175–1191. [Google Scholar] [CrossRef] [Green Version]
  48. Browarska, N.; Kawala-Sterniuk, A.; Chechelski, P.; Zygarlicki, J. Analysis of brain waves changes in stressful situations based on horror game with the implementation of virtual reality and brain-computer interface system: A case study. Bio-Algorithms Med.-Syst. 2020, 1. [Google Scholar] [CrossRef]
  49. Wang, C.M.; Xiao, W.C. Second-order IIR Notch Filter Design and implementation of digital signal processing system. In Applied Mechanics and Materials; Trans Tech Publ.: Stafa-Zurich, Switzerland, 2013; Volume 347, pp. 729–732. [Google Scholar]
  50. Li, S.; Zhou, W.; Yuan, Q.; Liu, Y. Seizure prediction using spike rate of intracranial EEG. IEEE Trans. Neural Syst. Rehabil. Eng. 2013, 21, 880–886. [Google Scholar] [CrossRef]
  51. Srinivasan, R.; Nunez, P.L.; Tucker, D.M.; Silberstein, R.B.; Cadusch, P.J. Spatial sampling and filtering of EEG with spline laplacians to estimate cortical potentials. Brain Topogr. 1996, 8, 355–366. [Google Scholar] [CrossRef]
  52. Jadav, G.M.; Lerga, J.; Štajduhar, I. Adaptive filtering and analysis of EEG signals in the time-frequency domain based on the local entropy. EURASIP J. Adv. Signal Process. 2020, 2020, 1–18. [Google Scholar]
  53. Issa, S.; Peng, Q.; You, X. Emotion Classification Using EEG Brain Signals and the Broad Learning System. IEEE Trans. Syst. Man Cybern. Syst. 2020. [Google Scholar] [CrossRef]
  54. Gupta, G.S.; Bhatnagar, M.; Kumar, S.; Sinha, R.K. A comparative study of application of different non-conventional filters on electroencephalogram. Biomed. Res. (0970-938X) 2020, 31, 1–9. [Google Scholar]
  55. Grzechca, D.; Szczeponik, A. Comparison of Filtering Methods for Enhanced Reliability of a Train Axle Counter System. Sensors 2020, 20, 2754. [Google Scholar] [CrossRef] [PubMed]
  56. Schafer, R.W. What is a Savitzky-Golay filter?[lecture notes]. IEEE Signal Process. Mag. 2011, 28, 111–117. [Google Scholar] [CrossRef]
  57. Acabchuk, R.L.; Simon, M.A.; Low, S.; Brisson, J.M.; Johnson, B.T. Measuring Meditation Progress with a Consumer-Grade EEG Device: Caution from a Randomized Controlled Trial. Mindfulness 2020, 1–14. [Google Scholar] [CrossRef]
  58. Ratti, E.; Waninger, S.; Berka, C.; Ruffini, G.; Verma, A. Comparison of medical and consumer wireless EEG systems for use in clinical trials. Front. Hum. Neurosci. 2017, 11, 398. [Google Scholar] [CrossRef] [Green Version]
  59. Maskeliunas, R.; Damasevicius, R.; Martisius, I.; Vasiljevas, M. Consumer-grade EEG devices: Are they usable for control tasks? PeerJ 2016, 4, e1746. [Google Scholar] [CrossRef]
  60. Browarska, N.; Kawala-Sterniuk, A.; Zygarlicki, J. Initial study on changes in activity of brain waves during audio stimulation using noninvasive brain—Computer interfaces: Choosing the appropriate filtering method. Bio-Algorithms Med.-Syst. 2020, 1. [Google Scholar] [CrossRef]
  61. Diker, A.; Avci, E.; Tanyildizi, E.; Gedikpinar, M. A novel ECG signal classification method using DEA-ELM. Med. Hypotheses 2020, 136, 109515. [Google Scholar] [CrossRef] [PubMed]
  62. Rahman, M.A.; Haque, M.M.; Anjum, A.; Mollah, M.N.; Ahmad, M. Classification of motor imagery events from prefrontal hemodynamics for BCI application. In Proceedings of International Joint Conference on Computational Intelligence; Springer: Berlin/Heidelberg, Germany, 2020; pp. 11–23. [Google Scholar]
  63. Yadava, M.; Kumar, P.; Saini, R.; Roy, P.P.; Dogra, D.P. Analysis of EEG signals and its application to neuromarketing. Multimed. Tools Appl. 2017, 76, 19087–19111. [Google Scholar] [CrossRef]
  64. Acharya, D.; Rani, A.; Agarwal, S.; Singh, V. Application of adaptive Savitzky–Golay filter for EEG signal processing. Perspect. Sci. 2016, 8, 677–679. [Google Scholar] [CrossRef] [Green Version]
  65. Agarwal, S.; Rani, A.; Singh, V.; Mittal, A.P. EEG signal enhancement using cascaded S-Golay filter. Biomed. Signal Process. Control 2017, 36, 194–204. [Google Scholar] [CrossRef]
  66. Khng, K.H.; Mane, R. Beyond BCI—Validating a wireless, consumer-grade EEG headset against a medical-grade system for evaluating EEG effects of a test anxiety intervention in school. Adv. Eng. Inf. 2020, 45, 101106. [Google Scholar] [CrossRef]
  67. Kawala-Sterniuk, A.; Browarska, N.; Al-Bakri, A.F.; Pelc, M.; Zygarlicki, J.; Sidikova, M.; Martinek, R.; Gorzelanczyk, E.J. Summary of over Fifty Years with Brain-Computer Interfaces–A Review. Brain Sci. 2021, 1. in press. [Google Scholar]
  68. Gorzelańczyk, E.J.; Podlipniak, P.; Walecki, P.; Karpiński, M.; Tarnowska, E. Pitch Syntax violations are linked to greater skin conductance changes, relative to timbral violations—The predictive role of the reward system in perspective of cortico—Subcortical loops. Front. Psychol. 2017, 8, 586. [Google Scholar] [CrossRef] [Green Version]
  69. Shuaib, H.; Anthony, R.J.; Pelc, M. A Framework for Certifying Autonomic Computing Systems; Curran Associates Inc.: Red Hook, NY, USA, 2012. [Google Scholar]
  70. Schembri, P.; Pelc, M.; Ma, J. Comparison between a Passive and Active response task and their effect on the Amplitude and Latency of the P300 component for Visual Stimuli while using Low Fidelity Equipment. In Proceedings of the 2019 41st Annual International Conference of the IEEE Engineering in Medicine and Biology Society (EMBC), Berlin, Germany, 23–27 July 2019; pp. 4566–4571. [Google Scholar]
  71. Pelc, M.; Galus, D.; Zolubak, M.; Ozana, S.; Chlewicki, W.; Cichon, K.; Podpora, M.; Kawala-Sterniuk, A. Behavioural Approach to Network Anomaly Detection for Resource-Constrained System—Presentation of the Novel Solution–Preliminary Study. IFAC-PapersOnLine 2019, 52, 121–126. [Google Scholar] [CrossRef]
  72. Nguyen, T.; Khosravi, A.; Creighton, D.; Nahavandi, S. EEG signal classification for BCI applications by wavelets and interval type-2 fuzzy logic systems. Expert Syst. Appl. 2015, 42, 4370–4380. [Google Scholar] [CrossRef]
  73. Herman, P.A.; Prasad, G.; McGinnity, T.M. Designing an interval type-2 fuzzy logic system for handling uncertainty effects in brain—Computer interface classification of motor imagery induced EEG patterns. IEEE Trans. Fuzzy Syst. 2016, 25, 29–42. [Google Scholar] [CrossRef] [Green Version]
  74. Matiko, J.W.; Beeby, S.P.; Tudor, J. Fuzzy logic based emotion classification. In Proceedings of the 2014 IEEE International Conference on Acoustics, Speech and Signal Processing (ICASSP), Florence, Italy, 4–9 May 2014; pp. 4389–4393. [Google Scholar]
  75. Chelune, G.J.; Baer, R.A. Developmental norms for the Wisconsin Card Sorting test. J. Clin. Exp. Neuropsychol. 1986, 8, 219–228. [Google Scholar] [CrossRef] [PubMed]
  76. Barry, D.; Petry, N.M. Predictors of decision-making on the Iowa Gambling Task: Independent effects of lifetime history of substance use disorders and performance on the Trail Making Test. Brain Cogn. 2008, 66, 243–252. [Google Scholar] [CrossRef] [PubMed] [Green Version]
  77. Jensen, A.R. Scoring the Stroop test. Acta Psychol. 1965, 24, 398–408. [Google Scholar] [CrossRef]
  78. Rutkowski, T.M.; Mori, H. Tactile and bone-conduction auditory brain computer interface for vision and hearing impaired users. J. Neurosci. Methods 2015, 244, 45–51. [Google Scholar] [CrossRef]
  79. Rutkowski, T.M. Robotic and virtual reality BCIs using spatial tactile and auditory oddball paradigms. Front. Neurorobot. 2016, 10, 20. [Google Scholar] [CrossRef] [Green Version]
Figure 1. Emotiv EPOC Flex device [7].
Brainsci 11 00098 g001
Figure 2. Schema of the sensors arrangement: (a) Emotiv Flex default electrodes arrangement; (b) electrodes chosen for analysis.
Brainsci 11 00098 g002
Figure 3. Stimuli workstation.
Brainsci 11 00098 g003
Figure 4. Data analysis scenario.
Brainsci 11 00098 g004
Figure 5. Raw signal during relax.
Brainsci 11 00098 g005
Figure 6. Raw signal—focused subject.
Brainsci 11 00098 g006
Figure 7. Filter comparison—relax mode (C3 channel).
Brainsci 11 00098 g007
Figure 8. Filter comparison—relax mode (C4 channel).
Brainsci 11 00098 g008
Figure 9. Filter comparison—focus mode (C3 channel).
Brainsci 11 00098 g009
Figure 10. Filter comparison—focus mode (C4 channel).
Brainsci 11 00098 g010
Figure 11. Raw signal—relax.
Brainsci 11 00098 g011
Figure 12. Raw signal—focus.
Brainsci 11 00098 g012
Figure 13. Filter comparison—relax (C3).
Brainsci 11 00098 g013
Figure 14. Filter comparison—relax (C4).
Brainsci 11 00098 g014
Figure 15. Filter comparison—focus (C3).
Brainsci 11 00098 g015
Figure 16. Filter comparison—focus (C4).
Brainsci 11 00098 g016
Figure 17. Filter comparison—relax (C3)—characteristic “peak” features.
Brainsci 11 00098 g017
Figure 18. Filter comparison—relax (C4)—characteristic “peak” features.
Brainsci 11 00098 g018
Figure 19. Filter comparison—focus (C3)—characteristic “peak” features.
Brainsci 11 00098 g019
Figure 20. Filter comparison—focus(C4)—characteristic “peak” features.
Brainsci 11 00098 g020
Figure 21. Filtering Comparison—percentage feature coverage.
Brainsci 11 00098 g021
Table 1. Stimuli scenario.
No.TaskDurationDescription
1Device configuration20 minGeneral rules discussion. Cap and electrodes placement.
2Relax3 minRelax with eyes closed. Relaxing sounds stimuli (nature, waves, etc.)
3Focus7 minSolving easy visual task (word search) without any audio stimulation.
4Relax3 minRelax with eyes closed. Relaxing sounds stimuli (nature, waves, etc.)
5Focus7 minSolving easy visual task (word search) with distraction sounds of electric drill, baby crying.
6Relax3 minRelax with eyes closed. Relaxing sounds stimuli (nature, waves, etc.)
7Focus7 minSolving easy visual task (word search) with stimuli 14 Hz sounds.
Table 2. Metadata.
Table 2. Metadata.
No.AgeGenderDrugs TakenCurrent Mood (0–10)
126fno7
230mno2
322mno7
448mno6
535mno4
642mno5
738mno6
830mno10
941mno4
1036fno2
Table 3. Filtering comparison—feature coverage accuracy.
Filter NumberPeak Coverage Accuracy %
Filter 165.16
Filter 264.92
Filter 391.14
Filter 443.06
Filter 548.42
Publisher’s Note: MDPI stays neutral with regard to jurisdictional claims in published maps and institutional affiliations.

