

Abstract
Since the redefinition of the base unit kelvin via fixing the Boltzmann constant in 2019, it has been possible to realise the unit applying different gas-thermometry methods in accordance with the 'Mise en pratique for the definition of the kelvin in the SI'. For this application, the use of data for the gas properties resulting from ab initio calculations is of special interest because it makes primary thermometry much easier. But since a rigorous estimation of the uncertainty of theoretical calculations is at least very complex, if not impossible, a check of the results by a comparison with highly-accurate experimental values is mandatory. Such a check is performed for the second virial coefficient of helium, which is a widely used measuring gas, in the temperature range from 3.7 K to 273 K. For obtaining highly-accurate second-virial-coefficient values (relative uncertainty at a few tenth of a percent level or even better), isotherms were measured with the PTB dielectric-constant gas thermometer. The highly-accurate isotherm data were evaluated by fitting, applying an extended working equation for the dependence of the gas pressure on the dielectric constant. The comparison with the results of the latest ab initio calculations shows coincidence within the combined uncertainty estimates.
Export citation and abstract BibTeX RIS

Original content from this work may be used under the terms of the Creative Commons Attribution 4.0 licence. Any further distribution of this work must maintain attribution to the author(s) and the title of the work, journal citation and DOI.
1. Introduction
On the occasion of the redefinition of the base unit kelvin by fixing the value of the Boltzmann constant in 2019 [1], the possibilities for realising the unit have been improved significantly by extending the 'Mise en pratique for the definition of the kelvin in the SI' [2]. It is now possible to apply directly selected primary thermometry methods for measuring the thermodynamic temperature T. For gas-thermometry methods, it may be helpful to use gas-properties data resulting from ab initio calculations. This concerns especially the virial coefficients, which describe the gas–particle interaction in real gases. Examples have been published for refractive-index gas thermometry (RIGT) [3], single-pressure RIGT [4], and, in a different form, acoustic gas thermometry (AGT) [5].
But a reliable estimation of the uncertainty is a crucial condition for using theoretical data in primary thermometry. This is challenging for virial coefficients because their ab initio calculation requires to solve multi-particle problems. Furthermore, only the calculation of the second virial coefficient, which describes the two-particle interaction, is straightforward. Therefore, rigorous uncertainty estimations yield usually unrealistic estimates, and highly accurate experimental data is urgently needed to check the validity of theoretical calculations. This was the motivation for performing dielectric-constant gas thermometry (DCGT) with helium in the temperature range from 3.7 K to 273 K, where the evaluation of isotherms applying an appropriate working equation for the dependence of the gas pressure on the dielectric constant yields values for the virial coefficients.
The paper is the third one in a series of papers, which present the results, the publication of which was originally announced as reference '[47]' in the review paper on DCGT [6], but was not performed in this form. The first paper contains the results for the polarizabilities of the three noble gases helium, neon, and argon [7]. The second one deals with measurements of thermodynamic temperature T in the range from 30 K to 200 K, where the results are presented as differences T − T90 [8] (T90 is the temperature on the international temperature scale of 1990, ITS-90 [9]).
The paper is organized as follows. In section 2, the theoretical fundamentals are updated both for the DCGT principle including the working equation and for the ab initio calculations for the virial coefficients. The challenges of DCGT and features of the DCGT facility of PTB are briefly repeated in section 3, and section 4 deals with the data sets and their evaluation. The uncertainty of the results is estimated in section 5. The comparison of the experimental and ab initio values of the virial coefficients in section 6 illustrates the level reached and the work to be done in future. Finally, conclusions are drawn.
2. Theoretical fundamentals
DCGT is based on the in situ determination of the gas density via the dielectric constant ε. The dielectric constant is measured by its influence on the capacitance of a suitable capacitor incorporated in the gas bulb. For a real measuring gas, the interaction between the gas particles must be considered that is described by the virial coefficients. Since an electrical measurement is performed, both density and dielectric virial coefficients are of relevance. The density virial coefficients describe the multi-particle interaction during mechanical scattering, whereas the dielectric virial coefficients consider the electrical multipole interaction. Thus, the DCGT working equation results from the combination of virial expansions of the gas equation p(T, V) (p is the pressure inside the measuring capacitor, T is the thermodynamic temperature, V is molar volume) and the Clausius–Mossotti equation εr(V) (εr = ε/ε0 is the relative dielectric constant with ε0 being the electric constant). For determining values of the thermodynamic temperature and/or the virial coefficients, isotherms can be measured, i.e. different pairs of values (p, εr) at the same temperature. In this paper, the following polynomial of third order for the pressure was fitted to all pairs (p, εr) of an isotherm:

The linear term describes the ideal-gas behaviour. Its coefficient is given by A1 = (Aε /RT + κeff/3)−1 (Aε is the molar polarizability, R is the molar gas constant). κeff denotes the effective compressibility of the capacitor, which describes the change of the capacitance only due to the mechanical deformation caused by the measuring gas. (The term 'effective' indicates the fact that each capacitor is a composite because small pieces of insulator materials are necessary to isolate the electrodes electrically.) The quantity μ = γ/(γ + 3) is deduced from the capacitance C(p) with gas at pressure p and that of the empty capacitor C(0) applying the relation

The connection between the coefficients A2 and A3 of the second- and third-order terms and the virial coefficients has been derived in [10]. It has been found that the density and dielectric virial coefficients cannot be determined independently from each other from A2 and A3, but only the combinations (B − b) and (C − 2Bb + b2 − c). (For the second combination, the abbreviation C* ≡ (C − 2Bb + b2 − c) is used in this paper). B and C are the density virial coefficients, and b and c the dielectric ones. They arise from the pair (B, b) and mainly triplet interaction (C, c). Neglecting terms in third order of κeff, the formulas given in [10] yield a more detailed form of polynomial (1):
(κeff terms in third order are neglected because they are not relevant, but in principle they can be considered by the overall fit). This yields the following formula for each measuring point i on an isotherm
Formula (4) is needed for introducing a new, alternative method for the evaluation of isotherm data, see below.
An overview of the theoretical ab initio calculations of the virial coefficients and experimental results at the triple point of water is given in [10]. For the density virial coefficients B and C, the achieved uncertainty of the theoretical values is smaller than that of the experimental ones, and the agreement is satisfactory. For the dielectric virial coefficients b and c, the situation is more complex, and best estimates are deduced. The conclusions drawn in [10] are supported by new ab initio calculations, one for the second density virial coefficient [11] and two for the second dielectric virial coefficient [12, 13]. Regarding the fact that at 5 K the second dielectric virial coefficient is more than four orders of magnitude smaller than the density one, the relative difference of about 10% between the values of [12, 13] at 5 K is not significant for this work. At 100 K and higher temperatures the deviation between the density and the dielectric virial coefficient is still two to three orders of magnitude, but the agreement between the results of [12, 13] is on the tenth of a percent level. In summary, the two calculations are very important because different approaches are used, but for this comparison it is not reasonable to distinguish between them. Therefore, in the following the results of [12, 13] are referenced as bTheory without further differentiation.
In the theoretical paper by Jäger et al [14], the following expansion has been suggested for describing the temperature dependence of the second (B2 ≡ B) and third (B3 ≡ C) density virial coefficients in a large range up to 10 000 K (formula (21) in [14]):

(Note, that in [14], T* = T/1000 was used and here T is used as variable.)
The terms with a positive exponent are important for the high-temperature range, and the negative exponents are most important at low temperatures. Expansion (5) contains some terms, which are based on theory as discussed in [15] (formulas (2) and (3)). Below parts of formula (5) are used for fitting the results in restricted temperature ranges.
3. Experimental DCGT setup
The DCGT setup of the second generation (DCGT2), leading to the results presented in this paper, is already described extensively in [16] and in full detail in [17]. The latest changes and improvements are discussed in [8]. Special emphasis was given to reduce static and dynamic errors in measuring the gas temperature. The temperature of the measuring system could be stabilised at a level from 10 μK–50 μK. The temperature T90 according to the ITS-90 was measured with three capsule-type standard platinum resistance thermometers (CSPRTs) manufactured by Leeds & Northrup 1 , which were situated at different locations of the measuring system. The calibration of the CSPRTs is described in [18, 19]. The CSPRTs carrying an ITS-90 calibration were compared at all measuring temperatures, and the maximum difference between their readings was below 50 μK. At all isotherm temperatures, the CSPRTs showed an agreement between 30 μK and 50 μK. The smallest relative uncertainty of the pressure measurement of 3.6 parts per million (3.6 ppm) was achieved by calibrating the piston-cylinder unit (PCU) of the pressure balance used against the special PCUs characterised for the measurement of the Boltzmann constant [20]. The equipment applied for measuring capacitance changes was developed as described in [6, 21], which resulted in a relative uncertainty of one part per billion (1 ppb). Dedicated experiments were performed to determine the individual effective compressibility of the cylindrical measuring capacitors, see in particular [8, 22]. Impurities may influence the results because especially water as dangerous contamination has properties quite different from those of helium. To prevent contamination of the measuring gas during handling, gas purifiers (getter and adsorber) have been incorporated in the ultra-high-purity gas-handling system. After each measurement of an isotherm, the measuring gas was analysed with the aid of a mass spectrometer to check for a possible contamination especially due to outgassing from the different pieces inside the experimental chamber.
4. Data sets and evaluation
The isotherm data used in this paper to deduce highly-accurate values of the second density virial coefficient of helium have been already completely published in three papers, in which it was evaluated primarily with respect to the virial coefficients in the low-temperature range (3.7 K to 26.5 K) [23] and the thermodynamic temperature (30 K to 38 K, 84 K, 120 K, 130 K, 140 K and 50 K, 60 K, 70 K, 79 K, 100 K, 200 K) [8, 24], respectively. The evaluation was performed by fitting polynomials of second to fourth order of the same form as equation (1) to the isotherms. Though for all triplets (temperature T90, pressure p, dielectric constant determining quantity μ) the gas density is not large, the third-order term cannot be neglected. Therefore, the second-order fits were performed using a constraint for this term, the uncertainty of which has been estimated reliably. For each isotherm, the results for the fitting coefficients Ai were the weighted means of the values obtained from fits of different order.
To consider better the triplets (T90, p, μ) measured at higher pressures, and thus higher gas densities, that contain more information about the real-gas properties, in this paper a new, alternative evaluation method was applied. This method consists of four steps:
- (a)First all isotherms were evaluated via a single-isotherm fit of third order using polynomial (1). (For all isotherms evaluated, the density is low enough so that the third order fit is sufficient to describe the physics.) The A3 term yields together with coefficient A1 the combined quantity C* DCGT ≡ (C − 2Bb + b2 − c)DCGT, cf equation (3). (The A1 term values, and thus differences (T − T90), are already published, see above. The uncertainty of the fitting coefficients was deduced using maximum-likelihood estimation [25].)
- (b)The temperature dependence of the C* DCGT values was then fitted for smoothing applying an expansion based on formula (5). But not the complete expansion was used because the data has a quite large scatter and the fit should be as simple as possible, but also capable to describe the temperature dependence. (This was checked performing fits to ab initio data.) Since mostly the low-temperature end is covered, the positive exponents are skipped and the most negative exponents as well (the check against ab initio data was performed in such a way that the differences are at least an order of magnitude smaller than the achievable experimental uncertainties). The reduced expansion used for C* TFit(T90) (TFit mean fit versus T90) starts with the constant term and includes negative exponents up to −4 as well as the invers square root term of Jäger et al [14]. In order to stabilize the fit at the high temperature end, the two data points from DCGT at 273.16 K published in [10] have been included.
- (c)Insertion of the smoothed C* TFit values in equation (4) allows to calculate for each triplet (T90, p, μ) an individual value of the DCGT second viral coefficient (B − b)DCGT.
- (d)In turn, the final (B − b)DCGT result for an isotherm can be calculated as the weighted mean of the individual (B − b)DCGT values. Since the information on the real-gas properties increases with enhancing density, the density was used as weight.
To obtain a link between the already published results and the ones presented in this paper, it is important to compare the (B − b)DCGT values obtained with the new, alternative evaluation method with those resulting from the 'classical' method in which the fitting parameters as well as CODATA values for the fundamental constants and ab initio data for the constants in the correction terms are applied. This comparison is shown in figure 1. The two methods yield results, which, except for nine outliers, coincide within the limits resulting from the standard uncertainties, which means that no unresolved discrepancies exit. Tests performed for other target quantities as the thermodynamic temperature produced the same level of coincidence.
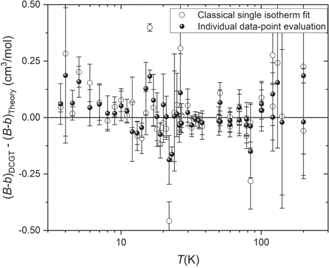
Figure 1. Deviation of values of the DCGT second viral coefficient (B − b)DCGT obtained with two different evaluation methods from ab initio theoretical calculations (the second density viral coefficient B is taken from [11], and the second dielectric viral coefficient b from [12, 13]). The 'individual' data-point evaluation is the new four-step evaluation method explained in the text (black dots). The 'classical' single-isotherm fits were performed applying the third-order polynomial given by equation (1) (open black dots). The uncertainty bars shown are only type A uncertainties (see upper part of table 2).
Download figure:
Standard image High-resolution imageThe final data (B − b)DCGT have been fitted over the whole temperature range in the same way as done for the DCGT third virial coefficient (C* TFit(T90)). But in the case of (B − b)DCGT versus T90, not the same exponents as for C* TFit(T90) have been used. The reason is that the temperature dependence of (B − b)DCGT is more complicated than that of C* DCGT(T90) (zero crossing etc). In order to stabilize the fit at the high temperature end, the two data points from DCGT at 273.16 K published in [10] have been included. From a comparison with ab initio theory, it can be seen that a fit with the positive exponents and negative exponents up to order −3 is enough to describe the temperature dependence accurately in the whole temperature range (fit with 9 coefficients). The fitting coefficients for both temperature dependencies are given in table 1.
Table 1. Fitting coefficients in formula (5) for the temperature dependences of the DCGT results (B − b)DCGT and C* DCGT for the virial coefficients of the heavy isotope of helium (helium-4), respectively. The resulting fitting expansions are called (B − b)TFit and C* TFit, respectively. (B − b)DCGT is dominated by the second density virial coefficient B (n = 2), and C* DCGT = (C − 2Bb + b2 − c)DCGT by the third density virial coefficient C (n = 3).
| Coefficient | (B − b)TFit versus T90 (n = 2) | C* TFit versus T90 (n = 3) |
|---|---|---|
| cn,3 | −5.255 73 × 10−14 | |
| cn,2 | 5.099 56 × 10−11 | |
| cn,1 | −3.579 22 × 10−8 | |
| cn,0 | 1.067 32 × 10−5 | −3.988 40 × 10−11 |
| cn,−1 | −5.429 20 × 10−4 | −1.311 07 × 10−8 |
| cn,−2 | 3.494 01 × 10−4 | 1.214 61 × 10−7 |
| cn,−3 | −5.488 12 × 10−4 | −4.376 78 × 10−7 |
| cn,−4 | 5.023 21 × 10−7 | |
| cn,0.5 | 4.364 04 × 10−7 | |
| cn,−0.5 | 5.228 97 × 10−5 | 3.365 65 × 10−9 |
5. Uncertainty budgets
The uncertainty budget for the determination of the difference (B − b)DCGT of the density B and the dielectric b second virial coefficients of the heavy isotope of helium (helium-4) by DCGT applying equation (4) is given for selected temperatures in table 2. The estimates for the type A components are based on Monte-Carlo simulations. The component caused by the effective compressibility is negligible at all temperatures, and that connected with layers of the measuring gas on the capacitor electrodes is relevant only at low temperatures.
Table 2. Uncertainty budget for the determination of the difference (B − b)DCGT of the density B and the dielectric b second virial coefficients by dielectric-constant gas thermometry applying equation (4). The type A components and the component caused by the third virial coefficients have been estimated by Monte-Carlo simulations. All uncertainty estimates are given in cm3 mol−1.
| T/K | 5 | 10 | 30 | 50 | 100 | 200 |
|---|---|---|---|---|---|---|
| Type A | ||||||
| εr measurement (μ) | 0.03 | 0.03 | 0.02 | 0.04 | 0.07 | 0.14 |
| Pressure repeatability | 0.02 | 0.02 | 0.02 | 0.03 | 0.05 | 0.10 |
| Fitting coefficient A1 | 0.06 | 0.06 | 0.05 | 0.03 | 0.04 | 0.23 |
| Type B | ||||||
| Third virial coefficients C* TFit | 0.01 | 0.01 | 0.01 | 0.00 | 0.00 | 0.00 |
| Effective compressibility κeff | 0.00 | 0.00 | 0.00 | 0.00 | 0.00 | 0.00 |
| 4He layers | 0.03 | 0.02 | 0.01 | 0.00 | 0.00 | 0.00 |
| Combined | 0.07 | 0.07 | 0.06 | 0.05 | 0.10 | 0.29 |
Examples for uncertainty budgets for determining C* DCGT from single-isotherm fits are presented in [23]. Based on those individual estimates, the uncertainty of the smoothed values C* TFit resulting from a fit of C* DCGT versus temperature (TFit), see above, has been estimated applying also a Monte-Carlo simulation. The C* TFit values at all measuring temperatures are listed in table 3 together with their standard uncertainty estimates u(C* TFit).
Table 3. Overview of the results for the virial coefficients of helium obtained by the evaluation of the DCGT isotherms published already in the references given in the first column (for details see section 4). The smoothed C* TFit values resulting from a fit versus T90 (TFit) are needed for the determination of the individual differences (B − b)DCGT of the density B and the dielectric b second virial coefficients from the triplets (T90, p, μ) applying equation (4). They do not allow to deduce reliably values of the third density virial coefficient C because the gas density achieved on the measured isotherms was not sufficiently large. The standard uncertainty estimates u(C * TFit) have been obtained from the individual ones (u(C* DCGT)) using Monte-Carlo simulation. The (B − b)DCGT values are the weighted means of the individual (B − b)DCGT values deduced from the triplets (T90, p, μ) on the corresponding isotherm. Their uncertainty estimates resulted from the application of classical uncertainty propagation for equation (4) and the weighted mean. In turn, the standard uncertainty estimates u((B − b)TFit) for the smoothed differences (B − b)TFit are based on Monte-Carlo simulations considering the individual u((B − b)DCGT) estimates.
| Reference | T90 (K) | C* TFit (cm6 mol−2) | u(C* TFit) (cm6 mol−2) | (B − b)DCGT (cm3 mol−1) | u((B − b)DCGT) (cm3 mol−1) | (B − b)TFit (cm3 mol−1) | u((B − b)TFit) (cm3 mol−1) |
|---|---|---|---|---|---|---|---|
| [23] | 3.701 | 1078 | 71 | −93.428 | 0.14 | −93.438 | 0.11 |
| [23] | 4.006 | 1080 | 52 | −84.718 | 0.31 | −84.765 | 0.11 |
| [23] | 4.494 | 1054 | 31 | −73.566 | 0.08 | −73.458 | 0.10 |
| [23] | 5.003 | 1004 | 13 | −64.088 | 0.07 | −64.097 | 0.07 |
| [23] | 5.981 | 887 | 18 | −50.704 | 0.08 | −50.664 | 0.06 |
| [23] | 7.004 | 771 | 16 | −40.630 | 0.09 | −40.654 | 0.06 |
| [23] | 8.002 | 677 | 13 | −33.346 | 0.08 | −33.353 | 0.04 |
| [23] | 9.002 | 601 | 11 | −27.643 | 0.05 | −27.657 | 0.03 |
| [23] | 10.003 | 540 | 11 | −23.052 | 0.07 | −23.100 | 0.03 |
| [23] | 11.003 | 492 | 12 | −19.352 | 0.06 | −19.373 | 0.04 |
| [23] | 12.007 | 453 | 14 | −16.332 | 0.13 | −16.258 | 0.04 |
| [23] | 13.009 | 422 | 15 | −13.711 | 0.05 | −13.630 | 0.05 |
| [23] | 14.010 | 396 | 16 | −11.446 | 0.05 | −11.386 | 0.05 |
| [23] | 15.012 | 375 | 17 | −9.332 | 0.12 | −9.443 | 0.05 |
| [23] | 16.016 | 357 | 17 | −7.579 | 0.03 | −7.745 | 0.05 |
| [23] | 17.017 | 342 | 16 | −6.194 | 0.12 | −6.254 | 0.05 |
| [23] | 18.022 | 329 | 16 | −4.940 | 0.11 | −4.929 | 0.05 |
| [23] | 19.024 | 318 | 16 | −3.839 | 0.05 | −3.751 | 0.04 |
| [23] | 20.021 | 309 | 15 | −2.654 | 0.14 | −2.699 | 0.04 |
| [23] | 21.015 | 301 | 14 | −1.758 | 0.09 | −1.752 | 0.04 |
| [23] | 21.993 | 294 | 14 | −1.104 | 0.11 | −0.909 | 0.03 |
| [23] | 23.006 | 287 | 13 | −0.281 | 0.03 | −0.113 | 0.03 |
| [23] | 23.998 | 282 | 12 | 0.601 | 0.20 | 0.598 | 0.03 |
| [23] | 24.991 | 276 | 12 | 1.265 | 0.10 | 1.251 | 0.03 |
| [23] | 26.011 | 272 | 11 | 1.833 | 0.04 | 1.867 | 0.03 |
| [23] | 26.491 | 270 | 11 | 2.250 | 0.17 | 2.139 | 0.03 |
| [23] | 26.989 | 268 | 11 | 2.388 | 0.04 | 2.411 | 0.03 |
| [24] | 29.905 | 257 | 10 | 3.840 | 0.06 | 3.811 | 0.02 |
| [24] | 31.891 | 251 | 9 | 4.586 | 0.04 | 4.608 | 0.02 |
| [24] | 33.875 | 246 | 9 | 5.312 | 0.03 | 5.305 | 0.02 |
| [24] | 35.890 | 242 | 9 | 5.928 | 0.04 | 5.927 | 0.02 |
| [24] | 37.850 | 238 | 9 | 6.457 | 0.05 | 6.463 | 0.02 |
| [8] | 49.835 | 219 | 11 | 8.743 | 0.06 | 8.739 | 0.02 |
| [8] | 50.787 | 218 | 11 | 8.953 | 0.06 | 8.869 | 0.02 |
| [8] | 50.787 | 218 | 11 | 8.870 | 0.05 | 8.869 | 0.02 |
| [8] | 59.785 | 208 | 12 | 9.856 | 0.05 | 9.855 | 0.02 |
| [8] | 59.785 | 208 | 12 | 9.837 | 0.05 | 9.855 | 0.02 |
| [8] | 69.739 | 199 | 13 | 10.647 | 0.08 | 10.598 | 0.02 |
| [8] | 69.739 | 199 | 13 | 10.591 | 0.07 | 10.598 | 0.02 |
| [8] | 78.558 | 192 | 13 | 11.050 | 0.07 | 11.063 | 0.02 |
| [8] | 78.558 | 192 | 13 | 11.025 | 0.08 | 11.063 | 0.02 |
| [24] | 83.809 | 188 | 13 | 11.119 | 0.12 | 11.278 | 0.03 |
| [24] | 83.809 | 188 | 13 | 11.231 | 0.10 | 11.278 | 0.03 |
| [8] | 100.496 | 177 | 12 | 11.767 | 0.09 | 11.760 | 0.05 |
| [8] | 100.496 | 177 | 12 | 11.795 | 0.10 | 11.760 | 0.05 |
| [24] | 120.727 | 166 | 11 | 12.148 | 0.14 | 12.083 | 0.07 |
| [24] | 120.727 | 166 | 11 | 12.045 | 0.15 | 12.083 | 0.07 |
| [24] | 130.735 | 161 | 10 | 12.288 | 0.29 | 12.178 | 0.08 |
| [24] | 140.698 | 157 | 9 | 12.173 | 0.32 | 12.244 | 0.10 |
| [8] | 200.088 | 136 | 5 | 12.225 | 0.24 | 12.297 | 0.21 |
| [8] | 200.088 | 136 | 5 | 12.430 | 0.35 | 12.297 | 0.21 |
6. Comparison of the experimental with ab initio values
Results for the virial coefficients of helium obtained by DCGT have already been published in several papers, mainly as a secondary result: [26] (4 K to 27 K), [16] (2.4 K to 27 K), [23] (3.7 K to 27 K), [15] (3.7 K to 36 K), [10] (273 K). Since no unresolved discrepancies exit between the former data and those presented in this paper, only the new data are compared with the results of ab initio calculations. An overview of the new (B − b) data is given in table 3. The (B − b)DCGT value is the weighted mean of the individual ones on the corresponding isotherm obtained from the triplets (T90, p, μ) applying equation (4). The smoothed (B − b)TFit values have been deduced by a fit of (B − b)DCGT versus temperature (TFit), see above. u((B − b)DCGT) and u((B − b)TFit) are the respective standard uncertainties.
A graphical overview of the results obtained for the third virial coefficients is given in figure 2. Except for a few clear outliers, the experimental data are compatible with the latest ab initio calculations within the limits corresponding to the estimated uncertainties. This justifies their use for calculating (B − b)DCGT applying equation (4). Figures 3 and 4 illustrate graphically the results presented in table 3 for the second virial coefficient of helium-4.
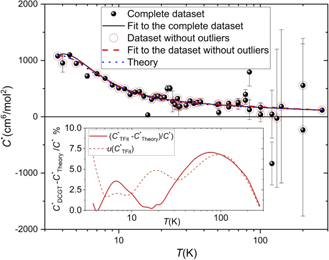
Figure 2. Data for C* DCGT = (C − 2Bb + b2 − c)DCGT in comparison with results of ab initio theoretical calculations for B [11], b [12, 13] and C [27] (blue dotted line). c = 0 was used due to lack of data and smallness. Furthermore, the large uncertainties of C* DCGT due to the small gas densities in most parts of the temperature range does not allow a distinction. The experimental black dots have been deduced from unweighted single-isotherm fits (SFits). The few clear outliers are not surrounded by a red circle. The functions resulting from fits to the complete dataset and the dataset without outliers are shown as black curve and red dashed curve, respectively. (The coefficients of the second fit function are listed in table 1.) The second, smaller plot inside the main plot shows the relative deviation of the second fit function from the latest ab initio calculations together with the standard uncertainty of the fit function (values at the isotherm temperatures are included in table 3). The data at 273.16 K published in [10] was just used for a stabilization of the fit (see text).
Download figure:
Standard image High-resolution image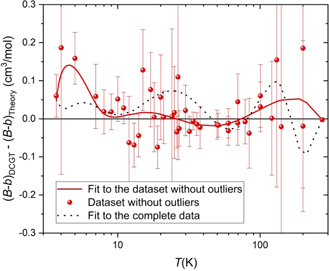
Figure 3. Deviation of values of the DCGT second viral coefficient (B − b)DCGT obtained with the individual data-point evaluation according to equation (4) explained in the text (red points). The uncertainty bars shown are only type A uncertainty estimates (see upper part of table 2). The red curve is a fit curve according to a part of the temperature expansion given by equation (5), see text. The fit coefficients given in table 1 are a result of a weighted fit according to the individual type A uncertainty estimates of the individual data-point evaluation (see table 2). The dotted black line shows the analogue evaluation with the complete dataset including outliers. The data at 273.16 K published in [10] was just used for a stabilization of the fit (see text).
Download figure:
Standard image High-resolution image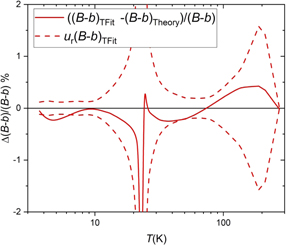
Figure 4. Relative deviation of the fit curve describing the values of the DCGT second viral coefficient (B – b)TFit (fit coefficients given in table 1) from theory. The area between the dashed red curves represents the confidence interval corresponding to the overall relative standard uncertainty of the fit curve (see table 3). The data at 273.16 K published in [10] was just used for a stabilization of the fit (see text).
Download figure:
Standard image High-resolution image
7. Conclusions
This study, summarizing data taken over more than one decade, is unique because it covers a wide temperature range using one technique. The comparison between experimental results for the second virial coefficient of helium obtained by DCGT and the theoretical predictions are a clear proof that ab initio calculations between 3.7 K and 273 K are highly reliable. Regarding the fact that a rigorous estimation of the uncertainty of theoretical calculations is at least problematic, an experimental check is mandatory. In the future, the use of ab initio calculations in different fields of gas thermometry can lead to a drastic reduction in the overall uncertainty of the results for thermodynamic temperature, pressure and other thermodynamic quantities. At the moment, this is a special situation for helium, where in addition a pressure standard is already feasible [28]. All other gases, even the noble gases neon and argon, are by far not as well known. In their cases, the experimental knowledge is more developed than the theoretical one and, therefore, a united work in this field has been started.
Acknowledgments
This work has received funding from the EMPIR programme co-financed by the Participating States and from the European Union's Horizon 2020 R&I programme through the QuantumPascal project. The authors thank Bogumił Jeziorski for providing data from reference [11] and Giovanni Garberoglio and Allan Harvey for providing data from reference [13] prior to publication.
Footnotes
- 1
Identification of commercial equipment and materials in this paper does not imply recommendation or endorsement by PTB, nor does it imply that the equipment and materials identified are necessarily the best available for the purpose.