

Abstract
For decades, meteorologists and governments have been warning communities in coastal areas for an imminent tropical cyclone (TC) using the Saffir-Simpson Hurricane Wind Scale (SSHWS). The SSHWS categorizes a TC based on its maximum wind speed, and is used in defining evacuation strategies and humanitarian response. However, the SSHWS considers only the wind hazard of a TC, whereas a TC can also cause severe conditions through its high storm surges and extreme rainfall, triggering coastal and inland flooding. Consequently, the SSHWS fails to mirror the TC's total severity. This becomes evident when looking at past events such as Hurricane Harvey (2017), which was classified as a Tropical Storm while it caused widespread flooding in the Houston (TX) area, with precipitation totals exceeding 1.5 m. Without including storm surge and rainfall information, adequate risk communication with the SSHWS can be challenging, as the public can (mistakenly) perceive a low-category TC as a low-risk TC. To overcome this, we propose the new Tropical Cyclone Severity Scale (TCSS) that includes all three major TC hazards in its classification. The new scale preserves the categorization as used in the SSHWS, to maintain familiarity amongst the general public. In addition, we extend the scale with a Category 6, to support communication about the most extreme TCs with multiple hazards. The TCSS is designed to be applied on a local-scale, hereby supporting local-scale risk communication efforts and evacuation strategies prior to a TC landfall. The scale can be used for risk communication on both the total TC risk and on the categories of the separate hazards, which can be valuable especially in cases when one hazard is the predominant risk factor, such as excess rainfall triggering flooding.
Export citation and abstract BibTeX RIS

Original content from this work may be used under the terms of the Creative Commons Attribution 4.0 license. Any further distribution of this work must maintain attribution to the author(s) and the title of the work, journal citation and DOI.
1. Introduction
Over the past decades, tropical cyclones (TCs) have greatly impacted the North Atlantic region, causing large economic damage and loss of life through their high wind speeds, storm surges, and precipitation. Some examples are Hurricane Sandy (2012), with over $70 billion in damage, and the 2017 Hurricanes Harvey, Irma and Maria, with total damages exceeding $260 billion (NOAA 2020a). To communicate about the potential threat of the TC, meteorologists commonly classify its maximum wind speeds following the Saffir-Simpson Hurricane Wind Scale (SSHWS; Simpson and Saffir (1974)). The SSHWS categorizes a TC's wind speed on a scale of 1–5 for wind speeds exceeding 33 m s−1, i.e. of at least hurricane strength, and uses the classifications 'tropical storm' and 'tropical depression' for weaker storm systems. However, recent research has shown that most TC-related fatalities in the U.S. are not caused by wind (8%), but by storm surge (49%) and rainfall (27%) (Rappaport 2014). For instance, Hurricane Katrina (2005) was classified as a Category 3 at landfall with wind speeds of around 55 m s−1, but its 8.6 m storm surge caused widespread levee failure around New Orleans (LA), resulting in over 1800 casualties and 125 billion US$ in damage, making it the costliest U.S. TC to date (NOAA 2020a). Another example is Hurricane Harvey (2017), which weakened to a tropical storm after landfall in Texas, but became the highest precipitation event in recorded history with precipitation totals exceeding 1.5 m in the greater Houston area (Blake and Zelinsky 2018). These examples demonstrate that a classification method solely based on wind speed, such as the SSHWS, fails to capture the full severity of a TC. In recent years, various alternative methods of TC classification and indexation have been proposed to overcome this weakness (see table 1). Almost all methods are applied on a pre-event basis, in that they use forecast information to classify a TC hazard, which is important given its function to warn and prepare. However, most classification methods assess either the wind or storm surge hazard, but rarely combine them. Moreover, most of the methods leave out precipitation altogether. The Hurricane Classification System by Senkbeil and Sheridan (2006) is the only method that includes all three TC hazards. However, their Hurricane Classification System is computed post-landfall, meaning that it is limited in use related to warning and preparation.
Table 1. Overview of past tropical cyclone classification methods. Scale characteristics that meet our set of criteria are presented in bold. These criteria are: (1) inclusion of wind, storm surge, and precipitation, (2) applicability for pre-landfall hazard assessment, and (3) discrete nature.
| Tropical cyclone classification method | Tropical cyclone hazard(s) reflected by scale | Applicability | Continuous/discrete | Reference | ||
|---|---|---|---|---|---|---|
| Wind | Storm surge | Precipitation | ||||
| Saffir-Simpson Hurricane Wind scale | Yes | No | No | Pre-landfall | Discrete | Simpson and Saffir (1974) |
| Hurricane Severity Index | Yes | No | No | Pre-landfall | Discrete | Hebert et al (2010) |
| Hurricane Hazard Index | Yes | No | No | Pre-landfall | Continuous | Kantha (2006) |
| Hurricane Intensity Index | Yes | No | No | Pre-landfall | Continuous | Kantha (2006) |
| Integrated Kinetic Energy | Yes | No | No | Pre-landfall | Continuous | Powell and Reinhold (2007) |
| Hurricane Classification System | Yes | Yes | Yes | Post-landfall | Discrete | Senkbeil and Sheridan (2006) |
| Surge scale | No | Yes | No | Pre-landfall | Continuous | Irish and Resio (2010) |
| Hurricane Surge Index | No | Yes | No | Pre-landfall | Continuous | Kantha (2008) |
| Multihazard Hurricane Index | Yes | No | Yes | Pre-landfall | Continuous | Song et al (2020) |
aFrom 1971 till 2009, the NHC used the Saffir-Simpson Hurricane Scale (SSHS), which utilized pressure, storm surge, and wind measurements (Kantha 2013, NHC 2019b). After Hurricanes Katrina (2005) and Ike (2008) demonstrated that storm surge potential based solely on wind categorization was misleading, the NHC dropped all requirements except wind. In 2012, the SSHS was modified to include only the wind component, and has been named the Saffir-Simpson Hurricane Wind Scale since.
TC classification methods are an important component of TC risk communication. Past research from psychology and economics shows that people generally have difficulty understanding low probabilities, and that responses to risk communication can be mediated by emotions such as worry (Petrova et al 2014), and presentation mode (Goldstein and Rothschild 2014, Okan et al 2018). Besides communicating risk, TC hazard warnings should explain uncertainty of predictions, adding another layer of complexity to the interpretation (see e.g. van der Bles et al (2019) for an interdisciplinary review on communicating uncertainty to the general public). Several attempts to improve TC risk communication have been documented, including proposals for and implementations of alternative forecast graphics (Broad et al 2007, Radford et al 2013, NHC n.d., NHC 2017) and interactive visualization tools (Lindner et al 2018).
Naturally, TC classification categories are used by residents for disaster-related decision-making, such as evacuation behavior and preparedness measures. Individuals have to consider many factors when making protective action decisions (such as evacuating or sheltering in place). These factors can include prior TC experiences, social connections and networks, environmental cues, warning messages, and the sources and channels of information they are exposed to (Kasperson and Kasperson 1996, Lindell and Perry 2012, Mase et al 2015, Collins et al 2017, 2018). When confronted with incomplete or inaccurate information, individuals are likely to spend more time gathering additional information before making a decision; this can cost valuable time during the window before a TC impacts (Perry and Lindell 2006, Bean et al 2016). Lazo et al (2010) show that the intention to evacuate seems to be linearly related to SSHWS Category. Recent studies on evacuation behavior in light of hurricanes impacting Puerto Rico, the U.S. Virgin Islands, and Texas show that residents rely heavily on SSHWS Category in evacuation decisions (Morss and Hayden 2010, FEMA 2014a, 2014b). Improving the classification method to better reflect the TC severity could therefore improve residents' preparedness and evacuation decisions aiding a rapid response.
A novel field of disaster research stems from the desire to understand how the public's perceptions of natural hazards are influenced by different risk communication methods (Bourque et al 2012). Studies show that concepts of return periods are difficult to grasp and there is a clear preference for concrete descriptions (Bell and Tobin 2007) and that mobile warning messages are often deemed confusing (Bean et al 2016). Another difficulty in lay understanding of hazard scales is the type of scale. People often apply linear logic to all scales encountered, including logarithmic scales. This may anchor or bias perceptions and leads to problems in risk communication, for example with regards to the logarithmic Richter scale of earthquake magnitude (Celsi et al 2005, Jones and Richardson 2007). Risk communication efforts in various domains have shown that categorization, for example with color coding or traffic light schemes, may be helpful to bring the most important information to attention (Jones and Richardson 2007). Table 2 gives an overview of hazard classification methods for several types of hazards. Note that most classifications are discrete and based on a continuous index. Interestingly, the Pandemic Severity Index was specifically modeled to mimic the discrete hurricane categorization of the SSHWS (Caduff 2010).
Table 2. Overview of hazard classification methods.
| Hazard | Scale name | Nature | Categories | Categories in words |
|---|---|---|---|---|
| Tropical cyclone wind speed | Saffir-Simpson Hurricane Wind Scale | Discrete | 5 | Very dangerous winds will produce some damage, extremely dangerous winds will cause extensive damage, devastating damage will occur, catastrophic damage will occur, catastrophic damage will occur |
| Earthquake (magnitude) | Richter | Logarithmic | — | — |
| Earthquake (intensity) | Modified Mercalli Intensity | Discrete | 10 | Not felt, weak, weak, light, moderate, strong, very strong, severe, violent, extreme, extreme, extreme |
| Forest fire | McArthur Forest Fire Index | Discrete, based on continuous index | 6 | Low-moderate, high, very high, severe, extreme, catastrophic |
| Snowfall | Northeast Snowfall Impact Scale | Discrete, based on continuous index | 5 | Notable, significant, major, crippling, extreme |
| Tornado | Enhanced Fujita | Discrete, based on continuous index (mph) | 6 | Light, moderate, considerable, severe, devastating, incredible |
| Pollution | Air Quality Index | Discrete, based on continuous index | 6 | Good, moderate, unhealthy for sensitive groups, unhealthy, very unhealthy, hazardous |
| Epidemic | Pandemic Severity Index | Discrete, based on continuous index (case-fatality ratio) | 5 | Category 1 to Category 5, designed to mimic hurricane classifications |
| Heatwave | Heat Index | Discrete, based on two continuous variables (temperature and relative humidity) | 4 | Caution, extreme caution, danger, extreme danger |
| Volcano | Alert-Notification System for Volcanic Activity | Discrete | 4 | Normal, advisory, watch, warning |
To overcome the aforementioned weaknesses of the SSHWS and building on past TC classification methods, we argue that an improved classification method should follow the following criteria:
- (a)The scale should include all major hazards, being wind, storm surge, and precipitation;
- (b)The scale should be applicable for pre-event hazard communication;
- (c)The scale should be discrete.
Here, we propose the new Tropical Cyclone Severity Scale (TCSS) following these criteria. Although a discrete scale might impose saturation at high intensities (Kantha 2006), a continuous scale can be more difficult to apply in risk communication to the lay public, as they have been familiar with discrete TC classification for decades. As such, we preserve the 1–5 categorization in the TCSS. Moreover, we extend the scale by an additional Category 6 to communicate the additional risk from multiple extreme hazards that may become more frequently encountered due to the effects of climate change. Even though a Category 6 is not necessary in the current SSHWS as Category 5 already represents total devastation, we believe that an additional category would be useful to communicate the ultimate severity of combined extreme hazards of wind, precipitation and storm surge. Finally, the scale should be applicable for pre-event communication, which can only be achieved if the scale solely consists of variables also used in forecasting. While the SSHWS is commonly applied to communicate on an event-scale basis, a major benefit of the TCSS is that it can be applied on a local scale to warn communities about their imminent danger. This way, people can receive tailored information on the TC's severity for their location, and prepare accordingly.
2. Methods
2.1. Tropical cyclone event dataset
To design and construct the new TCSS, we first extract all North Atlantic landfalling historical TCs between 1996 and 2018 from the National Hurricane Center (NHC) TC reports (NHC 2020b). Subsequently, we exclude those landfall events without casualty or damage statistics. A landfall event (as stated in the 'best track' table in the report) is included when there is either observational or estimated data on the maximum wind speed, storm surge and accumulated precipitation within 100 km from the landfall location. This yields a dataset of 90 TC events, including multiple landfall events from individual TCs. The maximum accumulated precipitation is taken as the highest total amount of rainfall that has been measured at a station within this 100 km of the landfall location. We assume that each of these observations within 100 km from the landfall location provide a good indication of the conditions at the precise landfall location. Local topographical effects, however, might influence each of these variables, but it is difficult to account for these effects when using data from a limited number of measurement stations. Reported wind data in the TC reports are gathered from, amongst others, satellite data, U.S. Airforce Reserve aircraft reconnaissance flights (the so-called 'Hurricane Hunters'), ship reports, radars, automated weather stations, and ocean buoys (NHC 2020b). Storm surge estimates are commonly collected from National Oceanographic Service tide gauge stations and high water-mark surveys conducted by the U.S. Army Corps of Engineers and U.S. Geological Survey. Rainfall data is retrieved from rainfall measurements stations.
Whilst the data from the TC reports used in this study have been acquired post-landfall to test the scale for past storms, the TCSS is designed for pre-landfall usage. In this case, hazard data will be retrieved from TC forecasts. For wind and precipitation, forecast information is collected from numerical weather models (NOAA 2009, NHC 2019a). Such models are generally run at 6 hourly intervals, with a forecast range of 120–240 h. For every model run, its initial conditions are derived from combining model information with observational data from satellites, a procedure also known as data assimilation (see e.g. ECMWF (2020) or NOAA (2020c) for more information on data assimilation in the ECMWF IFS and GFS models, respectively). Storm surges are modeled using the Sea, Lake and Overland Surges from Hurricanes (SLOSH) model (Jelesnianski et al 1984, NHC 2020a). This hydro-dynamical model simulates storm surge heights by using forecast data on atmospheric pressure, TC size, and TC forward speed as input data, and combining this with bathymetry and coastline data.
As with any scale, the performance of the TCSS is inherently dependent on the quality of the input data. Because of possible differences between pre- and post-landfall data, it is important to address forecast errors here. At the end of every TC season, the NHC releases its Forecast Verification Report, the latest one available being the 2018 report at the time of writing (Cangialosi 2019). For the 2018 season, the NHC reported mean forecast errors of 2.6 m s−1 at 12 h forecast time, and 6.7 m s−1 at 72 h and 96 h, both being lower than the 5 year averages. Besides accurate TC intensity forecasts, TC track forecasts also play an important role in storm surge modeling, as storm surge heights are strongly influenced by the location and timing of landfall (NHC 2020a). The NHC Forecast Verification Report lists mean track errors ranging from 44 km at 12 h forecast time, to 344 km at 120 h, which is lower than the 5 year average. Aside from TC track errors, the NHC Forecast Verification Report does not list storm surge and rainfall forecast errors. Luitel et al (2018) found that TC rainfall forecasts provide good skill, especially for lead-times up to 48 h. Various studies have also found good agreement between modeled (using SLOSH) and observed storm surges for different historical TCs (Glahn et al 2009, Forbes et al 2014). As such, we consider the forecast errors to be small enough for any difference between pre- and post-landfall data to not be of substantial impact. Hence, we use the post-landfall data here to design and demonstrate the TCSS.
2.2. Design of the Tropical Cyclone Severity Scale
Next, we define a categorization for wind speed, storm surge, and accumulated rainfall respectively (see table 3). This categorization is based on the severity (potential to damage), similar to the philosophy of the SSHWS. To facilitate interpretation and familiarity amongst risk communicators, the wind speed categorization is directly taken from the SSHWS. For storm surge and accumulated precipitation, there is currently no categorization in place. Choosing thresholds for categories is inherently subjective and, from a mathematical point of view, non-unique. In order to incorporate the SSHWS as the wind-categorization in our TCSS, we therefore follow the design of the SSHWS also for the other hazards. This means that a Category 1 represents moderate damage and a Category 5 catastrophic damage (Simpson and Saffir 1974). However, for the SSHWS, extensive research was done to determine the threshold values for each of the intermediate category thresholds (Thomas 2001). As there is no equivalent study for rainfall and storm surge, we evenly distribute the other thresholds amongst the other categories. The highest threshold for storm surge (4 m) is determined based on observations from TCs with known high-impact storm surges in the historical dataset, including Hurricane Michael (4.26 m) and Hurricane Rita (4.57 m). The TC reports show that historical TCs with storm surges lower than 0.75 m generally had very little impact from this hazard. Therefore, 0.75 m is set as the lowest threshold.
Table 3. Category thresholds for each hazard.
| Category | Wind speed (m s−1) | Storm surge (m) | Accumulated rainfall (mm) |
|---|---|---|---|
| 5 | ≥70 | ≥4.00 | ≥750 |
| 4 | 59–69 | 3.15–3.99 | 589–749 |
| 3 | 50–58 | 2.35–3.14 | 426–588 |
| 2 | 43–49 | 1.55–2.34 | 263–425 |
| 1 | 33–42 | 0.75–1.54 | 100–262 |
| 0 | <33 | <0.75 | <100 |
The highest threshold for accumulated rainfall is chosen based on the notice of 'catastrophic' rainfall impacts in the NHC TC reports. As such, past events like 2017 Hurricane Harvey (1538 mm), 2018 Hurricane Florence (912 mm) and 2001 Tropical Storm Allison (908 mm near the Texas landfall location, 758 mm near the Louisiana landfall location) would have been classified as a Category 5 when considering precipitation. Following these examples, we set the Category 5-threshold for precipitation totals above 750 mm. The lowest threshold should represent accumulated rainfall totals that can have an impact in urbanized regions, albeit temporarily. Such a value, however, cannot be uniformly set for the U.S., as this depends on a city's infrastructure and sewage system. Instead, we use the American Meteorological Society's definitions of rainfall events, and choose the lowest threshold such that moderate rainfall events (between 26 and 76 mm h−1) lasting for 2–4 h, or heavy rainfall events (more than 76 mm h−1) lasting for more than 1 h will be categorized on the TCSS (AMS 2020). Please note that the classification thresholds set here are based on the criteria outlined above, and these could be further improved by including more well-documented historical events and studies on damage of TCs by each of the three hazards (wind, storm surge, and rainfall).
The separate categories in table 3 can already be used in risk communication, especially for TCs where one hazard is the main driver of the TC risk, such as extreme rainfall driving inland flooding. As flooding risk requires different storm preparation strategies than for instance wind risk, risk communicators may wish to convey this distinct TC risk by communicating the separate categories (e.g. a Category-5 rain event) rather than the final category, as is presented next.
After defining the categorization for each separate hazard, these categories are combined into one final category that will be used for risk communication to the general public. This final category needs to adequately reflect the severity of the TC in one location. Therefore, we define a set of constraints that the final categorization should meet:
- (a)The final category can never be lower than the highest hazard-based category;
- (b)The TCSS should adequately reflect the case of high potential risk of two or more hazards. We consider a hazard of high risk when its respective category is classified as 3 or higher (equal to the definition for a Major Hurricane on the SSHWS). Whenever (at least) two high risk hazards have the same category value and the third hazard has a lower category value, the final category should increment the highest hazard-based category. This implies that a TC scoring a Category 3 on both wind and storm surge, and a Category 1 on rainfall, will be classified as a Category 4.
- (c)To warn the general public for an event with multiple extreme hazards, a high-risk TC can be classified as a Category 6 when either 1. at least two of the hazard-based categories are of Category 5; or 2. two categories are of Category 4, and one of Category 5.
To end up at the final category, we first rescale each of the hazard categories using rescaling values (see table 4). These rescaling values have been chosen such that the set of constraints for the final category are maintained. The reason we implement these rescaling values is twofold. First, it is not possible to sum the hazard-based categories as is; a TC scoring a Category 5 and two Category 0s as hazard-based categories would end up as a final Category 5, while a TC scoring a Category 2 on all three hazards would end up as a final Category 6. This would thus violate the above set of constraints. Second, these rescaling values enhance implementation in data post-processing algorithms, as this is a mathematical procedure that can easily be carried out by any programming language. The alternative, i.e. a decision tree based on the set of constraints outlined above, is a more complicated procedure to both implement and execute.
Table 4. Rescaling values for each of the hazard categories.
| Category of hazard | Rescaling value |
|---|---|
| 5 | 40 |
| 4 | 20 |
| 3 | 9 |
| 2 | 2.5 |
| 1 | 0.5 |
| 0 | 0 |
The final category is now determined from the sum of these rescaling values, see table 5.
Table 5. Determination of the final category of the tropical cyclone, with the rescaling values resulting from table 4.
| Final category | Sum of rescaling values |
|---|---|
| 6 | ≥80 |
| 5 | 40–80 |
| 4 | 18–39 |
| 3 | 9–17 |
| 2 | 2.5–8 |
| 1 | 0.5–2.4 |
| 0 | <0.5 |
To demonstrate the use of the TCSS, figure 1 shows the application to Hurricane Florence (2018). Upon landfall in North Carolina, Hurricane Florence had a maximum wind speed of 41 m s−1, a maximum storm surge height of 3.35 m, and maximum precipitation total of approximately 913 mm. Based on table 3, we categorize the wind as a Category 1, the storm surge as a Category 4, and the precipitation totals as a Category 5. Using table 4, these categories would receive a rescaling value of 0.5, 20, and 40, respectively, summing up to a total of 65.5 points. Hence, based on table 5, Hurricane Florence is categorized as a Category 5 on the TCSS.
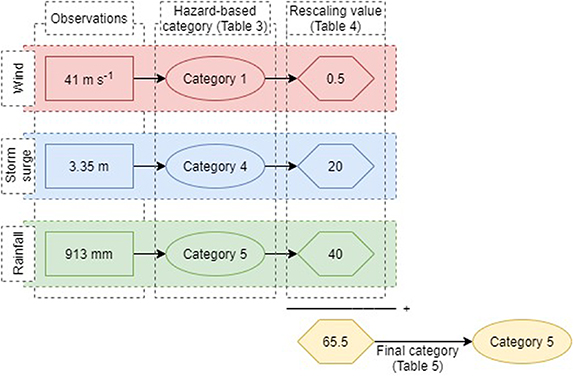
Figure 1. Flowchart demonstrating the application of the Tropical Cyclone Severity Scale to Hurricane Florence (2018).
Download figure:
Standard image High-resolution imageHurricane Florence is a typical case where risk communicators could benefit from the individual as well as the combined nature of the TCSS. Florence's Category-5 ranking is mainly driven by its extreme storm surge and rainfall, which would require different preparation strategies as opposed to a wind event. Here, risk communicators can clearly convey the imminent flooding threat by expressing that Hurricane Florence is a Category 4 for storm surge and a Category 5 for rainfall. Opting for such communication strategies, however, should be evaluated on a case-to-case basis. As such, the results presented in the next section are based on the final categories, but we will clarify the separate hazards wherever appropriate.
3. Results and discussion
3.1. Classification of past tropical cyclones on the Tropical Cyclone Severity Scale
Figure 2 shows a comparison of the categories of all landfalling TCs between the SSHWS and the TCSS. Note that every individual landfall event is included, hence individual storms can be included multiple times. Overall, we see that many TCs increase in category with the TCSS compared to the SSHWS, which is expected given that we use the same thresholds for the wind hazard and give a rating equal to at least the highest hazard category. Of the total 90 landfalling TCs considered, 27 events have the same category using our proposed scale compared to the current SSHWS. The majority, however, is classified as a higher category: 55 TCs are classified one or two categories higher upon landfall, five TCs are three categories higher and one TC is four categories higher. There are also two TC landfall events that are classified five categories higher (i.e. from tropical storm to Category 5: Tropical Storm Allison upon landfall in Texas and Louisiana). We find that the new Category 6 is only given to two TCs that were classified as Category 4 or 5 on the SSHWS, namely Hurricanes Wilma (2005; landfall in Mexico) and Michael (2018; landfall in Florida) respectively.

Figure 2. Change in tropical cyclone categorization between the Saffir-Simpson Hurricane Wind Scale and the Tropical Cyclone Severity Scale. Colors indicate the shift in category, scatter sizes reflect the number of landfalling events for that particular shift in categorization. Numbers between brackets indicate the total number of landfalling events shifting in categorization.
Download figure:
Standard image High-resolution imageNext, table 6 lists the 14 unique TCs that are now classified as a Category 5 or 6 on the TCSS. On the TCSS, the aforementioned Hurricanes Michael and Wilma are classified as a Category 6 due to the combination of high winds and storm surge (Michael) and precipitation (Wilma). Michael made landfall near Panama City, FL, and its wind and storm surge caused 'devastating to catastrophic damage in Bay County, Florida' (Beven Ii et al 2019), resulting in five direct deaths and an estimated 18.4 billion US$ in damage in Florida alone. Wilma hit Yucatan, Mexico, and despite official information on damage not being available, some reports state that conditions were very severe in portions of the peninsula (Pasch et al 2006). Aside from these two Category-6 TCs, 12 TCs are classified as a Category 5 on the TCSS, of which one was also classified as a Category 5 on the SSHWS, namely 2017 Hurricane Irma. This implies that the remainder of the TCs are upgraded in classification using the TCSS, with seven out of 12 classifying as a Category 5 on storm surge, and three as a Category 5 on precipitation. 2016 Hurricane Matthew is the only TC in this list with lower hazard-based categories, but which combination ends up at a final Category 5.
Table 6. Overview of Category 5 and 6 tropical cyclones on the Tropical Cyclone Severity Scale (TCSS), and how this categorization compares to the Saffir-Simpson Hurricane Wind Scale (SSHWS) at the location ofmaximum severity.
| Name | Year | Landfall location ofmaximum severity | SSHWS | TCSS | Composition of TCSS (wind-surge-rain) |
|---|---|---|---|---|---|
| Michael | 2018 | Tyndall Air ForceBase, Florida | 5 | 6 | 5-5-5 |
| Wilma | 2005 | Cozumel, Mexico | 4 | 6 | 4-5-5 |
| Florence | 2018 | Wrightsville Beach, North Carolina | 1 | 5 | 1-4-5 |
| Irma | 2017 | Cayo Romano, Cuba | 5 | 5 | 5-4-1 |
| Maria | 2017 | Yabucoa, Puerto Rico | 4 | 5 | 4-3-5 |
| Matthew | 2017 | Jauco, Cuba | 4 | 5 | 4-4-4 |
| Joaquina | 2015 | Rum Cay, Bahamas | 3 | 5 | 3-5-1 |
| Ike | 2008 | Galveston Island, Texas | 2 | 5 | 2-5-3 |
| Emily | 2005 | Tulum, Mexico | 4 | 5 | 4-5-1 |
| Katrina | 2005 | Louisiana/Mississippi border | 3 | 5 | 3-5-2 |
| Rita | 2005 | Johnson's Bayou, Louisiana | 3 | 5 | 3-5-1 |
| Charley | 2004 | Playa del Cajio, Cuba | 3 | 5 | 3-5-1 |
| Ivan | 2004 | Pine Beach, Alabama | 3 | 5 | 3-5-1 |
| Allison | 2001 | Freeport, Texas | 0 | 5 | 0-1-5 |
a Hurricane Joaquin and Tropical Storm Allison made a second landfall, also as a Category 5 on the TCSS, close to the landfall location given in this table. To avoid repetition, these events have been excluded.
3.2. Local-scale application of the Tropical Cyclone Severity Scale
To demonstrate the applicability of the TCSS in local-scale warnings, figure 3 shows the categorization on the SSHWS (left) and the TCSS (right) for Hurricane Harvey based on observational data (Blake and Zelinsky 2018). Whilst conditions in the majority of the affected region would have been classified as a Tropical Storm on the SSHWS, the TCSS shows a clear spatial distribution of categories, ranging from Category 0 in the outer regions to Category 5 around the Houston-Port Arthur area. These higher categories are driven by Harvey's high accumulated precipitation totals, up to 1.5 m near Port Arthur. By using the TCSS, official warning channels can warn citizens at the local scale for imminent severe conditions from either wind, storm surge, or rainfall, or a combination of these hazards.
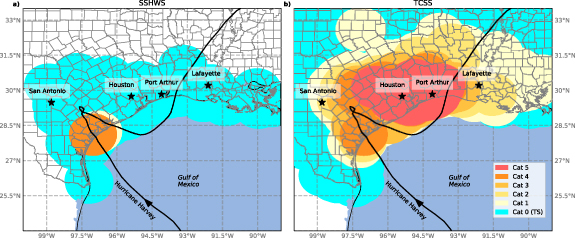
Figure 3. Spatial distribution of Hurricane Harvey's (2017) category based on (a) the Saffir-Simpson Hurricane Wind scale (SSHWS) and (b) the Tropical Cyclone Severity Scale (TCSS). Categorization is determined based on available observational data as given in the Tropical Cyclone Report of Hurricane Harvey (NHC 2020b). Tracks have been extracted from the International Best-Track Archive for Climate Stewardship (IBTrACS; Knapp et al (2010)).
Download figure:
Standard image High-resolution image3.3. Categorizing the costliest U.S. tropical cyclones
To further illustrate the use of the TCSS, figure 4 shows the costliest TCs between 1996 and 2018 (NOAA 2020b). As actual impact also depends on exposure, we do not expect a perfect match, but given that the TCSS reflects the severity of a storm, and arguing that a severe storm can cause more damage, we do anticipate that TCs that caused extensive damage will also score high on the TCSS. Note that the SSHWS categories for the top-20 of the costliest TCs since 1996 vary considerably, including a Tropical Storm (Allison) and four Category-1 TCs at landfall. On the TCSS, 16 out of 20 TCs are classified as a major hurricane (Category 3 or higher), nine of these being in the top-10. The only exception in this top-10 is Hurricane Sandy (ranked the 4th costliest hurricane), which is categorized as a Category 1 on the SSHWS and a Category 2 on the TCSS. Although not being a very intense storm, Sandy was an exceptionally large storm, affecting a large portion of the U.S. East Coast through its storm surge and rainfall. Most of the damage occurred approximately 150 km north of the landfall location, around New York City. Here, the shape of the New York Bight region caused exceptionally high storm surges (>4 m) (Brandon et al 2014), which would have been classified as a Category 5 for that location. This combined with the high population and asset density of that area resulted in the high aggregated damages associated with Sandy. Overall, the effects of high storm surges and rainfall totals are clearly visible in figure by the transition in category: TCs with a higher category on the TCSS obtained this category through a higher categorization on storm surge/precipitation than on wind speed. These results therefore underline earlier findings that storm surge and precipitation considerably add to TC damages (Bakkensen et al, 2018, Neumann et al 2015).

Figure 4. Overview of the top-20 costliest U.S. tropical cyclones (NOAA 2020a) between 1996 and 2018 and their categorization based on (a) the Saffir-Simpson Hurricane Wind Scale (SSHWS) and (b) the Tropical Cyclone Severity Scale (TCSS). These damages are totals over the U.S. per event and are adjusted for inflation to 2020 US$ using the Consumer Price Index adjusted cost. Note that Hurricane Jeanne (2004; 17th costliest between 1996 and 2018) is excluded as no observed storm surge height within 100 km from the landfall location was given in the official tropical cyclone report.
Download figure:
Standard image High-resolution image
3.4. Limitations and directions for future research
In the previous sections, we demonstrated that the TCSS performs well in reflecting the TC's major hazards in terms of potential impacts. As with any system of categorization, there are, however, some limitations to the usage of this scale; these are briefly reflected upon in this section.
First, the classification thresholds of the scale could be further improved by including more (well-documented) historical events and studies on damage of TCs. Moreover, studies on risk perception and behavior could provide valuable input on how the public perceives the scale with the method of combining categories, as well as the practicality of use of the TCSS. Future research on the comprehension of the use of a single category (i.e. our proposed final category) versus using individual hazard categories (which underlie our proposed final category), and the use of Category 6 events, in communication to the public should be considered as they are novel and have not been investigated before.
Second, the current scale is developed for the North Atlantic basin but can theoretically also be used for TCs in other basins. The thresholds of the underlying hazard categories likely have to be revised per basin, as the potential to cause damage and fatalities may be different in other basins. For instance, the rainfall categorization thresholds used in the current version of the TCSS (for the North Atlantic) may not necessarily cause as much problems in areas that have e.g. seasonal monsoons, thus being more used to such rainfall amounts.
Third, the TCSS does not explicitly account for the compound effects of multiple hazards, as the hazards are not interlinked. An example of such compound effect is rainfall water accumulating inland because the rivers cannot discharge into the sea due to high storm surges, even though these hazards by themselves would have had limited impact (e.g. van den Hurk et al (2015)). While the current generation of numerical weather models are capable of providing accumulated rainfall forecasts days prior to a landfall event, and the hydro-dynamical model SLOSH is currently used to estimate storm surge heights along the coasts, the combined effect of these hazards is yet to be represented in models. Such compound effects can be analyzed by coupling hydraulic models (fluvial/pluvial flooding) with hydro-dynamical models (storm surges). Once such a model setup is in place and used in the forecasting of storm surges, the TCSS would then reflect such compound effects as well.
Finally, the design of the TCSS allows for categorization of those TCs that affect land through wind, storm surge, and rainfall. This also implies that risk communication for TCs that either remain over sea, or at time steps where the TC is over open waters, is not possible using the full TCSS, since storm surge and precipitation data are generally absent at these locations. As this can play a role in e.g. risk communication for marine traffic, we suggest using solely the wind categorization of the TCSS (the SSHWS) for these specific situations.
4. Conclusion
In this paper, we have presented a new method of categorizing TCs based on wind speed, storm surge, and precipitation totals. Our TCSS first categorizes each of these three hazards separately, and subsequently derives a final category based on the combination of hazard categories. This final category is a number between 0 and 5, following the discrete nature of the current SSHWS, and is extended by a Category 6 for storms that are extremely severe on several fronts. By first assessing each of the hazards separately and then combining them into one holistic scoring, the TCSS adequately reflects the true TC severity, which will result in better risk communication, evacuation strategies, and humanitarian response. Examples of TCs that score substantially higher on the TCSS compared to the SSHWS are Tropical Storm Allison (2001; Tropical Storm on SSHWS versus Category 5 on TCSS), and Hurricane Ike (2008; Category 2 on SSHWS versus Category 5 on the TCSS). Overall, two TCs that occurred between 1996 and 2018 would have been classified as a Category 6 upon landfall, namely Hurricanes Michael (2018) and Wilma (2005). We showed that the top-20 costliest U.S. hurricanes score higher categories on the TCSS as opposed to the current SSHWS, hereby better reflecting the relationship between TC severity and potential impact on society.
The TCSS is set up to be used pre-landfall, using data available from meteorological and hydrological forecasts. As such, it can be used to create a spatially varying scale, to define different categories for different locations (see figure 3 for a demonstration). This way, the TCSS can assist in more localized risk communication and evacuation strategies. Moreover, the specific hazards of an approaching storm can be communicated easier to the public by referring to the individual hazard categories (e.g. Category 5 for rainfall, but Category 1 for wind and surge). This opens up more possibilities of understanding and communicating the TC's severity, hereby improving information communication to the general public and allowing for enhanced storm preparations and, ultimately, saving more lives.
Acknowledgments
The authors declare no competing interests. This research has been funded by a VICI grant from the Netherlands Organization for Scientific Research (NWO) (Grant Number 453-13-006).
Data availability statement
The data that support the findings of this study are available upon reasonable request from the authors.