


Abstract
Obtaining a better understanding of groundwater dynamics in permafrost zones is a critical issue in permafrost hydrology. This includes assessing the impacts of climate change on permafrost thaw and ground ice-melt. Both permafrost thaw and ground ice-melt can be related to groundwater discharges (i.e. spring discharges), and spring water is an important local water resource; accordingly, changes in these processes can have large impacts on local people and their subsistence activities. To detect permafrost thaw and ground ice-melt in the permafrost zone of Mongolia, groundwater ages of several spring discharges were determined using two transient tracers: tritium (3H) and chlorofluorocarbons (CFCs). Spring water samples were collected seasonally from 2015 to 2019 at seven spring sites around the Khangai Mountains in central Mongolia. The sites included two thermokarst landscapes on the northern and southern sides of the mountains. The 3H and CFC concentrations in the spring water in the thermokarst landscapes were very low, especially on the southern side of the mountains, and the estimated mean groundwater age for these sites was older than that for the other sampled springs. Consequently, the young water ratios of the thermokarst sites were lower than those for the other springs. This ratio, however, showed a gradual increase with time, which indicates that recently recharged rainwater began to contribute to the spring discharge at the thermokarst sites. An atmospheric water budget analysis indicated that net recharge from modern and recent precipitation to shallow groundwater in the summer season was almost zero on the southern side of the mountains. Thus, we inferred that the spring water at the thermokarst sites on the southern side of the mountains contained large amounts of ground ice-melt water.
Export citation and abstract BibTeX RIS

Original content from this work may be used under the terms of the Creative Commons Attribution 4.0 license. Any further distribution of this work must maintain attribution to the author(s) and the title of the work, journal citation and DOI.
1. Introduction
Obtaining a better understanding of groundwater dynamics in permafrost zones is a critical research issue in permafrost hydrology. It is important to determine the impacts of climate change when assessing permafrost vulnerability and detecting permafrost thaw. Permafrost thaw could be accelerating because of current climate warming, thereby leading to a deeper thaw (active) layer. Consequently, ground ice-melt could also be accelerating. Spring discharges are a mixture of young water (i.e. groundwater originating and/or recharged from modern precipitation) and old water (including ground ice-melt water). Quantitative and qualitative changes in spring discharges could have large impacts on local peoples and their subsistence activities.
Compared with groundwater age dating in lower latitudes (e.g. Busenberg and Plummer 1992), there are very few studies focusing on the age estimation of permafrost groundwater. Hiyama et al (2013) determined permafrost groundwater age in eastern Siberia, using four spring discharge samples taken in August each year during 2009–2012. They used transient tracers, including tritium (3H), chlorofluorocarbons (CFCs), and sulfur hexafluoride, to analyze permafrost groundwater age in the middle of the Lena River basin in eastern Siberia. They showed that 3H concentrations ranged from 1.0 to 16.8 tritium units (T.U.), and that the apparent age of groundwater ranged from around 1 to 55 years. One of the springs appeared to contain more than 90% water recharged by precipitation before the 1960s nuclear testing era, and this water could have been partly sourced from thawing permafrost. Although large differences in the age of the permafrost groundwater were found among the four spring discharges, each interannual variation of 3H and CFC concentrations was quite small (Hiyama et al 2013). This may have arisen because the target region is located in a continuous permafrost zone and thus the effect of climate warming was so small that the groundwater age remained stable over the short 4 year period.
The northern part of Mongolia has continuous, discontinuous, and isolated permafrost zones (Obu et al 2019). Guo et al (2018) showed that yearly air temperatures in the permafrost region of the Northern Hemisphere have experienced a statistically significant warming, with trends of 0.13 °C decade−1 for 1901–2014 and 0.40 °C decade−1 for 1979–2014. They drew attention to the fact that air temperatures in the permafrost zone of Mongolia had the largest increasing trend from 1901 to 2014, followed by those in Russia, Alaska, Canada, and China. Thus, Mongolia may be the region of the Northern Hemisphere most vulnerable to warming, with permafrost thaw occurring in conjunction with current climate warming.
Saruulzaya et al (2016) investigated thermokarst lake changes at seven different sites in the continuous and isolated permafrost zones, including the Khangai Mountains in central Mongolia. They noted that both the mean annual air temperature and potential evapotranspiration (PET) have increased significantly in the northern continuous permafrost zone, relative to the southern isolated permafrost zone, since 1962. Based on these observations, they speculated that the shrinking thermokarst lakes in the isolated permafrost zone might be the result of disappearing permafrost and increased water loss through surface evaporation and subsurface drainage. Additionally, many of the major river systems in Mongolia have their source waters located in the high mountains and north-central territory of Mongolia where permafrost is extensive (Dashtseren et al 2014, Ishikawa et al 2018). Consequently, when the hydrology of central Mongolia is researched, it is important to address water dynamics related to thermokarst-dominated landscapes.
The Khangai Mountains in central Mongolia are sparsely populated. Subsistence activities rely on water supplies from low-yielding springs. Spring discharges in the region originate from permafrost groundwater that is mixed with ground ice-melt water (old water) and seasonally recharged by modern precipitation (young water). Thus, the monitoring of spring discharge and the contribution ratio of both waters provides meaningful information for vulnerability assessment of water resources in the region. Consequently, the goal of the present study is to elucidate both estimated permafrost groundwater age and temporal changes in young water ratio in the sampled springs. By estimating the young water ratio of the spring water, this study determines the extent of permafrost thaw and ground ice-melt in the region. It is the first study to survey permafrost groundwater age and permafrost thaw in central Mongolia using the transient tracers 3H and CFCs.
2. Methods
2.1. Study site
The Khangai Mountains are located in central Mongolia. The mountain range is around 700 km long, and the main orientation is in the northwest–southeast direction. The elevations of the ridges are around 2000–3000 m above sea level. Continuous and isolated permafrost underlies the area of the mountains (Obu et al 2019). Many species of short grasses are present on the ground surface, but the northern slopes of the mountains are covered by mixed forest (mainly larch forests) because of the presence of permafrost and the seasonal thaw (active) layer. The main subsistence activity of the local population is the grazing of domestic livestock, such as cattle, sheep, and goats.
From a climatological point of view, clear interdecadal changes in the interannual variability of precipitation have been found in Mongolia (e.g. Hiyama et al 2016). These interdecadal changes were derived from changes in atmospheric circulation patterns over northern Eurasia. Hiyama et al (2016) found that there has been a significant increasing trend in geopotential height in the low-level troposphere over Mongolia since the mid-1980s. Additionally, Erdenebat and Sato (2016) have explored the reasons for the recent (since the late 1990s) increase in heat wave frequency in and around Mongolia. They focused on the roles of atmospheric forcing and the possible influence of soil moisture deficits in Mongolia and found that an atmospheric ridge appeared when heat wave events were observed in the region.
2.2. Water sampling and analyses
Seven water sampling campaigns were conducted during the following periods: August 2015, May 2016, May 2017, August 2017, October 2017, April 2018, and July and August 2019. During each campaign, water samples for analysis of 3H were collected (with duplicates) in 550 ml glass bottles with ethylene–propylene rubber-lined screw caps. Samples for analysis of CFCs were collected (with duplicates) in 125 ml glass bottles. The sample bottles for CFC analysis were flushed with approximately 1 l sample water, then filled and capped underwater to prevent contact with the atmosphere. A peristaltic pump (Welco model Wpx-1000) was used to take water from the spring points.
Figure 1 shows the locations of the spring water sampling points. Three points are located on the northern side and two on the southern side of the Khangai Mountains. Two thermokarst landscapes, the Chuluut (W-05, W-06) and the Galuut (W-14, W-14'), exist on the northern and southern sides, respectively. Two sampling points were selected for each thermokarst landscape. Spring discharge at Udleg (W-27), which is in the vicinity of Ulaanbaatar city, was also sampled for comparison. Table 1 shows the geographical coordinates and altitudes of the spring discharge sites.

Figure 1. The study area: (a) topographical map of Mongolia. The location of the capital city (Ulaanbaatar) is indicated as a red star, the boundary of Mongolia is indicated by a thick black line, and the spring discharge sites are depicted as black dots. (b) Detailed map of the Khangai Mountains and the locations of the sampled springs.
Download figure:
Standard image High-resolution imageTable 1. Geographical coordinates and altitudes of the sampled spring discharge sites.
| Geographical coordinates | Altitude | Remarks | |||
|---|---|---|---|---|---|
| No. | Name of sample | Latitude | Longitude | (m) | (Site no.) |
| 1 | Bayanbulag | N 46°48.222' | E 98°05.678' | 2258 | W-10 |
| 2 | Galuut (north) | N 46°33.441' | E 99°59.378' | 2034 | W-14 |
| 3 | Galuut (south) | N 46°33.439' | E 99°59.377' | 2034 | W-14' |
| 4 | Orookh | N 48°18.780' | E 99°23.692' | 2225 | W-03 |
| 5 | Chuluut (lake) | N 48°03.813' | E 100°22.532' | 1872 | W-05 |
| 6 | Chuluut (road) | N 48°05.142' | E 100°20.745' | 1894 | W-06 |
| 7 | Tsetserleg | N 47°28.950' | E 101°25.398' | 1895 | W-30 |
| 8 | Udleg | N 48°16.219' | E 106°49.388' | 1253 | W-27 |
We used two transient tracers (3H and CFCs) to estimate groundwater age at the springs described above. The 3H concentration of precipitation peaked around 1963 in the Northern Hemisphere as a result of nuclear testing (figure S1, which is available online at stacks.iop.org/ERL/16/015008/mmedia), and the half-life of 3H is relatively short (12.3 years). Thus, the 3H concentrations of the water could be a useful tracer to detect the extent to which the subsurface water originated from precipitation after nuclear testing (Hiyama et al 2013). To estimate the groundwater age of the spring discharges in the region, 3H counting was performed using a low-background liquid scintillation counter (Model LB-5; Hitachi-Aloka, Tokyo, Japan) following electrolytic enrichment of 3H by a factor of about 25 using Fe–Ni electrodes (Hiyama et al 2013). The total analytical precision was better than 0.23 T.U. and the detection limit was 0.3 T.U. The 3H measurements were conducted at the Geo-Science Laboratory Co. Ltd, Nagoya, Japan.
In addition to 3H, CFCs were also used to estimate groundwater age. CFCs are anthropogenic gases that were emitted into the atmosphere from the 1930s to 1987 (IAEA 2006). Atmospheric concentrations of the major CFCs, including dichlorodifluoromethane (CCl2F2; CFC-12), trichlorofluoromethane (CCl3F; CFC-11), and trichlorotrifluoroethane (C2Cl3F3; CFC-113), peaked in the 1990s. Figure S1 shows a historical record of atmospheric concentrations of CFCs observed by the Reston Groundwater Dating Laboratory of the US Geological Survey. CFC values can be used to estimate the age of groundwater that was recharged around 30–70 years ago.
CFC contents of the water samples were measured using a purge and trap gas chromatography procedure with an electron capture detector (GC-ECD) at the Geo-Science Laboratory Co. Ltd, Nagoya, Japan. The procedure involved stripping a 40 ml sample of water containing CFCs using an ultra-pure nitrogen gas. The extracted CFCs were purified and concentrated using a cold trap, and finally injected into the GC-ECD. The precision and detection limit of the analysis were less than 2% and 1 pg l−1, respectively (Hiyama et al 2013).
In this study, we made two assumptions: (a) that the sampled water actually reflected CFC concentrations from the target groundwater in the aquifer; and (b) that the recharged water reached full equilibrium in solubility with the soil gas (atmosphere), and thus that the dissolution of CFCs was preserved within the aquifer. The CFCs in the sampled water were used to estimate recharge age using Henry's solubility law (e.g. Warner and Weiss 1985). For accurate chemical analyses of CFC concentrations in the sampled water, all samples were kept isolated from the ambient atmosphere. The details of the analytic methodologies used are described in Thompson et al (1974), Thompson and Hayes (1979), and Bullister and Weiss (1988). Using the concentrations of CFC-12, CFC-11, and CFC-113 determined from the sampled spring water, the recharge year (i.e. when the sampled water entered the active layer) was estimated using Henry's solubility law. In this study, the equivalent atmospheric concentrations (EACs) of the three CFCs were also calculated using Henry's solubility law (e.g. Warner and Weiss 1985), in which the solubility potentials of CFCs depend on the air temperature and air pressure when the rainwater fell. Current annual mean air temperature in the region varies from −3 °C to 3 °C. However, because the water is recharged above melting point, the representative value of the air temperature was assumed to be 1 °C in this study. Additionally, the mean altitude of the recharge area was assumed to be 2500 m for the seven springs of the Khangai Mountains.
2.3. Electrical resistivity tomography (ERT) measurements
ERT measurement has become an important tool for providing images in sub-surface permafrost research (e.g. Isaksen et al 2002, Hilbich et al 2008, Lewkowicz et al 2011, You et al 2013, Glazer et al 2020). The ERT method is an electrical survey that can visualize underground electrical resistivity. The electrical resistivity of areas with ice-rich permafrost is higher than that of areas with permafrost with lower ground ice content. Additionally, this method can obtain sectional images of the seasonal active layer under the ground surface.
ERT measurements at four sites were carried out from 24 July to 9 August 2019, using a SYSCAL R1 (IRIS Instruments, Orleans, France) with a Wenner array. The electrical resistivity profile at each site had 475 m length, consisting of 96 electrodes with a spacing of 5 m on six cables. The data from the ERT were modeled to 2D images using the RES2DINV software (Loke and Barker 1996). The detailed topographic survey at each site was conducted using an electronic Total Station Pentax PCS-2S (TI Asahi Co., Ltd, Saitama, Japan), which was incorporated with the data from the ERT in the RES2DINV software.
2.4. Atmospheric water budget analyses
To estimate net precipitation (i.e. the net recharge rate of precipitation to the shallow groundwater), an atmospheric water budget was analyzed. For this analysis, satellite- and ground-based measurement data and atmospheric reanalysis data were used. The ERA-Interim atmospheric reanalysis dataset (Dee et al 2011), which has a horizontal resolution of 0.75° × 0.75°, was used in this study. Precipitable water (mm) and atmospheric moisture fluxes in qu (zonal component) and qv (meridional component) (kg m−1 s−1) were used for the analysis. The precipitable water and atmospheric moisture fluxes were vertically integrated from the bottom to the top of the atmosphere in the reanalysis model field. The data were calculated at 6 h intervals (00, 06, 12, and 18 UTC) and considered alongside daily original data. To estimate regional precipitation amounts, we used the Multi-Source Weighted-Ensemble Precipitation (MSWEP) dataset version 2.1 (Beck et al 2017, 2019); this is a global precipitation dataset for the period 1979–2016 with a temporal resolution of 3 h and a spatial resolution of 0.25° × 0.25°.
The concept of atmospheric water budget analysis (Peixoto and Oort 1983, 1992) was applied using the following equations:

where E is evapotranspiration, P is precipitation, C is the atmospheric moisture flux convergence, and Q is the temporal change in the precipitable water PW, which is an integral of q in the atmospheric column. The terms  , q, and v represent acceleration due to gravity, specific humidity, and the horizontal wind vector, respectively. The integral in the first term on the right-hand side of equation (1) and PW range from the bottom (Pb) to the top of the atmosphere (Pt). In this study, Pb was set to the ground surface and Pt was the 100 (hPa) pressure level because less contribution by water vapor can be assumed from 100 (hPa) to the top of the atmosphere.
We evaluated summer (June, July, August) mean atmospheric water budget components from 1979 to 2016. P was obtained from the MSWEP data. C was calculated using ERA-Interim reanalysis data. E was estimated from the residual term of equation (2) by assuming summer mean Q was zero.
2.5. Conceptual hydrological model
Spring discharge water was assumed to originate from two sources. (a) The first source is 'young water' that was recharged primarily from modern precipitation during the post-bomb period (i.e. from 1953 until the 1990s). Recent precipitation that fell from the 2000s onward also contributes to groundwater recharge. Thus, the young water is a mixture of modern and recent waters that contain measurable concentrations of 3H and CFCs. (b) The second source is 'old water' that originated from the pre-bomb period (i.e. before the 1950s). Ground ice-melt water from ice-rich permafrost, containing undetectable concentrations of 3H or CFCs, is also a main contributor to old water.
Because permafrost underlies the region, it can be assumed that the seasonally driven active layer above the permafrost is the active groundwater layer. Figure 2 presents schematic illustrations of a cross-section of groundwater flow in the active layer, with and without underlying ice-rich permafrost. Under these hydrological conditions, it can be assumed that the young water flows within the active groundwater layer. In such environments, the piston flow model (PFM) or exponential mixing model may be applicable for the estimation of mean residence time (and thus groundwater age) (Maloszewski and Zuber 1996). Additionally, in the event that permafrost contains ground ice and contributes to the active groundwater layer, a two-end-member analysis may also be applicable. For the specific hydrologic environment investigated here, a binary mixed model (BMM) can be used to estimate the young water ratio. Application of a BMM in this context will necessitate large differences between the two end members because smaller differences produce large uncertainty in the young water ratio. Fortunately, the concentrations of 3H and CFCs in the ground ice-melt water can be considered to be zero.
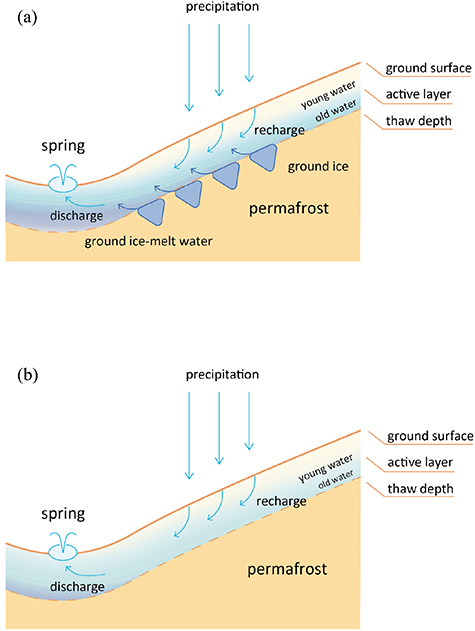
Figure 2. Schematic illustrations of the cross-section of groundwater flow in the active layers (a) with and (b) without ice-rich permafrost. It should be noted that 'permafrost' indicated in the figures includes continuous, discontinuous, sporadic, and isolated permafrost.
Download figure:
Standard image High-resolution image3. Results and discussion
3.1. 3H and CFC concentrations
Concentrations of 3H for all spring water samples are shown in table 2. It can be seen that 3H was detected in almost all spring waters. Because the spring discharge points at the Galuut sites (W-14, W-14') are located in thermokarst landscapes, and because ground ice-melt water can contribute to the spring water, the 3H concentrations were around the detection limit (0.3 T.U.). The Chuluut sites (W-05, W-06) are also located in a thermokarst topography; however, the 3H concentration at W-05 was higher than that expected for a thermokarst topography. A possible explanation for this is that the sampled water did not completely originate from spring discharge and may have mixed with modern precipitation via lake water.
Table 2. Tritium (3H) concentrations of spring water samples.
| Tritium (3H) concentration | ||||||||
|---|---|---|---|---|---|---|---|---|
| No. | Name of samples (Site no.) | Date | (T.U.) | (Bq l−1) | ||||
| 1 | Bayanbulag (W-10) | 10 August 2015 | 31.8 | ±0.3 | 3.79 | ±0.04 | ||
| May 2016 | — | — | — | — | ||||
| May 2017 | — | — | — | — | ||||
| 11 August 2017 | 22.9 | ±0.3 | 2.73 | ±0.03 | ||||
| 26 October 2017 | 16.7 | ±0.2 | 1.98 | ±0.03 | ||||
| April 2018 | — | — | — | — | ||||
| 29 July 2019 | 4.7 | ±0.2 | 0.56 | ±0.02 | ||||
| 2 | Galuut (north) (W-14) | 11 August 2015 | N.D. | N.D. | N.D. | N.D. | ||
| 17 May 2016 | N.D. | N.D. | N.D. | N.D. | ||||
| 12 May 2017 | N.D. | N.D. | N.D. | N.D. | ||||
| 10 August 2017 | <0.32 | N.D. | <0.04 | N.D. | ||||
| 26 October 2017 | <0.32 | N.D. | <0.04 | N.D. | ||||
| 18 April 2018 | <0.31 | N.D. | <0.04 | N.D. | ||||
| 28 July 2019 | <0.31 | N.D. | <0.04 | N.D. | ||||
| 3 | Galuut (south) (W-14') | August 2015 | — | — | — | — | ||
| May 2016 | — | — | — | — | ||||
| 12 May 2017 | N.D. | N.D. | N.D. | N.D. | ||||
| 10 August 2017 | <0.30 | N.D. | <0.04 | N.D. | ||||
| 26 October 2017 | <0.30 | N.D. | <0.04 | N.D. | ||||
| 18 April 2018 | <0.30 | N.D. | <0.04 | N.D. | ||||
| 28 July 2019 | <0.32 | N.D. | <0.04 | N.D. | ||||
| 4 | Orookh (W-03) | 7 August 2015 | 10.7 | ±0.2 | 1.28 | ±0.02 | ||
| May 2016 | — | — | — | — | ||||
| May 2017 | — | — | — | — | ||||
| 13 August 2017 | 7.3 | ±0.2 | 0.87 | ±0.02 | ||||
| 25 October 2017 | 8.2 | ±0.2 | 0.98 | ±0.02 | ||||
| 16 April 2018 | 5.8 | ±0.2 | 0.69 | ±0.02 | ||||
| 2 August 2019 | 11.0 | ±0.2 | 1.31 | ±0.02 | ||||
| 5 | Chuluut (lake) (W-05) | 8 August 2015 | 17.2 | ±0.2 | 2.05 | ±0.03 | ||
| May 2016 | — | — | — | — | ||||
| 13 May 2017 | 17.2 | ±0.2 | 2.05 | ±0.03 | ||||
| 14 August 2017 | 19.0 | ±0.3 | 2.30 | ±0.03 | ||||
| 24 October 2017 | 19.4 | ±0.2 | 2.30 | ±0.03 | ||||
| 16 April 2018 | 17.3 | ±0.2 | 2.10 | ±0.03 | ||||
| 1 August 2019 | 21.6 | ±0.3 | 2.58 | ±0.03 | ||||
| 6 | Chuluut (road) (W-06) | 9 August 2015 | 0.4 | ±0.1 | 0.04 | ±0.01 | ||
| May 2016 | — | — | — | — | ||||
| 13 May 2017 | 5.1 | ±0.1 | 0.61 | ±0.02 | ||||
| 14 August 2017 | 0.8 | ±0.1 | 0.10 | ±0.01 | ||||
| 24 October 2017 | 5.0 | ±0.2 | 0.60 | ±0.02 | ||||
| 16 April 2018 | 2.9 | ±0.1 | 0.34 | ±0.02 | ||||
| 1 August 2019 | 2.6 | ±0.1 | 0.31 | ±0.02 | ||||
| 7 | Tsetserleg (W-30) | August 2015 | — | — | — | — | ||
| May 2016 | — | — | — | — | ||||
| 13 May 2017 | 24.8 | ±0.3 | 2.96 | ±0.03 | ||||
| 14 August 2017 | 23.0 | ±0.3 | 2.75 | ±0.03 | ||||
| 24 October 2017 | 23.2 | ±0.3 | 2.76 | ±0.03 | ||||
| 16 April 2018 | 22.5 | ±0.3 | 2.68 | ±0.03 | ||||
| August 2019 | — | — | — | — | ||||
| 8 | Udleg (W-27) | August 2015 | — | — | — | — | ||
| 14 May 2016 | 15.9 | ±0.2 | 1.89 | ±0.03 | ||||
| 27 May 2017 | 14.4 | ±0.2 | 1.72 | ±0.03 | ||||
| 16 August 2017 | 14.8 | ±0.2 | 1.76 | ±0.03 | ||||
| 30 October 2017 | 14.7 | ±0.2 | 1.75 | ±0.03 | ||||
| 25 April 2018 | 14.1 | ±0.2 | 1.68 | ±0.03 | ||||
| August 2019 | — | — | — | — | ||||
N.D. means 'not detected' and — is 'not sampled'.The sign < means concentrations are close to the detection limits.
Figure 3 illustrates 3H concentrations in precipitation alongside those of the sampled water from all spring discharges. The 3H concentration of precipitation for each year was normalized to the decay value for 2017, considering the half-life of 3H. The 3H concentrations of precipitation in Mongolia (closed triangles in figure 3(a)) were estimated from the relationship between 3H values obtained at Ottawa and those obtained at Ulaanbaatar and the Tsast Ula glacier (Froehlich et al 1998) in Mongolia. The observed 3H values at Ulaanbaatar and the Tsast Ula glacier during 1970–2000 (i.e. over a period of 30 years) were 2.4 times higher than those obtained at Ottawa. From this estimation, the mean 3H concentration of the recent precipitation in Mongolia during the field campaigns (2015–2019) was determined to be 29.1 T.U. As noted above, the 3H concentrations in precipitation were normalized to the year 2017 (figure 3(a)); this made it possible to determine the recharge period of all spring discharges sampled during the field campaigns. Almost all spring discharges at W-05, W-03, W-10, W-30, and W-27 could have been recharged by modern precipitation that fell during the post-bomb period, although several samples from W-03 and W-10 contained old water that was recharged during the pre-bomb period and/or by ground ice-melt water. Conversely, the spring waters of W-14, W-14', and W-06 appear to have been recharged by precipitation that fell during the pre-bomb period or by a mixture of water originating from the pre-bomb and post-bomb periods. These spring waters likely originated primarily from precipitation that fell during the pre-bomb period and/or from ground ice-melt water. In particular, the 3H concentrations of W-14 and W-14' were relatively low and close to the detection limit of 3H (0.3 T.U.), which suggests that these spring waters likely originated from ground ice-melt water. These results are consistent with the locations of the spring discharge points of the Galuut sites (W-14, W-14') in thermokarst landscapes.

Figure 3. (a) Time series of 3H concentrations in precipitation obtained at four sites in the Northern Hemisphere. All 3H values were normalized to the year 2017. The estimated 3H concentrations in Mongolia were derived from the relationship between the 3H values at Ottawa and those at Ulaanbaatar and the Tsast Ula glacier (Froehlich et al 1998). (b) 3H concentrations of all spring water samples obtained at eight discharge points.
Download figure:
Standard image High-resolution imageCFCs were also detected at almost all sites (table 3). Although three kinds of CFCs (CFC-12, CFC-11, CFC-113) were detected at most sites, CFC-11 and CFC-113 showed relatively lower values (or were not detected) at the Galuut (north) (W-14) and Chuluut (lake) (W-05) sites. The low (or undetected) values of CFC-11 and CFC-113 at both sites may have been caused by anaerobic conditions. Under deoxidizing conditions, methane-producing bacteria appear to remove dissolved CFC-11 and CFC-113 (Happell et al 2003). This hypothesis is supported by the gas chromatography analysis, which detected CH4 in both spring waters. In contrast, three kinds of CFCs were detected at the other spring sites, and it is therefore likely that microbial degradation plays a smaller role at these spring sites. However, almost all of the water samples analyzed here can be considered to have been subject to methane-generating conditions to some degree; thus, CFC-11 and CFC-113 may have been underestimated in these samples (figure S2). Accordingly, the values of CFC-11 and CFC-113 were excluded from our estimation of the young water ratio (see below).
Table 3. Concentrations of CFCs, equivalent atmospheric concentrations (EACs), estimated recharge year, residence time calculated using piston flow model (PFM), and young water ratio (YWR) estimated using binary mixed model (BMM) of spring water samples.
| Concentration (pg kg−1) | EAC (pptv) | Estimated recharge year | Residence time (years) | YWR (%) | |||||||||||
|---|---|---|---|---|---|---|---|---|---|---|---|---|---|---|---|
| No. | Name of samples (Site no.) | Date | CFC-12 | CFC-11 | CFC-113 | CFC-12 | CFC-11 | CFC-113 | CFC-12 | CFC-11 | CFC-113 | CFC-12 | CFC-11 | CFC-113 | CFC-12 |
| 1 | Bayanbulag (W-10) | 10 August 2015 | 40 | 5 | 1 | 53 | 1 | 1 | 1963 | 1951 | 1965 | 52 | 64 | 50 | 10 |
| May, 2016 | — | — | — | — | — | — | — | — | — | — | — | — | — | ||
| May 2017 | — | — | — | — | — | — | — | — | — | — | — | — | — | ||
| August 2017 | — | — | — | — | — | — | — | — | — | — | — | — | — | ||
| 26 October 2017 | 102 | 90 | 20 | 137 | 26 | 13 | 1970 | 1965 | 1976 | 47 | 52 | 41 | 27 | ||
| April 2018 | — | — | — | — | — | — | — | — | — | — | — | — | — | ||
| 29 July 2019 | 95 | 71 | 11 | 128 | 21 | 7 | 1970 | 1964 | 1971 | 49 | 55 | 47 | 25 | ||
| 2 | Galuut (north) (W-14) | 11 August 2015 | 6 | 1 | 0 | 8 | 0 | 0 | 1950 | 1944 | 1960 | 65 | 71 | 55 | 2 |
| 17 May 2016 | 2 | 1 | 0 | 2 | 0 | 0 | 1946 | 1948 | 1960 | 70 | 68 | 56 | 0.4 | ||
| 12 May 2017 | 28 | 43 | 5 | 38 | 12 | 3 | 1961 | 1960 | 1969 | 56 | 57 | 48 | 7 | ||
| 10 August 2017 | 24 | 0 | 0 | 32 | 0 | 0 | 1959 | 1940 | 1943 | 58 | 77 | 74 | 6 | ||
| 26 October 2017 | 20 | 0 | 0 | 27 | 0 | 0 | 1958 | 1940 | 1943 | 59 | 77 | 74 | 5 | ||
| 18 April 2018 | 41 | 55 | 10 | 55 | 16 | 7 | 1963 | 1962 | 1971 | 55 | 56 | 47 | 11 | ||
| 28 July 2019 | 67 | 20 | 7 | 90 | 6 | 5 | 1967 | 1957 | 1969 | 52 | 62 | 50 | 18 | ||
| 3 | Galuut (south) (W-14') | August 2015 | — | — | — | — | — | — | — | — | — | — | — | — | — |
| May 2016 | — | — | — | — | — | — | — | — | — | — | — | — | — | ||
| 12 May 2017 | 4 | 4 | 1 | 5 | 1 | 1 | 1948 | 1951 | 1965 | 69 | 66 | 52 | 1 | ||
| August 2017 | — | — | — | — | — | — | — | — | — | — | — | — | — | ||
| 26 October 2017 | 41 | 26 | 8 | 55 | 8 | 6 | 1963 | 1958 | 1969 | 54 | 59 | 48 | 11 | ||
| 18 April 2018 | 34 | 58 | 9 | 46 | 17 | 6 | 1962 | 1962 | 1970 | 56 | 56 | 48 | 9 | ||
| 28 July 2019 | 33 | 14 | 6 | 45 | 4 | 4 | 1962 | 1955 | 1967 | 57 | 63 | 51 | 9 | ||
| 4 | Orookh (W-03) | 7 August 2015 | 216 | 390 | 40 | 291 | 114 | 26 | 1978 | 1974 | 1981 | 37 | 41 | 34 | 56 |
| May 2016 | — | — | — | — | — | — | — | — | — | — | — | — | — | ||
| May 2017 | — | — | — | — | — | — | — | — | — | — | — | — | — | ||
| 13 August 2017 | 209 | 191 | 42 | 282 | 56 | 28 | 1978 | 1969 | 1981 | 39 | 48 | 36 | 55 | ||
| 25 October 2017 | 233 | 444 | 59 | 313 | 130 | 39 | 1981 | 1976 | 1984 | 36 | 41 | 33 | 61 | ||
| 16 April 2018 | 175 | 315 | 40 | 236 | 92 | 26 | 1975 | 1973 | 1981 | 43 | 45 | 37 | 46 | ||
| 2 August 2019 | 222 | 380 | 47 | 299 | 111 | 31 | 1980 | 1975 | 1982 | 39 | 44 | 36 | 59 | ||
| 5 | Chuluut (lake) (W-05) | 8 August 2015 | 96 | 1 | 0 | 129 | 0 | 0 | 1970 | 1944 | 1960 | 45 | 71 | 55 | 25 |
| May 2016 | — | — | — | — | — | — | — | — | — | — | — | — | — | ||
| 13 May 2017 | 129 | 0 | 0 | 173 | 0 | 0 | 1972 | 1944 | 1960 | 45 | 73 | 57 | 34 | ||
| August 2017 | — | — | — | — | — | — | — | — | — | — | — | — | — | ||
| 24 October 2017 | 221 | 0 | 0 | 297 | 0 | 0 | 1979 | 1940 | 1943 | 38 | 77 | 74 | 58 | ||
| 16 April 2018 | 224 | 0 | 0 | 302 | 0 | 0 | 1980 | 1940 | 1943 | 38 | 78 | 75 | 59 | ||
| 1 August 2019 | 138 | 0 | 0 | 186 | 0 | 0 | 1973 | 1940 | 1952 | 45 | 79 | 67 | 37 | ||
| 6 | Chuluut (road) (W-06) | 9 August 2015 | 62 | 70 | 11 | 83 | 21 | 8 | 1966 | 1963 | 1973 | 49 | 52 | 42 | 16 |
| May 2016 | — | — | — | — | — | — | — | — | — | — | — | — | — | ||
| 13 May 2017 | 138 | 62 | 26 | 185 | 18 | 17 | 1973 | 1963 | 1978 | 44 | 54 | 39 | 36 | ||
| August 2017 | — | — | — | — | — | — | — | — | — | — | — | — | — | ||
| 24 October 2017 | 186 | 46 | 30 | 251 | 14 | 20 | 1976 | 1961 | 1979 | 41 | 56 | 38 | 49 | ||
| 16 April 2018 | 146 | 247 | 34 | 196 | 72 | 23 | 1974 | 1971 | 1980 | 44 | 47 | 38 | 38 | ||
| 1 August 2019 | 153 | 245 | 21 | 206 | 72 | 14 | 1974 | 1971 | 1976 | 44 | 47 | 42 | 40 | ||
| 7 | Tsetserleg (W-30) | August 2015 | — | — | — | — | — | — | — | — | — | — | — | — | — |
| May 2016 | — | — | — | — | — | — | — | — | — | — | — | — | — | ||
| 13 May 2017 | 295 | 488 | 68 | 397 | 143 | 45 | 1985 | 1977 | 1985 | 32 | 40 | 32 | 77 | ||
| 14 August 2017 | 277 | 481 | 68 | 373 | 141 | 45 | 1984 | 1977 | 1985 | 33 | 40 | 32 | 73 | ||
| 24 October 2017 | 297 | 525 | 72 | 400 | 154 | 48 | 1985 | 1978 | 1986 | 32 | 39 | 31 | 78 | ||
| 16 April 2018 | 283 | 306 | 53 | 381 | 90 | 35 | 1985 | 1973 | 1983 | 33 | 45 | 35 | 75 | ||
| August 2019 | — | — | — | — | — | — | — | — | — | — | — | — | — | ||
| 8 | Udleg (W-27) | August 2015 | — | — | — | — | — | — | — | — | — | — | — | — | — |
| 14 May 2016 | 192 | 384 | 33 | 258 | 112 | 22 | 1977 | 1974 | 1980 | 39 | 42 | 36 | 50 | ||
| 27 May 2017 | 253 | 386 | 29 | 340 | 113 | 19 | 1981 | 1974 | 1979 | 36 | 43 | 38 | 66 | ||
| August 2017 | — | — | — | — | — | — | — | — | — | — | — | — | — | ||
| 30 October 2017 | 151 | 551 | 30 | 203 | 161 | 20 | 1974 | 1979 | 1979 | 43 | 38 | 38 | 40 | ||
| 25 April 2018 | 265 | 455 | 53 | 356 | 133 | 35 | 1983 | 1976 | 1983 | 35 | 42 | 35 | 70 | ||
| August 2019 | — | — | — | — | — | — | — | — | — | — | — | — | — | ||
Values in italic form (and highlighted in yellow) indicate possibility of microbial degradation.
The EACs of the three CFCs were calculated using Henry's solubility law (e.g. Warner and Weiss 1985) and are shown in table 3. The apparent recharge year of each spring is also presented in table 3, as estimated based on the historical record of atmospheric CFC concentrations (figure S1) together with the calculated EACs for individual CFCs.
Figure 4(a) illustrates the atmospheric concentration of CFC-12 in the Northern Hemisphere (as shown in figure S1) and figure 4(b) indicates the EACs of CFC-12 for all spring waters analyzed. Because the concentrations of CFC-11 and CFC-113 may have been underestimated, only the CFC-12 results are shown in figure 4. The EACs of CFC-12 for the spring waters analyzed here correspond broadly to the atmospheric concentration of CFC-12. Thus, it was possible to evaluate the recharge period from the EACs alone. Although the CFC-12 concentrations at W-05 and W-10 were lower than expected from the 3H results, the CFC-12 concentrations at W-03, W-30, and W-27 are consistent with the results of the 3H analysis. These spring waters have estimated apparent ages of 30–50 years because the CFC-12 concentrations of these spring waters correspond to the range of atmospheric CFC-12 concentrations during the period 1970–1990 (130–500 pptv). These estimations are also consistent with the recharge period estimated from the 3H concentrations. Similarly, the spring waters in the thermokarst sites (W-14, W-14', and W-06) were estimated to have apparent ages of 40–70 years because the CFC-12 concentrations of these spring waters correspond to the range of atmospheric CFC-12 concentrations during the period 1950–1980 (5–320 pptv). These results are also consistent with the apparent age estimations from the 3H values. Thus, it is likely that the spring waters of the thermokarst sites (W-14, W-14', and W-06) originated partly from ground ice-melt water. There are inconsistencies between the 3H and CFC-12 concentrations at W-05 and W-10; in particular, the 3H concentrations and CFC-12 concentrations are higher and lower than expected, respectively. This can be attributed to the effects of lake water on W-05. Similarly, the W-10 site was characterized as a seepage face. One possible explanation for these inconsistencies is that the water sampled for the 3H analysis at W-05 and W-10 did not originate entirely from spring discharge and may have mixed with modern or recent precipitation.
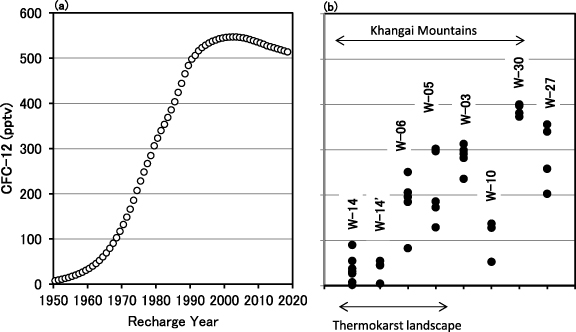
Figure 4. (a) Time series of the atmospheric concentration of CFC-12 in the Northern Hemisphere, as shown in figure S1. (b) CFC-12 concentrations (EACs) of all spring water sampled at eight discharge points.
Download figure:
Standard image High-resolution imageThe 3H and CFC-12 concentrations for all spring water samples are compared in figure 5, in which decadal changes in 3H concentrations in precipitation in Mongolia (as in figure 3(a)) and atmospheric CFC-12 concentrations in the Northern Hemisphere (as in figure 4(a)) have been plotted with the PFM results. The resultant residence times estimated from the EACs of CFCs using the PFM are shown in table 3. A simple BMM line between the mean recent water that recharged during 2015–2019 (i.e. during the field campaigns) and the ground ice-melt water has also been included in figure 5. As mentioned above, the concentrations of CFCs and 3H in the ground ice-melt water can be assumed to be zero. Two additional BMM lines in figure 5 represent the cases of the other end-member values (i.e. young water recharged in 1996 and 2017). Almost all samples analyzed plotted within these BMM lines, with some exceptions, which plotted around the PFM line or outside the BMM lines. Almost all spring discharges at the thermokarst sites (W-14, W-14', and W-06) plotted along the BMM lines or close to the ground ice-melt water area of the plot. These results imply the predominance of groundwater discharge originating from ground ice in these thermokarst landscapes. Conversely, almost all of the spring waters at W-05 and W-10 plotted along the PFM line, which can be attributed to the unique characteristics of these sites (i.e. the lake water influence at W-05 and the characterization of the W-10 site as a seepage face).
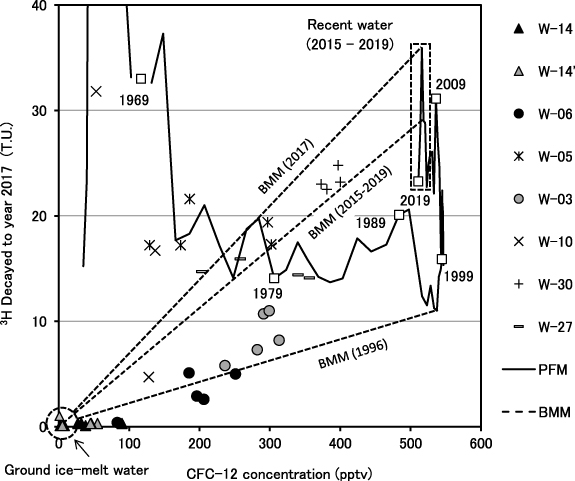
Figure 5. Tracer plots of all spring water samples at eight discharge points, comparing 3H concentrations in precipitation in Mongolia normalized to the year 2017 (as shown in figure 3(a)) with atmospheric CFC-12 concentrations (as shown in figure 4(a)). The solid lines with squares represent unmixed piston flow model (PFM) values with selected apparent ages (e.g. 1969, 1979, 1989). The dashed lines show examples of the binary mixed model (BMM) results for the case between the following end members: mean young water recharged during 2015–2019 (denoted as recent water and shown in a box with broken lines), and old water diluted with ground ice-melt water (shown in a circle with a dashed line). Also shown are two other BMM lines for the cases of young waters recharged in 2017 and 1996.
Download figure:
Standard image High-resolution imageAs shown in figure 5, the 3H concentrations of recent water provide the background level and are variable because of the short half-life time. If it is assumed that the young water is recently recharged water, the 3H concentrations in rainwater for the last 20 years range from 11 T.U. (in 1996) to 36 T.U. (in 2017). These values exhibit considerable variability, which makes them unsuitable for the estimation of the young water ratio with any degree of certainty. Therefore, it is difficult to apply 3H to estimate the young water ratio. In contrast, the EAC of CFC-12 was sufficiently high and the variability (536 ± 20 pptv) from 1997 to 2017 was quite small. Consequently, it is reasonable to estimate the young water ratio from the EAC of CFC-12 using a BMM. Because CFC-11 and CFC-113 were undetected or had values that were lower than expected values from CFC-12 in almost all the springs (figure S2), the young water ratio was estimated using the EAC of CFC-12 only. Table 3 shows the results for the estimated young water ratio, using the BMM between the mean recent water recharged during 2015–2019 and the ground ice-melt water.
Figure 6 shows the seasonal and interannual time-series of 3H concentrations at the Orookh (W-03), Galuut (north) (W-14), and Tsetserleg (W-30) sites. Temporal variations in 3H concentrations at Orookh and Tsetserleg were higher than those at Galuut. Compared with the dating trend of 3H, these variations were larger and can be attributed primarily to temporal changes in the origin of the groundwater. Although there was low variability between sampling campaigns, the variations for Orookh and Tsetserleg showed gradual decreases in 3H concentrations. In contrast, the 3H concentrations at Galuut were always around the detection limit (0.3 T.U.). This may have arisen because all of the spring water originated from ground ice-melt water. After August 2017, the values at Galuut showed small increases (>0.3 T.U.); it is possible that these increases are contributions from recently recharged rainwater.
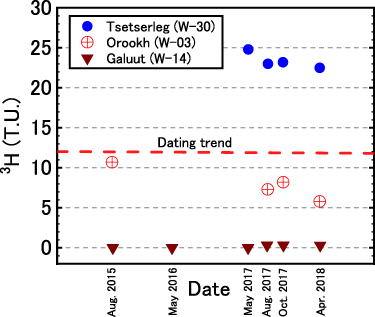
Figure 6. Seasonal and interannual variations in 3H concentrations for the spring water samples obtained at three discharge points: Orookh (W-03), Galuut (north) (W-14), and Tsetserleg (W-30). The overall dating trend for 3H is also shown, for an initial 3H concentration of 12 T.U.
Download figure:
Standard image High-resolution imageFigure 7(a) shows seasonal and interannual time-series of CFC-12 values in the EACs at Orookh (W-03), Galuut (north) (W-14), and Tsetserleg (W-30). A comparison of figures 6 and 7(a) indicated broad similarities between the temporal changes in 3H concentrations and the temporal changes in the EACs of CFC-12; in particular, the concentrations of 3H and CFC-12 varied in the same order at the three sites. Variations in both 3H and CFC-12 exhibited gradual decreases at Orookh and Tsetserleg. The EACs of CFC-12 at Galuut were relatively low (<10 pptv) and exhibited an increase (>30 pptv) after May 2017. Moreover, the concentrations of both 3H and CFC-12 became detectable at Galuut after August 2017; this confirms that recently recharged young water (i.e. that from modern and/or recent precipitation) contributes to the spring water to some extent in this thermokarst landscape.

Figure 7. Seasonal and interannual variations in (a) equivalent atmospheric concentrations (EACs) of CFC-12, and (b) young water ratio (%) obtained at three discharge points (Orookh, Galuut (north), and Tsetserleg).
Download figure:
Standard image High-resolution imageFigure 7(b) shows temporal changes in the young water ratio of the same spring sites shown in figures 6 and 7(a). Again, it is very clear that almost all of the Galuut (W-14) water originated from the ground ice-melt water, with young water appearing at this site after May 2017. Conversely, the spring water at Orookh (W-03) tends to originate more from old water (i.e. there is a reduction in the contribution from young water). This trend was also identified at Tsetserleg (W-30), although the sampling duration was short at this site. Additionally, it is important to note that the contribution of young water exhibited seasonal variation at the non-thermokarst sites: the young water ratio was highest in autumnal spring discharge, perhaps as a consequence of the deepest thaw (active) layer in this season. Thus, these results suggest that the contributions of young and old waters exhibited seasonal changes at non-thermokarst sites. Frequent water sampling was not undertaken in this study; accordingly, definitive explanations of these seasonal variations cannot yet be presented.
3.2. Electrical resistivity tomography
The ERT measurements were undertaken to determine permafrost conditions around spring sites (i.e. to determine whether the sites were ice-rich). It can be assumed that the ground ice in deeper permafrost was frozen completely in the past; this suggests that the ground ice contents in the deeper layers remained very steady and there were no temporal differences in the electrical resistivity. However, under such conditions, the upper part of the permafrost could still have been affected by temperature rise and thus ground ice-melt, which could have contributed to groundwater flow.
The results from the ERT measurements show that there is less ice-rich permafrost underground at the upstream end of the Orookh (W-03) spring (figure S3(a)). This suggests that the contribution of ground ice-melt water is small in this spring. A quantitative evaluation of the contribution from the ground ice-melt water to the Orookh spring water was not possible because ERT measurements orthogonal to the transect line of the electrical resistivity profile at Orookh were not obtained, and because it is difficult to estimate the amount of ice-rich permafrost from ERT results alone. A quantitative evaluation of the ground ice-melt water contribution needs to be carried out in future.
In contrast to the Orookh spring environment, large amounts of patchy ice-rich permafrost exist underground upstream of the Galuut (W-14) spring (Galuut-1 in figure S3(b)). Thus, the contribution of ground ice-melt water could be large in this spring. Interestingly, there are large amounts of ice-rich permafrost under the Galuut-2 line (figure S3(b)), in which no spring discharge exits (figures not shown). It is reasonable to assume that the transect line of the electrical resistivity profile at Galuut-2 was located in the vicinity of the floodplains of the Galuut River.
3.3. Atmospheric water budget
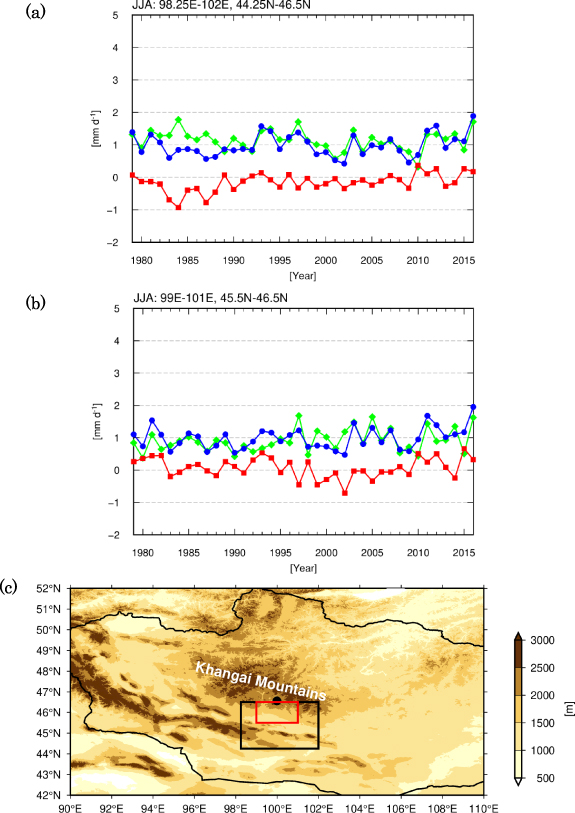
Figure 8 shows time series data for summer mean atmospheric water budget components from 1979 to 2016 in two grid boxes (44.25–46.50°N, 98.25–102.00°E) and (45.50–46.50°N, 99.00–101.00°E), the northern part of which includes the southern foot of the Khangai Mountains. It should be noted that both calculation domains for this atmospheric water budget analysis covered primarily the semi-arid environments of inland Mongolia. Values of precipitation (P), atmospheric moisture flux convergence (C), and evapotranspiration (E) are the 3 month mean values for the summer season (June, July, August). In this study, the atmospheric water budget was only evaluated for the summer season because the surface water recharge to the active groundwater layer mostly occurred in the warmer season with deeper thaw (active layer) depth conditions.
Figure 8. Time series of summer (JJA) mean atmospheric water budget components from 1979 to 2016 in two domains: (a) (44.25–46.50° N, 98.25–102.00° E) and (b) (45.50–46.50° N, 99.00–101.00° E). Blue circles and the blue line represent the precipitation (P) in (mm day−1), red squares and the red line represent the atmospheric moisture flux convergence (C) in (mm day−1), and green symbols and the green line represent the evapotranspiration (E) in (mm day−1). P was obtained from MSWEP version 2.1 (Beck et al 2019), and C was calculated using the ERA-Interim atmospheric reanalysis data (Dee et al 2011). E was estimated from the residual term of the atmospheric water budget (equation (2)) by assuming that the temporal change in precipitable water (Q) (mm day−1) was zero. (c) Map showing the two domains for the evaluations of atmospheric water budget. The Galuut site (closed circle) is included in both domains.
Download figure:
Standard image High-resolution image
Figure 8 indicates that net precipitation ((P−E), the net recharge of modern and recent precipitation to the active layer) in the summer season was almost zero at the southern part of the Khangai Mountains. This includes the Galuut sites (W-14, W-14'). The interannual changes in the water budget components are very similar between the larger domain (figure 8(a)) and the smaller domain (figure 8(b)). This implies that the spring water at the Galuut sites contained large amounts of ground ice-melt water. As mentioned in section 3.1, the Bayanbulag (W-10) spring discharge contains high levels of 3H, which indicates recharge of spring-source groundwater by modern and recent precipitation over the last 60 years. Because the Bayanbulag site lies outside the domain used for calculation of the atmospheric water budget and is located at a higher altitude than the other sites considered (i.e. at the foot of the mountains), the spring water at Bayanbulag (W-10) contains modern precipitation recharged in both summer (rainfall) and winter (snowfall).
The results of the atmospheric water budget analysis indicate that the net recharge of young water to the active groundwater layer in summer was almost zero on the southern side of the Khangai Mountains. Saruulzaya et al (2016) evaluated linear trends in annual precipitation (P), annual PET, and the annual water budgets (P−PET) in Mongolia, and showed that PET has increased significantly in the northern continuous permafrost zone compared with that of the southern isolated permafrost zone. This means that, in the near future, the net recharge of rainwater (i.e. young water) is expected to decline at all locations around the Khangai Mountains. Thus, the impact of current climate change (i.e. higher temperature and less precipitation) on the spring discharges will become more severe through permafrost thaw and ground ice-melt in the region.
Consequently, the authors are obliged to note that spring discharges around the Khangai Mountains are quite vulnerable to climate change and ground ice-melt. Local government should give attention to the plight of the local people who rely on subsistence activities based on the availability of spring water in the region.
4. Summary and future directions
The present study estimated the permafrost groundwater age and young water ratio, and their temporal variations, to detect contributions of ground ice-melt water to the sampled spring discharges around the Khangai Mountains, including springs in two thermokarst landscapes. This study used transient tracers, 3H and CFCs, to evaluate the groundwater ages. Water samples were collected intermittently (annually and seasonally) from August 2015 to August 2019. The concentrations of 3H and CFCs in water samples collected at two thermokarst sites were very low, and thus the apparent groundwater ages from the thermokarst sites were older than those for the other sites. An atmospheric water budget analysis showed that the net groundwater recharge by modern and recent precipitation to the active layer in the summer season was almost zero at the southern part of the Khangai Mountains. This suggests that the ground ice-melt water is the main contribution to the spring water of the thermokarst sites in the southern part of the mountains.
Compared with the results obtained in previous research (Hiyama et al 2013), which estimated permafrost groundwater ages in a continuous permafrost zone in eastern Siberia, the estimated groundwater ages in the present study for the Khangai Mountains exhibit older values (30–70 years) than those (1–55 years) in eastern Siberia (Hiyama et al 2013). Although long-term sampling was not performed in this study, evidence was obtained to show that the groundwater in the region is highly vulnerable as a result of permafrost thaw and ground ice-melt, due primarily to ongoing climate change. Thus, climate change can be considered to affect groundwater resources, which makes them highly vulnerable owing to their connection to permafrost.
The present study successfully detected permafrost thaw in central Mongolia using permafrost groundwater ages estimated from the transient tracers 3H and CFCs. However, to detect permafrost thaw rates (or, more specifically, ground ice-melt rates) in the region, continuous water sampling and analysis of CFCs and 3H are needed. To estimate ground ice-melt rates, the basin area contributing to the spring discharges must be determined; the ground ice conditions of the spring discharge points (more specifically, the volume of ground ice within the corresponding basin) must also be constrained. This requires field surveys, including ERT measurements, to assess permafrost conditions. The quantitative evaluation of the ground ice-melt water contribution from the ERT measurements is, however, not straightforward. It remains an important future research issue in the field of permafrost hydrology.
Acknowledgments
This study was partly supported by the Japan Society for the Promotion of Science KAKENHI Grant Numbers 26242026, 26252021, 17H01849, 19H00556, and 19H05668. It was also supported by the joint research program of the Institute for Space-Earth Environmental Research (ISEE), Nagoya University. Figure 2 was drawn by Ms Erika Shimizu of ISEE, Nagoya University. The authors wish to express their thanks to Dr Ya. Jambaljav and Ms. Yo. Amarbayasgalan for conducting field work in July and August 2019. Our thanks are also given to the anonymous reviewers.
Data availability statement
All data that support the findings of this study are included within the article (and any supplementary files).