Article

Effect of Mechanical Surface Treatments on the Surface State and Passive Behavior of 304L Stainless Steel

1
UMR CNRS 5510 MATEIS, INSA-Lyon, Université de Lyon, 20 Avenue Albert Einstein, 69621 Villeurbanne, France
2
Graduate School of Engineering, Tohoku University, 6-6-01-2 Aoba, Aramaki, Aoba-Ku, Sendai 980-8579, Japan
3
ELyTMaX UMI 3757, CNRS—Université de Lyon—Tohoku University, International Joint Unit, Tohoku University, Sendai 980-8579, Japan
*
Author to whom correspondence should be addressed.
Metals 2021, 11(1), 135; https://doi.org/10.3390/met11010135
Submission received: 22 December 2020 / Revised: 5 January 2021 / Accepted: 8 January 2021 / Published: 12 January 2021

Abstract

:
The effect of dry grinding on 304L stainless steel’s passive behavior is compared to two other surface finishing (mechanical polishing down to 2400 with SiC emery paper and 1 µm with diamond paste, respectively). The characterization of the surface state was performed using scanning electron microscopy, transmission electron microscopy, 3D optical profilometer, and X-ray diffraction. Results indicate that each surface treatment leads to different surface states. The ground specimens present an ultrafine grain layer and a strong plastic deformation underneath the surface, while an ultrafine grain layer characterizes the subsurface of the polished specimens. Grinding induces high residual compressive stresses and high roughness compared to polishing. The characterization of the passive films was performed by electrochemical impedance spectroscopy and Mott–Schottky analysis. The study shows that the semiconductor properties and the thickness of the passive films are dependent on the surface state of the 304L stainless steel.

1. Introduction

Stainless steels (SS) are used as structural materials in various applications, such as nuclear, civil engineering, and building. The main reasons are their relatively high-temperature resistance, good mechanical properties, and corrosion resistance. The SS corrosion resistance is due to the formation of a native passive film on its surface, which has been the subject of intense research [1,2,3,4]. The passive film is composed of two distinct layers: an inner chromium-enriched oxide layer and an outer iron-enriched oxide/hydroxide layer [1,2,5,6]. The outer iron-enriched oxide/hydroxide layer acts as a transition zone between the inner layer and the electrolyte, where electrochemical reactions and ion exchanges mainly occur [3,7]. Conversely, chromium oxide acts as a protective barrier against further oxidation, limiting the material’s dissolution. The properties of the passive film depend, in part, on the environment [8], the chemical composition of the SS [9], and the treatments or post-treatments carried out on the surface of the SS.
After casting, forming, machining, or repair, post-treatments of mechanical surface finish are applied. These processes aim to achieve dimensional requirements, modify the mechanical surface properties and roughness or eliminate flashes and defects in welded assemblies. Dry grinding is one of the processes that is used for these purposes. It is known to induce subsurface modifications characterized by macroscopic defects, including roughness, abrasion, and scratches [10,11]. Besides, this type of surface treatment leads to local dissipation of energy and matter, accompanied by a poorly controlled temperature increase and cooling, which in part leads to a strong residual compressive stress [12,13,14]. Moreover, a dynamic recrystallization is generated by high deformation and local temperature increase, inducing a nanostructured structure called ultrafine grain layer [13,15,16]. These surface modifications can affect the local properties of the material and the reactivity of the SS [5]. Consequently, they can induce harmful alterations to the passive film formed on the SS, affecting their corrosion and stress corrosion cracking (SCC) resistances [5,15,17,18].
One of the main factors controlling the behavior of a passive film (formation and degradation) is its electronic properties. Indeed, the SS passive state is governed by ionic and electronic transports closely related to the structure and properties of the film. Considering the passive film as a semiconductor, doping elements or point defects are assumed to be the main cause responsible for the semiconductive behavior but also to contribute to the electrochemical reactions, as summarized in the point defect model (PDM) [19,20,21]. Their migrations are involved in the mechanism of formation, growth, and steady-state of the passive film. For the evaluation of semiconductor properties, the Mott–Schottky (MS) approach is often used [1,22,23]. It has been shown that the doping densities in the passive film are closely related to the surface state of the material and can provide a relevant indicator of the passive behavior. For example, their density may depend on surface roughness or residual stresses from mechanical surface treatment [24]. Local modifications of the charge carrier densities or transport through the film may affect the balance of the steady-state processes inducing the breakdown [19,20,22]. Therefore, it is essential to understand the electronic properties of passive film before studying the susceptibility to localized corrosion processes, including pitting and SCC.
The present study evaluated the influence of the microstructure changes induced by a dry grinding process on passive film properties formed on a 304L SS. Two other surface states were also studied to discriminate the role of surface modifications due to dry grinding: one polished down to 2400 SiC, and one polished down to 1 µm diamond paste. This selection was strategically designed to limit surface changes such as roughness, scratches, as well as residual compressive stresses and microstructural modifications. Thus, the comparison of the passive film properties formed on a ground and the two polished surfaces could clarify the surface modification effects by mechanical treatment on SS’s passive behavior.
Surface modifications were characterized by scanning electron microscopy (SEM), transmission electron microscopy (TEM), X-ray diffraction (XRD) measurement, and 3D optical profilometer. The properties of the passive films were studied in a non-aggressive environment using a buffer solution of H3BO3 (0.05 M) and Na2B4O7 10H2O (0.075 M) (pH = 9.2). The electrochemical and electronic properties of the passive films were mainly determined by polarization curve measurements and multi-frequency electrochemical impedance spectroscopy (EIS) to apply the Mott–Schottky approach [21,24].

2. Materials and Methods

2.1. Surface Preparations

A commercial austenitic 304L stainless steel was used in this study. The as-received plate was degreased and cleaned before the different mechanical surface treatments. Three groups of samples were prepared from the as-received material to distinguish the role of the different parameters related to surface modifications after surface finishing. The first series was designed from a manually ground plate. The grinder surface finish was first prepared with Green Ace Gold (grain number: #46) and then with the Mac flat disc (grain number: #60), following the same protocol as our previous work [16]. Each grain of abrasive on the wheel’s surface cuts a small chip from the workpiece via shear deformation. During the grinding process, the original workpiece was dissociated into the machined surface and the chips. The second and third sets of samples were the polished samples obtained from the as-received plate. One series was polished with emery papers down to 2400 with SiC (320 SiC, 600 SiC, 1200 SiC, 2400 SiC) while the second series was polished with several emery papers and then with diamond paste down to 1 µm (320 SiC, 600 SiC, 1200 SiC, 2400 SiC, 3 µm with diamond paste, 1 µm with diamond paste). As all the preparations were done manually, it remains difficult to entirely control the affected material’s thickness for the grinder surface finish and the mechanical polishing process. Consequently, the microgeometry and topography of the machined surface have to be carefully characterized. Microstructure modifications of the underneath material also have to be clearly defined.

2.2. Surfaces and Subsurface Analysis

As the surface and subsurface were affected by the consequences of thermomechanical effects due to the preparation’s friction, several approaches were chosen to characterize the affected zone. Surface roughness was measured using the MICROMAP 3D optical profilometer. The root means square (RMS) parameter was selected as a relevant parameter. This descriptor was preferred to Ra because of its higher sensitivity to the microscopic surface texture. The surface and subsurface of the samples were characterized by SEM (SU-70, Hitachi, Tokyo, Japan). TEM (HF2000, Hitachi) observations were carried after FIB cross-section to characterize the microstructural modifications underneath the surface. Residual stresses generated by the surface preparation were evaluated by XRD with the cosα− method (µ-X360s, Pulstec Company, Hamamatsu, Japan). This method is an alternative to the classical sin2Ψ method. Note that Matsuda et al. [25] showed that the differences in the two methods were tiny. A Cu X-ray source was selected to access the lattice deformation of the austenite plans (311). The X-ray spot had a diameter of 2 mm, while the average penetration depth of the X-ray beam was estimated to about 10 µm.

2.3. Characterization of the Passive Film Properties

After preparation, the surfaces were rinsed in distilled water, ultrasonically cleaned in ethanol, and dried with pulsed air. Specimens were directly immersed in a H3BO3 (0.05 M) and Na2B4O7 10H2O (0.075 M) buffer solution (pH = 9.2) for 24 h. This buffer solution has been chosen to stabilize the oxi-hydroxide nature of the passive film and minimize the solubility of the Cr-oxide. Moreover, it is close to the composition of the primary circuit corresponding to the nuclear environment which are considered in our global study. Electrochemical measurements were performed in a three-electrode cell set-up connected to a potentiostat (SP-300, Biologic), with a large carbon rod as a counter electrode and a mercury/mercurous sulfate electrode (EMSE = 0.65 V vs. SHE) as a reference electrode. The working electrode was the 304L SS with an exposed surface of 0.57 cm2 in contact with the electrolyte. Before carrying out the electrochemical measurements, samples were exposed to the solution for 24 h, and the open circuit potential was monitored. Then, two different tests were selectively performed:
  • Polarization curve attended to characterize the surface’s electrochemical behavior (film formation, passivation ability) in the potential range between −0.8 V to 1.2 V vs. MSE. The scan rate was fixed to 0.5 mV·s−1.
Multifrequency electrochemical impedance spectroscopy (EIS) has been carried out to apply the Mott–Schottky (MS) approach and determine the passive film’s semiconductive behavior. The EIS diagrams were recorded by scanning the potential from −1.40 V to 0.00 V vs. MSE using a potential step of 50 mV in the anodic direction. This step was used to avoid changes in the passive film [26]. An EIS diagram was recorded for each potential in a frequency range from 100 kHz to 100 mHz, with 9 points per decade and a sine wave amplitude of 15 mV. A wide range of potentials was used in this study to highlight the passive film’s overall behavior. However, this potential range fulfills the requirements of MS approach (passive domain or low current density). Note that the MS multi-frequency methodology was used to avoid the frequency dependence of the results. Detailed descriptions of this approach’s procedure and advantages are given in Marcelin et al. [21].

Semiconductive Properties Determination

MS analysis was based on the relationship between the doping densities (NA or ND) and the space charge capacitance (Csc) as a function of the applied potential and the type of semiconductive behavior Equations (1) and (2) [27,28]. For a thin layer, the capacitance of the film is associated with the space-charge layer.
1 C 2 1 C S C 2 = 2 e ε ε 0 N D ( E E f b k B T e ) ( n-type )
1 C 2 1 C S C 2 = 2 e ε ε 0 N A ( E E f b k B T e ) ( p-type )
where e is the absolute value of the electron charge, ε is the relative dielectric constant of the oxide ( ε = 12 is commonly used for iron or chromium oxides [28,29,30]), ε 0 is the vacuum permittivity (8.85 × 10⁻¹⁴ F·cm2), and NA et ND are the acceptors and donors doping densities, k B is the Boltzmann constant, T is the absolute temperature, and E f b is the flat band potential.
According to Equations (1) and (2), the doping densities Nq (NA or ND) can be determined from the slope of experimental plots 1/C2 versus E, which must be linear, with a positive slope for n-type semiconductor and a negative slope for p-type semiconductor. The acceptor NA or the donor ND doping densities in the oxide film are quantified by Equation (3).
N q = 2 ε ε 0 e a
where a is the slope of the straight line in the Mott–Schottky plots.
In the case of passive material, the high-frequency capacitive behavior is related to the passive film that acts as a dielectric layer. Nevertheless, the capacitance of the passive film is not directly assessable. To extract the capacitance value, a transformation of the impedance spectrum by complex capacitance corrected from the electrolyte resistance, R e l e l c t r o l y t e representation is useful [31,32] Equation (4).
C ( ω ) = 1 i w [ Z ( ω ) R e l e l c t r o l y t e ]
where Z(ω) is the global impedance of the interface, and ω is the angular frequency.
It has recently been shown that the extrapolation of the complex-capacitance diagram at infinite frequency was a reliable way to determine the film’s capacitance and the corresponding thickness [32,33]. Using the complex-capacitance representation, it was possible to determine the passive film capacitance. Besides, the thickness of the passive film was determined via Equation (5).
δ = ε 0 ε C
where δ is the thickness of the passive film.

3. Results

3.1. Surface State Characterizations

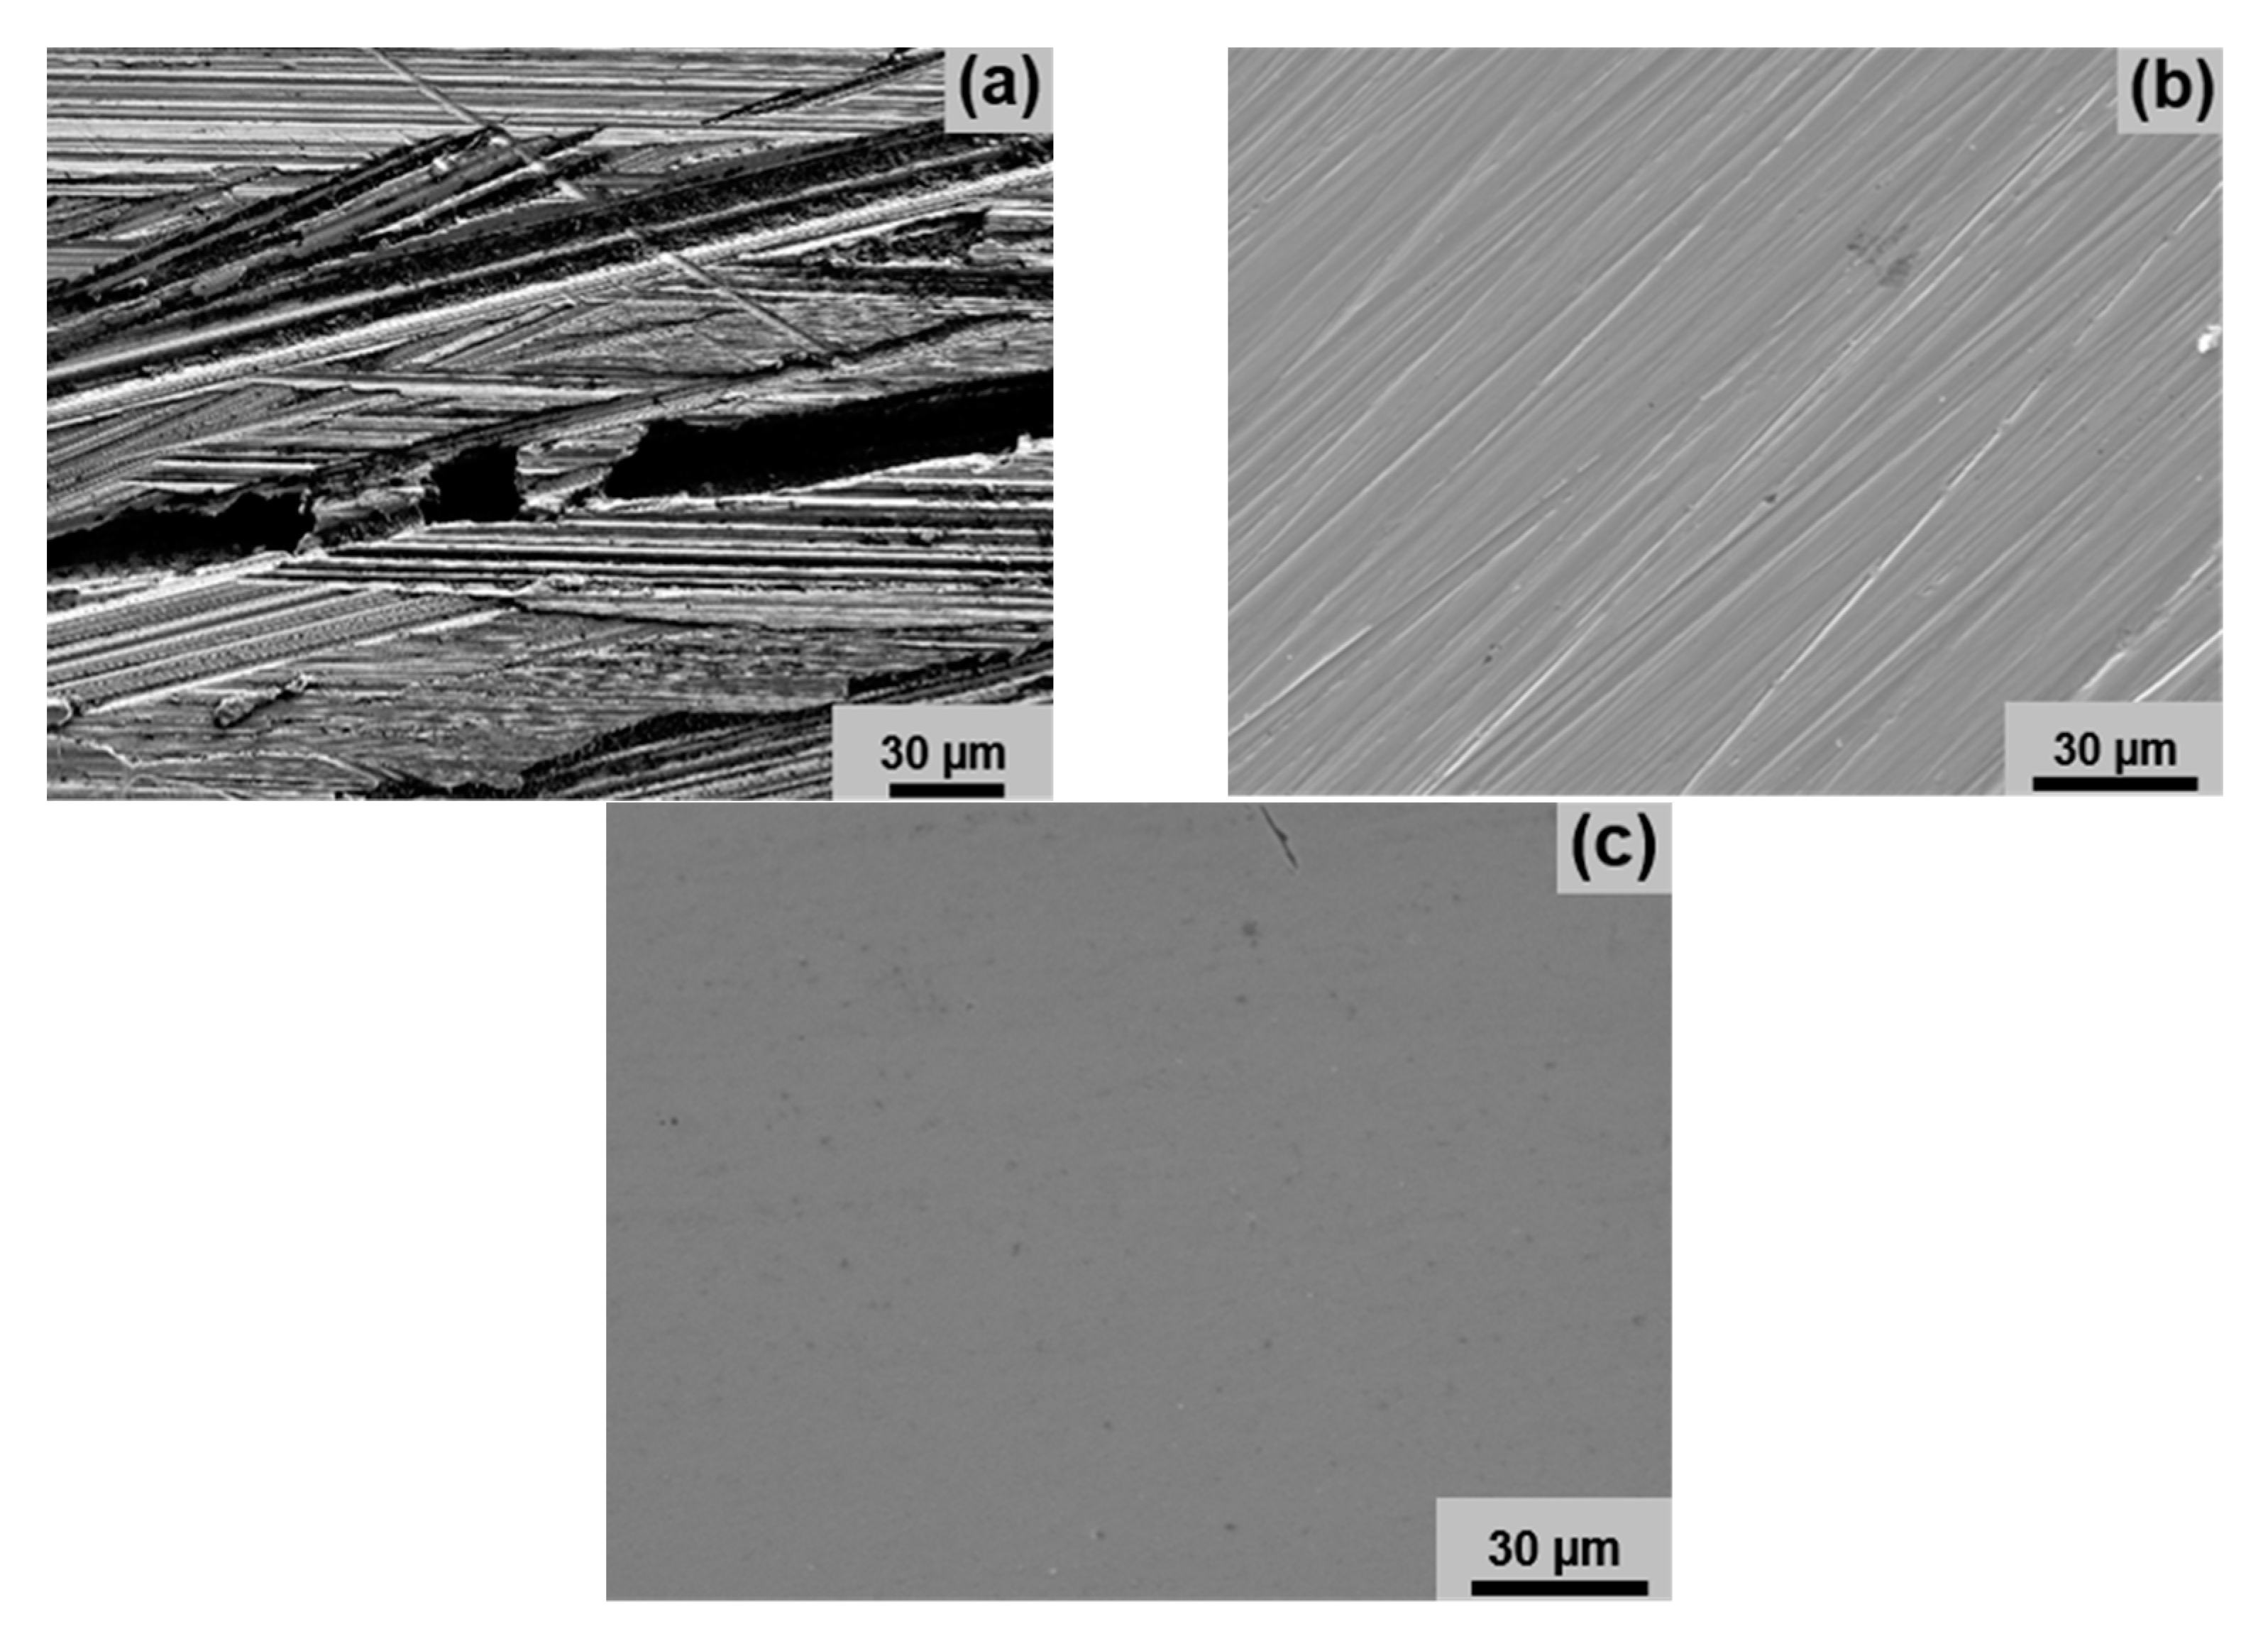
3.1.1. Top Surface Characterizations

SEM observations of the top surface after surface preparation are shown in Figure 1. The ground surface appears more damaged Figure 1a than the two polished surfaces Figure 1b,c. The ground surface Figure 1a shows severe material detachments in the parallel direction to the grinding process. Material removal leads to crack-like valleys and ridges that provide a significant surface roughness of 1300 nm Table 1. Chip generation involves the presence of deep scratches. These observations suggest that abrasive and cutting wear occurred during the grinding process. The surface polished down to 2400 SiC, shows fewer deep scratches and less abrasion than the ground surface, but on the contrary, the surface is almost flat. The surface polished down to 1 µm with diamond paste is the smoothest and Figure 1c shows no scratches and no abrasion in contrast to the other two surfaces Figure 1a,b. For polished specimens down to 2400 with SiC and down to 1 μm with diamond paste, the roughness values are 12 nm and 16 nm Table 1, respectively. According to the estimated deviation, these values are considered almost identical for both specimens.

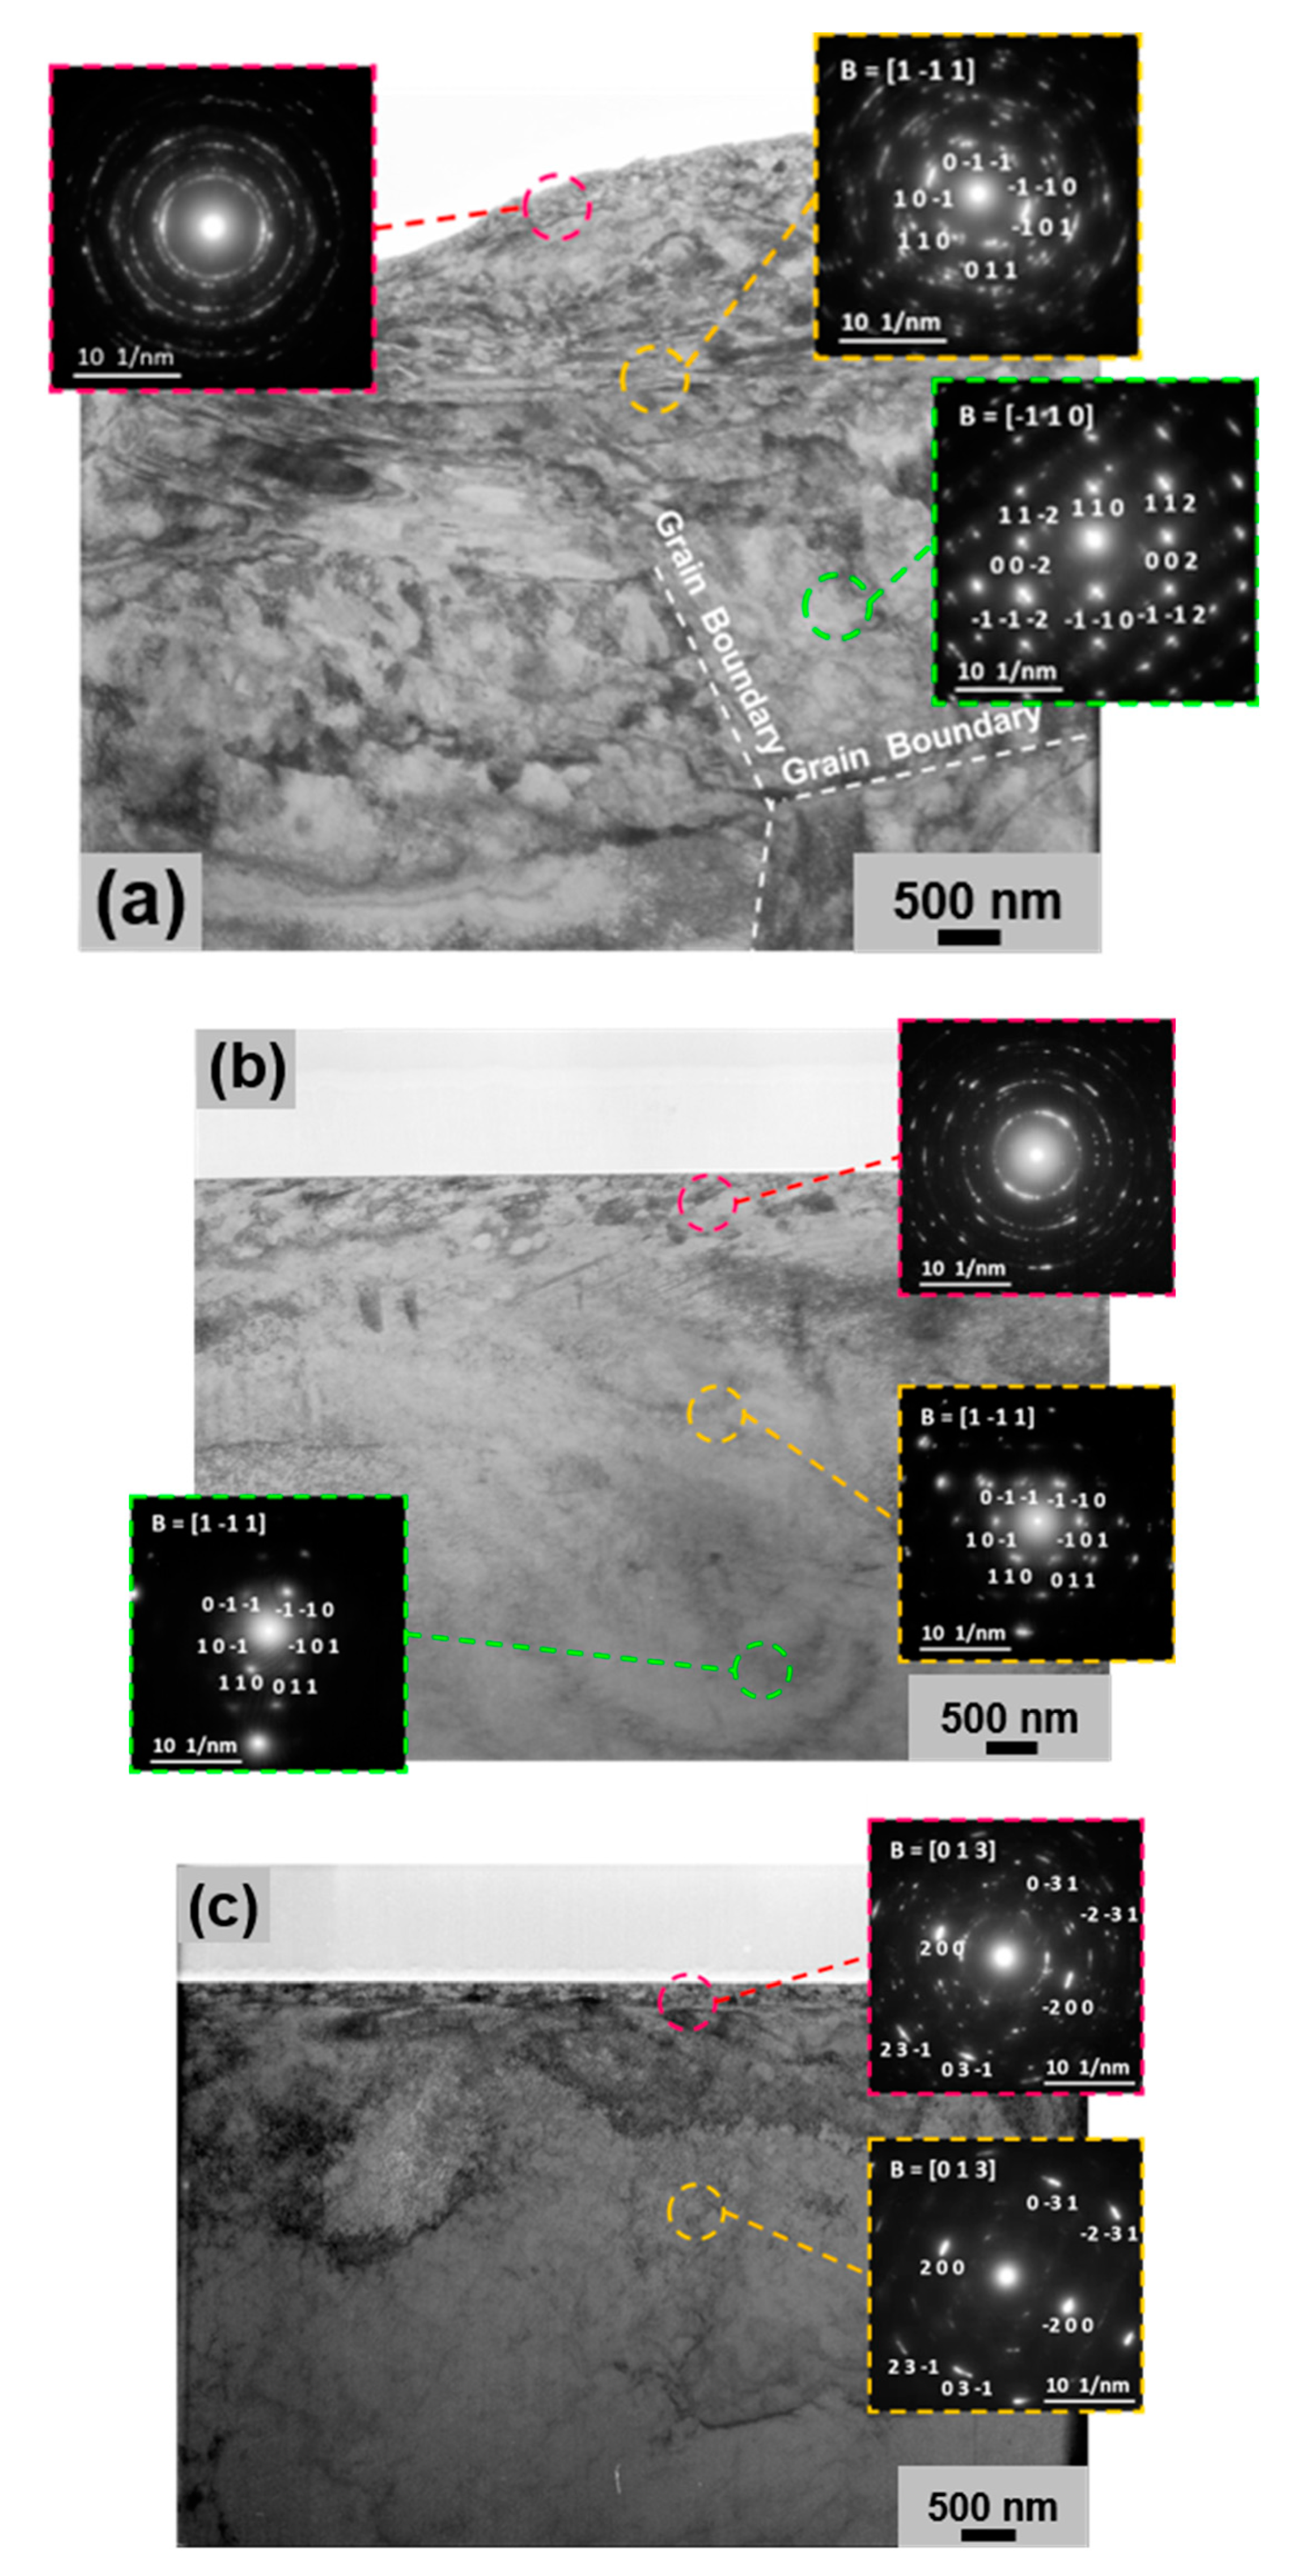
3.1.2. Microstructural Subsurface Modifications

As a result of the thermomechanical surface history, which combines surface stress and local increase of temperature due to friction, a modification of the subsurface microstructure can be observed, as shown in Figure 2. Focused ion beam (FIB) coupled to TEM has been used to characterize the microstructure modifications as performed in a previous study [16]. FIB cross-sections observed by TEM reveal a bi-layer structuration of the underneath material. Whatever the surface preparation, an ultrafine-grained layer is detected into the metal at the vicinity of the top surface [34]. This layer is characteristic of a severe plastic deformation associated with dynamic recrystallization. For all the specimens, the TEM electron diffraction patterns in the ultrafine-grained region suggest a crystalline structure with a significant crystallographic anisotropy due to plastic deformation. For the ground specimens Figure 2a, the thickness of the ultrafine-grained layer is not homogeneous presenting variation from 160 nm to 250 nm Table 1. Below the ultrafine-grained layer, a work-hardened zone and a plastic flow zone are identified through the diffraction pattern. Those zones are not observed for the two other surface preparations suggesting that the affected zone by the surface treatments is deeper with the grinding process than the two other surface states. Polishing with an abrasive paper made of SiC generates more stresses in the material than polishing with cloths and using diamond paste. Therefore, the thickness of the ultrafine grain layer is slightly higher for polishing down to 2400 with SiC Figure 2b than for polishing down to 1 µm with diamond paste. Figure 2c. In fact, the successive polishing steps down to 1 µm allow the removal of part of the ultrathin layer generated by the previous preparation steps with a limited damage process.

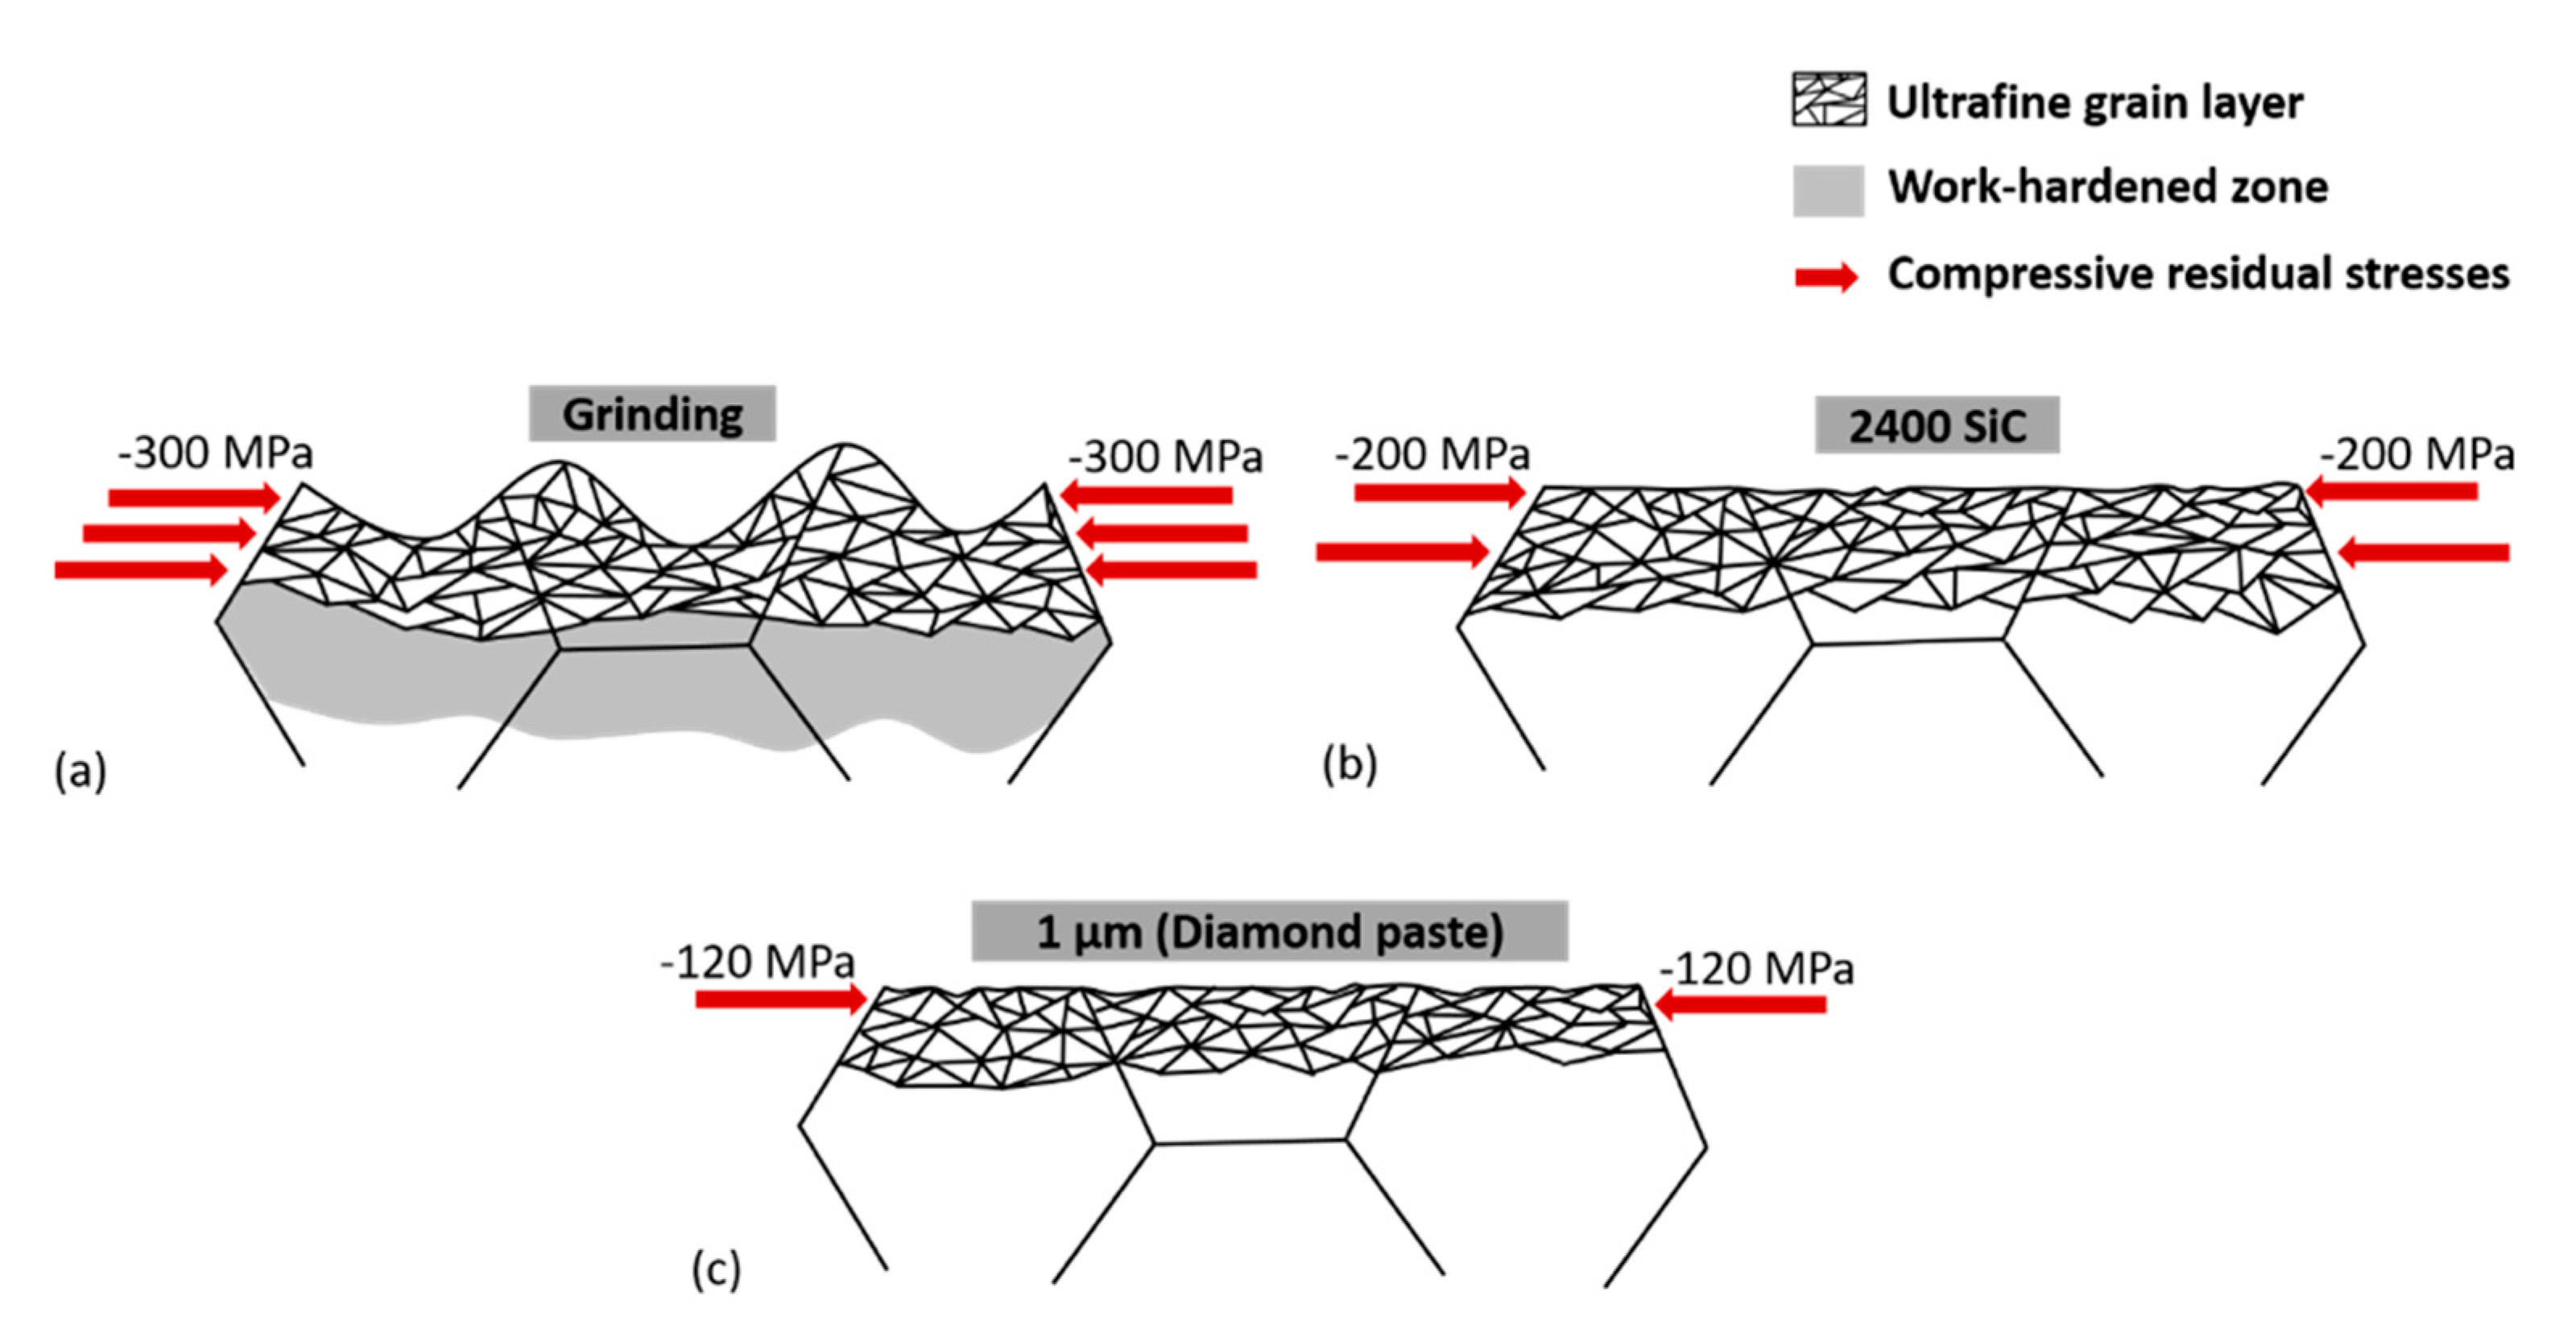
3.1.3. Residual Stresses Generated through Mechanical Surface Modification

The residual stress values measured using XRD are reported in Table 1. The residual compressive stress is equal to −432 MPa for the ground sample, and it is lower for the polished sample down to 2400 SiC with a value of −200 MPa, which is itself lower than for the polished sample down to 1 µm, with a value of −110 MPa. It should be mentioned that these values are of the same order of magnitude as those found by V. Vignal et al. [35]. These values represent the average stresses in the volume affected by the incident X-ray beam. As the X-ray beam’s mean penetration depth was estimated larger than the work-hardened layer, a stress gradient is expected with high compressive stresses at the top surface and decreasing into the material. The microstructure modifications previously characterized coincide with different stress levels in the subsurface layer. Dry grinding generates a large plastic deformation and a thick affected zone where compressive stresses reach −432 MPa.

3.2. Corrosion Behavior in Borate Buffer Solution

3.2.1. Electrochemical Characterizations in Borate Buffer Solution

During the 24 h of immersion, the OCP of the three surfaces finishing tested increases in consistency with the passive layer formation. After 24 h of immersion, OCP reached stable values of −0.61 V vs. MSE and −0.58 V vs. MSE for 1 µm and 2400 SiC polished surface, respectively. The OCP for the ground surfaces is slightly higher than both polished surfaces, with a value at −0.51 V vs. MSE. Potentiodynamic curves recorded after 24 h of immersion in borate buffer solution are plotted in Figure 3. Their shapes are similar regardless of the materials and are consistent with a stable passive film formed during 24 h. Before reaching the conventional plateau of passivity, the current density increases slightly from OCP, indicating that oxygen reduction contributes to the total current density measured in this potential range. The passive plateau is reached at 0 V vs. MSE for the surface polished down to 1 µm, with an average current density of 0.15 mA·cm−2. For the polished surface down to 2400 SiC, the passive plateau is reached at −0.9 V vs. MSE, with an average current density of 0.12 mA·cm−2. The passive plateau is achieved at 0.25 V vs. MSE, with an average current density of 0.03 mA·cm−2 for the ground specimen. The passive plateau length is 0.60 V, 0.50 V, and 0.25 V for polished sample down to 1 µm, down to 2400 SiC and ground sample, respectively. At 0.50 V vs. MSE, an abrupt increase of current density indicates that transpassivation of the passive film and oxygen evolution reaction occur. Thus, the passive film is dissolving, and the material’s surface is no longer protected [36]. For SS, the transpassivation is associated with the oxidation of Cr3+ of chromium oxide Cr2O3 into Cr6+.

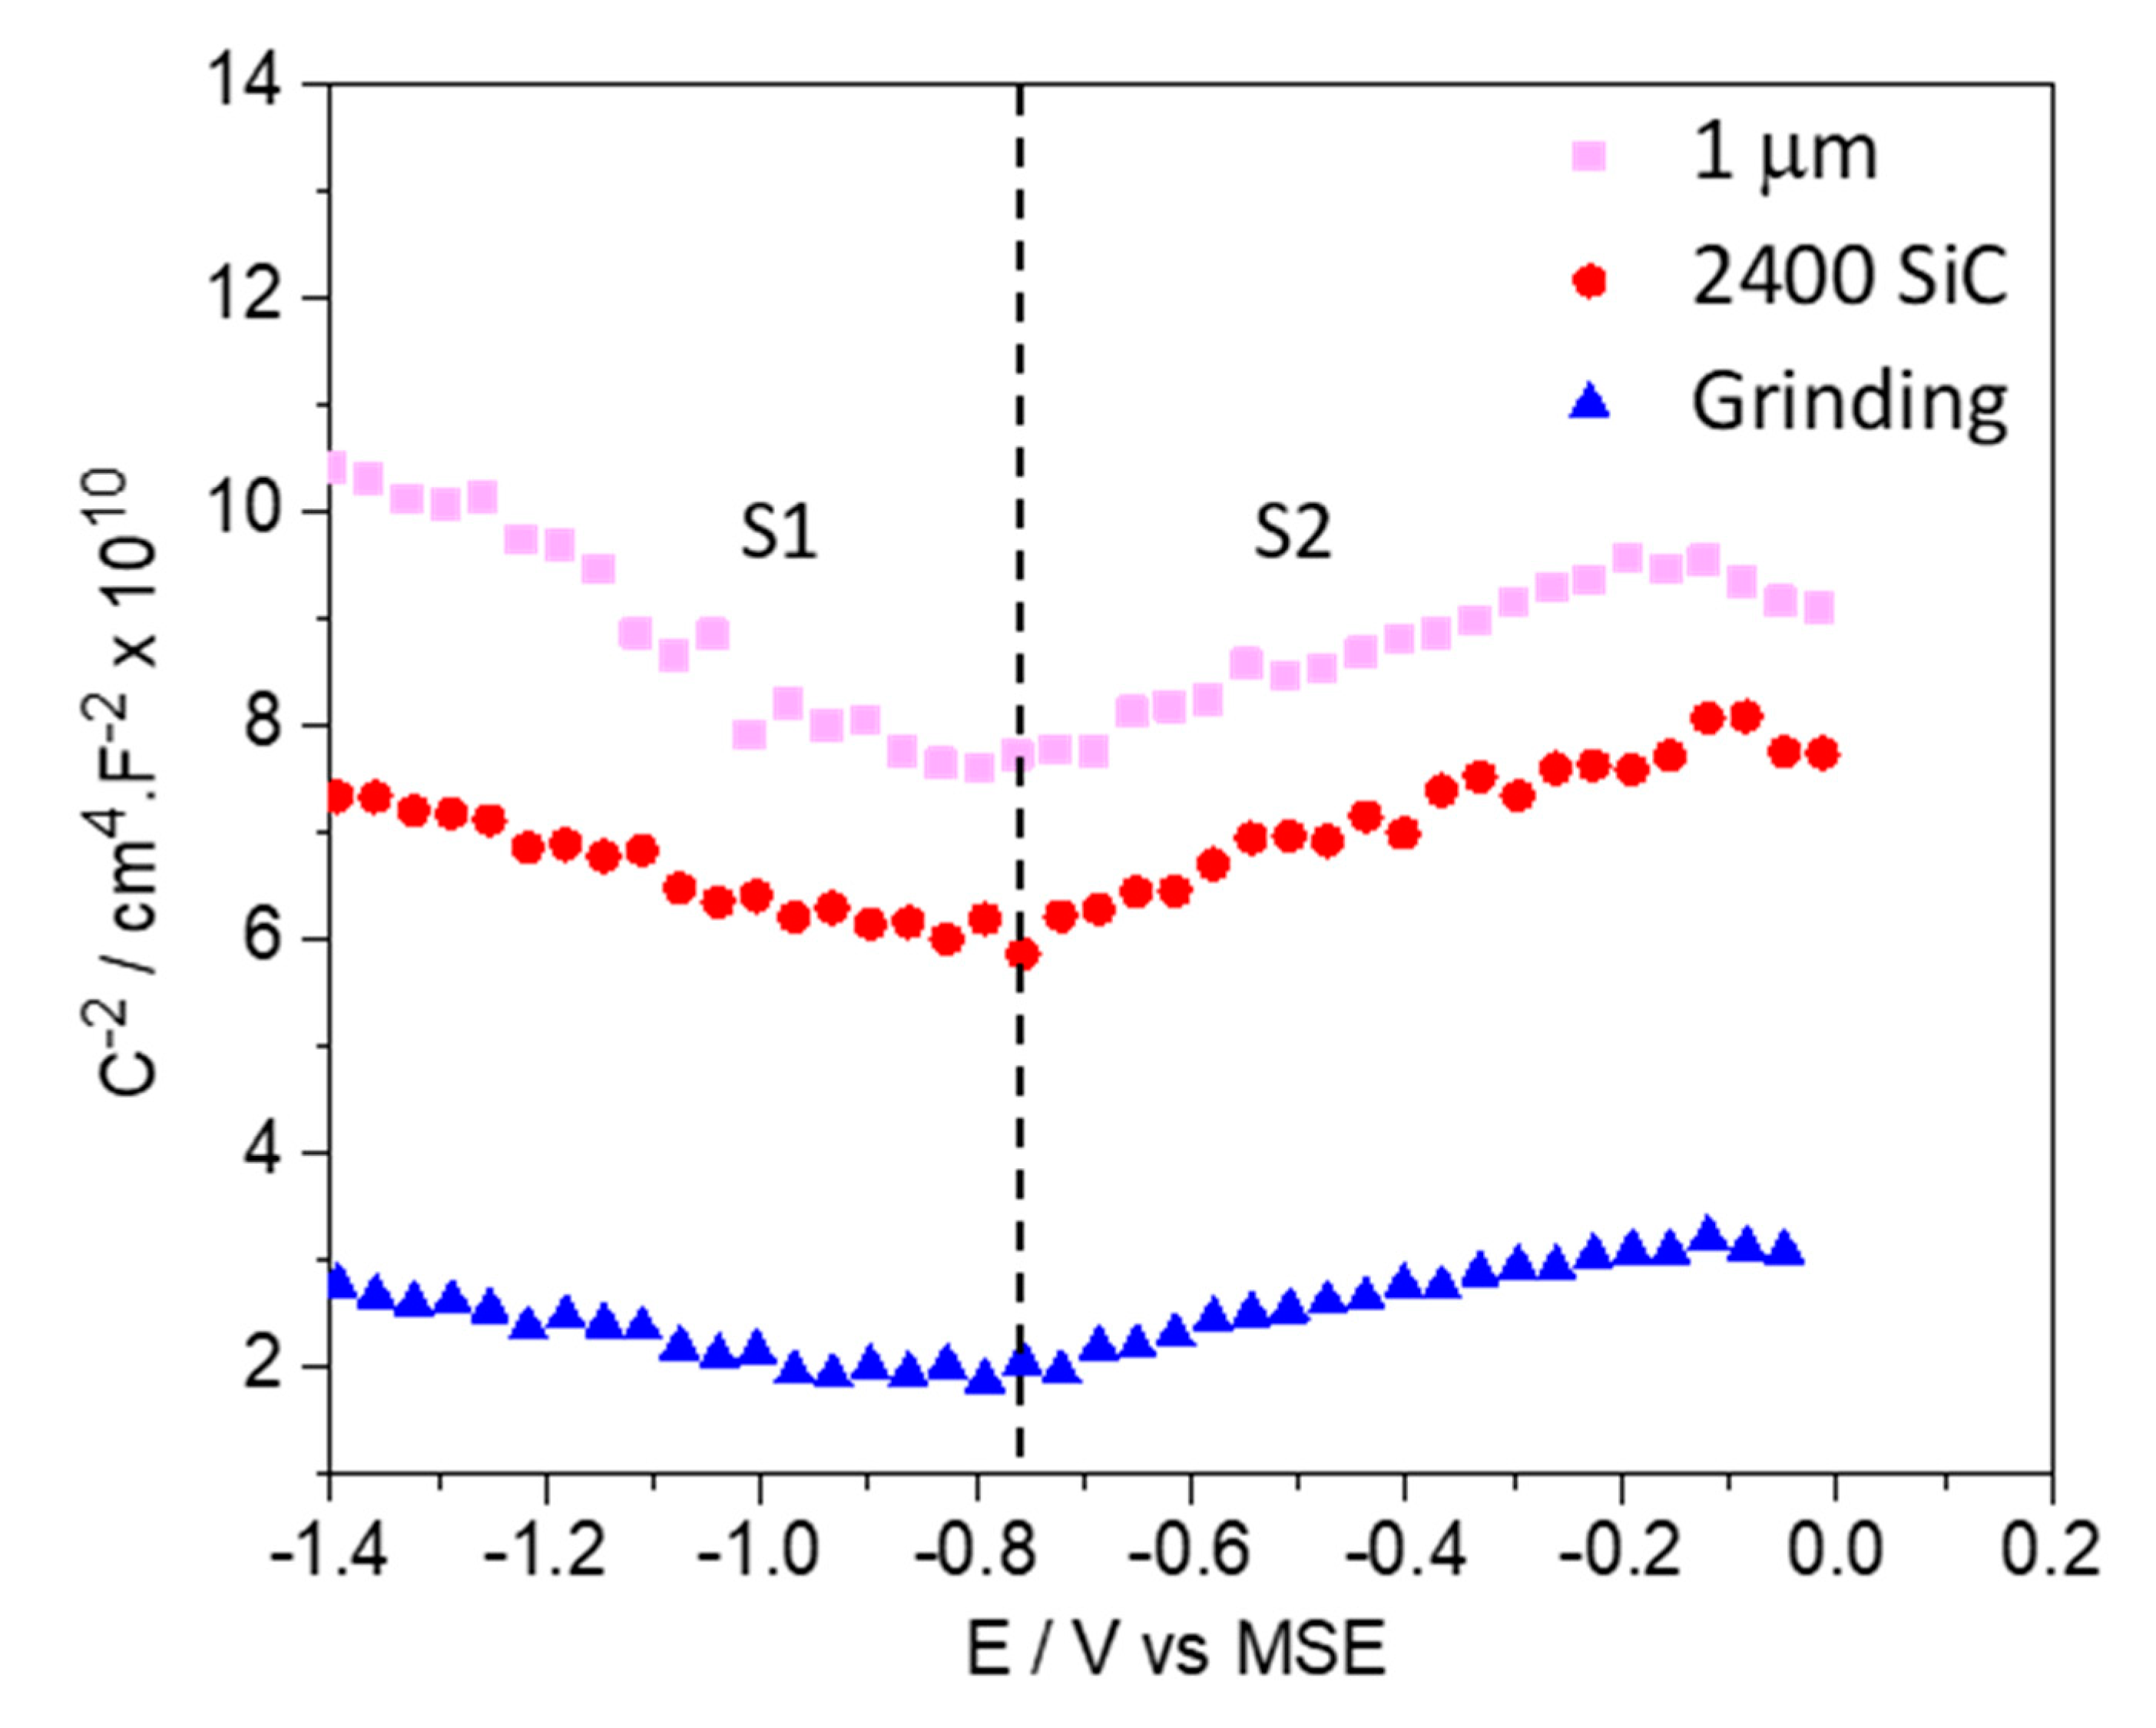
3.2.2. Mott–Schottky Analysis

In the present work, the assumption that the space charge capacitance is much smaller than the Helmholtz capacitance was made to relate the capacitance measured by EIS to the passive film capacitance. According to the PDM [20], the semiconductive properties assessment is essential to understand the passive state. Indeed, the physico-chemical properties of the passive film are dominated by point defects distribution and motion, which are responsible for passive film steady state.
The passive film’s semiconductive properties are determined by the Mott–Schottky curve, 1/C2 as a function of E in Figure 4. Whatever the samples, a negative slope is observed below −0.76 V vs. MSE. This trend is associated with a p-type semiconducting behavior [27,37,38]. Above 0.76 V vs. MSE, a positive slope is observed for an n-type semiconducting behavior [38]. Coupling MS analysis and X-ray photoelectron spectroscopy (XPS) on an oxide film on SS, Ferreira et al. [1] found that Cr is close to the oxide/metal interface, Fe is close to the electrolyte/oxide interface, and that Chromium oxide is attributed to the low potential capacitive response, while iron oxide is associated with a higher potential [27]. Thus, the capacitive response, for potentials lower than −0.76 V vs. MSE, is associated with chromium oxide [1,39], more precisely Cr2O3, where Cr3+ cations vacancies ( V C r ) are the dominant acceptor species in the inner layer [36,38]. On the other hand, the capacitive response, for potential higher than −0.76 V vs. MSE and up to −0.05 V vs. MSE, is attributed to iron oxide and hydroxide [40], where the oxygen vacancies ( V O ) [38] or iron cations (Fe2+) are the dominant donor species in the outer layer. According to Kloppers et al. [41], oxygen vacancies are generally the dominant species in Fe and Fe-Cr alloys. Measurements were not performed for higher potentials since the passive film dissolution occurred by transpassive process [42].
Passive film capacitance is lower for the surface polished down to 1 µm than for the polished one down to 2400 SiC, and these two samples have lower capacitance than ground samples. Since the thickness is inversely proportional to the capacitance Equation (2), the passive film has a higher thickness for polished samples than for ground samples. Table 2 shows an oxide film thickness of approximately 3–3.5 nm for the 1 µm polished sample, 2.6–2.9 nm for the 2400 SiC polished sample, and 1.4–1.6 nm for the ground sample. These values determined by impedance analysis are in good agreement with those reported by Chakri et al. [31] and Bensalah et al. [7].
The values of the doping densities are reported in Table 2. The density of the NA acceptors is lower for the polished surface down to 1 µm than for the other two surface preparations with a value of 2.2 × 1020 cm−3. The density of the acceptors NA is higher for the ground surface with a value of 8.0 × 1020 cm−3. For the ND donor density, the polished surface down to 1 µm and 2400 SiC have approximately the same value 3.8 × 1020 cm−3, 3.9 × 1020 cm−3, respectively. In contrast, the grinding surface is characterized by a higher value, 6.0 × 1020 cm−3. For all samples, the density is about 1020 cm-3, which is in excellent agreement with the data in the literature [2,4,7,27].

4. Discussions

Depending on the surface finishing process, the sub-surface material is affected differently. The mechanical surface modification has an impact on the surface state of the material. It generates roughness, scratches, and a recrystallization process, forming an ultrafine grain layer and residual compressive stresses.
Schematic representations of the cross-section of samples after mechanical surface treatment are shown in Figure 5. The parameters discussed in the previous section are detailed on these diagrams, offering an inventory of what happens after the mechanical surface treatments. For the ground surface Figure 5a, it generates an ultra-fine grain layer followed by a plastic deformation zone, high residual compressive stresses, whereas polishing down to 2400 SiC Figure 5b and down to 1 µm Figure 5c generates only an ultra-fine grain layer and lower residual compressive stresses. Grinding also results in very high surface roughness, unlike the two polished specimens, which have a minor roughness in comparison. The ground surface exhibits deep scratches, which are not as deep as for the 2400 SiC polished surface and not present for the polished surface down to 1 µm. Since a passive film grows on all the surfaces, each previous element can affect all the elementary processes associated with corrosion, i.e., charge transfer, adsorption, film growth, and film stability. Indeed, these modifications have an impact on the existence of the passive state and current densities. Generally, the shift to nobler value of the corrosion potential and smaller passive plateau characterize the ability of the material to become passive [43]. For the ground sample, the surface is more reactive than the polished surfaces due to its disordered surface. Consequently, the polarization curves are noisy when cathodic reactions still occur and the passive plateau exhibits a wavy shape, proving that even at the passive state, some sites are still reactive.
However, the surface state does not significantly affect the passive films chemical composition grown in borate buffer solution and their semiconductive type. Indeed, XPS analysis performed on the three materials after 24 h of immersion (results not shown here) reports a similar chemical composition whatever the surface preparation. The Cr(oxide)/(Cr(oxide) + Fe(oxide)) ratio is equal to 0.28 ± 0.04, 0.19 ± 0.02 and 0.34 ± 0.08, for the polished surface down to 1 µm, down to 2400 SiC and for ground surface, respectively. Furthermore, the passive film behaves as a p-type semiconductor for a low potential and as an n-type semiconductor for a higher potential for all three surface conditions. However, the amount of ND donors and NA acceptors, the capacitance, and thickness are dependent on the material’s surface state.
Figure 6 presents a schematic representation of the samples’ metallurgical state after immersion for 24 h in the borate buffer solution at room temperature. The passive film formed on the ground surface is reported in Figure 6a. It is characterized by very high doping densities, NA and ND, and thin film thickness (see Table 2). It is formed on a rough surface with high compressive residual stresses ( σ r ), and the subsurface contains an ultrafine grain layer followed by a plastically deformed zone. Coelho et al. [24] have also shown that both roughness and compressive residual stresses increase point defects densities in the passive film. Injection of point defects is probably promoted by the mechanical strain resulting from the stresses (dislocations) or the edge effect due to roughness. In this work, the passive film formed on the polished surface down to 2400 SiC is reported in Figure 6b. The passive film is thicker, with lower doping densities than the ground surface Figure 6a, while the surface has lower compressive residual stress and almost no roughness. The passive film formed on the polished surface down to 1 µm is shown in Figure 6c. It is the thickest with the lowest doping density than the two other surfaces Figure 6a,b. The surface on which it formed has almost no roughness and less compressive residual stress than the two previous surfaces.
Thus, the rougher, more damaged, plastically deformed, stressed, and abraded the surface is, the higher the doping densities and the thinner the passive film will be. The high surface reactivity promotes the injection of point defect inside the passive film during the formation and growth process and limits the passive film’s thickness. A large amount of these defects leads to an enhancement of the reactivity of the surface. The less disordered the surface, the more stable the passive film will be. Therefore, donors and acceptors’ densities will be lower. Finally, as observed by Azumi et al. [44] the film thickness is higher than for a disordered surface (ground) because the layers tend to become more stable.
To confirm the above statement on passive film stability and reactivity, pitting tests were carried out in chloride solution (2.5 M NaCl solution, pH = 6.5) after passivated samples in similar borate buffer solution conditions.
Figure 7 presents representative results obtained by cyclic polarization measurement for the three surface conditionings. For the ground surface, the anodic current density is about 0.1 mA·cm−2, meaning that the material loses its passive behavior. In contrast, the polished surfaces maintain their passive character with currents in the passive range of about 1 ×10⁻² mA·cm−2. Moreover, the pitting potential is slightly different between polished samples, confirming correlation between the doping densities (NA, ND) in the passive film and the pitting corrosion sensitivity. Higher the defect densities are, lower the pitting corrosion resistance is. The preliminary results shown here corroborate well that the ground sample is less resistant to corrosion than polished surfaces. Indeed, the ground surface has the most residual stresses, a rougher surface, and its passive film contains the highest doping density. Therefore, the residual compressive stress, surface roughness, and doping density in the passive film play an essential role in passive film resistance.

5. Conclusions

In this work, the influence of mechanical surface treatment on 304L stainless steel’s reactivity has been studied. Depending on the type of mechanical surface treatment, the subsurface material was affected differently. The ground specimen undergoes microstructure modifications such as an ultrafine grain layer followed by a plastic deformation zone and a hardened layer. The highest surface roughness and residual compressive stresses were determined for this surface condition. For polished samples, there is an ultrafine-grained layer but no plastic deformation. If the overall passive behavior in borate buffer solution is similar for all the samples, the present study reveals that the number of doping species, the capacitance value, and the thickness of the passive film are influenced by the roughness, the defects on the surface, and also by the residual compressive stresses. Consequently, the passive film formed on the more disordered and reactive surface is the thinnest and the less stable. Then, dry grinding affects detrimentally the passive behavior and the corrosion resistance of 304L SS. The study performed with chloride containing solution corroborates this conclusion by evidencing an enhanced reactivity when the sample is immersed in a chloride environment. The corrosion resistance is significantly affected by the surface finishing.
This work is a part of an ongoing project on the influence of surface finishing treatments on the corrosion behavior of SS for nuclear applications. Experiments in simulated primary water of nuclear power plants are still in progress.

Author Contributions

Conceptualization, B.T.-O. and B.N.; Formal analysis, K.J.; Investigation, K.J. and H.A.; Methodology, B.T.-O.; Resources, H.A. and Y.W.; Supervision, B.N. and Y.W.; Validation, K.J. and N.M.; Visualization, K.J., B.T.-O., and N.M.; Writing—original draft, K.J.; Writing—review and& editing, B.T.-O., H.A., N.M., B.N., and Y.W. All authors have read and agreed to the published version of the manuscript.

Funding

This research received no external funding.

Data Availability Statement

The raw/processed data required to reproduce these findings cannot be shared at this time as the data also forms part of an ongoing study.

Acknowledgments

The authors acknowledge Takamichi Miyazaki, TEM Specialist at Tohoku University for the TEM experiment and the electron diffraction pattern analysis.

Conflicts of Interest

The authors declare no conflict of interest.

References

  1. Ferreira, M.G.S.; Da Cunha Belo, M.; Hakiki, N.E.; Goodlet, G.; Montemor, M.F.; Simõesa, A.M.P. Semiconducting properties of oxide and passive films formed on AISI 304 stainless steel and Alloy 600. J. Braz. Chem. Soc. 2002, 13, 433–440. [Google Scholar] [CrossRef] [Green Version]
  2. Montemor, M.F.; Ferreira, M.G.S.; Hakiki, N.E.; Da Cunha Belo, M. Chemical composition and electronic structure of the oxide films formed on 316L stainless steel and nickel based alloys in high temperature aqueous environments. Corros. Sci. 2000, 42, 1635–1650. [Google Scholar] [CrossRef]
  3. Normand, B.; Pierre, A.; Pagetti, J. Electrochemical and surface studies of the passive layers grown on sputter-deposited nitrogen-stainless steel alloys in 1M H2SO4 solution. Corros. Sci. 1995, 37, 1537–1549. [Google Scholar] [CrossRef]
  4. Wallinder, D.; Pan, J.; Leygraf, C.; Delblanc-Bauer, A. EIS and XPS study of surface modification of 316LVM stainless steel after passivation. Corros. Sci. 1998, 41, 275–289. [Google Scholar] [CrossRef]
  5. Sudesh, T.L.; Wijesighe, L.; Blackwood, D.J. Electrochemical & optical characterisation of passive films on stainless steels. J. Phys. Conf. Ser. 2006, 28, 74–78. [Google Scholar] [CrossRef]
  6. Jargelius-Pettersson, R.F.A. Examination of the Role of Molybdenum in Passivation of Stainless Steels Using AC Impedance Spectroscopy. J. Electrochem. Soc. 1998, 145, 1462. [Google Scholar] [CrossRef]
  7. BenSalah, M.; Sabot, R.; Triki, E.; Dhouibi, L.; Refait, P.; Jeannin, M. Passivity of Sanicro28 (UNS N-08028) stainless steel in polluted phosphoric acid at different temperatures studied by electrochemical impedance spectroscopy and Mott-Schottky analysis. Corros. Sci. 2014, 86, 61–70. [Google Scholar] [CrossRef]
  8. Olsson, C.O.A.; Landolt, D. Passive films on stainless steels—Chemistry, structure and growth. Electrochim. Acta 2003, 48, 1093–1104. [Google Scholar] [CrossRef]
  9. Teramoto, K.; Asami, K.; Hashimoto, K. Composition of passive films on ferritic 30Cr stainless steels in H2SO4. Corros. Eng. 1978, 27, 57–61. [Google Scholar] [CrossRef] [Green Version]
  10. Lopes, J.C.; Fragoso, K.M.; Garcia, M.V.; Ribeiro, F.S.F.; Francelin, A.P.; de Angelo Sanchez, L.E.; Rodrigues, A.R.; de Mello, H.J.; Aguiar, P.R.; Blanchi, E.C. Behavior of hardened steel grinding using MQL under cold air and MQL CBN wheel cleaning. Int. J. Adv. Manuf. Technol. 2019, 105, 4373–4387. [Google Scholar] [CrossRef]
  11. Bianchi, E.C.; Sato, B.K.; Sales, A.R.; Lopes, J.C.; Sanchez, H.J.D.; Diniz, A.E.; Aguiar, P.R. Evaluating the effect of the compressed air wheel cleaning in grinding the AISI 4340 steel with CBN and MQL with water. Int. J. Adv. Manuf. Technol. 2018, 95, 2855–2864. [Google Scholar] [CrossRef] [Green Version]
  12. Silva, L.R.; Corrêa, E.C.S.; Brandão, J.R.; de Ávila, R.F. Environmentally friendly manufacturing: Behavior analysis of minimum quantity of lubricant—MQL in grinding process. J. Clean. Prod. 2020, 256, 103287. [Google Scholar] [CrossRef]
  13. Lou, S.; Li, Y.; Zhou, L.; Nie, X.; He, G.; He, W. Surface nanocrystallization of metallic alloys with different stacking fault energy induced by laser shock processing. Mater. Des. 2016, 104, 320–326. [Google Scholar] [CrossRef]
  14. Fredj, N.B.; Nasr, M.B.; Rhouma, A.B.; Braham, C.; Sidhom, H. Fatigue life improvements of the AISI 304 stainless steel ground surfaces by wire brushing. J. Mater. Eng. Perform. 2004, 13, 564–574. [Google Scholar] [CrossRef]
  15. Rhouma, A.B.; Sidhom, N.; Makhlouf, K.; Sidhom, H.; Braham, C.; Gonzalez, G. Effect of machining processes on the residual stress distribution heterogeneities and their consequences on the stress corrosion cracking resistance of AISI 316L SS in chloride medium. Int. J. Adv. Manuf. Technol. 2019, 105, 1699–1711. [Google Scholar] [CrossRef]
  16. Abe, H.; Watanabe, Y.; Miyazaki, T. Characteristics of work hardened surface layer on austenitic stainless steels and its relation to SCC susceptibility in high temperature water. In Proceedings of the 19th International Conference on Environmental Degradation of Materials in Nuclear Power Systems—Water Reactors, EnvDeg, Boston, MA, USA, 18–22 August 2019; pp. 165–173. [Google Scholar]
  17. Lyon, K.N.; Marrow, T.J.; Lyon, S.B. Influence of milling on the development of stress corrosion cracks in austenitic stainless steel. J. Mater. Process. Technol. 2015, 218, 32–37. [Google Scholar] [CrossRef]
  18. Ghosh, S.; Kain, V. Microstructural changes in AISI 304L stainless steel due to surface machining: Effect on its susceptibility to chloride stress corrosion cracking. J. Nuclear Mater. 2010, 403, 62–67. [Google Scholar] [CrossRef]
  19. MacDonald, D.D. The history of the Point Defect Model for the passive state: A brief review of film growth aspects. Electrochim. Acta 2011, 56, 1761–1772. [Google Scholar] [CrossRef]
  20. Macdonald, D.D. The point defect model for the passive state. J. Electrochem. Soc. 1992, 139, 3434. [Google Scholar] [CrossRef]
  21. Marcelin, S.; Ter-Ovanessian, B.; Normand, B. Electronic properties of passive films from the multi-frequency Mott-Schottky and power-law coupled approach. Electrochem. Commun. 2016, 66, 62–65. [Google Scholar] [CrossRef]
  22. Ter-Ovanessian, B.; Alemany-Dumont, C.; Normand, B. Electronic and transport properties of passive films grown on different Ni-Cr binary alloys in relation to the pitting susceptibility. Electrochim. Acta 2014, 133, 373–381. [Google Scholar] [CrossRef]
  23. Toor, I.H.; Ejaz, M.; Kwon, H.S. Mott–Schottky analysis of passive films on Cu containing Fe–20Cr–xCu (x = 0, 4) alloys. Corros. Eng. Sci. Technol. 2014, 49, 390–395. [Google Scholar] [CrossRef]
  24. Coelho, L.B.; Kossman, S.; Mejias, A.; Noirfalise, X.; Montagne, A.; van Gorp, A.; Poortemana, M.; Olivier, M.-G. Mechanical and corrosion characterization of industrially treated 316L stainless steel surfaces. Surf. Coat. Technol. 2020, 382, 125175. [Google Scholar] [CrossRef]
  25. Matsuda, M.; Okita, K.; Nakagawa, T.; Sasaki, T. Application of X-ray stress measurement for residual stress analysis by inherent strain method—Comparison of cosα and sin2Ψ method. Mech. Eng. J. 2017, 4, 17-00022. [Google Scholar] [CrossRef] [Green Version]
  26. Luo, H.; Wang, X.; Dong, C.; Xiao, K.; Li, X. Effect of cold deformation on the corrosion behaviour of UNS S31803 duplex stainless steel in simulated concrete pore solution. Corros. Sci. 2017, 124, 178–192. [Google Scholar] [CrossRef]
  27. Hakiki, N.B.; Boudin, S.; Rondot, B.; Da Cunha Belo, M. The electronic structure of passive films formed on stainless steels. Corros. Sci. 1995, 37, 1809–1822. [Google Scholar] [CrossRef]
  28. Dewald, J.F. The charge distribution at the zinc oxide-electrolyte interface. J. Phys. Chem. Solids 1960, 14, 155–161. [Google Scholar] [CrossRef]
  29. Permittivity of Inorganic Solids. In CRC Handbook of Chemistry and Physics; CRC Press: Boca Raton, FL, USA, 2014; pp. 12–48.
  30. Lovreček, B.; Sefaja, J. Semiconducting aspects of the passive layer on chromium. Electrochim. Acta 1972, 17, 1151–1155. [Google Scholar] [CrossRef]
  31. Chakri, S.; Frateur, I.; Orazem, M.E.; Sutter, E.M.M.; Tran, T.T.M.; Tribollet, B.; Vivier, V. Improved EIS Analysis of the Electrochemical Behaviour of Carbon Steel in Alkaline Solution. Electrochim. Acta 2017, 246, 924–930. [Google Scholar] [CrossRef]
  32. Jonscher, A.K. Admittance spectroscopy of systems showing low-frequency dispersion. Electrochim. Acta 1990, 35, 1595–1600. [Google Scholar] [CrossRef]
  33. Benoit, M.; Bataillon, C.; Gwinner, B.; Miserque, F.; Orazem, M.E.; Sánchez-Sánchez, C.M.; Tribollet, B.; Vivier, V. Comparison of different methods for measuring the passive film thickness on metals. Electrochim. Acta 2016, 201, 340–347. [Google Scholar] [CrossRef] [Green Version]
  34. Ghosh, S.; Kain, V. Effect of surface machining and cold working on the ambient temperature chloride stress corrosion cracking susceptibility of AISI 304L stainless steel. Mater. Sci. Eng. A 2010, 527, 679–683. [Google Scholar] [CrossRef]
  35. Vignal, V.; Mary, N.; Valot, C.; Oltra, R.; Coudreuse, L. Influence of Elastic Deformation on Initiation of Pits on Duplex Stainless Steels. Electrochem. Solid State Lett. 2004, 7, 39–42. [Google Scholar] [CrossRef]
  36. Cho, E.A.; Kwon, H.S.; Macdonald, D.D. Photoelectrochemical analysis on the passive film formed on Fe-20Cr in pH 8.5 buffer solution. Electrochim. Acta 2002, 47, 1661–1668. [Google Scholar] [CrossRef]
  37. Da Cunha Belo, M.; Hakiki, N.E.; Ferreira, M.G.S. Semiconducting properties of passive films formed on nickel-base alloys type Alloy 600: Influence of the alloying elements. Electrochim. Acta 1999, 44, 2473–2481. [Google Scholar] [CrossRef]
  38. Toor, I.-H. Mott-Schottky Analysis of Passive Films on Si Containing Stainless Steel Alloys. J. Electrochem. Soc. 2011, 158, C391. [Google Scholar] [CrossRef]
  39. Navaï, F. Effects of tensile and compressive stresses on the passive layers formed on a type 302 stainless steel in a normal sulphuric acid bath. J. Mater. Sci. 1995, 30, 1166–1172. [Google Scholar] [CrossRef]
  40. Hakiki, N.E. Influence of surface roughness on the semiconducting properties of oxide films formed on 304 stainless steel. J. Appl. Electrochem. 2008, 38, 679–687. [Google Scholar] [CrossRef]
  41. Kloppers, M.J.; Bellucci, F.; Latanision, R.M. Electronic properties and defect structure of Fe and Fe-Cr passive films. Corrosion 1992, 48, 229–238. [Google Scholar] [CrossRef]
  42. Hamadou, L.; Kadri, A.; Benbrahim, N. Impedance investigation of thermally formed oxide films on AISI 304L stainless steel. Corros. Sci. 2010, 52, 859–864. [Google Scholar] [CrossRef]
  43. Lavigne, O.; Alemany-Dumont, C.; Normand, B.; Delichère, P.; Descamps, A. Cerium insertion in 316L passive film: Effect on conductivity and corrosion resistance performances of metallic bipolar plates for PEM fuel cell application. Surf. Coat. Technol. 2010, 205, 1870–1877. [Google Scholar] [CrossRef]
  44. Azumi, K. Mott-Schottky Plot of the Passive Film Formed on Iron in Neutral Borate and Phosphate Solutions. J. Electrochem. Soc. 1987, 134, 1352. [Google Scholar] [CrossRef]
Figure 1. SEM observations of 304L SS after, (a) grinding process, (b) polished samples down to 2400 with SiC, (c) polished samples down to 1 µm with diamond paste.
Metals 11 00135 g001
Figure 2. TEM observations of 304L cross-section, after, (a) grinding process, (b) polished samples down to 2400 with SiC, (c) polished samples down to 1 µm with diamond paste, in window capture present electron diffraction patterns as a function of the surface depth.
Metals 11 00135 g002
Figure 3. Polarization curve of 304L SS immersed for 24 h in the buffer solution, for grinding process, polished samples down to 2400 with SiC, and 1 µm with diamond paste.
Metals 11 00135 g003
Figure 4. MS plots of C2− for the passive film, for 304L SS in borate buffer (pH = 9.2) for grinding process, polished samples down to 2400 with SiC, and 1 µm with diamond paste.
Metals 11 00135 g004
Figure 5. Schematics of surface modifications after mechanical surface treatment on 304L specimens, (a) grinding process, (b) polished samples down to 2400 with SiC, (c) polished samples down to 1 µm with diamond paste.
Metals 11 00135 g005
Figure 6. Diagram of passive film formed on surfaces after mechanical surface treatment on 304L specimens, (a) grinding process, (b) polished samples down to 2400 with SiC, (c) polished samples down to 1 µm with diamond paste.
Metals 11 00135 g006
Figure 7. Cyclic potentiodynamic polarization (CPP) curve 304L immersed 24 h in the buffer solution follow by immersion in 2.5 NaCl for grinding process, polished samples down to 2400 with SiC and 1 µm with diamond paste.
Metals 11 00135 g007
Table 1. Microstructural characterization of the effect of mechanical surface treatment on the top surface and subsurface of 304L SS. RMS values are reported for the roughness characterization. Thickness of the ultrafine-grained layer determined by TEM and residual stresses measured by XRD are reported.
SpecimensRMS (nm)Thickness of the Ultrafine-Grained Layer (nm)Residual Stresses (MPa)
Grinding1300 ± 200150–280−432 ± 17
(Rolling direction)
2400 SiC12 ± 2250−231 ± 49
1 µm16 ± 4150−110 ± 84
Table 2. Acceptor (NA) and donor (ND) densities for 304L SS in borate buffer (pH = 9.2) measured for grinding process, polished samples down to 2400 with SiC and 1 µm with diamond paste
SpecimensGrinding2400 SiC1 µm
NA × 1020 cm−38.04.42.2
ND × 1020 cm−36.03.93.8
Thickness δ (nm)1.4~1.62.6~2.93~3.5
Publisher’s Note: MDPI stays neutral with regard to jurisdictional claims in published maps and institutional affiliations.

