The Study of Carbon Recovery from Electrolysis Aluminum Carbon Dust by Froth Flotation


School of Energy Science and Engineering, Central South University, Changsha 410083, China
*
Authors to whom correspondence should be addressed.
Metals 2021, 11(1), 145; https://doi.org/10.3390/met11010145
Submission received: 19 December 2020
/
Revised: 6 January 2021
/
Accepted: 8 January 2021
/
Published: 12 January 2021
Abstract
:A large amount of carbon dust is generated in the process of aluminum smelting by molten salt electrolysis. The carbon dust is solid hazardous waste but contains a large quantity of recyclable components such as carbon and fluoride. How to recycle carbon dust more effectively is a challenge in the aluminum electrolysis field. In this study, X-ray diffraction, scanning electron microscope, and other methods were used to analyze the phase composition of electrolytic aluminum carbon dust. The effects of particle size distribution of carbon dust, impeller speed, reagent addition, mixing time, and flotation time on the flotation recovery of carbon dust were studied. The optimal flotation conditions were obtained and the flotation products were analyzed. The results show that the optimal particle size distribution is 70% of particles below 200 mesh, corresponding to a grinding time of 11 min. The optimum speed of the flotation machine was to be between 1600 and 1800 r/min with the best slurry concentration of 20–30% and 5 min mixing time, and the collector kerosene was suitable for adding in batches. Under the above conditions, the recovered carbon powder with a carbon content of 75.6% was obtained, and the carbon recovery rate was 86.9%.
1. Introduction
Molten salt electrolysis is a commonly used method for industrial aluminum smelting. Its production principle is to produce high-purity primary aluminum by electrolysis reaction with an aluminum electrolysis cell as the carrier, a carbon block as the anode, cryolite as the reaction solvent, and alumina as the raw material. During the production process, the highly active elements of the anode carbon block react with air [1], and the secondary reaction of CO2 and liquid aluminum occurs during the production process [2] along with anode bubble erosion [3,4], all of which cause the carbon block components to fall out. Under the combined effect, each ton of aluminum produced by electrolysis is accompanied by 5–10 kg [5] of carbon dust. The accumulation of carbon dust at a certain concentration causes an increase in electrolyte voltage drop and temperature inside the electrolysis cell, which destroy the electrolysis reaction heat balance [6] and affect the stability of the electrolysis production; hence, the generated carbon dust needs to be regularly removed and salvaged.
Aluminum electrolysis carbon dust has been officially listed on the “National Catalogue of Hazardous Wastes” [7] of China due to its environmental risks. Stacking treatment causes fine particles to enter the atmosphere, resulting in environmental pollution, while landfill disposal causes free-fluorine pollution of groundwater resources. According to research, carbon dust contains a large quantity of carbon, electrolytes, and other recyclables. In recent years, amounts of researches has been conducted on the harmless treatment and resource utilization of carbon dust. At present, the main treatment approach of carbon dust are fire roasting, vacuum smelting, and fluidized bed combustion technology [8]. The vacuum smelting method and fluidized bed treatment are still at the laboratory research stage due to technical limitations and cannot yet be used for large-scale industrial applications. Although fire roasting can recover cryolite and other components in carbon dust, it causes secondary pollution due to the burning of fluoride and carbonaceous components. The flotation method is an ideal method for carbon dust recovery for its good recovery effect, less equipment, and simple process flow.
The flotation method uses the difference in hydrophilicity and hydrophobicity between different mineral particles to classify [9,10,11,12,13]. As a means of resource recovery and reutilization, the development of processes and applications has emerged in various fields [14,15,16,17]. Carbon has strong natural hydrophobicity [18,19], and research on the flotation of carbon materials has been increased in recent years [20,21]. Yang et al. [22] studied the flotation kinetics for the removal of unburned carbon in fly ash. They found that the amount of collector and foaming agent is the key factor in the flotation of fly ash and carried out the flotation kinetics test data fitting. Derya et al. [23] used flotation technology to separate the unburned carbon in the bottom ash of coal-fired power plants and carried out experiments where the quantity of additives, slurry concentration, pH value, particle size distribution, flotation time and temperature were variables. Under the optimal process conditions, the carbon content of the concentrate was increased from 13.85% to 51.54%, and the carbon recovery rate was 54.54%. Zhang and Honaker [24] believes that froth flotation is the most effective separation technology for ultra-fine materials, and studied the influence of diesel fuel consumption, adjustment time and impeller speed on the performance of activated carbon flotation. Zhou et al. [25] mixed surfactant and collector kerosene in a certain proportion to prepare an emulsion and used it as a co-catalyst to improve the hydrophobicity of unburned carbon, then studying the effect of four different surfactants on foam flotation. An et al. [26] studied the effect of foaming agent polyglycol ether (DF-250) and its mixture on bubble size, foam stability, and unburned carbon flotation performance and found that 75% DF-250 had the best flotation performance. Yang et al. [27] conducted a flotation kinetic test on fly ash of different particle sizes and studied the effect of particle size on the flotation behavior of fly ash. Xu et al. [28] studied the mechanism of non-ionic surfactant Triton X-100 (C34H62O11; its hydrophilic-lipophilic balance (HLB) number is 13.4) pretreatment in enhancing the flotation of fly ash and found that it can significantly improve the hydrophobicity of the unburned carbon surface, thereby increasing the recovery rate of unburned carbon. Walker and Wheelock [29], Harris and Thomas [30] optimized the process conditions required for effective separation of unburned carbon from fly ash by studying parameters such as collectors, pretreatment slurry, and flotation stages in foam flotation.
Regarding the problem of aluminum electrolysis solid waste recycling, Vasyunina et al. [31] adopted a grinding–classification–reverse flotation–concentration process using flotation agents such as kerosene to remove silicon, iron oxide, and carbon particles, finally recovering aluminum electrolysis production sweep materials. Tropenauer et al. [32] introduced flotation and chemical treatment technology to solve the problem of industrial waste generated in the aluminum electrolysis process. Li et al. [33] explored a plan for recovering the waste lining of electrolytic cells by optimizing flotation conditions, including grinding particle size, slurry density, and the mixing speed of the flotation machine, and conducted a comparative experiment. The above experiments were mostly conducted to recover solid wastes such as the waste liner of aluminum electrolysis, though there are few reports on the carbon dust flotation recovery process and especially on influencing factors such as the flotation agent and process parameters. Therefore, this study conducted analysis of the main components and surface morphology characteristics of electrolytic aluminum carbon dust, studied flotation parameters and optimized in a laboratory environment. The performance of the flotation product was tested, and a suitable flotation treatment was proposed to provide a reference for application of carbon dust flotation process. Nowadays, all countries attach great importance to the sustainable development of resources and industrial clean production [34]. As a highly polluting industry, it is even more necessary for the aluminum electrolysis industry to implement energy saving, emission reduction and clean production. For companies, reducing harmful emissions and increasing recycling rates can save costs and obtain additional benefits while also contributing to ecological protection.
2. Materials and Methods
2.1. Raw Material Analysis
The experimental raw materials were taken from the electrolytic aluminum carbon dust of an aluminum electrolysis manufacturer in Henan. After drying, the phase composition was qualitatively analyzed using an X-ray diffraction (XRD, PW3040/60; PANalytical, Almelo, The Netherlands) instrument. The results are shown in Figure 1 and Table 1 below. Table 1 shows that the main components of carbon dust are C, Al2O3 and Na3AlF6, with a small quantity of fluoride salts such as CaF2, LiNa2AlF6 and K2NaAlF6.
In order to obtain a more accurate relative content of elements, the carbon dust sample was dried and pulverized, and then subjected to quantitative multi-elemental analysis using X-ray fluorescence (XRF, S8 Tiger; Bruker, Madison, WI, USA). The results are shown in Table 2.
In order to further understand the surface structure characteristics of the electrolytic aluminum carbon dust, a scanning electron microscope (SEM, 7600F; JEOL, Tokyo, Japan) was used to detect the surface of the electrolytic aluminum carbon dust. The acceleration voltage was 20.0 kV and the magnification was 5000×. The sample surface was sprayed with gold before shooting to prevent the accumulation of electricity during the imaging process and to make the observation image of the sample surface clearer. The image result is shown in Figure 2 below.
It can be seen from Figure 2 that the surface of the electrolytic aluminum carbon dust is covered with a large number of mesopores (blue arrow), the structure is rough, and the anti-breaking ability is weak. Its morphological characteristics are similar to industrial sponge coke, with a large number of granules and fibrous tissue particles embedded in the internal structure, the main components of which are particles of alumina and fluorine salts solidified (green arrow) onto the surface of the coke (yellow arrow). The surface of carbon dust has developed pores and has a large specific surface area which makes it easier to adsorb water molecules and, thereby, a hydration layer can easily form on the surface of the particles, which leads to the enhancement of surface hydrophilicity.
2.2. Contact Angle Measurements
The contact angle measurements of carbon dust sample used a drop shape analyzer (DSA, JY-82B; Kruss Hamburg Germany). The wet dust sample was ball-ground to 200 mesh and formed into thin slices by a tablet press. As shown in Figure 3, the contact angle of water on the dust surface is only 32.8°, so the dust is a mineral characterized by strong surface wettability, poor hydrophobicity, and poor natural floatability. Among the aluminum electrolysis carbon dust components, coke accounts for a relatively small proportion, and the unsaturated bond properties of its surface are mainly expressed as molecular bonds. The surface interaction with water is lower and is hydrophobic in nature. There is a high proportion of Na3AlF6, Al2O3, and other substances in the carbon dust components; the unsaturated bond properties of the surface are expressed as ionic bonds or covalent bonds; and the surface interaction with water is greater so the carbon dust as a whole is considered hydrophilic.
2.3. Flotation Apparatus and Reagents
The experiment used a single-slot flotation machine(HF-XFD; Jianfeng Nanchang China). The single-slot flotation machine is driven by the motor triangle transmission to rotate the impeller and forms negative pressure through centrifugal action. The machine inhales air and mixes the slurry to make the minerals bond on the refined foam surface, which floats to the slurry surface to form mineralized foam. By adjusting the height of the gate, the liquid level was controlled to scrape out the foam using the scraper. The machine specifications are shown in Table 3.
Reagents used in flotation experiment include collectors, foaming agents, inhibitors and pH adjusters. Details of these are shown in Table 4. Kerosene was used as the collector, and the variable was the batch of added collector. The weighed 500 g/t kerosene was separated into five equal parts in a beaker, where the first part of kerosene was added to the slurry before the start of flotation, and a part of kerosene was then added every 2 min.
2.4. Experimental Method
The single-factor test of the rough flotation process in industrial experiments was carried out. Specific amounts of electrolytic aluminum carbon dust sample, crushed in a jaw crusher, were collected and screened with a 2 mm standard sieve, and the sieved samples were wet-milled. The carbon dust and water were made into a slurry according to the ratio, mixed with flotation agent for a certain period of time, and placed into the flotation machine. Then, the flotation machine and the scraper motor switch were activated, the scraper rotated so that the foam in the foam tank was scraped out of the groove, and the scraped foam was defoamed to obtain the floating concentrate. The flotation process for a single factor experiment is shown in Figure 4.
The basic conditions of each process are shown in Table 5 below, and the quantity of experimental chemicals added was determined by the quality of raw materials and the ratio in this table.
When performing a single factor flotation experiment, the basic conditions of the above process remain the same except for the controlled variables.
The products obtained from each single-factor experiment are further processed, i.e., the floating concentrate was recovered, dried, and then weighed with a balance. Subsequently, the dried material was combusted and the carbon content in the combustion products was measured by infrared absorption. and the carbon recovery was calculated.
In the formula, R represents the recovery rate of carbon in the floating product (%); α is the amount of carbon in the carbon dust added to the experiment; β is the amount of carbon in the flotation product; γ is the amount of carbon concentrate relative to the initial mass of added carbon dust.
The above experiment process was continuously repeated while changing the grinding particle size, slurry concentration, speed of the flotation machine impeller, reagent system and other influencing factors to search for optimal experimental conditions.
2.5. Comparative Experiment
In order to determine the industrial effect under optimal conditions, comparative experiments were carried out according to the industrial experimental process. The flow is shown in Figure 5. First, a rough separation is used, the upper float concentrate is selected twice, and the underflow electrolyte is scanned twice. The floating carbon concentrate and the underflow electrolyte obtained from the flotation experiment were all subjected to post-processing, and subject to physical analysis.
3. Results
3.1. Granularity Experiment
In the process of flotation, the coarse particles of minerals easily allow the minerals fall off from the bubbles, leading to a decline in the separation and recovery effect; the particle size of the minerals is too fine, and their surface activity is too large, which results in the minerals readily producing nonselective condensation in the flotation environment. At this stage, concentrates with similar particle sizes are difficult to distinguish from tailings, the surface solubility of the fine particles is relatively large, and the contact angle with the bubbles decreases, which reduces the capture efficiency. Therefore, it becomes necessary to study the effect of particle size on the flotation effect.
To study the influence of carbon dust with different particle size and mass fraction on the initial carbon content and flotation effect, five equal parts of the crushed carbon dust with a mass of 500 g and an average particle size of 2 mm were used for experiments. Grinding was carried out under time conditions of 6, 9, 11, 13 and 15 min, carbon dust samples with a particle size of −200 mesh at mass fractions of 50%, 60%, 70%, 80%, and 90% were prepared. Using a 200 mesh standard sieve for sieving, the carbon content was separately tested in the sieved and unsieved samples. The results are shown in Figure 6 below. It can be seen that the carbon content of the +200 mesh particle sample is higher than that of the −200 mesh particle sample. The reason may be that when using a rod mill to grind carbon dust, the contact area between the roller and the solid surface is linear, the spongy fixed carbon structure in the carbon dust is not crushed, and its average particle size is larger than that of fluorine salt, alumina, and other particles. The five types of carbon dusts after the above screening treatment were remixed separately, then the flotation experiment was performed, and the float concentrate was taken for post-treatment research. The results are shown in Figure 7 below. It can be seen that as the mass fraction of −200 mesh particles increases, the carbon content in the floating concentrate shows an overall upward trend, indicating that the effect of fixing carbon and electrolyte dissociation in the carbon dust is better. When the mass fraction of −200 mesh particles exceeds 70, the carbon recovery rate in the floating carbon concentrate shows an obvious downward trend because the flotation separation is mainly achieved through the adhesion and mineralization process of fixed carbon and bubbles, and fine-grained carbon particles may detach from the bubble surface, ultimately reducing the recovery rate of carbon concentrate. Considering the carbon content and carbon recovery rate, the better particle size condition is the mass fraction of −200 mesh particles at 70% and the corresponding grinding time of 11 min.
3.2. Effect of Impeller Speed on Flotation
The increased impeller speed of the flotation machine results in higher negative pressure and air intake, which affects the flotation process. Impeller speed as an experimental variable to study its effect on flotation, which was adjusted to 1000, 1200, 1400, 1600, 1800, and 2000 r/min, the results are shown in Figure 8. Figure 8 displayed that in the low rotational speed range, the carbon recovery increased with the increase in impeller speed, while the carbon content, as a whole, showed a decreasing trend, and with the further increase in impeller speed, the carbon recovery decreased and the carbon content increased. From the perspective of the dynamics of the flotation process, there are two main factors influencing the flotation effect, namely the efficiency of collision and adhesion of minerals on bubbles, and the ability of bubbles to load minerals. Under low-speed conditions, the bubble motion characteristics are stable and conducive to carbon concentrates in the bubble surface adhesion. The reduced entrainment of other impurities means that the floating concentrate quality is better, but due to the lower air intake, there is less bubble generation, resulting in the flotation time being affected and a slow transport speed of carbon particles. At this stage, the influence of bubbles on the mineral loading capacity is higher than that of bubble mineralization adhesion. With the increase in the speed of the flotation machine impeller, the increase in the air content of the flotation machine can meet the requirements of the mineral load, and the rising speed of the bubbles increases, which causes the carbon recovery rate to increase; on the other hand, in the mixing area of the flotation machine, the air results in fine bubbles under the action of the impeller rotor, the trapping capacity of the bubbles decreases, and nonselective flocculation can occur, which reduces the carbon content of the carbon concentrate. At this stage, the collection and adhesion of bubbles to minerals becomes the dominant factor. When the impeller speed of the flotation machine is further increased, the negative pressure generated by the rotor is too large, and the rising speed of the bubbles increases, which results in the bubble movement tending to be chaotic and the carbon concentrate to falling off the surface of the bubble. Therefore, the recovery rate of carbon in the floating concentrate decreases when the rotation speed is too high. Overall, for optimal conditions, the speed range of the flotation machine impeller should be set to between 1600 and 1800 r/min.
3.3. Effect of Slurry Concentration on Flotation
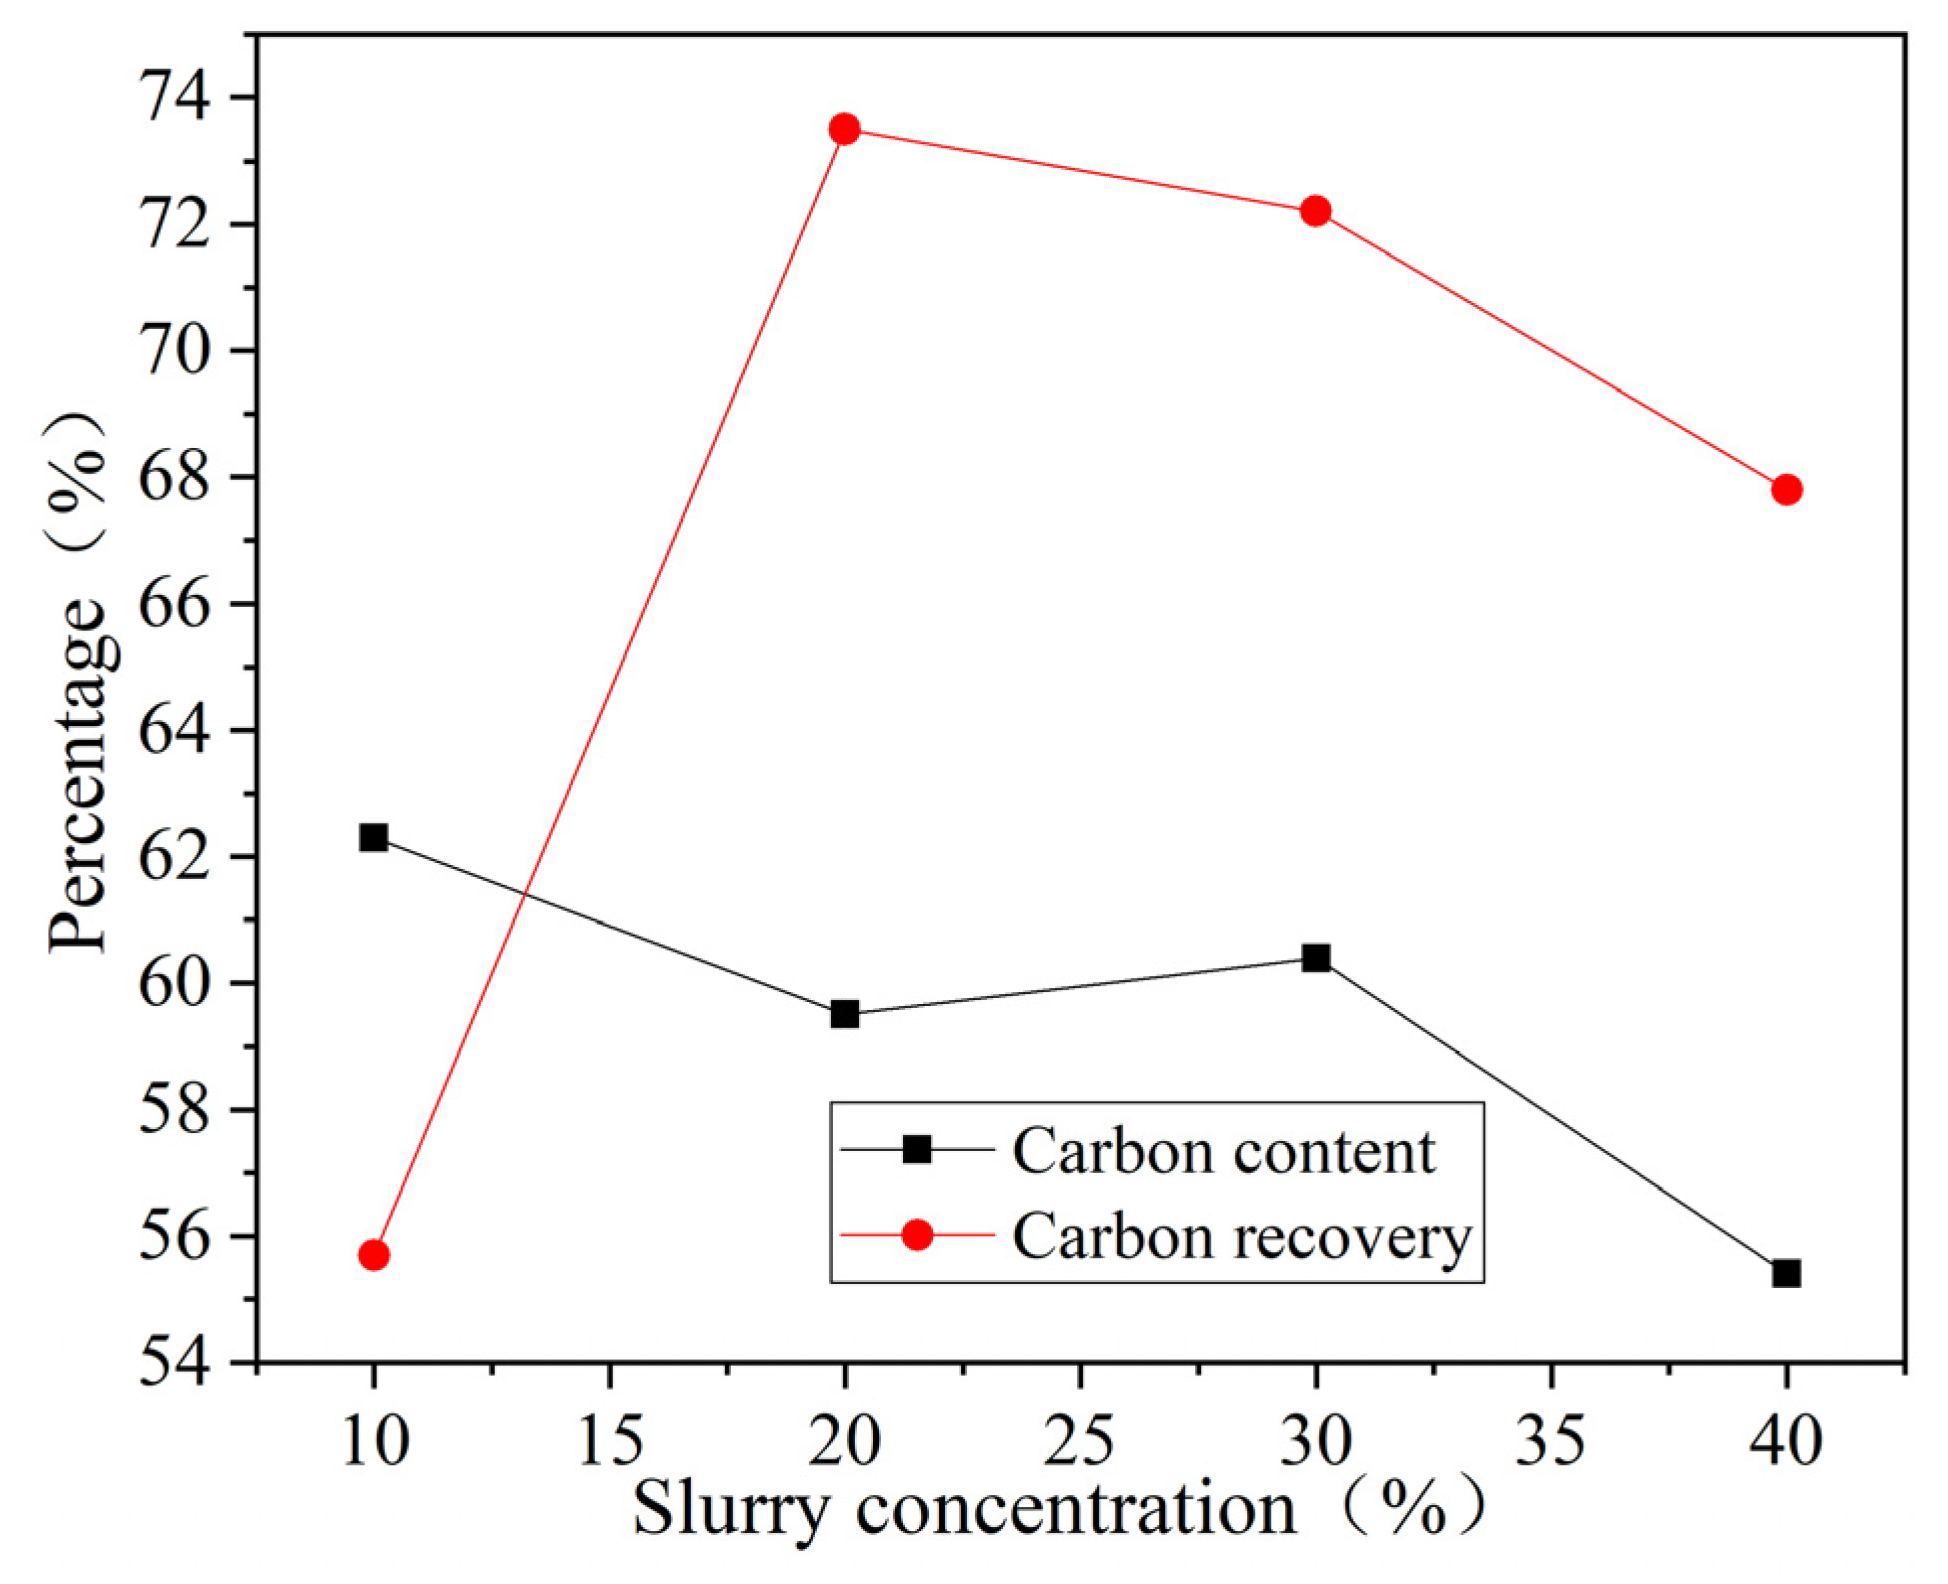
Before flotation, the carbon dust is mixed with water to make a slurry. The concentration of flotation slurry refers to the ratio of the mass of solid particles (carbon dust) of slurry raw material to slurry in the flotation machine, which affects the flotation time, reagent consumption, and bubble generation. Four different slurry concentrations of 10%, 20%, 30% and 40% as flotation variables, and the results shown in Figure 9. In this figure, it can be seen that in the low concentration environment, the carbon recovery rate in the flotation concentrate increases with the increase of slurry concentration, which is because there are fewer particles in the flotation environment, and the bubble loading capacity is the dominant factor determining the flotation effect. In the high concentration environment, with the increase in slurry concentration, the generation and loading capacity of bubbles in the flotation system are limited, and the excess particles in the slurry have difficulty adhering to the bubbles, resulting in the reduction of carbon recovery. Within the scope of the experiment, with the increase of the slurry concentration in the original sample, the distance between the particles in the flotation environment becomes smaller, and nonselective coagulation is more likely to occur during the flotation process, the impurities and the carbon concentrate are adsorbed, resulting in the grade of carbon (carbon content) being reduced. On the whole, when the slurry concentration is in the range of 20% to 30%, the flotation efficiency is high and the separation effect is better, which is the optimal condition.
3.4. Effect of Adding Reagents on Flotation
In order to improve flotation through the difference in surface properties between slurry components, it is necessary to add a flotation agent to improve the flotation process and perform agitation in advance to ensure that the flotation agent is in full contact with the particles to be floated. Depending on the application of the flotation chemicals, these include trapping agents used to change the hydrophobic properties of the mineral surface, foaming agents used to maintain foam stability and prevent bubble incorporation, and adjusting agents used to change the surface properties of the particles by adjusting the pH. In this study, the influence of agents on flotation experiment was studied.
Na2CO3 and NaOH were used considering as the pH regulator in the single factor experiments. The pH adjuster Na2CO3 or NaOH was added at a dosage of 100 g/t, the pH value of both slurries has been adjusted about 10–11, and the results are shown in Figure 10. It can be seen from Figure 10 that adding Na2CO3 or NaOH to the slurry solution has little effect on improving the flotation effect or on reducing the carbon recovery rate. Therefore, there is no need to add pH adjusters in the flotation process.
Kerosene was used as the collector in the single factor experiments, and the results are shown in Figure 11. It can be seen from Figure 11 that using kerosene as a collector, the batch dosing process increased the carbon recovery rate by 13.3% and the carbon content by 6.2%, which shows that batch dosing can effectively reduce the concentration difference of the collector in the slurry, strengthen the collision conditions of carbon particles and kerosene. Therefore, in the flotation process, using collectors and adding chemicals in batches can achieve better flotation effect.
Since the mixing time influences the agent effects, the effects of changing the mixing time on flotation were explored, and the experimental results are shown in Figure 12. Compared with the process of adding flotation reagent without mixing, adding the flotation reagent and mixing for 5 min resulted in a slightly increased carbon content and carbon recovery rate in the floating concentrate, indicating that after a certain period of mixing, the minerals and the flotation reagent were fully mixed and contacted. When the mixing time was further increased, the carbon recovery rate of the floating carbon concentrate decreased significantly, which may be due to the hydrophobic agglomeration phenomenon. Hydrophobic agglomeration refers to the behavior of hydrophobic carbon particles attracting each other to form flocs under the hydrophobic force during the flotation process, and the effective range of the force is between 10 and 25 nm. During initial mixing, the collection effect of the flotation agent increases the effective range of the hydrophobic force, thereby improving the rate of hydrophobic particle recovery. When the mixing time is too long, the effect of the mixing shear stress is much greater than the hydrophobic force, which damages hydrophobic agglomeration and increases the collision probability of hydrophobic particles and hydrophilic particles, resulting in a decrease in recovery rate. According to the above, the mixing time of flotation reagents should be limited to within 5 min.
3.5. Results and Analysis of Comparative Experimental
Industrial process experiments based on different rough flotation processes were carried out and the results were compared. The basic industrial experimental conditions were as follows: crushing particle size 2 mm, grinding time 20 min, 25% slurry concentration, single addition of collector 500 g/t, inhibitor 1 kg/t, foaming agent 200 g/t, no pH adjuster, mixing time 3 min, speed of the flotation machine impeller 1500 r/min, and flotation time 10 min. The different conditions of the optimization experiment were as follows: grinding time 11 min, the collector was added in five batches totaling 500 g/t, mixing time 5 min, and the impeller speed was 1700 r/min. The floating carbon concentrate and the underflow electrolyte obtained in the two experiments were dried and weighed separately, and the carbon content measurement results are shown in Table 6. A scanning electron microscope was used to observe the surface morphology of the optimized experimental product at a magnification of 5000×. The results are shown in Figure 13.
It can be seen in Table 6 that the optimized flotation process can improve the separation effect of carbon dust. The carbon content of the floating concentrate in the optimization experiment is increased by 5.2%, the carbon recovery rate is increased by 1.7%, and the carbon content of the underflow electrolyte is reduced by 1.3%, the separation flotation efficiency index was improved by 4.1%. Figure 13a shows the surface structure of the fixed carbon (yellow arrow) obtained after the flotation experiment is relatively smooth and appears to be irregularly stacked. Almost no cavities present in the structure and the fluoride salt particles embedded on the surface are significantly reduced. Different sizes agglomerates are shown in Figure 13b, which are mainly composed of fluoride salt (green arrow) particles. The optimized flotation experiments show that the carbon content in the float concentrate increased from initial 23.3% to 75.6%, and the carbon recovery rate was 86.9%. The concentrate can be used as carbon feedstock or mixed with coal as industrial fuel. The underflow electrolyte has a high carbon content and requires further treatment before it can be used directly. On the whole, the separation effect of the flotation experiment is more obvious, and the quality of the carbon concentrate was significantly improved.
4. Conclusions
The following conclusions can be drawn from this study of the flotation process of electrolytic aluminum carbon dust:
(1) The main components of carbon dust are C, Al2O3 and Na3AlF6, with small quantities of fluoride salts such as CaF2, LiNa2AlF6, and K2NaAlF6, which can be regarded as two components of carbon and electrolyte in the flotation process. The natural floatability of the whole carbon dust is poor, the structure is loose and easy to break and the surface has many pores. It is necessary to improve the flotation environment for better flotation effect.
(2) A grinding particle size that is too large or too small will adversely affect the flotation process. The −200 mesh particle fraction of 70% is preferred, corresponding to the grinding time of 11 min.
(3) As the speed of the flotation machine impeller increases, the carbon recovery rate first increases and then decreases. The carbon content of the concentrate first decreases and then increases. The optimal speed is between 1600 and 1800 r/min.
(4) As the slurry concentration increases, the carbon recovery rate first increases and then decreases. The carbon content of the concentrate shows a decreasing trend and the optimal slurry concentration is between 20% and 30%.
(5) In the flotation experiment, pH adjusters are not required, and the batch addition of collectors can significantly improve the flotation effect. The preferred mixing time for dosing is 5 min.
(6) Comparative experiments show that the optimal flotation experiment conditions are a −200 mesh particle while the fraction of 70%, a flotation machine impeller speed of 1700 r/min, a slurry concentration of 25%, adding collectors in five batches, and a mixing time of 5 min.
Author Contributions
H.L. proposed methodology and wrote the initial draft, J.W. did the experiment part, M.L. was the project administrator, W.H. deployed resources, B.C. and W.H. validated experimental results, M.L., Y.F. and T.X. were responsible for review and editing. All authors have read and agreed to the published version of the manuscript.
Funding
This research was funded by the Fundamental Research Funds for the Central Universities of Central South University (No. 2018zzts157).
Institutional Review Board Statement
Not applicable.
Informed Consent Statement
Not applicable.
Data Availability Statement
The data presented in this study are available on request from the corresponding author. The data are not publicly available due to privacy.
Conflicts of Interest
The authors declare no conflict of interest.
References
- Frans, A.V. Sustainable development and the challenge of innovation. J. Clean. Prod. 2002, 10, 215–223. [Google Scholar]
- Hou, W.; Li, H.; Li, M.; Zhang, B.; Wang, Y.; Gao, Y. Multi-physical field coupling numerical investigation of alumina dissolution. Appl. Math. Modell. 2019, 67, 588–604. [Google Scholar] [CrossRef]
- Ibrahim, D.; Marc, A.R. Energy, environment and sustainable development. Appl. Energy 1999, 64, 427–440. [Google Scholar]
- Hou, W.; Li, H.; Feng, Y.; Wang, J.; Li, M.; Cheng, B.; Cao, X. Effects of the application of a perforated anode in an aluminum electrolysis cell on the gas-liquid two-phase flow and bubble distribution characteristics. Ind. Eng. Chem. Res. 2020, 59, 14522–14530. [Google Scholar] [CrossRef]
- McLean, A.; Yang, Y.; Barati, M. Refining fluxes for metallurgical melts based on waste materials of the aluminium industry. Trans. Inst. Min. Metall. Sect. C 2017, 126, 106–115. [Google Scholar] [CrossRef]
- Grjotheim, K.; Krohn, M. Aluminium Electrolysis Fundamentals of the Hall-Heroult Process, 3rd ed.; Aluminium Verlag Marketing & Kommunikation GmbH: Warsaw, Poland, 2002; pp. 282–284. [Google Scholar]
- National Catalogue of Hazardous Wastes. Available online: http://www.mee.gov.cn/xxgk2018/xxgk/xxgk02/202011/W020201130399742157558.pdf (accessed on 12 January 2021).
- Zhou, J. Study on Aluminum Carbon Residue by Bubbling Fluidized Bed Technology. Master of Engineering. Master’s Thesis, Master of Engineering, Chongqing University, Chongqing, China, 2015. [Google Scholar]
- Sun, W.; Deng, M.; Hu, Y. Fine particle agregating and flotation behavior induced by high intensity conditioning of a CO2 saturation slurry. Min. Sci. Technol. 2009, 19, 483–488. [Google Scholar]
- Yalcin, E.; Kelebek, S. Flotation kinetics of a pyritic gold ore. Int. J. Miner. Process. 2011, 98, 48–54. [Google Scholar] [CrossRef]
- Xia, Y.; Yang, Z.; Zhang, R.; Xing, Y.; Gui, X. Enhancement of the surface hydrophobicity of low-rank coal by adsorbing DTAB: An experimental and molecular dynamics simulation study. Fuel 2019, 239, 145–152. [Google Scholar] [CrossRef]
- Harvey, P.A.; Nguyen, A.V.; Evans, G.M. Influence of electrical double-layer interaction on coal flotation. J. Colloid. Interf. Sci. 2002, 250, 337–343. [Google Scholar] [CrossRef]
- Nikolaev, A. Flotation recovery of toner containing iron oxide from water suspension. Miner. Eng. 2019, 144, 106027. [Google Scholar] [CrossRef]
- Estradaruiz, R.H.; Florescampos, R.; Gamezaltamirano, H.A.; Velardesanchez, E.J. Separation of the metallic and non-metallic fraction from printed circuit boards employing green technology. J. Hazard. Mater. 2016, 311, 91–99. [Google Scholar] [CrossRef]
- Zhu, G.; Wang, Y.; Wang, X.; Miller, J.D.; Lu, D.; Zheng, X.; Zhao, Y.; Zheng, H. Effects of grinding environment and lattice impurities on spodumene flotation. Trans. Nonferrous Met. Soc. China 2019, 29, 1527–1537. [Google Scholar] [CrossRef]
- Wang, L.; Hu, G.; Sun, W.; Khoso, S.A.; Liu, R.; Zhang, X. Selective flotation of smithsonite from dolomite by using novel mixed collector system. Trans. Nonferrous Met. Soc. China 2019, 29, 1082–1089. [Google Scholar] [CrossRef]
- Zhu, H.; Qin, W.; Chen, C.; Chai, L.; Li, H.; Liu, S.; Zhang, T. Selective flotation of smithsonite, quartz and calcite using alkyl diamine ether as collector. Trans. Nonferrous Met. Soc. China 2018, 28, 163–168. [Google Scholar] [CrossRef]
- Yu, Y.; Liu, J.; Wang, R.; Zhou, J.; Cen, K. Effect of hydrothermal dewatering on the slurry ability of brown coals. ISO 4 Energy. Convers. Manag. 2012, 57, 8–12. [Google Scholar] [CrossRef]
- Xing, Y.; Gui, X.; Cao, Y.; Wang, D.; Zhang, H. Clean low-rank-coal purification technique combining cyclonic-static microbubble flotation column with collector emulsification. J. Clean. Prod. 2017, 153, 657–672. [Google Scholar] [CrossRef]
- Wu, J.; Chen, L.; Zheng, N.; Sun, Z. Experimental investigation of the attachment of unburned carbon in coal fly ash to a stationary air bubble in aqueous solutions. Fuel 2021, 285, 119080. [Google Scholar] [CrossRef]
- Yang, T.; Wang, N.; Gu, H.; Guo, T. Froth flotation separation of carbon from barium slag: Recycling of carbon and minimize the slag. Waste Manag. 2021, 120, 108–113. [Google Scholar] [CrossRef] [PubMed]
- Yang, L.; Li, D.; Zhang, H.; Yan, X. Flotation kinetics of the removal of unburned carbon from coal fly ash. Energy Sources Part A 2018, 40, 1781–1787. [Google Scholar] [CrossRef]
- Derya, O.; Sabina, K.; Huseyin, K. Recycling of coal combustion wastes. Waste Manag. Res. 2009, 27, 267–273. [Google Scholar]
- Zhang, W.; Honaker, R. Studies on carbon flotation from fly ash. Fuel Process. Technol. 2015, 139, 236–241. [Google Scholar] [CrossRef]
- Zhou, F.; Yan, C.; Wang, H.; Zhou, S.; Liang, H. The result of surfactants on froth flotation of unburned carbon from coal fly ash. Fuel 2017, 190, 182–188. [Google Scholar] [CrossRef]
- An, M.; Liao, Y.; Zhao, Y.; Li, X.; Lai, Q.; Liu, Z.; He, Y. Effect of frothers on removal of unburned carbon from coal-fired power plant fly ash by froth flotation. Sep. Sci. Technol. 2018, 53, 535–543. [Google Scholar] [CrossRef]
- Yang, L.; Zhu, Z.; Li, D.; Yan, X.; Zhang, H. Effects of particle size on the flotation behavior of coal fly ash. Waste Manag. 2019, 85, 490–497. [Google Scholar] [CrossRef]
- Xu, M.; Li, C.; Wang, Y.; Zhang, H. Investigation on mechanism of intensifying coal fly ash froth flotation by pretreatment of non-ionic surfactant. Fuel 2019, 254, 115601. [Google Scholar] [CrossRef]
- Walker, A.; Wheelock, T.D. Separation of Carbon from Fly Ash Using Froth Flotation. Int. J. Coal Prep. Util. 2006, 26, 235–250. [Google Scholar] [CrossRef]
- Harris, T.; Thomas, D. Process Conditions for the Separation of Carbon from Fly Ash by Froth Flotation. Int. J. Coal Prep. Util. 2008, 28, 133–152. [Google Scholar] [CrossRef]
- Vasyunina, N.V.; Belousov, S.V.; Dubova, I.V.; Morenko, A.V.; Druzhinin, K.E. Recovery of Silicon and Iron Oxides from Alumina-Containing Sweepings of Aluminum Production. Russ. J. Non-Ferr. Met. 2018, 59, 230–236. [Google Scholar] [CrossRef] [Green Version]
- Tropenauer, B.; Klinar, D.; Samec, N.; Golob, J.; Kortnik, J. Sustainable waste-treatment procedure for the spent potlining (SPL) from aluminium production. Mater Tehnol. 2018, 53, 277–284. [Google Scholar] [CrossRef]
- Li, N.; Xie, G.; Wang, Z.; Hou, Y.; Li, R. Recycle of Spent Potlining with Low Carbon Grade by Floatation. AMR 2014, 881–883, 1660–1664. [Google Scholar] [CrossRef]
- Omair, M.; Sarkar, B.; Eduardo, L. Minimum Quantity Lubrication and Carbon Footprint: A Step towards Sustainability. Sustainability 2017, 9, 714. [Google Scholar] [CrossRef] [Green Version]
- Valeev, D.; Kunilova, I.; Alpatov, A.; Varnayskaya, A. Magnetite and Carbon Extraction from Coal Fly Ash Using Magnetic Separation and Flotation Methods. Minerals 2019, 9, 320. [Google Scholar] [CrossRef] [Green Version]
Figure 1.
X-ray diffraction (XRD) pattern of electrolytic aluminum carbon dust.

Figure 2.
Scanning electron microscope (SEM) surface topography of carbon dust.

Figure 3.
Contact angle of carbon dust.

Figure 4.
Flotation process for a single factor experiment.

Figure 5.
Comparison experiment flow chart.

Figure 6.
Carbon content of raw fraction carbon dust.

Figure 7.
Effect of the mass of −200 mesh particles on flotation.

Figure 8.
The effects of impeller speed on flotation.

Figure 9.
Effect of slurry concentration on flotation.

Figure 10.
Effect of pH control agents on flotation.

Figure 11.
Effect of batch addition on flotation.

Figure 12.
Effect of mixing time on flotation.

Figure 13.
Surface topography of (a) recovered carbon and (b) recovered electrolyte using SEM.


Table 1.
Relative content of the main component of carbon dust.
| Composition. | Na3AlF6 | Al2O3 | CaF2 | K2NaAlF6 | LiNa2AlF6 | Carbon |
|---|---|---|---|---|---|---|
| Relative Content/% | 60 | 11 | 2 | 2 | 4 | 20 |
Table 2.
Elemental analysis of carbon dust.
| Elements | C | O | F | Na | Al | S | Cl | K | Ca | Others |
|---|---|---|---|---|---|---|---|---|---|---|
| Content/% | 23.3 | 11.3 | 34.9 | 13.4 | 10.4 | 1.81 | 1.68 | 1.02 | 1.49 | 0.7 |
Table 3.
Specifications of the single-slot flotation machine.
| Volume/L | Diameter of Impeller/mm | Maximum Speed (r/min) | Feed Size/mm | Power/W |
|---|---|---|---|---|
| 1.5 | Φ60 | 2800 | 0.04–0.25 | 125 |
Table 4.
Experimental reagent details.
| Reagent Function | Name | Specification |
|---|---|---|
| Collector | Kerosene | Technical Grade |
| Foaming agent | Terpenic oil | Technical Grade |
| Inhibitor | Water glass | Technical Grade |
| pH adjuster | Sodium carbonate | Chemically Pure |
| pH adjuster | Sodium hydroxide | Chemically Pure |
Table 5.
Basic conditions for single factor flotation experimental process.
| Process | Basic Conditions |
|---|---|
| Crushed average particle size | 2 mm |
| Slurry concentration | 25% |
| Milling time | 15 min |
| Impeller speed | 1500 r/min |
| Inhibitor | 1 kg/t |
| Foaming agent | 200 g/t |
| pH adjuster | None |
| Collector (total) | 500 g/t |
| Stirring time | 3 min |
| Flotation time | 10 min |
Table 6.
Comparison of basic and optimized industrial process experiments.
| Material Types | Basic | Optimized | Difference |
|---|---|---|---|
| Initial carbon content (%) | 23.3 | 23.3 | - |
| Initial electrolyte content (%) | 76.7 | 76.7 | - |
| Carbon content in concentrate (%) | 70.4 | 75.6 | 5.2 |
| Carbon recovery rate (%) | 85.2 | 86.9 | 1.7 |
| Carbon content in electrolyte (%) | 8.8 | 7.5 | −1.3 |
| Concentrate yield (%) | 28.2 | 26.8 | −1.4 |
| Efficiency index (%) | 74.3 | 78.4 | 4.1 |
Publisher’s Note: MDPI stays neutral with regard to jurisdictional claims in published maps and institutional affiliations. |
© 2021 by the authors. Licensee MDPI, Basel, Switzerland. This article is an open access article distributed under the terms and conditions of the Creative Commons Attribution (CC BY) license (http://creativecommons.org/licenses/by/4.0/).
Share and Cite
MDPI and ACS Style
Li, H.; Wang, J.; Hou, W.; Li, M.; Cheng, B.; Feng, Y.; Xu, T. The Study of Carbon Recovery from Electrolysis Aluminum Carbon Dust by Froth Flotation. Metals 2021, 11, 145. https://doi.org/10.3390/met11010145
AMA Style
Li H, Wang J, Hou W, Li M, Cheng B, Feng Y, Xu T. The Study of Carbon Recovery from Electrolysis Aluminum Carbon Dust by Froth Flotation. Metals. 2021; 11(1):145. https://doi.org/10.3390/met11010145
Chicago/Turabian StyleLi, Hesong, Jiaoru Wang, Wenyuan Hou, Mao Li, Benjun Cheng, Yuan Feng, and Tibo Xu. 2021. "The Study of Carbon Recovery from Electrolysis Aluminum Carbon Dust by Froth Flotation" Metals 11, no. 1: 145. https://doi.org/10.3390/met11010145
Note that from the first issue of 2016, this journal uses article numbers instead of page numbers. See further details here.