Process Window for Electron Beam Melting of 316LN Stainless Steel


Sports Tech Research Centre, Department of Quality Management and Mechanical Engineering, Mid Sweden University, Akademigatan 1, SE-83125 Östersund, Sweden
*
Author to whom correspondence should be addressed.
Metals 2021, 11(1), 137; https://doi.org/10.3390/met11010137
Submission received: 21 December 2020
/
Revised: 7 January 2021
/
Accepted: 8 January 2021
/
Published: 12 January 2021
(This article belongs to the Special Issue Metal Additive Manufacturing – State of the Art 2020)
Abstract
:Electron beam melting (EBM) is currently hampered by the low number of materials available for processing. This work presents an experimental study of process parameter development related to EBM processing of stainless steel alloy 316LN. Area energy (AE) input and beam deflection rate were varied to produce a wide array of samples in order to determine which combination of process parameters produced dense (>99%) material. Both microstructure and tensile properties were studied. The aim was to determine a process window which results in dense material. The range of AE which produced dense materials was found to be wider for 316LN than for many other reported materials, especially at lower beam deflection rates. Tensile and microstructural analysis showed that increasing the beam deflection rate, and consequently lowering the AE, resulted in material with a smaller grain size, lower ductility, lower yield strength, and a narrower window for producing material that is neither porous nor swelling.
1. Introduction
One advantage that laser-based powder bed fusion (laser-PBF) methods still have over the electron beam melting (EBM) method is the sheer number of different materials available for processing. The dominant EBM machine supplier for industrial applications, Arcam (Arcam AB, Gothenburg, Sweden), currently supports six different materials, while the numerous suppliers of laser-based equipment offer more than 20 different materials. EBM process windows for pure copper [1,2,3], Inconel 718 [4], and Ti64 [5,6] have previously been reported. Wang et al. [7] presented work on EBM process development for 316L, and other researchers [8,9,10,11] have also presented work on EBM of 316LN, which is a nitrogen-enriched version of 316L, although without disclosing their process development methods. Stainless steel alloy 316L is a versatile engineering material that features outstanding corrosion resistance, good weldability, high strength, and high ductility [10]; it is readily available in a powder form suitable for additive manufacturing and offers a lower material cost than, for instance, the commonly used alloy Ti6Al4V. Therefore, 316L is a desirable choice for industrial adaptation for EBM. Using 316L(N) for additive manufacturing is not novel in itself; laser-PBF [12,13,14] and directed energy deposition [15,16,17] methods have been used to process 316L feedstock into solid parts. The novelty is found with the adaptation of the EBM process to the 316LN powder feedstock, and where previously mentioned research has demonstrated the feasibility of using EBM for 316LN for producing parts, this work explores the processing parameter space for which good, solid parts can be manufactured.
When using EBM to produce materials with high relative density and low top surface roughness, it is vital to find the correct process parameters [18,19]. The present work focuses on managing two of the critical process parameters: electron beam deflection rate and electron beam power input. The combination of said parameters determines the amount of beam energy applied to each part of the powder bed, often described as area energy (AE) (J/mm2). The parameters also determine the build temperature and solidification rate, which influence microstructure [20,21], as well as the build time, which relates to the overall productivity of the machine.
This study presents a well-defined process window for 316LN stainless steel, along with an investigation into the relationship between varying process parameters. The resulting microstructure and mechanical properties are investigated for a selection of process parameter settings. From an industrial standpoint, the important productivity aspect is presented, and one can relate the productivity to material properties.
2. Materials and Methods
2.1. Sample Manufacturing and Process Parameters
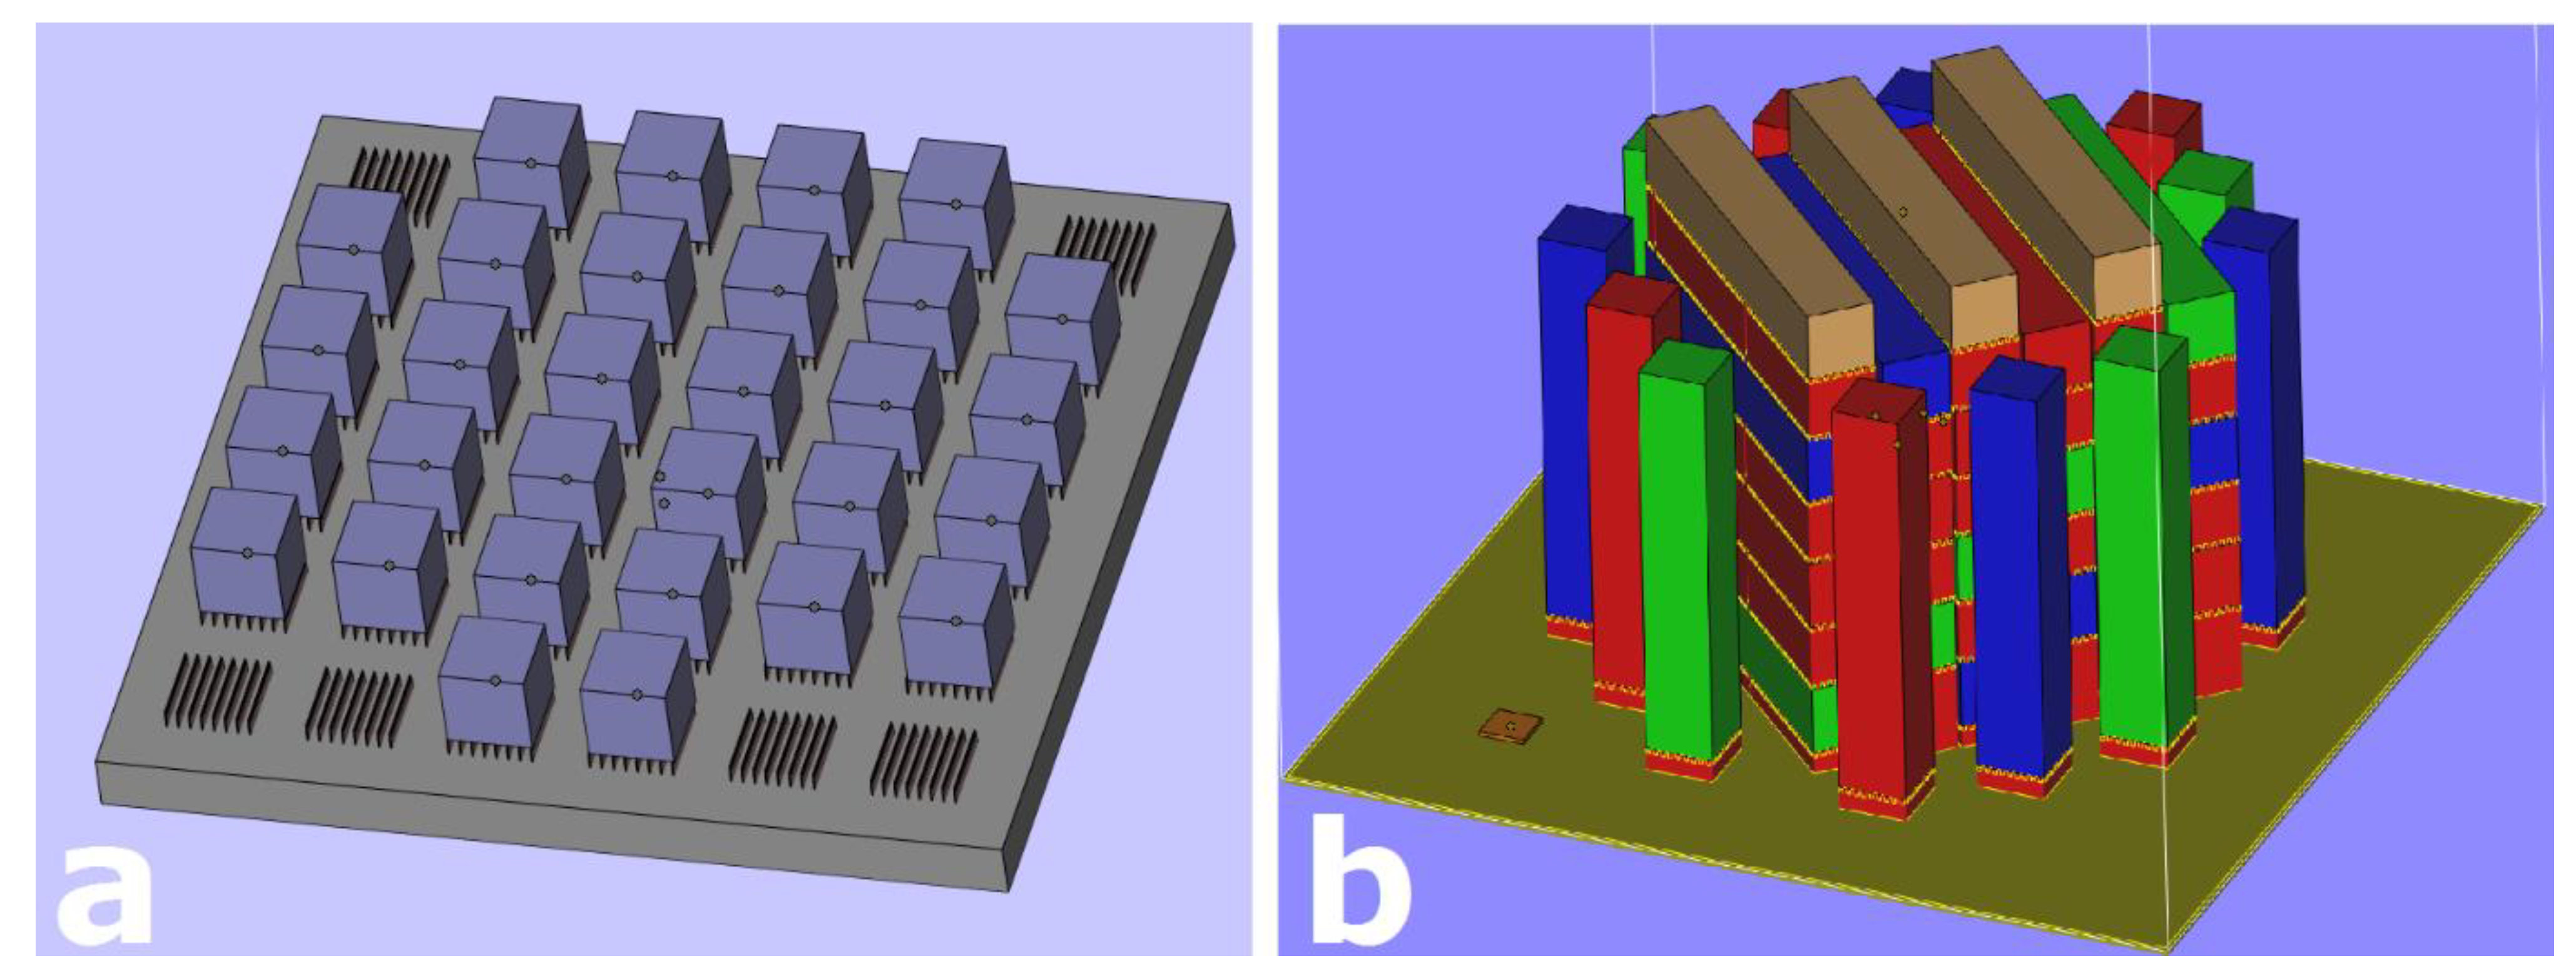
All samples were manufactured using a modified Arcam S20 EBM machine (GE Additive, Mölnlycke, Sweden) facilitating a 3 kW tungsten filament electron gun with an approximately 200 µm powder bed interaction diameter. Each build consisted of 30 pieces of 15 mm × 15 mm × 15 mm cubes arranged on a 170 mm × 170 mm stainless steel substrate (Figure 1a), with each cube assigned a unique set of process parameters. The process area energy (AE), calculated by Equation (1)
was varied by changing beam deflection rate and beam current while layer thickness (70 µm), line spacing (0.1 mm), process temperature (initially 810–820 °C, measured below start plate), hatch scanning strategy (snake pattern with layer-wise directional change), and focus offset (5 mA) remained constant. Equations (2) and (3) were used for calculating volumetric processing rate and volumetric energy input.
Automatic temperature control features were deactivated, and process temperature was regulated by altering preheat theme parameters during manufacturing. Each sample top surface was visually analyzed using light microscopy (Nikon Instruments, Tokyo, Japan) to determine porosity or swelling tendencies, and these observations were later quantified by Archimedes-type density measurements. A total of 120 sample cubes were manufactured over 4 builds. Tensile specimens were manufactured in the form of 15 mm × 15 mm × 90 mm rectangular blocks. Specimens arranged lengthwise in the xy-plane were angled at 45° with respect to the x- and y-axes in order to maintain a constant scan length between layers (Figure 1b). All specimens were built on 3.5 mm supports to facilitate ease of post-build removal and assurance of initial process stability. A total of 30 tensile bars were manufactured.
2.2. Powder Material
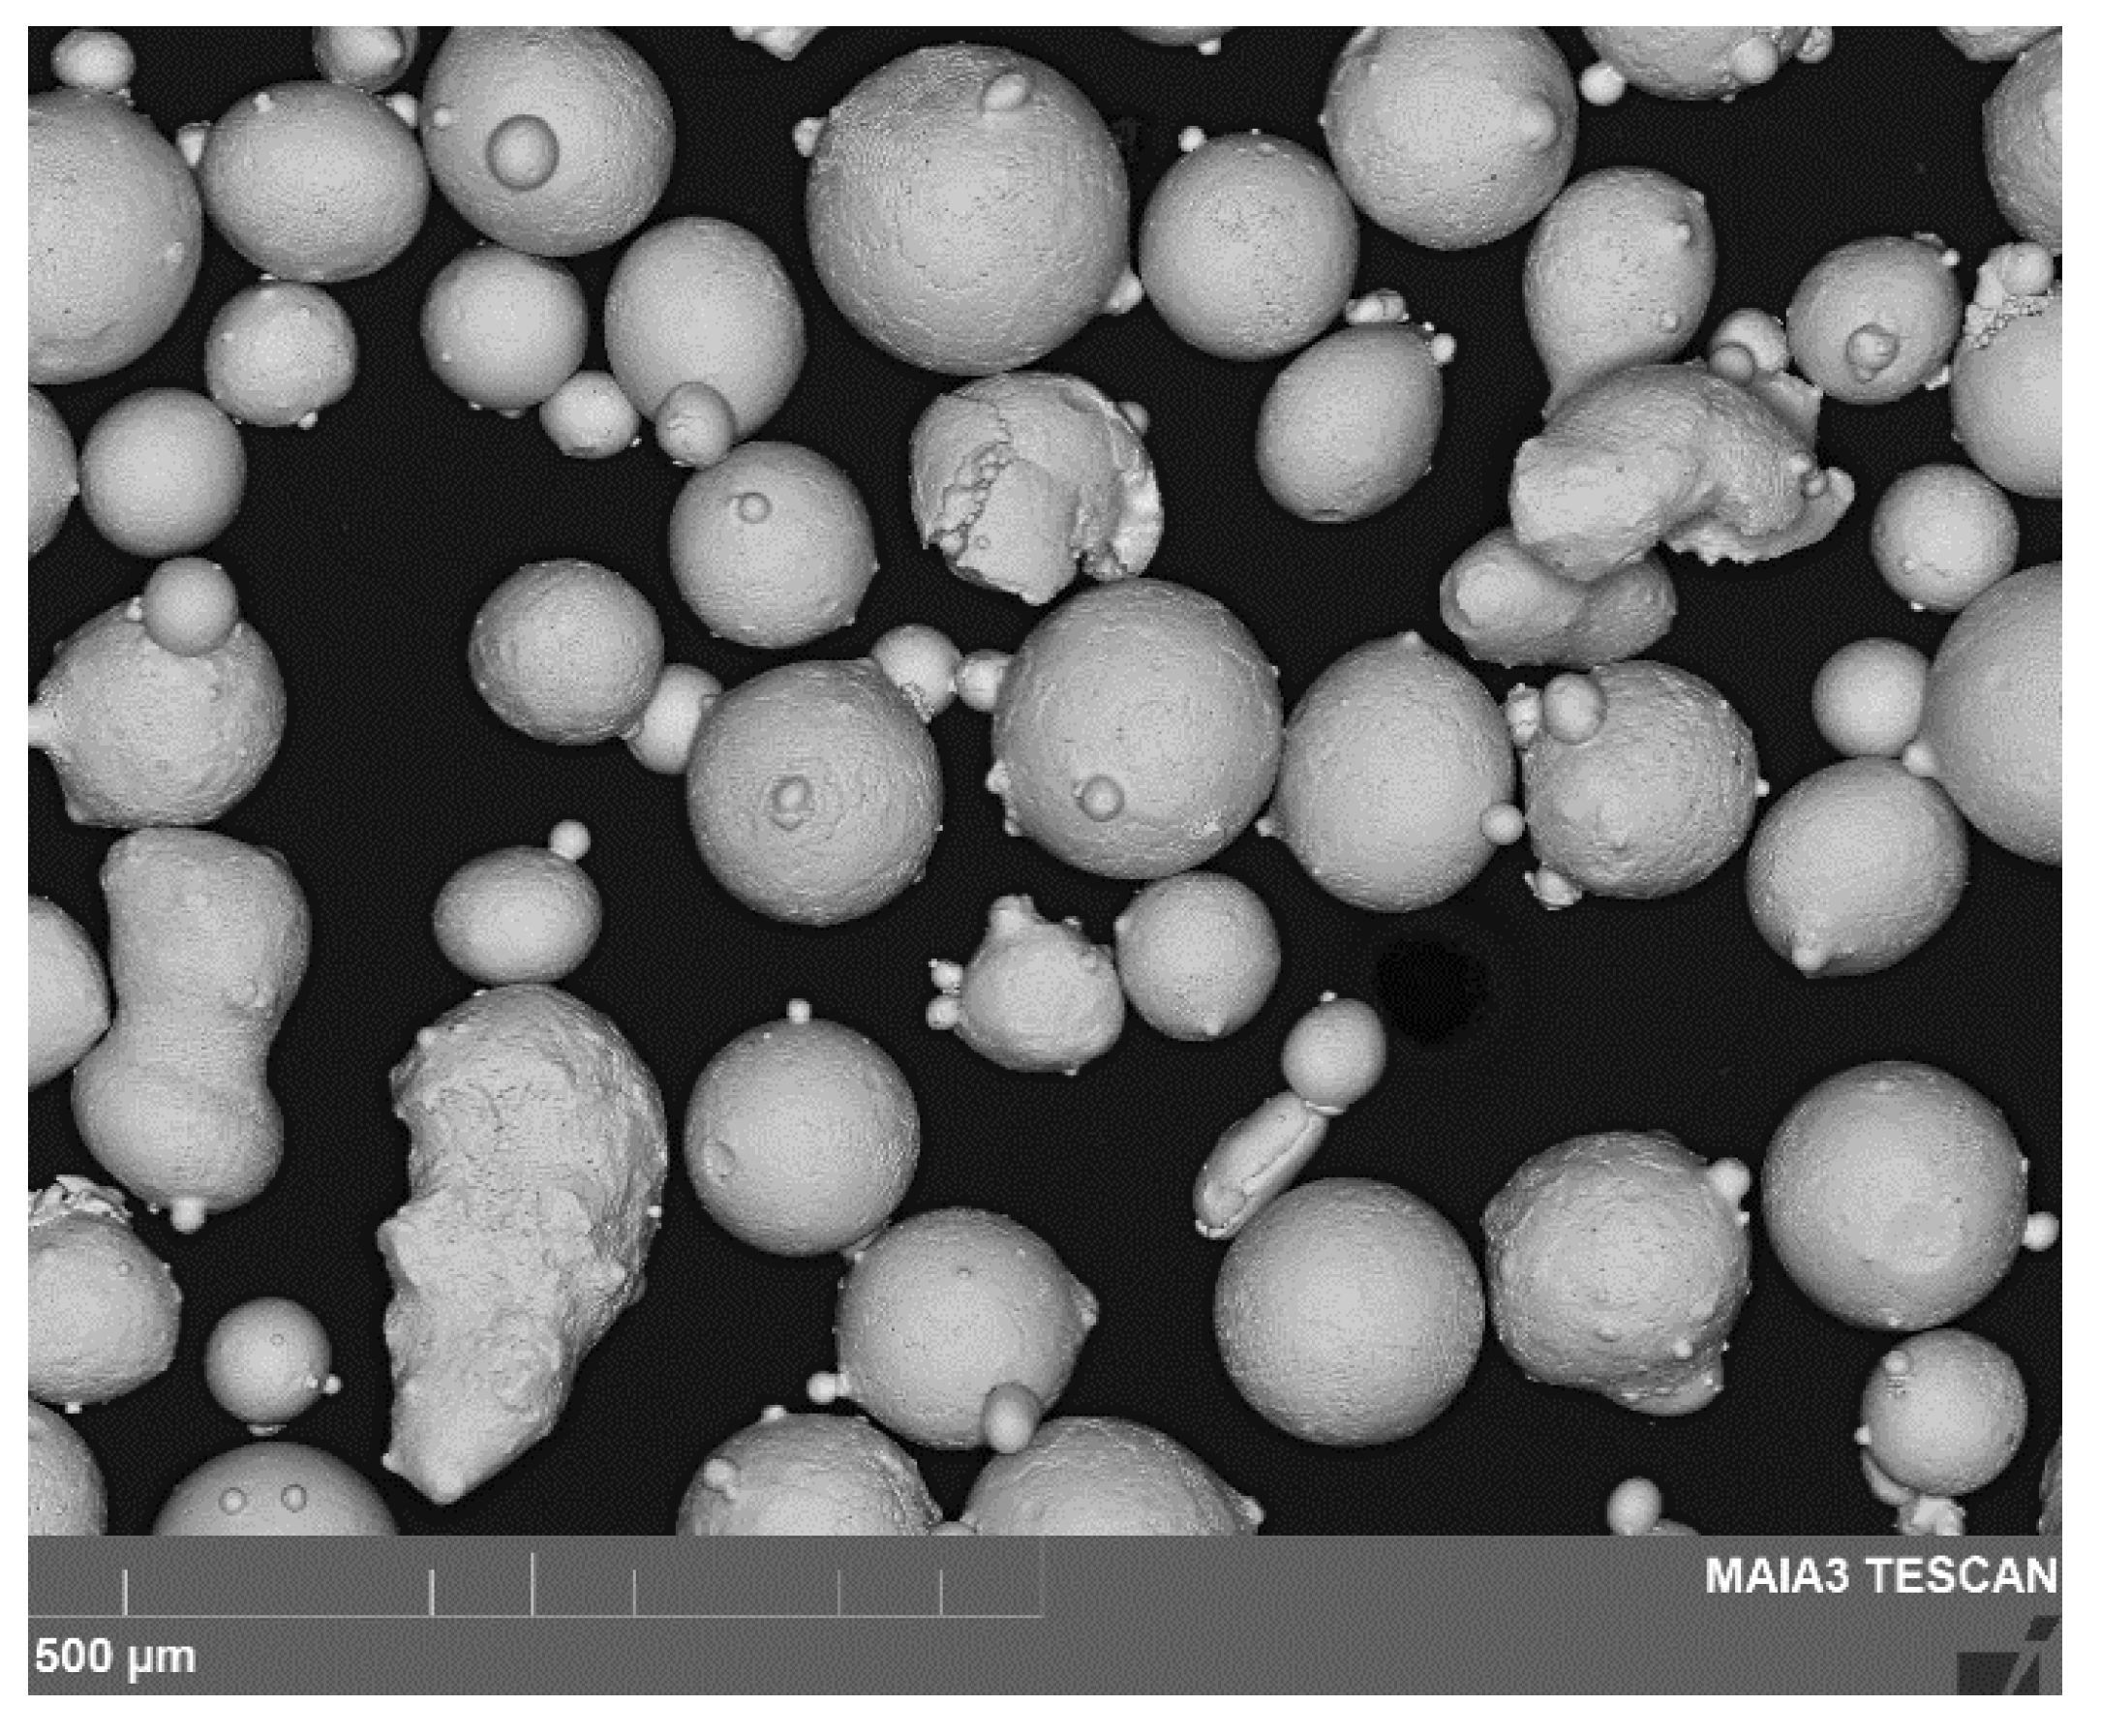
A gas-atomized 316LN precursor powder (Carpenter, Torshälla, Sweden) with 53–150 µm grain size range was used for this study. The chemical composition of the powder was 17.6 wt.% Cr, 12.3 wt.% Ni, 2.46 wt.% Mo, 1.7 wt.% Mn, 0.5 wt.% Si, 0.075 wt.% N, 0.013 wt.% C, and Fe for balance. The morphology of the powder was analyzed using scanning electron microscopy, flowability using a Hall flow funnel, and packing ratio using a scale with 10−4 g resolution. The powder used for this study had been recycled in the standard Arcam powder recovery system several times.
2.3. Density Measurement
Sample relative density was determined using Archimedes’ method. From Archimedes’ principle, sample density ( sample) was calculated via Equation (4)
where Win air and Win liq. are the measured sample weight in air and distilled water, respectively, and liq. is the density of the liquid for submersion. Three repetitive measurements were taken for each sample.
2.4. Testing of Mechanical Properties
Tensile specimens were machined from 15 mm × 15 mm × 90 mm rectangular blocks into circular cross-section rods of dimensions compliant with the “Small size specimen 3” of ASTM E8/E8M-13a (Ø6 mm and length 56 mm of reduced section). Tensile tests were carried out at room temperature using an Instron 5969 Universal Testing System (Instron, Norwood, MA, USA) with a clip-on extensometer. Four tensile specimens were tested for each selected process parameter setting: 1000/2.7, 3000/1.8, and 5000/1.5 (beam deflection rate (mm/s)/AE (J/mm2)). The process parameters were selected based on AE location being in the center of their approved respective beam deflection rate in the process window. Rockwell B hardness was determined using a Mitutoyo HR200 with a type B ball indenter.
2.5. Microstructural Characterization
Samples were encapsulated in acrylic resin and mechanically polished using colloidal silica as final polishing medium. Microstructural features were revealed via electrochemical etching with oxalic acid (saturated solution + 10% H20) for 30–60 s at 2 V with approximately 0.03 A (no current limit). Scanning electron microscopy and energy-dispersive X-ray spectroscopy (EDS) (Tescan Maia 3, Tescan, Brno, Czech Republic) were used to analyze the elemental composition of the processed material and to produce imagery for grain size analysis. EDS data was acquired and analyzed using AZtec software (Oxford Instruments, Abingdon, Oxfordshire, UK).
Optical spectroscopy was used to analyze and retrieve images of melt tracks revealed by the etching process. Image analysis was used to quantify the melt track width.
The grain dimensions were examined using particle analysis in ImageJ software (National Institutes of Health, Bethesda, Maryland, MD, USA).
2.6. Statistical Analysis
A null hypothesis stating that group arithmetic means are equal was used. Alpha of 0.05 (p ≤ 0.05) was used for rejection of the null hypothesis. Group means were compared with a t-test method. Since the expectation of the results was unknown, the t-test results were evaluated for double-sided variance. The arithmetic mean and standard deviation were used to present the test data.
3. Results and Discussion
The powder was mainly spherical in shape with some satellites attached, although some oddly shaped powder grains were observed (Figure 2). Particles deviating from spherical shape did not influence flowability (14.7 s/50 g Hall flow) or spreadability (visually determined) to the point of affecting the quality of powder distribution during processing. The bulk density of powder was approximately 4.98 g/cm3, or 62.3%.
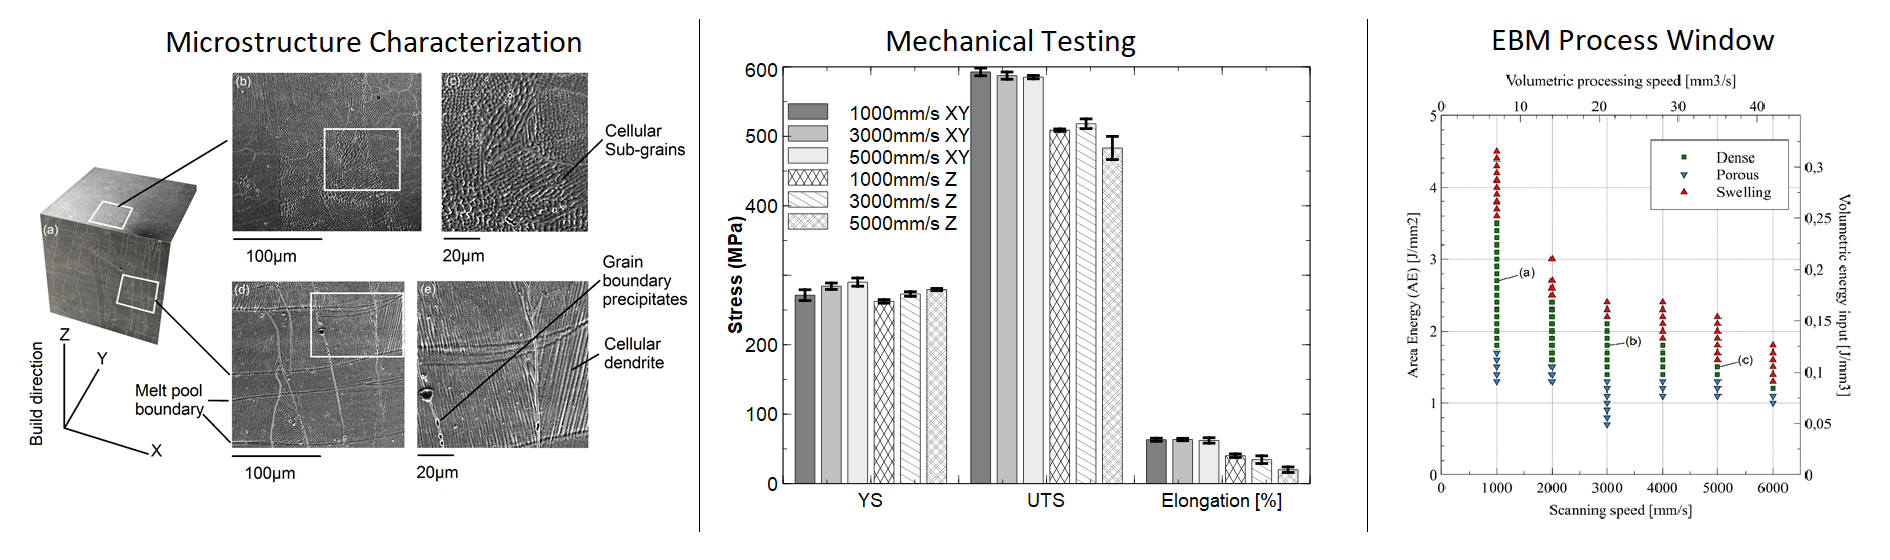
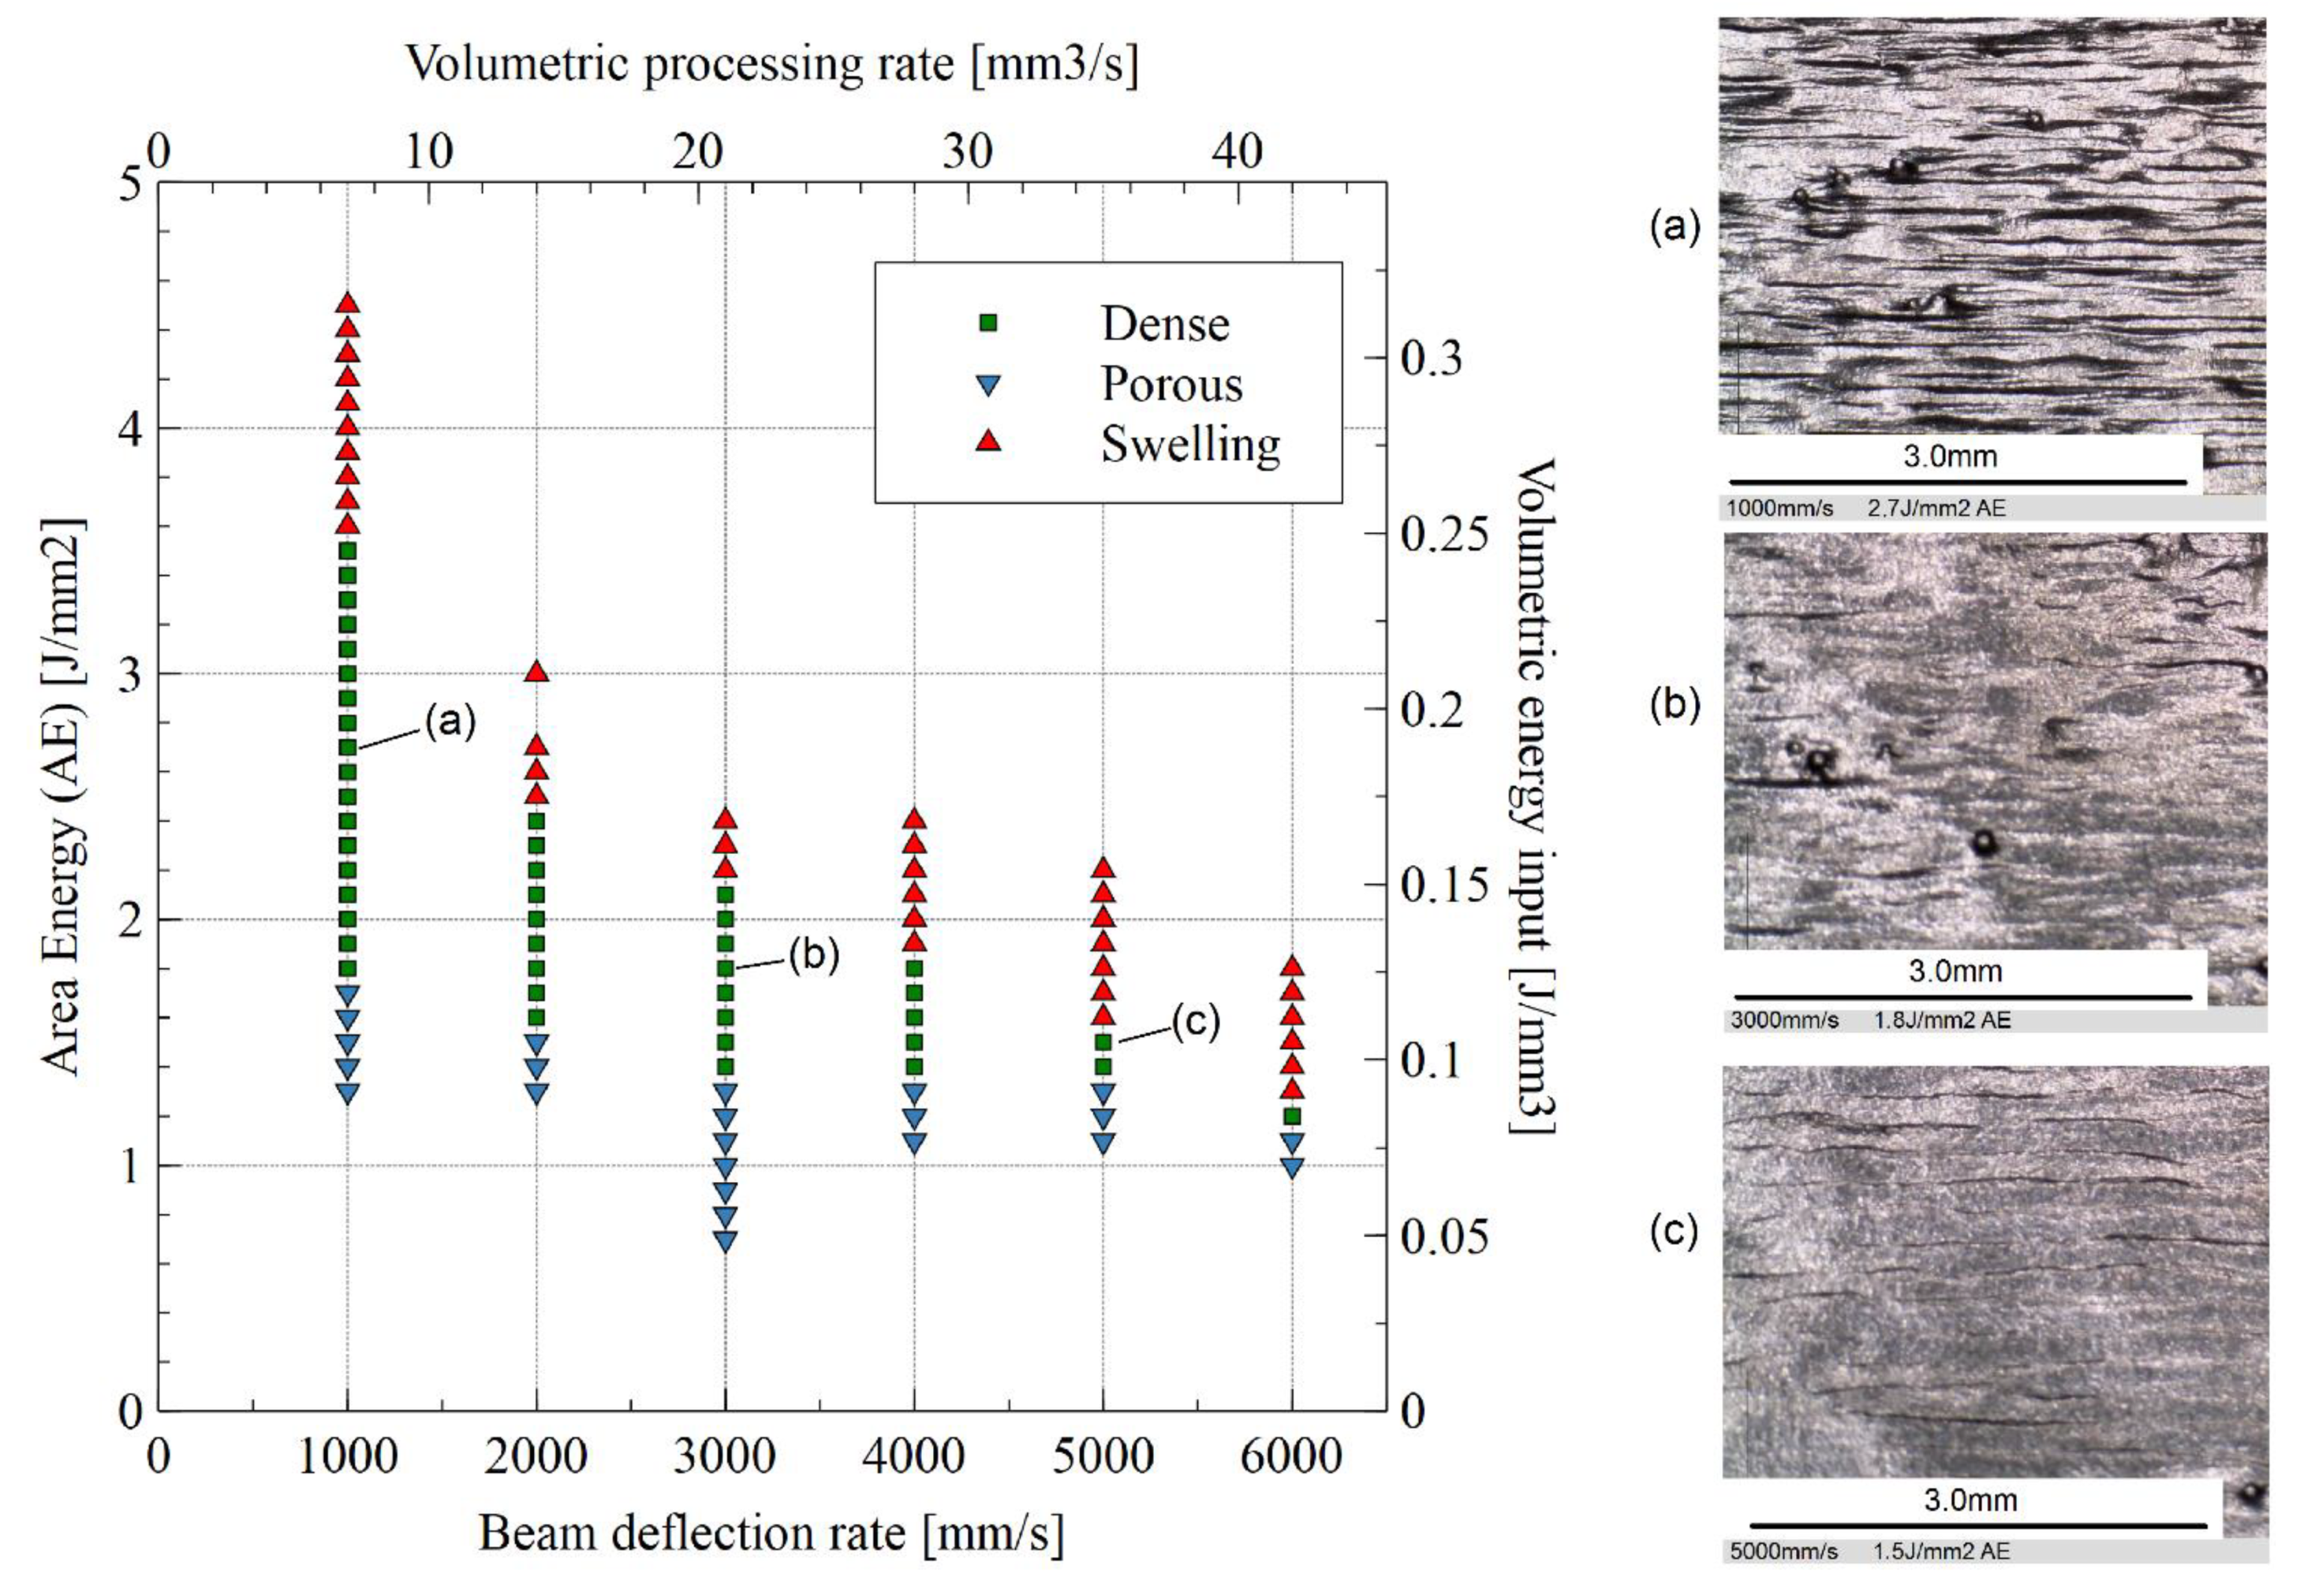
At lower beam deflection rates, there was a wide AE spectrum for producing dense material, but the acceptable AE span decreased as the deflection rate increased (Figure 3). Three process settings of varying beam deflection rates and AE were selected from the process window: samples “a” (1000 mm/s, 2.7 J/mm2), “b” (3000 mm/s, 1.8 J/mm2), and “c” (5000 mm/s, 1.5 J/mm2).
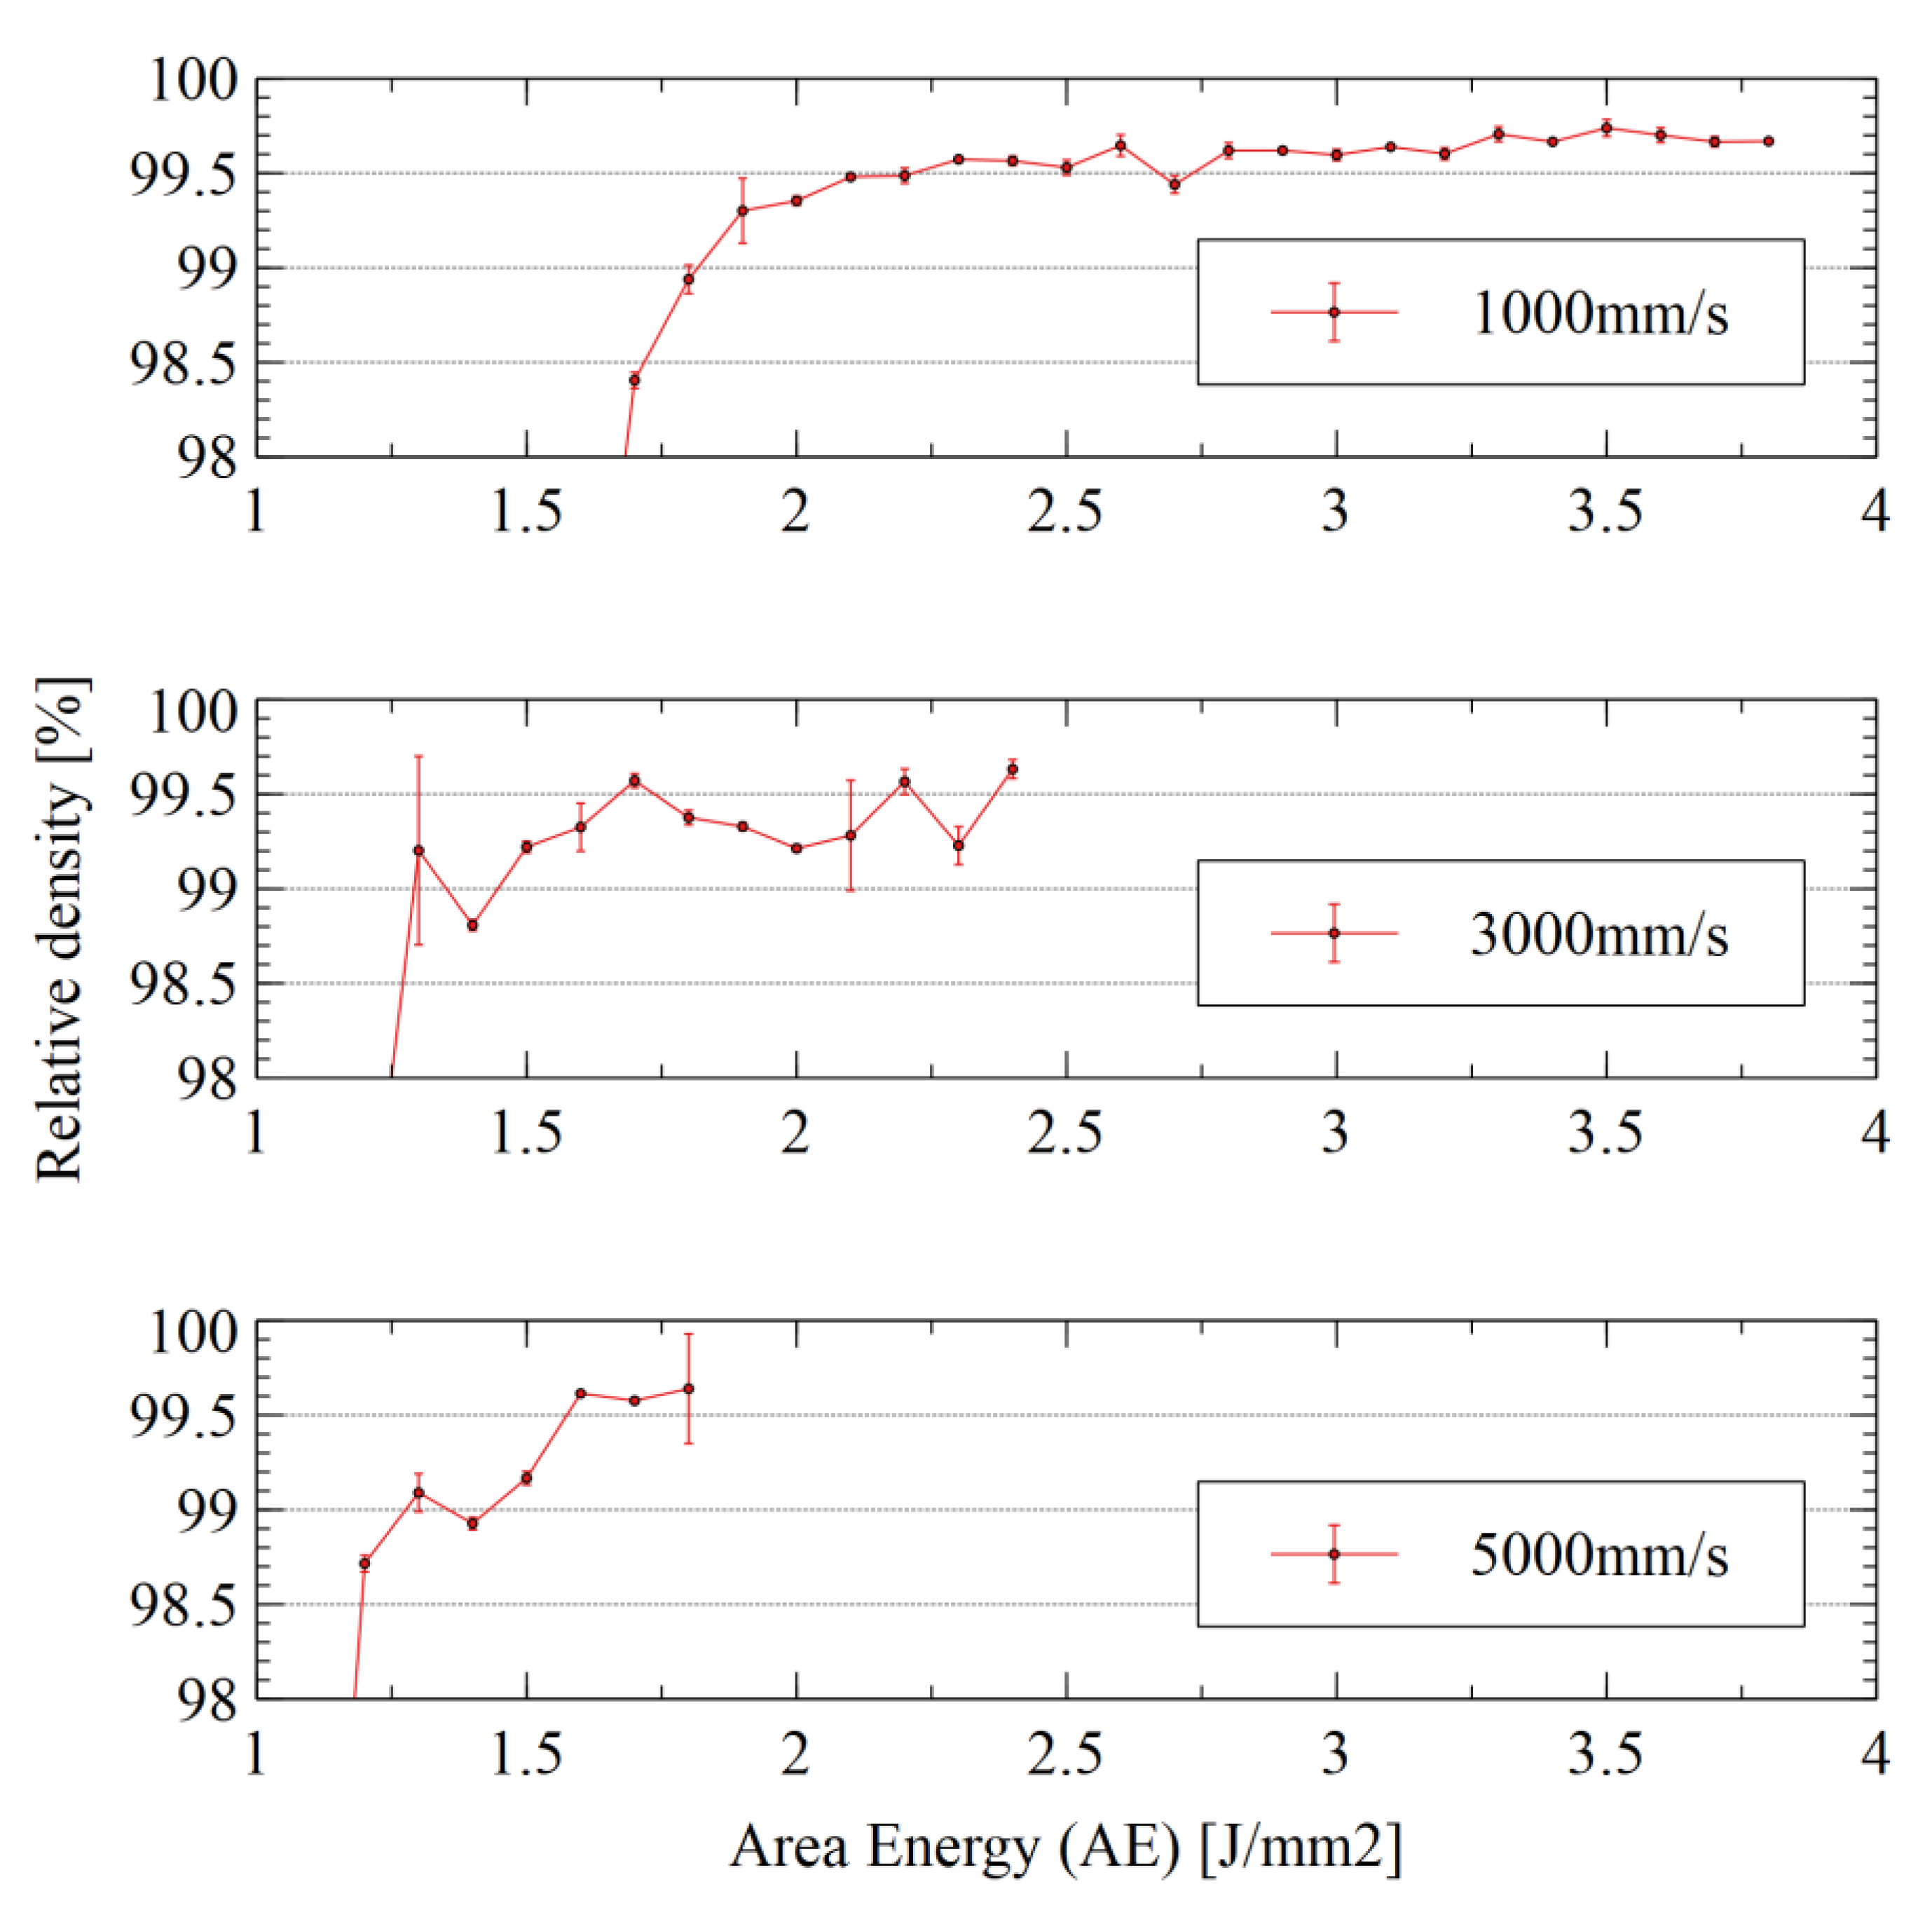
Density measurements showed a well-defined point of AE below which the samples had decreasing density (Figure 4). In addition, the density of the samples increased as the AE increased, even when entering the swelling region of the process window.
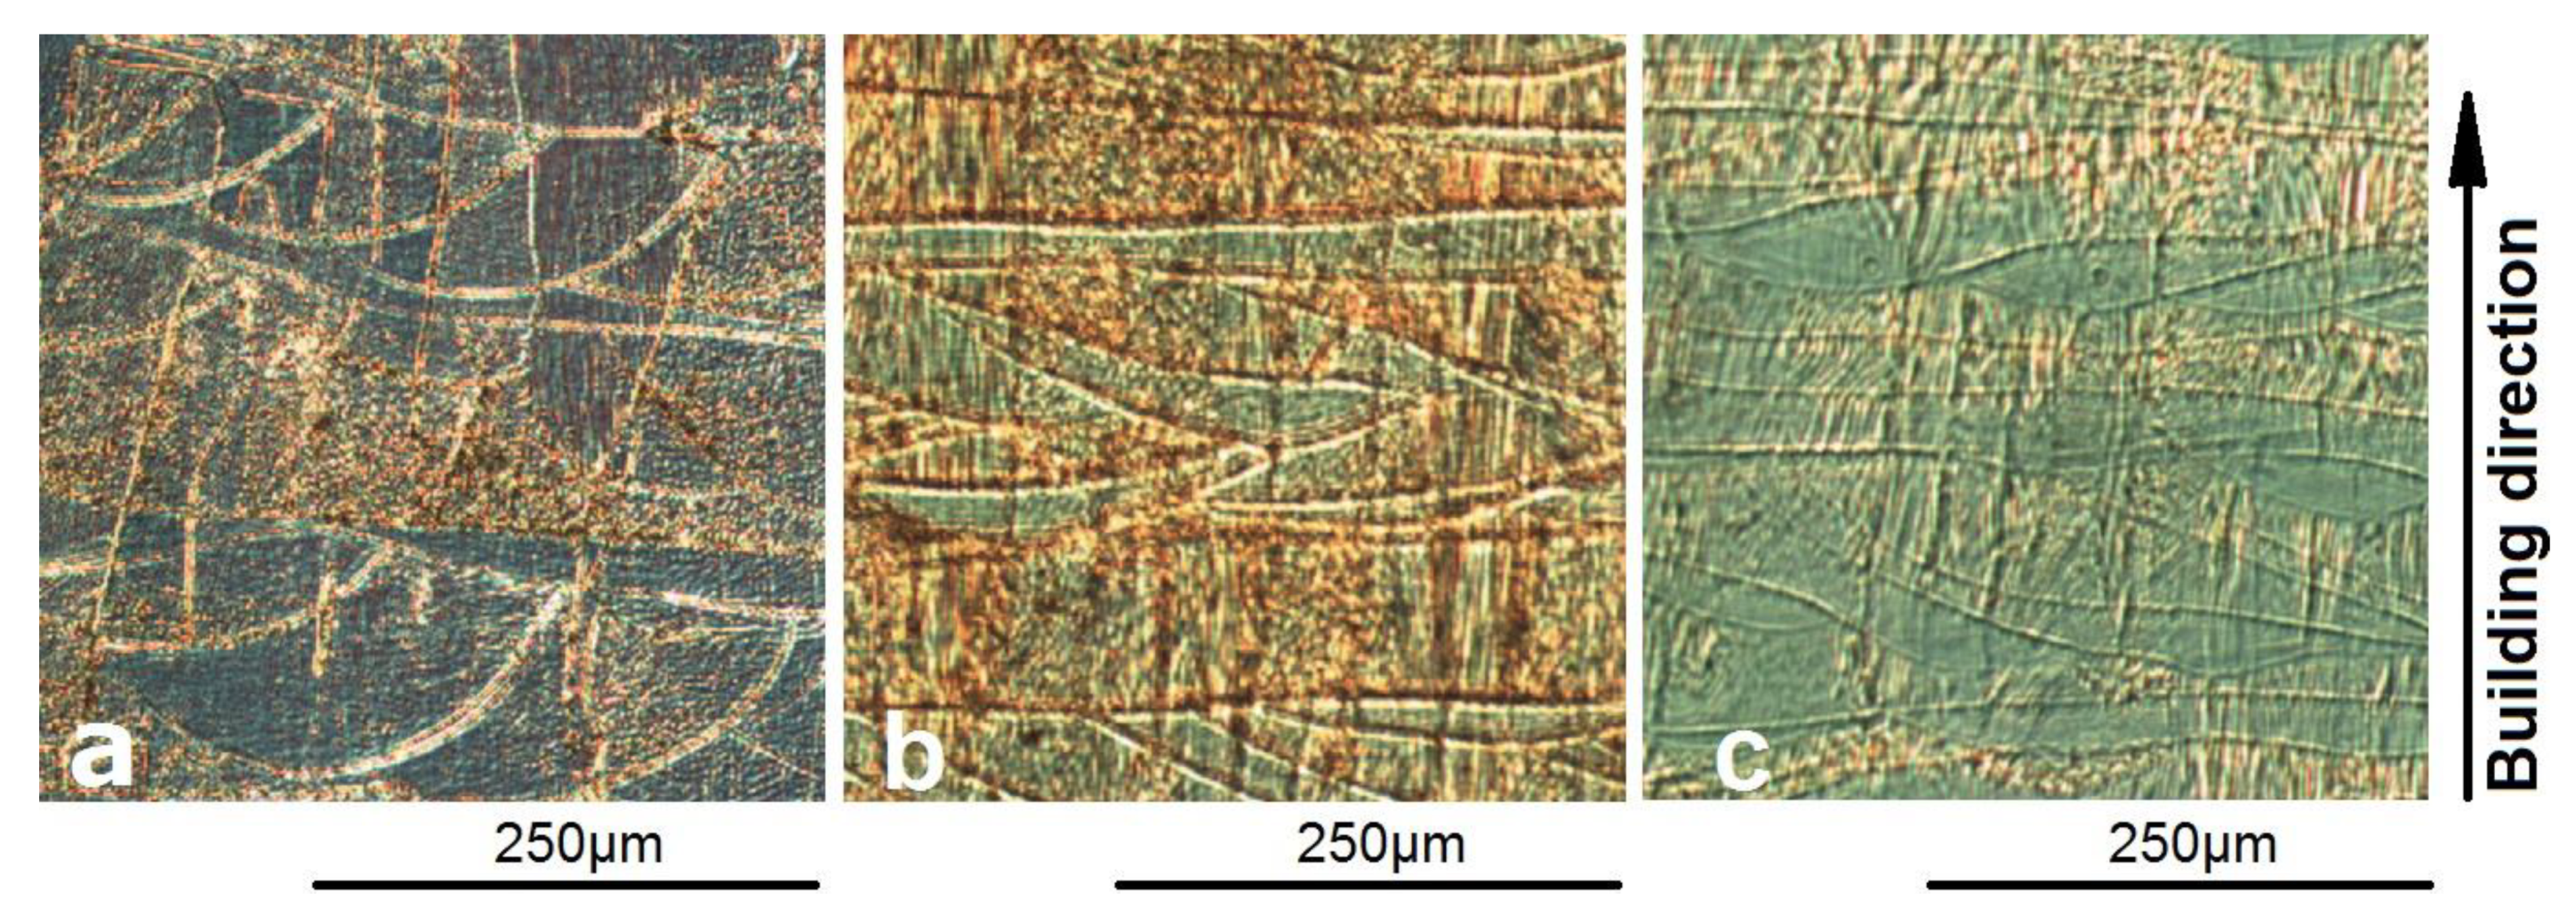
The impact of different process parameters on surface topography was visually clear. While density measurement showed that lower beam deflection rates resulted in higher relative density, the visual surface quality in terms of apparent surface roughness improved with higher deflection rates (Figure 3). One could hypothesize that this was an effect of melt pool dynamics, where the lower beam deflection rate caused the material to completely solidify between beam passes. The higher beam deflection rate may have entered a dynamic regime where the adjacent melt track was at least partly in a liquid state, thus combining the two melt tracks more seamlessly. This would also explain why the melt tracks appeared narrower at lower beam deflection rates, even though the opposite situation would be a reasonable assumption given the higher area energy input. This hypothesis is supported by the cross sections of samples a, b, and c (see Figure 5), with melt track widths of average (SD): 254 µm (38.3), 442 µm (78.8), and 649 µm (27.5), respectively.
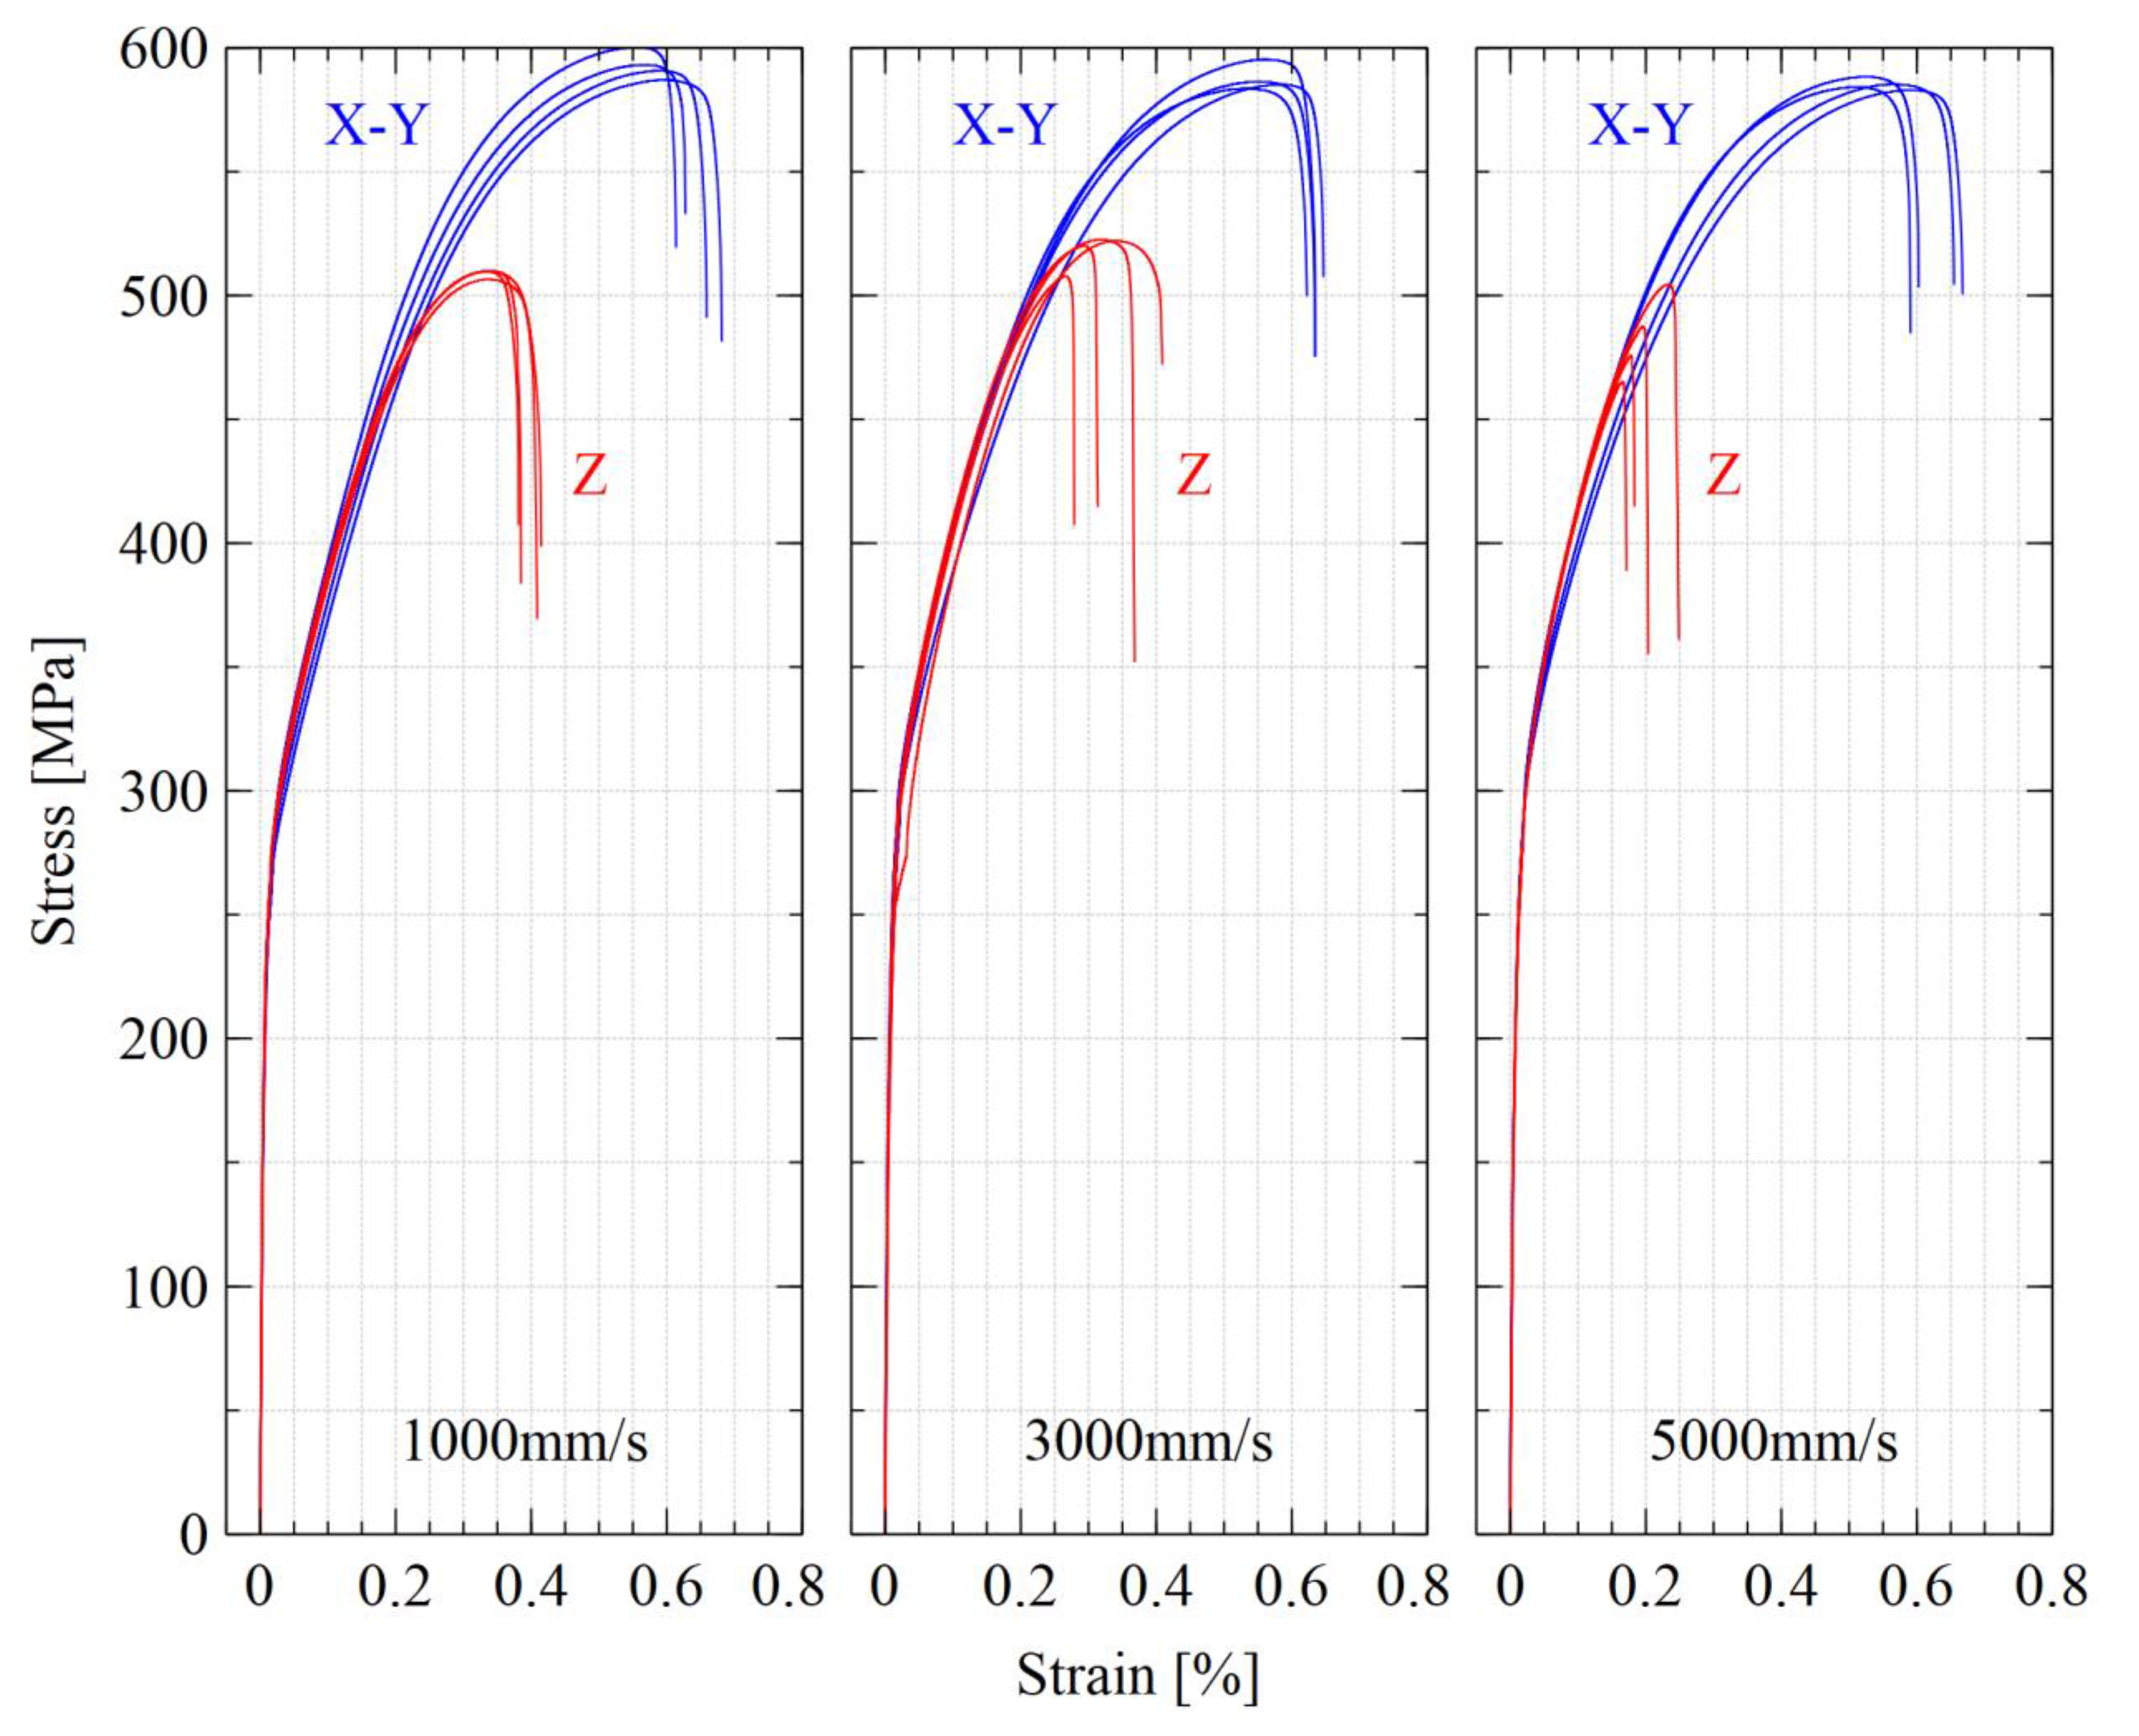
All z-axis-oriented samples showed material properties that were inferior in all aspects to their xy-oriented counterparts. Figure 6 shows the difference in breaking behavior for z-oriented bars at 5000 mm/s, which appeared more brittle than all other samples.
All of the xy-oriented tensile bars exceeded the specifications for both cast and wrought 316LN described by the ASTM standards ASTM240 (cast), ASTM A276 (wrought), and ASTM F3184 (316L AM) (Table 1). The z-oriented tensile bars fulfilled the yield strength requirement for all tested process settings but failed to comply with the ultimate tensile strength and elongation requirements.
Anisotropic mechanical properties in additively manufactured components are a common occurrence and are known to originate in the microstructure [17,22,23]. Thermal treatment throughout the entire build cycle due to elevated build temperatures in the EBM-build chamber have a history of producing as-built materials with good strength, high ductility, and low residual stress [24], which explains the high elongation at break recorded for the xy-oriented tensile bars. Microstructural heterogeneity, such as elongated grains, tends to yield inferior strength and ductility in the building direction, an effect which was also present in this study and explains the difference between xy-oriented tensile bars and z-oriented tensile bars. Lack of fusion between layers due to melting errors can also play a significant role if such a defect is present in the tensile bar. The fact that all tensile bars within each parameter set displayed a similar tensile behavior makes the presence of lack of fusion defects improbable.
Hardness tests showed that the Rockwell B hardness (HRB) value did not differ significantly between the samples, with HRB values of 78.3 ± 3.6, 77.5 ± 2.3, and 78.6 ± 2.0 for samples with process settings of 1000 mm/s, 3000 mm/s, and 5000 mm/s, respectively—all well below the maximum of 95 specified by ASTM A240.
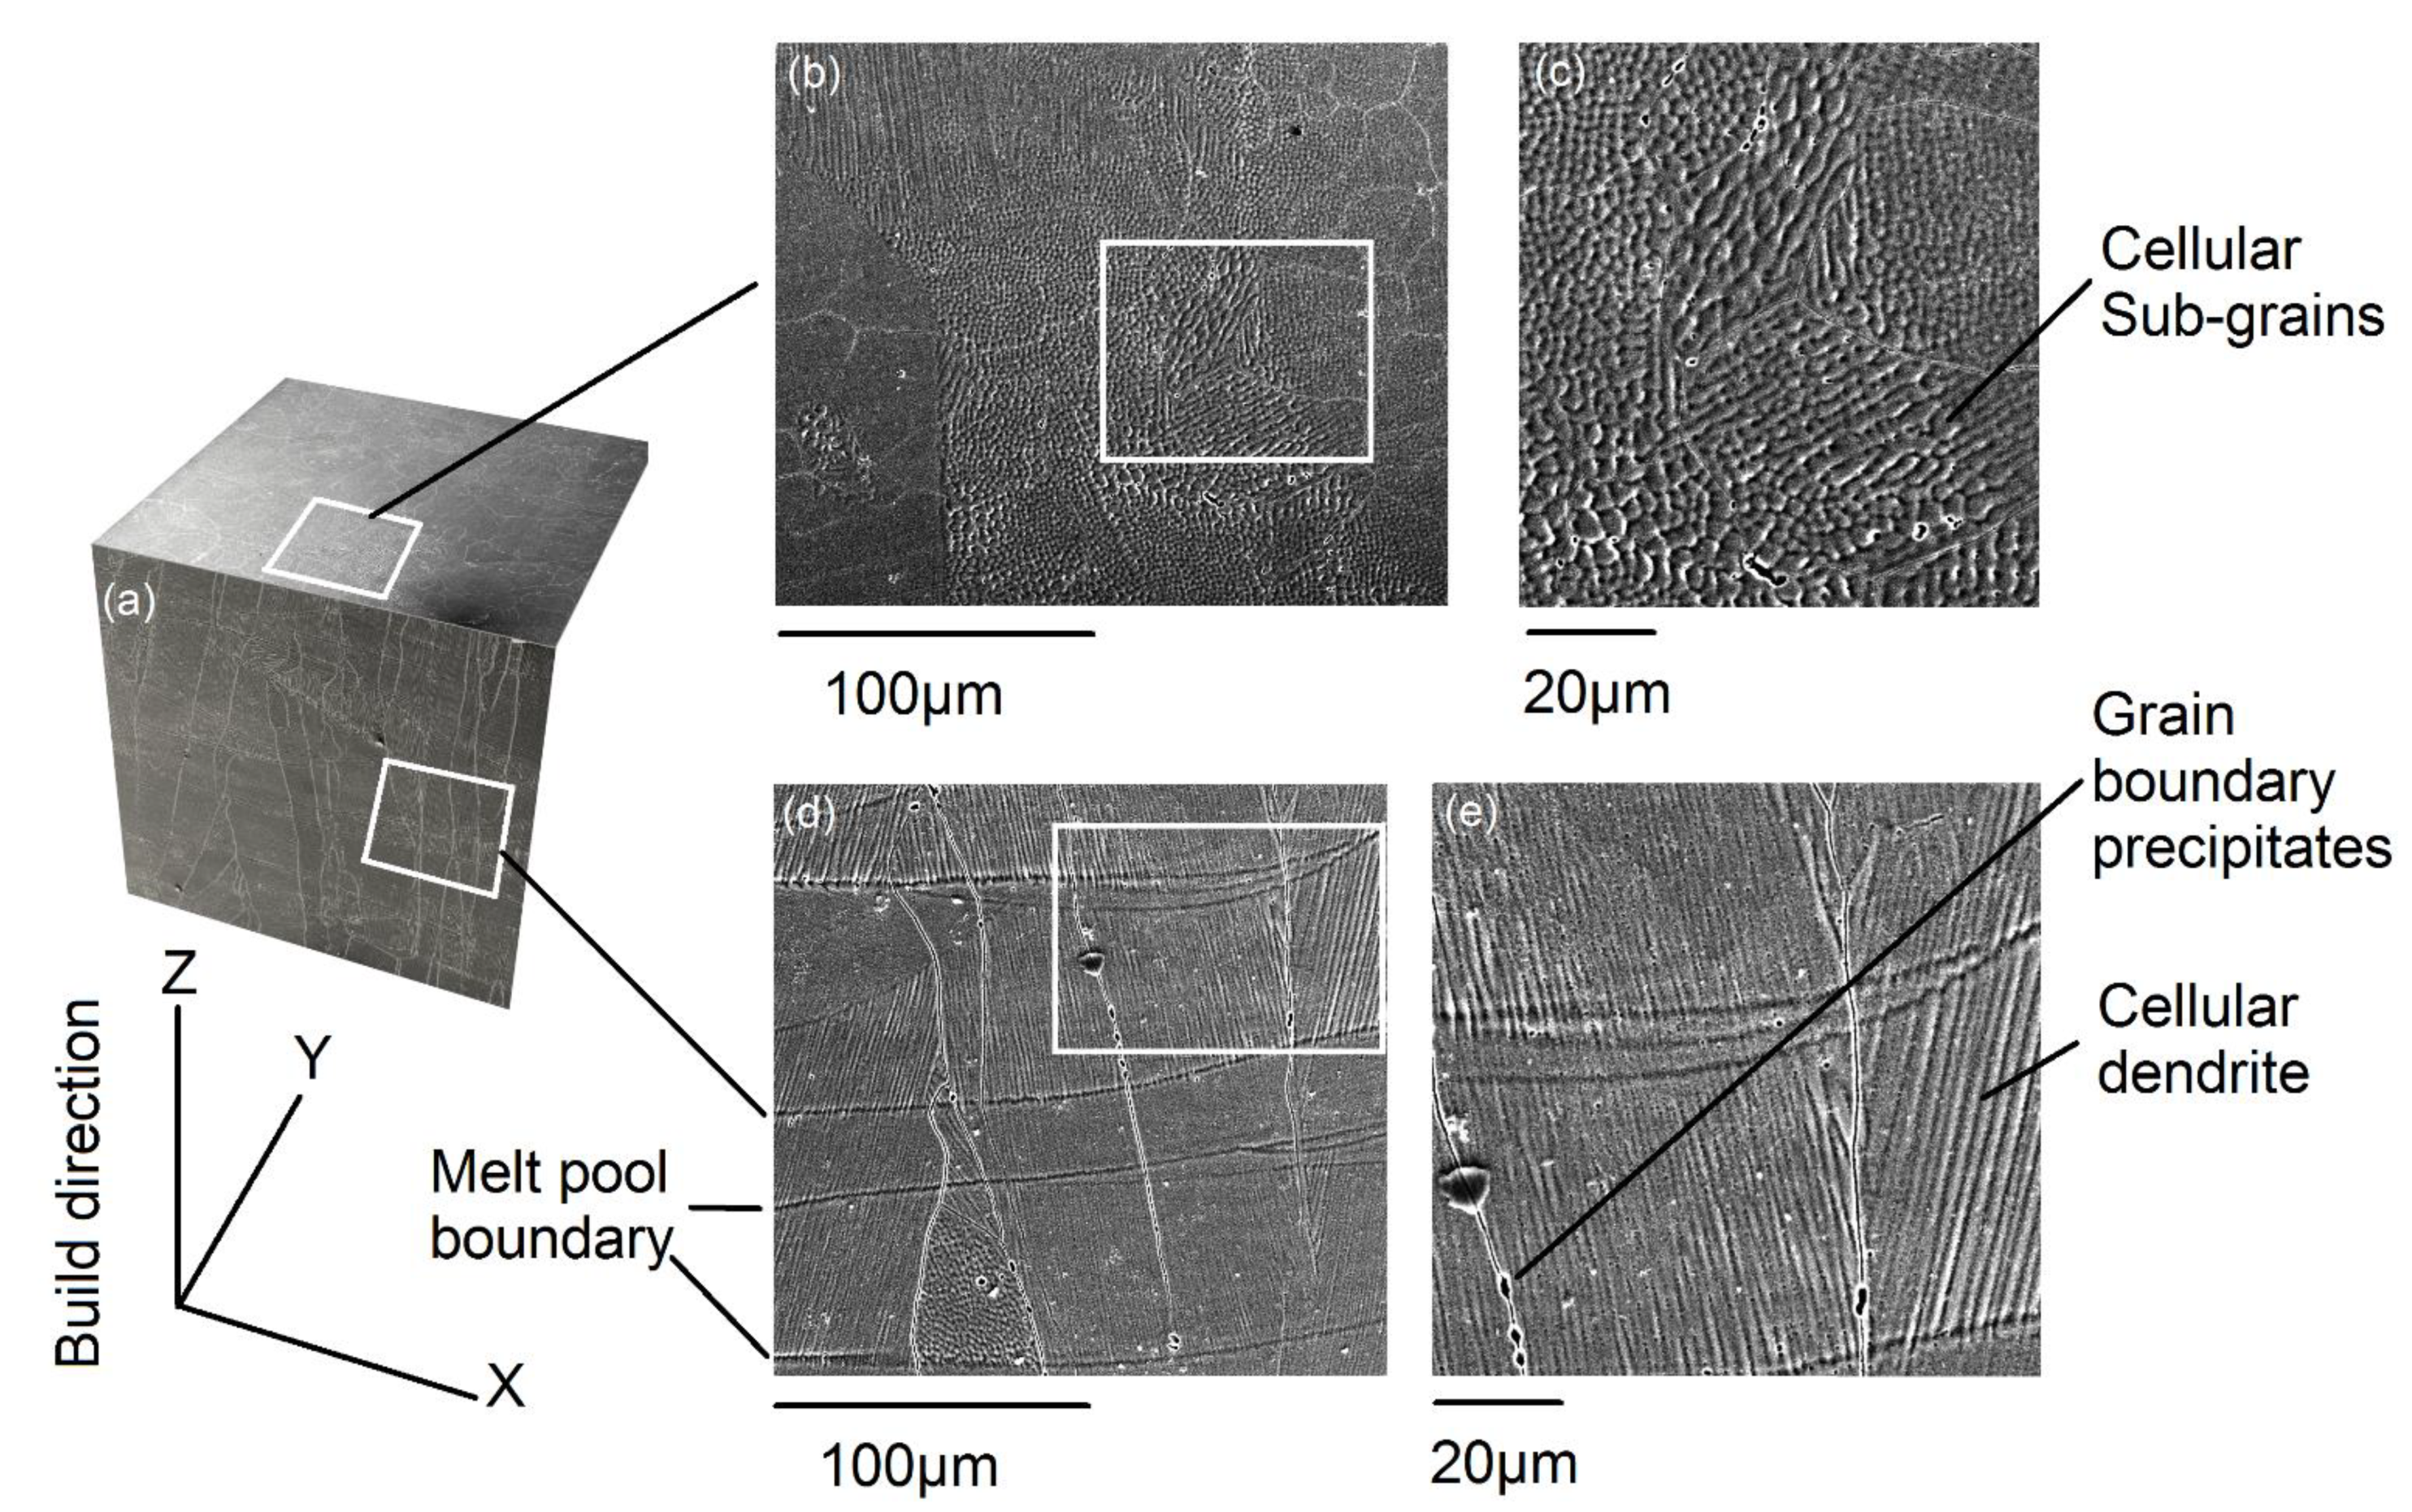
Microstructural analysis revealed that the grains and sub-grains were non-equiaxed. The grains showed elongation along the build direction for all examined specimens, while elongated sub-grains were oriented in multiple directions (Figure 7).
Grain size measurements in the xy-plane showed grain areas of 1847 ± 2509, 1485 ± 1977, and 1101 ± 1483 µm2 for samples a, b, and c, respectively. When a t-test was used to evaluate the null hypothesis of equal arithmetic means, the probability of accepting the null hypothesis was p = 0.50 for a and b, p = 0.19 for b and c, and p = 0.14 for a and c. Despite a trend where a faster beam deflection rate and lower AE led to finer grains, the statistical analysis did not support any conclusive statements.
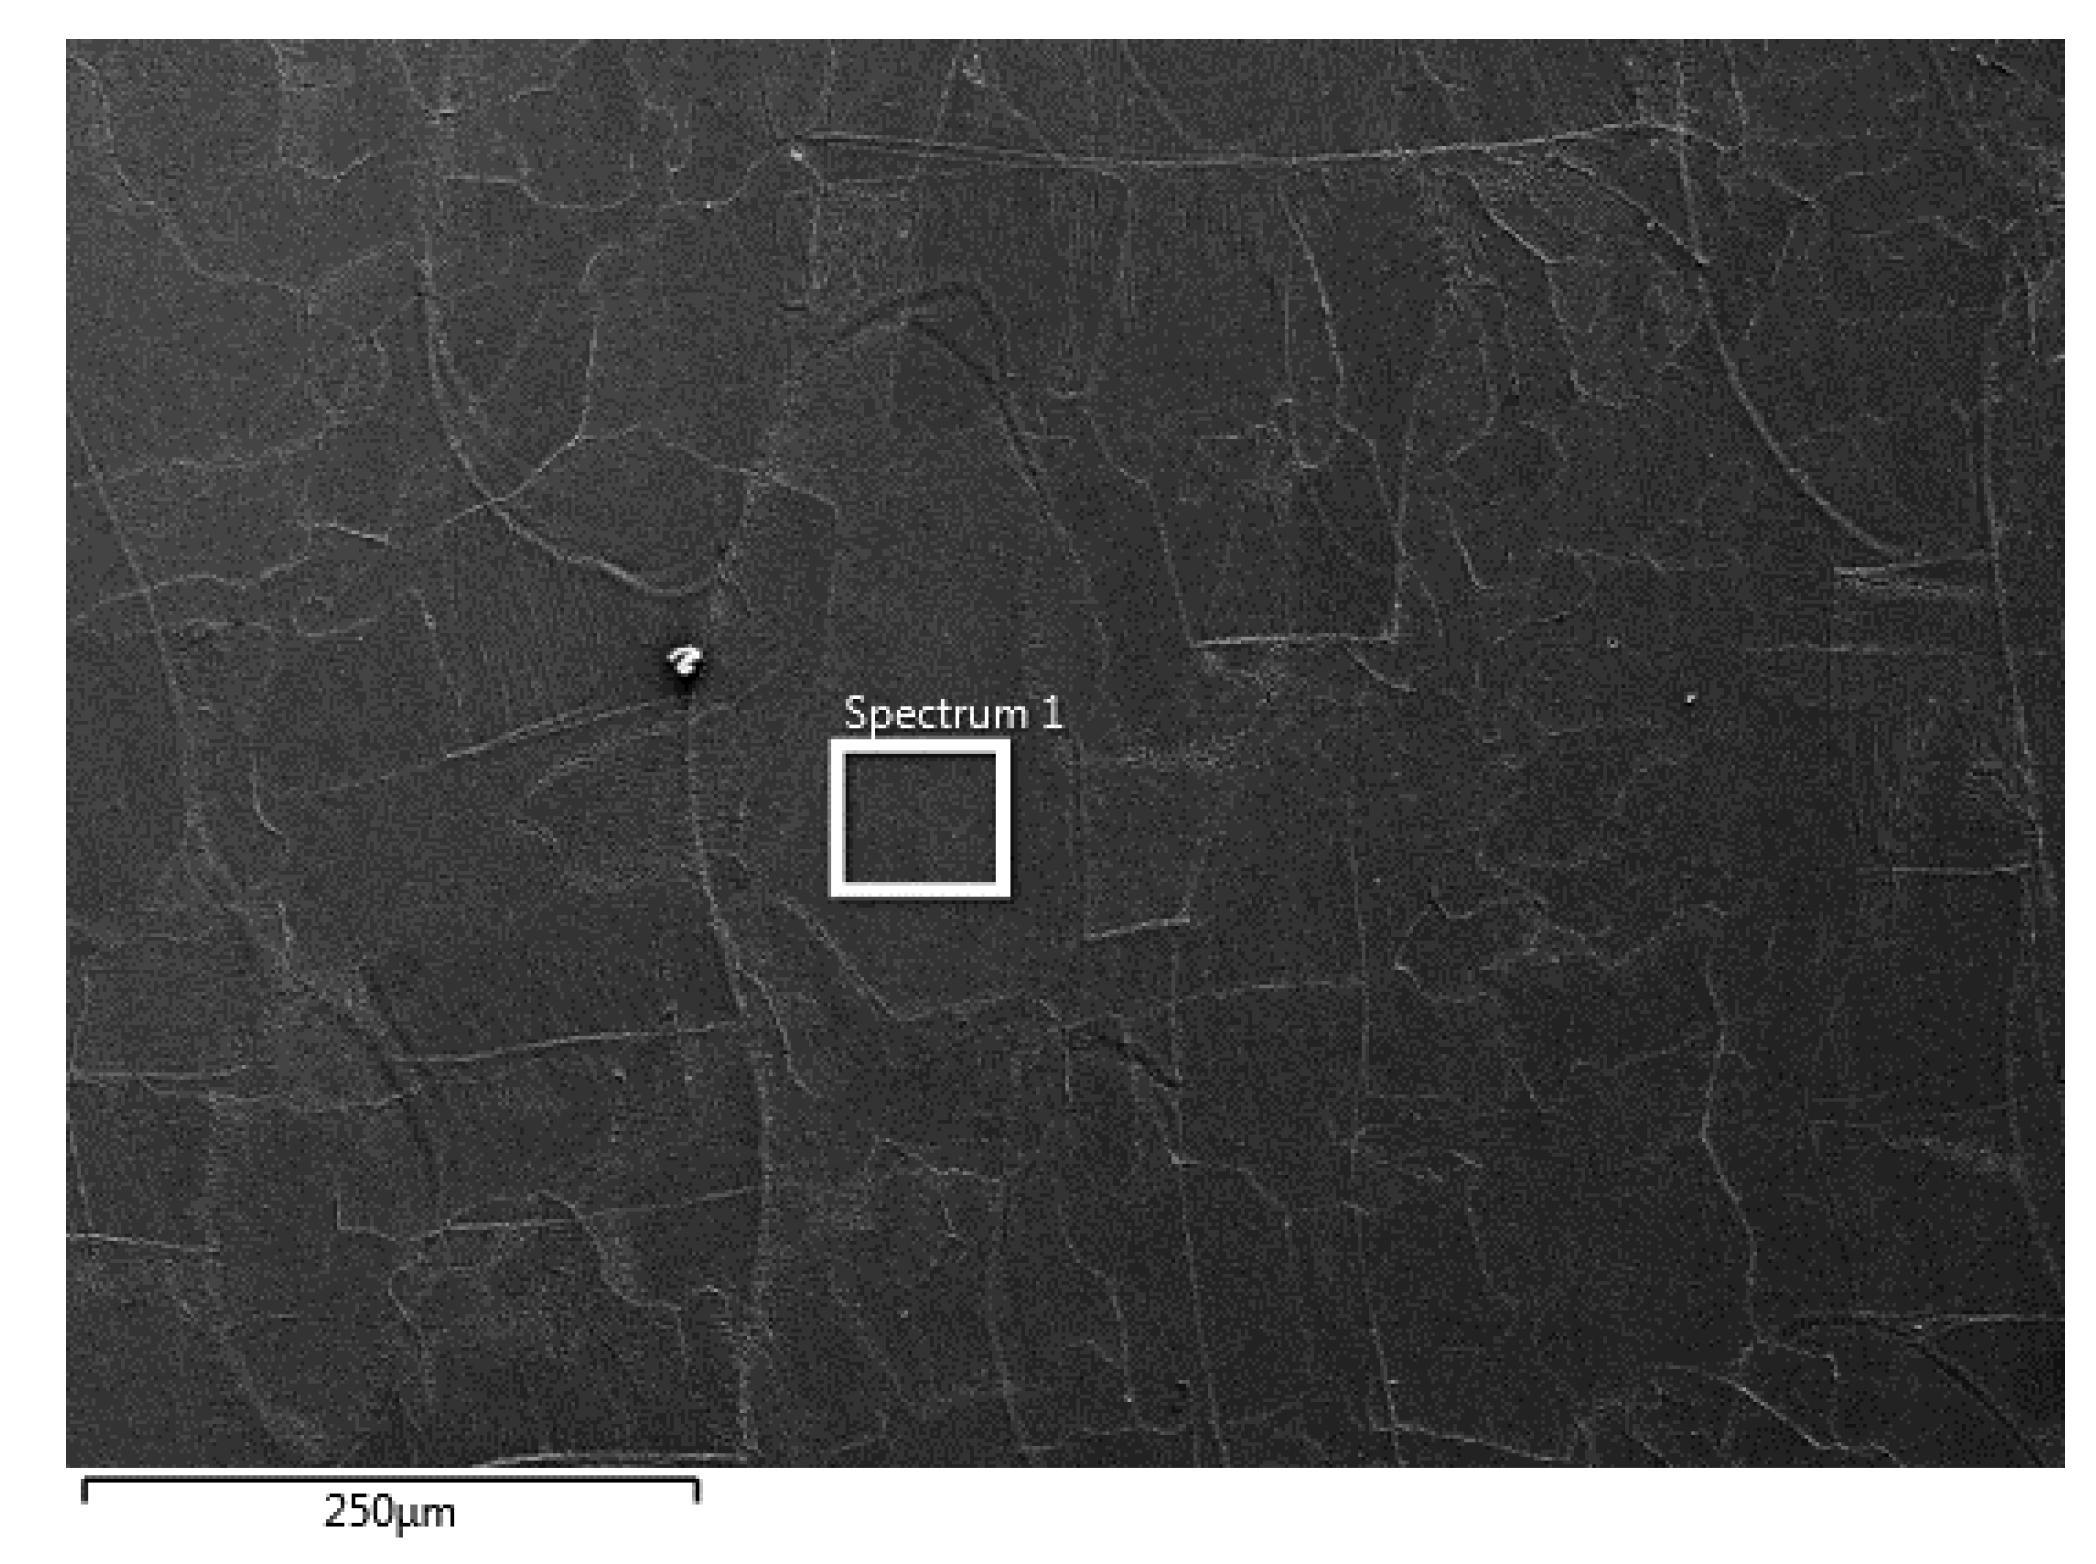
EDS analysis showed that there were no statistically significant differences in elemental composition between the samples resulting from different sets of process parameters. Typical area scan location, contained within a single grain, can be seen in Figure 8.
The scan was performed in the xy cross sections (building direction towards reader) at approximately 50% build height.
Levels of chromium and molybdenum were consistently slightly higher than manufacturer specification in all samples. One possible explanation for this is that the EDS scanning was performed within the boundaries of individual grains, and so any migration of elements towards the grain surfaces would not be included in the results. The precipitate scan should be seen as comparative rather than absolute. The interaction volume of the EDS scanning was of the same size magnitude as the precipitates themselves, causing the surrounding material to influence readings. Grain boundary precipitate scans did show a minor elevation in chromium levels, while nickel, molybdenum, and silicon all showed slightly lower levels than bulk material scans (Table 2). No manganese was detected in the precipitates.
The statistical analysis (Table 3) revealed several cases where the null hypothesis was rejected, with a significant difference between mean values for samples a, b, and c.
Statistical analysis of the test data showed that changing the beam deflection rate and AE significantly changed the melt track width and yield strength in the z-direction for all tested process settings. Comparing properties for samples a and c meant a greater change in beam deflection rate and beam power than comparing a and b, or b and c. The comparison between a and c also revealed statistically significant differences in yield strength in the xy-direction and elongation in the z-direction, but the impact was not of sufficient magnitude to show statistical relevance for each change in process settings. The analysis did not show any statistically significant differences between samples in terms of grain size, ultimate tensile strength in the xy-direction, elongation in the xy-direction, or hardness.
Future research should include the optimization of process parameters to process the precursor powder into solid material that is compliant with the current ASTM material specifications and corresponds to or exceeds the material properties of laser-based powder bed fusion-processed material. In order to keep the layer time to a minimum, the process window width for the higher beam deflection rates should, if possible, be increased by altering the parameters that were kept fixed in this study. Developing an understanding of how the dynamic melting characteristics of high deflection rates affect the thermal history of the processed material is the key to success in producing high-quality parts in the shortest possible timeframe.
4. Conclusions
Increasing the beam deflection rate and lowering the area energy counterintuitively led to a wider melt track. It also led to lower ductility and ultimate tensile strength in the z-direction.
Changing the beam deflection rate and area energy produced no significant differences in material grain size, ultimate tensile strength in the xy-direction, elongation in the xy-direction, or hardness.
Changes in the beam deflection rate and area energy had a greater influence on the z-direction properties than the xy-direction properties, with the sole exception of yield strength.
Even though the elemental composition was retained, the EBM-processed 316LN in this study failed to comply with existing ASTM standards for 316 L and 316 LN material. The main issue was the z-direction properties.
Author Contributions
S.R. has performed the research design and experiments, also performed the writing of this paper. L.-E.R. has proofread this paper and facilitated the use of equipment and resources. All authors have read and agreed to the published version of the manuscript.
Funding
Research is conducted with financial support from the European Regional Development Fund through the Interreg Sweden–Norway program.
Institutional Review Board Statement
Not Applicable.
Informed Consent Statement
Not Applicable.
Data Availability Statement
The raw/processed data required to reproduce these findings cannot be shared at this time as the data also forms part of an ongoing study.
Conflicts of Interest
The authors declare no conflict of interest.
References
- Frigola, P.; Harrysson, O.A.; West, H.A.; Aman, R.L.; Rigsbee, J.M.; Ramirez, D.A.; Murr, L.E.; Medina, F.; Wicker, R.B.; Rodriguez, E. Fabricating copper components with electron beam melting. Adv. Mater. Process. 2014, 172, 20–24. [Google Scholar]
- Lodes, M.A.; Guschlbauer, R.; Körner, C. Process development for the manufacturing of 99.94% pure copper via selective electron beam melting. Mater. Lett. 2015, 143, 298–301. [Google Scholar] [CrossRef]
- Guschlbauer, R.; Momeni, S.; Osmanlic, F.; Körner, C. Process development of 99.95% pure copper processed via selective electron beam melting and its mechanical and physical properties. Mater. Charact. 2018, 143, 163–170. [Google Scholar] [CrossRef]
- Helmer, H.E.; Körner, C.; Singer, R.F. Additive manufacturing of nickel-based superalloy Inconel 718 by selective electron beam melting: Processing window and microstructure. J. Mater. Res. 2014, 29, 1987–1996. [Google Scholar] [CrossRef]
- Kirchner, A.; Klöden, B.; Luft, J.; Weißgärber, T.; Kieback, B. Process window for electron beam melting of Ti-6Al-4V. Powder Metall. 2015, 58, 246–249. [Google Scholar] [CrossRef]
- Pobel, C.R.; Osmanlic, F.; Lodes, M.A.; Wachter, S.; Körner, C. Processing windows for Ti-6Al-4V fabricated by selective electron beam melting with improved beam focus and different scan line spacings. Rapid Prototyp. J. 2019, 25, 665–671. [Google Scholar] [CrossRef]
- Wang, C.; Tan, X.; Liu, E.; Tor, S.B. Process parameter optimization and mechanical properties for additively manufactured stainless steel 316L parts by selective electron beam melting. Mater. Des. 2018, 147, 157–166. [Google Scholar] [CrossRef]
- Rännar, L.-E.; Koptyug, A.; Olsén, J.; Saeidi, K.; Shen, Z. Hierarchical structures of stainless steel 316L manufactured by electron beam melting. Addit. Manuf. 2017, 17, 106–112. [Google Scholar] [CrossRef]
- Olsén, J.; Shen, Z.; Liu, L.; Koptyug, A.; Rännar, L.-E. Micro- and macro-structural heterogeneities in 316L stainless steel prepared by electron-beam melting. Mater. Charact. 2018, 141, 1–7. [Google Scholar] [CrossRef] [Green Version]
- Zhong, Y.; Rännar, L.-E.; Liu, L.; Koptyug, A.; Wikman, S.; Olsen, J.; Cui, D.; Shen, Z. Additive manufacturing of 316L stainless steel by electron beam melting for nuclear fusion applications. J. Nucl. Mater. 2017, 486, 234–245. [Google Scholar] [CrossRef]
- Zhong, Y.; Rännar, L.-E.; Wikman, S.; Koptyug, A.; Liu, L.; Cui, D.; Shen, Z. Additive manufacturing of ITER first wall panel parts by two approaches: Selective laser melting and electron beam melting. Fusion Eng. Des. 2017, 116, 24–33. [Google Scholar] [CrossRef]
- Zhang, M.; Sun, C.-N.; Zhang, X.; Goh, P.C.; Wei, J.; Hardacre, D.; Li, H. Fatigue and fracture behaviour of laser powder bed fusion stainless steel 316L: Influence of processing parameters. Mater. Sci. Eng. A 2017, 703, 251–261. [Google Scholar] [CrossRef]
- Li, Z.; Voisin, T.; McKeown, J.T.; Ye, J.; Braun, T.; Kamath, C.; King, W.E.; Wang, Y.M. Tensile properties, strain rate sensitivity, and activation volume of additively manufactured 316L stainless steels. Int. J. Plast. 2019, 120, 395–410. [Google Scholar] [CrossRef]
- Choo, H.; Sham, K.-L.; Bohling, J.; Ngo, A.; Xiao, X.; Ren, Y.; Depond, P.J.; Matthews, M.J.; Garlea, E. Effect of laser power on defect, texture, and microstructure of a laser powder bed fusion processed 316L stainless steel. Mater. Des. 2019, 164, 107534. [Google Scholar] [CrossRef]
- Feenstra, D.R.; Cruz, V.; Gao, X.; Molotnikov, A.; Birbilis, N. Effect of build height on the properties of large format stainless steel 316L fabricated via directed energy deposition. Addit. Manuf. 2020, 34, 101205. [Google Scholar] [CrossRef]
- Azinpour, E.; Darabi, R.; de Sa, J.C.; Santos, A.; Hodek, J.; Dzugan, J. Fracture analysis in directed energy deposition (DED) manufactured 316L stainless steel using a phase-field approach. Finite Elem. Anal. Des. 2020, 177, 103417. [Google Scholar] [CrossRef]
- Saboori, A.; Aversa, A.; Marchese, G.; Biamino, S.; Lombardi, M.; Fino, P. Microstructure and mechanical properties of AISI 316L produced by directed energy deposition-based additive manufacturing: A review. Appl. Sci. 2020, 10, 3310. [Google Scholar] [CrossRef]
- Safdar, A.; He, H.Z.; Wei, L.Y.; Snis, A.; de Paz, L.E.C. Effect of process parameters settings and thickness on surface roughness of EBM produced Ti-6Al-4V. Rapid Prototyp. J. 2012, 18, 401–408. [Google Scholar] [CrossRef]
- Klingvall, E.R.; Rännar, L.E.; Bäckstöm, M.; Carlsson, P. The effect of EBM process parameters upon surface roughness. Rapid Prototyp. J. 2016, 22, 495–503. [Google Scholar] [CrossRef]
- Pushilina, N.; Syrtanov, M.; Kashkarov, E.; Murashkina, T.; Kudiiarov, V.; Laptev, R.; Lider, A.; Koptyug, A. Influence of manufacturing parameters on microstructure and hydrogen sorption behavior of electron beam melted titanium Ti-6Al-4V alloy. Materials 2018, 11, 763. [Google Scholar] [CrossRef] [Green Version]
- Hrabe, N.; Quinn, T. Effects of processing on microstructure and mechanical properties of a titanium alloy (Ti–6Al–4V) fabricated using electron beam melting (EBM), Part 2: Energy input, orientation, and location. Mater. Sci. Eng. A 2013, 573, 271–277. [Google Scholar] [CrossRef]
- Kok, Y.; Tan, X.P.; Wang, P.; Nai, M.L.S.; Loh, N.H.; Liu, E.; Tor, S.B. Anisotropy and heterogeneity of microstructure and mechanical properties in metal additive manufacturing: A critical review. Mater. Des. 2018, 139, 565–586. [Google Scholar] [CrossRef]
- Carroll, B.E.; Palmer, T.A.; Beese, A.M. Anisotropic tensile behavior of Ti–6Al–4V components fabricated with directed energy deposition additive manufacturing. Acta Mater. 2015, 87, 309–320. [Google Scholar] [CrossRef]
- Zhao, X.; Li, S.; Zhang, M.; Liu, Y.; Sercombe, T.B.; Wang, S.; Hao, Y.; Yang, R.; Murr, L.E. Comparison of the microstructures and mechanical properties of Ti–6Al–4V fabricated by selective laser melting and electron beam melting. Mater. Des. 2016, 95, 21–31. [Google Scholar] [CrossRef]
Figure 1.
Layouts of builds for sample manufacturing: (a) cubes for evaluation of different process parameters; (b) layout for tensile bar build.
Figure 1.
Layouts of builds for sample manufacturing: (a) cubes for evaluation of different process parameters; (b) layout for tensile bar build.

Figure 2.
Scanning electron microscope image of 316LN precursor powder, showing mainly spherical powder grains with some satellites attached.
Figure 2.
Scanning electron microscope image of 316LN precursor powder, showing mainly spherical powder grains with some satellites attached.

Figure 3.
Process window for electron beam melting (EBM)-processed 316LN stainless steel at 70 um layer thickness and 0.1 mm line spacing; (a–c) the top surfaces of the specimens and their respective positions in the process window. For ease of comparison to other process development studies, volumetric energy (accounting for layer thickness), and volumetric processing rate have been added as secondary axes.

Figure 4.
Relative density measurement results (arithmetic mean ± SD) for different beam deflection rates and area energies.
Figure 4.
Relative density measurement results (arithmetic mean ± SD) for different beam deflection rates and area energies.

Figure 5.
Melt tracks from samples with different process settings: (a) sample a (1000 mm/s), (b) sample b (3000 mm/s), (c) sample c (5000 mm/s).
Figure 5.
Melt tracks from samples with different process settings: (a) sample a (1000 mm/s), (b) sample b (3000 mm/s), (c) sample c (5000 mm/s).

Figure 6.
Results from tensile testing of EBM-processed 316LN stainless steel.

Figure 7.
Microstructure of EBM-built 316LN stainless steel samples: (a) overview of magnified areas of interest, (b) low and (c) high magnification scanning electron microscope image of cross section perpendicular to build direction, highlighting cellular sub-grains, (d) low and (e) high magnification of cross section parallel to build direction showing boundaries of elongated grains, grain boundary precipitates, and cellular dendrites.

Figure 8.
Representative SEM image of cross section oriented in the xy-plane used for EDS analysis. EDS spectrum collected from area marked “Spectrum 1” contained within a single microstructural grain.
Figure 8.
Representative SEM image of cross section oriented in the xy-plane used for EDS analysis. EDS spectrum collected from area marked “Spectrum 1” contained within a single microstructural grain.


Table 1.
Tensile test results of 316LN stainless steel processed via EBM (arithmetic mean ± standard deviation (n-1)).
Table 1.
Tensile test results of 316LN stainless steel processed via EBM (arithmetic mean ± standard deviation (n-1)).
| EBM-Built Samples | YS (MPa) | UTS (MPa) | Elongation at Break (%) * |
|---|---|---|---|
| xy 1000 mm/s | 271.3 ± 7.8 | 592.7 ± 5.5 | 63.2 ± 2.2/72.4 ± 4.3 |
| xy 3000 mm/s | 284.2 ± 4.6 | 587.4 ± 5.2 | 63.5 ± 1.7/75.0 ± 0.0 |
| xy 5000 mm/s | 290.1 ± 5.9 | 585.2 ± 2.4 | 62.2 ± 3.9/78.1 ± 2.1 |
| z 1000 mm/s | 262.4 ± 2.5 | 508.9 ± 1.7 | 40.2 ± 2.6/39.6 ± 8.8 |
| z 3000 mm/s | 273.0 ± 3.3 | 518.1 ± 7.0 | 34.5 ± 5.5/35.9 ± 9.2 |
| z 5000 mm/s | 279.4 ± 1.6 | 483.2 ± 16.7 | 20.0 ± 4.0/16.7 ± 3.8 |
| ASTM A743M (cast) | 205 | 515 | 40 *** |
| ASTM A276 (wrought) | 255 | 515 ** | 35 *** |
| ASTM F3184 (316L AM) | 205 | 515 | 30 |
* Values show post-test measurements for gauge lengths 50/24 mm respectively; ** Annealed, thickness > 12.7 mm (1/2″); *** Gauge length = 50 mm.
Table 2.
EBM-manufactured 316LN stainless steel sample elemental weight percentage and (SD) acquired via EDS. Sample designation a, b, and c referenced from process window presented in Figure 3.
Table 2.
EBM-manufactured 316LN stainless steel sample elemental weight percentage and (SD) acquired via EDS. Sample designation a, b, and c referenced from process window presented in Figure 3.
| Element | Cr | Ni | Mo | Si | Mn | Fe |
|---|---|---|---|---|---|---|
| Sample a | 18.18 (0.05) | 12.24 (0.08) | 2.82 (0.05) | 0.62 (0.02) | 1.6 (0.04) | 64.44 (0.09) |
| Sample b | 18.17 (0.07) | 12.30 (0.10) | 2.78 (0.07) | 0.64 (0.02) | 1.66 (0.06) | 64.35 (0.11) |
| Sample c | 18.23 (0.05) | 12.35 (0.08) | 2.78 (0.05) | 0.67 (0.02) | 1.75 (0.05) | 64.12 (0.09) |
| Grain boundary inclusions | 19.25 (0.07) | 11.96 (0.10) | 1.97 (0.06) | 0.45 (0.02) | - | 66.28 (0.11) |
Table 3.
p-values for a true null hypothesis of equal means between groups. Alpha of 0.05 used for determination of statistical significance. Data from tests of samples with process settings a, b, and c (Figure 3). p-values less than 0.05 are highlighted.
Table 3.
p-values for a true null hypothesis of equal means between groups. Alpha of 0.05 used for determination of statistical significance. Data from tests of samples with process settings a, b, and c (Figure 3). p-values less than 0.05 are highlighted.
| Compared Data | a and b | b and c | a and c |
|---|---|---|---|
| Grain size | 0.5 | 0.194 | 0.135 |
| Melt track width | 0.003 | 0.002 | 3.09 × 10⁻⁷ |
| Ultimate tensile strength xy | 0.215 | 0.477 | 0.068 |
| Ultimate tensile strength z | 0.085 | 0.018 | 0.054 |
| Yield strength xy | 0.036 | 0.169 | 0.008 |
| Yield strength z | 0.002 | 0.025 | 8.73 × 10⁻⁵ |
| Elongation xy | 0.865 | 0.586 | 0.672 |
| Elongation z | 0.133 | 0.008 | 0.0004 |
| Hardness | 0.582 | 0.439 | 0.822 |
Publisher’s Note: MDPI stays neutral with regard to jurisdictional claims in published maps and institutional affiliations. |
© 2021 by the authors. Licensee MDPI, Basel, Switzerland. This article is an open access article distributed under the terms and conditions of the Creative Commons Attribution (CC BY) license (http://creativecommons.org/licenses/by/4.0/).
Share and Cite
MDPI and ACS Style
Roos, S.; Rännar, L.-E. Process Window for Electron Beam Melting of 316LN Stainless Steel. Metals 2021, 11, 137. https://doi.org/10.3390/met11010137
AMA Style
Roos S, Rännar L-E. Process Window for Electron Beam Melting of 316LN Stainless Steel. Metals. 2021; 11(1):137. https://doi.org/10.3390/met11010137
Chicago/Turabian StyleRoos, Stefan, and Lars-Erik Rännar. 2021. "Process Window for Electron Beam Melting of 316LN Stainless Steel" Metals 11, no. 1: 137. https://doi.org/10.3390/met11010137
Note that from the first issue of 2016, this journal uses article numbers instead of page numbers. See further details here.