Prediction of Jacking Force in Vertical Tunneling Projects Based on Neuro-Genetic Models


1
Department of Civil Engineering, Zhejiang University City College, Hangzhou 310015, China
2
College of Civil Engineering and Architecture, Zhejiang University, Hangzhou 310058, China
3
Institut für Geotechnik, Universität für Bodenkultur Wien, Feistmantelstraße 4, A-1180 Vienna, Austria
4
Shanghai Foundation Engineering Group Co., Ltd., Shanghai 200002, China
*
Author to whom correspondence should be addressed.
J. Mar. Sci. Eng. 2021, 9(1), 71; https://doi.org/10.3390/jmse9010071
Submission received: 8 December 2020
/
Revised: 6 January 2021
/
Accepted: 7 January 2021
/
Published: 12 January 2021
(This article belongs to the Section Ocean Engineering)
Abstract
:The vertical tunneling method is an emerging technique to build sewage inlets or outlets in constructed horizontal tunnels. The jacking force used to drive the standpipes upward is an essential factor during the construction process. This study aims to predict the jacking forces during the vertical tunneling construction process through two intelligence systems, namely, artificial neural networks (ANNs) and hybrid genetic algorithm optimized ANNs (GA-ANNs). In this paper, the Beihai hydraulic tunnel constructed by the vertical tunneling method in China is introduced, and the direct shear tests have been conducted. A database composed of 546 datasets with ten inputs and one output was prepared. The effective parameters are classified into three categories, including tunnel geometry factors, the geological factor, and jacking operation factors. These factors are considered as input parameters. The tunnel geometry factors include the jacking distance, the thickness of overlaying soil, and the height of overlaying water; the geological factor refers to the geological conditions; and the jacking operation factors consist of the dead weight of standpipes, effective overburden soil pressure, effective lateral soil pressure, average jacking speed, construction hours, and soil weakening measure. The output parameter, on the other hand, refers to the jacking force. Performance indices, including the coefficient of determination (R2), root mean square error (RMSE), and the absolute value of relative error (RE), are computed to compare the performance of the ANN models and the GA-ANN models. Comparison results show that the GA-ANN models perform better than the ANN model, especially on the RMSE values. Finally, parametric sensitivity analysis between the input parameters and output parameter is conducted, reaching the result that the height of overlaying water, the average jacking speed, and the geological condition are the most effective input parameters on the jacking force in this study.
1. Introduction
The vertical tunneling method (VTM) is an emerging approach to build vertical hydraulic tunnels to the inlets or outlets in sewage systems in China. In the VTM construction process, the standpipes are jacked upward from the horizontal tunnel to the seabed by applying jacking force through four jacks in the constructed horizontal tunnel. It is crucial to predict the jacking force during the VTM construction.
There are only a few studies related to the jacking force of the VTM available to date [1,2,3]. To calculate the jacking force during the vertical tunneling process in advance, Wang et al. regarded standpipes as reverse piles and utilized the Meyerhof foundation theory to compute the maximum jacking force [1,2]. To gain insight into the effective factors that influence the jacking force, Wang et al. have conducted case research about the vertical tunneling project, concluding that the jacking force is affected by factors such as the average jacking speed, the jacking distance, the geological conditions, and the effective overburden soil pressure [3].
The VTM is similar to the pipe jacking method and the microtunneling method. Thus, the influence factors of the jacking force in these methods can give clues to the research related to the VTM. The jacking force in the microtunneling process must be higher than the sum of the boring machine penetration force and the soil–pipe friction force. Specifically, overcut, lubrication, and stoppages have a dominating effect on friction force [4]. Moreover, factors such as length of drive, misalignment and corrections, jacking speed, curved alignment, and intermediate jacking station are also associated with the friction force [5]. According to the direct shear results of the underground trunk sewer lines constructed by the pipe jacking method in the Tuang formation of Kuching City, Malaysia, Choo and Ong presented that the jacking force was proved to be not only related to the surrounding geologies, but also to the lubrication [6]. Based on the previous related research, factors around the tunnel geometry, geological factor, and jacking operation factors can be concluded to be three crucial categories on jacking force.
Artificial intelligence (AI) techniques have been widely applied to solve geotechnical engineering problems [7,8,9]. Among the AI techniques, artificial neural networks (ANNs) can deal with problems with uncertain or limited experience, and no pre-knowledge on the relationships between the examined components is required. ANNs, comprising input, hidden, and output layers, can develop black-box models to classify or predict. The main objective in ANN models is to obtain optimum weights and biases, which can minimize the error [10]. Among the training algorithms in ANNs, the back propagation (BP) algorithm is the most widely used training algorithm. Although it can provide relatively precise prediction results, shortcomings exist, i.e., it may be trapped in local optima [8,11]. Thus, several optimization algorithms, including the genetic algorithm (GA), particle swarm algorithm, and imperialist competitive algorithm, are utilized to overcome this problem. By applying these optimization algorithms, different hybrid models can be developed to search for global minimum and overcome the shortcomings of the original backpropagation algorithm, and then the optimum model can be obtained [12].
This paper intends to propose an approach for predicting jacking force during the vertical tunneling construction process using ANNs and GA-ANNs. To achieve this goal, the hydraulic tunnel constructed by the VTM in Beihai, China is introduced. The jacking force, together with its effective factors such as the average jacking speed and the jacking distance, was collected and comprises one database with 546 datasets. Then, the 546 datasets were divided into five datasets, and several ANN models and GA-ANN models were established. Finally, the obtained models were evaluated, and the most suitable model was selected to predict the jacking force.
2. Case Study and Data Source
2.1. Construction Process
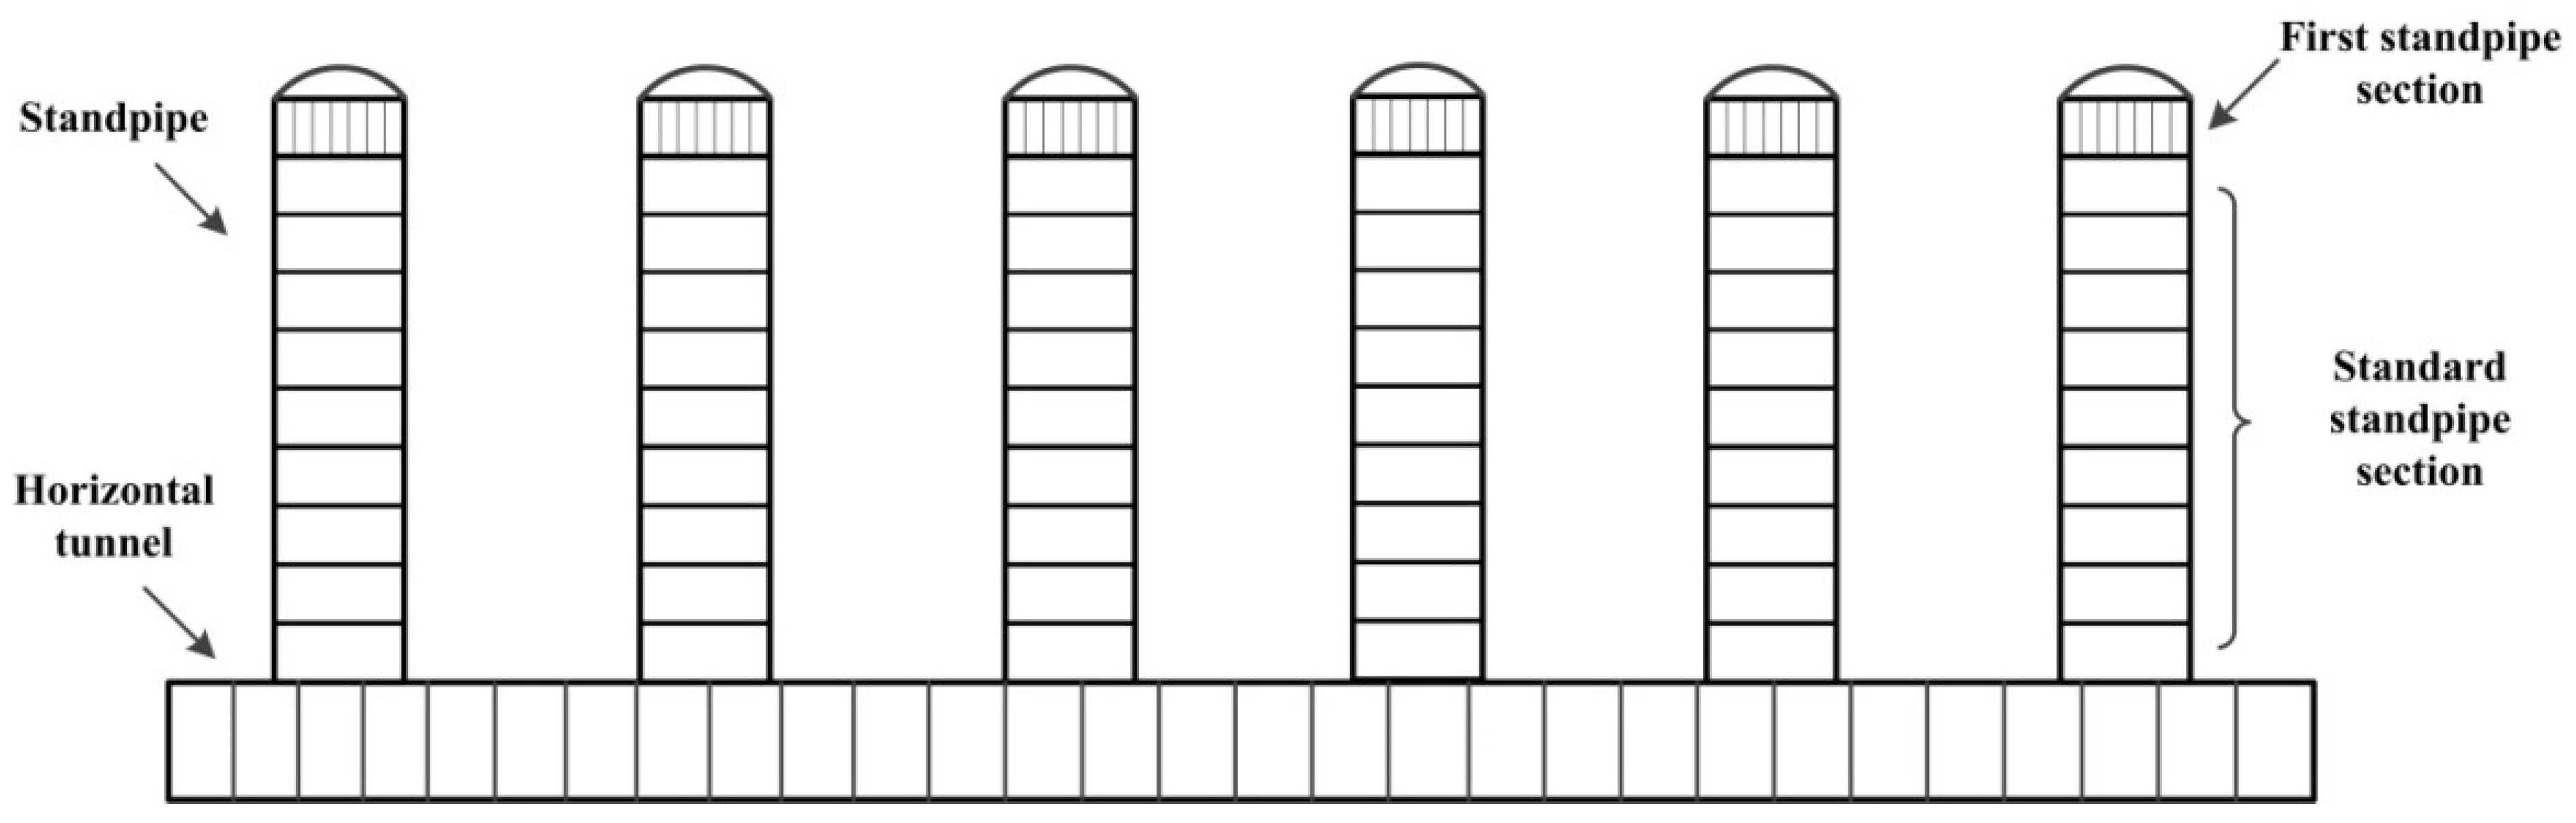
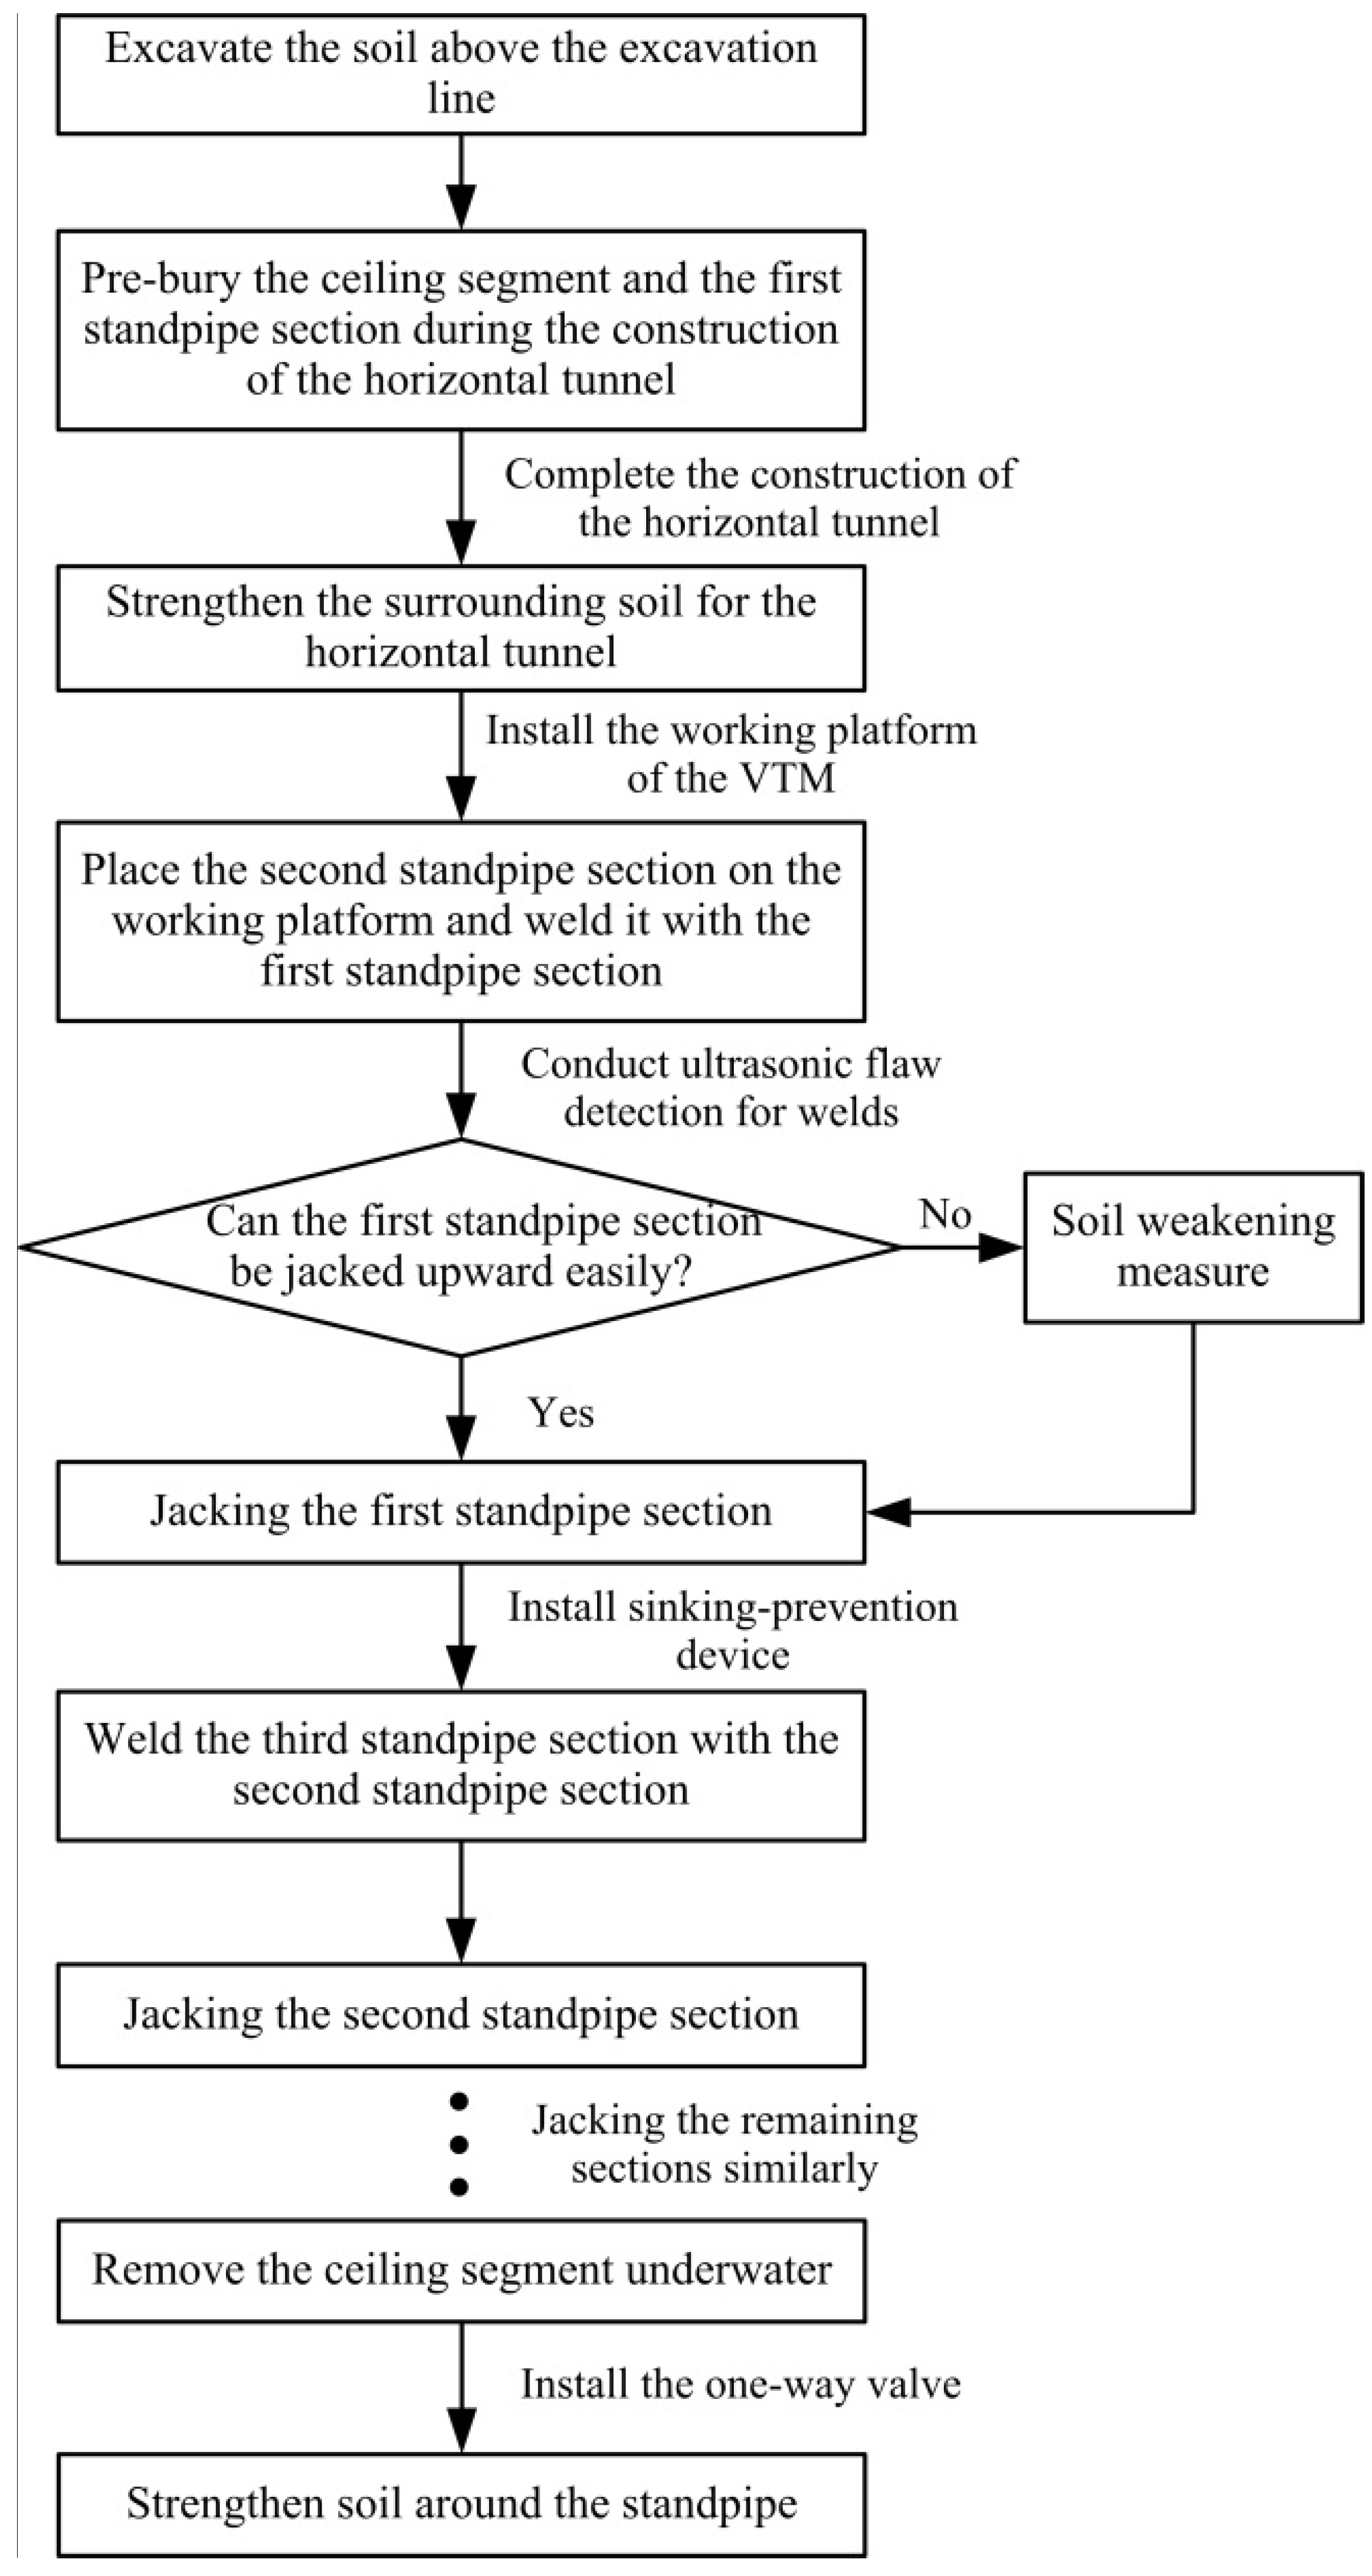
To deal with the sewage from the sewage treatment plant in Beihai, China, the VTM was used to construct vertical standpipes in the sea area, together with the pipe jacking method [1,2,3]. The horizontal tunnel was built by the pipe jacking method firstly, and the diameter was 2000 mm. When the construction of the horizontal tunnel was completed, the standpipes were constructed by the VTM. In this project, multi-point drainage of the standpipes was adopted to avoid seawater pollution (Figure 1). The distances between the vertical standpipes were mostly 13 m. At the end of 400 m in the horizontal pipe jacking project, 29 vertical standpipes with an outer diameter of 500 mm were set up with a height of 12.5 m (Figure 1 and Figure 2).
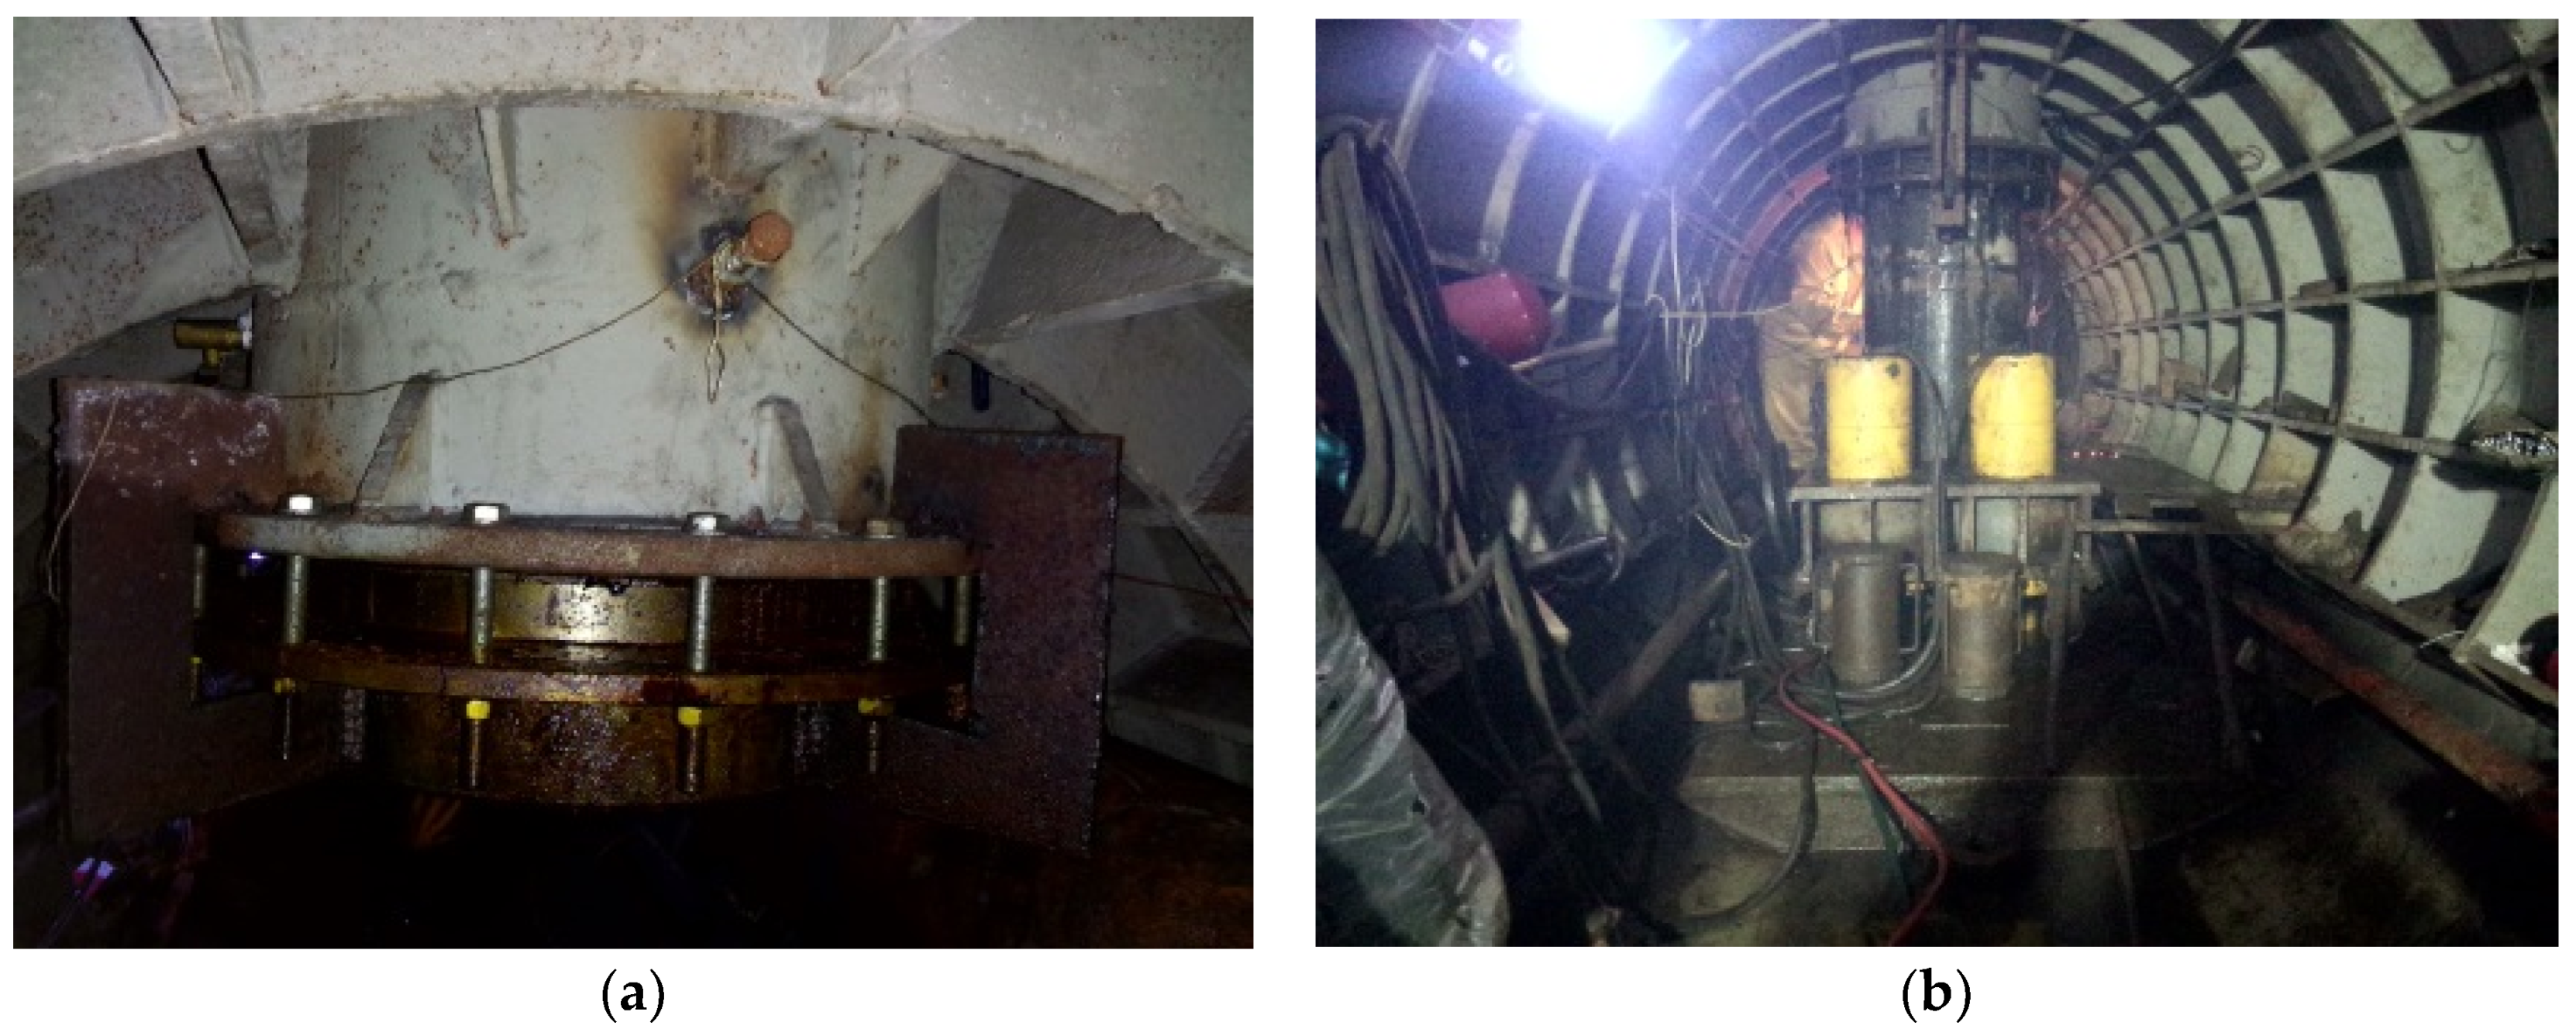
There were 21 standpipe sections for each standpipe in total; the first standpipe section was 50 cm in length, and the remaining sections were 60 cm in length. Figure 3 shows the construction flow chart of the VTM. Wang et al. depicted a detailed description of the VTM, comprising the construction process [3]. Before the VTM construction started, the soil above the excavation line was excavated. Thus, 29 standpipes could be jacked upward to the same altitude, and the upper 1 m of all the standpipes were embedded in water. When the standpipe could be easily jacked upward, i.e., when the jacking force was too large, the soil weakening measure was conducted. An advanced drilling bore at the corresponding standpipe position was constructed, and thixotropic mud was injected to weaken the soil. In order to ensure the safety of the standpipes during construction, the deviation of the standpipes was measured. The deviation tolerances ranged from 3 to 4 mm in different conditions. More details about the construction process of the VTM can be found in [3].
2.2. Factors Affecting Jacking Force
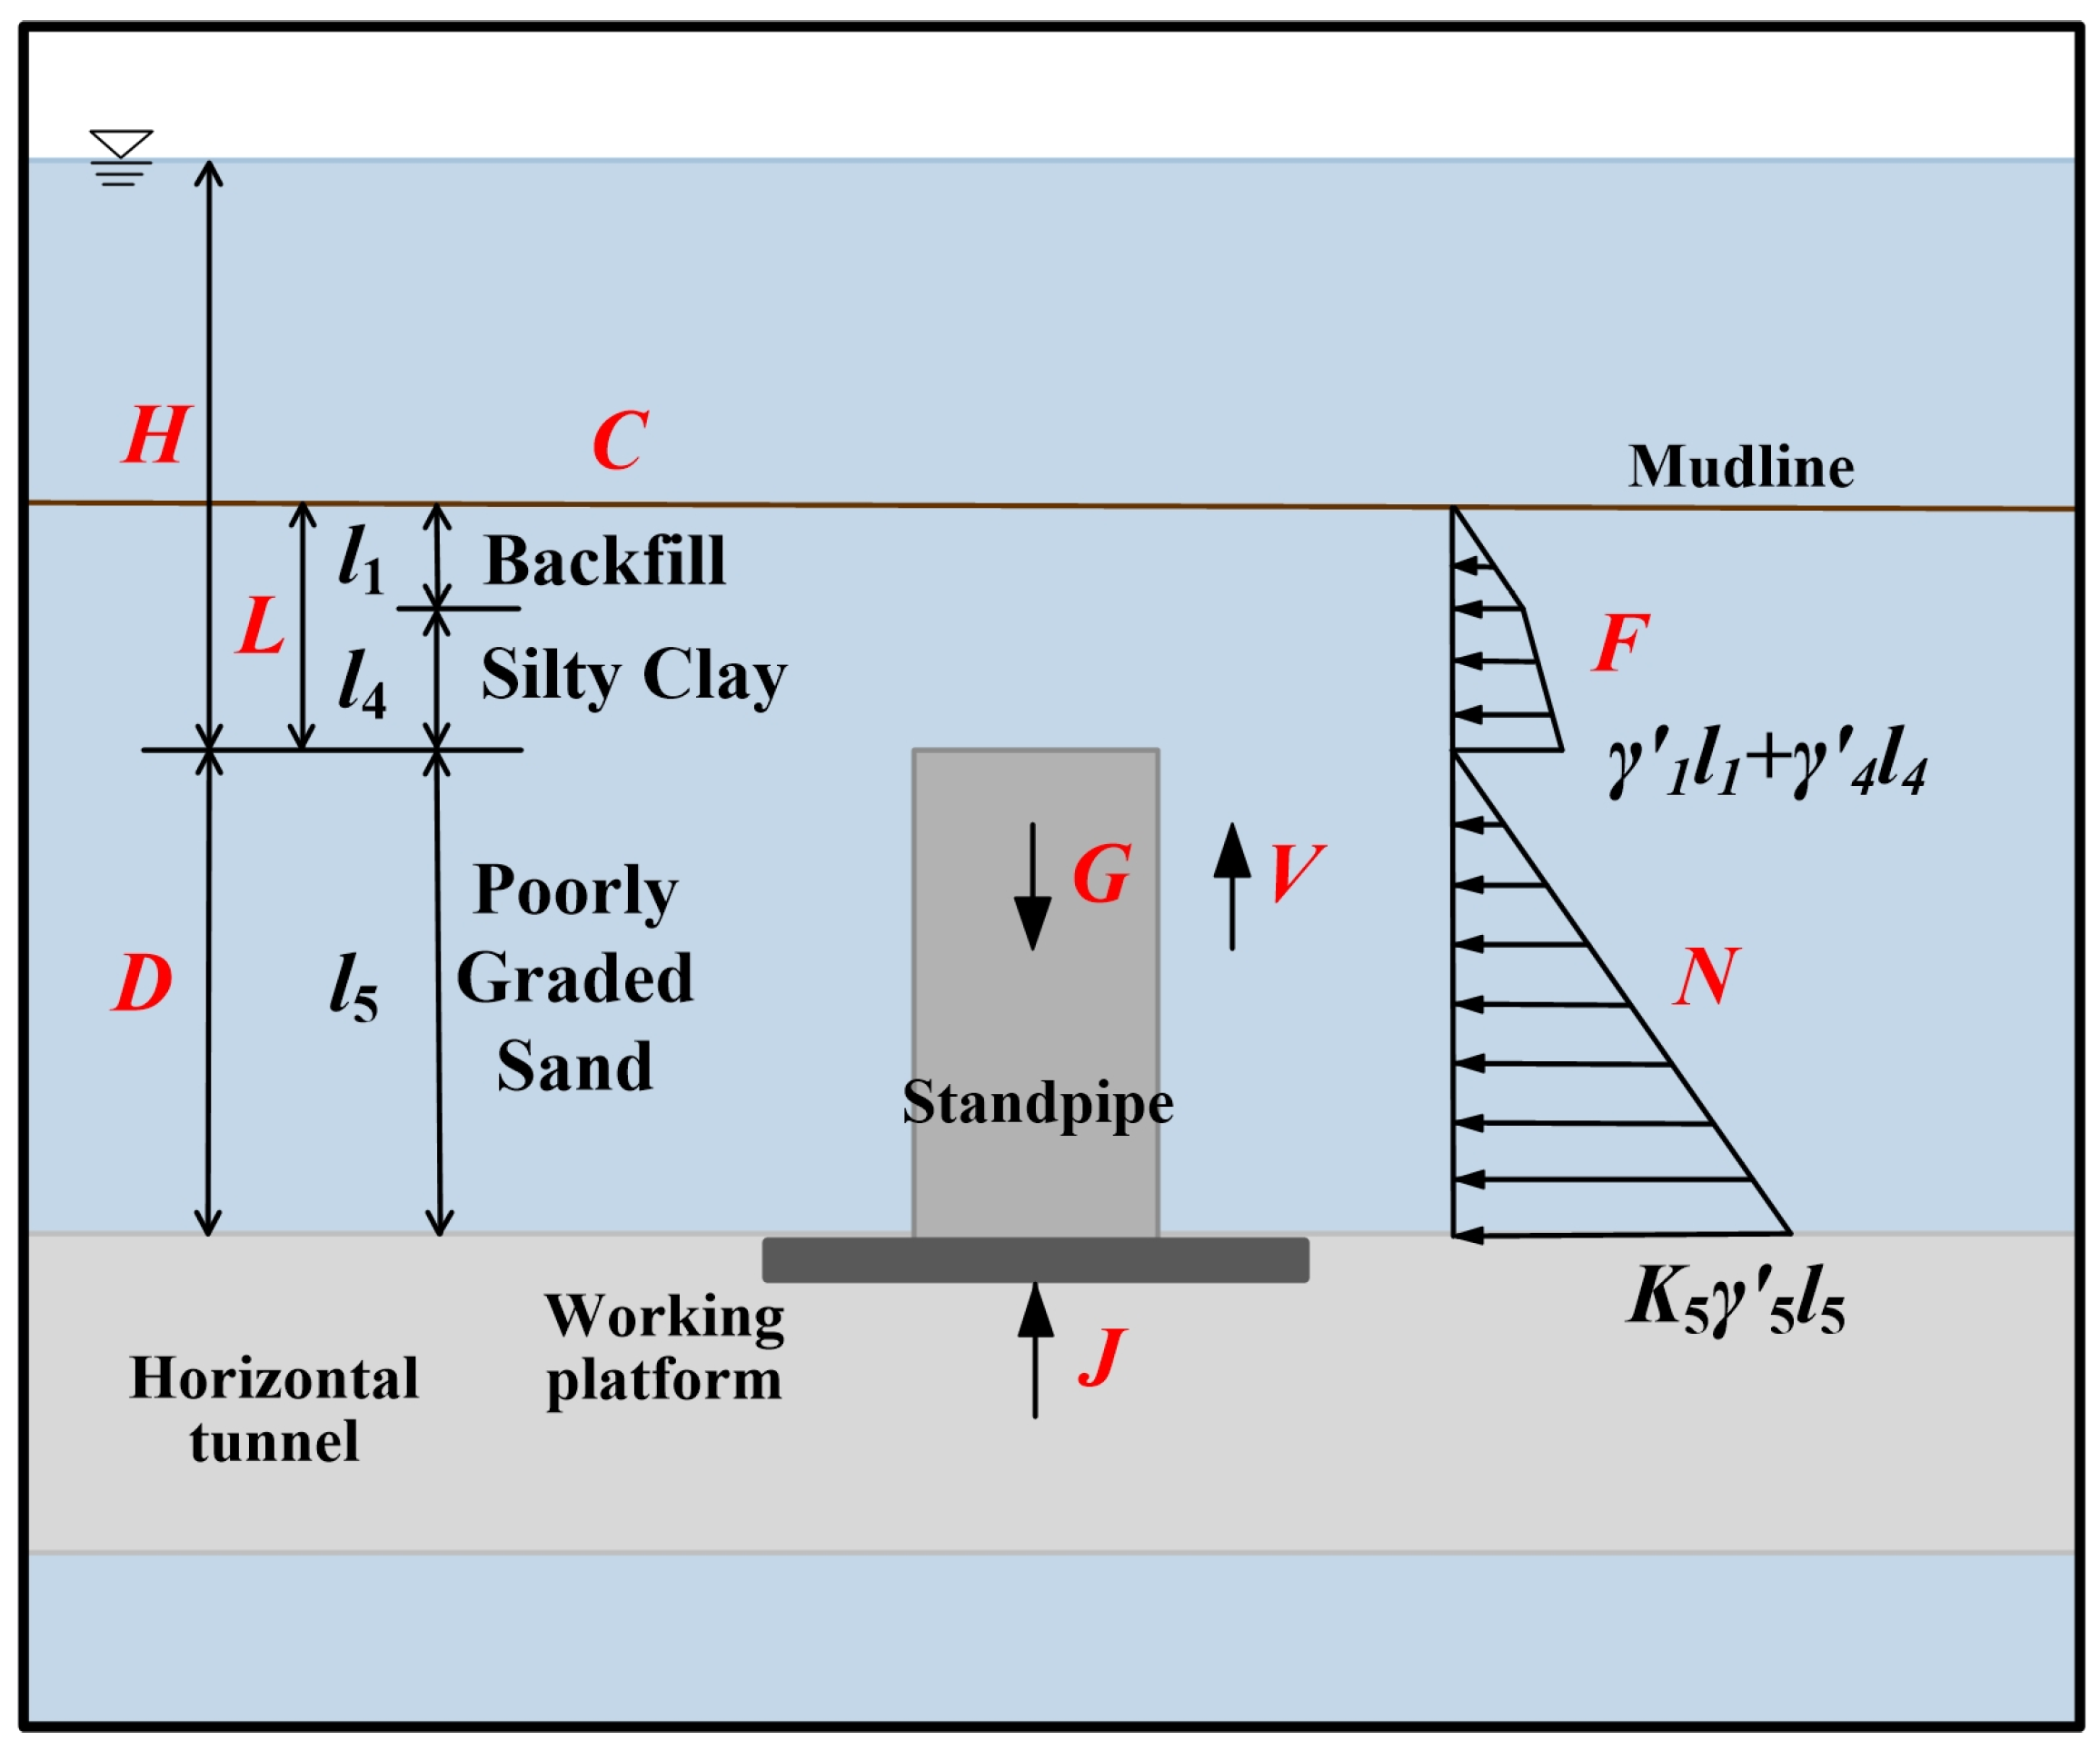
The jacking force of the standpipe (J) can be explained as:
where J is the jacking force, G is the dead weight of the standpipe, W is the external water pressure above the standpipe, R is the frictional resistance along pipe run, and S is the penetration resistance [3].
Based on the previous research about the VTM, the pipe jacking method and the microtunneling method, factors that affect the jacking force in the VTM construction, can be classified into three groups, including tunnel geometry, geological conditions, and jacking operation factors.
2.2.1. Tunnel Geometry Factors
Three tunnel geometry factors, including the jacking distance, the thickness of overlaying soil, and height of overlaying water, are regarded as effective parameters on the jacking force (Figure 4). As shown in Figure 4, the jacking distance (D) means the height of the standpipe that has been jacking upward. The thickness of overlaying soil (L) means the height between the mudline and the top of the standpipe. Moreover, the height of overlaying water (H) means the height between the sea surface and the top of the standpipe. Note that the diameters of the standpipes in this project are the same. Thus, they are not considered here.
2.2.2. The Geological Factor
According to the drilling results at the field, there was a quaternary artificial accumulation layer and marine sedimentary layer overlying the site. The drilling area was mainly composed of clay and sand layers. The soil layers intersected by the standpipes were mainly poorly graded sand, silty sand, and backfill. According to the direct shear test results, the distribution of geological properties of the site is shown in Table 1.
Because of the excavation before constructing the standpipes, after the jacking distance was larger than 11.5 m, there was no soil above the standpipe. As a result, there was only water above it. In general, there are six types of materials in the standpipes, including backfill, silty sand, silty clay, poorly graded sand, low liquid limit clay, and water. To consider the effect of the geological conditions, the five soil types were classified as 1 to 5, respectively (Table 1). Moreover, water was classified as 6 in the geological conditions. The geological condition (C) shown in Figure 4 is illustrated by number 2 standpipe, and it consisted of backfill, silty clay, and poorly graded sand.
2.2.3. Jacking Operation Factors
Jacking operation factors refer to factors that affect the jacking force during the operation of the jacking process. The jacking force in the vertical tunneling project should be larger than the sum of face resistance, friction resistance, the dead weight of standpipes, and the external water above the standpipe at the corresponding jacking distance [3]. According to this, jacking operation factors, including the dead weight of standpipes, effective overburden soil pressure, effective lateral soil pressure, average jacking speed, construction hours, and soil weakening measure, are concluded to be the influencing factors of the jacking force.
The dead weight of standpipes (G) consists of the dead weight of the ceiling segment (G1), the first standpipe section (G2), and the standard standpipe section(s) (G3) (Figure 4). It can be calculated according to the jacking distance [3]:
where G1 = 0.6353 kN, G2 = 1.6747 kN, G3 = 1.6572 kN, which was given by the on-site engineering report; n is the number of the standard standpipe sections which have been jacked upward, which ranged from 0 to 20.
The dominant factor that affects the face resistance of the standpipes is the effective overburden soil pressure (F). F means the effective vertical pressure produced by the gravity of the overlying soil above the standpipe (Figure 4). The expression of F is:
where li is the length of the standpipe buried in the ith soil layer during construction; γ’i is the effective unit weight of the ith soil layer; and m is the number of soil layers that the standpipe is buried in.
The primary control influencing factor of the friction resistance is the effective lateral soil pressure (N). N means the effective pressure that soil exerts in the horizontal direction when underwater. It can be calculated by the following equation:
where Ki is the static earth pressure coefficient of the ith soil layer (K1 = 0.9268, K2 = 0.7711, K3 = 0.6860, K4 = 0.9235, K5 = 0.8481). Note that Ki is calculated by Ki = 1−sinφ, where φ is the internal friction angle of the corresponding soil layer (Table 1).
During construction, the construction hours (T) of each standpipe were measured and collected. T refers to the time it has taken to jack the standpipe. Thus, the average jacking speed of standpipes (V) can be computed by divide the construction hours (T) by the jacking distance (D).
When the jacking force was too large, high-pressure rotary jet pile equipment was used to inject thixotropic mud to advance the standpipe by weakening the soil. In this project, a soil weakening measure (M) was only conducted on standpipe number 9 [3].
In conclusion, ten factors affect the jacking force during the vertical tunneling process. Statistical information, including maximum, minimum, average, and standard deviation of the used parameters in this study to estimate jacking force, is shown in Table 2. The exact values of ten influencing factors, together with the jacking force, can be found in the Supplementary Materials.
Before applying these data to establish the neuron-genetic model, the effects of these factors on the jacking force should be discussed briefly first. The relationships of six factors with the jacking force (J) are shown in Table 2. Six factors include the thickness of overlaying soil (L), the height of overlaying water (H), geological conditions (C), the dead weight of standpipes (G), the effective overburden soil pressure (F), and the effective lateral soil pressure (N). The relationships between other four factors and the jacking force were discussed in the following text.
As shown in Table 2, six influencing factors, including L, F, H, N, G, C, are all normally proportional to the jacking force. The thickness of overlaying soil (L) and the effective overburden soil pressure (F) are normally proportional to the penetration resistance (S). Thus, J will increase if there is a higher L and a higher F according to Equation (1). The height of overlaying water (H) is normally proportional to the external water pressure above the standpipe (W), so J will increase if there is a higher H. Similarly, the effective lateral soil pressure (N) is normally proportional to the frictional resistance (R); hence there will be a higher jacking force when N is higher. The dead weight of standpipes (G) is one part of the jacking force according to Equation (1), so it also has a normal proportional relationship with the jacking force. Moreover, when the standpipe is jacked from a soft soil layer to a hard soil layer, the jacking force will increase, explaining the normally proportional relationship between the geological condition (C) and the jacking force.
However, concerning the otherfour factors, including D, T, V, and M, the changing trend of the jacking force with regard to the jacking distance (D) includes two trends: the jacking force reaches a peak force at 25.7% of the jacking distance and then decreases to the lowest force [3]. When applying the soil weakening measure (M), the hard soil above the standpipe is replaced with soft soil; therefore, the jacking force will decrease when applying it. The exact effects of the construction hours (T) and the average jacking speed (V) cannot be decided yet. Nevertheless, the conclusion has been made that stoppage time will result in the fluctuation of jacking forces [6], and the jacking speed will be faster in the gravel layer than in the sand layer [5].
3. Intelligent Methods for Predicting Jacking Force
Due to limited on-site data, no more data of other factors can be gathered to help build the intelligent models. Thus, the intelligent method was applied when assuming that only the ten influencing factors in Section 2.2 are related to the jacking force. In the future, the bigger the dataset and the more related factors gathered, the more accurate the results can be obtained.
3.1. Artificial Neural Network
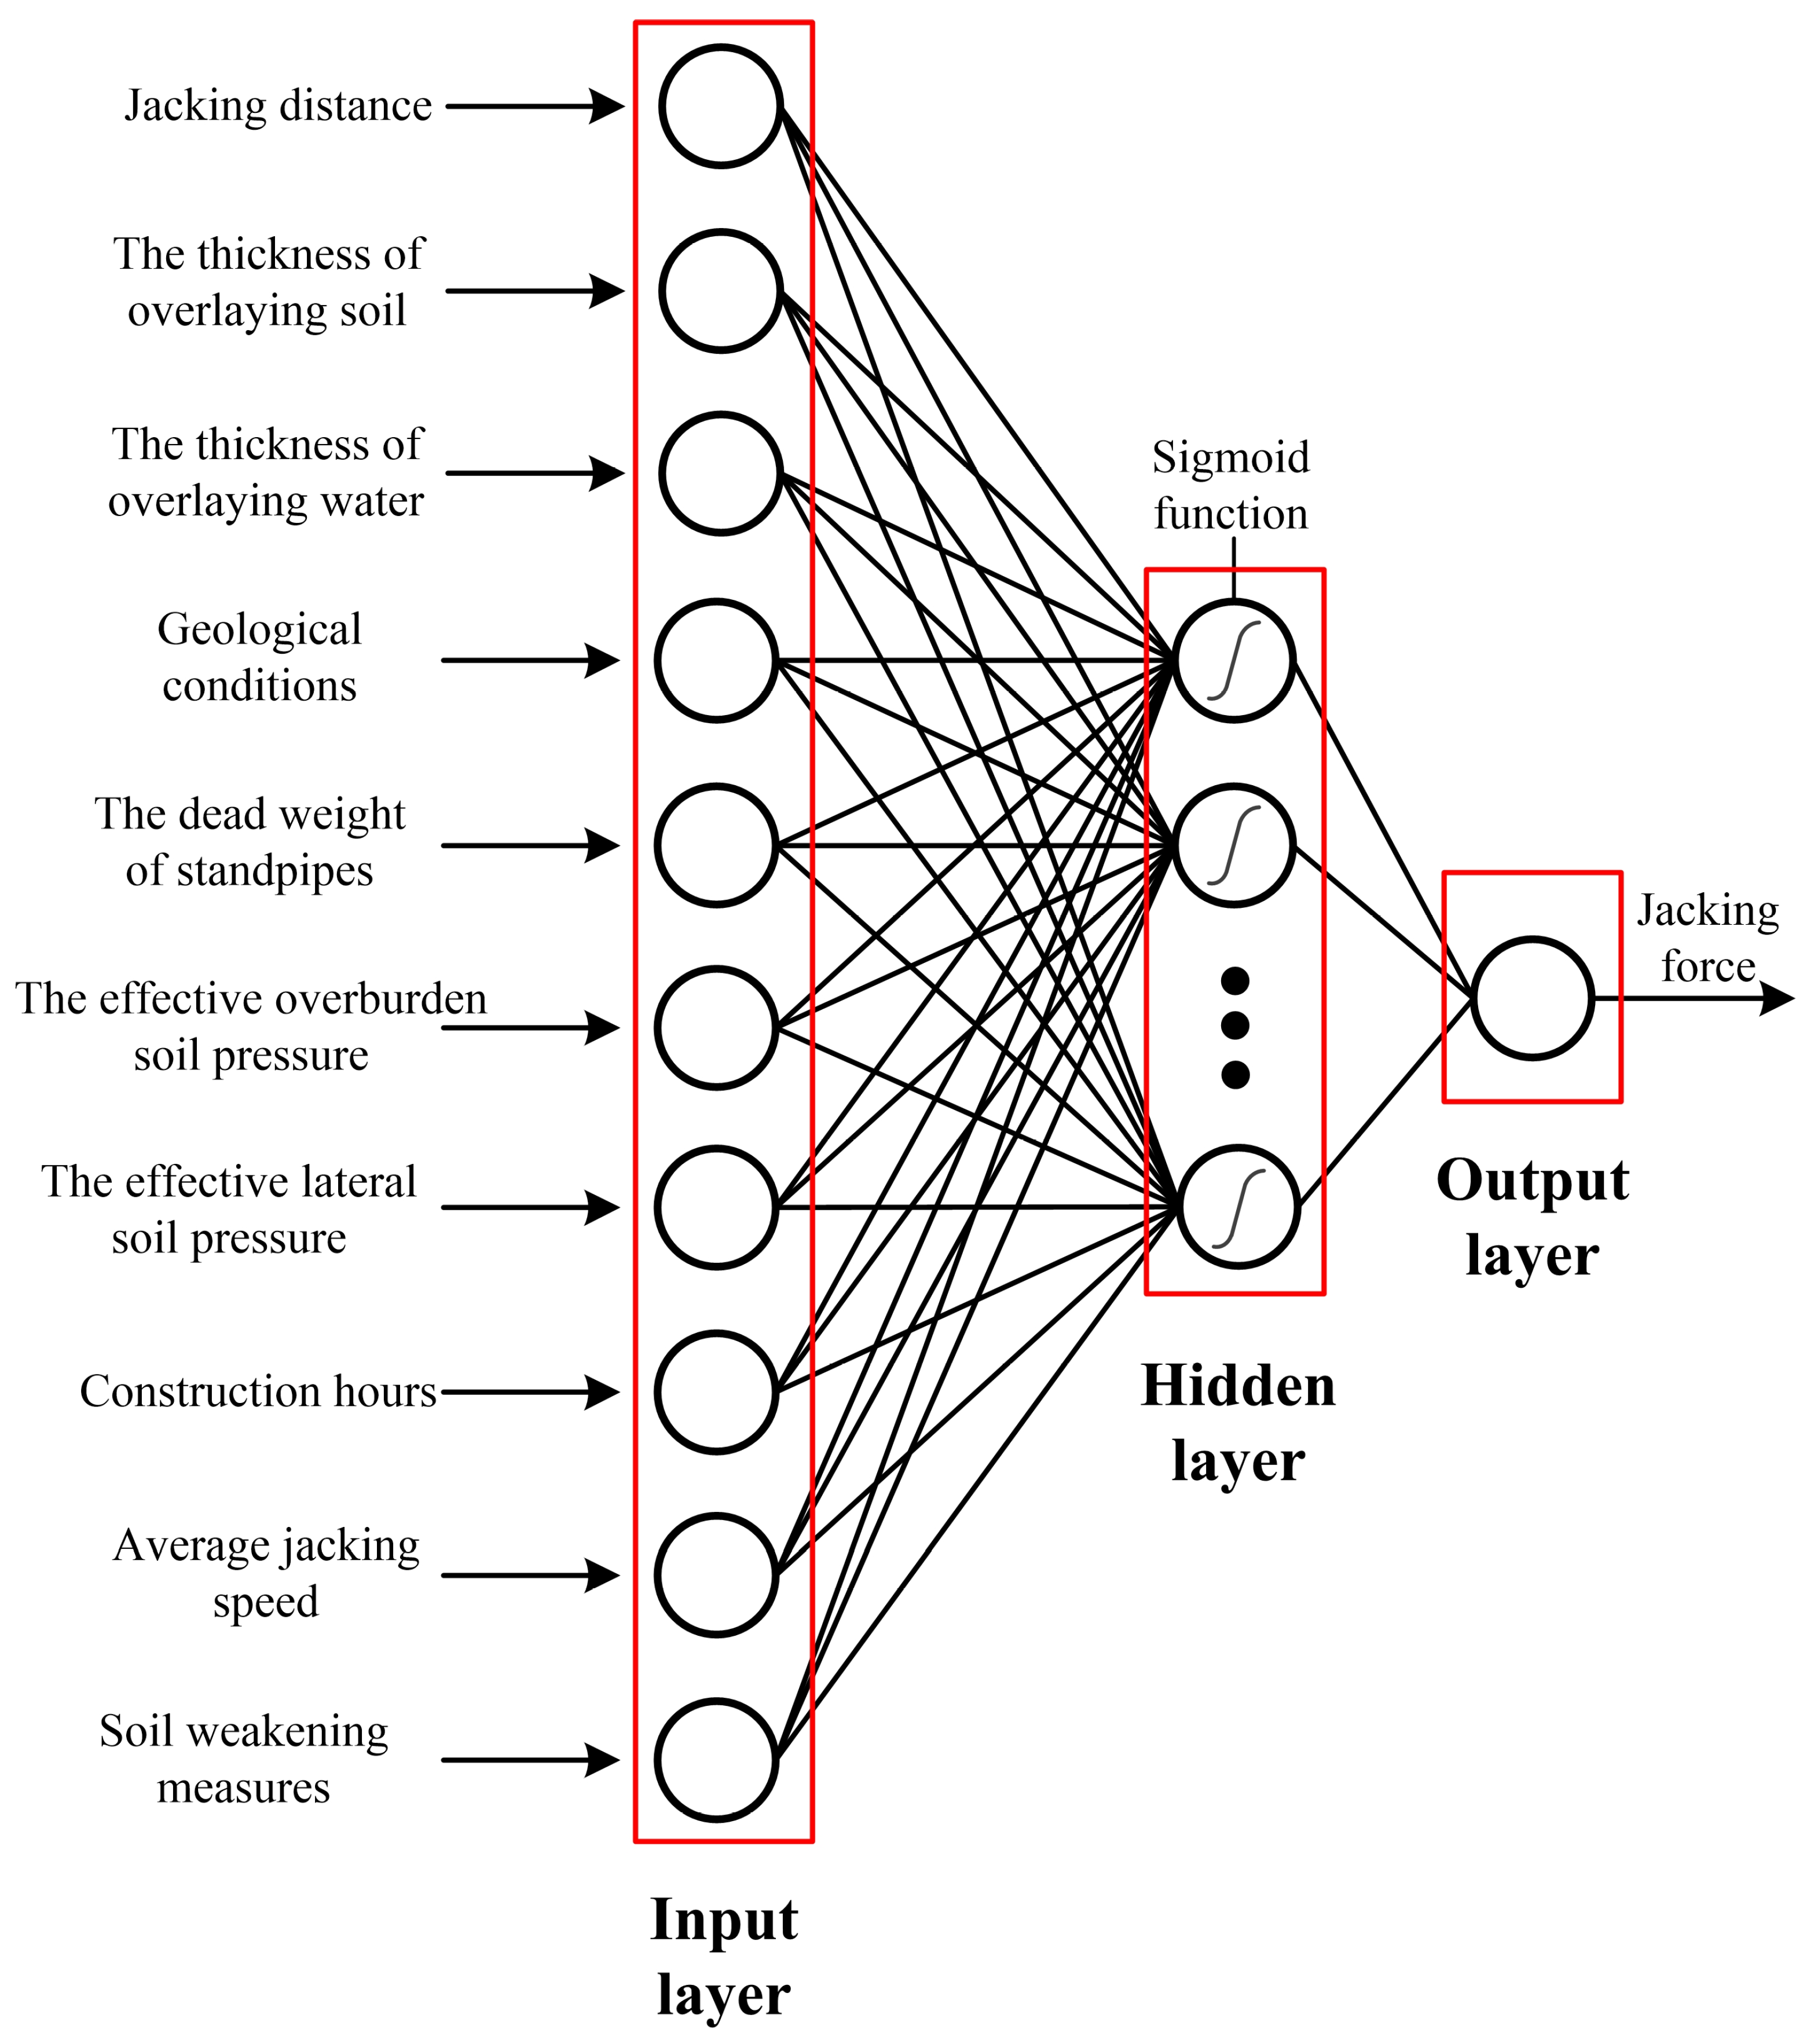
A typical ANN consists of three layers, including input, hidden, and output layers. In these layers, several neurons are logically arranged and connected by weights, determining the strength of influence between these neurons. The typical training process of an ANN is divided into three steps. The first step is to import the database into the input layer. The second step is to transfer the data multiplied by corresponding weights to the hidden layer(s) and calculate transfer functions. The last step is to obtain the output parameters in the output layer.
Rezaei et al. stated that three fundamental aspects, including network topology, activation functions, and training algorithms, are essential when building a specific ANN [13].
To develop the ANN model for predicting the jacking force, 546 datasets were analyzed in this study. Here, all 546 datasets were chosen randomly and classified as five different sets, namely dataset 1 to 5 (see Supplementary Materials). Wang et al. suggested that the ratio of the training dataset to the testing dataset should be 3:1 [14]. Thus, 75% of the total dataset is utilized as the training set, and 25% is utilized as the test set.
The architecture, i.e., network topology, of the ANN, is an essential factor that affects the performance of the ANN model significantly. It includes the features of the input layer, hidden layer(s), and output layer. According to Section 2.2 and Table 2, the input neurons (Ni) and the output neurons (No) are set to be 10 and 1, respectively. According to a systematic review of the application of ANN in the tunnel engineering field, Wang et al. summarized that single hidden layer networks could be applied in most problems, and the Equations for determination of the hidden neurons are provided [14] (Table 3). Hence, one hidden layer is selected in this paper, and the number of the hidden neurons (Nh) ranged from 1 and 30, according to Table 3. To choose a proper number of the hidden neurons, the trial-and-error method was conducted. Thus, 150 ANN models with Nh ranging from 1 to 30 for dataset 1 to 5 were constructed. To obtain an optimum number of hidden neurons, these models were evaluated by the average values of the coefficient of determination (R2) and root mean square error (RMSE) for the five datasets. The definitions of R2 and RMSE are explained in the following text.
To evaluate the performance of petrography-based models, Zorlu et al. have proposed a model selection procedure based on rate [24]. This method, named the total rate method, is widely used to evaluate model performance [8]. Thus, this method was applied here to choose the best hidden neuron number.
As shown in Table 4, the highest total rate of 102 was achieved when Nh = 7 (with the average R2 of 0.827 and 0.622, average RMSE of 26.0867 and 50.3891, for the training set and test set, respectively). Thus, Nh = 7 was found to be the best hidden neuron number among all the ANN models. Thus, 10 × 7 × 1 was chosen to be the optimum architecture to build neural network models (Figure 5). It can be found that Nh = 2Ni/3 was proven to be the well-matched equation of hidden neurons in this study, which can provide a reference to related researches. The activation functions are the hyperbolic tangent function (Tansig) in the hidden layer and the pure linear function (Purelin) in the output layer, respectively. Moreover, the Levenberg–Marquardt backpropagation algorithm was utilized in the ANN models. The best ANN model among the five ANN models for five datasets was selected later.
3.2. Genetic Algorithm
Firstly developed by Holland (1975), GA is one of the optimization techniques used to solve highly nonlinear or non-differentiable optimization problems [25]. Concepts from evolutionary biology are used to find the global minimum. It starts with an initial generation of candidate solutions that are tested against the objective function. Subsequent generations evolve from the first generation through reproduction, crossover, and mutation [7]. First of all, initial chromosomes are evaluated, and the fitness function value for each one of them is determined. After that, the best chromosomes are selected for reproduction and transferred to the next generations as “parents”. Thus, by absorbing the advantages of parents, new generations are evaluated, and the abovementioned process is continuing until stop criteria are met. Finally, the mutation process is conducted to change the chromosomes randomly to avoid being trapped in a local minimum [26].
Although the BP algorithm is widely used in ANN models, it may be trapped in local minima. Hence, optimization is necessary. GA can be applied to optimize the original ANN to obtain better prediction results. The implementation process of GA-ANN in this paper is shown in Figure 6.
During the optimization process of GA, determining the parameters of this algorithm, such as population size and genetic operator rates, and creating the proper function, are the most challenging problems. These parameters will considerably influence the convergence and results of the algorithm, which should be noticed during the optimization process [27,28]. Koopialipoor et al. selected 0.25 and 0.09 as the mutation probability value and percentage of recombination, respectively. The population range of 25–600 was utilized to conduct the parametric study, and 300 was chosen to be the optimum number of the population [7].
In this paper, a series of hybrid GA-ANN models were created to determine the best population size and the number of generations. The ranges of the population size and the number of generations were 50–500 and 10–500, respectively. In total, 140 hybrid models were generated to obtain the best GA parameters. In order to select the best GA parameters, the total rate method was applied as well [24]. Among the 140 hybrid models, eight models with the top rates are shown in Table 5. As shown in Table 5, the total rate for the hybrid model with 400 generations and 150 populations is the highest.
Thus, 400 generations and 150 populations were chosen to be the optimum GA parameters in this paper. Table 6 shows the GA parameters used in this study. Note that the architecture of the GA-ANN was 10 × 7 × 1, which is the same as that of the ANN.
According to Table 6, five GA-ANN models were established. The performance of these models will be discussed later.
4. Results and Discussion
4.1. Evaluation of the Results
Performance indices (PIs), including coefficient of determination (R2), root mean square error (RMSE), and the absolute value of relative error (RE), are utilized to evaluate the performance of the five ANN models and five GA-ANN models. Equations of these PIs are presented as follows:
where tk is the measured output value, yk is the predicted output value, is the average value of actual tk values, and N is the number of datasets.
Table 7 illustrates the values of PIs for training and test sets of five datasets. Similarly, the total rate method is applied here to select the optimum model from five ANN models and five GA-ANN models [24].
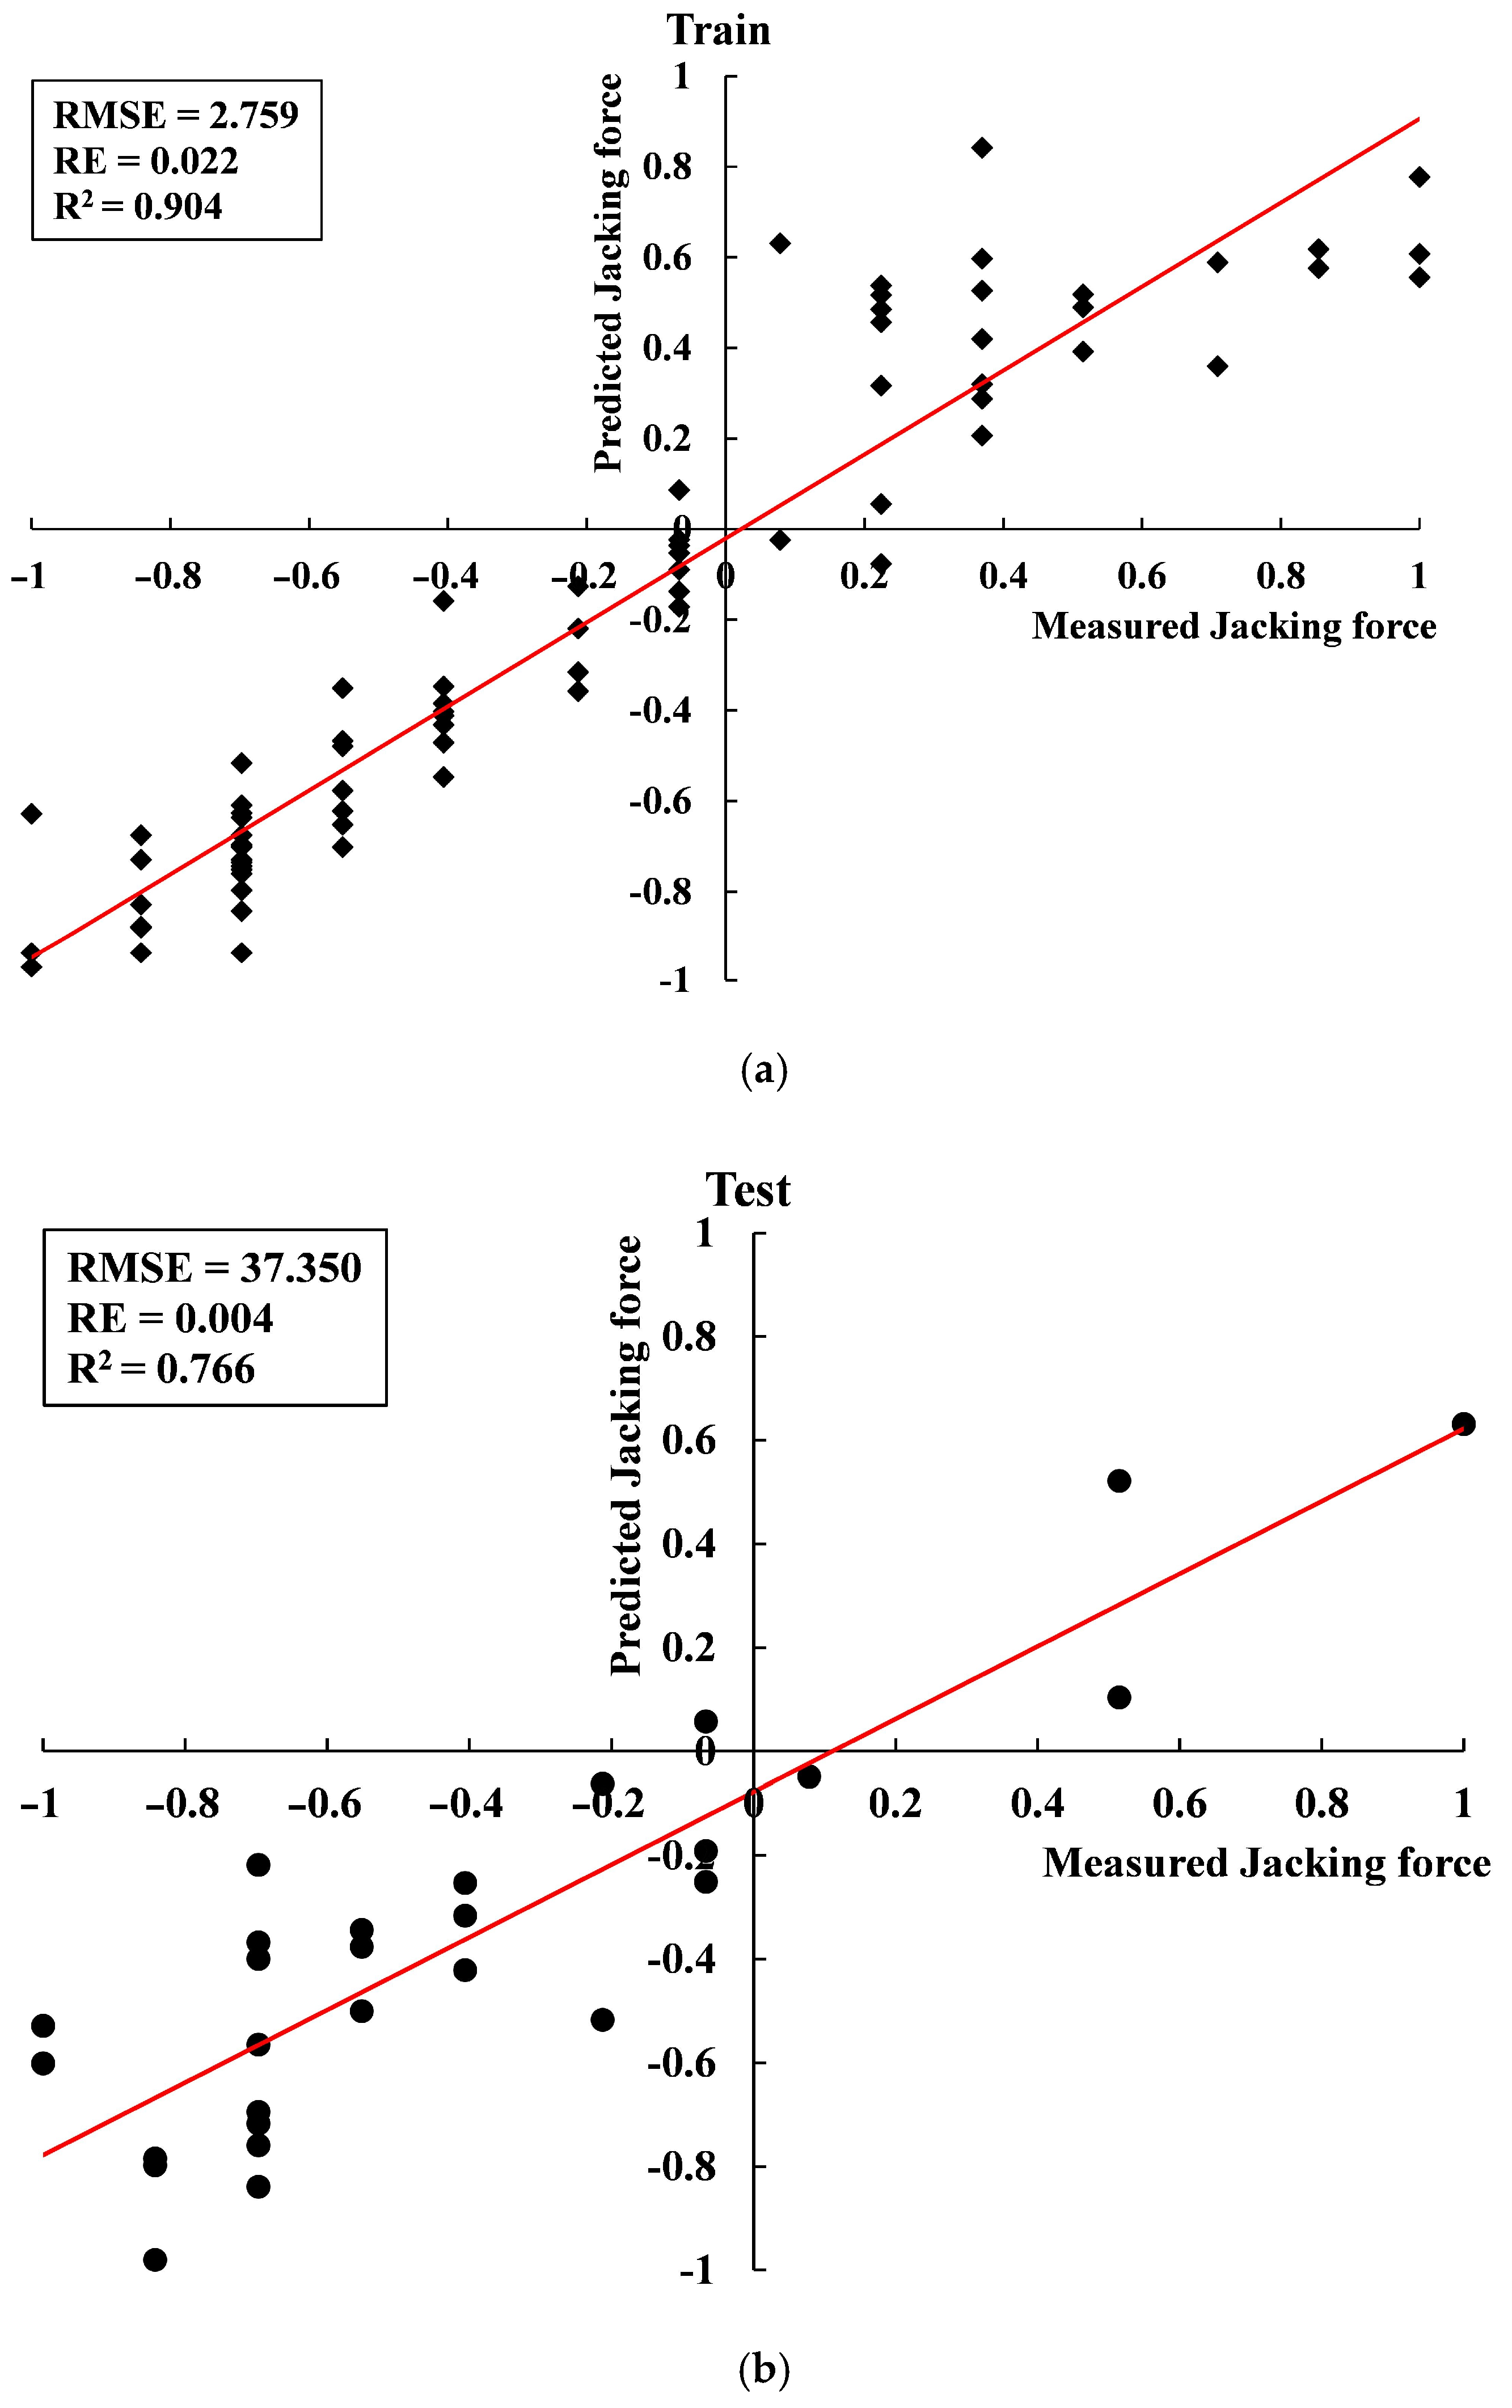
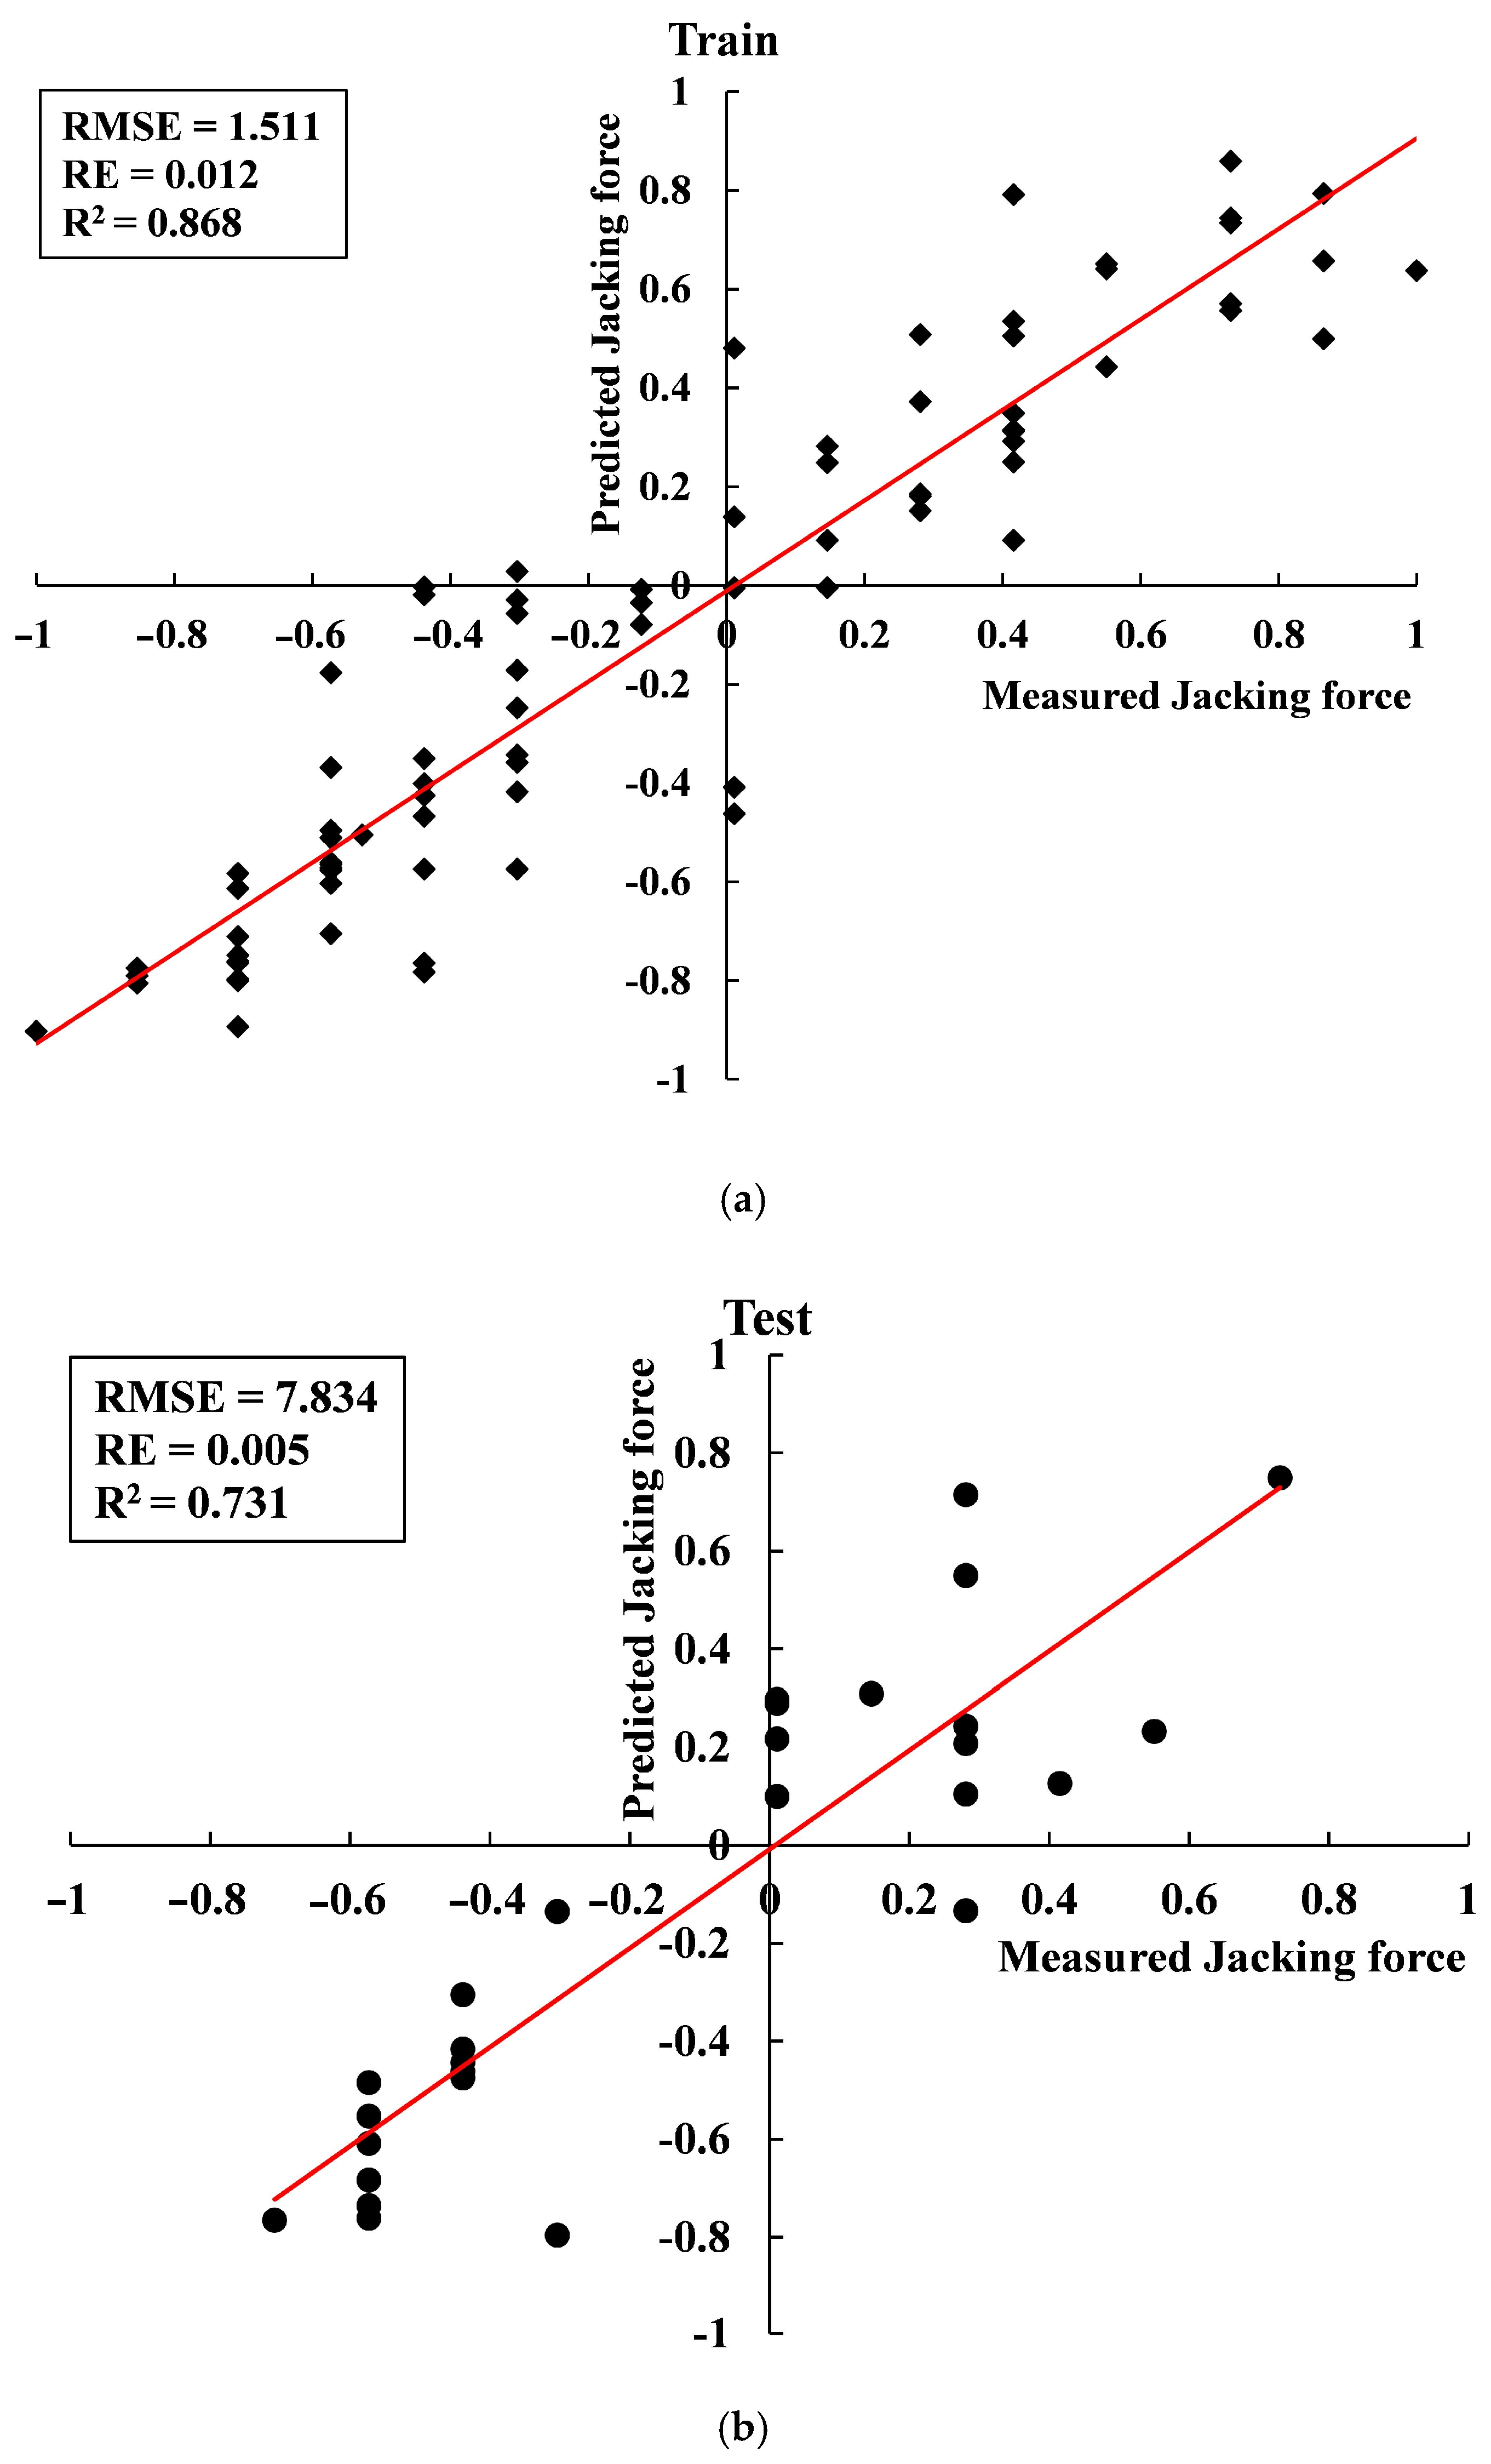
Afterwards, the ratings of PIs for both training and test set for each AI model was calculated (Table 8). As shown in Table 8, number 4 and number 1 models exhibited the highest total rate for the ANN and GA-ANN methods.
Values of the three PIs (R2, RE, RMSE) and the total rates show that the GA-ANN model is superior to the ANN model for the jacking force during the VTM construction, especially on the values of RMSE.
4.2. Parametric Sensitivity Analysis
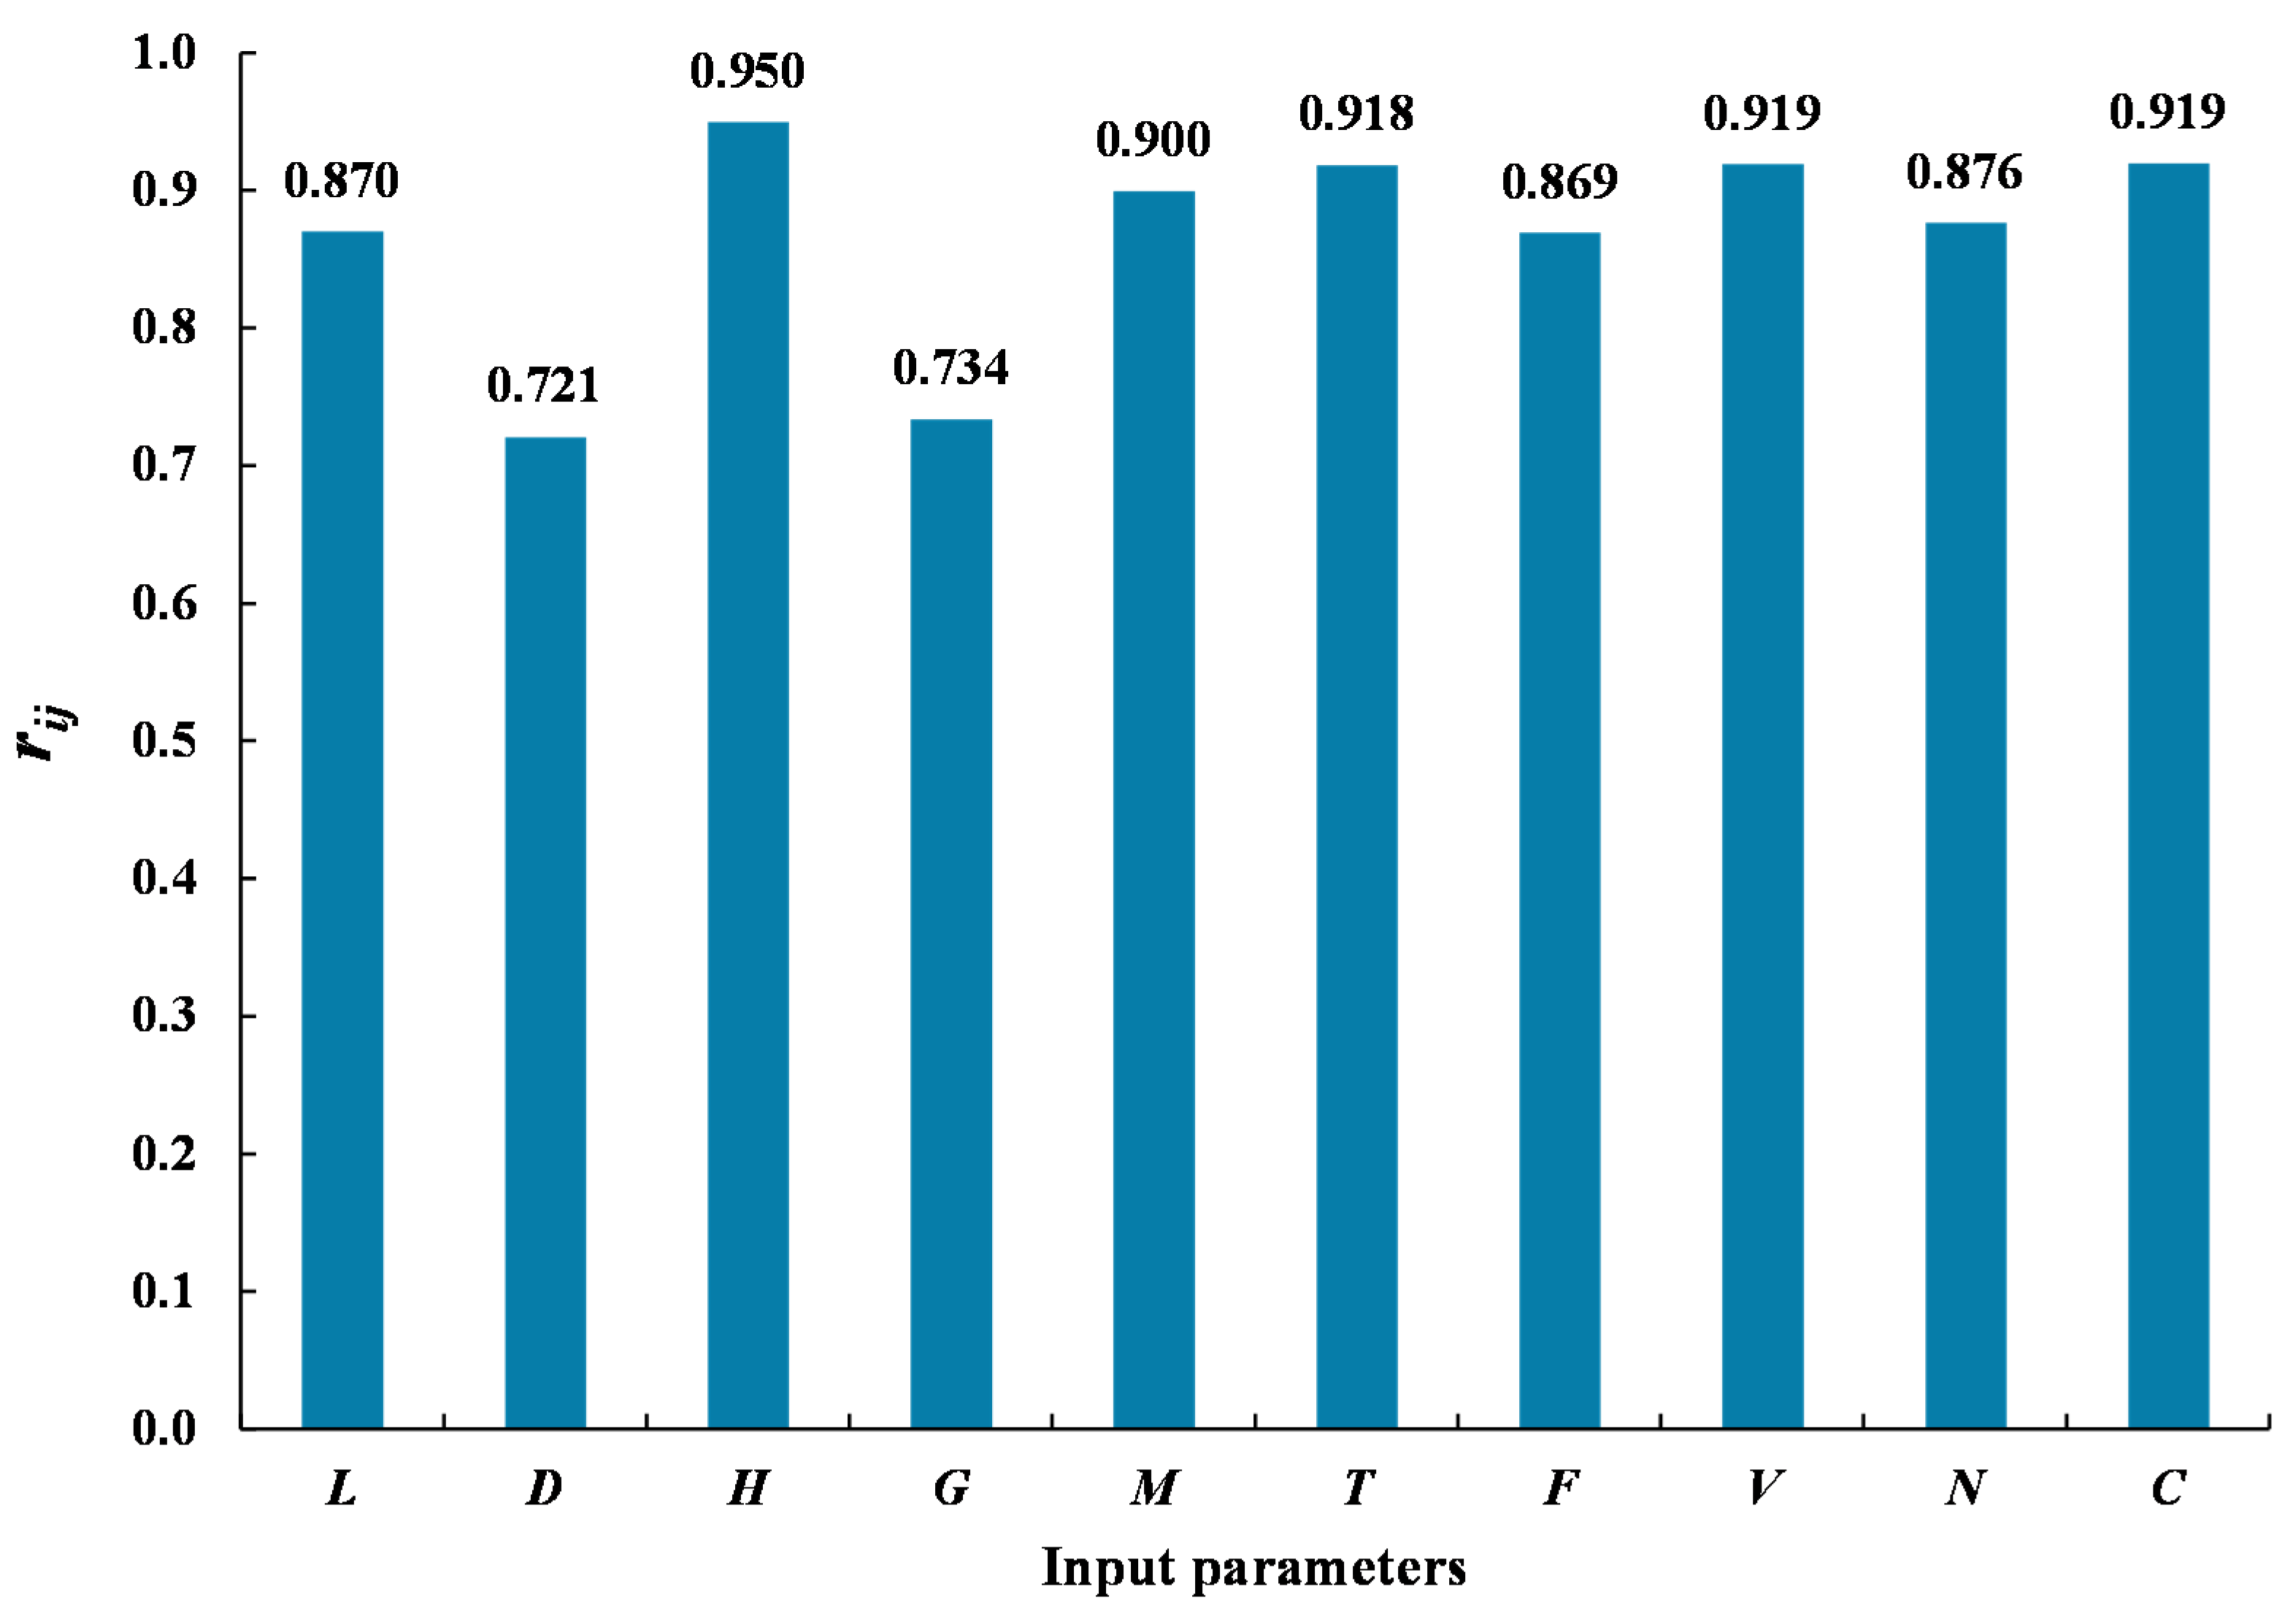
The ANN models are known as black-box models, which cannot provide a detailed relationship between the output parameter and the input parameters. To overcome this shortcoming, a sensitivity analysis was conducted to ascertain the importance of each influencing factor, i.e., each input parameter. The cosine amplitude method is widely applied when conducting parametric sensitivity analyses [29,30,31]. All data pairs are expressed in common X-space. The data pairs can be expressed as:
Each of the elements Xi in array X itself is a vector of length q, and can be expressed as:
The strength of the relationship (rij) between datasets Xi and Xj can be expressed as follows:
According to Equation (10), the relationship between the input data and the output data is shown in Figure 9. As shown in Figure 9, the height of overlaying water, the average jacking speed, and the geological condition are the most effective input parameters on the jacking force, whereas the jacking distance and the dead weight of standpipes are the least effective parameters.
5. Conclusions
To predict the jacking force during the VTM construction, a case study from Beihai, China was introduced, and 546 datasets were utilized to build ANN and GA-ANN models. The ten influencing factors which affect the values of the jacking force can be divided into three categories, i.e., geological condition factor, tunnel geometry factor, and jack operation factor. Assuming that only the ten influencing factors in Section 2.2 are related to the jacking force and using these ten factors as the input parameters, the jacking force as the output parameters, the basic ANN model was established. After a parametric study, the structure of 10 × 7 × 1 was chosen to be the best architecture. Based on this structure, many ANN models and hybrid GA-ANN models were built. Finally, three PIs, including R2, RMSE, and RE, were used to choose the best neural network of all the models. The number 4 and number 1 models exhibited the best total rates for ANN and GA-ANN models, respectively. The results show that the GA-ANN models were better than the ANN models. Finally, the sensitivity analysis showed that the height of overlaying water, the average jacking speed, and the geological condition are the most effective input parameters on the jacking force. In contrast, the jacking distance and the dead weight of standpipes are the least effective parameters.
Note that the limitation of the intelligent models in this paper is that the dataset number is not enough. Driven by big data, the accumulation of more data is believed to provide more accurate neural-genetic models to predict jacking force. By using this methodology, researchers and engineers will be able to predict the jacking force before the VTM construction, which can, in turn, guide the related projects. Moreover, the models in this paper may perform better if methods like “dropout”, activation functions such as “the rectified Linear Unit” (ReLU) can be used in the study [32,33]. This kind of method can optimize the neural network model and broaden its application field.
Supplementary Materials
The exact values of ten influencing factors, together with the jacking force, are available online at https://www.mdpi.com/2077-1312/9/1/71/s1.
Author Contributions
Conceptualization, X.-J.W.; methodology, X.-J.W.; software, X.W., and C.-W.Z.; validation, X.W.; formal analysis, X.W.; investigation, X.W., X.-J.W., and Y.S.; resources, Y.S.; data curation, G.W.; writing—original draft preparation, X.W.; writing—review and editing, X.-J.W., G.W., and C.-W.Z.; visualization, C.-W.Z.; supervision, X.-J.W., and G.W.; project administration, X.-J.W. and Y.S. All authors have read and agreed to the published version of the manuscript.
Funding
This research received no external funding.
Institutional Review Board Statement
Not applicable.
Informed Consent Statement
Not applicable.
Data Availability Statement
The data presented in this study are available in the supplementary materials.
Acknowledgments
Two anonymous reviewers are thanked for critically reading the manuscript and providing helpful comments on the earlier drafts of the manuscript.
Conflicts of Interest
The authors declare no conflict of interest.
References
- Wang, L.Z.; Sun, L.W.; Wang, Z.; Zhang, J. Field monitoring of a subsea shield tunnel during standpipe lifting. Tunn. Undergr. Space Technol. 2015, 45, 52–62. [Google Scholar] [CrossRef]
- Wang, L.Z.; Wang, Z.; Li, L.L.; Wang, J.C. Construction behavior simulation of a hydraulic tunnel during standpipe lifting. Tunn. Undergr. Space Technol. 2011, 26, 674–685. [Google Scholar] [CrossRef]
- Wang, X.; Behbahani, S.S.; Iseley, T.; Azimi, M.; Wei, X.; Wei, G.; Shi, Y. Vertical tunneling in China—A case study of a hydraulic tunnel in beihai. Tunn. Undergr. Space Technol. 2021, 107, 103650. [Google Scholar] [CrossRef]
- Pellet-Beaucour, A.L.; Kastner, R. Experimental and analytical study of friction forces during microtunneling operations. Tunn. Undergr. Space Technol. 2002, 17, 83–97. [Google Scholar] [CrossRef]
- Cheng, W.C.; Ni, J.C.; Shen, J.S.L.; Huang, H.W. Investigation into factors affecting jacking force: A case study. Proc. Inst. Civ. Eng. Geotech. Eng. 2017, 170, 322–334. [Google Scholar] [CrossRef]
- Choo, C.S.; Ong, D.E.L. Evaluation of pipe-jacking forces based on direct shear testing of reconstituted tunneling rock spoils. J. Geotech. Geoenviron. Eng. 2015, 141, 04015044. [Google Scholar] [CrossRef] [Green Version]
- Koopialipoor, M.; Armaghani, D.J.; Haghighi, M.; Ghaleini, E.N. A neuro-genetic predictive model to approximate overbreak induced by drilling and blasting operation in tunnels. Bull. Eng. Geol. Environ. 2019, 78, 981–990. [Google Scholar] [CrossRef]
- Armaghani, D.J.; Koopialipoor, M.; Marto, A.; Yagiz, S. Application of several optimization techniques for estimating tbm advance rate in granitic rocks. J. Rock Mech. Geotech. Eng. 2019, 11, 779–789. [Google Scholar] [CrossRef]
- Wang, Z.-F.; Cheng, W.-C. Predicting jet-grout column diameter to mitigate the environmental impact using an artificial intelligence algorithm. Undergr. Space 2020, in press. [Google Scholar] [CrossRef]
- Jahed Armaghani, D.; Hajihassani, M.; Yazdani Bejarbaneh, B.; Marto, A.; Tonnizam Mohamad, E. Indirect measure of shale shear strength parameters by means of rock index tests through an optimized artificial neural network. Measurement 2014, 55, 487–498. [Google Scholar] [CrossRef]
- Moghaddasi, M.R.; Noorian-Bidgoli, M. Ica-ann, ann and multiple regression models for prediction of surface settlement caused by tunneling. Tunn. Undergr. Space Technol. 2018, 79, 197–209. [Google Scholar] [CrossRef]
- Armaghani, D.J.; Mohamad, E.T.; Narayanasamy, M.S.; Narita, N.; Yagiz, S. Development of hybrid intelligent models for predicting tbm penetration rate in hard rock condition. Tunn. Undergr. Space Technol. 2017, 63, 29–43. [Google Scholar] [CrossRef]
- Rezaei, M.; Rajabi, M. Vertical displacement estimation in roof and floor of an underground powerhouse cavern. Eng. Fail. Anal. 2018, 90, 290–309. [Google Scholar] [CrossRef]
- Wang, X.; Lu, H.F.; Wei, X.J.; Wei, G.; Behbahani, S.S.; Iseley, T. Application of artificial neural network in tunnel engineering: A systematic review. IEEE Access 2020, 8, 119527–119543. [Google Scholar] [CrossRef]
- Hecht-Nielsen, R. In Kolmogorov’s mapping neural network existence theorem. In Proceedings of the International Conference on Neural Networks; IEEE Press: New York, NY, USA, 1987; pp. 11–14. [Google Scholar]
- Hush, D.R. In Classification with neural networks: A performance analysis. In Proceedings of the IEEE International Conference on Systems Engineering, Fairborn, OH, USA, 24–26 August 1989; pp. 277–280. [Google Scholar]
- Ripley, B.D. Statistical aspects of neural networks. In Networks and Chaos-Statistical and Probabilistic Aspects, 1st ed.; Chapman and Hall/CRC: London, UK, 1993; pp. 40–123. [Google Scholar]
- Paola, J. Neural Network Classification of Multispectral Imagery. Master’s Thesis, The University of Arizona, Tucson, AZ, USA, 1994. [Google Scholar]
- Wang, C. A Theory of Generalization in Learning Machines with Neural Network Applications; University of Pennsylvania: Philadelphia, PA, USA, 1994. [Google Scholar]
- Masters, T.; Schwartz, M. Practical neural network recipes in c. IEEE Trans. Neural Netw. 1994, 5, 853. [Google Scholar] [CrossRef]
- Kaastra, I.; Boyd, M. Designing a neural network for forecasting financial and economic time series. Neurocomputing 1996, 10, 215–236. [Google Scholar] [CrossRef]
- Kanellopoulos, I.; Wilkinson, G.G. Strategies and best practice for neural network image classification. Int. J. Remote Sens. 2010, 18, 711–725. [Google Scholar] [CrossRef]
- Haji Mohammad Hasan Mamaqani, B. Numerical Modeling of Ground Movements Associated with Trenchless Box Jacking Technique; The University of Texas at Arlington: Arlington, TX, USA, 2014. [Google Scholar]
- Holland, J.H. Adaptation in Natural and Artificial Systems: An Introductory Analysis with Applications to Biology, Control, and Artificial Intelligence; MIT Press: Cambridge, MA, USA, 1975. [Google Scholar]
- Goh, A.T.C. Search for critical slip circle using genetic algorithms. Civ. Eng. Environ. Syst. 2000, 17, 181–211. [Google Scholar] [CrossRef]
- Momeni, E.; Nazir, R.; Jahed Armaghani, D.; Maizir, H. Prediction of pile bearing capacity using a hybrid genetic algorithm-based ann. Measurement 2014, 57, 122–131. [Google Scholar] [CrossRef]
- Khandelwal, M.; Armaghani, D.J. Prediction of drillability of rocks with strength properties using a hybrid ga-ann technique. Geotech. Geol. Eng. 2015, 34, 605–620. [Google Scholar] [CrossRef]
- Zorlu, K.; Gokceoglu, C.; Ocakoglu, F.; Nefeslioglu, H.A.; Acikalin, S. Prediction of uniaxial compressive strength of sandstones using petrography-based models. Eng. Geol. 2008, 96, 141–158. [Google Scholar] [CrossRef]
- Rajabi, M.; Rahmannejad, R.; Rezaei, M.; Ganjalipour, K. Evaluation of the maximum horizontal displacement around the power station caverns using artificial neural network. Tunn. Undergr. Space Technol. 2017, 64, 51–60. [Google Scholar] [CrossRef]
- Salsani, A.; Daneshian, J.; Shariati, S.; Yazdani-Chamzini, A.; Taheri, M. Predicting roadheader performance by using artificial neural network. Neural Comput. Appl. 2014, 24, 1823–1831. [Google Scholar] [CrossRef]
- Koopialipoor, M.; Fallah, A.; Armaghani, D.J.; Azizi, A.; Mohamad, E.T. Three hybrid intelligent models in estimating flyrock distance resulting from blasting. Eng. Comput. 2018, 35, 243–256. [Google Scholar] [CrossRef] [Green Version]
- Srivastava, N.; Hinton, G.; Krizhevsky, A.; Sutskever, I.; Salakhutdinov, R. Dropout: A simple way to prevent neural networks from overfitting. J. Mach. Learn. Res. 2014, 15, 1929–1958. [Google Scholar]
- Boob, D.; Dey, S.S.; Lan, G. Complexity of training relu neural network. Discret. Optim. 2020, 100620. [Google Scholar] [CrossRef]
Figure 1.
The multi-point drainage mode of the standpipes in the vertical tunneling method (VTM).

Figure 2.
Construction process of the VTM: (a) The embedded first standpipe section; (b) Construction diagram on site.
Figure 2.
Construction process of the VTM: (a) The embedded first standpipe section; (b) Construction diagram on site.

Figure 3.
Flowchart of the construction process of the VTM.

Figure 4.
Factors affecting the jacking force.

Figure 5.
The structure of the ANN model.

Figure 6.
The implementation process of genetic algorithm optimized ANNs (GA-ANNs).

Figure 7.
Prediction results of the best ANN model to predict the jacking force: (a) Training set; (b) Test set.
Figure 7.
Prediction results of the best ANN model to predict the jacking force: (a) Training set; (b) Test set.

Figure 8.
Prediction results of the best GA-ANN model to predict the jacking force: (a) Training set; (b) Test set.
Figure 8.
Prediction results of the best GA-ANN model to predict the jacking force: (a) Training set; (b) Test set.

Figure 9.
Strength of the relationship (rij) between the input parameters and the jacking force.


Table 1.
Soil properties.
| Soil Type | Water Content (%) | Unit Weight (kN·m3) | Cohesive Force (kPa) | Internal Friction Angle (°) | Compression Modulus (MPa) | Classification |
|---|---|---|---|---|---|---|
| Backfill | 30.90 | 19.33 | 11.1 | 4.20 | 4.36 | 1 |
| Low liquid limit clay | 22.48 | 19.6 | 47.44 | 13.23 | 12.03 | 2 |
| Silty sand | 21.07 | 18.86 | 7.6 | 18.30 | 6.34 | 3 |
| Silty clay | 39.60 | 16.96 | 7.72 | 4.39 | 2.89 | 4 |
| Poorly graded sand | 25.12 | 19.18 | 5.29 | 8.74 | 5.42 | 5 |
| Water | - | 9.8 | - | - | - | 6 |
Table 2.
Maximum, minimum, average, and standard deviation of the used parameters to estimate jacking force.
Table 2.
Maximum, minimum, average, and standard deviation of the used parameters to estimate jacking force.
| Classification | Parameter | Unit | Category | Min. | Max. | Ave. | Standard Deviation | NP |
|---|---|---|---|---|---|---|---|---|
| Tunnel geometry factors | Jacking distance (D) | m | Input | 0.5 | 12.5 | 6.5 | 3.63 | - |
| The thickness of overlaying soil (L) | m | Input | 0 | 11 | 5.07 | 3.53 | Yes | |
| The height of overlaying water (H) | m | Input | 13.41 | 25.41 | 19.41 | 3.63 | Yes | |
| Geological factor | Geological conditions (C) | - | Input | 1 | 6 | 4.75 | 1.02 | Yes |
| Jacking operation factors | The dead weight of standpipes (G) | kN | Input | 2.31 | 35.45 | 18.88 | 10.03 | Yes |
| The effective overburden soil pressure (F) | kN/m2 | Input | 0 | 100.97 | 46.09 | 32.26 | Yes | |
| The effective lateral soil pressure (N) | kN/m2 | Input | 0 | 87.57 | 47.09 | 26.35 | Yes | |
| Construction hours (T) | h | Input | 34.34 | 63.97 | 43.64 | 5.70 | - | |
| Average jacking speed (V) | mm/min | Input | 3.33 | 16.67 | 9.30 | 2.88 | - | |
| Soil weakening measure (M) | - | Input | 1 | 2 | 1.03 | 0.19 | - | |
| Prediction object | Jacking force (J) | kN | Output | 380 | 2160 | 1122 | 439.47 | - |
Note: Max., maximum; Min., minimum, Ave., average; NP, normally proportional relationship between the corresponding influencing factor and the jacking force.
Table 3.
Equations for Determination of the Hidden Neurons.
| Heuristic | Application in This Paper | References |
|---|---|---|
| [15] | ||
| [16] | ||
| [17] | ||
| [18] | ||
| [19] | ||
| [20] | ||
| [21,22] | ||
| [23] |
Table 4.
Artificial neural network (ANN) models with the top eight rates.
| Number of Hidden Neurons | Training Set | Test Set | Rate for Training Set | Rate for Test Set | Total Rate | ||||
|---|---|---|---|---|---|---|---|---|---|
| R2 | RMSE | R2 | RMSE | R2 | RMSE | R2 | RMSE | ||
| 7 | 0.8270 | 26.0867 | 0.6222 | 50.3891 | 27 | 21 | 29 | 25 | 102 |
| 6 | 0.8136 | 18.6259 | 0.4891 | 46.1933 | 24 | 26 | 17 | 27 | 94 |
| 12 | 0.8427 | 31.1240 | 0.5721 | 68.2328 | 29 | 17 | 25 | 17 | 88 |
| 28 | 0.7865 | 43.9984 | 0.6263 | 48.8771 | 23 | 9 | 30 | 26 | 88 |
| 14 | 0.7710 | 25.7299 | 0.5343 | 61.0777 | 19 | 23 | 21 | 20 | 83 |
| 2 | 0.6600 | 13.5642 | 0.4851 | 28.1256 | 5 | 29 | 15 | 30 | 79 |
| 11 | 0.7682 | 23.1934 | 0.5739 | 97.8736 | 18 | 24 | 26 | 9 | 77 |
| 17 | 0.8517 | 19.2946 | 0.3817 | 72.0997 | 30 | 25 | 6 | 15 | 76 |
Table 5.
GA-ANN models with the top eight rates among the 140 GA-ANN models.
| Number of Generation | Population Size | Training Set | Test Set | Rate for Training Set | Rate for Test Set | Total Rate | ||||
|---|---|---|---|---|---|---|---|---|---|---|
| R2 | RMSE | R2 | RMSE | R2 | RMSE | R2 | RMSE | |||
| 400 | 150 | 0.8808 | 2.5368 | 0.8519 | 1.4076 | 138 | 111 | 131 | 137 | 517 |
| 500 | 500 | 0.868 | 1.2022 | 0.8461 | 7.9039 | 124 | 129 | 121 | 122 | 496 |
| 350 | 300 | 0.8684 | 0.9074 | 0.8412 | 9.5502 | 125 | 134 | 108 | 121 | 488 |
| 250 | 150 | 0.8757 | 3.061 | 0.8543 | 13.0499 | 134 | 102 | 134 | 110 | 480 |
| 300 | 400 | 0.8679 | 0.9775 | 0.8446 | 18.1216 | 123 | 133 | 118 | 91 | 465 |
| 20 | 500 | 0.8717 | 1.8646 | 0.8534 | 20.395 | 130 | 118 | 133 | 81 | 462 |
| 350 | 100 | 0.8705 | 3.5565 | 0.8476 | 14.3326 | 128 | 96 | 125 | 104 | 453 |
| 30 | 200 | 0.8655 | 0.171 | 0.8383 | 15.8342 | 114 | 138 | 95 | 96 | 443 |
Table 6.
GA parameters used for the determination of jacking force.
| GA Parameter | Values |
|---|---|
| Genetic operators (possibility) | Crossover (0.9), mutation (0.1) |
| Selection method | Roulette wheel selection |
| Number in population | 150 |
| Number of generations | 400 |
Table 7.
Values of the performance indices (PIs) for ANN and GA-ANN models.
| Method | Model | RMSE | R2 | RE | Rate | Total Rate | ||
|---|---|---|---|---|---|---|---|---|
| RMSE | R2 | RE | ||||||
| ANN | Tr 1 | 6.713 | 0.873 | 0.129 | 4 | 3 | 1 | 8 |
| Tr 2 | 85.924 | 0.613 | 0.099 | 1 | 2 | 2 | 5 | |
| Tr 3 | 22.071 | 0.896 | 0.034 | 2 | 4 | 3 | 9 | |
| Tr 4 | 2.759 | 0.904 | 0.022 | 5 | 5 | 5 | 15 | |
| Tr 5 | 12.966 | 0.904 | 0.027 | 3 | 5 | 4 | 12 | |
| Ts 1 | 66.928 | 0.794 | 0.014 | 2 | 5 | 3 | 10 | |
| Ts 2 | 34.284 | 0.632 | 0.008 | 4 | 2 | 4 | 10 | |
| Ts 3 | 93.595 | 0.278 | 0.034 | 1 | 1 | 2 | 4 | |
| Ts 4 | 37.350 | 0.766 | 0.004 | 3 | 4 | 5 | 12 | |
| Ts 5 | 19.788 | 0.641 | 0.037 | 5 | 3 | 1 | 9 | |
| GA-ANN | Tr 1 | 1.511 | 0.868 | 0.012 | 5 | 4 | 5 | 14 |
| Tr 2 | 53.862 | 0.570 | 0.060 | 1 | 2 | 1 | 4 | |
| Tr 3 | 23.972 | 0.808 | 0.043 | 3 | 3 | 2 | 8 | |
| Tr 4 | 20.341 | 0.894 | 0.027 | 4 | 5 | 4 | 13 | |
| Tr 5 | 47.804 | 0.426 | 0.035 | 2 | 1 | 3 | 6 | |
| Ts 1 | 7.834 | 0.731 | 0.005 | 5 | 4 | 5 | 14 | |
| Ts 2 | 25.691 | 0.506 | 0.063 | 3 | 2 | 1 | 6 | |
| Ts 3 | 8.038 | 0.718 | 0.029 | 4 | 3 | 4 | 11 | |
| Ts 4 | 66.201 | 0.463 | 0.052 | 1 | 1 | 2 | 4 | |
| Ts 5 | 54.433 | 0.746 | 0.039 | 2 | 5 | 3 | 10 | |
Note: Tr means training, Ts means test.
Table 8.
Total rates for ANN and GA-ANN models.
| Method | Model | Total Rate |
|---|---|---|
| ANN | 1 | 18 |
| 2 | 15 | |
| 3 | 13 | |
| 4 | 27 | |
| 5 | 21 | |
| GA-ANN | 1 | 28 |
| 2 | 10 | |
| 3 | 19 | |
| 4 | 17 | |
| 5 | 16 |
Publisher’s Note: MDPI stays neutral with regard to jurisdictional claims in published maps and institutional affiliations. |
© 2021 by the authors. Licensee MDPI, Basel, Switzerland. This article is an open access article distributed under the terms and conditions of the Creative Commons Attribution (CC BY) license (http://creativecommons.org/licenses/by/4.0/).
Share and Cite
MDPI and ACS Style
Wei, X.-J.; Wang, X.; Wei, G.; Zhu, C.-W.; Shi, Y. Prediction of Jacking Force in Vertical Tunneling Projects Based on Neuro-Genetic Models. J. Mar. Sci. Eng. 2021, 9, 71. https://doi.org/10.3390/jmse9010071
AMA Style
Wei X-J, Wang X, Wei G, Zhu C-W, Shi Y. Prediction of Jacking Force in Vertical Tunneling Projects Based on Neuro-Genetic Models. Journal of Marine Science and Engineering. 2021; 9(1):71. https://doi.org/10.3390/jmse9010071
Chicago/Turabian StyleWei, Xin-Jiang, Xiao Wang, Gang Wei, Cheng-Wei Zhu, and Yu Shi. 2021. "Prediction of Jacking Force in Vertical Tunneling Projects Based on Neuro-Genetic Models" Journal of Marine Science and Engineering 9, no. 1: 71. https://doi.org/10.3390/jmse9010071
Note that from the first issue of 2016, this journal uses article numbers instead of page numbers. See further details here.