Short-Term Aerial Pollutant Concentrations in a Southwestern China Pig-Fattening House
by
 ,
,
Shihua Pu
1,2, 
Xiao Rong
1,
Jiaming Zhu
1,2,
Yaqiong Zeng
1,2,
Jian Yue
1,2,
TengTeeh Lim
3,* and
Dingbiao Long
1,2,* 1
Chongqing Academy of Animal Sciences, No. 51, Changlong Avenue, Rongchang District, Chongqing 402460, China
2
The Scientific Observation and Experiment Station of Livestock Equipment Engineering in Southwest China, Ministry of Agriculture and Rural Affairs, Chongqing 402460, China
3
Division of Food Systems and Bioengineering, University of Missouri, Columbia, MO 65211, USA
*
Authors to whom correspondence should be addressed.
Atmosphere 2021, 12(1), 103; https://doi.org/10.3390/atmos12010103
Submission received: 11 December 2020
/
Revised: 5 January 2021
/
Accepted: 8 January 2021
/
Published: 12 January 2021
(This article belongs to the Special Issue Livestock Odor and Air Quality)
Abstract
:Concentrations of critical aerial pollutants within animal farms are important to the health of animals and farm staff and can be reduced via manure management, ventilation control, and barn design. This study characterized measurements of ammonia (NH3), total suspended particle (TSP), and airborne microbial communities of a large-scale pig-fattening house, as well as their correlations with environmental variables in Southwestern China. Monitoring was conducted for 15 consecutive days during both August and January, at various locations inside the pig house. The concentrations of NH3 and TSP averaged 3.22 and 0.55 mg m−3, respectively, while the average number of airborne microbial colonies was 3.91 log cfu m−3. The aerial pollutant concentrations displayed significant seasonal differences (p < 0.05). Specifically, concentrations in winter were significantly higher than those in summer (p < 0.05), and the 07:00 measurements were the highest among the three measurement times. The concentrations were significantly correlated with indoor temperature and relative humidity. In summer, TSP concentration was negatively correlated with temperature (correlation coefficient = −0.732), while NH3 concentration was positively correlated with temperature (correlation coefficient = 0.58). In winter, TSP and NH3 concentrations were negatively correlated with relative humidity (correlation coefficients = −0.739 and −0.713, respectively), while the airborne microbial colonies were not correlated with either humidity or temperature in summer or winter. These findings confirm that the aerial pollutant concentrations in a Southwestern China pig-fattening house exhibited significant seasonal and diurnal variations. Air quality can be improved by more precise ventilation control as observed by the correlation of concentrations with ventilation control, indoor temperature, and humidity.
1. Introduction
The release of harmful gases from animal farms has become one of the major sources of air pollution [1,2]. The development of large-scale, intensive farming increases the emissions of air pollutants such as ammonia (NH3), odors, particulate matter (PM), and greenhouse gases in certain areas. Among these, NH3 emissions from animal husbandry have become a significant source of agricultural NH3 emissions. It has been estimated that NH3 emissions from animal husbandry account for 64.0% of the total NH3 emissions from Canada, 48.7% from the United States, and 90.0% from the Swiss agricultural sources [3,4,5]. Pan et al. conducted monitoring and showed that the NH3 emissions of Beijing’s intensive livestock farms, in 2012, were 4.43 million tons, of which the pig industry accounted for 37.3% [6]. The 2019 China Animal Husbandry and Veterinary Yearbook projected that the percentage of large-scale operations of China’s animal husbandry would reach 49.1% in 2018 and would be expected to surpass 58% by 2020 [7]. Therefore, it is very important to conduct NH3 monitoring and emission research at intensive pig farms for China’s air pollution mitigation.
Harmful gases from animal facilities negatively impact the atmospheric and ecological environments and also adversely affect the health of farm animals and workers. Studies have shown that the components of odor, such as NH3a and hydrogen sulfide, can cause diseases such as central paralysis, toxic liver disease, and myocardial strain [8]. Particulate matter and pathogenic microbes in the air can cause respiratory tract inflammation in pigs and spread anaphylaxis, leading to severe financial losses for livestock and poultry farms [9,10,11,12]. At present, there have not been many studies on the monitoring of aerial pollutants from livestock and poultry farms in China, especially for commercial farms [13,14,15,16]. Therefore, the study of concentration, emission, and prediction models for aerial pollutants is of great significance for estimating animal farm emissions in China and for the development of better environmental regulations and management of animal husbandry.
The research on animal farm emissions has mainly come from the United States and Europe [17]. Cambra-López et al. [18] reviewed and discussed PM emissions from egg layer, meat chicken, turkey, and pig houses. Chai et al. [19] used a mass balance model to estimate the total NH3 emission in beef cattle houses. Cabrera et al. [20] used the livestock dynamic North Florida dairy farm model to simulate nitrogen pollution from farms. Breeding methods, farming intensity and size, climate, and other factors can affect air pollutants. Kim et al. found that NH3 concentrations and emissions were higher in the pig buildings that had deep-pit manure systems with slats and mechanical ventilation than in other housing types [21]. Significant differences in NH3 concentrations were reported for pig houses at different breeding stages and, in general, were as follows: pregnant sow house > fatting house > piggery [22]. Wang et al. suggested that the ventilation mode had an effect on the concentration of NH3 in a pig house, and that NH3 concentration in a natural ventilation house was 36.71% higher than that using mechanical ventilation [23].
At present, pig houses in Southern China are mostly open or semi-open houses that mainly utilize natural ventilation and manual removal of feces, and lack consistent guidelines for ventilation control, which are quite different from those in Europe and the United States. Their pig houses are often fully enclosed and automated, mechanically ventilated, and manure is either flushed or stored in deep pits. Therefore, the studies do not closely reflect Chinese farms, especially the vastly changing pig production operations, and thus are unable to provide appropriate guidance. Hence, there is an urgent need to conduct research on indoor environmental monitoring, aerial pollutant prediction models, and emission regulations specific to China’s animal farms. It is essential to learn from the U.S. and European research, to ensure scientific and systematic monitoring of the aerial pollutants in order to perform proper evaluation, modeling, and eventually mitigation of pollution challenges of animal productions, with the goal of creating environmentally friendly systems.
The present study was conducted in a pig-fattening house of a commercial pig farm in Chongqing, which is China’s dominant pig production province. The province has a humid subtropical climate, which experiences very high relative humidity for most of the year. The summers are long and among the hottest and most humid in China, while winters are short and somewhat mild but damp and overcast. The special climate conditions of the province have caused some difficulty in the environmental management of intensive pig farm operations. Many new, larger, and more intensive pig farms are being built in the region, but relevant aerial pollutant information within such animal farms is often lacking. Standards and proven methodology to characterize the critical aerial pollutants from the commercial operations are much needed to document the on-farm conditions and to develop potential local environmental regulations. The objectives of this study are to monitor the environmental variables and aerial pollutant concentrations at a pig-finishing house during summer and winter periods and to analyze the factors affecting pollutant concentration in order to strengthen the basis for the design and management of animal farms and potential regulations of air emissions.
2. Materials and Methods
2.1. Pig-Fattening House Structure and Management
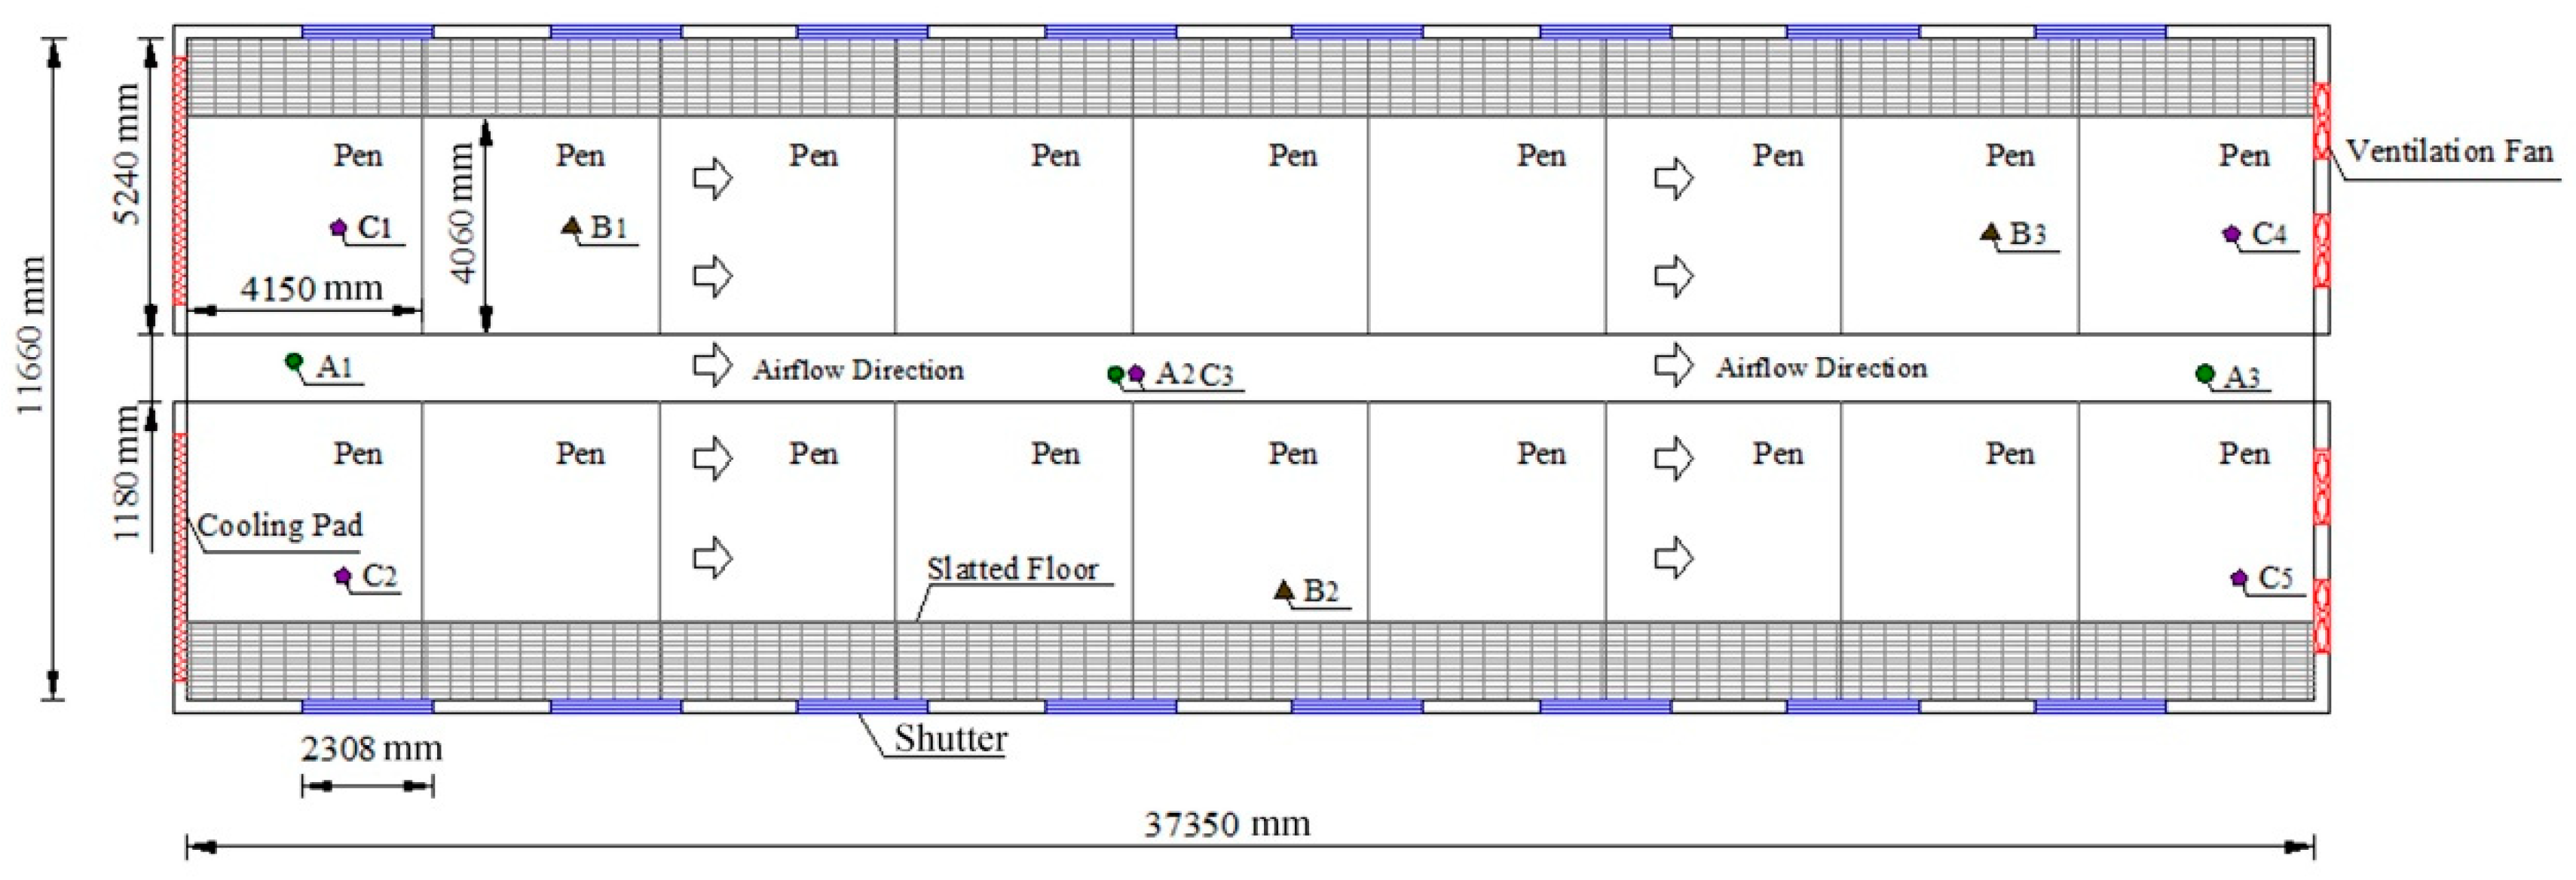
The experiment was conducted in a pig-fattening house of a Yuanzhong pig farm, located in Chongqing, China. The Yuanzhong pig farm is a farrow-to-finish operation that occupies an area of 66,666.7 m2. The farm had 3200 pigs in stock and was built in 2012. The pig-fattening house measures 37.35 × 11.66 × 3.30 m (L × W × H) and includes air inlet shutters that are 2.31 × 0.94 m (L × W). Each pen is 4.15 × 5.24 m (L × W) and has a partially slatted floor that is 4.15 × 1.18 m (L × W). The shutters were closed during the monitoring to minimize air leakage. The floor plan of the pig house is shown in Figure 1.
Typically, from March to April each year, the pig farm transfers 15–20 kg weaner pigs to the pig-fattening house. The fattening house reaches its maximum inventory (300–330 heads and 140–160 kg finishers) in August and markets all the pigs by early September. The fattening house is vacant for 1–2 weeks for cleaning and disinfection, after which a new group of 15–20 kg weaner pigs is stocked again, before the end of September. The house again reaches its maximum inventory (310–330 finishers each weighing 130–150 kg) by late January, and then the pigs are marketed by early February for the Chinese Spring Festival.
The growers/finishers were fed commercially formulated diets, following recommended growth phases (feed #910 for 20–60 kg pigs and #930 for 60–170 kg pigs, dry pelletized feed from Huiguang Feed Co. Ltd., Chongqing, China), by an automatic feeding system, and both feed and water were supplied ad libitum. The pig-finishing barn has a partially slatted floor, which is typical of pig farms in the region. The partially slatted floor allows the liquid manure to drain into manure collection channels underneath the slatted floor area. The solid manure was manually removed twice daily, at 08:00 and 18:00. The solid floor and the liquid manure channel were flushed using freshwater manually every day. The liquid portion of the manure was gravity-flowed to a nearby collection pit and eventually flowed into an on-farm anaerobic digester. The 300-head pig-finishing barn with a partially slatted floor operation is typical of the commercial farms in the region.
2.2. Fans and Evaporative Cooling Pads
There are four ventilation fans (mounted on the east wall) and two cooling pads (west wall, 3300 × 1800 × 150 mm, Figure 1) in the pig-fattening house, such that fresh air enters the barn through the cooling pad and exits through the ventilation fans located at the opposite end. One large fan and one small fan were installed on both sides of the barn east door. The large ventilation fan was 1.25 m in diameter (M1250, 1380 mm × 1380 mm, fan blades = 1250 mm, flowrate = 3.0 × 10⁴ m3 h−1–4.2 × 10⁴ m3 h−1, rotation speed = 1400 rpm) and the small ventilation fan was 1.0 m in diameter (M1000, 1110 mm × 1110 mm, fan blades = 1000 mm, rated flowrate = 2.5 × 10⁴ m3 h−1–3.5 × 10⁴ m3 h−1, rotation speed = 1400 rpm).
The ventilation fans and cooling pads are manually controlled by the pig farm manager every day. Four fans are usually turned on at 08:00 and off at 20:00, leaving one small fan to run at night during summer, while only one fan operates from 08:00–20:00 during winter. The operation and estimated ventilation of the fans and cooling pads during winter and summer are listed in Table 1. While there were more commercial pig farms equipped with fully automated ventilation control systems, the manually controlled barn operation was still very popular in the region when the research was conducted. The authors decided to minimize interfering in the barn management in order to collect the data more representative of the on-farm condition.
2.3. Monitoring Schedule and Details
In this experiment, the monitoring was conducted for 15 consecutive days each, during August 2017 and January 2018. The measurements covered the periods when the fattening house reached its maximum animal density with the most and larger pigs, and therefore the concentrations of aerial pollutants measured were representative of the full-barn conditions. Selected environmental parameters in the pig-fattening house were monitored, including indoor temperature, relative humidity, and indoor air pressure. Ammonia concentration, total suspended particles (TSP) concentration, and the total number of airborne microbial colonies were determined by field sampling and laboratory analyses, at sampling times of 07:00, 13:00, and 17:00 each day. Indoor sampling was completed prior to solid manure removal, and the sampling height was 1.5 m. The indoor sampling and monitoring locations are shown in Figure 1. The airtightness of the sampling equipment was checked in order to ensure no air leakage prior to sampling. The flow rate of the sampler was calibrated every week, and the flow rate error was kept under 5%. During each sampling, a blank sample was used to check for potential sample contamination.
2.4. Monitoring Equipment and Details
2.4.1. Temperature and Relative Humidity
A temperature and relative humidity sensor (HOBO U23-001, Onset, MA, USA) was set up at each of the five indoor locations (Figure 1) to automatically measure temperature and relative humidity every 10 min. The ambient weather data were obtained from a small automatic weather station (AG1000, Campbell Scientific, Logan, UT, USA), located near the pig house on the Yuanzhong pig farm.
2.4.2. Ammonia Concentration
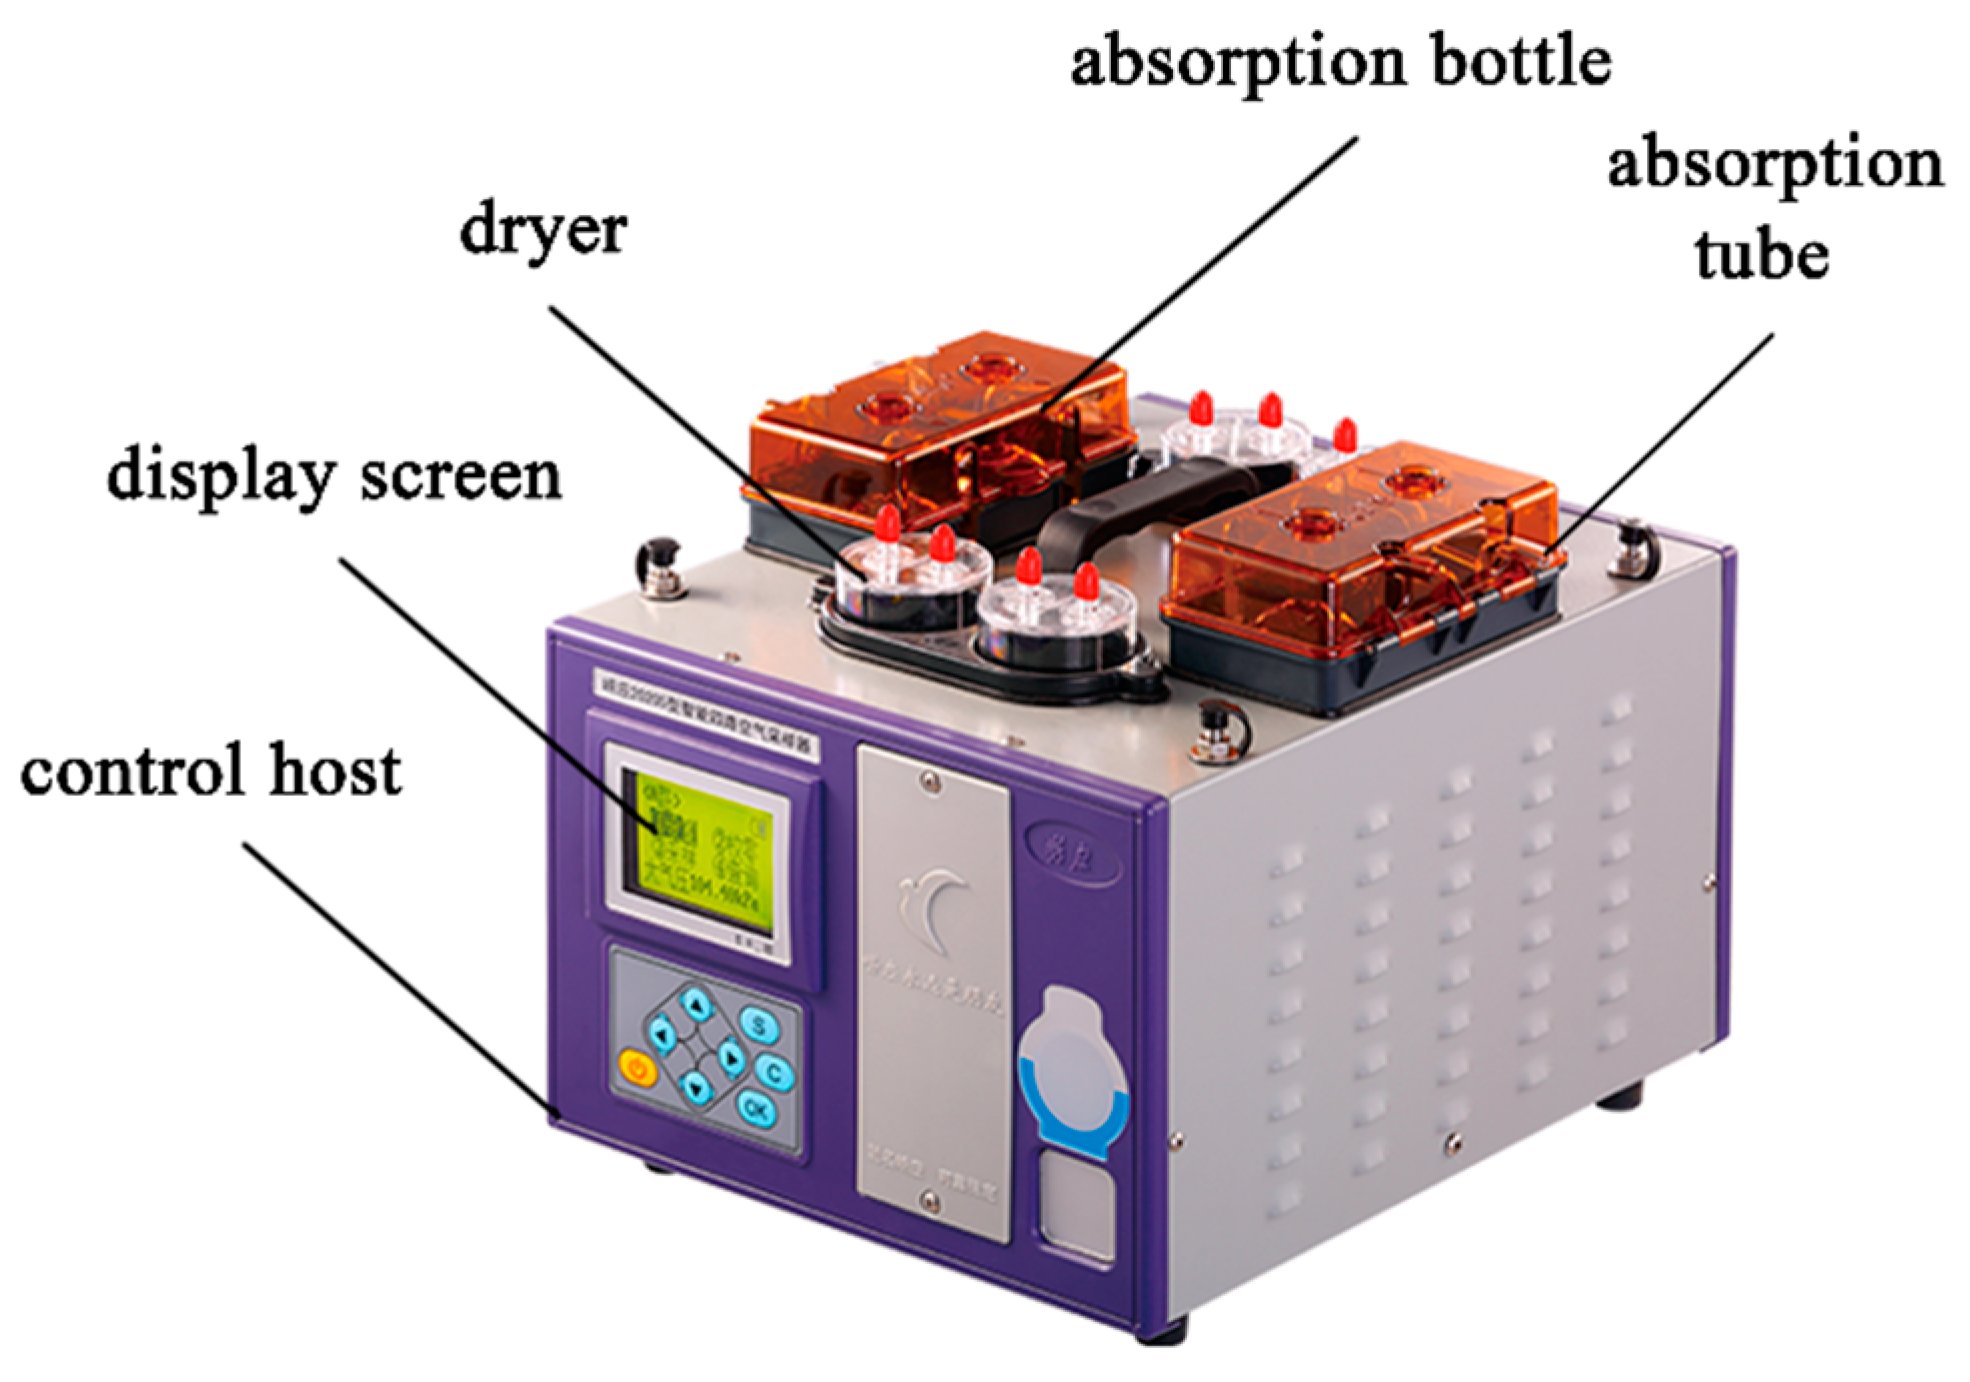
Concentrations of NH3 were measured using the sodium hypochlorite-salicylic acid spectrophotometry method (National Environmental Protection Standards of the People’s Republic of China, HJ 534-2009), at a wavelength of 697 nm. The measurement principle is that NH3 is absorbed by the diluted sulfuric acid solution to form ammonium sulfate. In the presence of sodium nitroferricyanide, ammonium ion, salicylic acid and sodium hypochlorite react to form a blue colored compound. Because the absorbance is linearly proportional to NH3 concentration, the NH3 concentration can, then, be measured by the absorbance. The detection limit was 0.025 mg m−3. A two-channel air sampler (LY2020S, Laoying, Qingdao, China), composed of an absorption tube, guide tube, dryer, electronic flow meter, sampling pump, and control host (Figure 2), was used for the NH3 concentration sampling. The two-channel sampler (sampling flowrate ≤2 L/min, sampling time = 4 min) collected air samples in the absorption tube with 0.005 mol L−1 sulfuric acid. The absorption tube was sealed and sent to a commercial laboratory for sample analysis.
The NH3 concentration was computed as (1) (HJ534-2009):
where CNH3 is the NH3 concentration (mg m−3), A is the absorbance value of the sample solution, A0 is the absorbance value of the blank sample that was prepared together with the sample, a is the calibration curve intercept −0.0589, b is the calibration curve slope 11.3401, Vs is the total volume of the sample solution (mL), Vnd is the volume (L) of the prepared air sample in the standard state, and V0 is the volume of the sample solution that was used for analysis (mL).
CNH3 = (A − A0–a) × VS/b × Vnd × V0
The volume of air sample in the standard state was calculated as (2):
where V is the sample volume (L), P is the atmospheric pressure (kPa) during sampling, and t is the sampling temperature (°C).
Vnd = V × P × (273/101.33) × (273 + t)
2.4.3. Airborne Microbial Colonies
Prepared agar was sampled for 30 s using an Andersen-6 stage sampler (Andersen-6 stage, Westech, UK). The airflow rate is 28.3 L min−1. The sample number of microbial colonies on the agar plate was calculated, and the obtained data were corrected using the Andersen calibration table, and then converted into the number of the microbial colonies per cubic meter of air, using the following calculation formula, and calculated as (3):
where Log CFU m−3 is the number of the microbial colonies per cubic meter of air, Qi is the total number of colonies on the six plates after correction, and t is the sampling time (min).
Log CFU m−3(Air) = Log10 (Qi/28.3) × t × 1000
For, the TSP concentration, the samples were obtained using a TSP medium velocity sampler (2030, Laoying) at fixed times (07:00, 13:00, and 17:00) and locations (A1, A2, and A3). Before sampling, the filter films were stored in a constant temperature and humidity incubator for 24 h and kept in the incubator during transportation. The sampling process lasted 15 min at an airflow rate of 100 L min−1. After sampling, the dust-laden particle samples were stored for 24 h in a constant temperature and humidity incubator, under the same conditions in which the empty filters were prepared. Then, the sampling films were weighed using a 1/10,000 scale and converted into TSP concentrations (g m−3). The calculation formula was the following as Equations (4) and (5):
where TSP is the total particulate matter concentration (µg m−3), K is a constant 1 × 10⁶, W0 is the weight of the empty filter film (µg), W1 is the dust-laden film (µg), QN is the average flow of the gas collection (m3 min−1), t is the sampling time (min), QM is the sampler operating flow (L min−1), PN is standard pressure as 101.3 kPa, TN is standard temperature as 273 K, P sampler pressure (kPa), and T is sampler temperature (K).
TSP = K × (W1 − W0)/(QN × t)
QN = (QMPTN)/(TPN)
2.5. Statistical Analysis of the Data
The data were organized in Microsoft Excel 2010, where the mean values and standard errors of each parameter were calculated; concurrently, the environmental variables (temperature and humidity) and concentrations (NH3 concentration, TSP concentration, and the total number of airborne microbial colonies) were fitted. Single-factor analysis of variance (ANOVA) was conducted using the SPSS 17.0 software package (IBM Software, Chicago, IL, USA), and multiple comparison analysis was performed using Duncan’s test. The results are presented in terms of mean value ± standard error, with p < 0.05 representing significant differences and p < 0.01 indicating highly significant differences. The data were plotted using Origin 2019b software (OriginLab Corp., Northampton, MA, USA), and the drawing of the pig house floor plan was completed using AutoCAD 2014 (Autodesk, San Rafael, CA, USA).
3. Results and Discussion
3.1. Weather Conditions
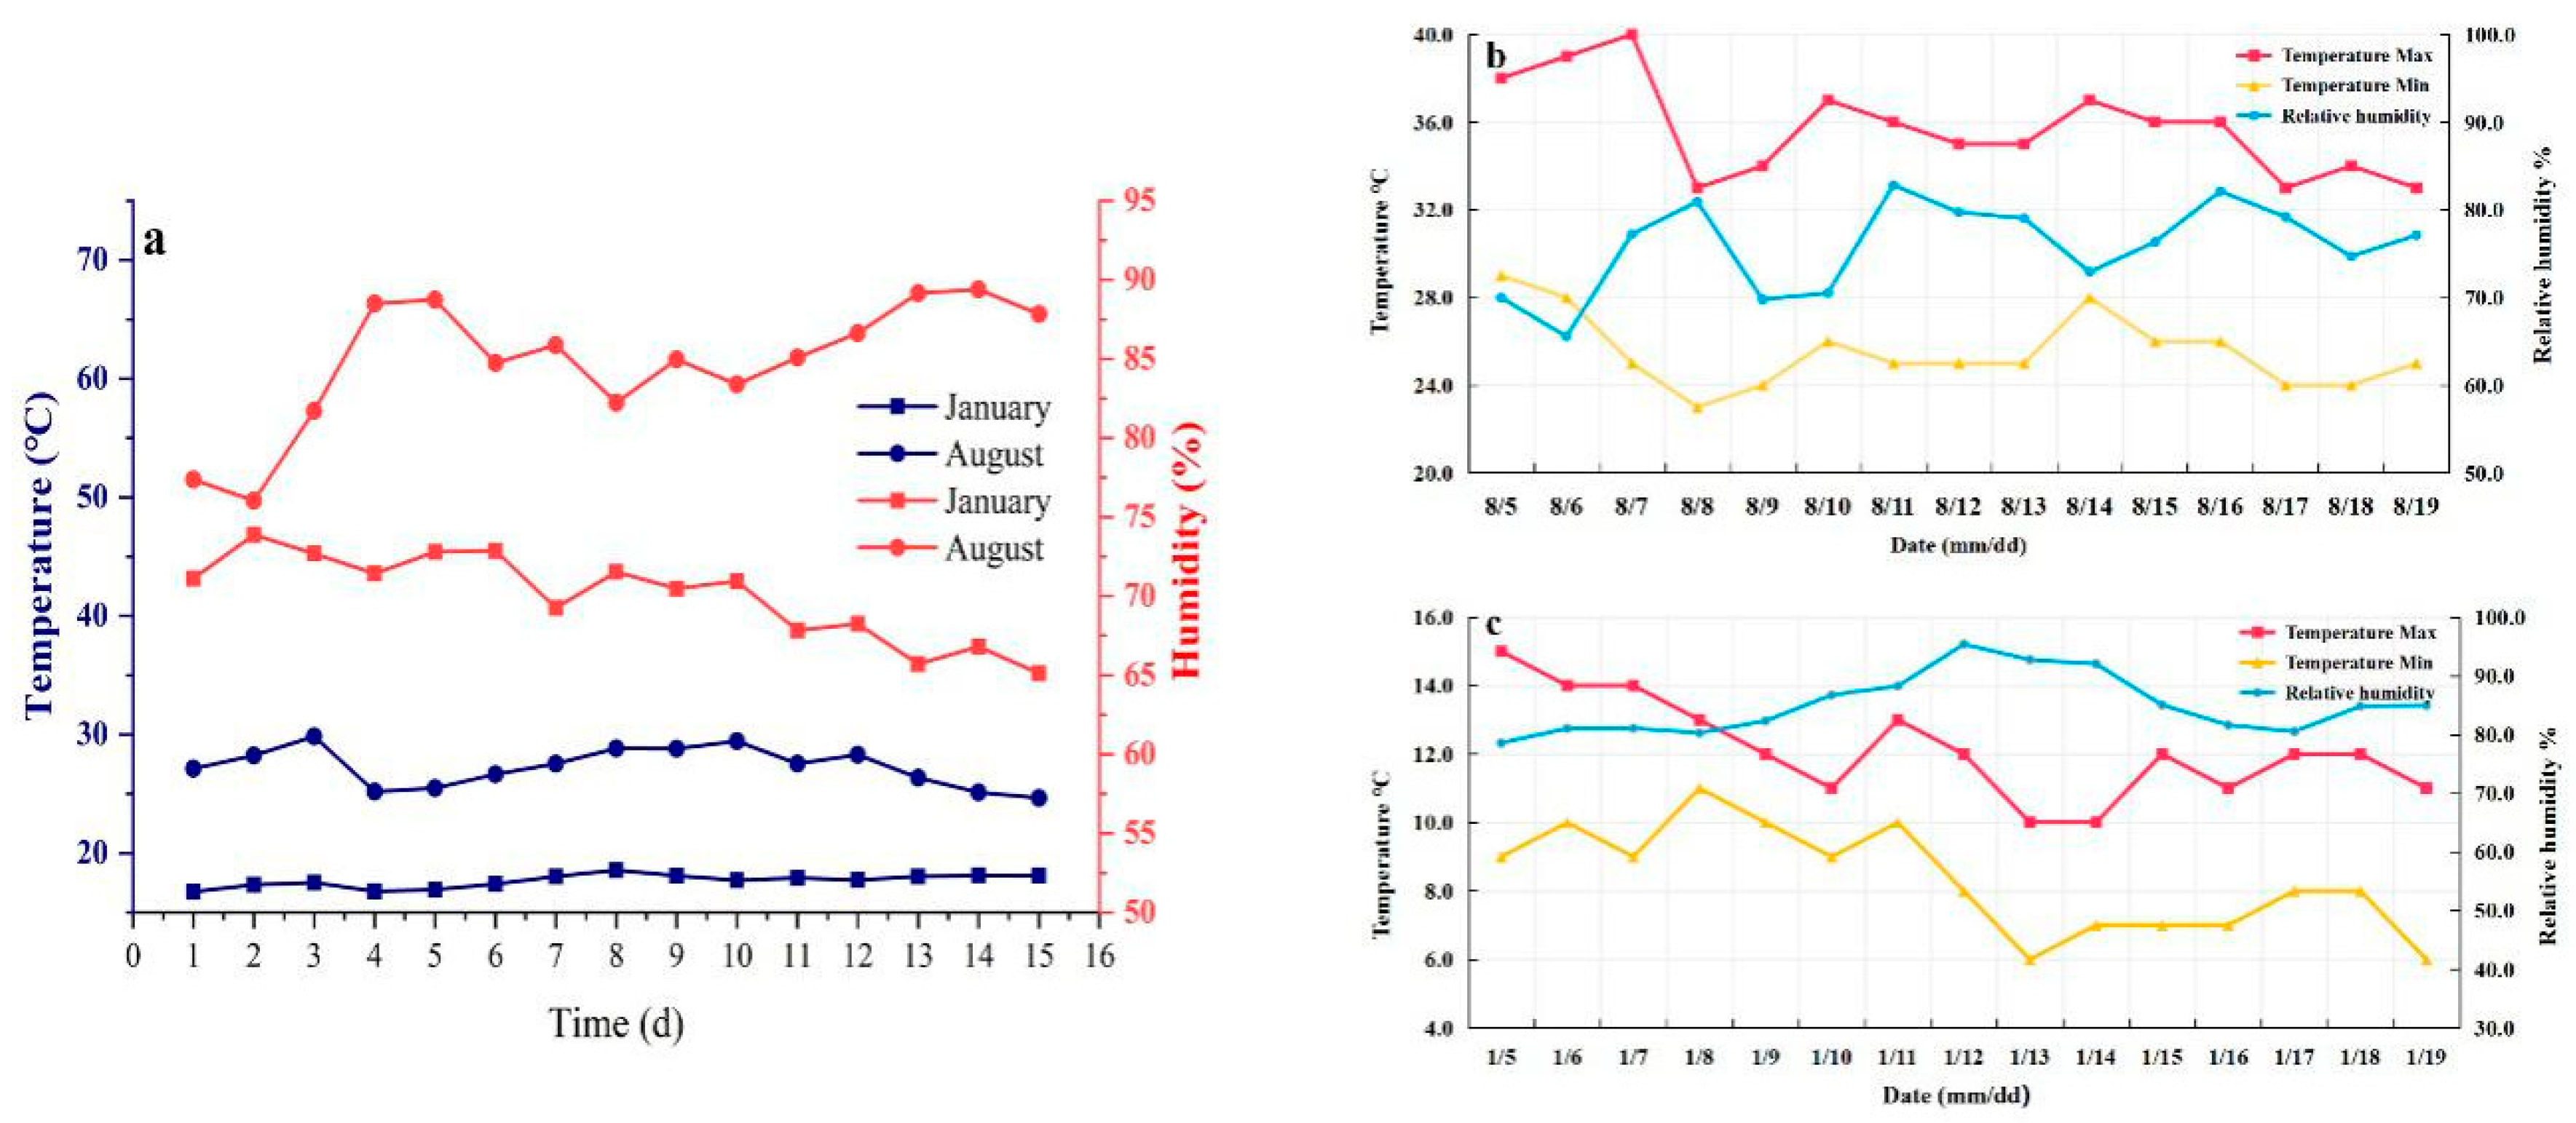
The ambient temperature of the farm area during the summer measurement period (August 2017) consisted of a maximum of 40.22 °C and a minimum of 23.43 °C, and the daily maximums were 37.56–40.22 °C. The ambient relative humidity ranged from 65.98% to 82.12%, and the total precipitation was 152 mm. These values were typical of the Chongqing province in Southwestern China, which has a subtropical monsoon climate. The area has high annual precipitation influenced by the East Asian monsoon circulation. The indoor temperatures of the piggery varied from 24.62 to 27.11 °C, and the average relative humidity was 84.78%. The daily maximum temperature during the winter measurement period (January 2018) was 15.30 °C, and the minimum was 6.27 °C, while the relative humidity ranged from 78.56% to 95.37%, and the total precipitation was 18 mm. The indoor temperatures of the pig-finishing house ranged from 16.75 to 18.64 °C, and the relative humidity ranged from 65.11% to 73.88% (Figure 3). The weather conditions exhibited typical seasonal characteristics of high temperatures and high humidity during the summer and relatively low temperatures with high humidity during the winter. The indoor temperatures showed relatively high temperatures during the summer weeks, and some daily minimum temperatures lower than 10.00 °C during the winter weeks, suggesting that improvements were needed for indoor climate control. Even when the pig house was equipped with evaporative cooling, the manual operation of the cooling pads and ventilation fans was not fully utilized for a more consistent climate control.
3.2. Aerial Pollutant Concentrations in the Piggery During Winter and Summer
Table 2 summarizes the major variables, presented as mean ± standard deviation, for the summer and winter measurement periods. During the winter weeks of January, the average NH3 and TSP concentrations were two and 15 times higher than during the summer weeks of July, respectively, and the average number of airborne microbial colonies was approximately 1.2 times higher. It is worth noting that the aerial pollutant concentrations exhibited significant differences (p ≤ 0.05) between the summer and winter periods, with the NH3 and TSP concentrations of the pig-fattening house in winter being at least twice as high as the summer values.
According to the requirements of the recommended China standards 17824.3-2008, the NH3 concentration in commercial pig farms should not exceed 25 mg m−3, and the TSP concentration should be <3 mg m−3. The results of this study, although only measured for a little over two weeks during the summer and winter weeks, indicated that the average NH3 concentration in the pig-fattening house was within the thresholds of the China standard, which was consistent with the NH3 concentrations (6.24–8.41 mg m−3 in winter and 3.15–4.07 mg m−3 in summer) of a mechanically ventilated pig-fattening house monitored by Philippe et al. and Liu et al. [24,25]. Li [26] reported that the NH3 concentrations of pig-fattening houses in Southeastern China were 10.62 ± 7.71 mg m−3 during February and 5.61 ± 3.81 mg m−3 during July. In addition, Wu et al. [27] reported that the NH3 concentration of a closed pig-fattening house in East China was 9–10 mg m−3 during June. Although these monitoring results were 10–20% higher than the results of this study, they are consistent with the pig house’s NH3 characteristics of higher concentrations in winter and lower concentrations in summer.
The main reason for the differences in NH3 and dust concentrations for the two seasons is likely the amount of ventilation provided. The ventilation rate during the winter was one-fifth of that during the summer, while the concentrations of NH3 and TSP in the piggery during winter were 2.76 and 15.45 times those during summer, respectively. Kim et al. [28] pointed out that there was a large temperature difference between the ambient air and the indoor pig house environment during winter. In order to maintain indoor temperature, pig farm managers often kept the facilities closed in an attempt to reduce the ventilation costs, which led to the accumulation of harmful gases and a subsequent increase in NH3 concentration. The higher NH3 concentration was also related to the breeding density, ventilation mode, manure management removal frequency, and other factors such as growth stage and temperature settings.
In this research, the TSP concentration during winter exceeded the recommended threshold, which was related to the relatively low ventilation rate and also to the extensive feeding management of fattening pigs and the inconsistent removal of fecaluria and residual feed. Chen et al. [29] found that the TSP concentration in pig-fattening houses was responsible for many respiratory diseases in finishing pigs. This was mainly due to the increased PM accumulation in the piggery, which provided more attachment points for airborne microorganisms, which, then, promoted their reproduction. This was also one reason that the number of airborne microorganisms reported during winter was higher than during summer [30,31]. Approximately 44.0% of these airborne microorganisms can enter the upper respiratory tracts of both humans and pigs, and 19.8% can directly invade the alveoli, seriously threatening the health of both pigs and management personnel [32,33,34]. Therefore, it is very important to control aerial pollutant concentrations by increasing and maintaining a proper ventilation rate while ensuring comfortable indoor temperatures in pig houses. In this research, we observed that improvement could be made during the winter period.
3.3. Variations of Measurements in the Pig-Fattening House
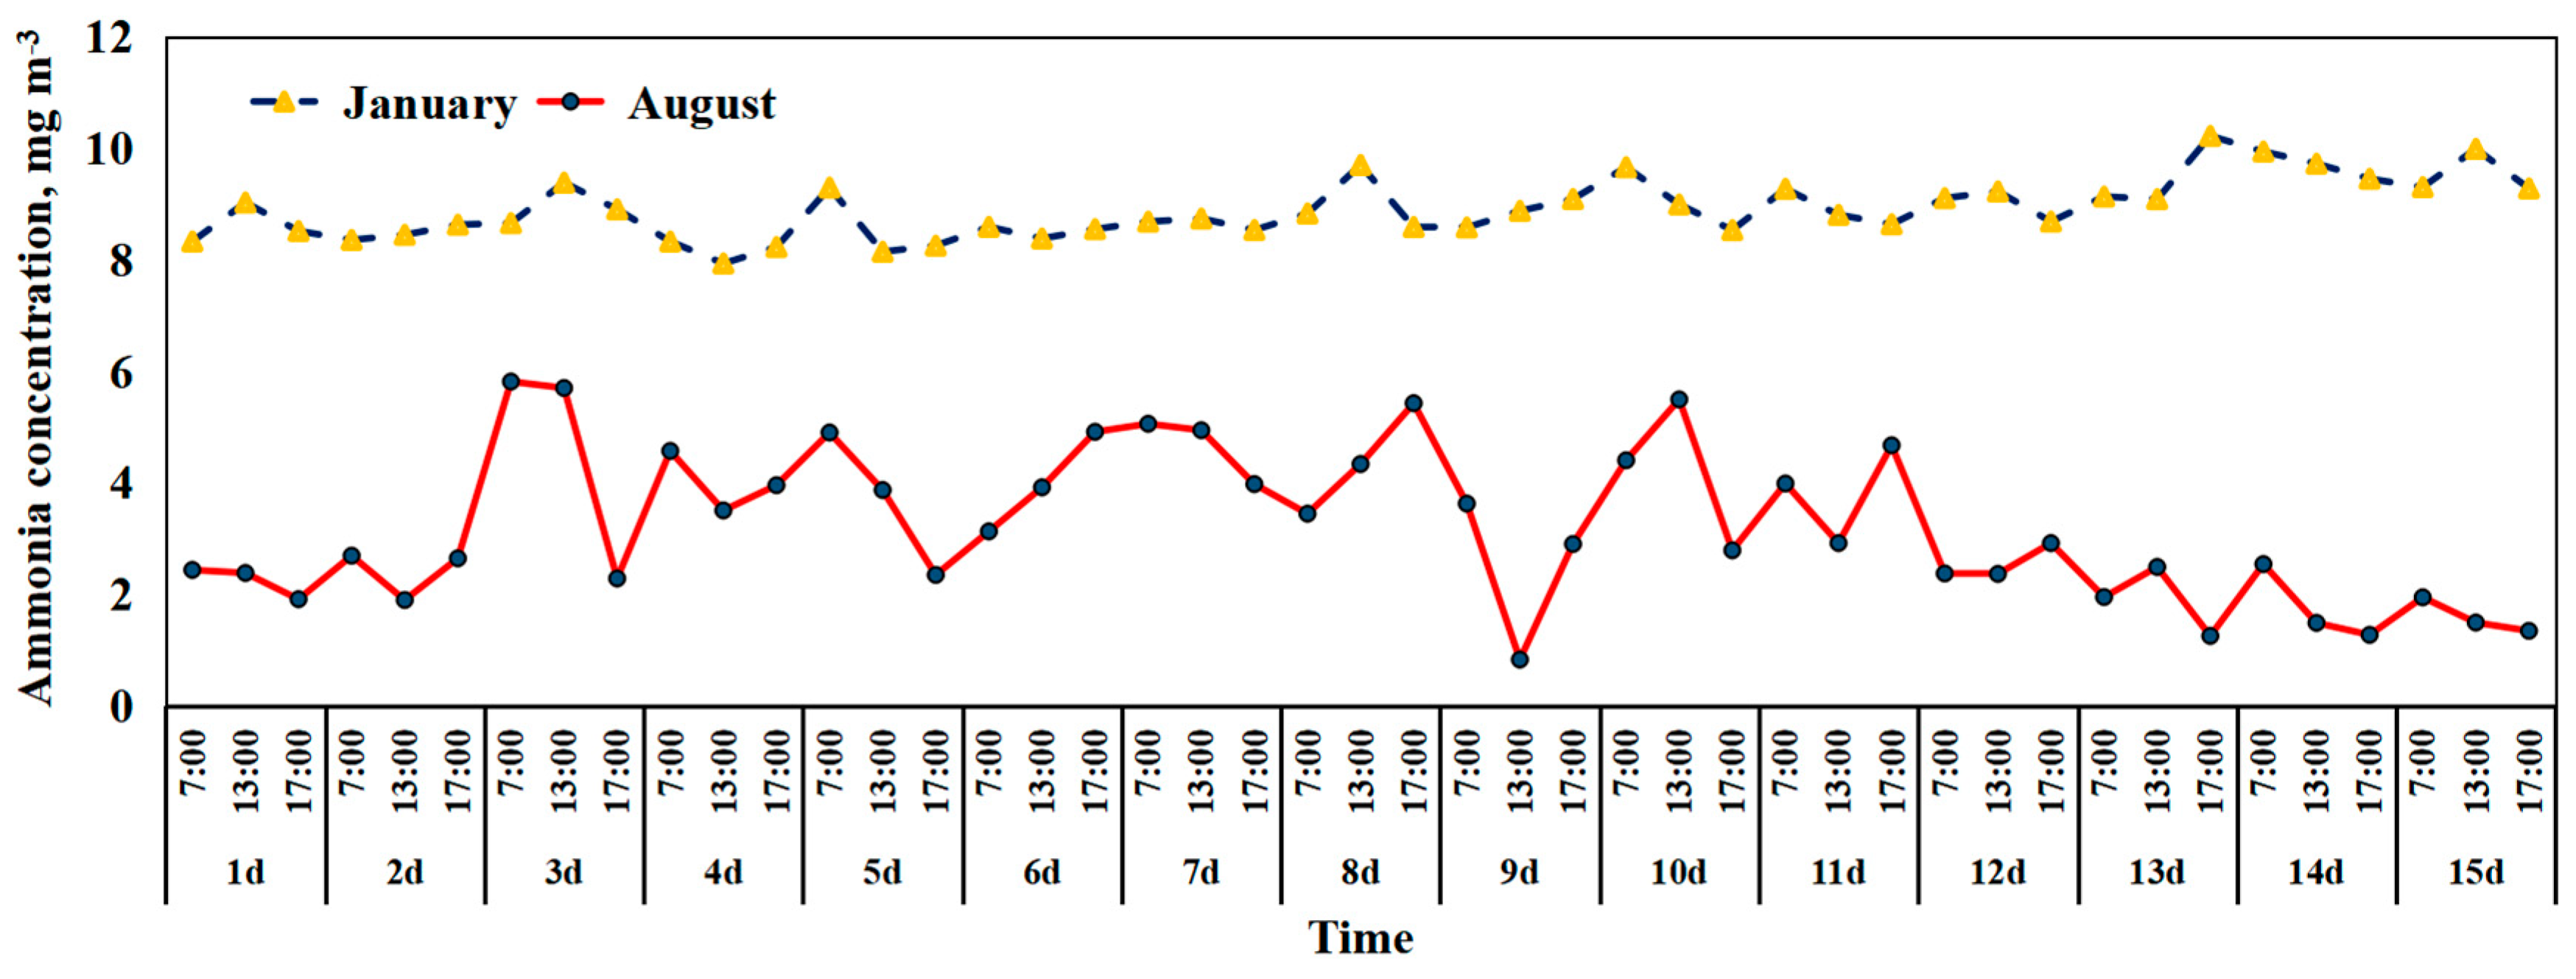
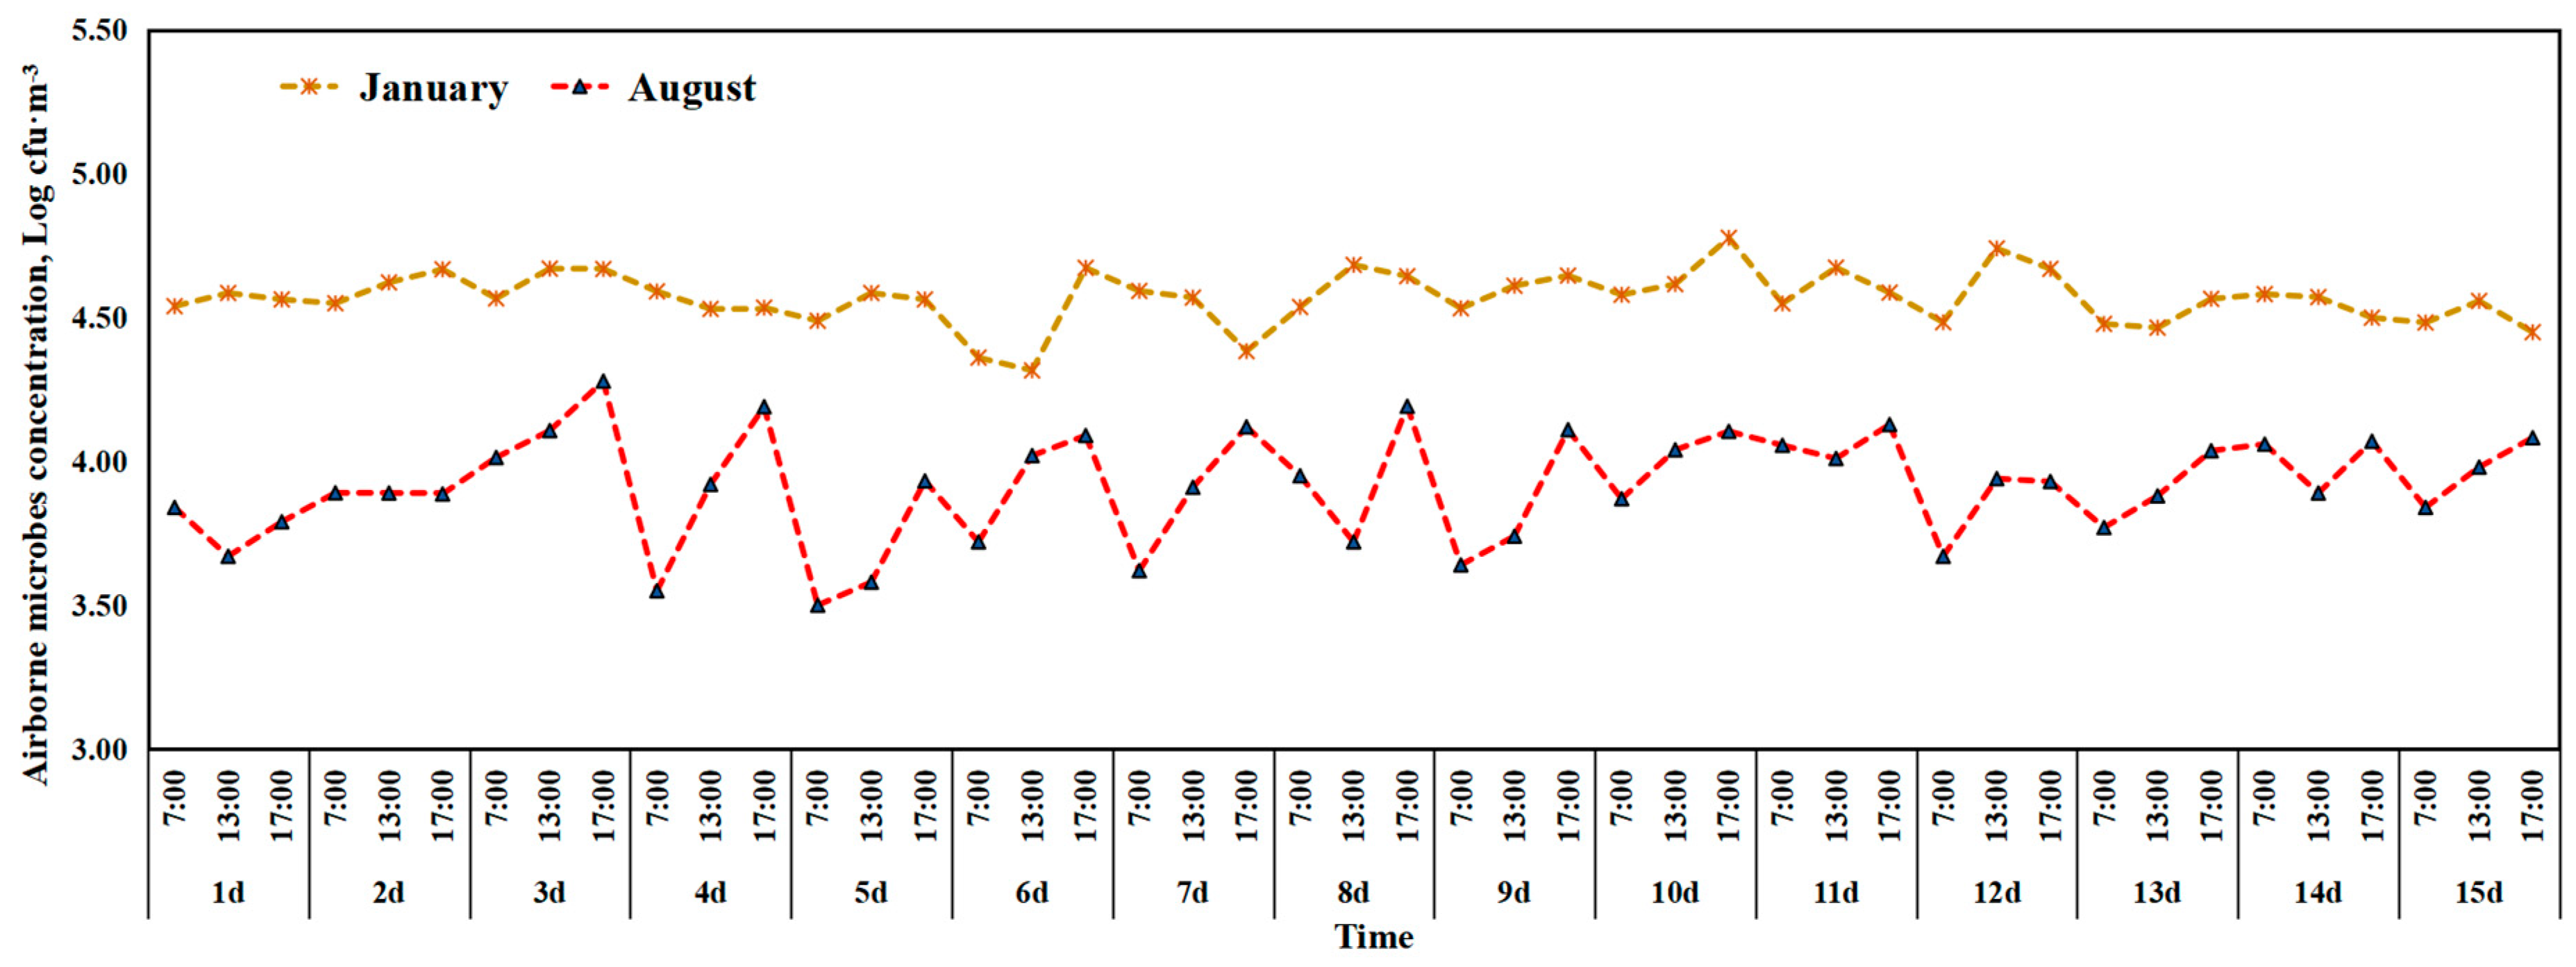
Table 3 summarizes the variables measured at the three different times of the day. The NH3 concentrations exhibited no significant variations among the three sampling times for both summer and winter measurements. Meanwhile, the TSP concentrations at 07:00 were the highest in both summer and winter measurements. During the summer, the 07:00 TSP concentration was significantly higher than the values at 13:00 and 17:00 (p ≤ 0.05), while, during winter, it was not significantly different from the 13:00 value but significantly higher than the 17:00 measurement. The total number of airborne microbial colonies exhibited no significant variation in the winter measurements, while the minimum was observed at 07:00, in which both the 07:00 and 13:00 airborne microbial colonies were significantly lower than that of the 17:00 values (p ≤ 0.05). Among the measurements of the three sampling time points, the lowest indoor temperature, during both summer and winter, occurred at 07:00; while the highest relative humidity was observed at 07:00 during summer, and there was no significant variation during winter.
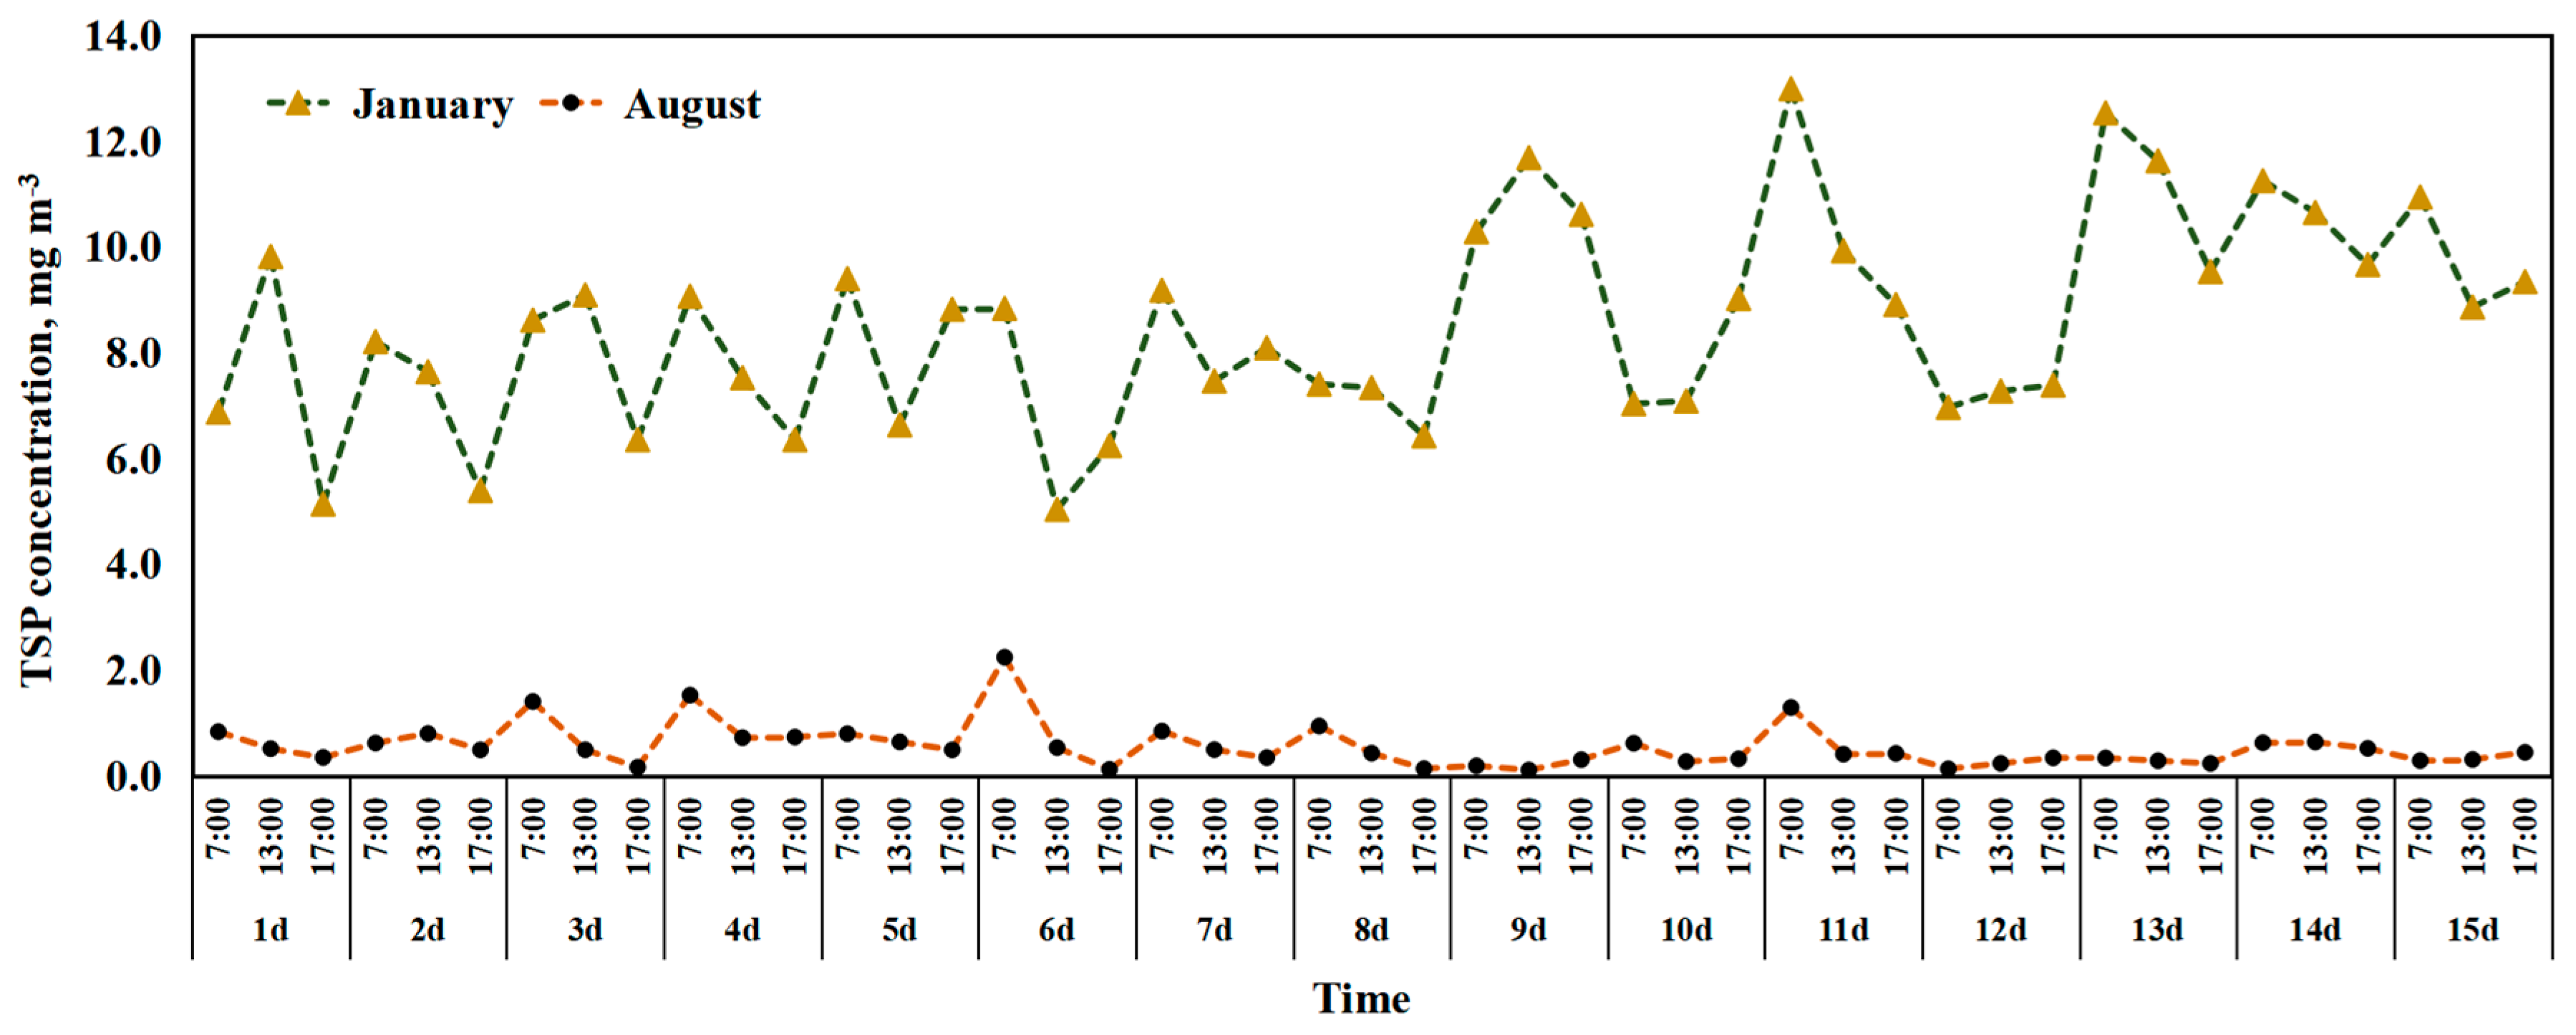
A unique relationship was observed between TSP concentration and the ventilation rate at the three sampling times (Figure 4, Figure 5 and Figure 6). Due to the relatively low ventilation rate (2.5 × 10⁵ m−3–3.5 × 10⁵ m−3 during summer with no fan being operated after 20:00 during winter) in the evening, concentrations of TSP appeared to have accumulated overnight, resulting in generally higher concentrations at 07:00 among the three sampling points, which was consistent with the results of other studies [35,36]. During summer, there was at least one fan operating continuously, and the full ventilation rate (13.2 × 10⁵ m−3–18.5 × 10⁵ m−3) was maintained during the daytime. Given the more abundant ventilation rate, there was a relatively small variation in the aerial pollutant concentrations during the summer, although there were some consistent differences between the 17:00 measurements vs. the earlier measurements.
During the winter, the pig-fattening house was relatively sealed, and there was much less ventilation, resulting in a relatively low variation in NH3 and airborne microorganism concentrations that were not significantly different (p > 0.05). This also suggests that the nonexistent or low ventilation provided during the wintertime was not effective for removing the aerial pollutants in the pig house, and that more ventilation was needed to improve the air quality, especially the PM level. The frequent removal of solid manure and daily flushing of the pens effectively maintained a low NH3 concentration in the pig house (Table 3). The lower indoor temperature and activity of the pigs during the evening helped to reduce significant NH3 accumulation overnight, even when there was no active ventilation provided during the evening (all ventilation was shut off daily 18:00–08:00).
A significant decrease in the TSP concentration was observed during summer (although still above the recommended 3 mg m−3 threshold) at 17:00 (p ≤ 0.05), which was likely related to the decreased activity and feeding behavior of pigs during the late afternoon. A previous study has shown a significant correlation between pig activity and TSP concentration in a large U.S. commercial pig house, based on one-minute means over a 24 h period [37]. Costa et al. also reported that PM10 concentrations increased from 316 to 624 mg/m3 with an increase in animal activity of 0.018 units (p < 0.001) [38]. Huang and Xu [39] reported that the peak TSP concentration occurred from 07:00 to 09:00, while the minimum was at 19:00. Li et al. [40] also performed long-term monitoring of the air quality in a closed pig house during winter and highlighted that the TSP concentration had a pronounced relationship with pig behavior. When the pigs were feeding or frightened, their activity increased, and the PM concentrations increased noticeably; when the pigs were resting, they were in a relatively quiet state, and the indoor PM concentration was relatively low. Therefore, in order to mitigate PM concentration in a piggery, it is necessary to maintain a comfortable and relatively tranquil environment for swine, reduce their stress, and, at the same time, provide them with liquid feedstuff (when possible).
3.4. Correlations of Meteorological Factors
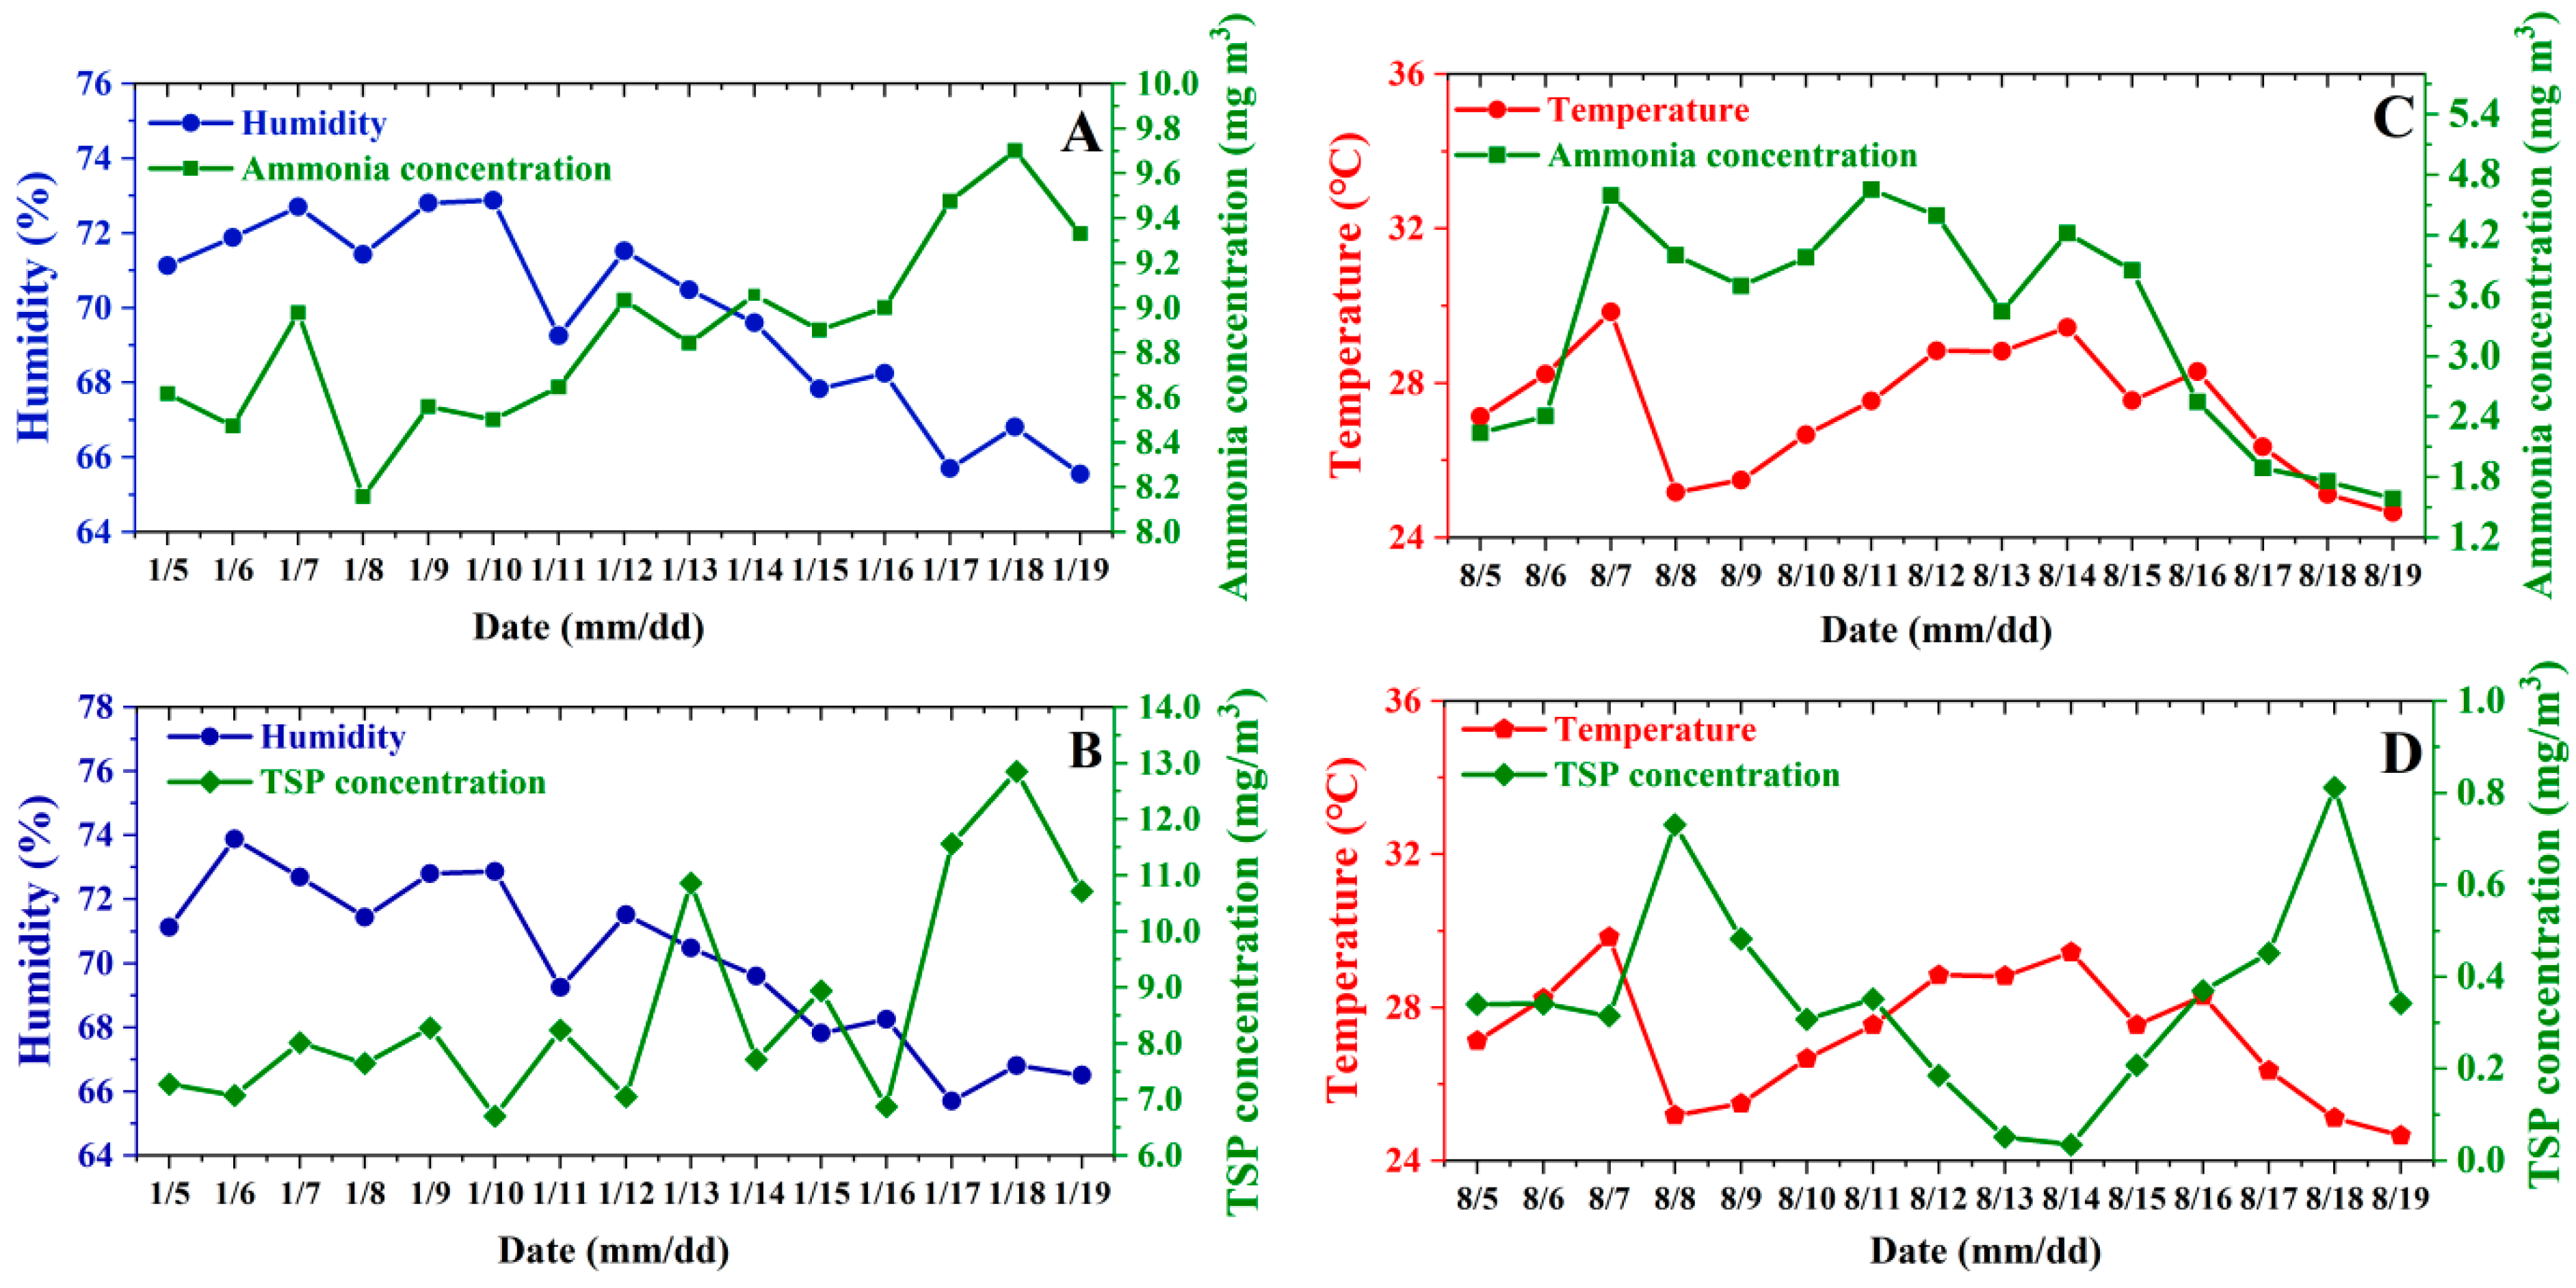
In this study, the correlation coefficients among aerial pollutant concentrations and the indoor environmental factors were determined using the PEARSON function. Table 4 presents the correlations between the concentrations and the environmental variables for both of the sampling seasons. The dynamic changes of aerial pollutants, temperature, and relative humidity are shown in Figure 7. The temperature and relative humidity during summer were positively correlated, while the temperature and humidity during winter were negatively correlated, agreeing with the typical local weather conditions. During the summer, the correlations between NH3 and TSP concentrations and temperature were highly significant (with correlation coefficients of 0.580 and −0.732, respectively). During the winter, the correlation of the measured aerial pollutants with relative humidity was highly significant. Concentrations of NH3 and TSP were negatively correlated with humidity (with correlation coefficients of −0.739 and −0.713, respectively), while the relationship between NH3 and temperature exhibited a highly significant correlation, with a correlation coefficient of 0.701. However, the total number of airborne microbial colonies did not exhibit a strong correlation with the measured variables during either summer or winter weeks.
In summary, the aerial pollutant concentrations were significantly correlated with indoor temperature and relative humidity while displaying significant variations between the two seasons. During summer, the NH3 concentration was positively correlated with temperature, while TSP was negatively correlated with temperature; during winter, NH3 concentration and TSP were negatively correlated with relative humidity. These findings are similar to those reported in previous studies conducted in pig production facilities [41,42]. Shen et al. [43] found that the concentration of NH3 in a chicken coop was correlated with temperature and relative humidity during different seasons. Under higher temperatures, the concentration of NH3 increases with relative humidity, while during lower temperatures, the concentration of NH3 decreases with increasing humidity. Studies [44,45] have pointed out that NH3 in a pigsty is mainly produced by the microbial decomposition of fecaluria, feed residue, and bedding (when used). Organic matter such as decomposed proteins and amino acids in feces produces ammonium via microbial decomposition and volatilizes to NH3 with increasing temperature. In addition, the nitrogen in urine is decomposed into NH3 under the action of urease, and the activity of urease increases with increasing temperature within the appropriate temperature range. Therefore, the NH3 concentration in a piggery will typically increase as the temperature rises. Ammonia is also a water-soluble substance that is easily decomposed and released from water. Hence, humidity change in a piggery exerts a specific influence on NH3 concentration [46,47].
Current publications have revealed that seasonal temperatures exert a direct impact on the PM concentration in the indoor environment of a pig house, with high temperatures allowing the feed powder, dung dust, and PM to be suspended in the air more easily [48,49,50], a phenomenon that is not consistent with the research results in this study. This may be because the excessive humidity in the Chongqing piggery causes the PM to attach onto the water vapor surface, thus, forming a liquid bridge, which increases the interparticle force. This would explain the occurrence of condensation and settling [51]. There have also been studies abroad on the connection between airborne bacteria and seasonal temperature and humidity, although the results have been inconsistent. Some researchers believe that the number of airborne microbes is positively correlated with temperature while being negatively correlated or not correlated with relative humidity [52,53]. Such correlations are primarily due to the differences in the climatic environment, the type of piggery, the manure management used, and the management level of the pig farm. According to the results of this study and the literature review [54], it is likely that the PM and NH3 concentrations can be mitigated by better managing the indoor environment, especially by improving and automating the temperature and ventilation control system. Systematic and long-term research is necessary, however, to confirm the effectiveness and practicality of such mitigation and training of the farmworkers. More intensive and longer-term monitoring, covering other seasons and hours of the day, as well as semi-continuous concentration and emission monitoring, are needed to provide a better understanding of the pig production specific to this region. The data collected in this research, however, helps to provide some insights into the regional pig houses and encourages more research in intensive animal farm air quality and emission monitoring and potential regulation research for the regions.
4. Conclusions
The summary and conclusions of this study are as follows:
- Aerial pollutants (NH3 and TSP) and the indoor environment were measured in a Southwestern China pig house. The aerial pollutant concentrations measured during winter were significantly higher than those during summer, most likely due to the lower ventilation rate during winter.
- There was a unique relationship between the aerial pollutants and ventilation rate at different hours. Due to the reduced ventilation rate at night, the aerial pollutant concentrations accumulated overnight in the piggery exhibited higher concentrations at 07:00 among the three sampling time points.
- The pollutant concentrations were significantly correlated with indoor temperature and relative humidity, evidently reflecting the seasonal differences.
- Currently, the challenges facing many pig farms in Southwestern China include relatively high concentrations of aerial pollutants. These issues stem from inconsistent manure management and barn ventilation control, and the fact that there are relatively high temperature and humidity levels in this region, which can contribute to PM aggregation, thus, accelerating the propagation of airborne microorganisms and ammonia volatilization. Therefore, increasing the ventilation exchange rate, combined with improved automation to maintain more consistent indoor temperature and humidity levels, is of great significance for improving the environment of pig farms in Southwestern China.
Highlights
- Concentrations of ammonia and particulate matter were measured in a Southwestern China pig-fattening house, during summer and winter weeks.
- Concentrations measured during winter were significantly higher than those during summer (p < 0.05), and the 07:00 measurements were the highest.
- The air quality of a pig house can be improved by utilizing more precise ventilation control, as observed by the correlation of concentrations with ventilation, indoor temperature, and humidity.
Author Contributions
Conceptualization, T.L.; Data curation, X.R.; Formal analysis, T.L.; Methodology, J.Z. and D.L.; Project administration, D.L.; Resources, J.Y.; Software, Y.Z.; Writing—review & editing, S.P. All authors have read and agreed to the published version of the manuscript.
Funding
This research was financially supported by the National Key Research and Development Program of China (2018YFD0800100), the International Cooperation Project of the Chongqing Financial Fund (19502), the earmarked fund for the Modern Agro-industry Technology Research System (CARS-35), and the Scientific Observation and Experiment Station of Livestock Equipment Engineering in Southwest China, Ministry of Agriculture and Rural Affairs.
Data Availability Statement
The data that support the findings of this study are available from the corresponding author, upon reasonable request.
Conflicts of Interest
The authors declare no conflict of interest.
References
- Knížatová, M.; Mihina, Š.; Brouček, J.; Karandušovská, I.; Mačuhová, J. Effect of the age and season of fattening period on carbon dioxide emissions from broiler housing. Czech. J. Anim. Sci. 2010, 55, 436–444. [Google Scholar]
- Mihina, Š.; Sauter, M.; Palkovicova, Z.; Karanduovská, I.; Broucek, J. Concentration of harmful gases in poultry and pig houses. Anim. Sci. Papers Rep. 2012, 30, 395–406. [Google Scholar]
- Rice, J.M.; Caldwell, D.F.; Humenik, F.J. (Eds.) Iowa State University Digital Repository. Available online: http://lib.dr.iastate.edu/abe_eng_pubs/361 (accessed on 8 January 2021).
- Kupper, T.; Bonjour, C.; Menzi, H. Evolution of farm and manure management and their influence on ammonia emissions from agriculture in Switzerland between 1990 and 2010. Atmos. Environ. 2015, 60, 215–221. [Google Scholar]
- World Health Organization. Ambient (Outdoor) Air Quality and Health. Available online: https://www.who.int/news-room/fact-sheets/detail/ambient-(outdoor)-air-quality-and-health (accessed on 8 January 2021).
- Pan, T.; Xue, N.T.; Sun, C.H.; Liu, G.; Li, S. Distribution Characteristics of Ammonia Emission from Livestock Farming Industry in Beijing. Environ. Sci. Technol. 2015, 38, 159–162. [Google Scholar]
- Yun, X.H.; Yuan, R. The 2019 China Animal Husbandry and Veterinary Yearbook, 1st ed.; China Agricultural Press: China, Beijing, 2019; pp. 1–20. [Google Scholar]
- Zhu, L.Y.; Lu, Q.P.; Zhang, H.F.; Meng, L.H.; Pang, M. Ammonia production, hazards and mitigation measures in a pig house. Chin. J. Anim. Nutr. 2015, 27, 2328–2334. [Google Scholar]
- Liu, J.W. Characteristics of airborne microorganism pollution in pig house. J. Anhui Agric. Sci. 2010, Z1, 41–44. [Google Scholar]
- Lai, H.T.L.; Nieuwland, M.G.B.; Aarnink, A.J.A.; Kemp, B.; Parmentier, H.K. Effects of 2 size classes of intratracheally administered airborne dust particles on primary and secondary specific antibody responses and body weight gain of broilers: A pilot study on the effects of naturally occurring dust. Poult. Sci. 2012, 91, 604. [Google Scholar]
- Behera, N.S.; Sharma, M.; Aneja, V.P.; Balasubramanian, R. Ammonia in the atmosphere: A review on emission sources, atmospheric chemistry and deposition on terrestrial bodies. Environ. Sci. Pollut. Res. 2013, 20, 8092–8131. [Google Scholar] [CrossRef]
- Zhang, J.; Li, C.; Tang, X.; Lu, Q.; Sa, R.; Zhang, H. Proteome changes in the small intestinal mucosa of broilers (Gallus gallus) induced by high concentrations of atmospheric ammonia. Proteome Sci. 2015, 13, 9. [Google Scholar] [CrossRef] [Green Version]
- Feng, M.; Qiu, Z.P.; Bai, L.L.; Tian, Y.U. Pollution prevention and control of large-scale livestock and poultry production in current Sichuan Province. Anim. Husb. Feed Sci. 2010, 31, 107–108. [Google Scholar]
- Wang, X.; Li, Z.; Wu, Y.; Liu, J.; Yu, L. Pollution and prevention countermeasures of livestock and poultry farms in Jilin Province. Environ. Sci. Manag. 2012, 37, 22–26. [Google Scholar]
- Su, C.W.; Li, Y.; Sun, Q.Y.; Guo, H.M.; Li, F.; Xia, C.D.; Wang, K. Effects of spraying microecological preparation on pathogenic microorganisms in pregnant sow house. Heilongjiang Anim. Sci. Vet. Med. 2017, 14, 60–62, 66. [Google Scholar]
- Zheng, F.; Cheng, B.; Li, Y.M.; Du, H.Y.; Zhang, A.; Xia, W. Diffusion Laws of odorous pollutants from dairy farms. J. Agro-Environ. Sci. 2010, 29, 1808–1813. [Google Scholar]
- Zhu, H.S.; Dong, H.M. Research progress of models for predicting ammonia emission in swine houses. Trans. Chin. Soc. Agric. Eng. 2006, S2, 187–192. [Google Scholar]
- Cambra-López, M.; Aarnink, A.J.A.; Zhao, Y.; Calvet, S.; Torres, A.G. Airborne particulate matter from livestock production systems: A review of an air pollution problem. Environ. Pollut. 2010, 158, 1–17. [Google Scholar] [CrossRef]
- Chai, L.L.; Kröbel, R.; Janzen, H.H.; Beauchemin, K.A.; Mcginn, S.M.; Bittman, S.; Dong, R.L. A regional mass balance model based on total ammoniacal nitrogen for estimating ammonia emissions from beef cattle in Alberta Canada. Atmos. Environ. 2014, 92, 292–302. [Google Scholar] [CrossRef]
- Cabrera, V.E.; Vries, A.D.; Hildebrand, P.E. Prediction of nitrogen excretion in dairy farms located in north Florida: A comparison of three models. J. Dairy Sci. 2006, 89, 1830–1841. [Google Scholar]
- Kim, K.Y.; Ko, H.J.; Kim, H.T.; Kim, Y.S.; Roh, Y.M.; Lee, C.M.; Kim, C.N. Quantification of ammonia and hydrogen sulfide emitted from pig buildings in Korea. Environ. Manag. 2008, 88, 195–202. [Google Scholar] [CrossRef]
- Xu, W.; Liu, X.J.; Meng, L.M.; Kun, Z. Dynamics and pollution features of ammonia and particulate matter during different pig breeding stages. J. Agro-Environ. Sci. 2018, 37, 1248–1254. [Google Scholar]
- Wang, Y.; Zhao, T.K.; Zou, G.Y.; Yang, J.F.; Tian, Z.; Li, X.R. Research statues of ammonia emission characteristics and mitigation technologies from livestock houses. Chin. J. Anim. Nutr. 2017, 12, 4249–4259. [Google Scholar]
- Philippe, F.X.; Cabaraux, J.F.; Nicks, B. Ammonia emissions from pig houses: Influencing factors and mitigation techniques. Agric. Ecosyst. Environ. 2011, 141, 245–260. [Google Scholar] [CrossRef]
- Liu, Y.; Shang, B.; Dong, H.M.; Tao, X.P.; Xu, W.Q.; Yang, P.Y. Ammonia production and emissions from a mechanically ventilated fattening swine confinement building. J. Agro-Environ. Sci. 2020, 39, 2058–2065. [Google Scholar]
- Li, K.T. Simulation of Interior and Exterior Environmental Air Quality of Pig Buildings Based on CFD. Master’s Thesis, Zhejiang University, Zhejiang, China, 2017. [Google Scholar]
- Wu, S.; Shen, D.; Tang, Q.; Dai, S.Y.; Li, Y.S.; Li, C.M. Distribution of particulate matters and noxious gases in large-scale semi-enclosed swine houses. Anim. Husb. Vet. Med. 2018, 50, 30–38. [Google Scholar]
- Kim, K.Y.; Han, J.K.; Lee, K.J.; Park, J.B.; Chi, N.K. Temporal and spatial distributions of aerial contaminants in an enclosed pig building in winter. Environ. Res. 2005, 99, 157. [Google Scholar] [CrossRef]
- Chen, J.B.; Wu, S.Y.; Wang, S.H.; Wu, M.H.; Yang, L.H.; Dong, C.G.; Liang, Y.C. Study on the correlation between air pollutants and respiratory diseases of pigs in large-scale pig farms in winter. Swine Prod. 2012, 6, 73–75. [Google Scholar]
- Yuan, W.; Chai, T.J.; Miao, Z.M.; Zhang, H.S.; Qin, M.; Zhou, Y.F.; Liu, D.Y. The seasonal changes and health risk assessment of airborne aerobic bacteria concentration in closed pig house. J. Northwest A F Univ. 2010, 38, 51–55. [Google Scholar]
- Zhong, Z.B.; Wang, N. The size distribution and health risk assessment of microbe bacterial aerosol in livestock and poultry house. Chin. Anim. Health Insp. 2014, 11, 101–105. [Google Scholar]
- Halloy, D.J.; Kirschvink, N.A.; Grégoire, L.V.; Hamoir, J.N.; Delvaux, F.H.; Gustin, P.G. Whole body barometric plethysmography: A screening method to investigate airway reactivity and acute lung injuries in freely moving pigs. Vet. J. 2004, 168, 276–284. [Google Scholar]
- Li, M.F.; Qi, J.H.; Zhang, H.D.; Huang, S.; Li, L.; Gao, D.M. Concentration and size distribution of bioaerosols in an outdoor environment in the Qingdao coastal region. Sci. Total Environ. 2011, 409, 3812–3819. [Google Scholar] [CrossRef]
- Yu, G.L.; Liu, J.Y.; Wang, Y.; Cai, Y.M.; Chai, T.J.; Gao, J. Influence of ambient microbial aerosol on stress and performance of meat ducks raised in sheds during winter. Chin. J. Anim. Nutr. 2015, 27, 3402–3410. [Google Scholar]
- Zhu, Z.P.; Dong, H.M.; Shang, B.; Kang, G.H.; Zhu, H.S.; Shi, Y. Measurement of ammonia and nitrous oxide concentrations and estimation of the emission rates from gestation pig buildings. Trans. Chin. Soc. Agric. Eng. 2006, 22, 175–178. [Google Scholar]
- Peng, H.F. Monitoring of the Environmental Parameter of Different Seasons and Different Type Pig Houses and the Effect on the Production Performance of Piglets. Master’s Thesis, Hebei University of Agriculture, Baoding, China, 2015. [Google Scholar]
- Heber, A.J.; Lim, T.T.; Ni, J.Q.; Tao, P.C.; Schmidt, A.M.; Koziel, J.A.; Hoff, S.J.; Jacobson, L.D.; Zhang, Y.H.; Baughman, G.B. Quality-assured measurements of animal building emissions: Particulate matter concentrations. Air Waste Manag. Assoc. 2006, 56, 1642–1648. [Google Scholar] [CrossRef] [PubMed] [Green Version]
- Costa, A.; Borgonovo, F.; Leroy, T.; Berckmans, D.; Guarino, M. Dust concentration variation in relation to animal activity in a pig barn. Biosyst. Eng. 2009, 104, 118–124. [Google Scholar] [CrossRef]
- Huang, Z.Y.; Xu, Z.W. Diurnal variation of airborne microorganism and dust concentration in winter piggery and effects of fresh air system on them. Hubei Agric. Sci. 2019, 58, 158–163. [Google Scholar]
- Li, Y.M.; Xu, Z.W.; Huang, Z.Y. Effects of fresh air system on air quality, piglet performance, blood biochemical and immune indexes of closed piggery in cold season. Chin. J. Anim. Sci. 2013, 49, 83–87. [Google Scholar]
- Wang, Z.W.; Wei, P.; Ao, C.L.; Li, R.F. Multiple linear regression analysis of micro-climate and environmental number of bacteria in pigsty. Mod. J. Anim. Husb. Vet. Med. 2009, 5, 59–62. [Google Scholar]
- Zhu, K.F.; Cao, J.; Liang, W.J.; Fan, Y.; Dai, Q.W. Correlation between ammonia concentration and environmental data in IoT pig houses. Jiangsu Agric. Sci. 2015, 43, 462–464. [Google Scholar]
- Shen, F.J.; Liu, X.L.; Zhang, K.Q. Analysis of NH3 concentration and its influencing factors in closed laying hens. Agric. Environ. Dev. 2019, 36, 221–226. [Google Scholar]
- Bao, X.Y.; Zhang, J.; Zhang, N.; Wang, T.Z.; Hao, R.R.; Li, Q.H. Study on the distribution law and influence factors of main harmful gases in winter’s farrowing house. J. Shanxi Agric. Sci. 2018, 46, 1019–1023. [Google Scholar]
- Sahrawat, K.L. Effects of temperature and moisture on urease activity in semi-arid tropical soils. Plant Soil. 1984, 78, 401–408. [Google Scholar] [CrossRef]
- Zhang, L.; Feng, J.; Han, J.; Xia, Z. Effect of temperature and humidity on ammonia concentration of laying hens in winter. Livest. Poult. Ind. 2019, 30, 1–5. [Google Scholar]
- Jia, S.T.; Chang, D.; Wang, S.; Liu, T.T.; Ye, K.P.; Liu, L.Q.; Zuo, C.; Peng, Z.H. Effect of relative humidity on formaldehyde and ammonia concentration in indoor air after decoration. Occup. Health 2005, 4, 482–483. [Google Scholar]
- Yang, K.L. Spatial and seasonal variation of PM10 mass concentrations in Taiwan. Atmos. Environ. 2002, 36, 3403–3411. [Google Scholar] [CrossRef]
- Charron, A.; Harrison, R.M.; Moorcroft, S.; Booker, J. Quantitative interpretation of divergence between PM10 and PM2.5 mass measurement by TEOM and gravimetric (Partisol) instruments. Atmos. Environ. 2004, 38, 415–423. [Google Scholar] [CrossRef]
- Joo, H.S.; Ndegwa, P.M.; Heber, A.J.; Ni, J.Q.; Bogan, B.W.; Ramirez-Dorronsoro, J.C.; Cortus, E.L. Particulate matter dynamics in naturally ventilated freestall dairy barns. Atmos. Environ. 2013, 69, 182–190. [Google Scholar] [CrossRef]
- Li, N. The Effect of Humidity on Dust Removal Performance of Different Properties. Master’s Thesis, Beijing University of Technology, Beijing, China, 2016. [Google Scholar]
- Dungan, R.S.; Leytem, A.B.; Bjorneberg, D.L. Concentrations of airborne endotoxin and microorganisms at a 10,000-cow open-freestall dairy. Anim. Sci. 2011, 89, 3300. [Google Scholar] [CrossRef] [Green Version]
- Hansen, A.; Bi, P.; Nitschke, M.; Pisaniello, D.; Ryan, P.; Sullivan, T.; Barnett, A.G. Particulate air pollution and cardiorespiratory hospital admissions in a temperate Australian city: A case-crossover analysis. Sci. Total Environ. 2012, 416, 48–52. [Google Scholar] [CrossRef]
- Lee, B.U.; Lee, G.; Heo, K.J. Concentration of culturable bioaerosols during winter. J. Aerosol. Sci. 2016, 94, 1–8. [Google Scholar] [CrossRef]
Figure 1.
Floor plan and locations of monitoring points in the pig house. A1, A2, and A3 are the locations of the total suspended particle (TSP) and ammonia (NH3) measurements, as well as atmospheric pressure monitoring; B1, B2, and B3 are the locations of the microbe sampling; and C1, C2, C3, C4, and C5 are the locations of the temperature and humidity monitoring.

Figure 2.
Two-channel air sampler.

Figure 3.
Ambient temperature and relative humidity (left) (a), and indoor temperature and relative humidity (right) (b,c), of the monitoring periods.
Figure 3.
Ambient temperature and relative humidity (left) (a), and indoor temperature and relative humidity (right) (b,c), of the monitoring periods.

Figure 4.
Ammonia concentration variations among different sampling times during winter and summer.

Figure 5.
Total suspended particles (TSP) concentration variations among different sampling times during winter and summer.
Figure 5.
Total suspended particles (TSP) concentration variations among different sampling times during winter and summer.

Figure 6.
Variations in the number of airborne microbes among different sampling times during winter and summer.
Figure 6.
Variations in the number of airborne microbes among different sampling times during winter and summer.

Figure 7.
Correlations of aerial pollutant concentration and relative humidity of the pig-fattening house during winter weeks (A,B) and summer weeks (C,D).
Figure 7.
Correlations of aerial pollutant concentration and relative humidity of the pig-fattening house during winter weeks (A,B) and summer weeks (C,D).


Table 1.
Operation and estimated ventilation rate of the fans and cooling pads.
| Season | Ventilation Operation and Hours | Ventilation Rate (m3 h−1) | |
|---|---|---|---|
| Ventilation Settings | Hours | ||
| Summer | Two 1.25 m and 1.0 m wall fans, and two cooling pads | 08:00–20:00 | 11.0 × 10⁴–15.4 × 10⁴ |
| One 1.0 m wall fan | 00:00–08:00, and 20:00–24:00 | 2.5 × 10⁴–3.5 × 10⁴ | |
| Winter | One 1.0 m wall fan | 08:00–20:00 | 2.5 × 10⁴–3.5 × 10⁴ |
Table 2.
Summary of measurement variables during summer and winter weeks.
| Measurement | Summer | Winter |
|---|---|---|
| NH3 (mg m−3) | 3.22 b ± 0.20 | 8.89 a ± 0.08 |
| TSP (mg m−3) | 0.55 b ± 0.06 | 8.50 a ± 0.29 |
| Airborne microbes (Log cfu·m−3) | 3.91 b ± 0.19 | 4.57 a ± 0.09 |
Note: Different superscript letters of figures in the same row represent significant variation (p < 0.05), while the same letter represents insignificant variation (p > 0.05).
Table 3.
Summary of measurements at different sampling times during summer and winter weeks.
| Season | Time (hh:mm) | NH3 (mg m−3) | TSP (mg m−3) | Airborne Microbes (log cfu m−3) | Temperature (°C) | Humidity (%) |
|---|---|---|---|---|---|---|
| Summer | 07:00 | 3.52 a ± 0.32 | 0.88 a ± 0.57 | 3.80 a ± 0.18 | 26.03 b ± 1.13 | 86.82 a ± 3.34 |
| 13:00 | 3.17 a ± 0.39 | 0.42 b ± 0.22 | 3.89 a ± 0.15 | 28.76 a ± 2.81 | 80.67 b ± 8.27 | |
| 17:00 | 2.97 b ± 0.35 | 0.34 b ± 0.15 | 4.06 b ± 0.13 | 29.28 a ± 2.22 | 82.45 b ± 6.19 | |
| Winter | 07:00 | 8.93 a ± 0.13 | 9.31 a ± 0.51 | 4.53 a ± 0.06 | 16.37 b ± 0.75 | 70.90 a ± 1.93 |
| 13:00 | 8.96 a ± 0.15 | 8.51 a ± 0.50 | 4.58 a ± 0.10 | 18.18 a ± 1.14 | 68.90 a ± 3.80 | |
| 17:00 | 8.80 a ± 0.13 | 7.81 b ± 0.45 | 4.59 a ± 0.10 | 18.43 a ± 0.82 | 70.10 a ± 3.90 |
Note: Different superscript letters of figures in the same column represent significant variation (p ≤ 0.05), while the same letter represents no significant variation (p > 0.05).
Table 4.
Correlation coefficients between air pollutant concentrations and indoor environmental variables during summer and winter.
Table 4.
Correlation coefficients between air pollutant concentrations and indoor environmental variables during summer and winter.
| Season | Winter Parameter | Relative Humidity | Temperature | NH3 | TSP | Airborne Microbes |
|---|---|---|---|---|---|---|
| Winter | Relative humidity | 1 | 0.539 * | −0.739 ** | −0.713 ** | 0.007 |
| Temperature | 1 | 0.701 ** | 0.456 | 0.040 | ||
| NH3 | 1 | 0.724 | 0.018 | |||
| TSP | 1 | 0.118 | ||||
| Airborne microbes | 1 | |||||
| Summer | Relative humidity | 1 | −0.594 * | -0.102 | 0.459 | −0.344 |
| Temperature | 1 | 0.580 * | −0.732 ** | 0.270 | ||
| NH3 | 1 | 0.226 | −0.094 | |||
| TSP | 1 | −0.116 | ||||
| Airborne microbes | 1 |
Note: The * superscript of figures in the same row represents significant variation (p < 0.05); ** represents highly significant variation (p < 0.01).
Publisher’s Note: MDPI stays neutral with regard to jurisdictional claims in published maps and institutional affiliations. |
© 2021 by the authors. Licensee MDPI, Basel, Switzerland. This article is an open access article distributed under the terms and conditions of the Creative Commons Attribution (CC BY) license (http://creativecommons.org/licenses/by/4.0/).
Share and Cite
MDPI and ACS Style
Pu, S.; Rong, X.; Zhu, J.; Zeng, Y.; Yue, J.; Lim, T.; Long, D. Short-Term Aerial Pollutant Concentrations in a Southwestern China Pig-Fattening House. Atmosphere 2021, 12, 103. https://doi.org/10.3390/atmos12010103
AMA Style
Pu S, Rong X, Zhu J, Zeng Y, Yue J, Lim T, Long D. Short-Term Aerial Pollutant Concentrations in a Southwestern China Pig-Fattening House. Atmosphere. 2021; 12(1):103. https://doi.org/10.3390/atmos12010103
Chicago/Turabian StylePu, Shihua, Xiao Rong, Jiaming Zhu, Yaqiong Zeng, Jian Yue, TengTeeh Lim, and Dingbiao Long. 2021. "Short-Term Aerial Pollutant Concentrations in a Southwestern China Pig-Fattening House" Atmosphere 12, no. 1: 103. https://doi.org/10.3390/atmos12010103
Note that from the first issue of 2016, this journal uses article numbers instead of page numbers. See further details here.