


Introduction and state of the art
In the field of Egyptology, the most complete and detailed method of recording epigraphy has been outlined by the Epigraphic Survey of the Oriental Institute of Chicago. Based on an ever-evolving combination of handmade drawings, hardware and software, it produces extremely refined line drawings, able to convey a large amount of information thanks to precise graphic standards (Vertés & the Epigraphic Survey Reference Vertés2014). In parallel, researchers have, in recent years, begun to investigate how to extract line drawings from 3D models (DeCarlo et al. Reference DeCarlo, Finkelstein, Rusinkiewicz and Santella2003; DeCarlo & Rusinkiewicz Reference DeCarlo and Rusinkiewicz2007; Ohtake et al. Reference Ohtake, Belyaev and Seidel2004; Rusinkiewicz et al. Reference Rusinkiewicz, Burns and DeCarlo2006, Reference Rusinkiewicz, Cole, DeCarlo and Finkelstein2008; Judd et al. Reference Judd, Durand and Adelson2007), including some experiments in the epigraphic field (Kolomenkin et al. Reference Kolomenkin, Shimshoni and Tal2013; Tokovinine & Fash Reference Tokovinine and Fash2014; Berkiten et al. Reference Berkiten, Fan and Rusinkiewicz2015; Carrero-Pazos & Espinosa-Espinosa Reference Carrero-Pazos and Espinosa-Espinosa2018). In an attempt to bridge these two approaches, we present the results of our investigation into the best combination of tools to automatically achieve computer-generated line drawings that would be, at the same time, directly based on the 3D geometry of the reliefs, and useful for subsequent epigraphic studies, especially monitoring erosion.
Methodology
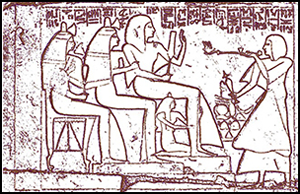
We applied non-photorealistic rendering techniques (Rusinkiewicz et al. Reference Rusinkiewicz, Cole, DeCarlo and Finkelstein2008) to the 3D models of a selection of reliefs from the tomb of Meryneith (Saqqara, Egypt) using real-time suggestive contours (RTSC) software (https://gfx.cs.princeton.edu/proj/sugcon), which collects all the basic algorithms commonly used to extract shapes from 3D surfaces in the fields of engineering and gaming (Figure 1).
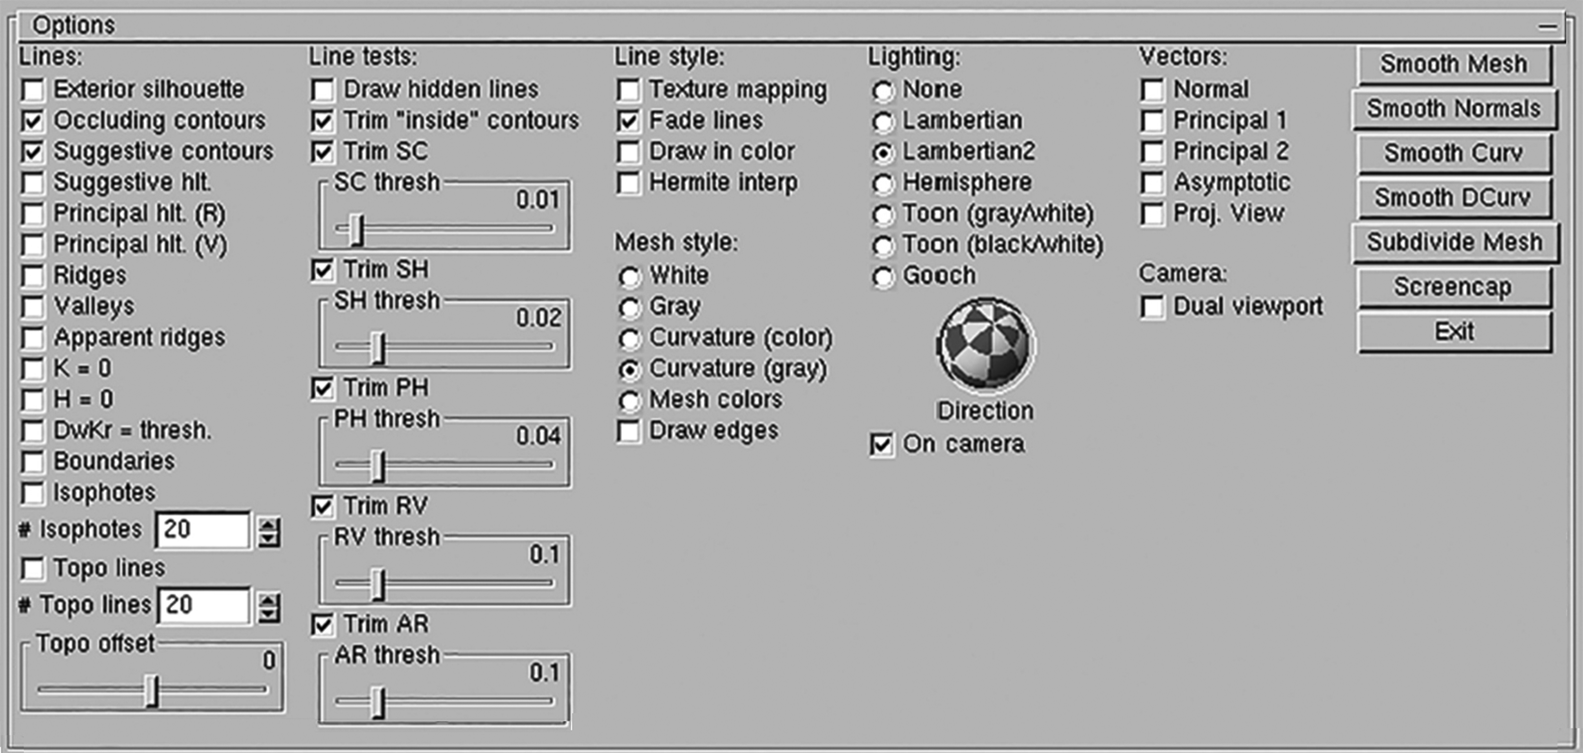
Figure 1. RTSC software options panel. Screenshot by Francesca Lori. Software developed by A. Finkelstein, S. Rusinkiewicz, M. Burns, J. Klawe, D. DeCarlo, A. Santella. All the RTSC files are distributed under the GNU General Public Licence.
We tested the software on different reliefs from the tomb (Figure 2): a well-preserved sunken relief (R22-23-24, Figure 3A), a partly eroded sunken relief (R32, Figure 3B) and a rather faded raised relief (R14, Figure 3C). The images were all surveyed in 3D employing photogrammetry, using a Canon EOS 5D reflex camera, without flash, ISO 100, f8 settings and 35mm focal distance, and aligned using Agisoft Metashape software. We proceeded to test them all using the RTSC filters in order to identify which combination would produce a clearer result.
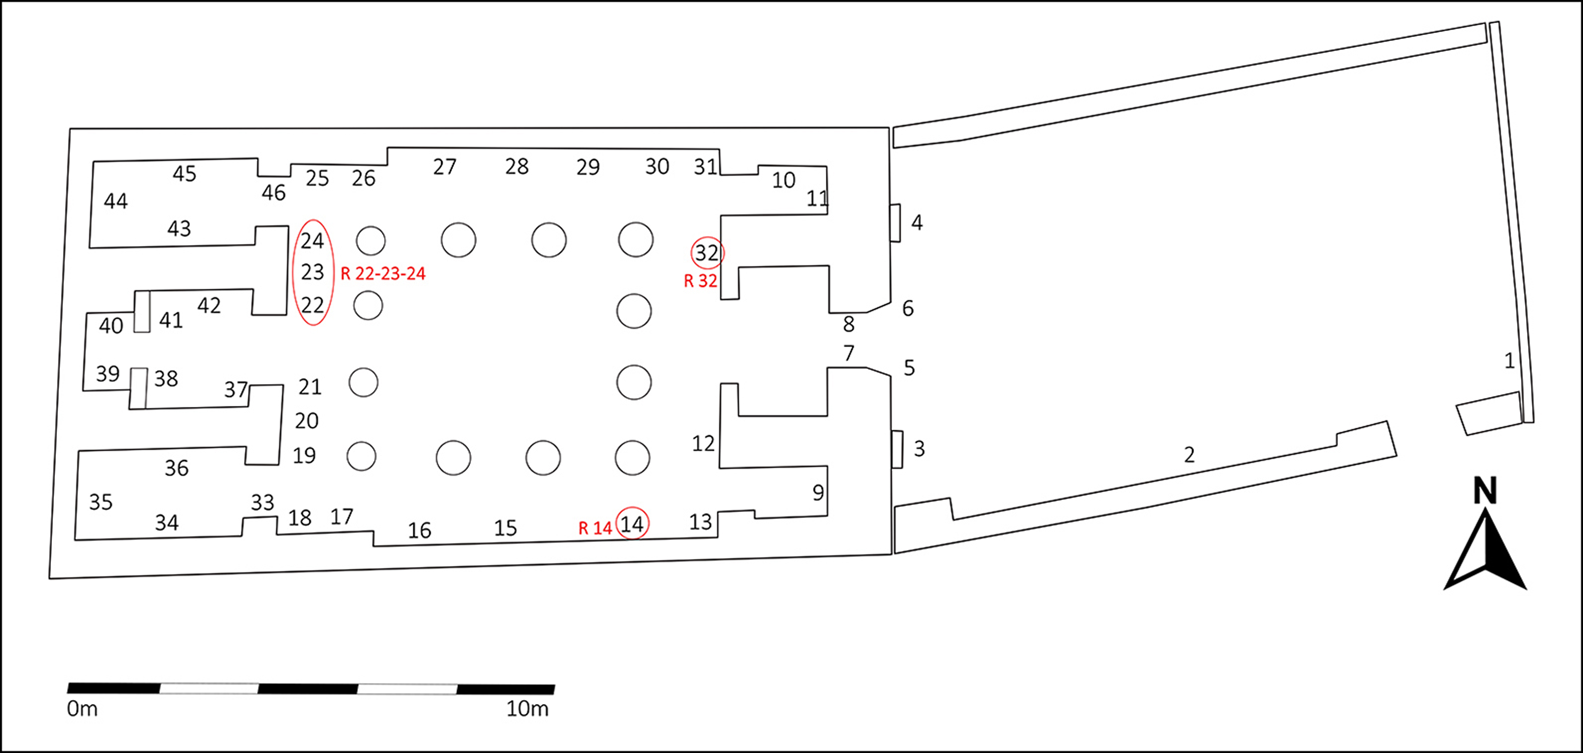
Figure 2. Plan of the tomb of Meryneith, showing the position of all of the reliefs; the circled numbers indicate reliefs analysed in this paper. Plan redrawn by Francesca Lori based on a photograph from the book The Tomb of Meryneith at Saqqara (M.J. Raven & R. van Walsem; Chapter 3: The Architecture, fig.III.3).
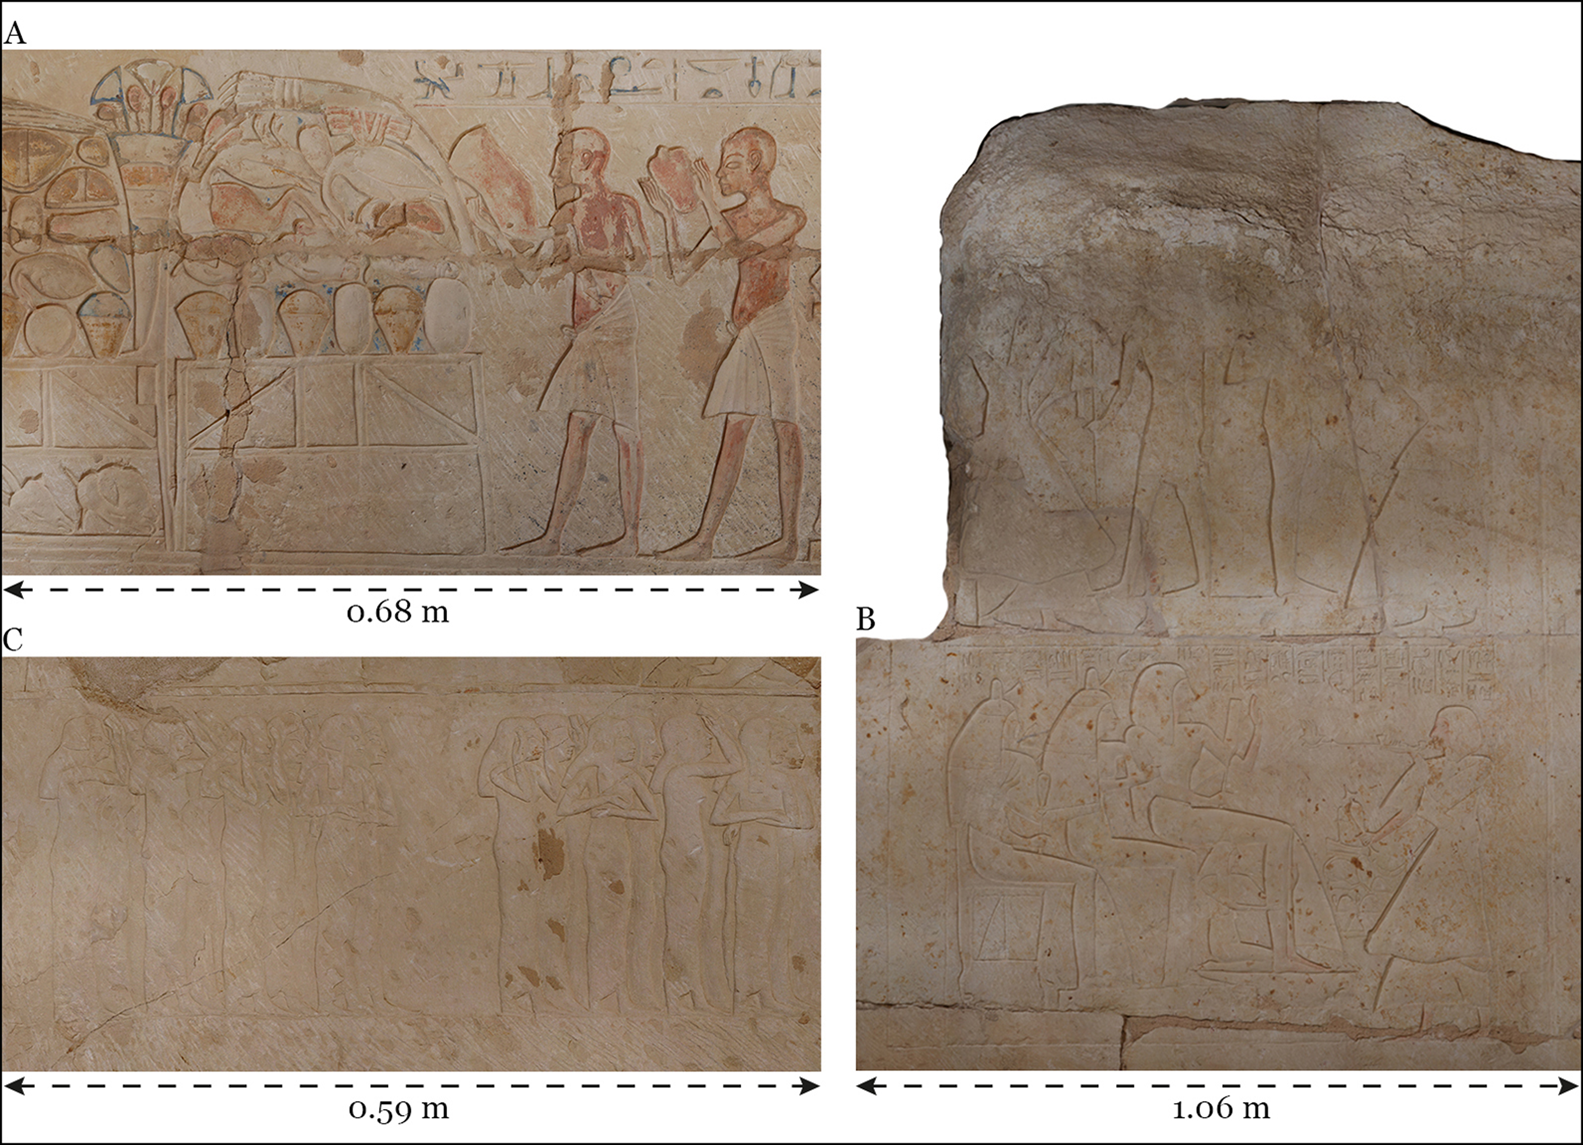
Figure 3. A) Orthophotograph of a detail of R22-23-24; B) orthophotograph of a detail of R32; C) orthophotograph of a detail of R14. Photographs by Francesco Fassi, Alessandro Mandelli and Luca Perfetti (3D Survey Group, Politecnico di Milano). Orthophotographs courtesy of the Turin-Leiden mission to Saqqara (Museo Egizio, Torino and Rijksmuseum van Oudheden, Leiden).
Results
Our tests measured ‘ridges’, which correspond to the points where the surface bends sharply from top to bottom (shown in blue in Figures 4–6A), and ‘valleys’, the points at which the surface bends sharply from bottom to top (shown in brown in Figures 4–6A). According to our results, ridges are fundamental in revealing details such as the folds of the skirts of R22-23-24, while valleys best reveal the outline of both sunken and raised reliefs. In general, varying the threshold settings can be useful to highlight or tone down some elements (e.g. the higher the threshold, the lower the background noise). The combination of ridges and valleys is very useful in visualising the angle of the engravings (the longer the distance, the lower the slope), but can also generate rather confusing line drawings (Figures 4–6A).
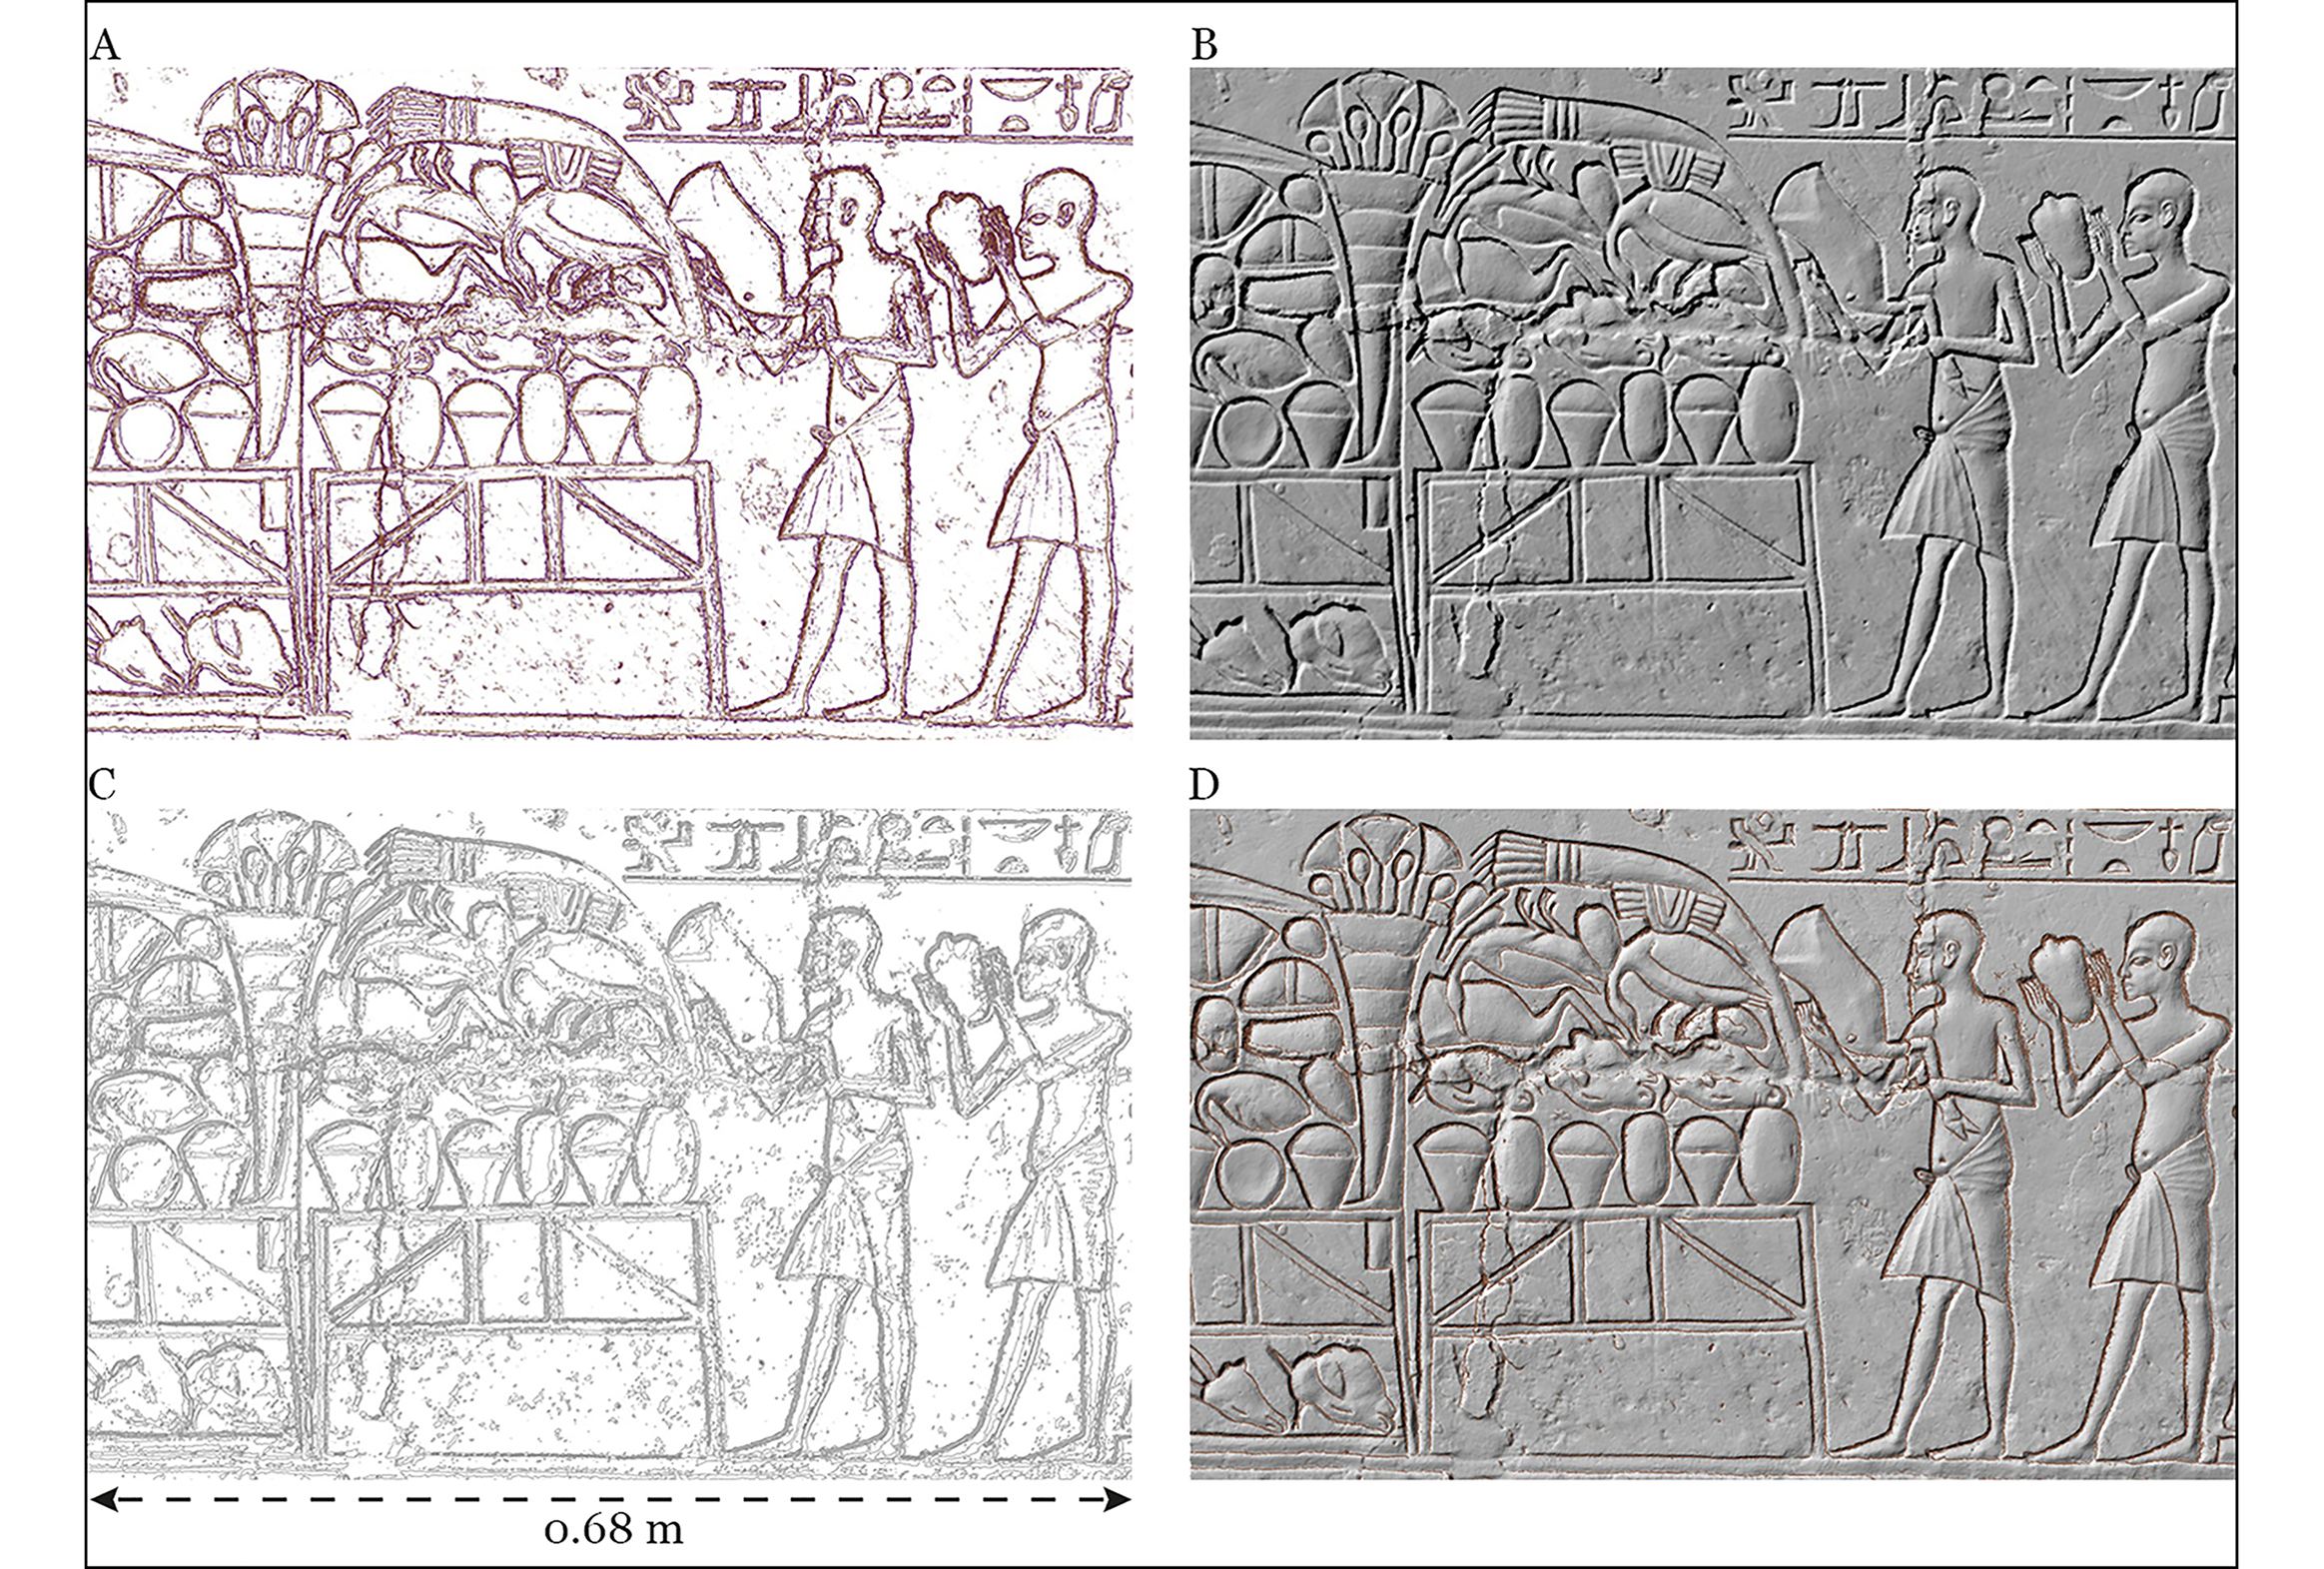
Figure 4. Detail of R22-23-24 (sunken relief): A) ridges shown in blue, and valleys in brown (threshold: 0.138; B) with Lambertian lighting from 45° upper left; C) isophotes drawing (density: 4); D) 3D CoDe: Lambertian lighting from 45° upper left and valleys shown. Image by Francesca Lori; 3D models optimisation by Politecnico di Milano; 3D models courtesy of the Turin-Leiden mission to Saqqara (Museo Egizio, Torino and Rijksmuseum van Oudheden, Leiden).
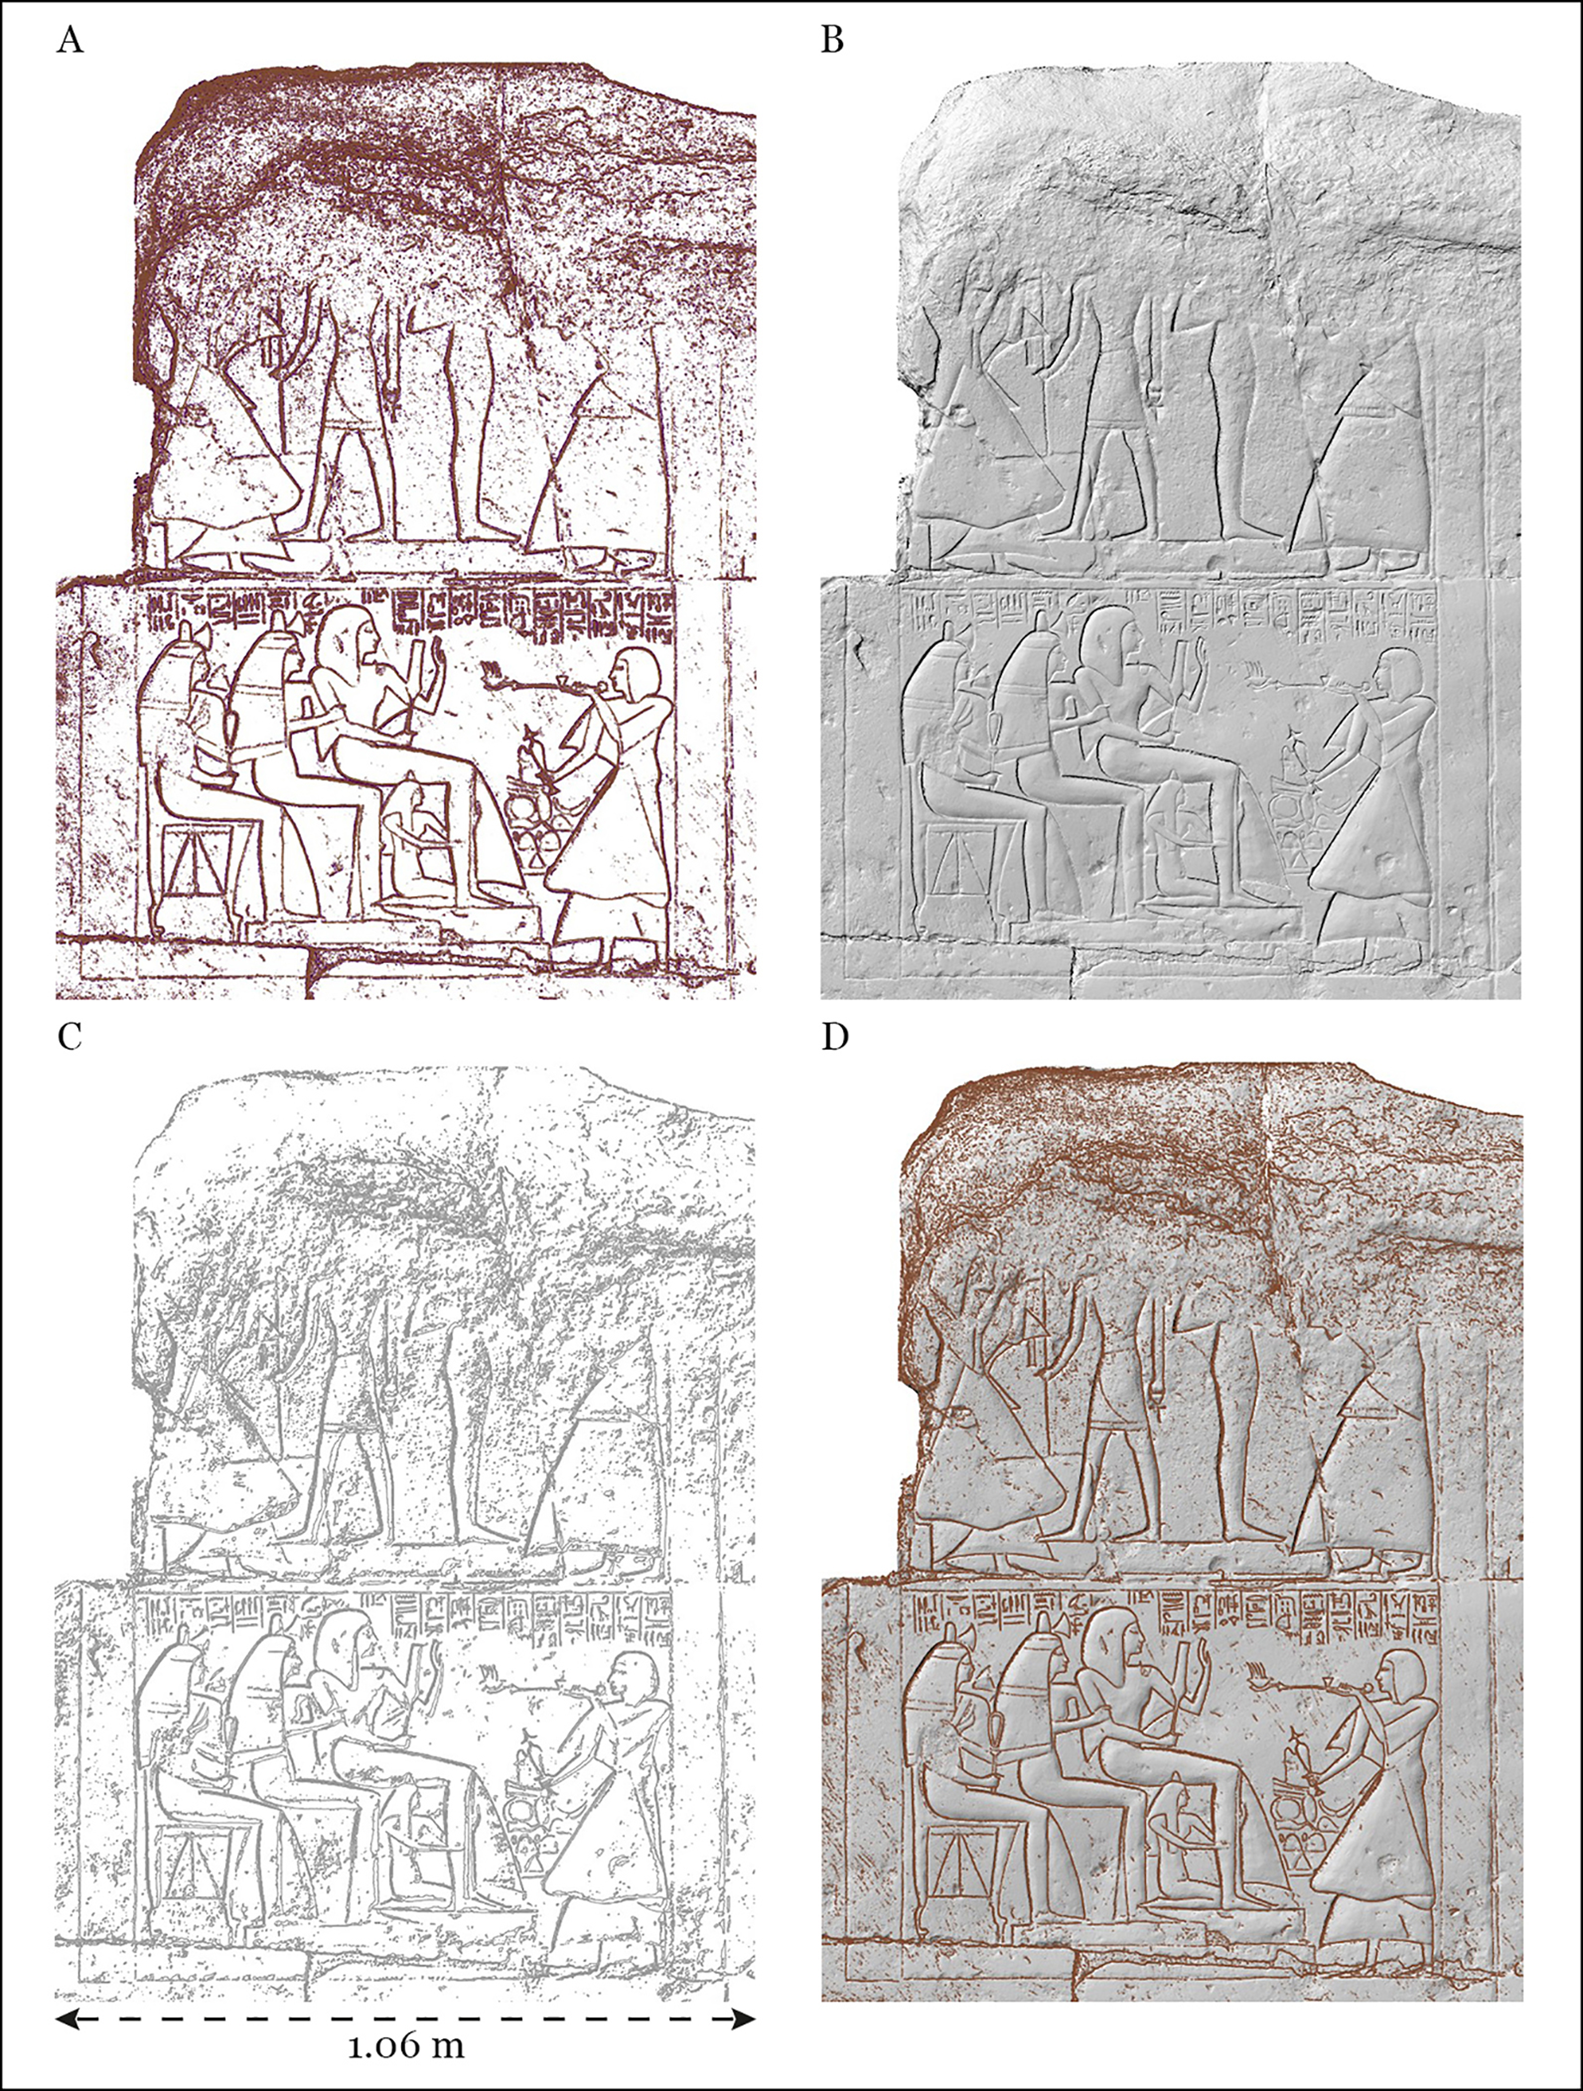
Figure 5. Detail of R32 sunken relief: A) ridges shown in blue and valleys in brown (threshold: 0.174); B) with Lambertian lighting from 45° upper left; C) isophotes drawing (density: 3); D) 3D CoDe: Lambertian lighting from 45° upper left and valleys shown. Image by Francesca Lori; 3D models optimisation by Politecnico di Milano; 3D models courtesy of the Turin-Leiden mission to Saqqara (Museo Egizio, Torino and Rijksmuseum van Oudheden, Leiden).
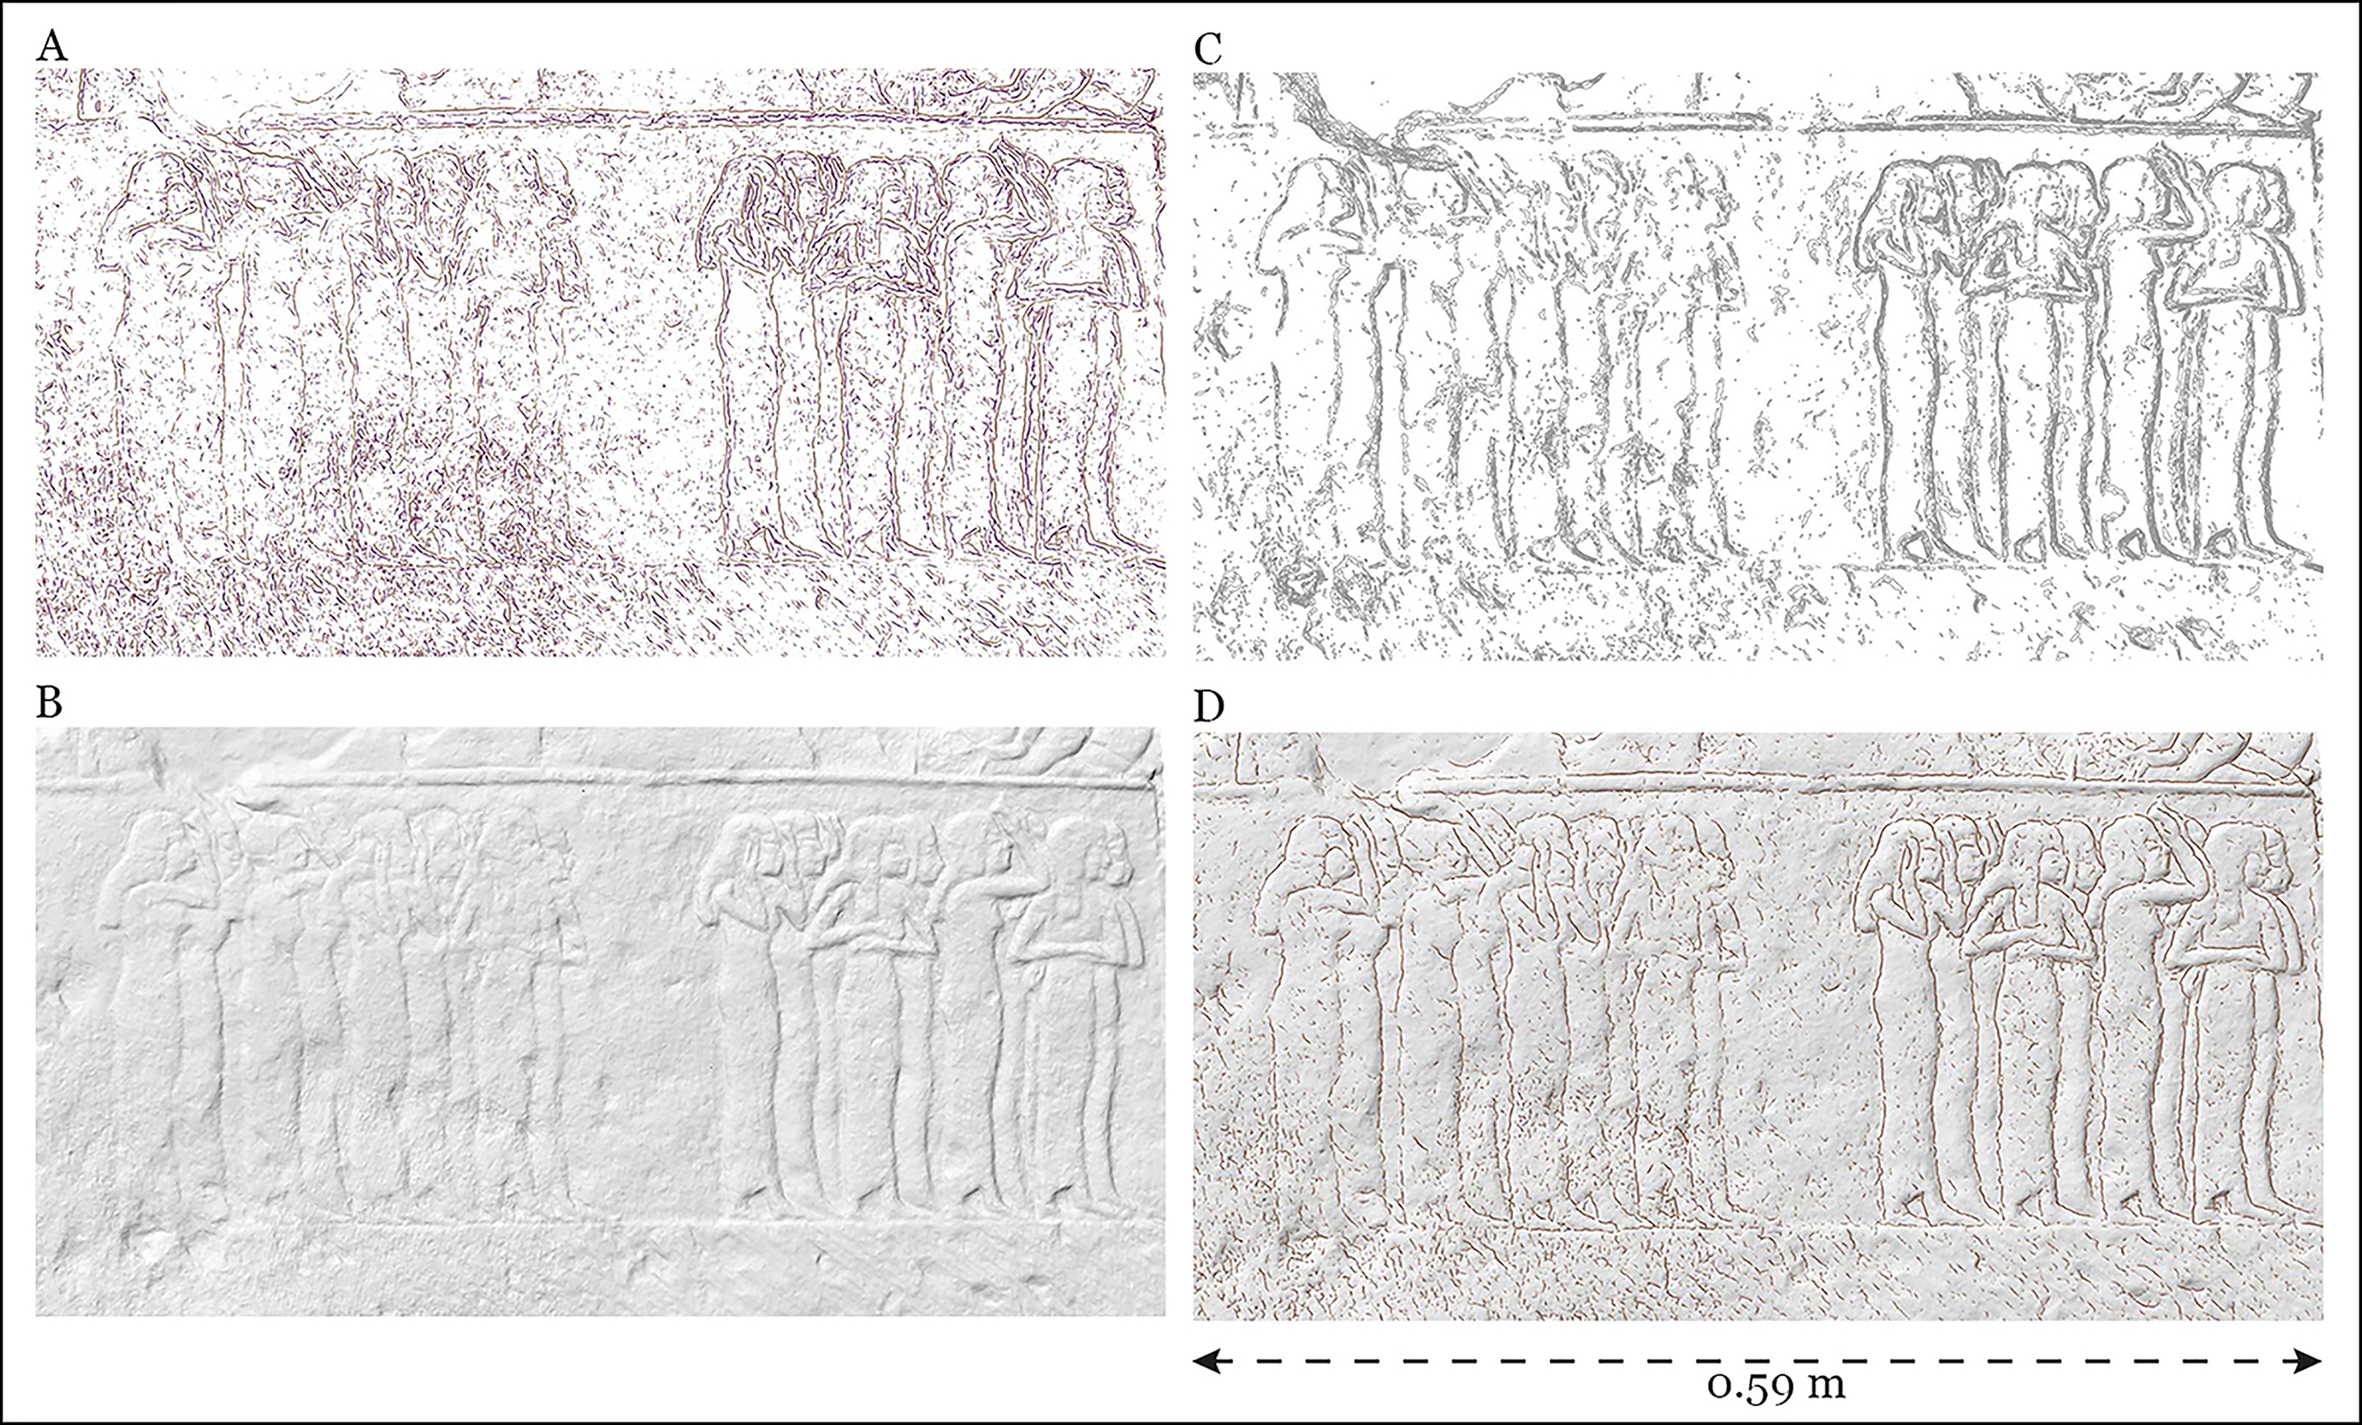
Figure 6. Detail of R14 raised relief: A) ridges shown in blue and valleys in brown (threshold: 0.1); B) with Lambertian lighting from 45° upper left; C) isophotes drawing (density: 44); D) 3D CoDe: Lambertian lighting from 45° upper left and valleys shown. Image by Francesca Lori. 3D models optimisation by Politecnico di Milano; 3D models courtesy of the Turin-Leiden mission to Saqqara (Museo Egizio, Torino and Rijksmuseum van Oudheden, Leiden).
The use of the Lambertian lighting function proved to be particularly interesting. In general, as radiance scaling and ambient occlusion demonstrate, artificial lighting can be useful to analyse extremely faded or damaged reliefs (as the upper part of R32). In particular, as the standard convention in the representation of reliefs places the hypothetical sun always coming from the upper-left corner at 45°, we set the light as coming by default from that direction (as shown in Figures 4–6B).
The RTSC software can also draw isophotes, curves connecting points of equal brightness (Figures 4–6C). The resulting images convey a very effective description of the geometry of the surfaces; however, as they already consist of a large number of lines, if combined with valley and/or ridges, they generate a wealth of information that is detrimental to a detailed study of the figures.
Conclusions
In order to automatically obtain a line drawing directly based on the 3D geometry of the reliefs that can be used as a basis by epigraphists, the most efficient among the available tools appears to be the combination of Lambertian light and valley contours offered by RTSC (Figures 4–6D). The advantage of this combination is the clarity of the resulting image; an additional benefit is its ability to reveal damaged or worn engravings (such as R32 and R14).
Isophotes can be useful, in parallel, to highlight faded reliefs by increasing the number of lines (as used on R14) and, subsequently, to monitor the degradation of the surface over time: repeated surveys might reveal a reduction of the perimeter of the ‘islands’ of points characterised by the same brightness, caused by progressive erosion.
We have named the procedure described here 3D contour detection (3D CoDe). It can be successfully used in its current form to achieve the results described above. As the mathematical algorithms applied by RTSC are designed to extract shapes from 3D objects, the procedure could be considerably improved if developed specifically for epigraphy, which is usually perpendicular to a flat surface and therefore could use a streamlined algorithm compared with those necessary for 3D complex objects. Another interesting research direction would be to focus on the potential of light and shadow rendering or using comparison between isophotes and meshes to monitor progressive erosion.
In general, 3D CoDe may support the work of archaeologists and epigraphists by providing a filter able to generate a representation that would be readable, geometrically correct and aligned to the basic epigraphic standards.
Acknowledgements
Thanks to Christian Greco, Co-Director of the joint Turin-Leiden mission to Saqqara (Museo Egizio, Torino and Rijksmuseum van Oudheden, Leiden), who suggested an investigation in this direction. Thanks to Lara Weiss, Co-Director of the mission, and to Szymon Rusinkiewicz for their support. The survey of the reliefs was the work of Francesco Fassi, Alessandro Mandelli and Luca Perfetti (3D Survey Group, Politecnico di Milano); the elaboration of the 3D models was undertaken by Simone Galli (Politecnico di Milano).
Funding statement
The research illustrated in this article is part of the project LIFE (‘Living in a Fringe Environment’), funded by the European Research Council under the European Union's Horizon 2020 research and innovation programme (grant agreement 681673).


