The Impact Study of El Niño-Southern Oscillation to the Wind and Solar Data in Malaysia Using the Wavelet Analysis
 Aliashim Albani*
  Mohd Zamri Ibrahim Siti Syazwani Abdul Ghani Muhammad Zulkifli Mat Rofi Puteri Nurfarah Adawiyah Taslin
- Renewable Energy and Power Research Interest Group (REPRIG), Eastern Corridor Renewable Energy (ECRE), Faculty of Ocean Engineering Technology and Informatics, Universiti Malaysia Terengganu, Kuala Terengganu, Malaysia
Malaysia has launched initiatives for utilizing renewable energy (RE) as a source of electricity since 2011 by establishing renewable energy-related laws and policies. Malaysia's geographical location and climate have led to a limited amount of intermittent RE resources. Thus, a more thorough study of the various factors affecting the RE-based electricity generation is needed for energy output optimization. This article aims to understand the impact of El Niño-Southern Oscillation (ENSO) events on wind and solar reanalysis datasets using the Wavelet Transform. The thirty-year ERA5 solar and wind datasets were used in the study, together with the multivariate ENSO Index (MEI). As a result, the selected sites experienced an increase in solar irradiation during moderate to very strong El Niño and a decrease during the La Niña period. The wind speed increases during La Niña and decreases during El Niño, with the exception of the high wind speed during the Northeast monsoon season. Also, there was a significant coherence relationship between the wind and solar datasets with the ENSO index at a specified period. Therefore, the ENSO is essential as an input factor for future development plans for wind and solar power, energy predictions, and risk assessment.
Introduction
Environmental concerns have led to a keen interest in expanding the use of different renewable resources in generating electricity. Malaysia is conveniently located close to the equator, benefiting solar exploitation. Malaysia's monthly solar irradiation is around 111–167 kWh/m2 (Mekhilef et al., 2012). The irradiation during the Northeast Monsoon is high and during the Southwest Monsoon is low (Mekhilef et al., 2012). Malaysia typically has sunshine all year round (Gomesh et al., 2013) and could produce solar energy up to 6.50 GW (Ahmad et al., 2011). However, the amount of exploited solar energy depends on many factors, including the solar panel efficiency and available land area for project installation. The country also receives irradiance more intensively in northern Malaysia than in the southern region. However, in tropical countries, such as Malaysia, clouds are very variable, especially during monsoon seasons, because of high humidity and uncertain weather conditions.
The wind is yet another renewable energy (RE) source that has potential for specific locations in Malaysia. With wind energy technology becoming increasingly popular and used worldwide, wind energy costs have already declined significantly and are therefore competitive with conventional power stations. Malaysia's strong wind blows from the South China Sea and the Indian Ocean, where Kudat and Mersing are the country's windiest sites (Albani et al., 2017; Albani and Ibrahim, 2017; Albani et al., 2019). Wind speed is an essential factor in determining the position of wind energy. Hence, understanding the characteristics of wind speed data is very important.
The El Niño-Southern Oscillation (ENSO) is one of the world's most prominent climate phenomena and is the Western Pacific Ocean's mixed ocean-atmospheric convective system. ENSO refers to asymmetric oscillations in the tropical Pacific Ocean between the cold state of La Niña and the hot state of El Niño, which occur on an interannual basis approximately every 2–7 years (Timmermann et al., 2018), (Mcphaden et al., 2006). It is essential to define ENSO's impact, especially in Malaysia that is situated in a low wind speed region (Albani et al., 2018). The energy is produced in the area with relatively low wind speed generally at the edge of economic viability. Usually, the wind turbines run below the rated power and the cut-in wind speed. Accordingly, a decrease in wind speed would cause production to drop, which is proportionally more massive compared with high wind speed sites. Several works in the literature explicitly discussed ENSO's impact on several sectors in Malaysia, such as agriculture and aquaculture sectors (Al-Amin and Alam, 2016; Kamil and Omar, 2016; Nadia Kamil and Omar, 2017; Mohd Hassan et al., 2018). Nevertheless, there is less research, in particular, about the effect of ENSO on RE resources in Malaysia. This is due to the fact that most RE impact and forecasting studies in the country were only considering prominent factors such as the impact of monsoonal seasons (Ibrahim et al., 2015; Muzathik et al., 2009), design and position of devices (Fadaeenejad et al., 2014; Humada et al., 2016), and local site characteristics (Ibrahim and Albani, 2016; Albani et al., Feb. 2013).
In the analysis method aspect, regression is used as one of the most common methods for evaluating the relationship between two variables. This method is restricted by the fact that it offers a general overview of the relationship between two series (Bonkaney et al., 2019). The other fascinating mathematical technique for evaluating relationships is the wavelet analysis (WA). The strength of this technique lies in its decomposition properties in the space of time-frequency. In addition, WA can work for nonstationary time series and even sense the existence of significant periods (Sleziak et al., 2015). The WA technique presents two wavelet transform classes: the continuous wavelet transformation (CWT) and the discrete wavelet transformation (DWT). The latter is often used for the reduction of noise and data compression, whereas the former is useful for feature extraction. The CWT expands a time series into a time-frequency space and is indeed a suitable method for examining two time series together, which can be connected in some way. Also, the Cross-Wavelet Transform (XWT) can be created from the CWT, which explores regions with very high common power and further reveals the phase relationship. Besides, the Wavelet Transform Coherence (WTC) is determined from two XWTs, which is a measure of how coherent the cross-wavelet is in time-frequency space.
The WA technique has already been applied by several researchers across many disciplines (Sleziak et al., 2015). There are also studies about the use of WA in energy applications (Ali et al., 2020). Linear regression and WTC were used to evaluate the power consumption, and it was found that the WTC approach offers an insight into the impacts of the significant power consumption factors (Avdakovic et al., 2013). The application of WA in RE study is also reported in (Kirinus et al., 2018; Chellali et al., 2010). Hence, in this study, the ENSO effect on solar and wind variables for Malaysia was investigated using the WTC to determine the time-frequency causal association between ENSO and solar/wind data.
Methodology
Data Descriptions
This study will use three selected locations (Figure 1; Table 1) for thirty years (1989–2018) of ERA5 solar and wind datasets. The ERA5 is an improved climate reanalysis dataset (Mateus et al., 2020), distributed by Copernicus Climate Change Service (C3S) and processed and published by the European Centre for Medium-Range Weather Forecasts (ECMWF). Several studies have been conducted to compare the performance of ERA5 data with the ground measured data. The ERA5 reanalysis product shows closer agreement than ERA-Interim reanalysis across Sweden for 2013–2017, except in mountainous areas (Minola et al., 2020). The disagreement of ERA5 for data on mountainous areas was also reported by Sianturi et al. (2020); however, for other measurement locations in France, the ERA5 shows a higher correlation, mostly above 0.9. Moreover, the performance evaluation of ERA5 and MERRA2 reanalyses for solar data was also studied in Indonesia (Sianturi et al., 2020), where the result showed the correlation coefficient in all stations for ERA5 (0.31–0.96) was higher than that for MERRA2 (0.21–0.85), suggesting a stronger relationship between ERA5 estimate with the ground observation of solar radiation. In the East African tropical region, the correlation for ERA5 data compared to data from the meteorological sensors at five stations was ranging from 0.976 to 0.996 (Ssenyunzi et al., 2020).
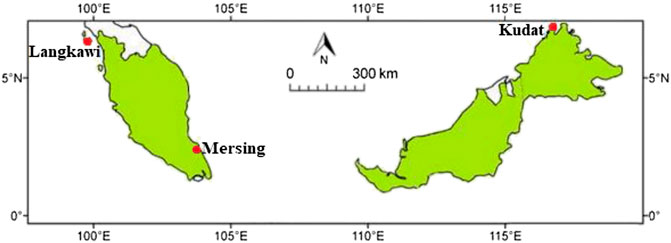
FIGURE 1. The selected sites in Malaysia.
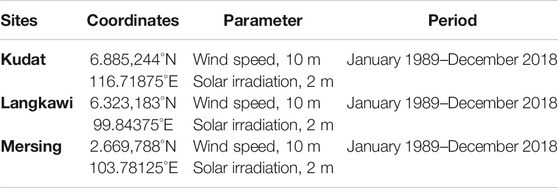
TABLE 1. The coordinates, parameters, and periods of data at selected sites.
Another dataset required in this study is the ENSO indexes. The ENSO cycle is the most noteworthy ocean-atmosphere coupled phenomenon to impact global climate variability interannual time scales. The multivariate ENSO Index (MEI) is one of the ENSO indexes applied for Southeast Asia (Wolter and Timlin, 1998). The other ENSO indexes are Niño3, Niño4, and Niño3.4 (Rao and Ren, 2017). The advantages of MEI include the following: (i) better in incorporating additional information, (ii) the nature of the coupled ocean-atmosphere system being better reflected than either component; (iii) less vulnerable to occasional data glitches in the monthly update cycles. Hence, MEI is used as ENSO indicators in this study. The new version of the MEI (MEI.v2) was developed using five variables to yield a time series of ENSO conditions from 1979 to the present. The variables include the following: sea-level pressure (SLP), sea surface temperature (SST), surface zonal winds (U), surface meridional winds (V), and Outgoing Longwave Radiation (OLR). The two datasets, solar or wind, and MEI need to consist of equally spaced observations in space or time to be applicable in WA.
Wavelet Coherence
Wavelet coherence (WTC) power was useful to reveal an area with high common power. It was also helpful in measuring how coherent the XWT in time-frequency space. The equation below is the WTC of two time series that was defined by (Torrence and Compo, 1998):
where
where Sscale denotes smoothing along the wavelet scale axis and Stime smoothing in the time. Based on Torrence and Compo (1998), the suitable Morlet wavelet smoothing operator was given as follows:
where c1 and c2 are normalized as a constant and Π is a rectangle function; 0.6 is a factor of the empirically determined scale decorrelation length for the Morlet wavelet (Torrence and Compo, 1998).
A basic or 'mother' wavelet shape is chosen before WA, e.g., Morlet, Haar, or Daubechies and Paul or Gaussian Derivative (DOG). The selection of the basic wavelet depends on the nature of the data and the information that the study will extract or filter. The Morlet wavelet, a flat wave modulated by Gaussian (Venables and Ripley, 2002), is chosen from the different wavelet types because it provides the right balance between space and frequency (Shu et al., 2008).
Result and Discussions
Data Analysis
Figure 2 presents the boxplot that illustrates the overall trend and provides a useful way of displaying the range and other data characteristics for a large group of data. Figure 2A presents the boxplot for 30 years of solar data at the selected sites. The highest solar radiation is at Kudat, 287.19 W/m2 in April 1998, and the lowest is 152.41 W/m2 in January 1996. For Langkawi, the highest is 290.76 W/m2 in March 1998, and the lowest is 161.11 W/m2 in December 2005. In Mersing, the highest solar radiation was 266.07 W/m2 in March 1990, and the lowest is 123.85 W/m2 in December 1991. Figure 2B presents a boxplot for wind energy, where the median data are 2.88 m/s, 2.39 m/s, and 3.19 m/s at Kudat, Langkawi, and Mersing, respectively. Kudat and Mersing's minimum data are 1.63 and 1.84 m/s, respectively, whereas Langkawi’s minimum data are 1.38 m/s. The maximum data for Kudat, Mersing, and Langkawi are 4.73 m/s, 6.09 m/s, and 4.48 m/s, respectively. Apparent abnormal or outlier points occur as a result of data far from the significant data values.
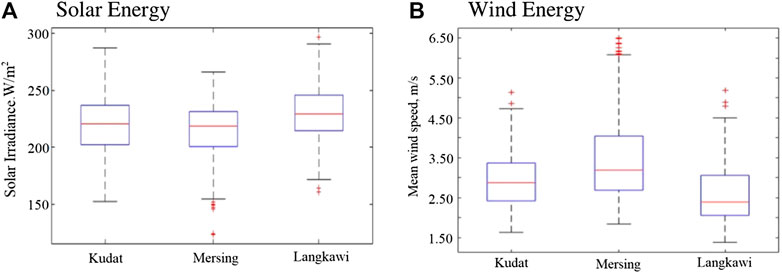
FIGURE 2. Boxplot of monthly mean data of wind speed and solar radiation for Kudat, Langkawi, and Mersing.
Figure 3 shows the dimensionless median absolute deviation (DMAD) of ERA5 wind/solar data and MEI. To assess the impact of ENSO events on wind speed and solar irradiance variability, it is crucial to establish data deviations from normal ranges. The median absolute deviation (MAD) is the median of the absolute deviations from the data median. The MAD provides a robust measure of statistical dispersion and central tendency (Venables and Ripley, 2002). The sets of standardized indexes varying from negative to positive can be generated using DMAD. The DMAD value can be either positive or negative and indicates the number of MADs from the median (Mohammadi and Goudarzi, 2018). The strength of the ENSO event based on the MEI index is defined in (Mazzarella and Giuliacci, 2009). The MEI strength is classified into very weak (Strength Index (SI) = 1, 0 ≤ MEI<0.6), weak (SI = 2, 0.6 ≤ MEI<1.2), moderate (SI = 3, 1.2 ≤ MEI<1.8), strong (SI = 4, 1.8 ≤ MEI<2.4), very strong (SI = 5, 2.4 ≤ MEI<3.0), and extreme (SI = 6, MEI = 3.0). Moreover, the strongest and most powerful of El Niños, namely, Super El Niño, was reported by Hameed et al. (2018). Super El Niño only normally occurs once every 2 decades, and its climate effects are considered to be much greater globally than those of a typical El Niño (Rao and Ren, 2017; Panmao et al., 2016). At least thirty El Niño events since 1900 have been recorded, with 1982–1983, 1997–1998, and 2014–2016 events among the strongest on record (Takahashi and Martínez, 2019). A significant increment of solar irradiance is expected during El Niño and decrement during La Niña. Also, solar irradiance usually is high during Southwest Monsoon (SWM) between May and September and low between November and March during the Northeast nonsoon (NEM) (Mekhilef et al., 2012). During the transition monsoon in April and October, the solar irradiance was also low and brought heavy rain and thunderstorm, with the weather being slightly warmer in the morning. In Kudat, the highest monthly mean solar data were recorded in April 1998 (287.20 W/m2), whereas the lowest data (152.41 W/m2) were recorded in January 1996. The solar irradiance increased during the transition monsoon due to the very strong El Niño event that occurred in April 1998. In Mersing, the highest monthly mean solar energy is in March 1990 (266.07 W/m2), whereas the lowest was 123.85 W/m2 that occurred in December 1991. Although the value of MEI is low, the solar DMAD is still higher due to SWM seasons. In Langkawi, the highest monthly mean solar irradiance occurred in March 1998 (290.76 W/m2), whereas the lowest was 161.11 W/m2 in December 2005. The strong El Niño that occurred in March 1998 resulted in higher solar DMAD. Moreover, the ENSO influence on wind speed data is always different for each ENSO event, as each event has unique characteristics in terms of specific pattern changes, timing, and intensity. The wind speed is generally quite lower during the weak El Niño but much higher during moderate to very strong El Niño in the NEM period. The value of wind DMAD in Kudat was higher during the NEM period of 1998, whereas MEI data also peaked at that year. A significant peak was also recorded during the NEM period of 2016 in Kudat, Langkawi, and Mersing, showing that wind speed and MEI data were highly correlated on that year.
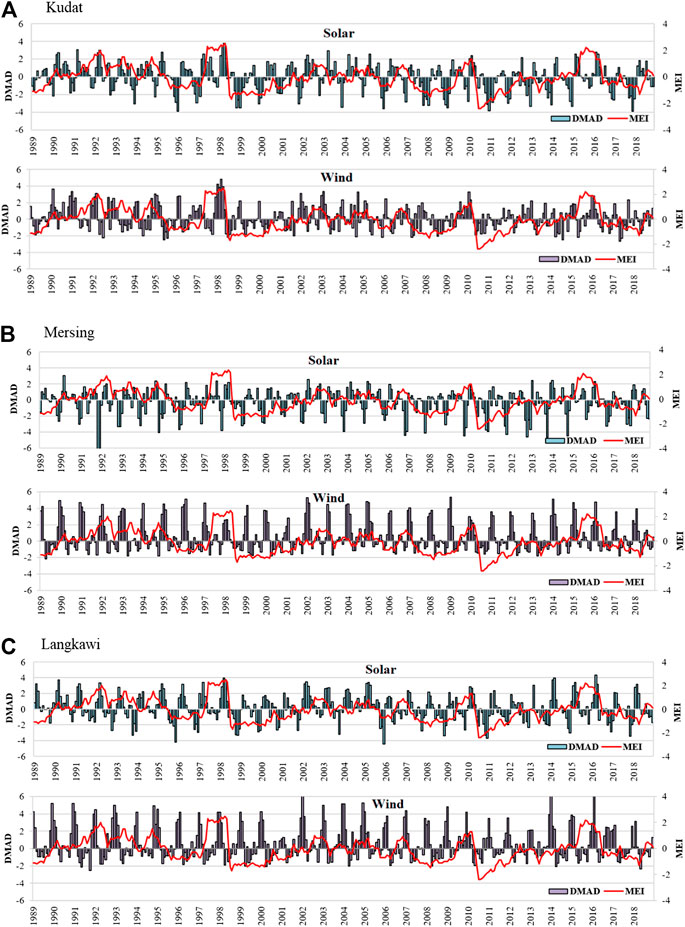
FIGURE 3. The dimensionless median absolute deviation (DMAD) of ERA5 wind/solar data and the multivariate ENSO index (MEI).
Wavelet Analysis
Figure 4 shows the wavelet power spectrum for WTC of solar and wind data with the MEI values. WTC is used to interpret the coherence and phase lag between two time series as a function of time and frequency. The horizontal axis represents the time scale, whereas the vertical axis represents the period (1/frequency). The legend in the right figure indicates the spectral power of the wavelet at the color level. The area affected by the edge-effect and conical in shape is called the cone of influence. The thick contour shows the 5% significance level against yellow noise. The coherency was presented based on the color code from low coherency (dark blue) to high coherency (yellow). In addition, black arrows indicate the phase difference between the two sets of time series, only plotted for coherence equal to or greater than 0.5. The phase arrow pointing to the right was interpreted as in-phase, where the solar or wind data decrease with the decrease of MEI value. Also, they are antiphase if the phase arrow points to the left. The solar or wind data led the ENSO by 90° if the phase arrow was pointing down and vice versa. In Kudat, the most significant correlation with the in-phase relationship between both solar and wind data and the ENSO index can be identified in the 16–64-month period band. In other words, a positive relationship does exist between both solar and wind data and the ENSO index for a periodicity mentioned period, suggesting the strong seasonal relationship between the two variables.
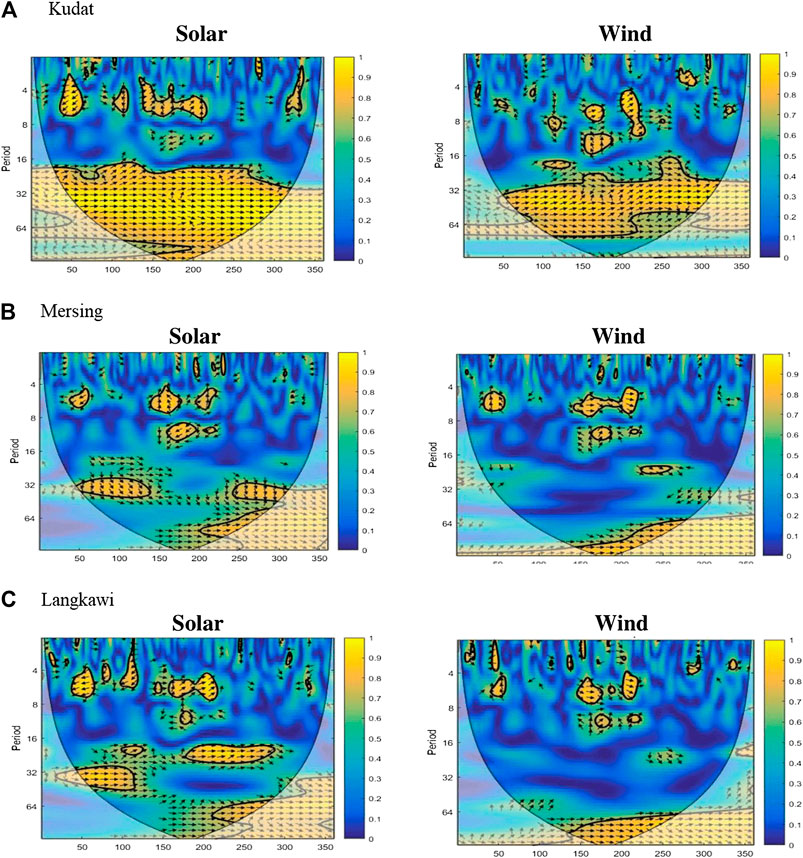
FIGURE 4. The Wavelet Coherence (WTC) of wind and solar with multivariate ENSO index.
Moreover, the solar and wind data were leading ENSO by 90°. In the period between 4 and 8 months, another significant coherence is also identified at a certain observed period. Furthermore, the two observed bands' coherence is greater than 0.8, suggesting a strong correlation between the solar/wind data and ENSO in Kudat. The sites in Mersing and Langkawi also showed significant coherence at a specified period. The significant coherence occurred at 16–64-month period band for both sites, where the relationship of solar data and ENSO is in-phase, indicating a positive correlation. However, at 4–16-month period band, the relationship is antiphase. In contrast to solar-ENSO, less coherency was presented in the wind-ENSO time series relationship for Mersing and Langkawi. The average coherence between the two time series is also weak (less than 0.5).
The Impact Summary
El Niño and La Niña events have enormous implications on the RE sector worldwide, especially wind and solar energy, as the events will influence the region's weather conditions. These events happened because the ocean temperatures were warmer or colder than the normal value (Cai et al., 2014). Surface water is exceptionally warm during El Niño in the central and eastern equatorial Pacific Oceans. The trade winds from east to west are declining, and the warm waters in the Western Pacific usually travel east along the equator (Chen et al., 2019). This will cause wetter conditions, including major precipitation and flooding in the Eastern Pacific countries, and dry conditions causing the drought in Western Pacific countries (Paquette and Fender, 2016). El Niño's impacts are more direct and substantial in South America than in North America. Massive floods occurred in Northern Peru and Ecuador during the strong or extreme El Niño. Also, Southern Brazil and Northern Argentina are wetter than average, mostly in spring and early summer. Central Chile experiences a mild winter with heavy rain, and often the Peru-Bolivian Altiplano is subjected to severe winter snowfalls. The Amazon River Valley, Colombia, and Central America experience drier and hotter weather. Malaysia and other parts of Southeast Asia tend to have long-term drought and dry weather. On the other hand, La Niña is the opposite of the El Niño phase, where trade winds reinforce and warm water and precipitation enter the western equatorial Pacific. This results in colder surface water in the equatorial Pacific Ocean, dry conditions in Eastern Pacific countries, and much wetter conditions, including heavy rains, in Western Pacific countries. During the time of La Niña, drought plagues the coastal regions of Peru and Chile. Heavy rains occur in Northern Australia and Southeast Asia, including Malaysia.
The WA revealed the influence of ENSO on the wind speed and solar irradiance data in Malaysia. These results agree with existing studies on the RE-ENSO relationship, as reported by Greene et al. (2010). Thus, the ENSO effect should be included as a variable in the project finance planning and forecasting to minimize uncertainty and loss.
The wind speed is an essential parameter in determining the potential energy output of a wind turbine. The energy in the wind is the cube of wind speed (Pryor and Barthelmie, 2010; Johnston et al., 2012; Carvalho et al., 2017). Thus, the decrease of wind speed will have a massive impact on the energy output, especially with the low wind speed region such as Malaysia (Albani, 2013; Albani et al., 2013; Albani et al., 2020), where the wind speed is close to the cut-in wind speed. The temperature is expected to increase during the El Niño event, which leads to a slight reduction in air density and energy production (Pryor and Barthelmie, 2010; Pryor and Barthelmie, 2013). The rise of temperature might increase the operational costs and affect the wind turbine equipment efficiency and performance (Gaetani et al., 2015). Also, the severe increase in wind strength will challenge wind turbines' design, especially small scale in size. This will cause the wind turbine to shut down (Devis et al., 2018) due to the fact that the wind speed exceeds the cut-out wind speed.
The ENSO impact depends on the ENSO event intensity and varies from region to region. During El Niño, Malaysia experienced a substantial decrease in rainfall and increased temperature that led to drought disaster (Nadia Kamil and Omar, 2017). The association between El Niño and the global temperature was also reported in several works in the literature (Revadekar et al., 2010; Yang et al., 2018). Less rainfall intensity meant less cloudiness and the rise of solar irradiance. High solar irradiance will positively increase energy production by solar photovoltaic. Still, the increase in temperature during El Niño would negatively affect the performance of solar photovoltaic output (Huld et al., 2008; Fesharaki et al., 2011; Thevenard and Pelland, 2013; Jerez et al., 2015; Amelia et al., 2016; Perez et al., 2019). The solar photovoltaic efficiency would drop by 0.5% with every 1°C rise in temperature (Patt et al., 2013). During La Niña events, the cloudiness and heavy rainfall intensity have commonly occurred, mostly if the event was concurrent with the NEM season. The changes in solar irradiation and the existence of cloudiness will affect the solar production output and projected long-run cash flow (Yang et al., 2018). The most affected is the concentrated solar power (CSP) as it cannot use diffuse light (Arent et al., 2014), and also the availability of rainwater reduces CSP's performance (Chandramowli and Felder, 2014).
Conclusion
In the present study, the WA technique was applied to understand the relationship between solar/wind data and ENSO at three selected Malaysia sites. The thirty-year ERA5 reanalysis of monthly mean solar irradiance and wind speed datasets from 1989 to 2018 has been used and analyzed. For the ENSO index, the dataset of MEI was selected. The boxplot, DMAD, and WTC have been used to analyze the datasets. The results revealed that significant coherence occurs between the wind and solar data and the ENSO index at different periods. The wind speed value was less than the normal range during a weak El Niño, and it was remarked that the site experienced rises of wind speed during the NEM season of a moderate to very strong El Niño. On the other hand, the solar irradiance rises compared to the normal range during El Niño and decreases during La Niña events. The significant coherence tends to be in-phase with the ENSO, which influences the distribution of wind/solar data within the period of approximately 16–64 months for Kudat. In Mersing and Langkawi, the solar datasets show the apparent significant coherence with the ENSO index at a specific period; however, for wind-ENSO, the coherency was weak.
Data Availability Statement
Publicly available datasets were analyzed in this study. This data can be found here: https://cds.climate.copernicus.eu/#!/home.
Author Contributions
AA: substantial contributions to the conception or design of the work, analysis, and interpretation of data for the work. MI, SG, MR, and PT: drafting the work. All authors contributed to the article and approved the submitted version.
Funding
This study was funded by the Malaysia Ministry of Higher Education (MOHE) through the Fundamental Research Grant Scheme (FRGS), grant number (Vot. 59602), FRGS/1/2019/TK07/UMT/02/1.
Conflict of Interest
The authors declare that the research was conducted in the absence of any commercial or financial relationships that could be construed as a potential conflict of interest.
References
Ahmad, S., Zainal, M., Ab, A., and Shafie, S. (2011). Current perspective of the renewable energy development in Malaysia. Renew. Sustain. Energy Rev. 15 (2), 897–904. doi:10.1016/j.rser.2010.11.009
Al-Amin, A. Q., and Alam, G. M. (2016). Impact of El-Niño on agro-economics in Malaysia and the surrounding regions: an analysis of the events from 1997-98. Asian J. Earth Sci. 9 (1), 1–8. doi:10.3923/ajes.2016.1.8
Albani, A., Ibrahim, M., Yong, K., Yusop, Z. ., Jusoh, M., and Ridzuan, A. (2020). The wind energy potential in Kudat Malaysia by considering the levelized cost of energy for combined wind turbine capacities. Energy Environ. doi:10.1177/0958305X20937006
Albani, A., Ibrahim, M. Z., and Hamzah, M. H. M. (2013). Assessment of wind energy potential based on METAR data in Malaysia. Int. J. Renew. Energy Resour. 3. (4), 959–968.
Albani, A., Ibrahim, M. Z., Taib, C. M. I. C., and Azlina, A. A. (2017). The optimal generation cost-based tariff rates for onshore wind energy in Malaysia. Energies. 10 (8), 1114. doi:10.3390/EN10081114
Albani, A., and Ibrahim, M. Z. (2017). Wind energy potential and power law indexes assessment for selected near-coastal sites in Malaysia. Energies. 10 (307), 1–21. 10.3390/en10030307.
Albani, A., Ibrahim, M. Z., and Yong, K. H. (2018). Influence of the ENSO and monsoonal season on long-term wind energy potential in Malaysia. Energies. 11 (11), 2965. doi:10.3390/en11112965
Albani, A., Ibrahim, M. Z., Yong, K. H., and Muzathik, A. M. (2013). Wind energy potential investigation and micrositting in Langkawi Island, Malaysia. Wind Eng. 37 (1), 1–12. doi:10.1260/0309-524X.37.1.1
Albani, A. (2013). Statistical analysis of wind power density based on the Weibull and Rayleigh models of selected site in Malaysia. Pak. J. Statistics Oper. Res. 9 (4), 393–406. doi:10.1234/pjsor.v9i4.580
Albani, A., Zamri, M., and Hwang, K. (2019). Wind shear data at two different terrain types. Data Br. 25, 104306. doi:10.1016/j.dib.2019.104306
Ali, A., Kamarulzaman, R., Soetrisno, F. K., Shahril, M., and Razimi, A. (2020). Wavelet analysis of renewable , non-renewable energy consumption and environmental degradation as a precursor to economic Growth : evidence from Malaysia. Int. J. Energy Econ. Pol. 10 (3), 182–189.
Amelia, A., Irwan, Y., Leow, W., Irwanto, M., Safwati, I., and Zhafarina, M. (2016). Investigation of the effect temperature on photovoltaic ( PV ) panel output performance. Int. J. Adv. Sci. Eng. Inf. Technol. 6 (5), 682–688. doi:10.18517/ijaseit.6.5.938
Arent, D, J., Faust, E., Hella, J. P., Kumar, S., Strzepek, K. M., Toth, F. L., et al. (2014). Key economics sectors and services. Available at: https://www.ipcc.ch/report/ar5/wg2/key-economic-sectors-and-services/ (Accessed December 30, 2014).
Avdakovic, S., Ademovic, A., and Nuhanovic, A. (2013). Correlation between air temperature and electricity demand by linear regression and wavelet coherence approach: UK, Slovakia and Bosnia and Herzegovina case study. Arch. Electr. Eng. 62 (4), 521–532. doi:10.2478/aee-2013-0042
Bonkaney, A. L., Seidou Sanda, I., and Balogun, A. A. (2019). Wavelet analysis of daily energy demand and weather variables. J. Energy. 2019, 1–7. doi:10.1155/2019/4974107
Cai, W., Borlace, S., Lengaigne, M., Rensh, P. V., Collins, M., Vecchi, G., et al. (2014). Increasing frequency of extreme El Niño events due to greenhouse warming. Nat. Clim. Change. 4 (2), 111–116. doi:10.1038/NCLIMATE2100
Carvalho, D., Rocha, A., Gomez-Gesteira, M., and Santos, C. (2017). Potential impacts of climate change on European wind energy resource under the CMIP5 future climate projections. Renew. Energy. 101, 29–40. doi:10.1016/j.renene.2016.08.036
Chandramowli, S., and Felder, F. (2014). Impact of climate change on electricity systems and markets – a review of models and forecasts. Sustain. Energy Technol. Assessments. 5, 62–74. doi:10.2139/ssrn.2251167
Chellali, F., Khellaf, A., and Belouchrani, A. (2010). Wavelet spectral analysis of the temperature and wind speed data at Adrar, Algeria. Renew. Energy. 35 (6), 1214–1219. doi:10.1016/j.renene.2009.10.010
Chen, N., Thual, S., and Hu, S. (2019). “El Niño and the southern oscillation: observation,” in Reference module in earth systems and environmental sciences. Elsevier.
Devis, A., Lipzig, N., and Demuzere, M. (2018). Should future wind speed changes be taken into account in wind farm development ? Environ. Res. Lett. 13, 064012. doi:10.1088/1748-9326/aabff7
Fadaeenejad, M., Amran, M., Radzi, M., Fadaeenejad, M., and Zarif, M. (2014). Optimization and comparison analysis for application of PV panels in three villages. Energy Sci. Eng. 3, 145–152. doi:10.1002/ese3.52
Fesharaki, V., Dehghani, M., and Fesharaki, J. (2011). The effect of temperature on photovoltaic cell efficiency,” in Proceedings of the 1st international conference on emerging trends in energy conservation - ETEC Tehran, Tehran, Iran, 20-21 November 2011, pp. 1–6.
Gaetani, M., Vignati, E., Monforti, F., Huld, T., Dosio, A., and Raes, F. (2015). Climate modelling and renewable energy resource assessment. Italy: JRC Science and Policy ReportAvailable at: https://ec.europa.eu/jrc (Accessed 2015).
Gomesh, N., Daut, I., Irwanto, M., Irwan, Y. M., and Fitra, M. (2013). Study on Malaysian ’ s perspective towards renewable energy mainly on solar energy. Energy Procedia. 36, 303–312. doi:10.1016/j.egypro.2013.07.035
Greene, S., Morrissey, M., and Johnson, S. (2010). Wind climatology, climate change, and wind energy. Geogr. Compass. 4 (11), 1592–1605. doi:10.1111/j.1749-8198.2010.00396.x
Hameed, S. N., Jin, D., and Thilakan, V. (2018). A model for super El Niños. Nat. Commun. 9, 2528. doi:10.1038/s41467-018-04803-7
Huld, T., Suri, M., and Dunlop, E. (2008). Geographical variation of the conversion efficiency of crystalline silicon photovoltaic modules in europe. Prog. Photovoltaics Res. Appl. 16. 595–607. doi:10.1002/pip.846
Humada, A. M., Hojabri, M., Hamada, H. M., Samsuri, F. B., and Ahmed, M. N. (2016). Performance evaluation of two PV technologies (c-Si and CIS) for building integrated photovoltaic based on tropical climate condition : a case study in Malaysia. Energy Build. 119, 233–241. doi:10.1016/j.enbuild.2016.03.052
Ibrahim, M. Z., and Albani, A. (2016). Wind turbine rank method for a wind park scenario. World J. Eng. 13 (6), 500–508. doi:10.1108/WJE-09-2016-0083
Ibrahim, M. Z., Yong, K. H., Ismail, M., and Albani, A. (2015). Spatial analysis of wind potential for Malaysia. Int. J. Renew. Energy Resour. 5 (1), 202–209.
Jerez, S., Tobin, I., Vautard, R., Montávez, J. P., López-Romero, J. M., Thais, F., et al. (2015). The impact of climate change on photovoltaic power generation in Europe. Nat. Commun. 6, 1–8. doi:10.1038/ncomms10014
Johnston, P., Gomez, J., and Laplante, B. (2012). Climate risk and adaptation in the electric power sector. Manila, Philiphines. Available at: http://hdl.handle.net/11540/887 (Accessed July 2012).
Kamil, N. N., and Omar, S. F. (2016). Climate variability and its impact on the palm oil Industry. Oil Palm Ind. Econ. J. 16, 43.
Kirinus, E. de. P., Oleinik, P. H., Costi, J., and Marques, W. C. (2018). Long-term simulations for ocean energy off the Brazilian coast. Energy. 163, 364–382. doi:10.1016/j.energy.2018.08.080
Mateus, P., Catalão, J., Mendes, V. B., and Nico, G. (2020). An ERA5-based hourly global pressure and temperature (HGPT) model. Rem. Sens. 12 (7), 1098. doi:10.3390/rs12071098
Mazzarella, A., and Giuliacci, A. (2009). The El Niño events: their classification and scale-invariance laws. Ann. Geophys. 52 (10), 517–522. doi:10.4401/AG-4607
Mcphaden, M. J., Zebiak, S. E., and Glantz, M. H. (2006). Concept in earth science. Science. 314, 1740. doi:10.1126/science.1132588
Mekhilef, S., Safari, A., Mustaffa, W. E. S., Saidur, R., Omar, R., and Younis, M. A. A. (2012). Solar energy in Malaysia: current state and prospects. Renew. Sustain. Energy Rev. 16 (1), 386–396. doi:10.1016/j.rser.2011.08.003
Minola, L., Zhang, F., Azorin-Molina, C., Safei Pirooz, A. A., Flay, R. G. J., Hersbach, H., et al. (2020). Near-surface mean and gust wind speeds in ERA5 across Sweden: towards an improved gust parametrization. Clim. Dynam. 55 (3), 887–907. doi:10.5194/egusphere-egu2020-4691
Mohammadi, K., and Goudarzi, N. (2018). Study of inter-correlations of solar radiation, wind speed and precipitation under the influence of El Niño Southern Oscillation (ENSO) in California. Renew. Energy. 120, 190–200. doi:10.1016/j.renene.2017.12.069
Mohd Hassan, N. A., Ahmad, S. M., and Balu, N. (2018). Relationship between severe El Niño phenomena and Malaysia’s palm oil production—a VECM approach. Oil Palm Ind. Econ. J. 18 (1), 1–8.
Muzathik, A. M., Nik Wan, W. B., Ibrahim, M. Z., and Samo, K. B. (2009). Wind resource investigation of Terengganu in the west Malaysia. Wind Eng. 33 (4), 389–402. doi:10.1260/030952409789685708
Nadia Kamil, N., and Omar, S. F. (2017). The impact of El Niño and La Niña on Malaysian palm oil industry. Oil Palm Bull. 74, 1–6.
Panmao, Z., Yu, R., Guo, Y., Li, Q., Ren, X., Wang, Y., et al. (2016). The strong El Niño global and China’s climate. J. Meteor. Res. 30 (3), 283–297. doi:10.1007/s13351-016-6101-3
Paquette, E., and Fender, A. (2016). Handbook of global climate cycle & seasons. New York: Academic Studio.
Patt, A., Pfenninger, S., and Lilliestam, J. (2013). Vulnerability of solar energy infrastructure and output to climate change. Climatic Change. 121, 93–102. doi:10.1007/s10584-013-0887-0
Perez, J., Gonzalez, A., Diaz, J., Exposito, F., and Felipe, J. (2019). Climate change impact on future photovoltaic resource potential in an orographically complex archipelago , the Canary Islands. Renew. Energy. 133, 749–759. doi:10.1016/j.renene.2018.10.077
Pryor, S., and Barthelmie, R. (2013). Assessing the vulnerability of wind energy to climate change and extreme events. Climatic Change. 121, 79–91. doi:10.1007/s10584-013-0889-y
Pryor, S., and Barthelmie, R. (2010). Climate change impacts on wind energy : a review. Renew. Sustain. Energy Rev. 14, 430–437. doi:10.1016/j.rser.2009.07.028
Rao, J., and Ren, R. (2017). Parallel comparison of the 1982/83, 1997/98 and 2015/16 super El Ninos their Effects on the extratropical stratosphere. Adv. Atmos. Sci. 34, 1121–1133. doi:10.1007/s00376-017-6260-x
Revadekar, J. V., Borgaonkar, H. P., and Kothawale, D. R. (2010). “Temperature extremes over India and their relationship with El niño-southern oscillation,” in Natural and anthropogenic disasters. Dordrecht: Springer, 275–292.
Shu, Q., Liu, Z., and Si, B. (2008). Characterizing scale- and location-dependent correlation of water retention parameters with soil physical properties using wavelet techniques. J. Environ. Qual. 37 (6), 2284–2292. doi:10.2134/jeq2007.0179
Sianturi, Y., Marjuki, , and Sartika, K. (2020). Evaluation of ERA5 and MERRA2 reanalyses to estimate solar irradiance using ground observations over Indonesia region. AIP Conf. Proc. 2223 (1), 020002. doi:10.1063/5.0000854
Sleziak, P., Hlavčová, K., and Szolgay, J. (2015). Advantages of a time series analysis using wavelet transform as compared with a fourier analysis. Slovak J. Civ. Eng. 23 (2), 30–36. doi:10.1515/sjce-2015-0010
Ssenyunzi, R. C., Oruru, B., D'ujanga, F. M., Realini, E., Barindelli, S., Tagliaferro, G., et al. (2020). Performance of ERA5 data in retrieving precipitable water vapour over East African tropical region. Adv. Space Res. 65 (8), 1877–1893. doi:10.1016/j.asr.2020.02.003
Takahashi, K., and Martínez, A. G. (2019). The very strong coastal El Niño in 1925 in the far—eastern Pacific. Clim. Dynam. 52 (12), 7389–7415. doi:10.1007/s00382-017-3702-1
Thevenard, D., and Pelland, S. (2013). Estimating the uncertainty in long-term photovoltaic yield predictions. Sol. Energy. 91, 432–445. doi:10.1016/j.solener.2011.05.006
Timmermann, A., Ann, S.-I., Kug, J.-S., Jin, F.-F., Cai, W., Capotondi, A., et al. (2018). El Niño—southern oscillation complexity. Nature. 559, 535–545. doi:10.1038/s41586-018-0252-6
Torrence, C., and Compo, G. P. (1998). A practical guide to wavelet analysis. Bull. Am. Meteorol. Soc. 79 (1), 61–78. doi:10.1175/1520-0477(1998)079<0061:APGTWA>2.0.CO;2
Venables, W. N., and Ripley, B. D. (2002). Modern applied statistics with S-plus. New York: Springer-Verlag.
Wolter, K., and Timlin, M. S. (1998). Measuring the strength of ENSO events: how does 1997/98 rank? Weather. 53, 315–324. doi:10.1002/J.1477-8696.1998.TB06408.X
Keywords: wavelet, solar energy, wind energy, coherency, Malaysia
Citation: Albani A, Ibrahim MZ, Abdul Ghani SS, Mat Rofi MZ and Taslin PNA (2021) The Impact Study of El Niño-Southern Oscillation to the Wind and Solar Data in Malaysia Using the Wavelet Analysis. Front. Energy Res. 8:591469. doi: 10.3389/fenrg.2020.591469
Received: 04 August 2020; Accepted: 19 November 2020;
Published: 11 January 2021.
Edited by:
Bernard Saw, Tunku Abdul Rahman University, MalaysiaReviewed by:
Jian Rao, Nanjing University of Information Science and Technology, ChinaOlusegun Steven Ayodele Oluwole, University of Ibadan, Nigeria
Mahdi Haddad, Algerian Space Agency (ASAL), Algeria
Copyright © 2021 Albani, Ibrahim, Abdul Ghani, Mat Rofi and Taslin. This is an open-access article distributed under the terms of the Creative Commons Attribution License (CC BY). The use, distribution or reproduction in other forums is permitted, provided the original author(s) and the copyright owner(s) are credited and that the original publication in this journal is cited, in accordance with accepted academic practice. No use, distribution or reproduction is permitted which does not comply with these terms.
*Correspondence: Aliashim Albani, albani@umt.edu.my