Influence of Load and Phase of Contraction on Lateral Symmetries in Flywheel Squats


1
Faculty of Health Sciences, University of Primorska, 6310 Izola, Slovenia
2
InnoRenew CoE, Livade 6, 6310 Izola, Slovenia
3
Faculty of Sport, University of Ljubljana, 1000 Ljubljana, Slovenia
4
Andrej Marušič Institute, University of Primorska, Titov trg 4, 6000 Koper, Slovenia
5
Laboratory for Motor Control and Motor Behaviour, S2P, Science to Practice, Ltd., 1000 Ljubljana, Slovenia
*
Author to whom correspondence should be addressed.
Symmetry 2021, 13(1), 111; https://doi.org/10.3390/sym13010111
Submission received: 24 November 2020
/
Revised: 2 January 2021
/
Accepted: 8 January 2021
/
Published: 11 January 2021
(This article belongs to the Section Life Sciences)
Abstract
:Assessment of lateral symmetries (LS) of lower limbs has been widely investigated. However, there are no studies about LS during exposure to high eccentric and concentric loads during flywheel (FW) squats. A total of 422 young, physically active participants performed squats on an FW device with different equidistant loads (0.05, 0.125 and 0.2 kg∙m2). The mean and peak force of the left and right leg were assessed for the concentric and eccentric contaction phase. LS values were calculated for each load and phase of squat. Our results showed that the absolute mean and peak force of the concentric and eccentric phase of contraction had excellent reliability, while LS values were more reliable when eccentric force was used for their calculation. Mean and peak forces were increased with the higher FW load. In general, we found a decrease in LS values in the concentric phase of contraction with the higher load. Moreover, values of LS are similar to a wide range of other functional movements. Nevertheless, symmetrical force application during squatting on a FW device should be satisfied regardless of the FW load. Due to the large sample size, our results are valuable as a reference point when athletes are evaluated during training.
1. Introduction
In past years, differences in function and performance of the contralateral limbs have been widely investigated. Studies used different methods for quantifying lateral symmetry such as isokinetic dynamometry [1], free weights [2], jumping [3], and change of direction speed [4]. However, none of these methods assessed lateral (a)symmetries by combining concentric and eccentric contraction under higher loads, which occur in sport-specific actions [5].
Lower limb exposure to different loads in the concentric and eccentric phase of contraction can be achieved and well-controlled during squatting on a flywheel (FW) device. While performing FW squats and delaying the deceleration movement in the first phase of the eccentric phase, these devices enable the participant to achieve a difference between eccentric and concentric peak forces [6]. Due to the eccentric overload, good balance and stability during FW squats may be even more important for symmetrical performance than a traditional barbell squat [2]. Lateral symmetry between legs can be evaluated in unilateral or bilateral tasks. The decreased strength symmetries between the left and right side or dominant and non-dominant side, which are considered as a risk factor for injury ranging from 10 to 15% [7,8,9]. These differences are more frequently evaluated in different unilateral tasks [10,11,12,13], while evaluation of bilateral resistance exercises during squatting is rare as bilateral exercises are most often incorrectly considered symmetrical [14].
The use of the FW squatting devices is a popular and effective tool for resistance training in athletes [15] and in rehabilitation [16]. The reliability of different outcome measures during FW squatting such as force output [17] and force-velocity outcome parameters [18] has already been confirmed. However, there is no evidence about lateral symmetries during bilateral FW squat performance. Bilateral symmetry values can be calculated with different equations, however, they need to be selected based on the test method, ensuring accurate calculation and interpretation [19]. Reduced lateral symmetry represents a risk factor for an injury [20,21], or it can negatively affect performance [22]. Use of different loads in FW squatting is required for the development of muscle hypertrophy or strength [23] and power [24].
Only a few studies have explored the relationship between load magnitude and lateral symmetry in the squat exercise. This relationship has been studied only in recreationally trained men and women (7), where a decreased lateral symmetry occurred in several kinematic and kinetic parameters during barbell squat under light loads. In addition, increasing the external load did not necessarily lead to a decrease in the lateral symmetry in any of the outcome measures explored in that study (7). However, only one study on female softball players (12) has been conducted under a heavy loading condition (80% of 1RM); therefore, it is unclear whether the lateral symmetry differs among varying loading conditions.
Symmetrical squatting and good postural control should be provided before participating in FW resistance training due to high forces occurring during the concentric and especially eccentric phase of the FW squat. It could be speculated that the higher force demands result in decreased lateral symmetry. The first aim of our study was to test the reliability of FW squat (mean and peak ground reaction force; lateral symmetry values). We hypothesized that good to excellent reliability would be calculated for the mean force, peak force and symmetry values calculated from the mean and peak force. Moreover, our second aim was to compare mean and peak forces in the eccentric and concentric phase of contraction for three different loads. We hypothesized that the mean and peak force would significantly increase with higher FW load, while significantly higher mean and peak forces would be present in the eccentric phase of contraction as compared to the concentric phase. The first and the second aim served as the ground for our third and the main aim of our study. The aim was to investigate force lateral symmetries of lower limbs during squatting on an FW device. Specifically, we investigated force lateral symmetry in FW squatting between three different FW loads. We hypothesized that the mean and peak force lateral symmetry would decrease with higher FW loads and moreover, that lateral symmetry values would be decreased more in the eccentric phase of contraction compared to the concentric phase.
2. Materials and Methods
2.1. Participants
All of 422 volunteers (Table 1) were regularly physically active and knowledgeable about resistance training. The inclusion criterion for our participants was regular strength training at least twice a week for the past three years. Participants with knee injuries (e.g., cartilage, meniscus, or ligament damage), chronic medical conditions (systemic, cardiac, and/or respiratory diseases and neuromuscular disorders), previous occurrence of low back pain, or any acute injuries in the past six months that might prevent the participant from performing squats on FW device with maximal exhaustion. The Slovenian Medical Ethics Committee (approval no. 0120-99/2018/5) approved the experiment, which was conducted according to the Declaration of Helsinki. Participants (or their parents/guardians if a subject was underage (n = 260, age: 16.0 ± 1.2 years)) were informed of the testing procedures before signing an informed consent form. To determine participants’ preferred (jumping) leg, we used a question, “Which leg do you use for take-off during unilateral jumping movements?” Participants were instructed to avoid any demanding exercise at least 48 h prior to the testing session.
2.2. Experimental Design
A cross-sectional study was conducted to compare the mean and peak ground reaction force and lateral symmetry in the concentric and eccentric phase during the FW squat. Six repetitions were used to assess the reliability of force and symmetry parameters for each FW load and each phase (concentric and eccentric), as suggested by previous studies [18]. Six repetitions were averaged to calculate the outcome variables: mean and peak force in the concentric and eccentric phase (left and right leg), symmetry values for mean and peak force between the legs in the concentric and eccentric phase. Mean values were used for symmetry calculation as it was previously suggested that they better highlight individual differences [25].
2.3. Testing Procedures
The participants performed FW squats on a custom-made FW device (Figure 1) [18]. Three equidistant FW loading conditions were used—0.05, 0.125, and 0.2 kg∙m2. Prior to each testing session on the FW device, participants performed a 10-min warm-up consisting of 2 min of alternating step-ups on a 25 cm high bench (80 bpm), flexibility exercises for the arms, hips, knees, and ankles (10 repetitions each), dynamic stretches of the hip flexors, knee extensors, knee flexors, and ankle extensors (10 reps each), and heel raise, squat, crunch resistance exercises (10 reps each). After the general warm-up, each subject performed five maximal countermovement jumps, squat jumps and jumping push-ups.
A draw-wire sensor (Way-Con SX-50, Taufkirchen, Germany; range 1250 mm, linearity ±0.02%) was attached perpendicular to the FW device under the standing surface, and a draw-wire was attached to the lifting harness (between the legs). The sensor setup provided us with position-time data for the propulsive and braking phase of the squat. A bilateral force plate system (type 9260AA, Kistler Instrumente AG, Winterthur, Switzerland) with Kistler MARS software was used to record ground reaction force (Figure 1). The two sensory systems were synchronized in time and acquired with a USB Data Acquisition System (Type 5695B, Kistler Instrumente AG, Winterthur, Switzerland).
After the warm-up, an experienced investigator verbally described and demonstrated the correct technique of the FW squats. The participant then performed two to three sets of five to ten submaximal FW squats with each FW load to achieve the correct tempo and amplitude of squat execution—the accustomization protocol.
Subsequently, three loading conditions were applied to subjects in opposite random order to avoid systematic inter-trial effects. Participants performed eight squat repetitions with each load. The first two repetitions were used to accelerate FW and stabilize squat amplitude and were excluded from data analysis; the following six repetitions were performed at maximal effort and analysed post-hoc. The number of consecutive squat repetitions and the FW loads were selected based on previous reliability research findings [18]. Participants performed the squat from the bottom position (90° knee angle) to full extension of the knees (0° knee angle). Arms were crossed with the hands on the opposite shoulders, and ankle extension was not allowed. Participants were instructed to perform the concentric phase as quickly as possible, delaying breaking during the first third of the eccentric phase and making the transition from the eccentric to the concentric phase of the squat as short as possible. During all testing sessions, participants received loud verbal encouragement. To standardize the participants’ range of motion, the squat amplitude was monitored, and real-time feedback was provided on the screen in front of the subject. Rest periods between the different loads were at least 2 min long [26], allowing participants to maintain maximal power levels under the different loading conditions.
2.4. Data Processing
The position and force data were simultaneously collected at a frequency of 1000 Hz and filtered using a moving average filter with a 50-ms window. During each of the FW loads, force parameters were calculated directly from the force plates. Mean and peak values of the force parameters were calculated for both the concentric and eccentric phase of the squat (Figure 2).
2.5. Statistical Analysis
The mean and peak forces were calculated as an average of the six consecutive repetitions for each leg, load and both contraction phases. The equation used is based on previously established literature [27,28]. In our case, the symmetry values between the legs were calculated for each of the six repetitions according to the following equation:
The six repetitions averaged values of the absolute outcome measures, and the symmetry indexes are presented as means ± standard deviations.
Coefficient of variation (CV) and intraclass correlation coefficient (ICC2,1) with 95% confidence intervals (CI) [29,30] were calculated from the six consecutive repetitions (within-session reliability) for mean and peak force (both legs, concentric and eccentric phase of the contraction) and symmetry values at each FW load. CV values <10% were deemed acceptable [31]. The values of the ICC2,1 were interpreted according to recent guidelines (ranges): <0.5 indicates poor reliability, 0.5–0.75 indicates moderate reliability, 0.75–0.9 indicates good reliability, and >0.90 indicates excellent reliability [30].
Normal distribution of data was tested with the Shapiro–Wilk test. Differences between absolute values were assessed with repeated measures multi-factor three-way (load; 0.05, 0.125, and 0.2 kg∙m2, contraction: concentric, eccentric; leg: left, right), followed by two-way (load; 0.05, 0.125, and 0.2 kg∙m2, contraction: concentric, eccentric) analysis of variance followed by Bonferroni post-hoc comparisons, separately for common peak and mean force values (both legs together). Paired t-tests were performed to assess differences between all absolute outcome metrics. Taking into account the non-normal distribution of the symmetry data, an aligned rank transformation was performed, while afterwards, type III ANOVA was performed. To assess symmetry differences between loads and phases of contraction, contrasts were used. In the case of statistical significance, Wilcoxon’s signed-rank test was used to assess the mean and peak symmetry value comparisons among different loading conditions. The effect size was calculated by taking the Z-value, dividing it by the number of observations over the two time-points (sample size multiplied by 2), and then taking the square root of this value [32]. Value of <0.1 is considered as a very small effect, 0.1–0.29 is considered to be a small effect, 0.3–0.49 a medium effect, and >0.5 a large effect. Statistical analyses were performed in SPSS (Version 26, IBM, Armonk, NY, USA) and R (4.0.2) [33]. For all analyses, the level of significance was set at p < 0.05.
3. Results
3.1. Reliability
The reliability results for the three different loads and the two phases of contraction (concentric and eccentric) are presented in Table 2. Reliability values are presented for the mean and peak force (both legs) and lateral symmetry values. In general, reliability results for absolute outcome metrics showed acceptable CV values (<10%) (except peak eccentric force for the load 0.05 kg∙m2, CV = 10.61) and excellent ICC2,1 values. Moreover, CV values for symmetry outcome metrics showed acceptable CV values (all <10%), while ICC2,1 values varied from poor to good reliability (Table 2).
3.2. Absolute Differences
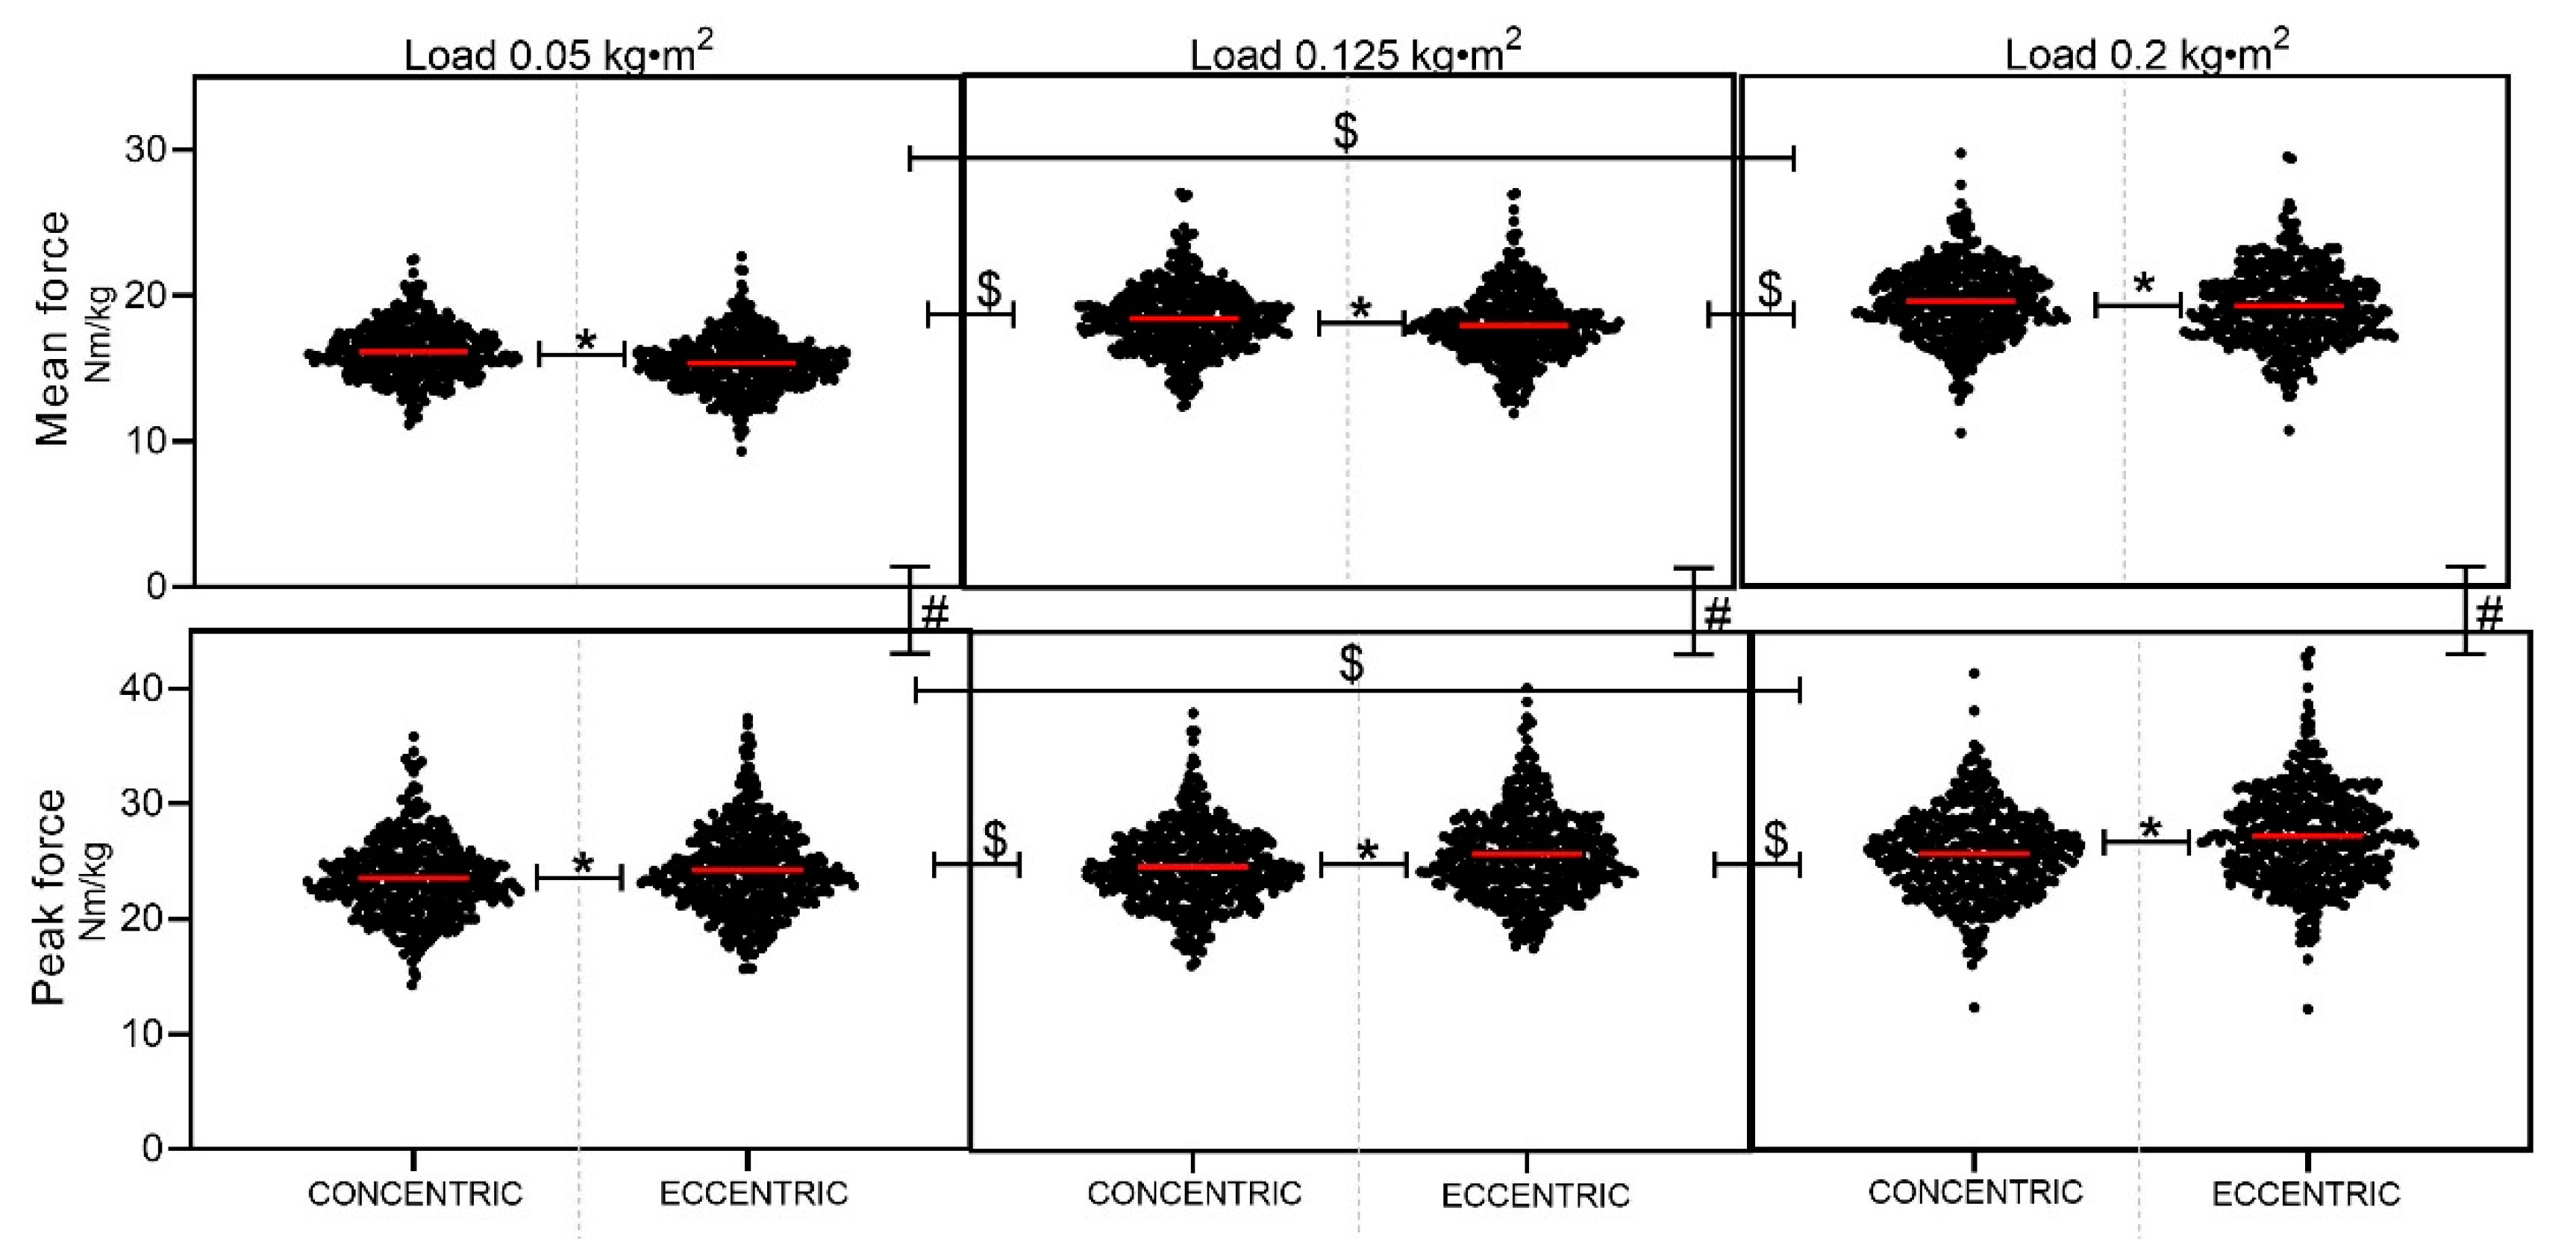
Three-way repeated measure ANOVA for the mean force values showed a significant effect of load (F = 2827.9, p = 0.000, 0.87) and phase (F = 3067, p = 0.000, 0.88), while there were no differences between the legs (F = 1.2, p = 0.27, 0.003). Moreover, there was a significant interaction between load and phase (F = 5181.5, p = 0.000). According to that, only common force (both legs together) was included in further analysis of absolute values. Due to that, two-way ANOVA was performed, where our results showed a significant effect of load (F = 870.9, p = 0.000, 0.67), phase (F = 70.8, p = 0.000, 0.14) and interaction between load and phase (F = 5.5, p = 0.004, 0.013) when mean force was observed. The results were similar when the peak force was assessed. There was a significant effect of load (F = 170.8, p < 0.001, 0.45), phase (F = 137.6, p < 0.001, 0.25) and interaction between load and phase (F = 38.8, p < 0.001, 0.16). We observed a statistically significant difference in mean and peak force between all three loads (all p < 0.001). Both the mean and peak force significantly increased with a higher load (Figure 3). Differences in mean force between phases showed a significantly lower force in the eccentric phase of contraction (p < 0.001). In contrast, the eccentric force was significantly higher compared to the concentric when the peak force values were observed (p < 0.001). All pairwise comparisons are presented in Figure 3.
3.3. Symmetry
Our results of symmetry values using the mean force showed significant effect of phase (F = 359.6, p < 0.001), load (F = 3.1, p < 0.05), and significant interaction between phase and load (F = 6.0, p < 0.01).
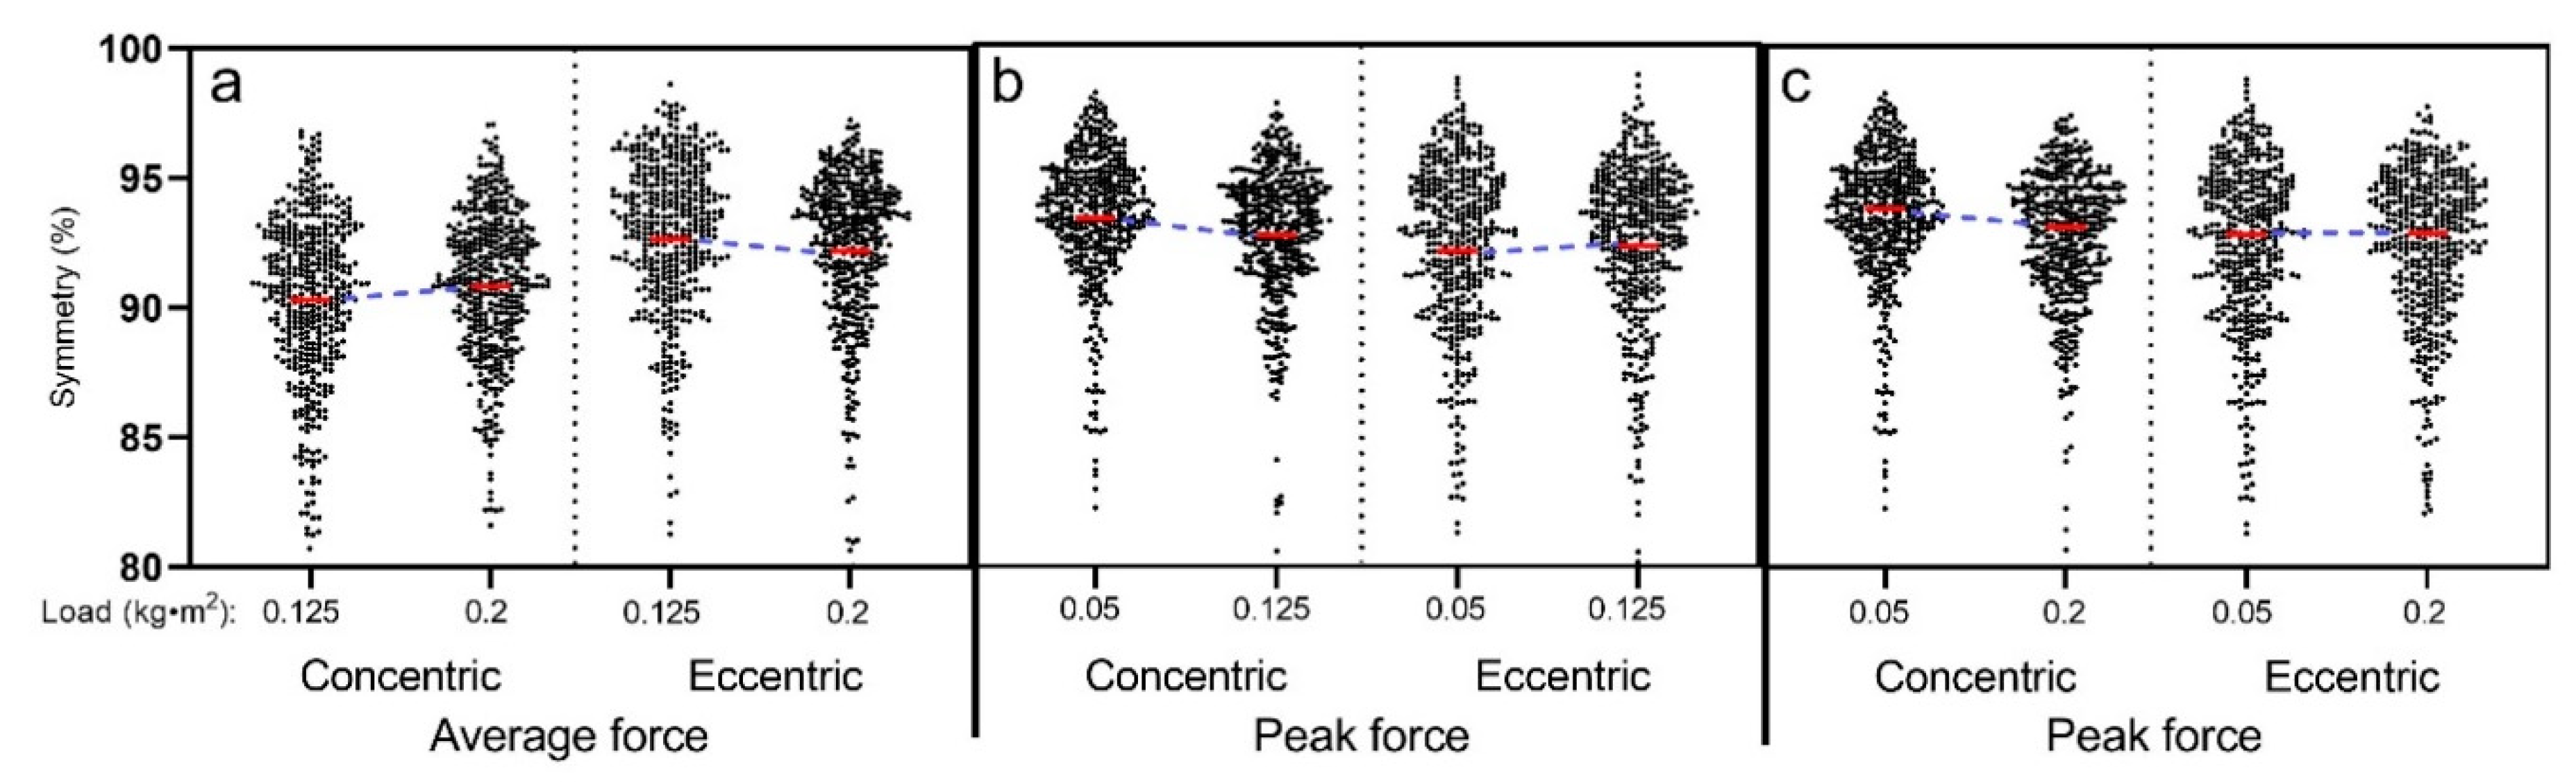
Pairwise comparison showed that the difference between the load 0.125 kg∙m2 and load 0.2 kg∙m2 in the concentric phase is significantly different than the difference between the load 0.125 kg∙m2 and load 0.2 kg∙m2 in the eccentric phase (p < 0.001). Symmetry values were significantly increased from the load 0.125 kg∙m2 (90.31%) to the load 0.2 kg∙m2 (90.82%) in the concentric phase (p < 0.01, ES = 0.12) and mean symmetry values were significantly decreased between the load 0.125 kg∙m2 (92.65%) and the load 0.2 kg∙m2 (92.19%) in the eccentric phase (p < 0.001, ES = 0.13) (Figure 4a).
In the case when maximal values were used for symmetry calculation, our results showed a significant effect of load (F = 7.2, p < 0.001), phase (F = 32.3, p < 0.001) and significant interaction between load and phase (F = 8.7, p < 0.001).
The pairwise comparison showed that the difference between the load 0.05 kg∙m2 and load 0.125 kg∙m2 in the concentric phase was significantly different than the difference between the load 0.05 kg∙m2 and load 0.125 kg∙m2 in the eccentric phase (p < 0.001). There was a significant decrease in symmetry values between load 0.05 kg∙m2 (93.36%) and load 0.125 kg∙m2 (92.70%) in the concentric phase (p < 0.001, ES = 0.17), while there were no significant differences in symmetry values between the load 0.05 kg∙m2 (92.11%) and load 0.125 kg∙m2 (92.31%) in the eccentric phase (p = 0.54, ES = 0.03). Moreover, the difference between the load 0.05 kg∙m2 and load 0.2 kg∙m2 in the concentric phase is significantly different than the difference between the load 0.05 kg∙m2 and load 0.2 kg∙m2 in the eccentric phase (p < 0.001). We found a significant decrease of symmetry values between the load 0.05 kg∙m2 (93.36%) and load 0.2 kg∙m2 (92.59%) in the concentric phase (p < 0.001, ES = 0.18) (Figure 4b), while there were no significant differences in the eccentric phase between the load 0.05 kg∙m2 (91.11%) and load 0.2 kg∙m2 (92.21%) (p = 0.98, ES = 0.001) (Figure 4c).
4. Discussion
This study is the first to evaluate lateral symmetries during bilateral FW squats in concentric and eccentric phases between different FW loads. Our reliability results showed acceptable CV for most outcome metrics, while ICC2,1 values were found to be excellent for all absolute force values and poor to good for lateral symmetry values. Moreover, we found that the mean and peak forces significantly increased with a higher FW load. Furthermore, mean force values were significantly higher in the concentric phase of contraction compared to the eccentric phase of contraction. Our results of lateral symmetry values showed a decrease in lateral symmetry with higher FW load in the eccentric phase, while the opposite trend was seen in the concentric phase when the mean force was evaluated. Moreover, the opposite trend was seen when the peak force was assessed. There was a decrease in lateral symmetry with higher FW load in the concentric phase, while the opposite was seen in the eccentric phase.
The main aim of our study was to assess symmetry between legs during squatting on an FW device. Different FW devices are nowadays popular and widely used tools for different purposes (i.e., resistance training, rehabilitation, exercise in an elderly population). However, symmetrical squatting and good postural control should be satisfied before participating in FW resistance training with higher loads. Thus, we evaluated lateral symmetries during squatting on an FW device between three different loads. Moreover, due to specific eccentric overload, which is present in FW squatting, we evaluated lateral symmetries in the concentric and eccentric phase of contraction using mean and peak force. When mean force was assessed, our results showed a significant increase of symmetry values between load 0.125 kg∙m2 (90.31%) and load 0.2 kg∙m2 (90.82%) in the concentric phase (p < 0.01, ES = 0.12), while a decrease in symmetry values between the same loads were seen in eccentric phase (92.65% vs. 92.19%) (p < 0.001, ES = 0.13). (Figure 4). In contrast, when symmetry values using peak force were compared, significant differences in the concentric phase were seen between load 0.05 kg∙m2 (93.36%) and 0.125 kg∙m2 (92.70%) (p < 0.001, ES = 0.17) and between load 0.05 kg∙m2 (93.36%) and load 0.2 kg∙m2 (92.59%) (p < 0.001, ES = 0.18). Based on this, we can conclude that, in general, there was a decrease in symmetry values in the concentric phase of contraction with a higher load. In the eccentric phase differences between loads showed the opposite trend, as symmetry values increased with higher load, but they were not significant (load 0.05 kg∙m2: 92.1%, load 0.125 kg∙m2: 92.3%, load 0.2 kg∙m2: 92.2%).To evaluate the trustworthy of our results the reliability analysis was performed. Our results showed excellent ICC2,1 (all ICC2,1 > 0.92) and acceptable CV values (<10%) for most absolute outcome metrics, except for the peak eccentric force of the right leg for Load 0.05 kg∙m2 (CV = 10.61). This is in accordance with some other studies which investigated reliability and validity of force [17] and force-velocity outcome measures [18] during squatting on FW device. However, lateral symmetry values during squatting on the FW device have not been assessed until now. All lateral symmetry values showed an acceptable CV, while ICC2,1 values were in general lower compared to absolute outcome metric. ICC2,1 values were higher in the eccentric phase (ICC2,1 = 0.43–0.80) compared to the concentric phase in which ICC2,1 values were poor (ICC2,1 = 0.37–0.52). Consequently, we can confirm our first hypothesis. Our results suggest that FW squatting can be a useful and simple way for multi-joint lateral symmetry evaluation in eccentric conditions. It is well known that high forces are produced in muscles working eccentrically, which can cause damage and injury prevention [34]. Because of that, lateral asymmetry evaluation in eccentric conditions can be useful for injury prevention.”
Based on the three-way ANOVA factor analysis, the comparison of the absolute force values showed significant differences between the loading conditions and contraction phases, while there were no differences between the legs. Due to that, only common force (both legs together) was included and presented in the further investigation of the absolute values. In the evaluation of common force, our results showed that mean and peak forces produced at different loading conditions depend on the contraction phase observed. When two-way ANOVA was applied to the factors, the significant differences of factors (load, contraction phase) were reconfirmed. Significant differences in mean and peak force were calculated between all three loads (all p < 0.001). Our results showed that both mean and peak force are increased with higher FW load, which can confirm the fact that participants performed the test with maximal effort (Figure 3, Table 2). Similar results were already confirmed in a previous study where mean and peak forces were increased with a higher FW load while performing knee extension, however, there were only 22 participants included in that study [6]. In case when mean force was evaluated, our results showed a significantly lower force in the eccentric phase compared to the concentric phase (p < 0.001) (Table 2, Figure 3). This can be explained with the fact that only a short period of high force is present in the eccentric phase (short peak force/eccentric overload), while concentric force production is present during the whole range of motion in the concentric phase [35]. Averaging whole concentric (propulsive) and eccentric (braking) phase of contraction consequently results in higher mean forces during the concentric phase (Table 2, Figure 3). Similar findings were presented by Vázquez-Guerrero et al. (2016) Ref. [36] who reported mean force outputs during squatting performance on an FW device were greater in the concentric phase compared to eccentric phase for four different FW loads. On the other hand, significantly higher peak force was observed in the eccentric phase compared to the concentric phase, which confirms the theory of eccentric overload during squatting on an FW device [6,35] (Table 2). Based on these results, we can only confirm the first part of our second hypothesis, while the second part can be confirmed only partially.
We are aware that these differences between contraction phases and different loads are extremely small and that significant differences are also a consequence of a very large sample size. However, these results represent valuable information about absolute lateral symmetry values in the FW squat, which was not questioned in the past. Several studies investigated lateral symmetries during different tasks such as isokinetic knee extension and flexion [1], squat exercise [14,37], bilateral vertical jumping [38], unilateral vertical jumping [3], and others [4]. These studies used different metrics for asymmetry calculation as peak torque [1], knee net joint torque [14], mean force [37], and peak force [3,37,38] and reported different lateral asymmetries ranging from 6% to 13.2%. In our case, absolute symmetry values were very similar for mean force in both phases (from 90.16–92.20% or 7.80–9.74%) and peak force in both phases (from 92.12–93.37% or 6.63%–7.88%). In general, we can notice slightly lower symmetry values in the concentric compared to the eccentric phase. This could be a consequence of longer force production during the concentric phase, where possible asymmetries influence force production during longer intervals compared to short eccentric action during the FW squat [39]. In addition, eccentric contractions require unique activation strategies by the nervous system [40], which could mean that the nervous system’s strategy for controlling movement during squatting could be independent of contraction type. However, it should be addressed that despite acceptable CV, symmetry values in the concentric phase had poor to good reliability, which should be considered. Nevertheless, similar findings can be found in the study by Hart et al. [41] where greater lateral asymmetries (peak force) were found in the concentric phase of countermovement jumps compared to the eccentric phase in professional football players.
In previous literature, a strong focus has been given to lateral (a)symmetries and injury incidence, which highlighted that lateral asymmetries >15% have been associated with increased injury incidence in athlete and non-athlete population [8,42]. Moreover, it has been investigated how lateral asymmetries in different abilities, such as strength, jumping and balance, influence physical and sport-specific performance [43]. Our study showed that quantifying (a)symmetries is possible with a bilateral task such as squatting on an FW device. Such measurements on an FW device enable us identifying (a)symmetry during forced eccentric movement, which is important for a wide range of functional movement where high eccentric forces occur (e.g., skiing). Moreover, assessment of FW squatting with different flywheel loads evaluates a wide spectrum of physical abilities such as strength, speed, power and balance. Due to that, further investigations should address (a)symmetry during FW squatting and its associations with injury risk and sport-specific performance.
There are a few limitations of our study. Despite a very large sample size, the results and conclusions can be related only to young, sport active and trained population. Furthermore, even though the sample was heterogeneous (sport, training history), there were no significant differences between groups. Better results may be collected with a longer familiarization protocol, as squatting on an FW device represents a specific movement for this type of participants. The direct transmission of a rope to the flywheel shaft provides us with an unbiased determination of the flywheel load [18] and a high intra-leg force data reliability. On the contrary, the discrepancy between high absolute reliability (CV) and lower lateral symmetry reliability (ICC2,1) values could be a consequence of the absolute/relative coefficient calculations from each of the six consecutive squat repetitions. Coiling the rope onto the shaft (spinning once to the left and once to the right) laterally changes the vector of pulling rope by the shaft radius, and it is plausible that the lateral force distribution is affected despite the execution of a bilateral task. Nevertheless, symmetry values when averaging an even number of repetitions (six) represent a valid result.
To sum up, our results showed that absolute mean and peak forces of concentric and eccentric phases of contraction have excellent reliability, while lateral symmetry values are more reliable when the eccentric force is used for their calculation. Mean and peak forces were increased with higher FW load. Mean force outputs during squatting performance on the FW device were greater in the concentric compared to the eccentric phase, while the opposite was seen when peak force was assessed. These results confirm the theory of eccentric overload [6,39]. In general, we found a decrease in symmetry values in the concentric phase of contraction with a higher load. However, we are aware that these significant differences are very small from a practical point of view. Moreover, values of lateral (a)symmetries are similar to a wide range of other functional movements. Nevertheless, symmetrical force application during squatting on the FW device should be satisfied regardless of the FW load as our results showed similar lateral (a)symmetries for three different loads. Furthermore, because of a slightly greater decrease of lateral symmetries in the concentric phase of contraction (peak force), it seems that more attention should be given to the movement in the propulsion phase. Due to the large sample size, our data (force and force symmetry) are valuable as a reference point when athletes are evaluated during training.
Author Contributions
Conceptualization, N.Š. and D.S. (Darjan Spudić); methodology, D.S. (Darjan Smajla), N.Š., and D.S. (Darjan Spudić); software, N.Š.; validation, D.S. (Darjan Smajla), N.Š., and D.S. (Darjan Spudić); formal analysis, D.S. (Darjan Smajla) and D.S. (Darjan Spudić); investigation, D.S. (Darjan Smajla); resources, N.Š.; data curation, D.S. (Darjan Smajla) and D.S. (Darjan Spudić); writing—original draft preparation, D.S. (Darjan Smajla); writing—review and editing, N.Š. and D.S. (Darjan Spudić); visualization, N.Š.; supervision, N.Š.; project administration, N.Š.; funding acquisition, N.Š. All authors have read and agreed to the published version of the manuscript.
Funding
This research was funded by the Slovenian Research Agency, grant number L5-1845: Body asymmetries as a risk factor in musculoskeletal injury development: studying etiological mechanisms and designing corrective interventions for primary and tertiary preventive care and the research program found P5-0147 Kinesiology of monostructural, polystructural, and conventional sports.
Institutional Review Board Statement
The study was conducted according to the guidelines of the Declaration of Helsinki and approved by the Slovenian Medical Ethics Committee (approval no. 0120-99/2018/5).
Informed Consent Statement
Informed consent was obtained from all subjects involved in the study.
Data Availability Statement
The data presented in this study are available on request from the corresponding author. The data are not publicly available due to privacy restrictions.
Conflicts of Interest
The authors declare no conflict of interest.
References
- Ruas, C.V.; Minozzo, F.; Pinto, M.D.; Brown, L.E.; Pinto, R.S. Lower-extremity strength ratios of professional soccer players according to field position. Kinesiology 2015, 47, 188–192. [Google Scholar] [CrossRef] [PubMed]
- Sato, K.; Heise, G. Influence of weight distribution asymmetry on the biomechanics of a barbell back squat. J. Strenght Cond. Res. 2012, 26, 342–349. [Google Scholar] [CrossRef] [PubMed] [Green Version]
- Bishop, C.; Read, P.; Chavda, S.; Jarvis, P.; Turner, A. Using unilateral strength, power and reactive strength tests to detect the magnitude and direction of asymmetry: A test-retest design. Sports 2019, 7, 58. [Google Scholar] [CrossRef] [PubMed] [Green Version]
- DosʼSantos, T.; Thomas, C.; Jones, P.A.; Comfort, P. Assessing asymmetries in change of direction speed performance: Application of change of direction deficit. J. Strength Cond. Res. 2019, 33, 2953–2961. [Google Scholar] [CrossRef] [PubMed] [Green Version]
- Nuñez Sanchez, F.J.; De Villarreal, E.S. Does flywheel paradigm training improve muscle volume and force? A meta-analysis. J. Strength Cond. Res. 2017, 31, 3177–3186. [Google Scholar] [CrossRef]
- Martinez-Aranda, L.M.; Fernandez-Gonzalo, R. Effects of inertial setting on power, force, work, and eccentric overload during flywheel resistance exercise in women and men. J. Strength Cond. Res. 2017, 31, 1653–1661. [Google Scholar] [CrossRef]
- Kannus, P. Isokinetic Evaluation of Muscular Performance. Int. J. Sports Med. 1994, 15, S11–S18. [Google Scholar] [CrossRef]
- Impellizzeri, F.M.; Rampinini, E.; Maffiuletti, N.; Marcora, S.M. A vertical jump force test for assessing bilateral strength asymmetry in athletes. Med. Sci. Sports Exerc. 2007, 39, 2044–2050. [Google Scholar] [CrossRef] [Green Version]
- Jones, P.; Bampouras, T. A comparison of isokinetic and functional methods of assessing bilateral strength imbalance. J. Strenght Cond. Res. 2010, 24, 1553–1558. [Google Scholar] [CrossRef]
- Bishop, C.; Pereira, L.A.; Reis, V.P.; Read, P.; Turner, A.N.; Loturco, I. Comparing the magnitude and direction of asymmetry during the squat, countermovement and drop jump tests in elite youth female soccer players. J. Sports Sci. 2019, 7. [Google Scholar] [CrossRef]
- Dos’Santos, T.; Thomas, C.; Jones, P.A.; Comfort, P. Asymmetries in single and triple hop are not detrimental to change of direction speed. J. Trainology 2017, 6, 35–41. [Google Scholar] [CrossRef] [Green Version]
- Maffiuletti, N.A.; Bizzini, M.; Widler, K.; Munzinger, U. Asymmetry in quadriceps rate of force development as a functional outcome measure in TKA. Clin. Orthop. Relat. Res. 2010, 468, 191–198. [Google Scholar] [CrossRef] [PubMed] [Green Version]
- Raya-González, J.; Castillo, D.; Domínguez-Díez, M.; Hernández-Davó, J.L. Eccentric-overload production during the flywheel squat exercise in young soccer players: Implications for injury prevention. Int. J. Environ. Res. Public Health 2020, 17, 3671. [Google Scholar] [CrossRef] [PubMed]
- Flanagan, S.; Salem, G. Bilateral differences in the net joint torques during the squat exercise. J. Strenght Cond. Res. 2007, 21, 1220–1226. [Google Scholar] [CrossRef] [PubMed]
- Norrbrand, L.; Pozzo, M.; Tesch, P.A. Flywheel resistance training calls for greater eccentric muscle activation than weight training. Eur. J. Appl. Physiol. 2010, 110, 997–1005. [Google Scholar] [CrossRef] [PubMed]
- Gual, G.; Fort-Vanmeerhaeghe, A.; Romero-Rodríguez, D.; Tesch, P. Effects of in-season inertial resistance training with eccentric overload in a sports population at risk for patellar tendinopathy. J. Strenght Cond. Res. 2016, 30, 1834–1842. [Google Scholar] [CrossRef] [PubMed]
- Beato, M.; Fleming, A.; Coates, A.; Dello Iacono, A. Validity and reliability of a flywheel squat test in sport. J. Sports Sci. 2020, 1–7. [Google Scholar] [CrossRef]
- Spudić, D.; Smajla, D.; Šarabon, N. Validity and reliability of force–velocity outcome parameters in flywheel squats. J. Biomech. 2020, 107, 109824. [Google Scholar] [CrossRef]
- Bishop, C.; Read, P.; Lake, J.; Chavda, S.; Turner, A. Interlimb asymmetries: Understanding how to calculate differences from bilateral and unilateral tests. Strength Cond. J. 2018, 40, 1–6. [Google Scholar] [CrossRef] [Green Version]
- Croisier, J.L.; Forthomme, B.; Namurois, M.H.; Vanderthommen, M.; Crielaard, J.M. Hamstring muscle strain recurrence and strength performance disorders. Am. J. Sports Med. 2002, 30, 199–203. [Google Scholar] [CrossRef]
- Knapik, J.J.; Bauman, C.L.; Jones, B.H.; Harris, J.M.; Vaughan, L. Preseason strength and flexibility imbalances associated with athletic injuries in female collegiate athletes. Am. J. Sports Med. 1991, 19, 76–81. [Google Scholar] [CrossRef] [PubMed]
- Manning, J.; Pickup, L. Symmetry and performance in middle distance runners. Int. J. Sport. Med. 1998, 19, 205–209. [Google Scholar] [CrossRef] [PubMed]
- Mendez-Villanueva, A.; Suarez-Arrones, L.; Rodas, G.; Fernandez-Gonzalo, R.; Tesch, P.; Linnehan, R.; Kreider, R.; Di Salvo, V. MRI-based regional muscle use during hamstring strengthening exercises in elite soccer players. PLoS ONE 2016, 11, e0161356. [Google Scholar] [CrossRef] [PubMed] [Green Version]
- Carroll, K.M.; Wagle, J.P.; Sato, K.; Taber, C.B.; Yoshida, N.; Bingham, G.E.; Stone, M.H. Characterising overload in inertial flywheel devices for use in exercise training. Sport. Biomech. 2018, 18, 390–401. [Google Scholar] [CrossRef] [PubMed]
- Bishop, C.; Lake, J.; Irineu, L.; Papandopoulos, K.; Turner, A.; Read, P. Interlimb Asymmetries: The Need for an Individual Approach to Data Analysis. J. Strength Cond. Res. 2018, 1–7. [Google Scholar] [CrossRef]
- Sabido, R.; Hernández-davó, J.L.; Capdepon, L.; Tous-fajardo, J. How are mechanical, physiological, and perceptual variables affected by the rest interval between sets during a flywheel resistance session? Front. Physiol. 2020, 11, 1–8. [Google Scholar] [CrossRef]
- Bishop, C.; Read, P.; McCubbine, J.; Turner, A. Vertical and horizontal asymmetries are related to slower sprinting and jump performance in elite youth female soccer players. J. Strength Cond. Res. 2018, 35, 56–63. [Google Scholar] [CrossRef] [Green Version]
- Šarabon, N.; Smajla, D.; Maffiuletti, N.A.; Bishop, C. Strength, jumping and change of direction speed asymmetries in soccer, basketball and tennis players. Symmetry 2020, 12, 1664. [Google Scholar] [CrossRef]
- Hopkins, W.G. Measures of reliability in sports medicine and science. Sport. Med. 2000, 30, 1–15. [Google Scholar] [CrossRef] [Green Version]
- Koo, T.K.; Li, M.Y. A guideline of selecting and reporting intraclass correlation coefficients for reliability research. J. Chiropr. Med. 2015. [Google Scholar] [CrossRef] [Green Version]
- Cormack, S.; Newton, R.; McGuigan, M.; Doyle, T. Reliability of measures obtained during single and repeated countermovement jumps. Int. J. Sport Physiol. Perform. 2008, 3, 131–144. [Google Scholar] [CrossRef] [PubMed] [Green Version]
- Pallant, J. SPSS Survival Manual: A Step by Step Guide to Data Analysis Using IBM SPSS; Open University Press/McGraw-Hill: Maidenhead, UK, 2016. [Google Scholar]
- R Core Team. R: A Language and Environment for Statistical Computing; R Foundation for Statistical Computing: Vienna, Austria, 2020. [Google Scholar]
- LaStayo, P.; Woolf, J.; Lewek, M.; Snyder-Mackler, L.; Reich, T.; Lindstedt, S. Eccentric muscle contractions: Their contribution to injury, prevention, rehabilitation, and spor. J. Orthop. Sport Phys. Ther. 2003, 33, 557–572. [Google Scholar] [CrossRef] [PubMed] [Green Version]
- Norrbrand, L.; Fluckey, J.D.; Pozzo, M.; Tesch, P.A. Resistance training using eccentric overload induces early adaptations in skeletal muscle size. Eur. J. Appl. Physiol. 2008, 102, 271–281. [Google Scholar] [CrossRef] [PubMed]
- Vázquez-Guerrero, J.; Moras, G.; Baeza, J.; Rodríguez-Jiménez, S. Force outputs during squats performed using a rotational inertia device under stable versus unstable conditions with different loads. PLoS ONE 2016, 11, e0154346. [Google Scholar] [CrossRef] [PubMed]
- Newton, R.; Gerber, A.; Nimphius, S.; Shim, J.; Doan, B.; Robertson, M.; Pearson, D.; Craig, B.; Häkkinen, K.; Kraemer, W. Determination of functional strength imbalance of the lower extremities. J. Strenght Cond. Res. 2006, 20, 971–977. [Google Scholar]
- Menzel, H.-J.; Chagas, M.H.; Szmuchrowski, L.A.; Araujo, S.R.S.; de Andrade, A.G.P.; de Jesus-Moraleida, F.R. Analaysis of lower limb asymmetries by isokinetic and vertical jump tests in soccer players. J. Strength Cond. Res. 2013, 27, 1370–1377. [Google Scholar] [CrossRef]
- Norrmbrand, L. Acute and Early Chronic Responses to Resistance Exercise Using Flywheel or Weights. Karolisnska Institute. 2008. Available online: https://openarchive.ki.se/xmlui/handle/10616/40201 (accessed on 11 January 2021).
- Enoka, R.M. Eccentric contractions require unique activation strategies by the nervous system. J. Appl. Physiol. 1996, 81, 2339–2346. [Google Scholar] [CrossRef] [Green Version]
- Hart, L.M.; Cohen, D.D.; Patterson, S.D.; Springham, M.; Reynolds, J.; Read, P. Previous injury is associated with heightened countermovement jump force-time asymmetries in professional soccer players. Transl. Sport. Med. 2019, 2, 256–262. [Google Scholar] [CrossRef]
- Logerstedt, D.; Grindem, H.; Lynch, A.; Eitzen, I.; Engerbretsen, L.; Risberg, M.; Axe, M.; Mackler, L. Single-legged Hop test as predictors of self-reported knee function after ACL reconstruction. Am. J. Sports Med. 2012, 40, 2348–2356. [Google Scholar] [CrossRef] [Green Version]
- Bishop, C.; Read, P.; Brazier, J.; Jarvis, P.; Chavda, S.; Bromley, T.; Turner, A. Effects of interlimb asymmetries on acceleration and change of direction speed. J. Strength Cond. Res. 2019. online ahead of print. [Google Scholar] [CrossRef] [PubMed]
Figure 1.
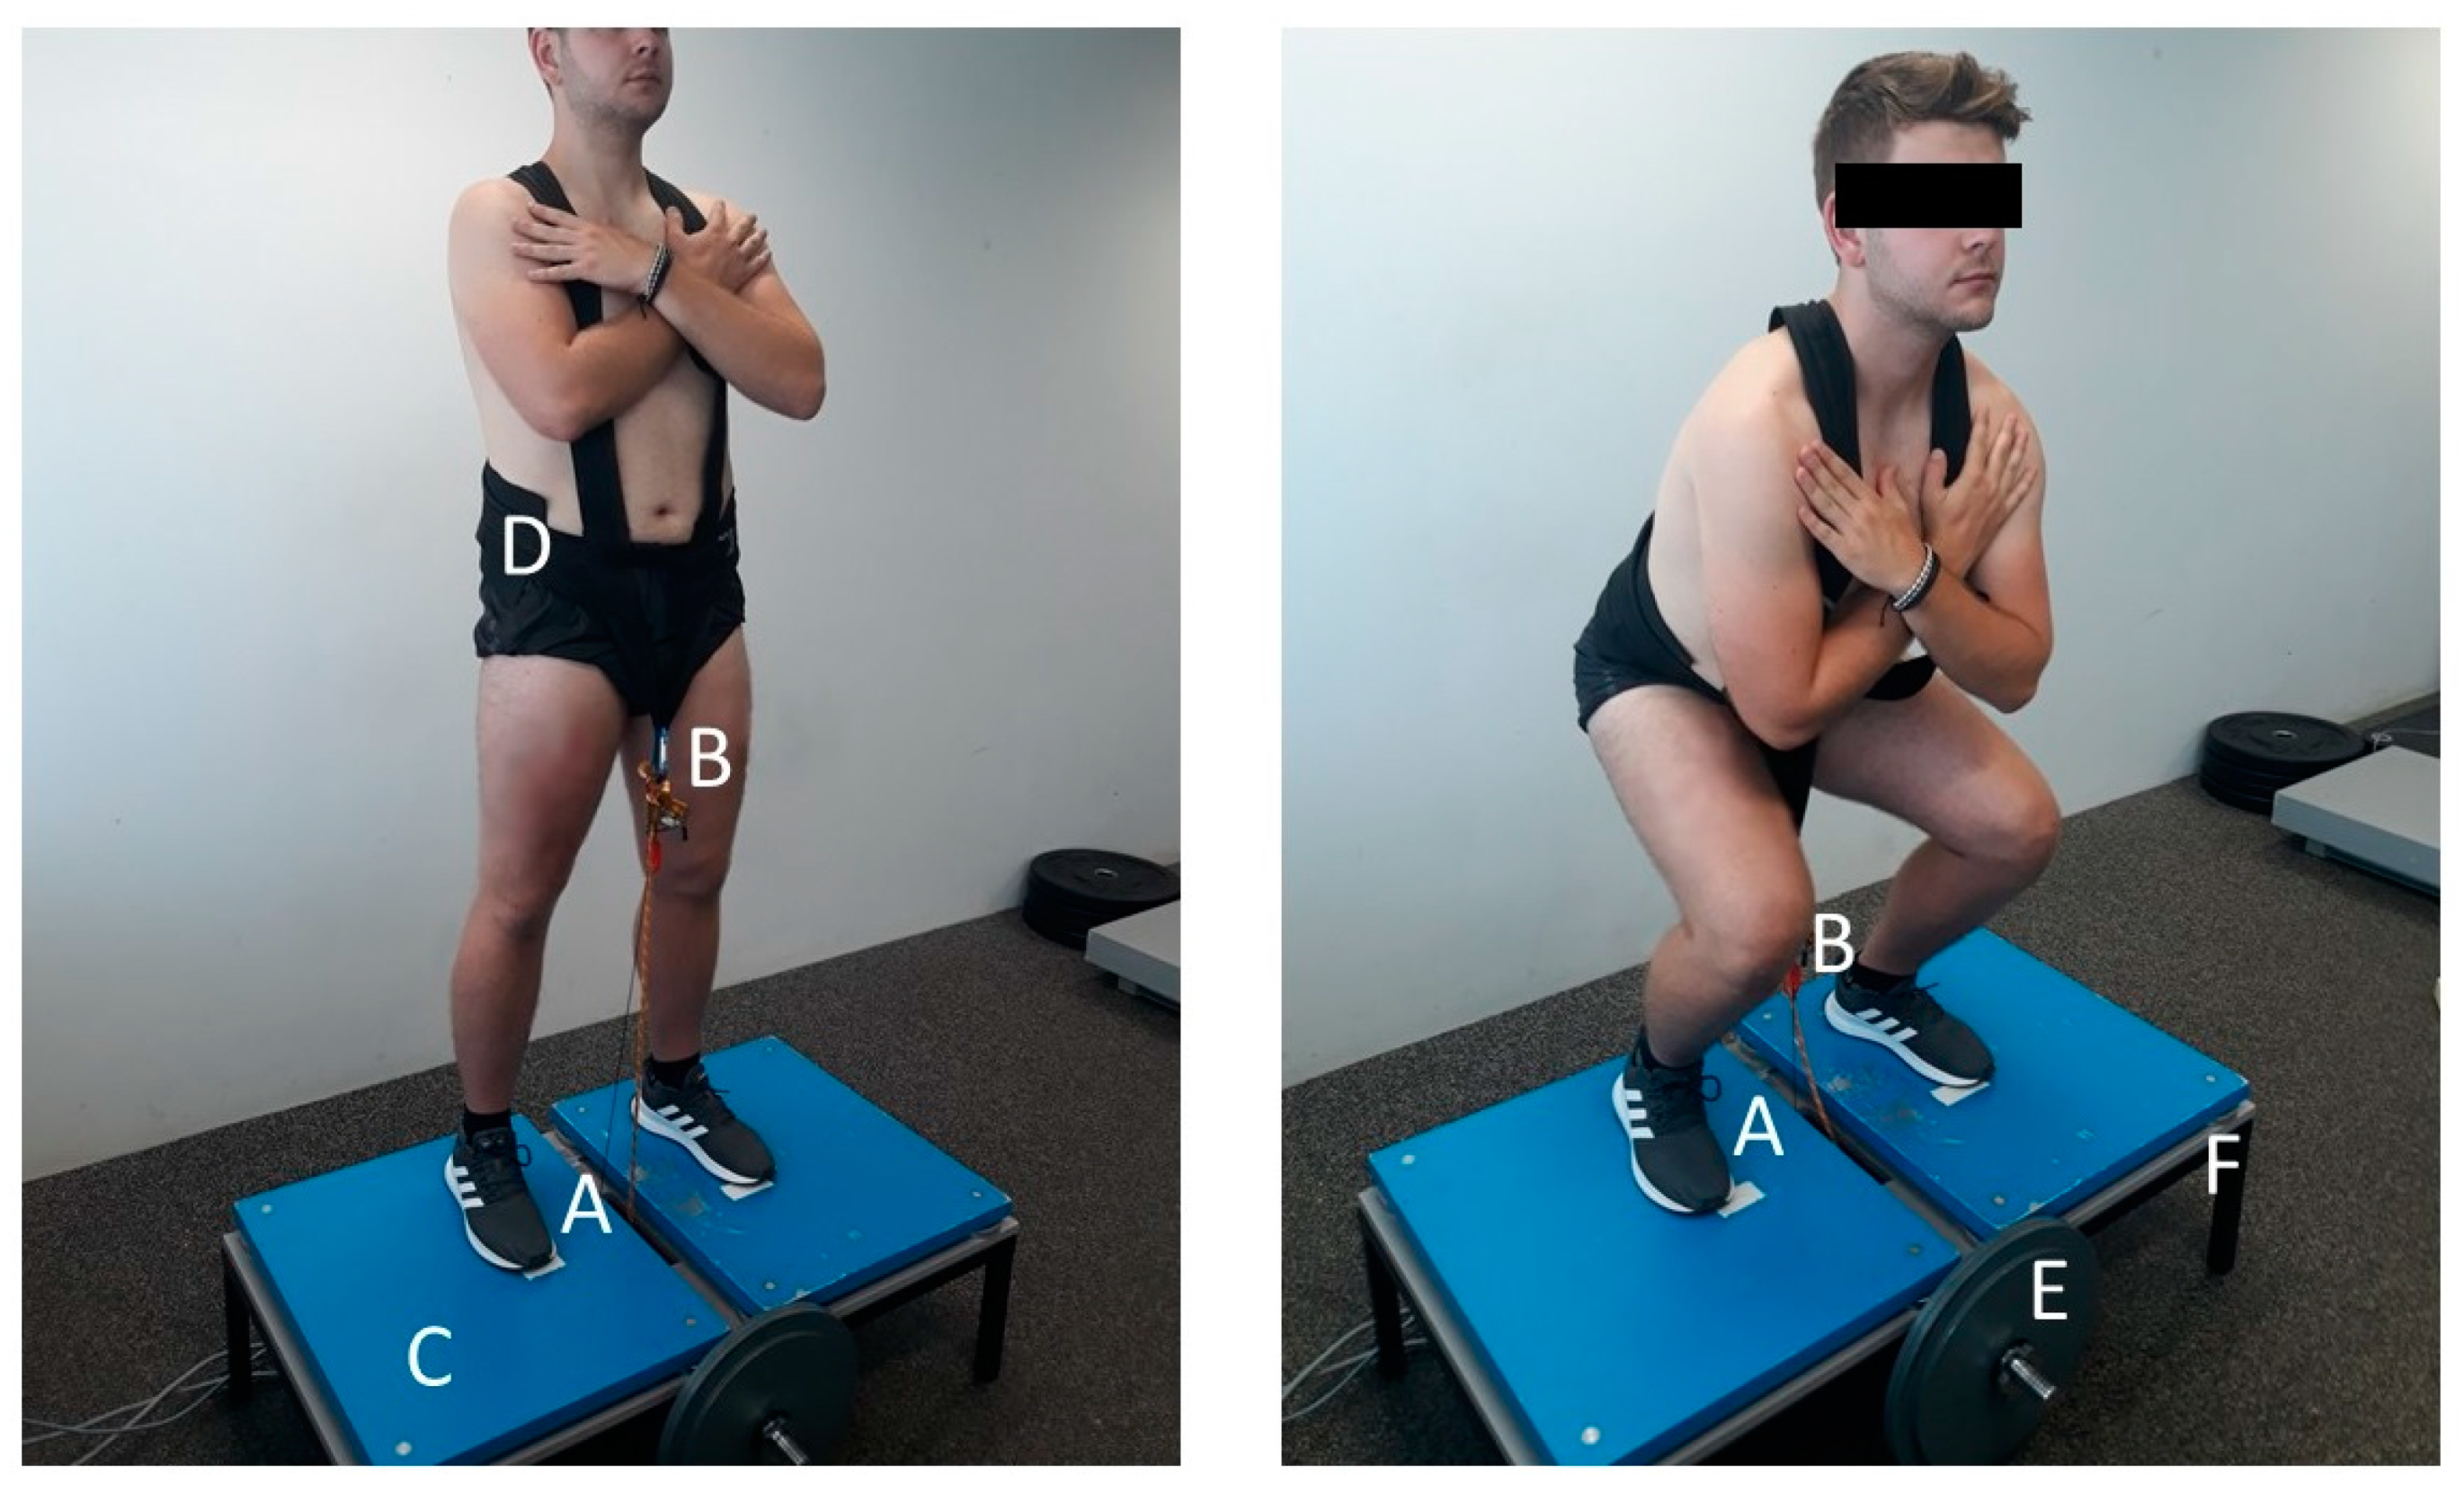
Position and measurement setup for bilateral ground reaction force measurement during flywheel (FW) squats. The FW device used the inertia of a rotating FW load (E) to generate resistance. The dimensions of the FW standing platform (F) were 1.1 × 0.6 m (width × length). To aid in performing FW squats, participants wore a harness (D). Participants stood on the force plates (C) in a symmetrical position. A draw-wire sensor was placed under the device (A). The distal part of the wire was attached to the harness and to the rope attachment between the legs (B).
Figure 1.
Position and measurement setup for bilateral ground reaction force measurement during flywheel (FW) squats. The FW device used the inertia of a rotating FW load (E) to generate resistance. The dimensions of the FW standing platform (F) were 1.1 × 0.6 m (width × length). To aid in performing FW squats, participants wore a harness (D). Participants stood on the force plates (C) in a symmetrical position. A draw-wire sensor was placed under the device (A). The distal part of the wire was attached to the harness and to the rope attachment between the legs (B).

Figure 2.
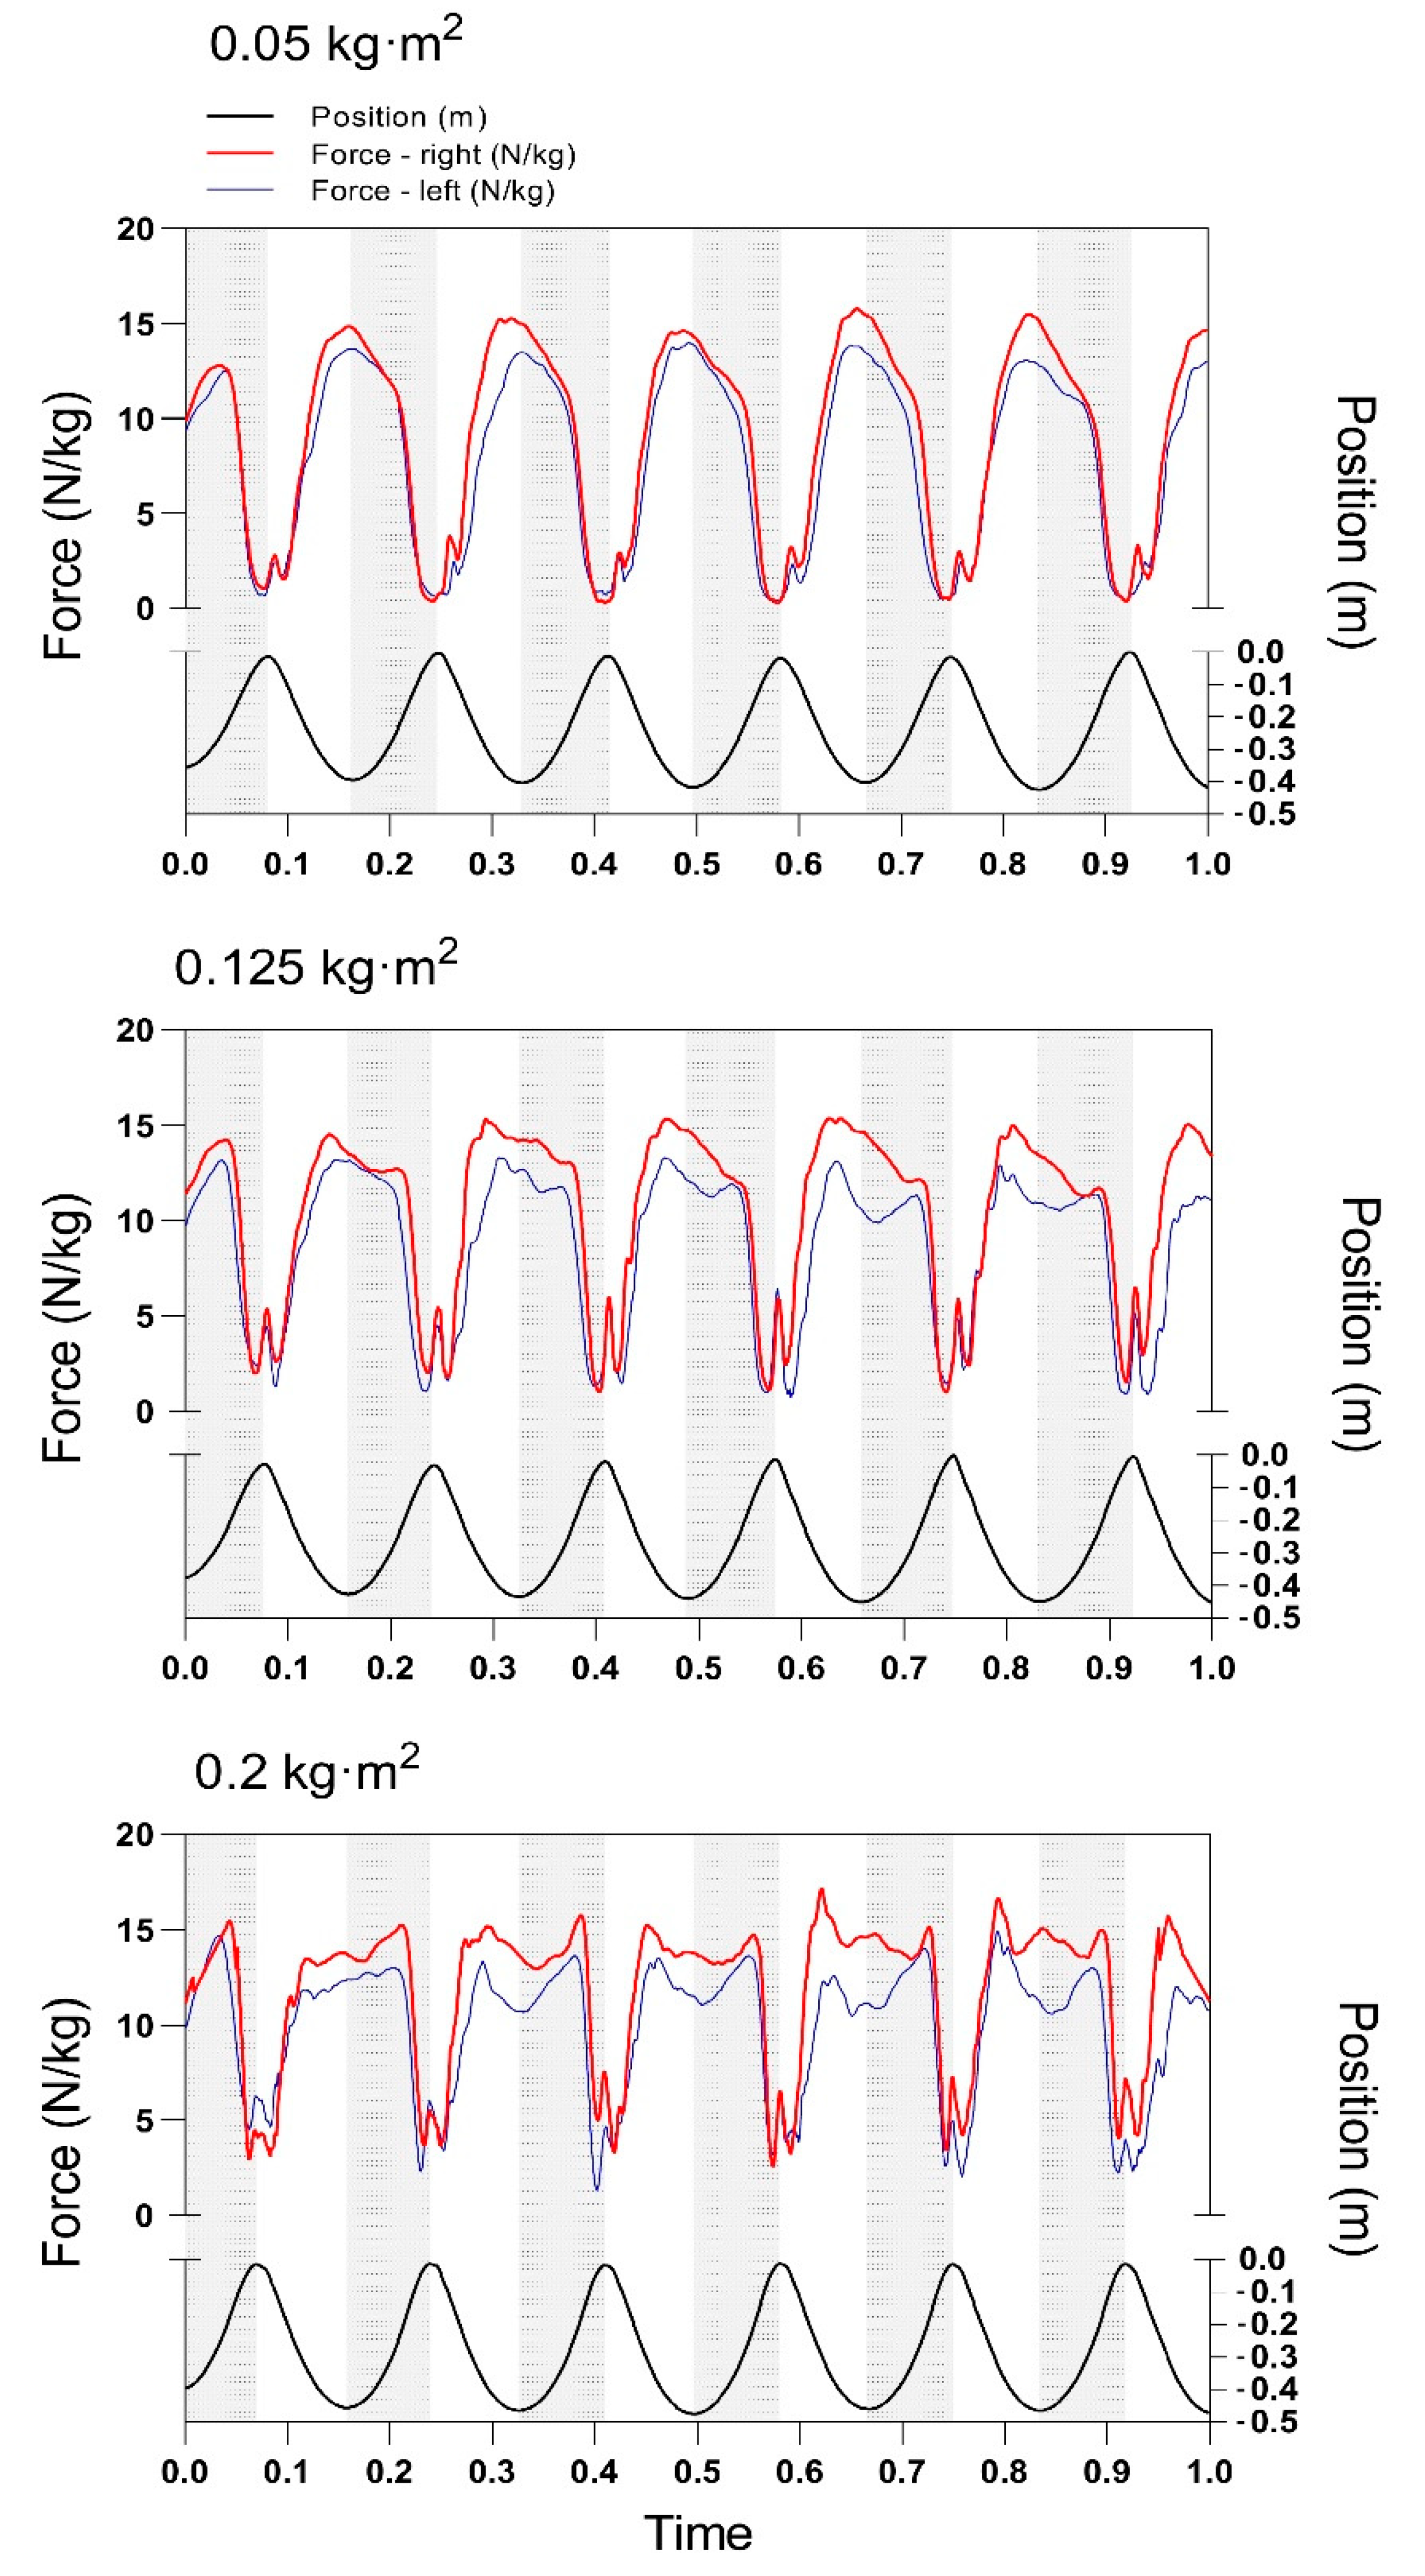
Representative time normalized force (upper part) and position data (lower part) during FW squats. Data are presented for six consecutive squat repetitions at three different loading conditions (0.05, 0.125, and 0.225 kg∙m2). Repetitions were determined from position data cycles, starting at the lowest (approximately 90° knee flexion) going through the highest (approximately 0° knee flexion) position and stopping again at the lowest vertical position. The shaded area represents the concentric phase of the squat.
Figure 2.
Representative time normalized force (upper part) and position data (lower part) during FW squats. Data are presented for six consecutive squat repetitions at three different loading conditions (0.05, 0.125, and 0.225 kg∙m2). Repetitions were determined from position data cycles, starting at the lowest (approximately 90° knee flexion) going through the highest (approximately 0° knee flexion) position and stopping again at the lowest vertical position. The shaded area represents the concentric phase of the squat.

Figure 3.
Differences in absolute values of the mean and peak force (both legs) between different loads and phases. * Significant differences between contraction phases (p < 0.001); # significant differences for all pairwise comparisons (concentric and eccentric phase) between mean and peak force (p < 0.001). $ significant differences for all pairwise comparisons (mean and peak force) between three different loads (p < 0.001).

Figure 4.
Selected symmetries (statisticaly significant contrasts) between different loads for eccentric and concentric phase: (a) load 0.125 kg∙m2 and load 0.2 kg∙m2 (mean force); (b) load 0.05 kg∙m2 and load 0.125 kg∙m2 (peak force); (c) load 0.05 kg∙m2 and Load 0.2 kg∙m2 (peak force).
Figure 4.
Selected symmetries (statisticaly significant contrasts) between different loads for eccentric and concentric phase: (a) load 0.125 kg∙m2 and load 0.2 kg∙m2 (mean force); (b) load 0.05 kg∙m2 and load 0.125 kg∙m2 (peak force); (c) load 0.05 kg∙m2 and Load 0.2 kg∙m2 (peak force).


Table 1.
Subjects’ characteristics.
| n | Age (Years) | Body Height (cm) | Body Mass (kg) | BMI (kg/m2) | Left Preferred n | Right Preferred n | |
|---|---|---|---|---|---|---|---|
| Female | 119 | 20.3 ± 8.4 | 170.3 ± 6.9 | 62.8 ± 9.4 | 21.6 ± 2.5 | 84 | 35 |
| Male | 303 | 18.4 ± 5.3 | 181.9 ± 8.2 | 73.3 ± 11.1 | 22. 1± 2.4 | 188 | 115 |
| All | 422 | 18.9 ± 6.4 | 178.6 ± 9.5 | 70.3 ± 11.7 | 21.9 ± 2.4 | 272 | 150 |
Mean data ± standard deviation.
Table 2.
Force and lateral symmetry reliability values for different loads (0.05 kg∙m2, 0.125 kg∙m2, and 0.2 kg∙m2) and contraction phases (concentric and eccentric).
Table 2.
Force and lateral symmetry reliability values for different loads (0.05 kg∙m2, 0.125 kg∙m2, and 0.2 kg∙m2) and contraction phases (concentric and eccentric).
| KERRYPNX | Load (kg∙m2) | Left | Right | Symmetry | ||||||
|---|---|---|---|---|---|---|---|---|---|---|
| M ± SD (N/kg) | CV (%) | ICC2,1 (95% CI) | M ± SD (N/kg) | CV (%) | ICC2,1 (95% CI) | M ± SD (%) | CV (%) | ICC2,1 (95% CI) | ||
| Concentric | Mean force: | |||||||||
| 0.05 | 8.07 ± 0.91 | 8.89 | 0.92 (0.90, 0.93) | 8.03 ± 0.91 | 8.15 | 0.92 (0.90, 0.91) | 90.16 ± 3.35 | 8.20 | 0.37 (0.28, 0.36) | |
| 0.125 | 9.20 ± 1.11 | 8.40 | 0.93 (0.92, 0.94) | 9.23 ± 1.08 | 8.57 | 0.93 (0.91, 0.94) | 90.31 ± 3.27 | 7.97 | 0.38 (0.29, 0.47) | |
| 0.2 | 9.78 ± 1.24 | 8.88 | 0.95 (0.94, 0.96) | 9.76 ± 1.23 | 8.21 | 0.95 (0.94, 0.96) | 90.82 ± 2.99 | 7.80 | 0.33 (0.23, 0.41) | |
| Peak force: | ||||||||||
| 0.05 | 11.77 ± 1.66 | 5.23 | 0.95 (0.93, 0.96) | 11.71 ± 1.64 | 7.73 | 0.95 (0.93, 0.96) | 93.37 ± 2.69 | 4.86 | 0.52 (0.44, 0.58) | |
| 0.125 | 13.47 ± 8.96 | 9.55 | 0.95 (0.94, 0.96) | 13.49 ± 8.89 | 8.64 | 0.94 (0.93, 0.95) | 92.70 ± 2.81 | 6.35 | 0.42 (0.33, 0.50) | |
| 0.2 | 12.88 ± 1.83 | 8.58 | 0.96 (0.95, 0.96) | 12.83 ± 1.81 | 8.24 | 0.96 (0.95, 0.96) | 92.59 ± 2.69 | 6.06 | 0.42 (0.33, 0.50) | |
| Eccentric | Mean force: | |||||||||
| 0.05 | 7.68 ± 0.93 | 5.23 | 0.95 (0.93, 0.97) | 7.64 ± 0.93 | 5.68 | 0.95 (0.93, 0.96) | 91.73 ± 4.46 | 5.42 | 0.80 (0.74, 0.83) | |
| 0.125 | 8.96 ± 1.15 | 8.12 | 0.95 (0.93, 0.96) | 8.89 ± 1.12 | 6.64 | 0.95 (0.93, 0.96) | 92.65 ± 3.29 | 5.82 | 0.67 (0.61, 0.71) | |
| 0.2 | 9.62 ± 1.27 | 6.73 | 0.95 (0.94, 0.97) | 9.50 ± 1.23 | 6.72 | 0.95 (0.94, 0.96) | 92.20 ± 3.23 | 6.37 | 0.58 (0.51, 0.63) | |
| Peak force: | ||||||||||
| 0.05 | 12.12 ± 1.86 | 9.41 | 0.93 (0.92, 0.94) | 12.07 ± 1.84 | 10.61 | 0.93 (0.92, 0.94) | 92.12 ± 3.75 | 6.48 | 0.61 (0.55, 0.66) | |
| 0.125 | 12.89 ± 1.86 | 7.17 | 0.94 (0.93, 0.95) | 12.81 ± 1.81 | 9.76 | 0.93 (0.92, 0.94) | 92.31 ± 3.32 | 6.86 | 0.54 (0.46, 0.60) | |
| 0.2 | 13.66 ± 2.08 | 7.27 | 0.94 (0.93, 0.95) | 13.51 ± 1.99 | 7.85 | 0.94 (0.93, 0.95) | 92.21 ± 3.05 | 6.73 | 0.43 (0.34, 0.51) | |
M, mean value; SD, standard deviation; CV, coefficient of variation; ICC2,1, intraclass correlation coefficient; 95% CI, 95% confidence interval.
Publisher’s Note: MDPI stays neutral with regard to jurisdictional claims in published maps and institutional affiliations. |
© 2021 by the authors. Licensee MDPI, Basel, Switzerland. This article is an open access article distributed under the terms and conditions of the Creative Commons Attribution (CC BY) license (http://creativecommons.org/licenses/by/4.0/).
Share and Cite
MDPI and ACS Style
Smajla, D.; Spudić, D.; Šarabon, N. Influence of Load and Phase of Contraction on Lateral Symmetries in Flywheel Squats. Symmetry 2021, 13, 111. https://doi.org/10.3390/sym13010111
AMA Style
Smajla D, Spudić D, Šarabon N. Influence of Load and Phase of Contraction on Lateral Symmetries in Flywheel Squats. Symmetry. 2021; 13(1):111. https://doi.org/10.3390/sym13010111
Chicago/Turabian StyleSmajla, Darjan, Darjan Spudić, and Nejc Šarabon. 2021. "Influence of Load and Phase of Contraction on Lateral Symmetries in Flywheel Squats" Symmetry 13, no. 1: 111. https://doi.org/10.3390/sym13010111
Note that from the first issue of 2016, this journal uses article numbers instead of page numbers. See further details here.