Article

An Ensemble of Global and Local-Attention Based Convolutional Neural Networks for COVID-19 Diagnosis on Chest X-ray Images

1
Department of Computer Science, College of Computer Science and Information Technology, King Faisal University, P.O. Box 400, Al-Ahsa 31982, Saudi Arabia
2
Faculty of Computers and Information, Menoufia University, Menoufia 32511, Egypt
*
Author to whom correspondence should be addressed.
Symmetry 2021, 13(1), 113; https://doi.org/10.3390/sym13010113
Submission received: 10 December 2020 / Revised: 4 January 2021 / Accepted: 7 January 2021 / Published: 11 January 2021
(This article belongs to the Section Computer)

Abstract

:
The recent Coronavirus Disease 2019 (COVID-19) pandemic has put a tremendous burden on global health systems. Medical practitioners are under great pressure for reliable screening of suspected cases employing adjunct diagnostic tools to standard point-of-care testing methodology. Chest X-rays (CXRs) are appearing as a prospective diagnostic tool with easy-to-acquire, low-cost and less cross-contamination risk features. Artificial intelligence (AI)-attributed CXR evaluation has shown great potential for distinguishing COVID-19-induced pneumonia from other associated clinical instances. However, one of the associated challenges with diagnostic imaging-based modeling is incorrect feature attribution, which leads the model to learn misguiding disease patterns, causing wrong predictions. Here, we demonstrate an effective deep learning-based methodology to mitigate the problem, thereby allowing the classification algorithm to learn from relevant features. The proposed deep-learning framework consists of an ensemble of convolutional neural network (CNN) models focusing on both global and local pathological features from CXR lung images, while the latter is extracted using a multi-instance learning scheme and a local attention mechanism. An inspection of a series of backbone CNN models using global and local features, and an ensemble of both features, trained from high-quality CXR images of 1311 patients, further augmented for achieving the symmetry in class distribution, to localize lung pathological features followed by the classification of COVID-19 and other related pneumonia, shows that a DenseNet161 architecture outperforms all other models, as evaluated on an independent test set of 159 patients with confirmed cases. Specifically, an ensemble of DenseNet161 models with global and local attention-based features achieve an average balanced accuracy of 91.2%, average precision of 92.4%, and F1-score of 91.9% in a multi-label classification framework comprising COVID-19, pneumonia, and control classes. The DenseNet161 ensembles were also found to be statistically significant from all other models in a comprehensive statistical analysis. The current study demonstrated that the proposed deep learning-based algorithm can accurately identify the COVID-19-related pneumonia in CXR images, along with differentiating non-COVID-19-associated pneumonia with high specificity, by effectively alleviating the incorrect feature attribution problem, and exploiting an enhanced feature descriptor.

1. Introduction

Commencing from early 2020, Coronavirus Disease 2019 (COVID-19) has become a global pandemic causing a serious health crisis all around the world. COVID-19 is induced by a novel coronavirus called SARS-CoV-2 (Severe Acute Respiratory Syndrome Coronavirus 2), which is considered a novel strain in the family of coronaviruses previously unidentified in humans [1]. The exponential growth rate and rapid transmission of this infectious disease over many territories in multiple continents led the World Health Organization (WHO) to declare it as a global outbreak on 11 March 2020. As of the time of writing this manuscript, over 44 million COVID-19 cases have been confirmed worldwide with more than 1 million reported deaths [2]. The rapid growth rate of SARS-CoV-2 has imposed a substantial pressure on healthcare systems worldwide mainly due to the shortage of key personal protective equipment and qualified health-care providers. Furthermore, SARS-CoV-2 infection poses some unique challenges in terms of peak infectiousness, i.e., the time when the virus is most transmissible and preceding onset of symptoms, which make the exact prevalence and transmission dynamics of COVID-19 partly unclear [3]. The overall poorly defined infectiousness and transmission process make it particularly important to identify the infected cases at early stages and to isolate the subjects from the healthy population in order to avoid the risk of human-to-human transmission at the community level. Moreover, a significant number of COVID-19 cases admitted to intensive care units (ICU) suffer from respiratory distress and hypoxemia and require treatments like endotracheal intubation and ventilation [4]. Until this point, COVID-19 screening is primarily conducted by a viral nucleic acid detection technique known as reverse transcriptase polymerase chain reaction (RT-PCR). Although rapid RT-PCR is considered the golden reference point-of-care testing methodology for COVID-19 detection [4,5], this method associates several clinical problems: (1) High false-negative rate leading to underdiagnosing COVID-19-infected cases; (2) time-consuming test procedure and delays in processing; (3) variabilities in test techniques; and (4) sensitivities reported as low as 60–70% [5,6,7].
On the contrary, medical diagnostic imaging has arisen to be promising and a feasible alternative for many decision-making processes related to COVID-19 including diagnosis, complication assessment, prognosis, and triage decisions for hospitalization, because chest imaging of COVID-19 patients typically manifest abnormalities in most cases [5,6,7,8]. Specifically, chest radiography (CXR) and computed tomography (CT) are two imaging modalities that are being extensively employed by the forefront hospitals in outbreak sites for making clinical decisions related to COVID-19 [9,10,11]. Several studies reported the higher sensitivity of CT findings compared to RT-PCR, and highlighted that in some incidents, the CT findings could detect the lung abnormalities in the setting of a false negative RT-PCR test [9,10]. As CT imaging can most capture the respiratory distress syndromes, the most common representations of COVID-19, this is indicated for patients with moderate-severe clinical features and worsening respiratory status, and even for patients with mild clinical symptoms at the presence of risk for disease progression, according to the Fleischner1 Society consensus statement published on 7 April 2020 [11]. Furthermore, the chest CT findings are used as a substitute diagnostic test by some studies [12,13,14] and demonstrate high potential as a rapid diagnostic method of COVID-19 infection on an evaluation of 51 confirmed cases [4].
Providing that the chest CT imaging is more sensitive and indicated, recent COVID-19 radiology literature primarily focuses on the CT findings [4,8,9,10,11,12,13,14,15]. However, performing CT routinely for a large population is not feasible and carries further risks, mainly due to limited personal protective equipment (PPE) resources, increased risk of viral transmission due to the proximity of patients and radiology technicians, and exposure to additional ionizing radiation [14]. On the other hand, CXR imaging is associated with less expense, ease of carrying out, and less ionization exposure than CT [11]. Furthermore, the X-ray machines are much more accessible than CT scanners in resource-constrained environments. In addition, CXR imaging can be performed in the isolation rooms using portable X-ray machines, reducing the risk of viral contamination to staff, patients, and care givers, as well as saving the time and resources required to disinfect the equipment in the radiology department [3,16].
Typical radiographical appearances for COVID-19-infected cases include ground glass opacities (GGO) and air space consolidation. However, differential diagnosis from the similar radiography findings could possibly pose a challenge for the radiologists to discriminate between COVID-19-induced pneumonia and other kinds of viral and bacterial pneumonia including some inflammatory pulmonary infections [4]. In such cases, expert radiologists with several years of experience could make reliable diagnostics with high precision, resulting in a relatively longer screening time due to the limited availability and large workload. Under the current pandemic situation, this manual screening/diagnosis could be largely unproductive, undermining the efficacy of the imaging data. Moreover, the patients waiting for screening in hospitals may carry additional risks of viral transmission. In this aspect, artificial intelligence (AI) could play a pivotal role for the more effective use of the imaging tools in combating the COVID-19 outbreak. Advanced AI technologies with appropriate image processing could be successfully applied on imaging data for rapid COVID-19 screening, and quantifying the level of infections to assess the disease progression. The high predictive power of AI could not only expedite and automate these clinical decision processes, but could also help to achieve radiologist-level performances in the case of COVID-19 screening. Along the same line, the AI predictive models could serve as decision support systems to guide and assist the novice radiologists for COVID-19 identification in the imaging data.
A substantial amount of research was carried out on AI-assisted diagnostics using CXR imaging data, which will be briefly highlighted later in this article. The efforts were consolidated mainly into the classification of CXR images into COVID-19 and other types of pneumonia exploiting different deep learning architectures. Due to the limitation of imaging data sources with expert-labelled data sets, most methods relied on deep learning experiments in a ‘Transfer Learning’ (TL) setting, as an alternative to training a very deep model from scratch on a small dataset. In these works, either feature extraction or fine-tuning the network weights based on the new COVID-19 samples was used in customizing the pre-trained model in the TL setup. It is important to note that all the baseline models used were pre-trained on the ImageNet database, which is primarily a collection of over one million natural images [17]. For this medical image classification task, the TL using ImageNet pre-trained models may be suboptimal due to several factors: (1) The natural images are largely different than medical imaging data in terms of visual appearance and class labels; (2) the feature extraction network could be biased to the source data, leading to a less generalized model on the new target data [18]. Most of the proposed techniques use raw X-rays, which may lead to the wrong attribution in pathological images, eventually causing false predictions for both COVID-19-positive and -negative cases. However, this issue is either neglected or unaddressed in the majority of previous studies. Another important concern is the proper setting of the COVID-19 diagnosis framework. As other bacterial and viral pneumonia including some pulmonary infections may co-exist with COVID-19-induced pneumonia, the most suitable learning setup would be multi-label classification to handle the associated challenges of differential diagnosis. However, the multi-class classification formulation can be predominantly observed in the current COVID-19 automated diagnosis studies, which may not be the appropriate learning framework to tackle this problem.
In the present study, we proposed an ensemble of deep learning models, which combines both global and local deep features in a multi-label classification framework. We thoroughly investigated the wrong attribution in CXR images by extracting and analyzing the deep features from the deep learning models. We then addressed the problem by performing a region of interest localization followed by a lung segmentation in CXR images. A set of deep learning models were examined for this multi-label classification problem, and finally, the DenseNet161 models enriched with global and local attention deep features was found to be the best performing model.
The major contributions of this study are highlighted as follows.
1.
A thorough investigation and mitigation of the incorrect attribution problem in CXR images during the deep learning process through consecutive lung localization and segmentation.
2.
Identification of the best performing model for classifying COVID-19 through a comprehensive examination of multiple deep learning models with various combinations of global and local attention features using the state-of-the-art training technique of deep learning methods.
3.
Presentation of an ensemble of DenseNet161 models coupled with global and local attention-based features for COVID-19 identification in a three-label classification framework.
4.
Evaluation of the performances of deep learning models using state-of-the-art performance measures for multi-label classification problem.
5.
Testing the efficacy of data augmentation and class balancing techniques on the performance of deep learning models.

2. Related Work

The outbreak of COVID-19 has witnessed myriads of research efforts developing AI-based diagnostic and screening methods utilizing chest CXR imaging data. We aim to shed light on a set of literature focusing on CXR-based AI and deep learning methods in the following paragraphs.
Pham and his co-researchers described a deep convolutional neural network (CNN) based supervised multi-label classification framework for predicting the 14 common thoracic diseases on CXR images [19]. Trained on the large CXR dataset called ChexPert [20], the method utilized hierarchical dependencies among abnormality labels to achieve a competing AUC score of 0.94 in predicting five selected pathologies from the validation set. Gabruseva et al. proposed an automatic pneumonia detection technique using CXR images based on SSD RetinaNet with the SE-ResNext101 encoder pre-trained on ImageNet [21]. They developed a model to classify lung images into ‘Normal,’ ‘Lung Opacity,’ and ‘No Lung Opacity/Not Normal’ using a modified RetinaNet, heavy augmentation with custom rotations, and NMS thresholded postprocessing. Bansal et al. described a Deep TL approach using pre-trained Deep CNN models to classify CXR images to detect COVID-19 [22]. Bassi et al. applied transfer learning on CheXNet [23] to detect COVID-19 from CXR images. Specifically, a deep neural network model was built by using the initial weights of CheXNet, and then training the network by fine-tuning the weight decay and learning rate parameters with a variable number of training epochs [24]. Benbrahim et al. in his study [25] used the Deep Transfer Learning technique with a combination of DeepImageFeaturizer available in Apache Spark [26] and logistic regression to COVID-19 identification in CXR images. Chowdhury et al. employed CNN to identify COVID-19 patients based on chest X-ray images [27]. De Moura et al. utilized a customized DenseNet161 architecture, initialized with weights pre-trained on ImageNet [18], to classify the CXR images into healthy, pneumonia, and COVID-19 cases [28]. In a study by Ghoshal et al. [29], the uncertainty of the deep learning prediction for COVID-19 was estimated using a Bayesian CNN, which reports the high or low confidence score of its decision as a predictive posterior distribution. The authors reported a performance improvement of the image classification via the uncertainty-aware Bayesian model and observed an increase in prediction accuracy as the model uncertainty declines. Chatterjee et al. utilized an ensemble of five different pre-trained deep learning models, ResNet18, ResNet34, InceptionV3, InceptionResNetV2, and DenseNet16, to classify COVID-19, pneumonia, and healthy subjects using CXR [30]. The interpretability of each of the models was studied using different techniques and the ResNets were found to be the most interpretable model in terms of explaining the prediction outcomes through a qualitative analysis. Khan et al. proposed a CNN-based architecture, COVID-REnet, which incorporates edge- and region-based dynamic features extracted from a CNN with a SVM classifier to classify X-ray images into COVID-19 and healthy cases [31].
In a study by Lv et al. [32], COVID-19 and other kinds of pneumonia in chest radiography are examined using a Cascade-SEMEnet composed of SEME-ResNet50 for differentiating between bacterial and viral pneumonia, and DenseNet169 for distinguishing between COVID-19 and other types of viral pneumonia. They introduced various components to the custom network, such as Global Average Pooling (GAP), Squeeze-Excitation structure, and Attention mechanisms for its characteristics channel to emphasize on the pathological details of the image. Moreover, U-Net segmentation of the lung regions, CLAHE for image enhancement, and MoEx for rapid convergence of the network were also included to increase the effectivity of the proposed custom model. Three pre-trained Deep Transfer Learning models were investigated in a study by Narin et al. [33], in which the ResNet50 model achieved the highest performance in classifying chest X-ray radiograph images. Oh et al. proposed a patch-based CNN approach that can be manageable with a small number of training parameters for COVID-19 diagnosis [34]. The proposed model consists of a segmentation network extracting lung and heart contours from the CXR images using fully convolutional DenseNet103, and a classification network to classify the chest X-ray images into four classes: Normal, bacterial pneumonia, tuberculosis, and viral COVID-19 pneumonia using a Deep Transfer learning technique adapted on a base model called ResNet18. Rajaraman et al. described an iteratively pruned customized CNN with a linear stack of convolutional layers, GAP, and a dense layer for COVID-19 detection in chest X-rays [35]. They reported that Deep Learning Ensembles combined with Transfer learning and iterative model pruning demonstrated superior performances when compared to individual models. An adapted deep learning architecture from MobileNetV2 and ResNext, called CovIDNet, was proposed by Ramadhan et al. [36]. With a lesser number of hyperparameters, CovIDNet was trained with a two-class model (COVID-19 vs. non-COVID-19) with Softmax activations at the classification layer. In a retrospective study conducted by Duchesne et al., they utilized CXR deep learning features for classifying the disease trajectory categorized as ‘worse,’ ‘stable,’ and ‘improved’ [37]. A DenseNet121 architecture was trained on the CheXpert dataset, that was previously mapped to radiological labels. This trained network was used in two different ways: (1) To compute the difference in finding probabilities between sequential CXRs in each pair between three outcome groups; (2) to extract deep learning features from the last convolutional layer to feed into a logistic regression model after dimensionality reduction.
A deep Bayesian optimization-inspired SqueezeNet architecture-based rapid COVID-19 diagnosis was proposed in a study conducted by Ucar et al. [38]. The hyperparameters of the Deep-SqueezeNet model was fine-tuned using a Bayesian-based optimization technique on an augmented image dataset for a three-class classification of normal, pneumonia, and COVID-19. On the other hand, Ezzat et al. [39] applied a Gravitational Search optimization to fine-tune the hyperparameters of a pre-trained DenseNet-121 architecture on a CXR dataset. Rajaraman et al. examined various combinations of weakly labeled CXR images showing pathological signs for non-COVID-19 pneumonia from RSN, CheXpert, and NIH databases with a baseline Pediatric CXR dataset to train wide residual network-based custom CNN models [40]. As a preprocessing step, the lung ROI was cropped using a trained dilated dropout U-Net model to extract the relevant feature representation from the lung images. The objective of the weakly labeled augmentation in this study was to increase the deep learning model generalizability by expanding the learned feature space for an enhanced inter-class discrimination, through incorporating diversified training samples. Finally, Wang et al. presented a tailored Deep CNN design for CXR-based COVID-19 detection, called COVID-Net, which was the first open-source network design at the time of its initial release [41]. The authors largely introduced a lightweight residual projection-expansion-projection-extension (PEPX) design pattern, along with selective long-range connectivity, and a heterogeneous mix of convolution layers with a diversity of kernel sizes and grouping configuration, in their custom CNN architecture to classify the CXTR images into three classes, namely normal, non-COVID-19 pneumonia, and COVID-19 viral pneumonia. In a quantitative analysis, COVID-Net exhibited 95%, 94%, and 91% of sensitivity, and 90.5%, 91.3%, and 98.9% of positive predictive value for each infection type, respectively. Another interesting CXR image classification study was conducted by Sahlol et al., which focused on developing a hybrid approach coupling a CNN model with fractional order marine predator algorithms (FO-MPAs) [42]. In this approach, the CNN-extracted deep features were further reduced by FO-MPAs to utilize only relevant features for an accurate and computationally economic COVID-19 classification on CXR images.

3. Materials and Methods

3.1. COVID-19 Diagnosis Dataset

In order to build a reliable medical-imaging-based diagnostic support system exploiting deep-learning algorithms, it is important to utilize a sufficiently large image database that comes with a diverse set of good-quality medical images. Therefore, in this study, we used one of the largest currently available COVID-19 CXR datasets, released by Valencian Region Medical Image Bank, BIMCV COVID-19 dataset [43]. The dataset contains 1380 CXR images and 855 digital X-ray images from 1311 COVID19-positive patients. The images were collected from 11 different departments at the Valencian region for confirmed positive patients during the period between 26 February and 18 April 2020. The collection method provides the source of data diversity to some extent. The image data were anonymized by removing all patient-related data from the DICOM images, as well as the radiological reports. The dataset includes high-resolution CXR images with 16-bit format and dynamic range rescaled to window center and width.
Radiological reports were utilized for data labeling using a pre-trained natural language processing. There are several labels associated with each image including COVID-19, pneumonia, and infiltrates, which we utilize in our multi-label CXR image classification scheme. For COVID-19-negative cases, images with other pulmonary disease labels are extracted from the PadChest dataset [44]. Specifically, the images that are labeled as either pneumonia or infiltrates or both are considered as non-COVID-19 pneumonia, and a similar number of normal and other pulmonary disease categories are added to the control group. We hypothesize that this formulation is more realistic and resembles the real clinical scenario. After performing necessary pre-processing, such as noisy image removal, cropping, and segmentation, the dataset finally contains a total of 11,197 CXR images, of which 1056 belong to COVID-19 positive, 5451 correspond to pneumonia, and 7217 are labeled as Control (normal and other pulmonary diseases). After the lung localization and segmentation, all images are resized to 320 × 320 pixels. In the current study, to facilitate developing and appropriately evaluating an unbiased model, the deep learning experiments were repeated three times as suggested in ChexPert article [20]. On every iteration, we performed stratified splitting of the data into 70% of training, 15% of validation, and 15% of testing for each class, as shown in Table 1. The top five checkpoints for each model, according to the validation loss, are saved each time. These models are then used to calculate the final evaluation metrics.

3.2. COVID-19 Diagnosis Using Lung CXR Classification

In the present study, we aim to develop a deep learning-based lung CXR image classification method that can be utilized to overcome the hurdle of differential diagnosis of similar pathological findings associated with other non-COVID-19 pneumonia and pulmonary infections in CXR images. Accordingly, we investigated the performances of various deep learning approaches to choose the best setup for this multi-label classification problem. The proposed end-to-end framework that was proposed in this work is shown in Figure 1. As a preliminary step, the lung region is localized in the input CXR image and the image is then cropped and resized to a predefined size. This stage helps the algorithm to alleviate the effect of the irrelevant external lung area that may cause classifier bias. Following that, a lung segmentation is performed to segment the region of interest from CXR images to remove any non-interesting tissue around the lung. The purpose of the lung segmentation is to facilitate the model learning pertinent features from the lung tissues. Additionally, lung segmentation helps to alleviate the wrong feature attribution problem reported in previous studies [45]. An example of such feature attribution is shown in Figure 2. The details of the localization and segmentation stages are presented in Section 3.2.1 and Section 3.2.2. For the multi-label classification task, an ensemble of CNN models equipped with global and local feature heads is utilized.

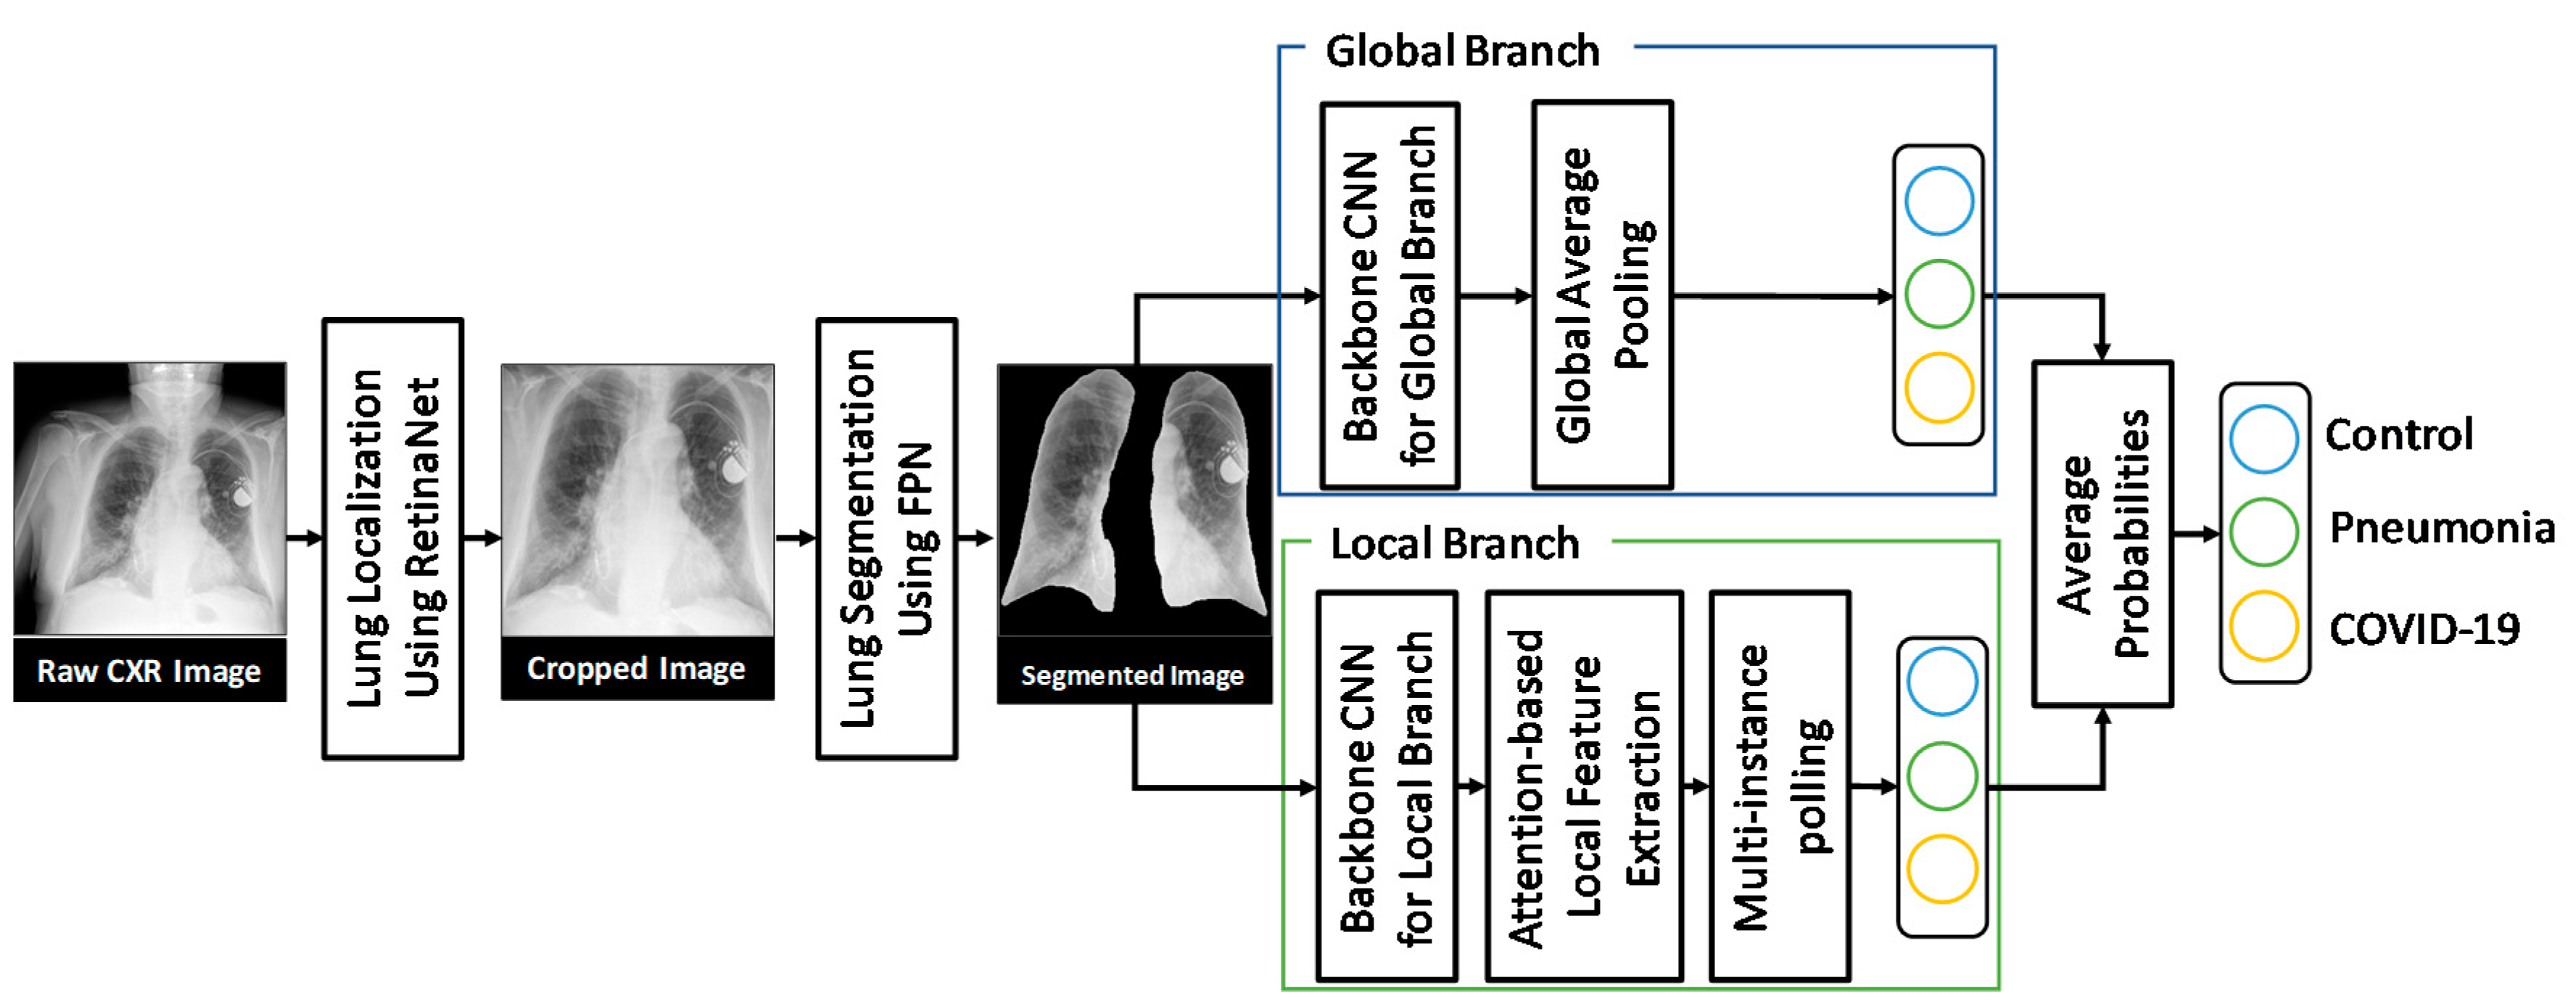
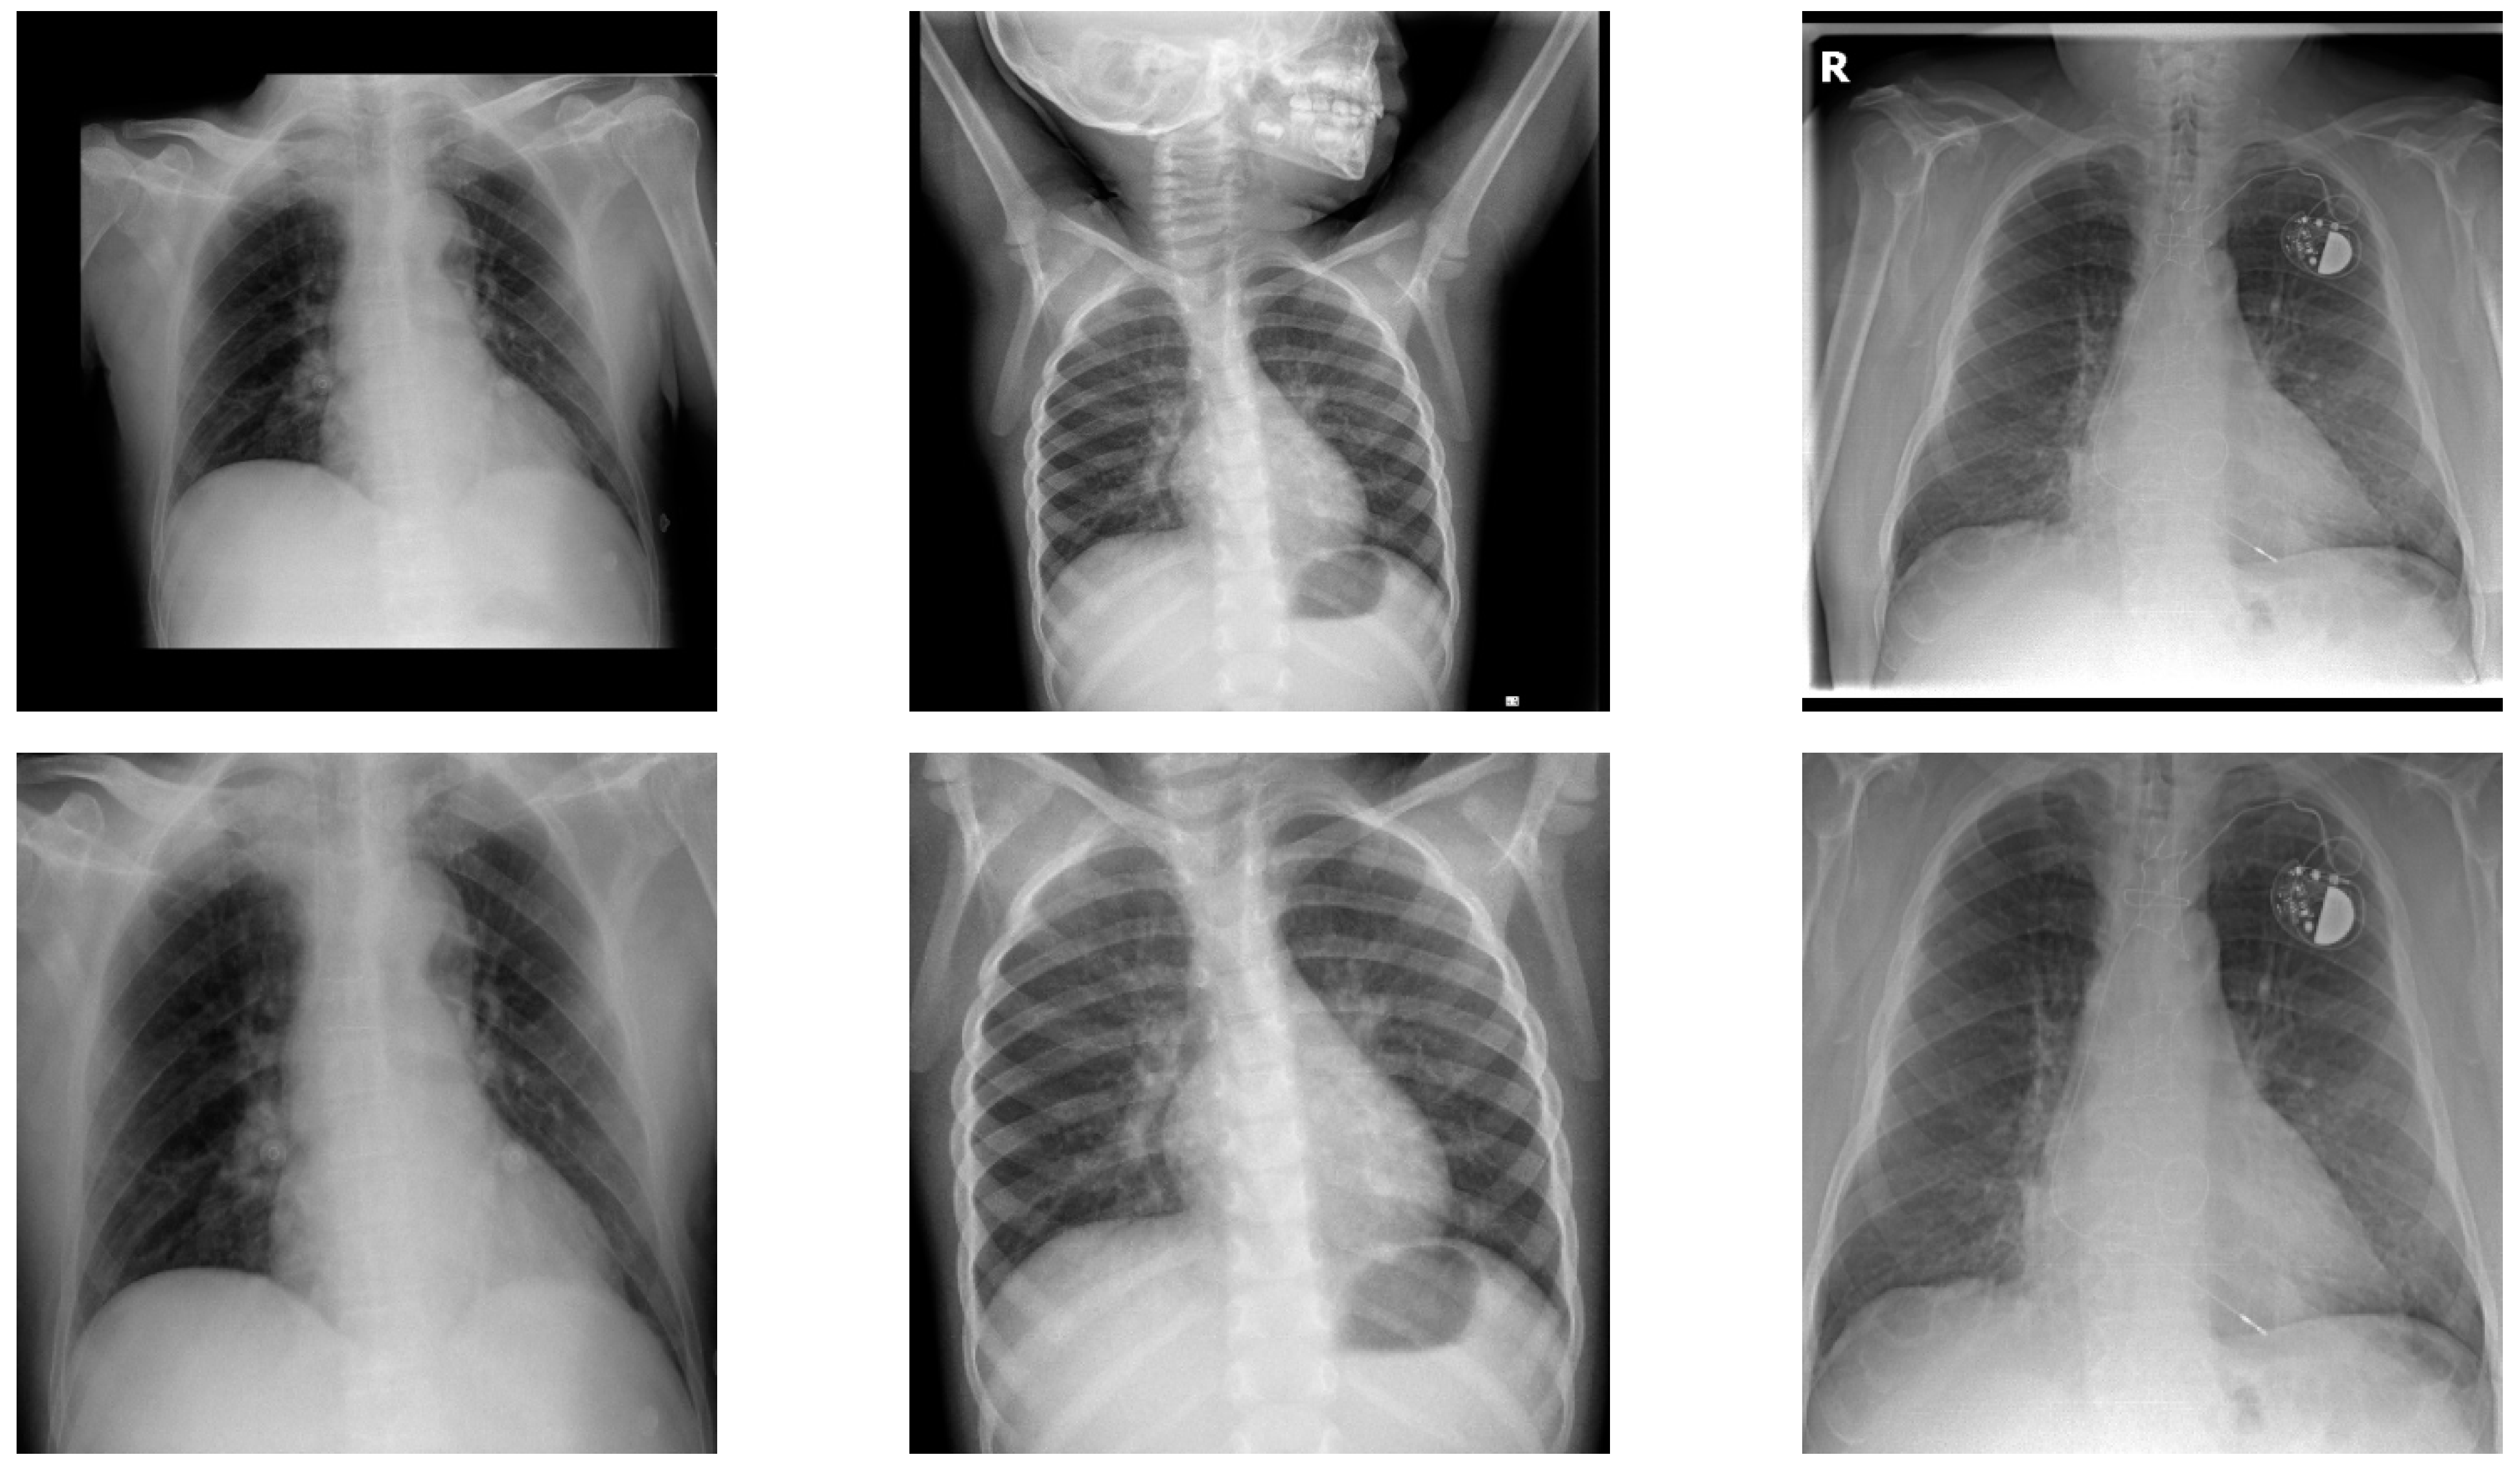
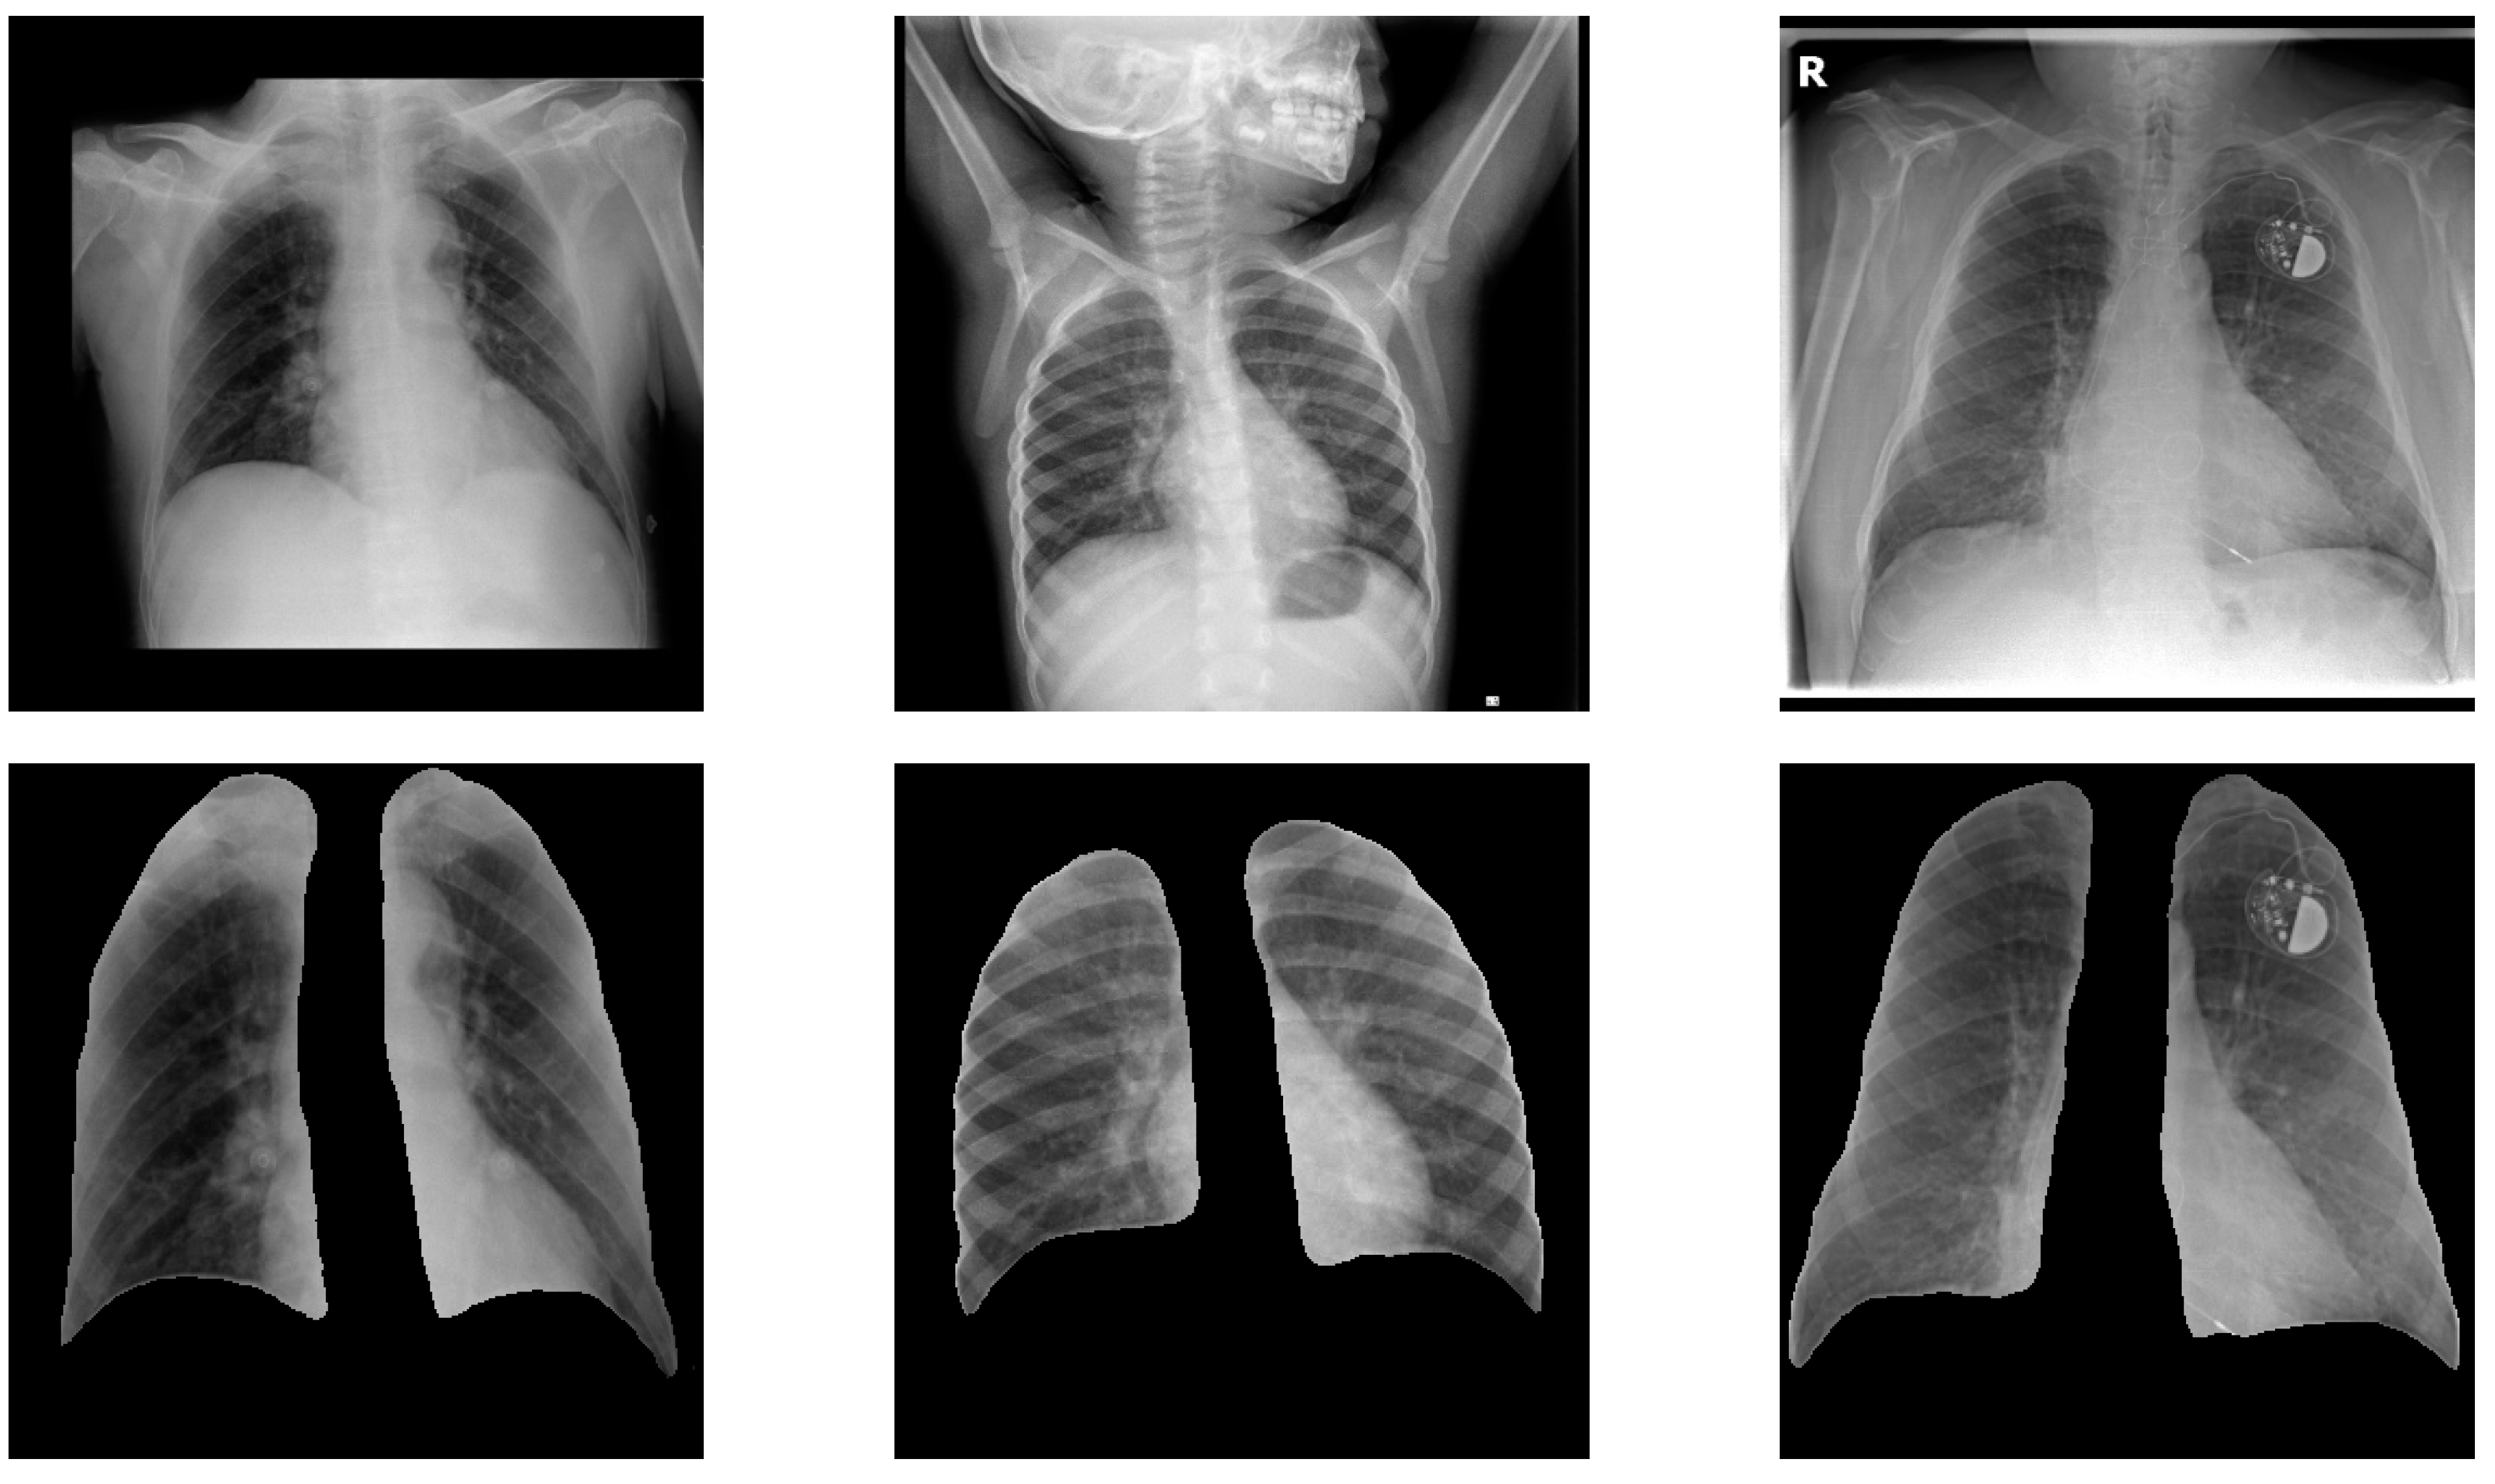
3.2.1. Lung Localization

A Retina-net [46] deep learning model is used to perform the lung localization in the current study. The Retina-net is a single-stage object detector consisting of multiple networks. Among those, there is a backbone network for feature extraction, one subnetwork for classification, and another subnetwork for bounding box regression. While any convolutional neural network (CNN) can be used as a backbone network, feature pyramid network (FPN) [47] is used to enhance multiscale object detection. Specifically, we exploited a ReseNet50 [48] network to build the FPN, which allows us to extract multiscale features from a single resolution image. Both classification and regression subnetworks are a simple fully convolutional network (FCN) attached to each pyramid level. The Retina-net detector uses the -balanced focal loss to handle the large imbalance between background and foreground objects. The focal loss reduces the effect of the easy sample and is defined as in Equation (1):
F L ( p t ) = ( 1 p t ) γ log ( p t ) , p t = { p i f   y = 1 1 p o t h e r w i s e ,
where p [ 0 ,   1 ] is the predicted class probability, γ is a tunable parameter, and is a balancing parameter.
To train the Retina-net detector for lung localization on CXR images, a set of 2000 images is selected from the ChexPert data set [20] as a training data set. We then manually draw a bounding box around the lung area in each of these images. To increase the robustness of the detector, we have explicitly chosen images containing pathological signs from different pulmonary diseases. The detection results of several test samples from the COVID-19 Diagnosis Dataset produced by the localization algorithm are depicted in Figure 3. The localization can remove several artifacts outside the lung and, at the same time, assist in normalizing the lung size, which can be observed in Figure 3.

3.2.2. Lung Segmentation

Earlier, Comelli et al. focused on employing customized UNet and ENet architectures for segmenting the parenchyma region in high-resolution CT images with pulmonary fibrosis [49], whereas an automated segmentation of ascending thoracic aortic aneurysm was investigated by the same authors using UNet, ENet, and ERFNet techniques in CT angiography images [50]. In our study, we implement an FPN network using Resnext50 [51] as a backbone model for lung tissue segmentation. A feature pyramid is constructed using different scales with the following methodology. First, a set of feature maps F i ,   i = 2 , , 5 is extracted by applying 1 × 1 followed by 3 × 3 convolutional kernels to the outputs of stages 2–5. These maps have special dimensions of 1 4 ,   1 8 ,   1 16 , and 1 32 with respect to the original image size, and all these are reduced to 128 channels. Afterward, a pyramid of features { P 2 ,   P 3 ,   P 4 ,   P 5 } is constructed according to Equation (2),
P i = ( P i + 1 ) 2 + F i , P 5 = F 5
where ( . ) 2 is a nearest neighbor sampling by a factor of 2. Accordingly, the final pyramid is formed by up-sampling higher-level features and combining them with the low-level features via element-wise addition. Finally, the segmentation mask is extracted from the feature pyramid and upscaled to the original image size.
A large CXR lung segmentation dataset is utilized to train the segmentation model [52]. This dataset has 6500 images, among which 570 cases are COVID-19-positive. With pixel-level lung segmentation, the model is trained using Adam optimizer [53] for 40 epochs. An initial learning rate of 1.0 × 10 4 is used and reduced by a factor of 10 after 20 epochs. We used Dice loss for training as defined by Equation (3).
D L ( y , p ^ ) = 1 2 y p ^ + 1 y + p ^ + 1 ,
where y is the ground truth segmentation mask and p ^ is the extracted segmentation mask. Sample segmentation results are presented in Figure 4.

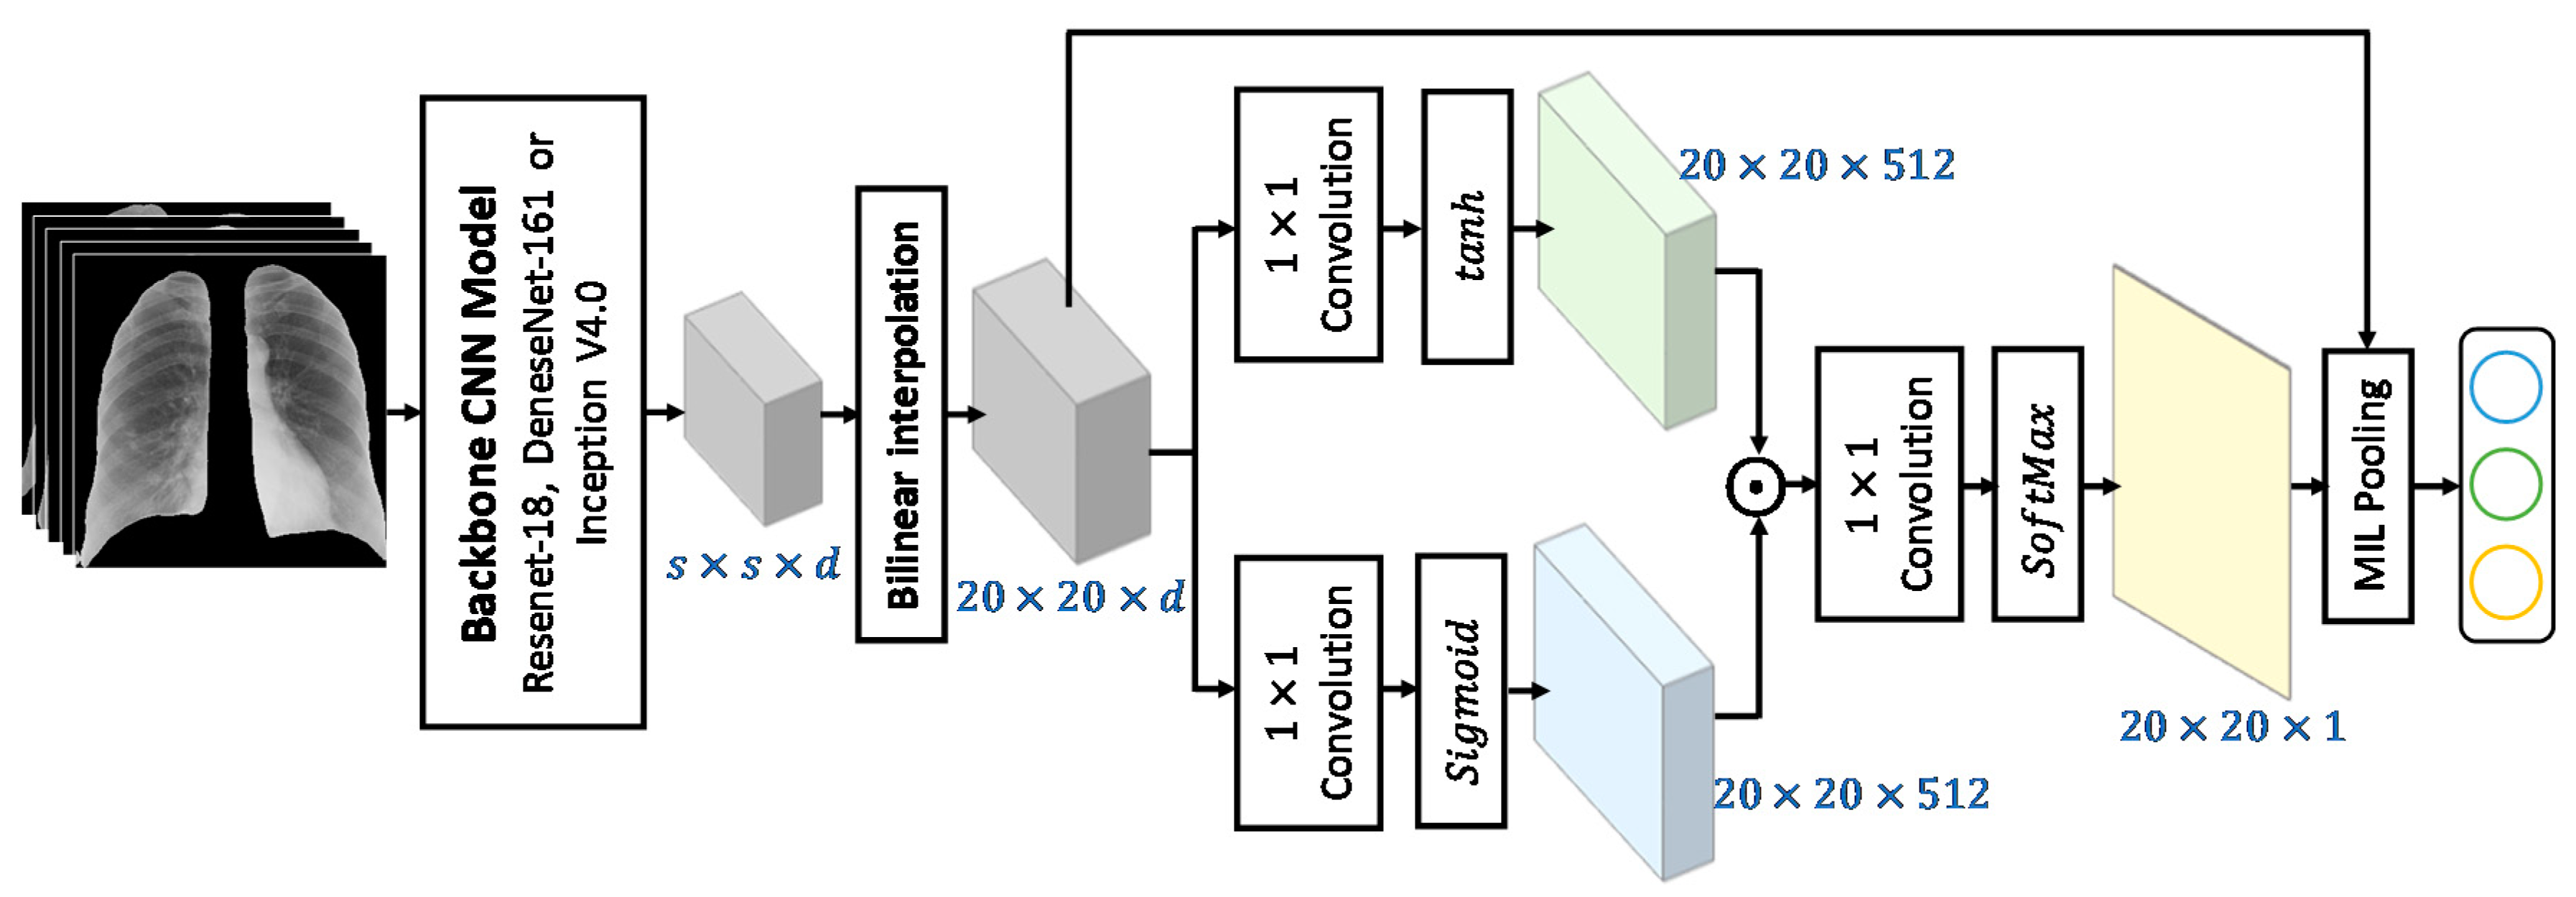
3.2.3. Multi-Label Lung CXR Classification with Attention-Based Local Features

As COVID-19 and pneumonia have both general symptoms that may occur at the entire lung and local markers that may affect specific parts of the lung [54], we build classification models that use both global and local features. We have utilized three different backbone convolutional neural networks (CNNs) with varying architectures and complexities, namely a small Residual neural network (ReseNet18) [50], Inception v4.0 [55], and Densely Connected Convolutional Networks (DenseNet161) [56]. An attention head, based on multi-instance polling (MIL) able to extract localized features, is implemented and attached to these backbone models. A brief description of these backbone models and the MIL-based attention head are presented in the following subsections.

Deep Residual Learning (ResNet)

The main idea behind Residual learning is the usage of identity shortcut connections. These connections skip several consecutive layers and concatenate the input and the output of these skipped layers via element-wise addition. The use of residual learning helps to alleviate the problem of the vanishing gradient for deep architectures and make the training more stable. Furthermore, the skip connections are parameter-less and therefore do not contribute to the complexity of the model. There are many different Rese-Net architectures with varying complexity. Interestingly, all Rese-Net models share the same overall structure of a steam, i.e., four stages with various numbers of residual blocks and a SoftMax classifier. Specifically, the Rese-Net18 architecture has two residual blocks in each stage with each residual block having two layers. The total number of trainable parameters of this model is around 12 million.

Inception V4.0

The idea of the inception network is to make the network deeper and wider while maintaining the computational complexity of the model at the moderate level. The inception block is the basic building block of the inception network, which utilizes several branches with different kernels to process visual information at various scales and aggregates them at the end of the block. Similarly, the next bock can simultaneously extract features from different scales. It uses 1 × 1 convolutions and polling layers to reduce the model complexity. The early versions of the inception network utilized an auxiliary classifier to alleviate the vanishing gradient problem, which is replaced by dropout in the later versions. Inception V4.0 improves the network steam to make it more uniform and uses a memory optimization to reduce the memory requirement for model training. This architecture uses different types of inception blocks stacked together. The number of trainable parameters for the inception V4.0 model is about 43 million parameters.

Densely Connected Convolutional Networks (DenseNet)

Dense-Net uses a different strategy for resolving the vanishing gradients problem and enhancing the information flow through the deep architecture. It uses a dense connection, which connects any layer to all consequent layers in the same block. Layers are divided into a group of blocks called dense blocks. The features within the same block are aggregated by concatenation. A transition layer is added after each block except the last one to reduce feature dimension. All Dense-Net architectures share a steam, which has four dense blocks, three transition layers after the first three blocks, followed by a SoftMax classifier. The steam applies a 7 × 7 convolution for noise reduction and feature enhancement. The Dense-Net-161 has 6, 12, 36, and 24 layers in the four dense blocks involving a total of around 29 million parameters.

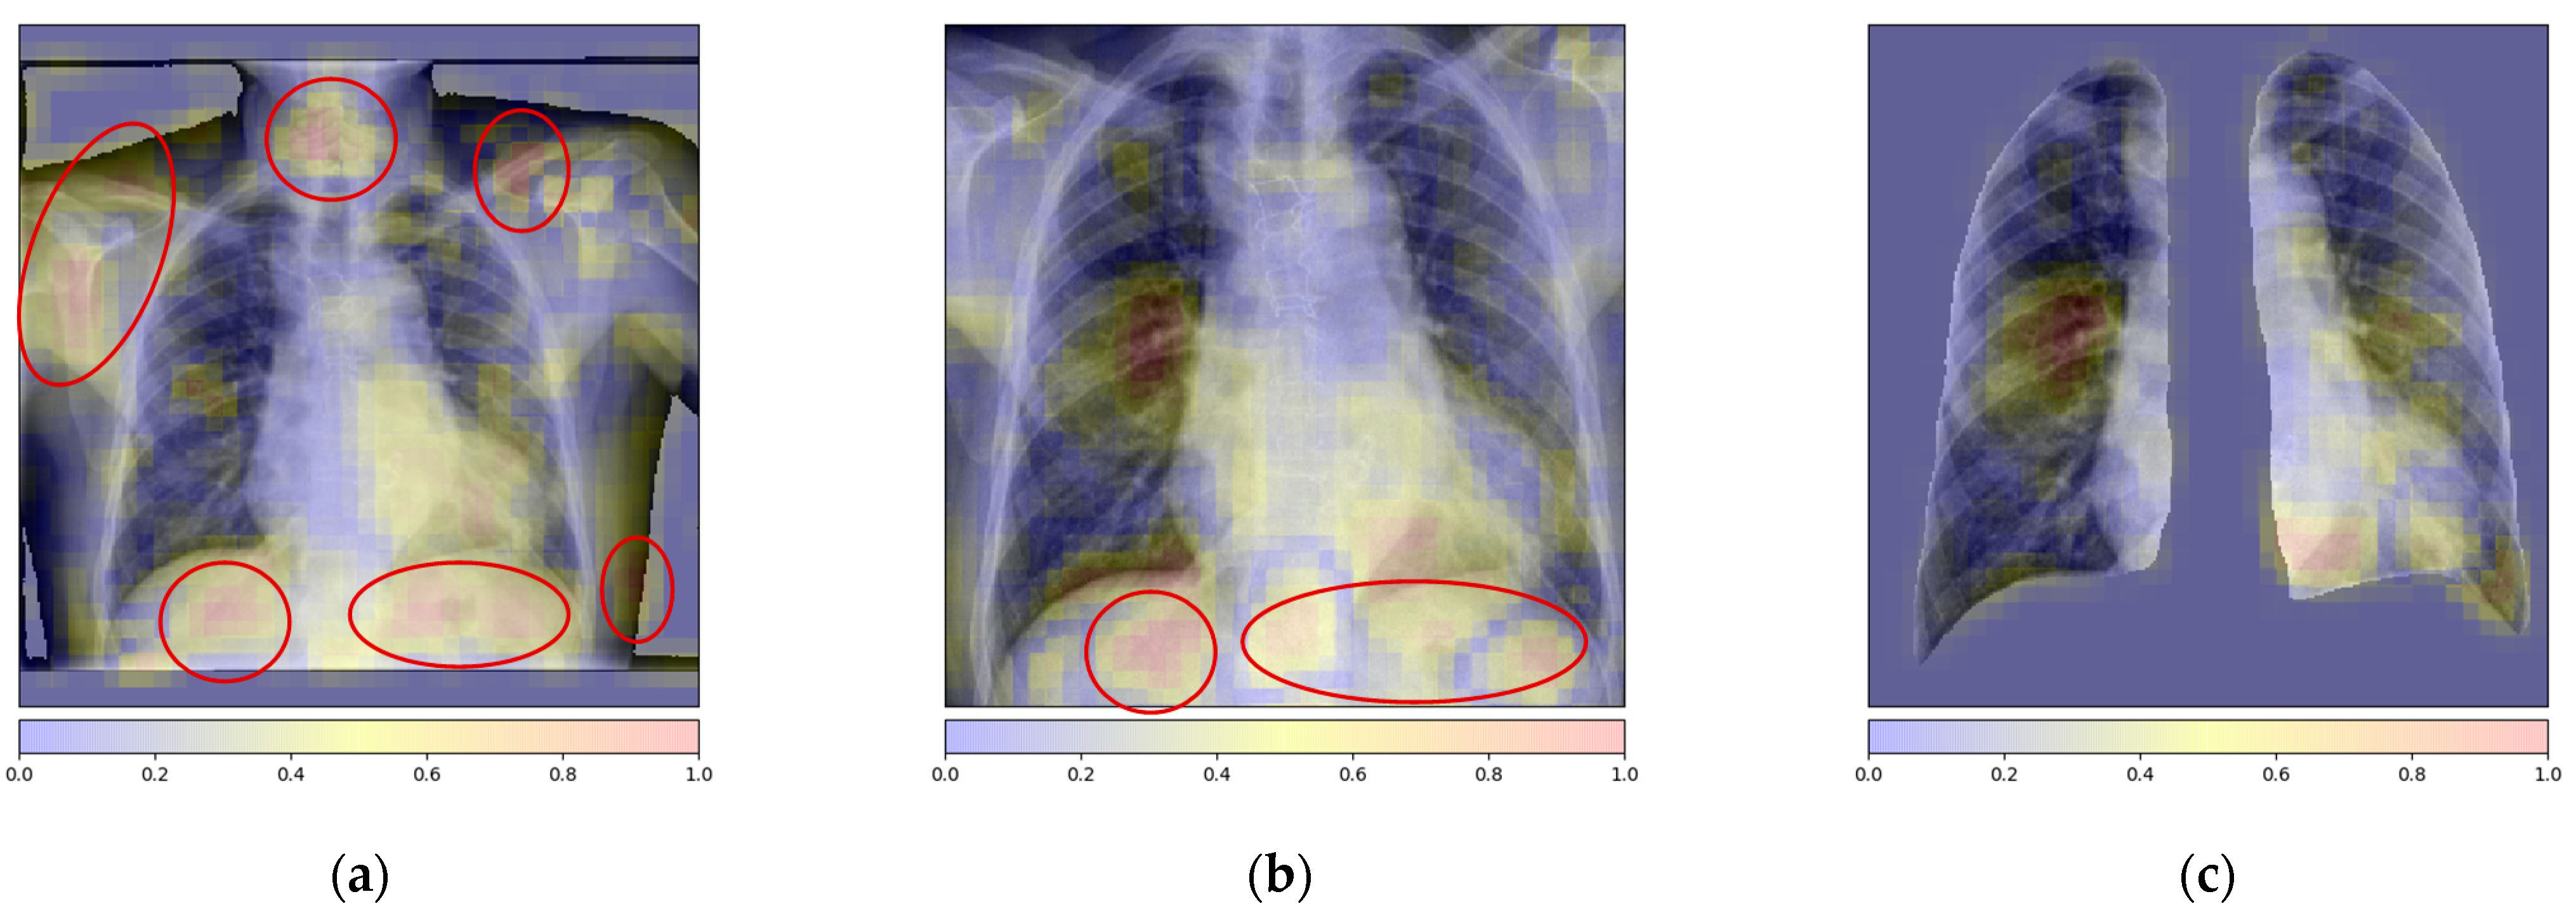
Attention-Based Local Feature Extraction
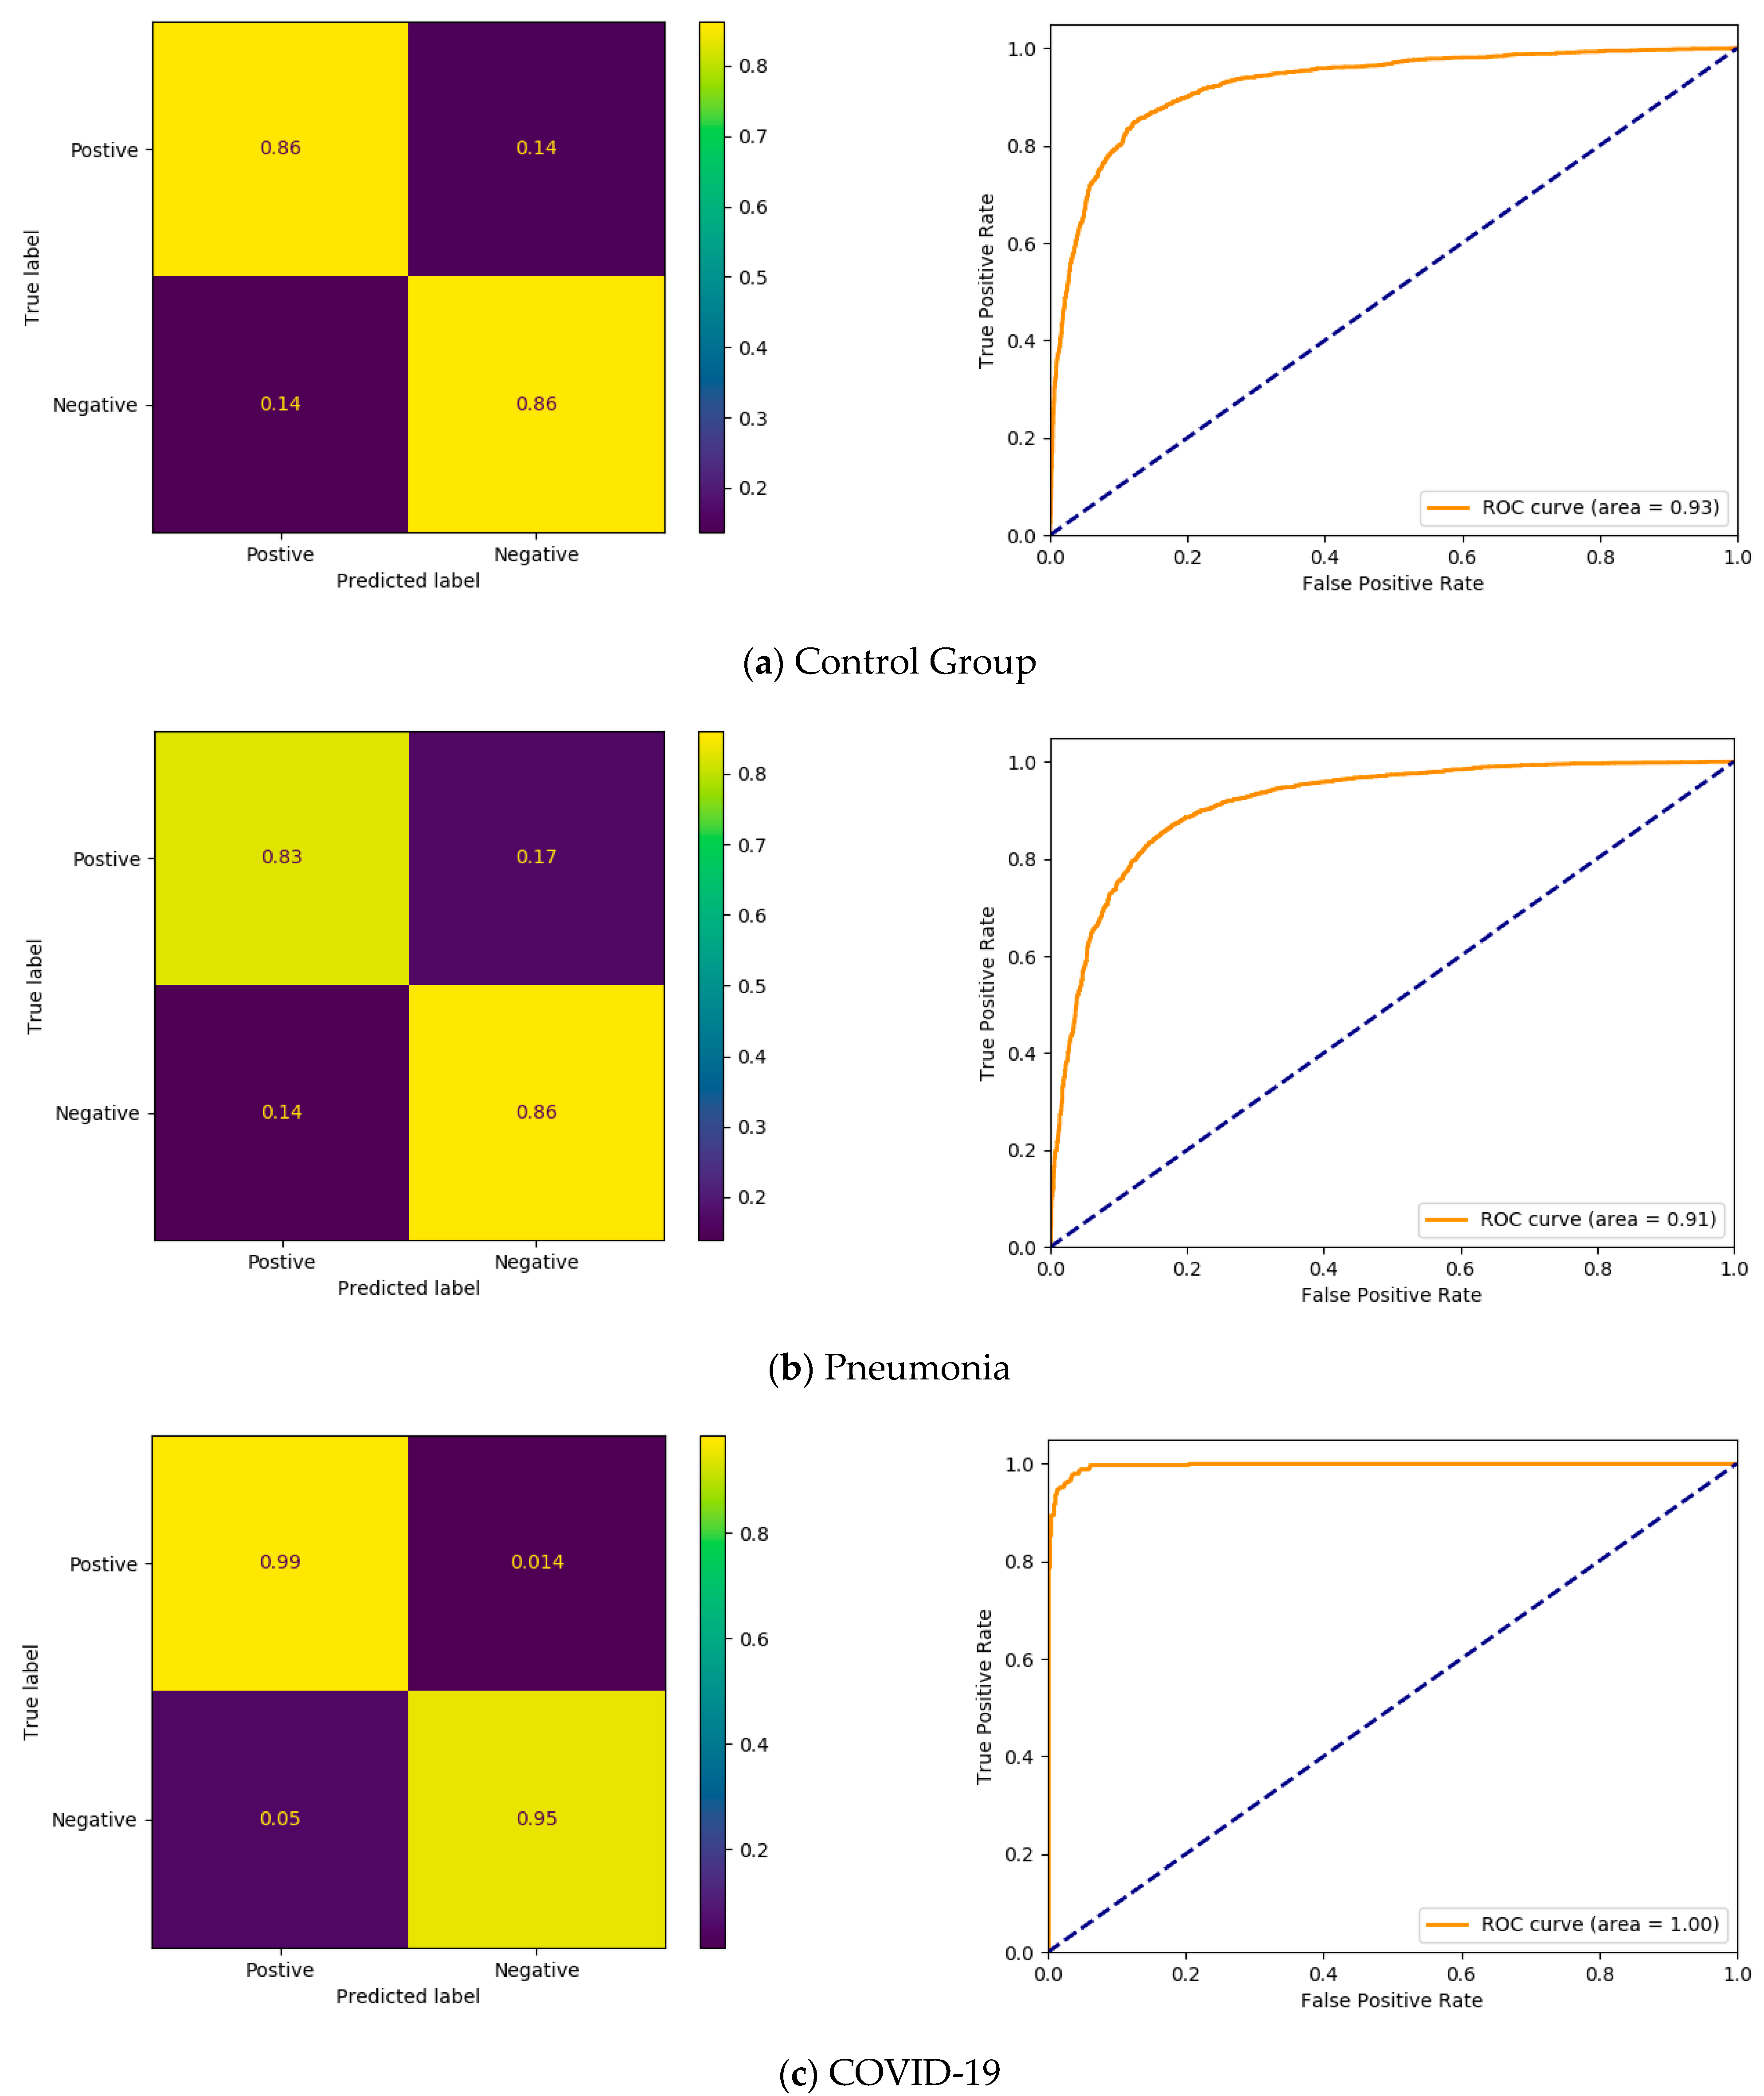
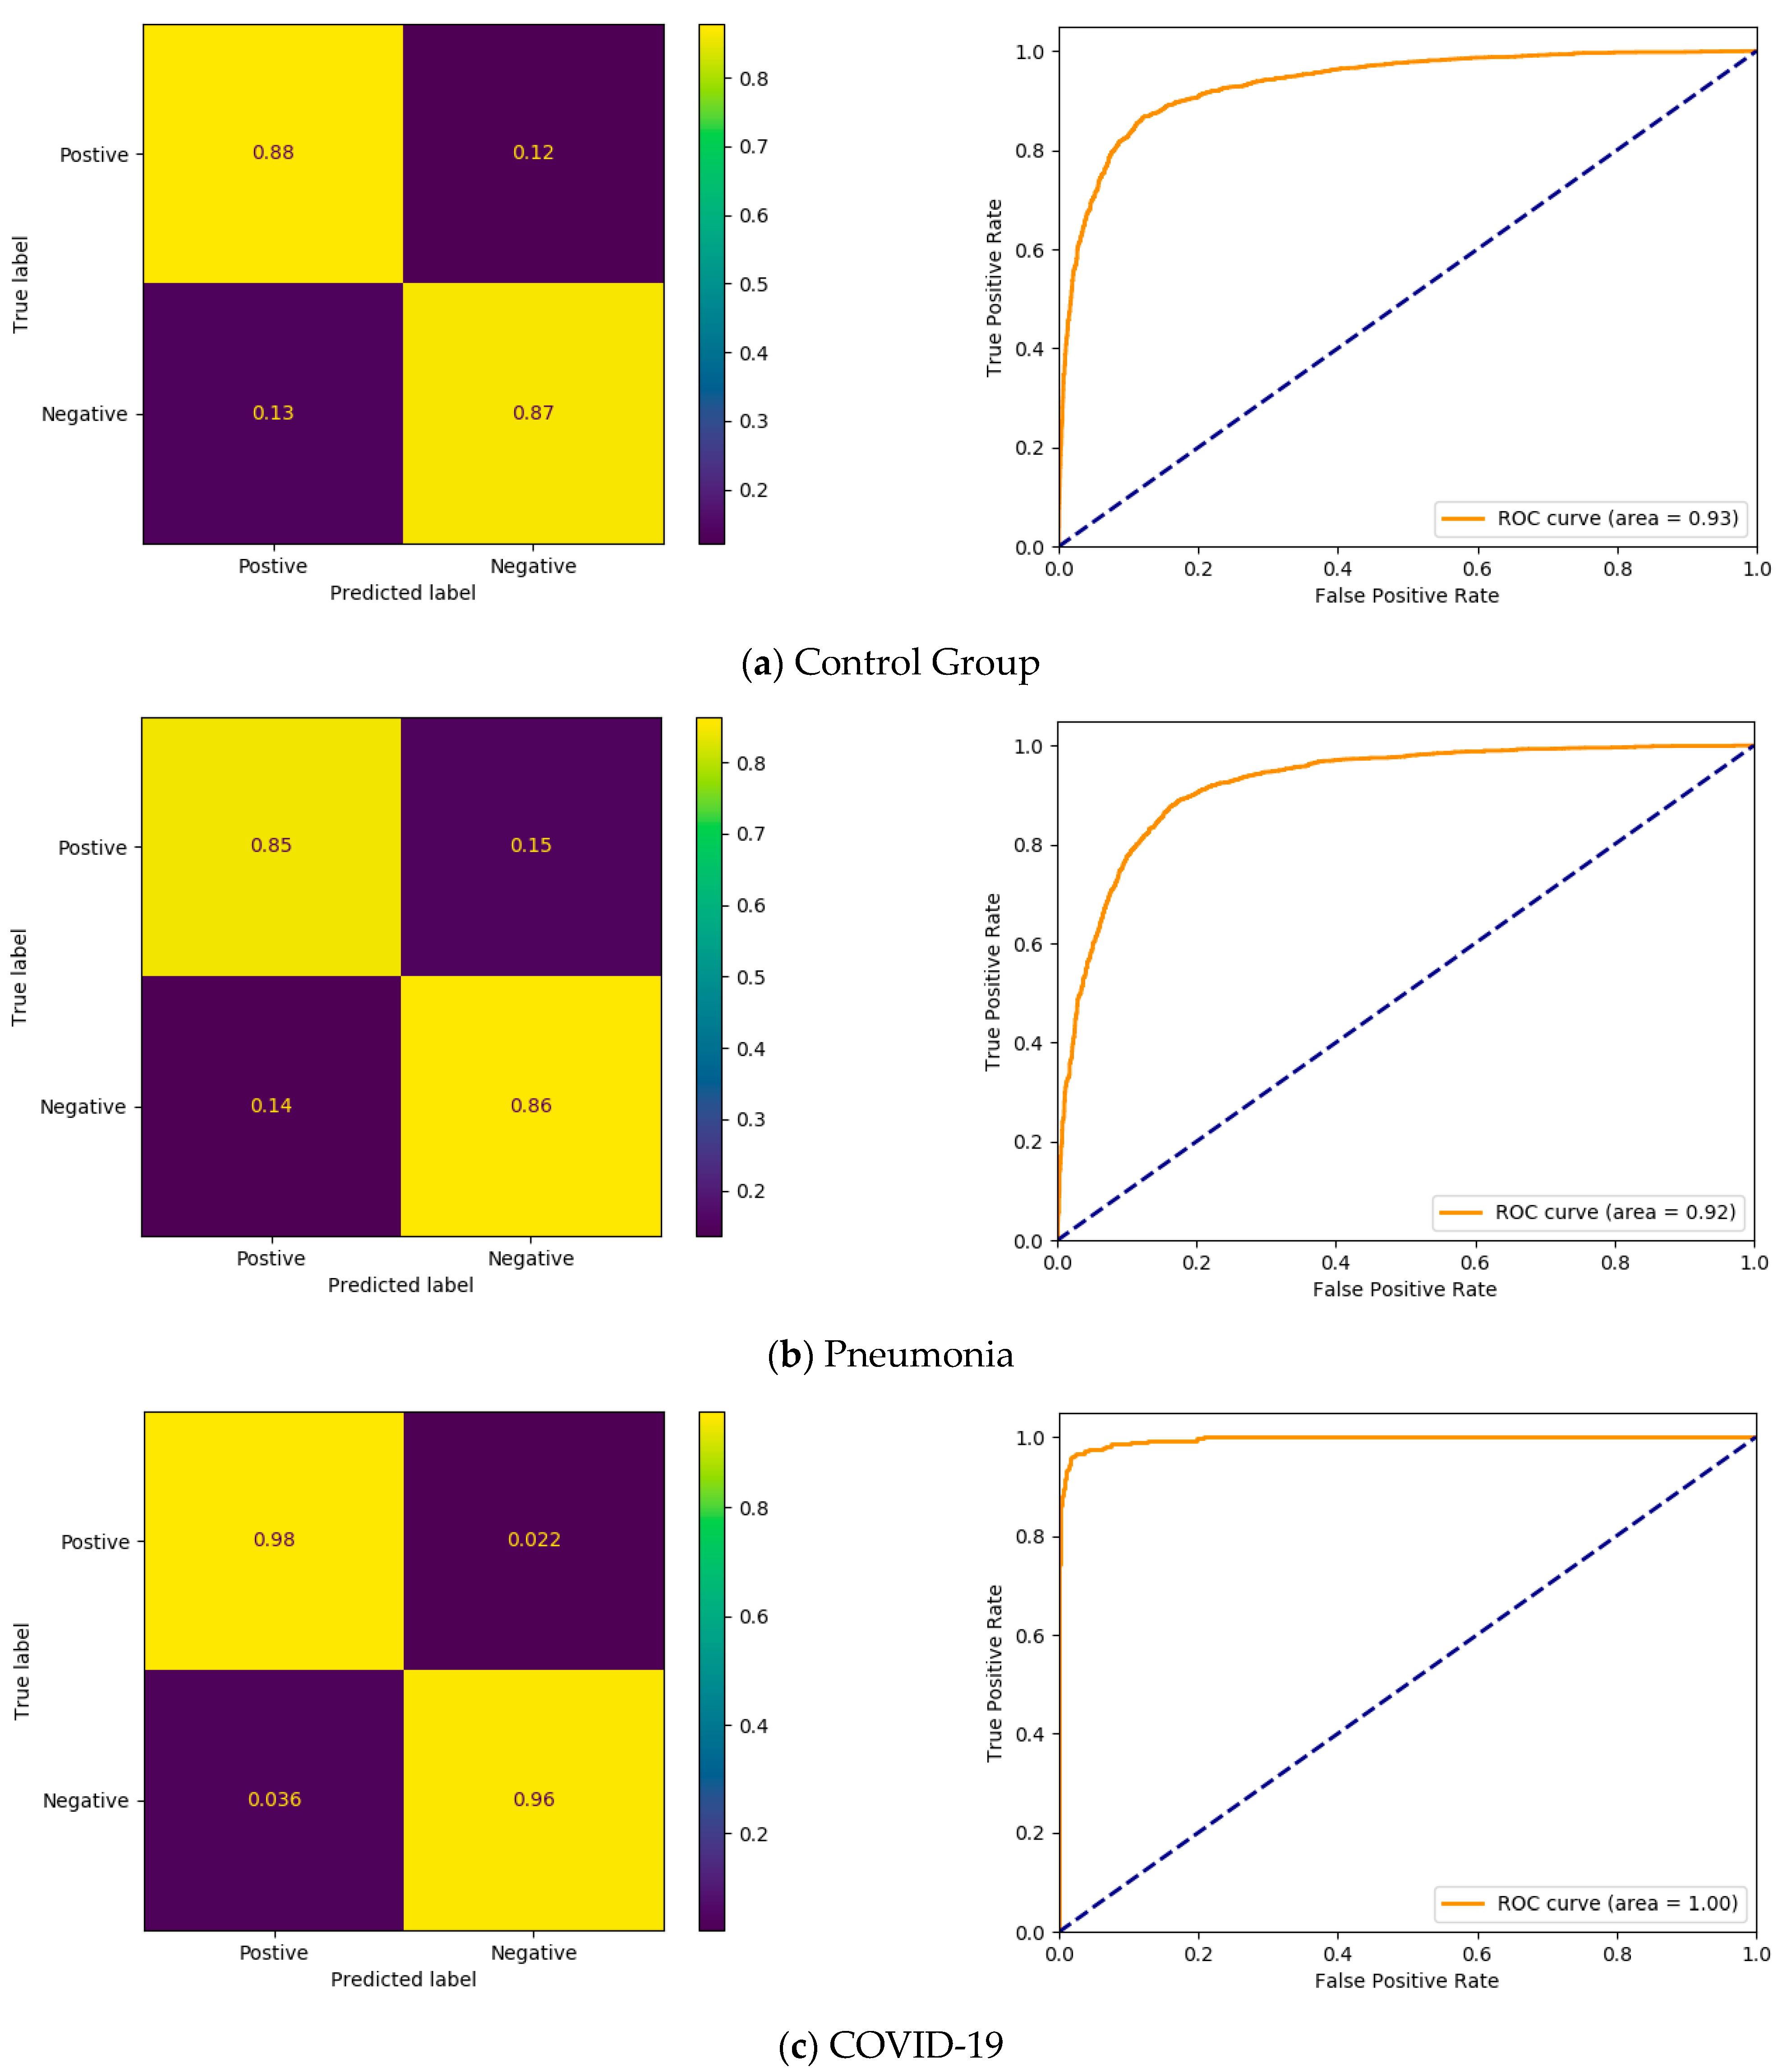
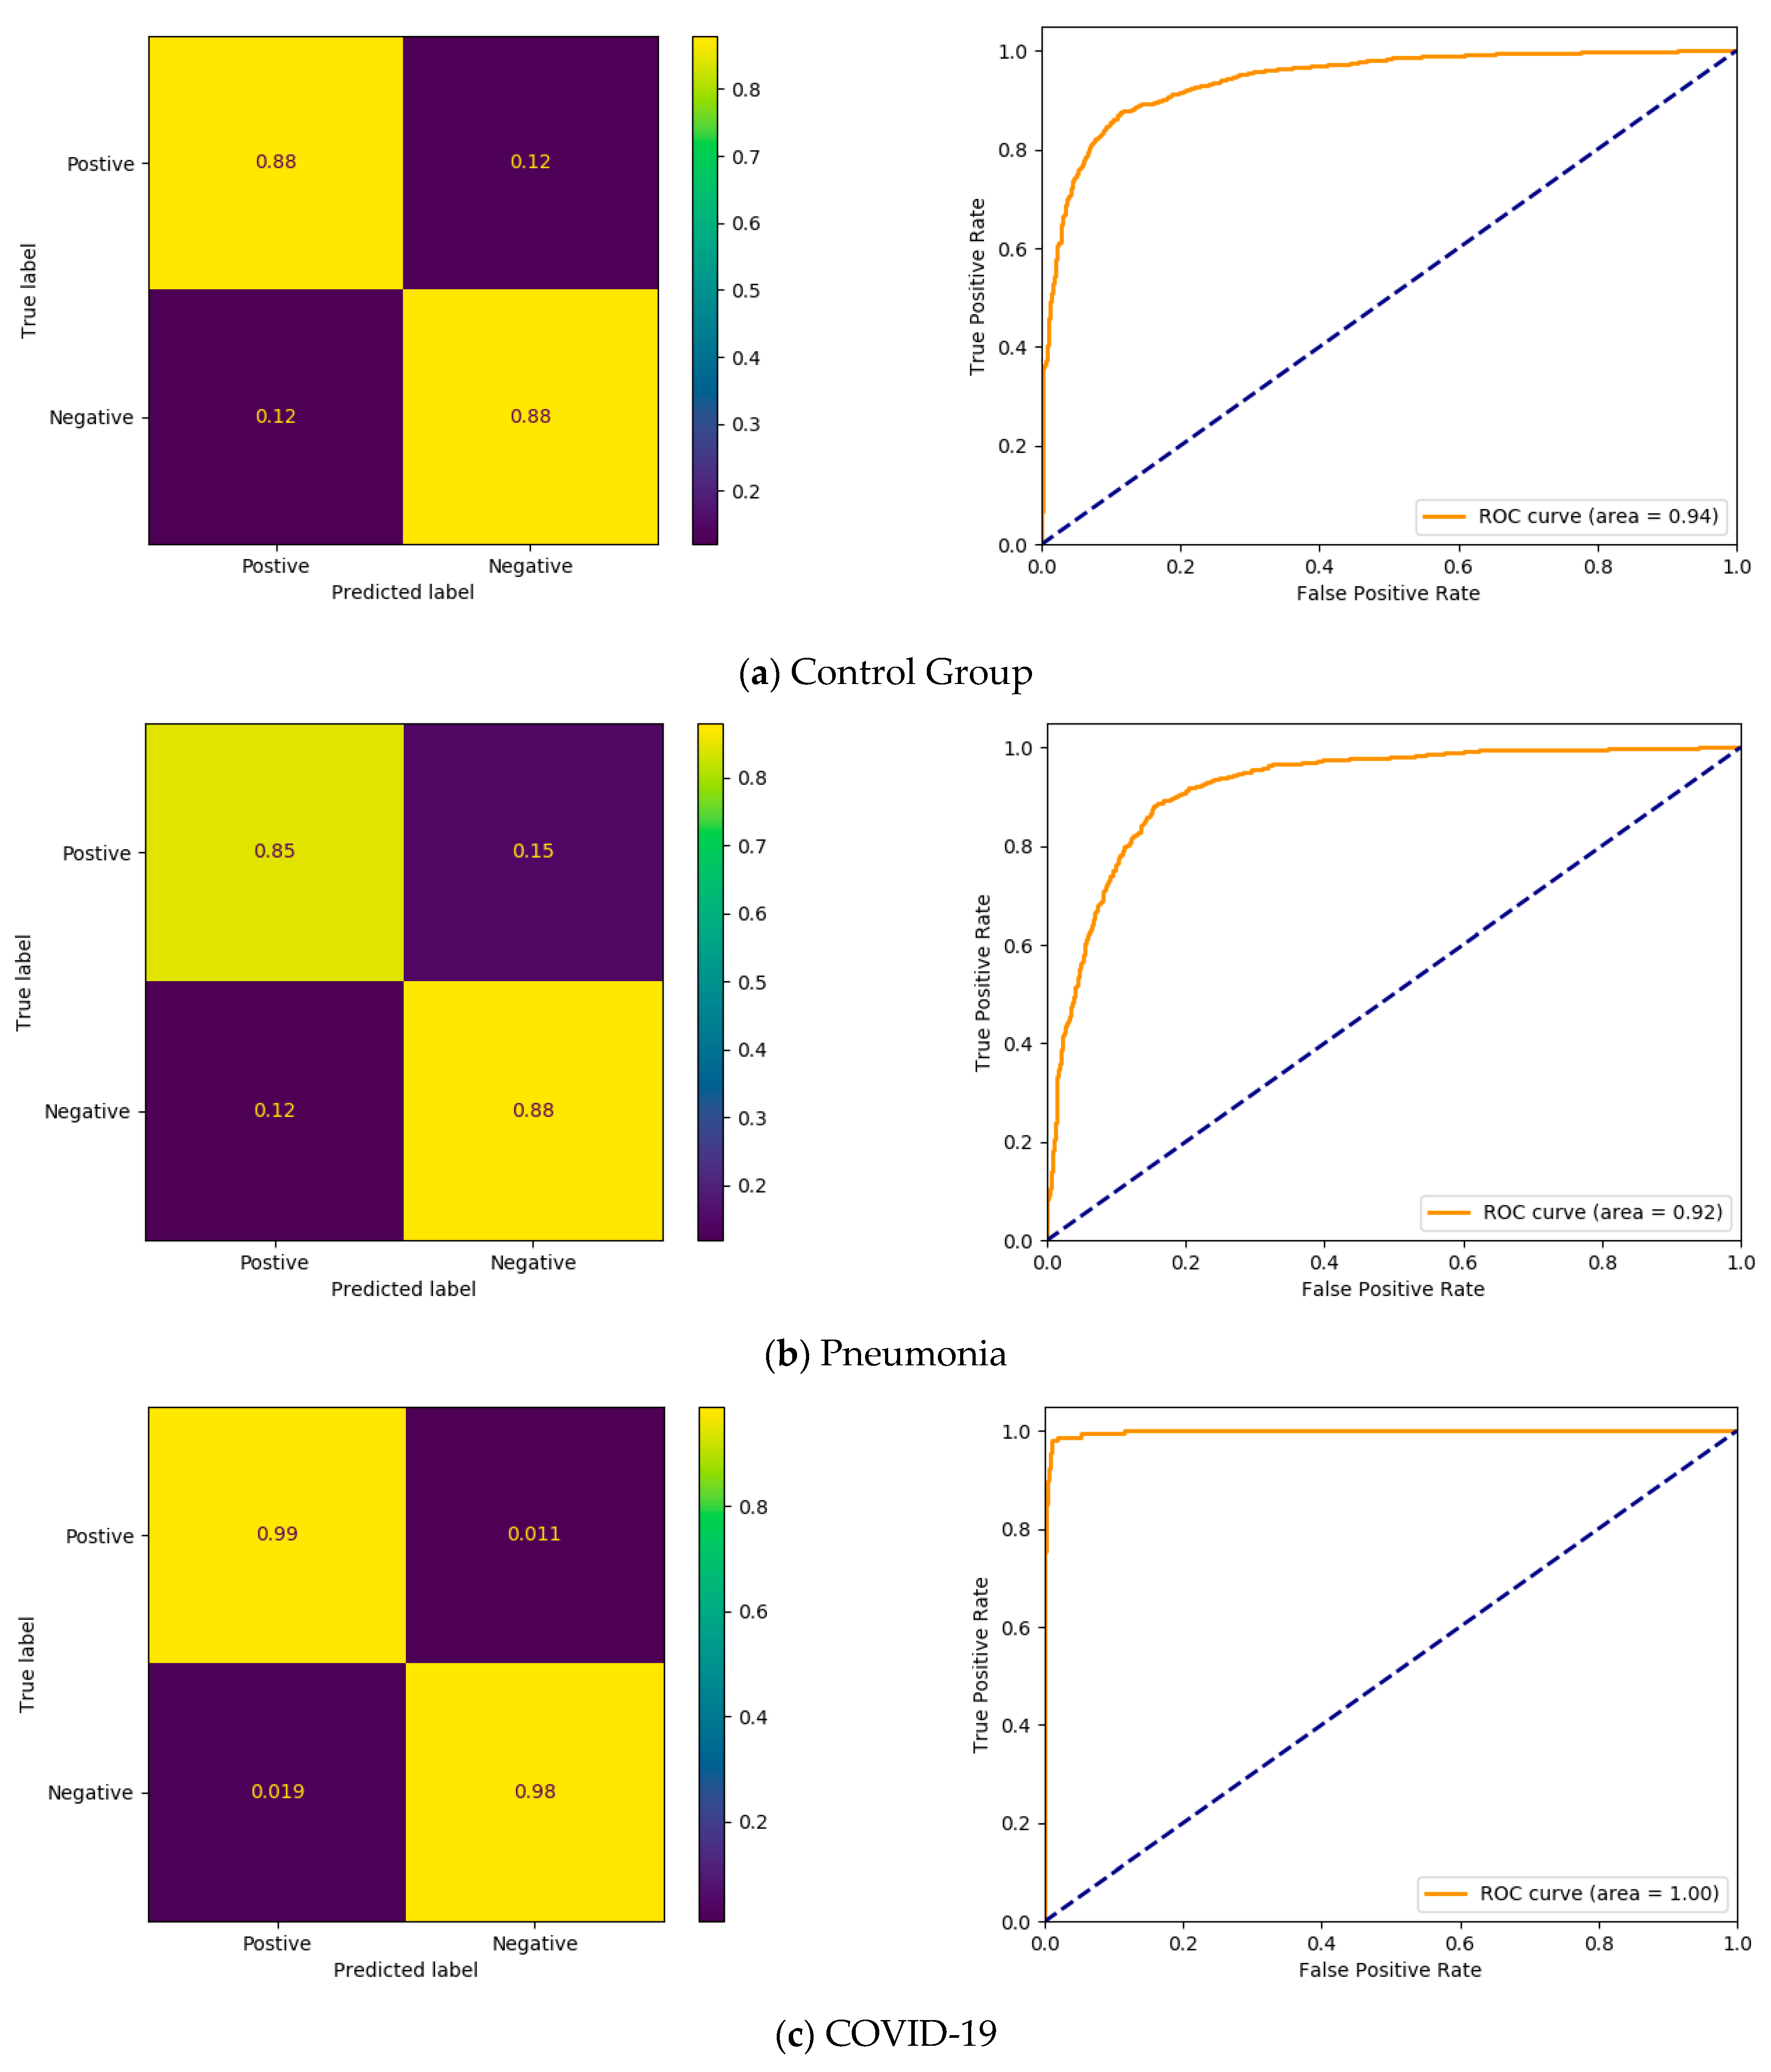
For the purpose of COVID-19 and other pneumonia identification, we may consider the CXR image as a bag of instance, in which each part of the lung represents one instance. In this way, if at least one instance has the symptoms of COVID-19 or pneumonia, the whole image will be classified accordingly. To achieve this goal, we use a permutation-invariant MIL model. One obvious choice for this model is taking the maximum over the labels of all instances or label aggregation via multiplications as described in [57]. However, these formulations may not be suitable in the present scenario, due to the possible vanishing gradient problem, and accordingly, the instance-based classifier may not be suitable here. Therefore, a weighted average modeling approach is used to aggregate the labels of instances as proposed by Ilse et al. [58]. Note that this modeling is permutation-invariant and does not affect the information flow.
If we consider the embeddings of K instances using a backbone network as H = { h 1 ,   ,   h k } , the MIL average pooling can be calculated as in Equation (4)
z = k = 1 K a k H k
where a k are the weights of the instances that can be estimated using different neural networks as in Equation (5).
a k = exp ( w T ( tanh ( V h k T ) sigm ( U h k T ) ) ) j = 1 K exp ( w T ( tanh ( V h j T ) sigm ( U h j T ) ) )
where w ,   V , and U are learnable parameters that we want to estimate, is an element-wise multiplication, sigm ( . ) is the sigmoid function, and tanh ( . ) is the hyperbolic tangent function. Both sigmoid and tanh functions allow the model to estimate well the relationship between the parameters.
In our study, to estimate a k , a small network with two parallel branches is connected to the feature extractor of the backbone network. As shown in Figure 5, the layer output before the average polling layer is scaled up to a spatial resolution of 20 × 20 . Both first and second branches used to estimate V and U , respectively, use a 1 × 1 convolutional kernel to create 512 feature maps. The tanh activation function is applied to the first branch while the sigmoid activation function is applied to the second one. The outputs of the two branches are merged via element-wise multiplication and an additional convolutional layer with SoftMax activation is used to produce the final weight.
All models were trained for 40 epochs using Adam optimizer with an initial learning rate of 0.001, which is reduced by a factor of 10 in case the validation loss does not improve during three subsequent epochs. We applied an early stopping mechanism to alleviate overfitting during the training, if there is no observed improvement in validation loss during five subsequent epochs. A series of data augmentations including horizonal flipping, rotation (within a range of −15° to 15°), and brightness variation (within a range of 0.9 to 1.1) was applied followed by an image normalization step using the mean and standard deviation of the segmented lung. To reduce the effect of the data imbalance issue, mini-batches were balanced out both by oversampling the COVID-19 cases and applying a random augmentation during the training. Finally, a weighted binary cross entropy with a logit function was employed in this study that assigns higher importance to positive COVID-19 cases, as shown in Equation (6).
B C E W ( y ^ , y ) = 1 N n = 1 n c = 1 C w n , c ( y n , c · log ( sigm ( y ^ n , c ) ) + ( 1 y n , c ) · log ( sigm ( 1 y ^ n , c ) ) ) ,
where N is the number of samples, C is the number of labels for each example, w n , c is the sample weight according to its true label, y n , c is the true label, and y ^ n , c is the network-predicted label.

4. Results

In the present study, lung segmentation is an auxiliary stage to alleviate the impact of wrong attribution. The segmentation model was evaluated using 1478 CXR images and it achieved a Dice Score Coefficient (DSC) of 95 % ± 2.7 . The COVID-19 diagnosis problem is formulated as a multi-label classification problem as CXR images may contain simultaneous manifestations from multiple pathologies. We use the AUC (area under the curve) score using the receiver operating characteristics (ROC) curve to evaluate the performance of our multi-label classification approaches. The ROC curves represent the classification performance at various thresholds by plotting the True Positive Rates (TPR) against the False Positive Rates (FPR), as provided in Equations (7) and (8), and the integral area under the ROC curve from (0, 0) to (1, 1) is calculated as AUC scores.
T P R = T P T P + F N
F P R = F P F P + T N
The AUC scores of the validation dataset are utilized to determine the optimal threshold for each class maximizing the TPR and minimizing the FPR. For obtaining this optimal value, a Geometric mean (G-mean), as defined in Equation (9), is calculated for all thresholds used to form the ROC curve, and the one corresponding to the maximum G-mean is selected. This process gives some unbiased measure to indicate the classification performance of the models for under-representative classes, such as COVID-19.
G - m e a n = T P R ( 1 F P R )
Additionally, the performances of the models are assessed using evaluation metrics including balanced accuracy, average precision score, and F1-score, as shown in Equations (10)–(12).
B a l a n c e d   A c c u r a c y = 1 2 ( T P T P + F N + T N T N + F P )
A v e r a g e   P r e c i s i o n = t r ( R e c a l l t r R e c a l l t r 1 ) P r e c i s i o n t r ,
F 1 - S c o r e   = 2 × P r e c i s i o n × R e c a l l P r e c i s i o n + R e c a l l
The R e c a l l t r and P r e c i s i o n t r are the precision and recall of the classification model at a certain threshold t r . The average precision (AP) calculates the weighted average of the precisions achieved at different thresholds and consequently summarizes the precision-recall curve. The F 1 - S c o r e is the weighted average of the precision and recall.
For each backbone CNN model, ResNet18, DeneseNet161, and Inception V4.0, the detailed performances (AUC score, balanced accuracy, average precision, and F1-score along the 95% confidence interval) of the models using global features, local attention and MIL pooling-derived features, and ensembles of features are presented in Table 2, Table 3 and Table 4. Table 2 shows the performance statistics for the control group, while Table 3 and Table 4 show those for pneumonia and COVID-19 classes, respectively. Finally, the average performance of the classification models is calculated using the micro-averaging ( m i c r o a v g ), defined in Equation (13).
m i c r o a v g = M e t r i c ( c = 1 C T P c , c = 1 C F P c , c = 1 C T N c , c = 1 C F N c )
Table 5 presents the summarized performances of all models for all three classes by micro-averaging the balanced accuracy, average precision score, and F1-score metrics. These results, in consistency with the results presented in Table 2, Table 3 and Table 4, indicate the superiority of the DenseNet161-based models. The ROC curves and confusion matrices of these modes are shown in Figure 6, Figure 7 and Figure 8. Additionally, the training performances of these models as weighted cross-entropy loss plots are shown in Figure 9. A statistical analysis of the prediction models is performed to investigate whether there exists a significant difference between different models. To accomplish this task, we compared the models using the Friedman test followed by the post-Hoc Nemenyi test [59,60,61]. Two different tests were carried out; the first one was comparing the models of the same backbone, while the second test was the comparison of the best models obtained from the previous round. These statistical analysis results are depicted in Figure 10.
In order to perform a detailed investigation of the learning models, the feature attribution of the DenseNet161-based models is calculated using the occlusion technique [62]. In this technique, a sliding window is utilized masking the rectangular parts of the input image and computing the difference in outputs. This technique can be considered as a feature importance analysis with respect to a specific label. In this work, a 15 × 15 window and a stride of 8 was used to calculate the feature attribution for both COVID-19 and pneumonia cases. We implemented the occlusion technique for CXR images using the Captum framework [63]. Sample occlusion results for COVID-19 and pneumonia-labeled images are presented in Figure 11 and Figure 12, respectively.
The computational complexity of all stages and models are presented in Table 6. These analyses were performed using a Nvidia Titan X GPU machine and an AMD Ryzen7 2700X CPU platform. Finally, we performed an experiment to examine the impact of data augmentation and mini-batch balancing used during the training on the performances of the reported best model. Specifically, we trained DenseNet161-based models including both data augmentation and mini-batch balancing, while another set of models were trained excluding both steps. Table 7 shows comparisons between these two types of models for COVID-19, pneumonia, and Control Group classes in terms of four different evaluation metrics.

5. Discussion

In the current study, a large and a comparatively challenging dataset was chosen in which CXR images were collected from multiple clinical sites in Valencia, Spain [43]. The challenging part comes from the fact that all COVID-19 cases, including the suspected patients, were confirmed by RT-PCR test, even when the patients are asymptotic at the radiological level. The chosen dataset therefore contains COVID-19 examples with both visible and obscured symptoms, unlike other datasets available in the literature. Another challenge is that the normal control groups may include patients with nonpneumonia-related pulmonary diseases. Therefore, the proposed approach is designed not only to distinguish between pneumonia (either COVID-19 or bacterial) and healthy cases, but also the cases with pulmonary abnormalities nonrelated to pneumonia.
In terms of defining the learning problem setup, the majority of previous studies identified the diagnostic problem as a multi-class classification instance in which each case is assumed to exclusively have either a bacterial pneumonia or a COVID-19-induced pneumonia. However, COVID-19 infection may have a high association with other pulmonary diseases and may manifest mutually inclusive pathological features corresponding to bacterial pneumonia or infiltrates [51]. This can also be observed in the current CXR image-base, where many instances of COVID-19 were also diagnosed with bacterial pneumonia. Consistently, we proposed a multi-label classification framework for the simultaneous detection of pneumonia and COVID-19 infections using a joint probability distribution involving the normal (control group), pneumonia, and COVID-19 classes. The average precisions reported by the best performing DenseNet161 CNN model for COVID-19 and pneumonia classes (97.5% and 92.1%, respectively) demonstrated the appropriateness of the proposed learning framework.
An extensive literature analysis on imaging-based COVID-19 diagnostic studies reveals several research challenges. The foremost among those is learning on a limited training dataset, which leads the model to learn ‘shortcuts’ rather than actual features from the images. These shortcuts usually include lung size and position, and artifacts present outside the lung area. We also encountered the same problem in the current study. This hinders the process of training models exclusively on true pathological features. To overcome this challenge, the CNN models were trained using segmented lung regions instead of entire X-ray images. Specifically, the current approach uses a lung segmentation procedure preceded by a localization operation on CXR images. The lung localization helped in standardizing both lung size and position, while the segmentation process removed all irrelevant tissues.
The micro-averaging-based performance summary presented in Table 5 indicates that the model using an ensemble of global and local attention features showed the best performance among all backbone CNN models. Specifically, the models based on the DenseNet161 network outperform all other models, whereas the Inception V4.0-based models demonstrate worst performances. The results indicated that DenseNet161 CNN surpassed the more complex Inception V4.0 model, which also suggested the efficacy of using local features along with global features. Test results of the ensemble approach indicate its higher capability of diagnosing COVID-19 cases, achieving a balanced accuracy of 98.5%, average precision of 97.5%, and F1-score of 98.9%. Figure 9 shows the weighted binary cross-entropy loss for all the models during a single experiment. This figure illustrates that all the models converged around the same time except for the global Inception v4.0 model, for which the convergence was slightly faster. Models based on DenseNet161 experienced higher training losses, making them candidates for further improvement with additional training data. These results, in accordance with the metrics presented in Table 2, Table 3, Table 4 and Table 5 and the statistical analysis, indicate the superiority of the DenseNet161 over other models. It is important to note that the current dataset and the problem formulation mostly differ from the previous studies, which make a fair comparison with existing methods a bit difficult. However, we attempt to provide an overview of the accuracy of these studies to determine the efficiency of the proposed approach. The current method outperformed the techniques proposed by Ahsan et al. [64] and Khan et al. [65], which achieved an accuracy of 89.6 and 95.38, respectively. Furthermore, our approach showed a comparable performance to the COVID-Net method [41], which achieved a precision (positive predictive value) of 98.9 for COVID-19 cases.
The statistical analysis of the models in the current study was found to be useful in detecting differences in the prediction models across multiple test attempts. For the ResNet18 backbone, as shown in Figure 10a, the analysis indicates that there is no significant difference between the local and global models, while the ensemble model and the other models differ from each other in a significant manner. Specifically, the mean rank of the ensemble model, local, and global models resulted as 1.0, 2.125, and 2.875, respectively. Figure 10b manifests that in the case of DenseNet161-based models, the model ensemble occupied the best rank followed by the local model and the global model, which further indicates that there is a significant difference between the model ensemble and the other models. For Inception V4.0 models, as shown in Figure 10c, there were significant differences between all models, and the model ensemble ranked the best position among all models. The model ensemble turned out to be the winner in the first round of statistical tests. Based on that outcome, the second test was then used to compare among the ensembles of ResNet18, DenseNet161, and Inception V4.0 models. The results of the latter test indicated that there was a significant difference between all models, as shown in Figure 10d. In particular, the DenseNet161-based ensemble held the best rank followed by ResNet18 ensemble, while the Inception v4.0-based ensemble occupied the worst position.
The occlusion technique-based model investigation (Figure 9 and Figure 10) demonstrated that the global feature-based model and the model with local attention features emphasized on distinct parts of the image. The local attention head and MIL pooling focused on some detailed features while suppressing some general global features. Accordingly, we hypothesize that the latter process could enhance the feature descriptions extracted from CXR images with complex pathological signs or disease structures.
The run-time complexities reported in Table 6 demonstrate that the ResNet18 backbone was the fastest and the DenseNet161 was the slowest among three models tested on both GPU and CPU computing platforms. However, in the case of all three models, the diagnosis of a single case can be performed in less than a second on the GPU machine, whereas it takes approximately two seconds on the CPU, including the combined run-times of localization, segmentation, and classification. Therefore, all the models are reported to have an economical diagnostic time irrespective of their classification performances in the present study.
The comparative analysis of the DenseNet161 ensemble model performances in- and excluding data augmentation and balancing shows that there were observable differences in classification performances in the case of COVID-19. When handling the low samples and class imbalance issues during the training, it enhanced the model performances in terms of all evaluation metrics, particularly for COVID-19 cases. Modest improvements were also observed for the other two classes (pneumonia and control groups). This analysis therefore exemplifies the necessity of enriching the low-representing class through data augmentation and resolving the class imbalance issue by adopting suitable balancing techniques to ensure a reliable and a bias-free training of the prediction models. The statistical analysis using the Wilcoxon signed rank test [61,66] shows a significant difference these models. The p-values are 0.008 in the case of the control group, 0.001 for pneumonia class, and 0.0002 for COVID-19 cases. Finally, the model ensemble with data augmentation has a higher mean rank in the case of all classes.

6. Conclusions

In the current study, we presented an ensemble approach of deep learning models utilizing both global and local attention-based features for COVID-19 detection on CXR images. The proposed approach attempts to alleviate several research challenges; for instance, incorrect feature attribution was addressed by consecutive localization and segmentation of the lung region from the whole CXR images prior to feature extraction, whereas class imbalance issues were resolved by effective data augmentation and mini-batch balancing techniques. Furthermore, an enhanced feature descriptor was built using a combination of global and local attention-based features. After inspecting a series of backbone CNN models, an ensemble of DenseNet161 models using these two levels of features was found to be the best model for classifying CXR images in a multi-label classification framework. This ensemble model achieves an average balanced accuracy of 91.2%, precision of 92.4%, and F1-score of 91.9% considering all three classes, on the independent test set, with an estimated response time of around two (2) seconds on a typical CPU setup on a single CXR image. A comprehensive statistical analysis further establishes the superiority of the DenseNet161-based ensembles over other models. The highly accurate and prompt performance indicates the effectivity of the proposed model even when multiple pathologies are intertwined in a single CXR image. A potential research avenue could be to incorporate radiological reports as NLP features to further augment the prediction performances of the proposed models.

Author Contributions

Conceptualization, A.A. (Ahmed Afifi) and N.E.H.; methodology, A.A. (Ahmed Afifi); software, A.A. (Ahmed Afifi); validation, A.A. (Ahmed Afifi), N.E.H. and M.A.S.A.; formal analysis, A.A. (Ahmed Afifi); investigation, A.A. (Ahmed Afifi), N.E.H., M.A.S.A. and S.A.; resources, A.A. (Ahmed Afifi) and A.A. (Abdulaziz Alhumam); data curation, A.A. (Ahmed Afifi), N.E.H. and S.A.; writing—original draft preparation, A.A. (Ahmed Afifi) and N.E.H.; writing—review and editing, A.A. (Ahmed Afifi) and N.E.H.; visualization, A.A. (Ahmed Afifi); supervision, A.A. (Ahmed Afifi) and A.A. (Abdulaziz Alhumam); project administration, A.A. (Ahmed Afifi) and N.E.H.; funding acquisition, A.A. (Ahmed Afifi), N.E.H., M.A.S.A., A.A. (Abdulaziz Alhumam) and S.A. All authors have read and agreed to the published version of the manuscript.

Funding

This research was funded by King Abdulaziz City for Science & Technology (KACST) through the Fast-Track Funding Path for Coronavirus (COVID-19), grant number 5-20-01-004-0022.

Institutional Review Board Statement

The dataset used in this article [43] was approved by “The Institutional Review Board (IRB) of the Miguel Hernandez University (MHU) approved this HIPAA-compliant retrospective cohort study. The study was approved by the local institutional ethics committee CElm: 12/2020 at Arnau de Vilanova Hospital in Valencia Region. The healthcare authorities of the Comunitat Valenciana authorized the publication of the open database based on the basis of different reports that had to be written”.

Informed Consent Statement

Not applicable. The dataset [43] was anonymized by the dataset authors and all patient data were removed from radiological reports and DICOM images.

Data Availability Statement

Data is available from its original source as cited in the article, BIMCV-COVID19–BIMCV (cipf.es).

Acknowledgments

The authors wish to thank the King Abdul-Aziz City for Science and Technology for their generous funding through the Fast-Track Funding Path for Coronavirus (COVID-19) grant number 5-20-01-004-0022.

Conflicts of Interest

The authors declare no conflict of interest.

References

  1. WHO Report of the WHO-China Joint Mission on Coronavirus Disease 2019 (COVID-19). World Health Organization (WHO). Available online: https://www.who.int/publications-detail/report-of-the-who-china-joint-mission-on-coronavirus-disease-2019-(covid-19) (accessed on 19 June 2020).
  2. Coronavirus Update (Live), Worldometer. Available online: https://www.worldometers.info/coronavirus/ (accessed on 19 June 2020).
  3. He, X.; Lau, E.H.Y.; Wu, P.; Deng, X.; Wang, J.; Hao, X.; Lau, Y.C.; Wong, J.Y.; Guan, Y.; Tan, X.; et al. Temporal dynamics in viral shedding and transmissibility of COVID-19. Nat. Med. 2020, 26, 672. [Google Scholar] [CrossRef] [PubMed] [Green Version]
  4. COVID-19 Radiology Reference Article, Radiopaedia. Available online: https://radiopaedia.org/articles/covid-19-3 (accessed on 20 June 2020).
  5. Ai, T.; Yang, Z.; Hou, H.; Zhan, C.; Chen, C.; Lv, W.; Tao, Q.; Sun, Z.; Xia, L. Correlation of Chest CT and RT-PCR Testing for Coronavirus Disease 2019 (COVID-19) in China: A Report of 1014 Cases. Radiology 2020, 296, E32–E40. [Google Scholar] [CrossRef] [PubMed] [Green Version]
  6. Fang, Y.; Zhang, H.; Xie, J.; Lin, M.; Ying, L.; Pang, P.; Ji, W. Sensitivity of chest CT for COVID-19: Comparison to RT-PCR. Radiology 2020, 296, E115–E117. [Google Scholar] [CrossRef] [PubMed]
  7. Won, J.; Lee, S.; Park, M.; Kim, T.Y.; Park, M.G.; Choi, B.Y.; Kim, D.; Chang, H.; Kim, V.N.; Lee, C.J. Development of a laboratory-safe and low-cost detection protocol for SARS-CoV-2 of the Coronavirus Disease 2019 (COVID-19). Exp. Neurobiol. 2020, 29, 107. [Google Scholar] [CrossRef] [PubMed]
  8. Kanne, J. Chest CT findings in 2019 novel coronavirus (2019-NCoV) infections from Wuhan, China: Key points for the radiologist. Radiology 2020, 295, 16–17. [Google Scholar] [CrossRef] [PubMed] [Green Version]
  9. Bernheim, A.; Mei, X.; Huang, M.; Yang, Y.; Fayad, Z.A.; Zhang, N.; Diao, K.; Lin, B.; Zhu, X.; Li, K.; et al. Chest CT findings in coronavirus disease 2019 (COVID-19): Relationship to duration of infection. Radiology 2020, 295, 685. [Google Scholar] [CrossRef] [Green Version]
  10. Xie, X.; Zhong, Z.; Zhao, W.; Zheng, C.; Wang, F.; Liu, J. Chest CT for Typical Coronavirus Disease 2019 (COVID-19) Pneumonia: Relationship to Negative RT-PCR Testing. Radiology 2020, 296, E41–E45. [Google Scholar] [CrossRef] [Green Version]
  11. Rubin, G.D.; Ryerson, C.J.; Haramati, L.B.; Sverzellati, N.; Kanne, J.P.; Raoof, S.; Schluger, N.W.; Volpi, A.; Yim, J.J.; Martin, I.B.K.; et al. The Role of Chest Imaging in Patient Management during the Covid-19 Pandemic: A Multinational Consensus Statement from the Fleischner Society. Radiology 2020, 296, 172–180. [Google Scholar] [CrossRef] [Green Version]
  12. Rodrigues, J.C.L.; Hare, S.S.; Edey, A.; Devaraj, A.; Jacob, J.; Johnstone, A.; McStay, R.; Nair, A.; Robinson, G. An update on COVID-19 for the radiologist—A British society of Thoracic Imaging statement. Clin. Radiol. 2020, 75, 323. [Google Scholar] [CrossRef] [Green Version]
  13. Perlman, S. Another Decade, another Coronavirus. N. Engl. J. Med. 2020, 382, 760–762. [Google Scholar] [CrossRef]
  14. Kanne, J.P.; Little, B.P.; Chung, J.H.; Elicker, B.M.; Ketai, L.H. Essentials for Radiologists on COVID-19: An Update-Radiology Scientific Expert Panel. Radiology 2020, 296, E113–E114. [Google Scholar] [CrossRef] [PubMed] [Green Version]
  15. Raptis, C.A.; Hammer, M.M.; Short, R.G.; Shah, A.; Bhalla, S.; Bierhals, A.J.; Filev, P.D.; Hope, M.D.; Jeudy, J.; Kligerman, S.J.; et al. Chest CT and Coronavirus Disease (COVID-19): A Critical Review of the Literature to Date. Am. J. Roentgenol. Roentgenol. 2020, 215, 839. [Google Scholar] [CrossRef] [PubMed]
  16. Jacobi, A.; Chung, M.; Bernheim, A.; Eber, C. Portable Chest X-Ray in Coronavirus Disease-19 (COVID-19): A Pictorial Review. Clin. Imaging 2020, 64, 35. [Google Scholar] [CrossRef] [PubMed]
  17. Deng, J.; Dong, W.; Socher, R.; Li, L.; Li, K.; Li, F. ImageNet: A Large-Scale Hierarchical Image Database. In Proceedings of the 2009 IEEE Conference on Computer Vision and Pattern Recognition, Miami, FL, USA, 20–25 June 2009; p. 248. [Google Scholar]
  18. He, X.; Yang, X.; Zhang, S.; Zhao, J.; Zhang, Y.; Xing, E.; Xie, P. Sample-Efficient Deep Learning for COVID-19 Diagnosis Based on CT Scans. medRxiv 2020. [Google Scholar] [CrossRef]
  19. Pham, H.H.; Le, T.T.; Ngo, D.T.; Tran, D.Q.; Nguyen, H.Q. Interpreting Chest X-Rays Via CNNS That Exploit Hierarchical Disease Dependencies and Uncertainty Labels. arXiv 2020, arXiv:1911.06475. [Google Scholar]
  20. Irvin, J.; Rajpurkar, P.; Ko, M.; Yu, Y.; Ciurea-Ilcus, S.; Chute, C.; Marklund, H.; Haghgoo, B.; Ball, R.; Shpanskaya, K.; et al. CheXpert: A Large Chest Radiograph Dataset with Uncertainty Labels and Expert Comparison. In Proceedings of the 33rd AAAI Conference on Artificial Intelligence, Honolulu, HI, USA, 27 January–1 February 2019; p. 590. [Google Scholar]
  21. Gabruseva, T.; Poplavskiy, D.; Kalinin, A. Deep Learning for Automatic Pneumonia Detection. In Proceedings of the IEEE Computer Society Conference on Computer Vision and Pattern Recognition Workshops, Seattle, WA, USA, 14–19 June 2020; p. 350. [Google Scholar]
  22. Bansal, N. Classification of X-ray Images for Detecting Covid-19 Using Deep Transfer Learning. Res. Square 2020. [Google Scholar] [CrossRef]
  23. Zech, J. Reproduce-Chexnet. 2018. Available online: https://github.com/jrzech/reproduce-chexnet (accessed on 19 June 2020).
  24. Bassi, P.R.; Attux, R. A Deep Convolutional Neural Network for COVID-19 Detection Using Chest X-Rays. arXiv 2020, arXiv:2005.01578. [Google Scholar]
  25. Benbrahim, H.; Hachimi, H.; Amine, A. Deep Transfer Learning with Apache Spark to Detect COVID-19 in Chest X-ray Images. Rom. J. Inf. Sci. Technol. 2020, 23, 117. [Google Scholar]
  26. Zaharia, M.; Xin, R.S.; Wendell, P.; Das, T.; Armbrust, M.; Dave, A.; Meng, X.; Rosen, J.; Venkataraman, S.; Franklin, M.J.; et al. Apache Spark: A Unified Engine for Big Data Processing. Commun. ACM 2016, 59, 56. [Google Scholar] [CrossRef]
  27. Chowdhury, M.E.H.; Rahman, T.; Khandakar, A.; Mazhar, R.; Kadir, M.A.; Mahbub, Z.B.; Islam, K.R.; Khan, M.S.; Iqbal, A.; Al Emadi, N.; et al. Can AI Help in Screening Viral and COVID-19 Pneumonia? IEEE Access 2020, 8, 132665. [Google Scholar] [CrossRef]
  28. De Moura, J.; Novo, J.; Ortega, M. Fully Automatic Deep Convolutional Approaches for The Analysis of Covid-19 Using Chest X-Ray Images. medRxiv 2020. [Google Scholar] [CrossRef]
  29. Ghoshal, B.; Tucker, A. Estimating Uncertainty and Interpretability in Deep Learning for Coronavirus (COVID-19) Detection. arXiv 2020, arXiv:2003.10769. [Google Scholar]
  30. Chatterjee, S.; Saad, F.; Sarasaen, C.; Ghosh, S.; Khatun, R.; Radeva, P.; Rose, G.; Stober, S.; Speck, O.; Nürnberger, A. Exploration of Interpretability Techniques for Deep Covid-19 Classification Using Chest X-Ray Images. arXiv 2020, arXiv:2006.02570. [Google Scholar]
  31. Hussain, S.; Khan, A.; Zafar, M.M. Coronavirus Disease Analysis using Chest X-ray Images and a Novel Deep Convolutional Neural Network. Res. Gate 2020. [Google Scholar] [CrossRef]
  32. Lv, D.; Qi, W.; Li, Y.; Sun, L.; Wang, Y. A Cascade Network for Detecting Covid-19 Using Chest X-rays. arXiv 2020, arXiv:2005.01468. [Google Scholar]
  33. Narin, A.; Kaya, C.; Pamuk, Z. Automatic Detection of Coronavirus Disease (COVID-19) Using X-ray Images and Deep Convolutional Neural Networks. arXiv 2020, arXiv:2003.10849. [Google Scholar]
  34. Oh, Y.; Park, S.; Ye, J.C. Deep Learning COVID-19 Features on CXR Using Limited Training Data Sets. IEEE Trans. Med. Imaging 2020, 39, 2688. [Google Scholar] [CrossRef]
  35. Rajaraman, S.; Siegelman, J.; Alderson, P.O.; Folio, L.S.; Folio, L.R.; Antani, S.K. Iteratively Pruned Deep Learning Ensembles for COVID-19 Detection in Chest X-Rays. IEEE Access 2020, 8, 115041. [Google Scholar] [CrossRef]
  36. Ramadhan, M.M.; Faza, A.; Lubis, L.E.; Yunus, R.E.; Salamah, T.; Handayani, D.; Lestariningsih, I.; Resa, A.; Alam, C.R.; Prajitno, P.; et al. Fast and Accurate Detection of Covid-19-Related Pneumonia from Chest X-Ray Images with Novel Deep Learning Model. arXiv 2020, arXiv:2005.04562. [Google Scholar]
  37. Duchesne, S.; Gourdeau, D.; Archambault, P.; Chartrand-Lefebvre, C.; Dieumegarde, L.; Forghani, R.; Gagné, C.; Hains, A.; Hornstein, D.; Le, H.; et al. Tracking and Predicting Covid-19 Radiological Trajectory Using Deep Learning on Chest X-rays: Initial Accuracy Testing. medRxiv 2020. [Google Scholar] [CrossRef]
  38. Ucar, F.; Korkmaz, D. COVIDiagnosis-Net: Deep Bayes-Squeezenet Based Diagnosis of the Coronavirus Disease 2019 (COVID-19) from X-ray Images. Med. Hypotheses 2020, 140, 109761. [Google Scholar] [CrossRef] [PubMed]
  39. Ezzat, D.; ell Hassanien, A.; Ella, H.A. GSA-DenseNet121-COVID-19: A Hybrid Deep Learning Architecture for the Diagnosis of COVID-19 Disease based on Gravitational Search Optimization Algorithm. arXiv 2020, arXiv:2004.05084. [Google Scholar]
  40. Rajaraman, S.; Antani, S. Weakly Labeled Data Augmentation for Deep Learning: A Study on COVID-19 Detection in Chest X-rays. Diagnostics 2020, 10, 358. [Google Scholar] [CrossRef] [PubMed]
  41. Wang, L.; Lin, Z.Q.; Wong, A. COVID-Net: A Tailored Deep Convolutional Neural Network Design for Detection of COVID-19 Cases from Chest X-ray Images. Sci. Rep. 2020, 10, 19549. [Google Scholar] [CrossRef]
  42. Sahlol, A.T.; Yousri, D.; Ewees, A.A.; Al-qaness, M.A.A.; Damasevicius, R.; Elaziz, M.A. COVID-19 Image Classification Using Deep Features and Fractional-Order Marine Predators Algorithm. Sci. Rep. 2020, 10, 15364. [Google Scholar] [CrossRef]
  43. De la Vayá, M.I.; Saborit, J.M.; Montell, J.A.; Pertusa, A.; Bustos, A.; Cazorla, M.; Galant, J.; Barber, X.; Orozco-Beltrán, D.; García-García, F.; et al. BIMCV COVID-19+: A Large Annotated Dataset of RX and CT Images from COVID-19 Patients. arXiv 2020, arXiv:2006.01174. [Google Scholar]
  44. Bustos, A.; Pertusa, A.; Salinas, J.M.; de la Iglesia-Vayá, M. Padchest: A Large Chest X-ray Image Dataset with Multi-Label Annotated Reports. arXiv 2019, arXiv:1901.07441. [Google Scholar] [CrossRef] [PubMed]
  45. De Grave, A.J.; Janizek, J.D.; Lee, S. AI for radiographic COVID-19 detection selects shortcuts over signal. medRxiv 2020. [Google Scholar] [CrossRef]
  46. Lin, T.Y.; Goyal, P.; Girshick, R.; He, K. Dollar, Focal Loss for Dense Object Detection. In Proceedings of the 2017 IEEE International Conference on Computer Vision, Venice, Italy, 22–29 October 2017; p. 2999. [Google Scholar]
  47. Lin, T.Y.; Dollár, P.; Girshick, R.; He, K.; Hariharan, B.; Belongie, S. Feature Pyramid Networks for Object Detection. In Proceedings of the 2017 IEEE Conference on Computer Vision and Pattern Recognition, Honolulu, HI, USA, 21–26 July 2017; p. 936. [Google Scholar]
  48. Comelli, A.; Coronnello, C.; Dahiya, N.; Benfante, V.; Palmucci, S.; Basile, A.; Vancheri, C.; Russo, G.; Yezzi, A.; Stefano, A. Lung Segmentation on High-Resolution Computerized Tomography Images Using Deep Learning: A Preliminary Step for Radiomics Studies. J. Imaging 2020, 6, 125. [Google Scholar] [CrossRef]
  49. Comelli, A.; Dahiya, N.; Stefano, A.; Benfante, V.; Gentile, G.; Agnese, V.; Raffa, G.M.; Pilato, M.; Yezzi, A.; Petrucci, G.; et al. Deep Learning Approach for the Segmentation of Aneurysmal Ascending Aorta. Biomed. Eng. Lett. 2020, 1–10. [Google Scholar] [CrossRef]
  50. He, K.; Zhang, X.; Ren, S.; Sun, J. Deep Residual Learning for Image Recognition. In Proceedings of the 2016 IEEE Conference on Computer Vision and Pattern Recognition, Las Vegas, NV, USA, 27–30 June 2016; p. 770. [Google Scholar]
  51. Xie, S.; Girshick, R.; Dollár, P.; Tu, Z.; He, K. Aggregated Residual Transformations for Deep Neural Networks. In Proceedings of the 2017 IEEE Conference on Computer Vision and Pattern Recognition, Honolulu, HI, USA, 21–26 July 2017; p. 5987. [Google Scholar]
  52. COVID-19 Xray Dataset [Dataset]. Available online: https://github.com/v7labs/covid-19-xray-dataset (accessed on 1 November 2020).
  53. Kingma, D.P.; Ba, J.L. Adam: A Method for Stochastic Optimization. In Proceedings of the 3rd International Conference on Learning Representations, San Diego, CA, USA, 7–9 May 2015. [Google Scholar]
  54. Yasin, R.; Gouda, W. Chest X-Ray Findings Monitoring COVID-19 Disease Course and Severity. Egypt. J. Radiol. Nucl. Med. 2020, 51, 1–18. [Google Scholar] [CrossRef]
  55. Szegedy, C.; Ioffe, S.; Vanhoucke, V.; Alemi, A.A. Inception-v4, Inception-Resnet and the Impact of Residual Connections on Learning. In Proceedings of the 31st AAAI Conference on Artificial Intelligence, 4–9 February 2017; p. 4278. [Google Scholar]
  56. Huang, G.; Liu, Z.; Van Der Maaten, L.; Weinberger, K.Q. Densely Connected Convolutional Networks. In Proceedings of the 2017 IEEE Conference on Computer Vision and Pattern Recognition, Honolulu, HI, USA, 21–26 July 2017; p. 2261. [Google Scholar]
  57. Li, Z.; Wang, C.; Han, M.; Xue, Y.; Wei, W.; Li, L.J.; Fei, L. Thoracic Disease Identification and Localization with Limited Supervision. In Proceedings of the 2018 IEEE/CVF Conference on Computer Vision and Pattern Recognition, Salt Lake City, UT, USA, 18–23 June 2018; p. 8290. [Google Scholar]
  58. Ilse, M.; Tomczak, J.M.; Welling, M. Attention-Based Deep Multiple Instance Learning. In Proceedings of the 35th International Conference on Machine Learning, Stockholm, Sweden, 10–15 July 2018. [Google Scholar]
  59. Janez, D. Statistical Comparisons of Classifiers over Multiple Data Sets. J. Mach. Learn. Res. 2006, 7, 1–30. [Google Scholar]
  60. Nemenyi, P. Distribution-Free Multiple Comparisons. Ph.D. Thesis, Princeton University, Princeton, NJ, USA, 1963. [Google Scholar]
  61. Herbold, S. Autorank: A Python package for automated ranking of classifiers. J. Open Source Softw. 2020, 5, 2173. [Google Scholar] [CrossRef] [Green Version]
  62. Zeiler, M.D.; Fergus, R. Visualizing and Understanding Convolutional Networks. Lecture Notes in Computer Science; Springer: Cham, Switzerland, 2014; p. 8689. [Google Scholar]
  63. Captum-Model Interpretability for PyTorch [Software Framework]. Available online: https://captum.ai/ (accessed on 1 November 2020).
  64. Ahsan, M.M.; Alam, T.E.; Trafalis, T. Huebner, Deep MLP-CNN Model Using Mixed-Data to Distinguish between COVID-19 and Non-COVID-19 Patients. Symmetry 2020, 12, 1526. [Google Scholar] [CrossRef]
  65. Khan, A.I.; Shah, J.L.; Bhat, M.M. CoroNet: A Deep Neural Network for Detection and Diagnosis of COVID-19 from Chest X-ray Images. Comput. Methods Programs Biomed. 2020, 196, 105581. [Google Scholar] [CrossRef]
  66. Rey, D.; Neuhäuser, M. Wilcoxon-Signed-Rank Test. In International Encyclopedia of Statistical Science; Lovric, M., Ed.; Springer: Berlin/Heidelberg, Germany, 2011. [Google Scholar] [CrossRef]
Figure 1. The proposed end-to-end diagnosis approach, which receives a raw chest X-ray (CXR) image and produces the infection probability.
Symmetry 13 00113 g001
Figure 2. Feature attribution of a sample image from Coronavirus Disease 2019 (COVID-19) diagnosis dataset—(a) the original image, (b) after lung localization, and (c) after lung segmentation. Wrong attributions are marked by red ovals.
Symmetry 13 00113 g002
Figure 3. Lung localization in several CXR samples. Original images are on the first row and the processed images are on the second row.
Symmetry 13 00113 g003
Figure 4. Lung segmentation from several CXR samples. Original images are on the first row and the segmented images are on the second row.
Symmetry 13 00113 g004
Figure 5. The backbone convolutional neural network (CNN) classification model with an attention-based local features extraction head using a multiple-instance learning scheme. The dimensions, s and d, indicate the spatial resolution of the output feature maps and the number of feature maps, respectively.
Symmetry 13 00113 g005
Figure 6. Normalized confusion matrices and the receiver operating characteristics (ROC) curves of the DenseNet161-based global models for (a) control group; (b) pneumonia; (c) COVID-19 classes.
Symmetry 13 00113 g006
Figure 7. Normalized confusion matrices and the ROC curves of the DenseNet161-based model with local attention and multi-instance polling (MIL) for (a) control group; (b) pneumonia; (c) COVID-19 classes.
Symmetry 13 00113 g007
Figure 8. Normalized confusion matrices and the ROC curves of the DenseNet161-based ensemble of global model and the model with local attention and MIL for (a) control group; (b) pneumonia; (c) COVID-19 classes.
Symmetry 13 00113 g008
Figure 9. Weighted cross-entropy training loss curves for all models (early stopping of training was enforced when validation loss stopped improving for five consecutive epochs).
Symmetry 13 00113 g009
Figure 10. Statistical analysis of different models using the Friedman test followed by the post-Hoc Nemenyi test [59,60,61].
Symmetry 13 00113 g010aSymmetry 13 00113 g010b
Figure 11. Visualization of the most important features for COVID-19 diagnosis by DenseNet161 based models. Features related to the global models are shown on the first row and those for the models with local attention are displayed on the second row.
Symmetry 13 00113 g011
Figure 12. Visualization of the most important features for pneumonia diagnosis by DenseNet161-based models. Features related to the global models are shown on the first row and those for the models with local attention are depicted on the second row.
Symmetry 13 00113 g012
Table 1. Number of samples in each class for training, validation, and independent test folds.
ClassTrainingValidationTest
Control500910761133
Pneumonia3934822785
COVID19739158159
Table 2. Evaluation results of all models for the control group.
CNN ModelEvaluation MetricGlobal OnlyLocal AttentionEnsemble
ReseNet18AUC0.903 (0.883, 0.927)0.917 (0.890, 0.943)0.927 (0.902, 0.955)
Balanced Accuracy83.8% (81.3, 86.7)84.9% (81.4, 88.4)85.5% (82.0, 89.4)
Average Precession87.8% (85.6, 90.5)90.2% (87.4, 93.0)91.3% (88.6, 94.3)
F1 Score83.6% (81.0, 86.7)84.9% (81.4, 88.4)85.3% (81.8, 89.2)
DenseNet161AUC0.926 (0.908, 0.947)0.934 (0.910, 0.959)0.943 (0.921, 0.967)
Balanced Accuracy86.0% (83.6, 88.8)87.3% (84.1, 90.4)87.8% (84.6, 91.3)
Average Precession91.0% (89.0, 93.3)92.2% (89.5, 94.8)93.1% (90.6, 95.9)
F1 Score86.0% (83.6, 88.8)87.3% (84.1, 90.4)87.8% (84.6, 91.3)
Inception V4.0AUC0.896 (0.875, 0.921)0.906 (0.878, 0.934)0.923 (0.896, 0.853)
Balanced Accuracy82.1% (79.5, 85.1)83.5% (79.8, 87.1)84.7% (81.2, 88.6)
Average Precession87.4% (85.2, 90.1)88.5% (85.3, 91.6)90.9% (88.0, 94.1)
F1 Score82.3% (79.7, 85.4)83.6% (79.9, 87.2)84.5% (81.0, 88.4)
Table 3. Evaluation results of all models for pneumonia.
CNN ModelEvaluation MetricGlobal OnlyLocal AttentionEnsemble
ReseNet18AUC0.891 (0.865, 0.922)0.907 (0.873, 0.940)0.911 (0.877, 0.948)
Balanced Accuracy82.3% (79.1, 86.1)83.2% (78.8, 87.5)83.8% (79.4, 88.6)
Average Precession89.2% (86.6, 92.3)90.8% (87.4, 94.1)91.5% (88.1, 95.2)
F1 Score82.4% (79.2, 86.2)83.0% (78.6, 87.3)83.6% (79.2, 88.4)
DenseNet161AUC0.914 (0.890, 0.942)0.922 (0.890, 0.953)0.923 (0.890, 0.958)
Balanced Accuracy84.5% (81.5, 88.0)85.5% (81.3, 89.6)86.4% (82.4, 90.9)
Average Precession91.5% (89.1, 94.3)92.1% (88.9, 95.2)92.1% (88.9, 95.6)
F1 Score85.0% (82.0, 88.5)85.6% (81.4, 89.7)86.5% (82.5, 91.0)
Inception V4.0AUC0.883 (0.857, 0.914)0.895 (0.860, 0.930)0.906 (0.872, 0.943)
Balanced Accuracy80.6% (77.3, 84.4)82.0% (77.5, 86.5)83.3% (78.9, 88.1)
Average Precession88.8% (86.2, 91.9)89.7% (86.2, 93.2)90.5% (87.0, 94.4)
F1 Score80.4% (77.1, 84.3)81.9% (77.4, 86.4)83.3% (78.9, 88.1)
Table 4. Evaluation results of all models for COVID-19.
CNN ModelEvaluation MetricGlobal OnlyLocal AttentionEnsemble
ReseNet18AUC0.989 (0.976, 1.00)0.989 (0.971, 1.00)0.994 (0.983, 1.00)
Balanced Accuracy95.2% (91.3, 99.8)95.7% (90.3, 100)96.0% (90.9, 100)
Average Precession90.1% (85.0, 96.5)92.0% (85.0, 99.0)94.3% (88.2, 100)
F1 Score95.7% (91.9, 100)97.4% (93.2, 100)98.1% (94.6, 100)
DenseNet161AUC0.997 (0.993, 1.00)0.995 (0.987, 1.00)0.998 (0.993, 1.00)
Balanced Accuracy96.8% (93.6, 99.5)97.1% (92.7, 99.7)98.5% (95.7, 100)
Average Precession95.7% (91.9, 100)95.5% (90.1, 100)97.5% (93.5, 100)
F1 Score98.4% (96.5, 100)97.7% (94.1, 100)98.9% (96.9, 100)
Inception V4.0AUC0.983 (0.965, 1.00)0.987 (0.967, 1.00)0.991 (0.969, 1.00)
Balanced Accuracy95.0% (91.0, 99.7)95.1% (89.7, 100)96.6% (91.9, 100)
Average Precession90.0% (84.4, 96.6)90.3% (83.0, 97.8)93.5% (86.8, 100)
F1 Score96.2% (92.7, 100)96.5% (91.9, 100)96.4% (91.2, 100)
Table 5. Summary of the evaluation results of all models using Micro-average.
CNN ModelEvaluation MetricGlobal OnlyLocal AttentionEnsemble
ReseNet18Balanced Accuracy86.8% (85.0, 88.9)87.2% (84.9, 89.5)88.7% (88.8, 91.3)
Average Precession87.9% (86.2, 89.9)87.3% (85.0, 89.6)88.8% (86.4, 91.4)
F1 Score87.3% (85.6, 89.3)88.5% (86.2, 90.8)89.3% (87.1, 91.7)
DenseNet161Balanced Accuracy88.9% (87.2, 90.9)89.4% (87.2, 91.6)91.2% (89.2, 93.4)
Average Precession90.7% (89.3, 92.4)91.3% (89.3, 93.3)92.4% (90.5, 94.6)
F1 Score89.6% (88.1, 91.4)90.2% (88.0, 92.4)91.9% (89.9, 94.1)
Inception V4.0Balanced Accuracy84.7% (82.9, 86.8)86.2% (83.7, 88.7)87.5% (85.1, 90.1)
Average Precession85.5% (83.7, 87.6)88.7% (86.4, 91.0)88.9% (86.5, 91.5)
F1 Score86.3% (84.5, 88.4)87.3% (85.0, 89.6)88.2% (85.8, 90.8)
Table 6. Comparison of the computation complexity of all tasks and models.
Task/Backbone Model GPU (Time in Seconds)CPU (Time in Seconds)
Localization + segmentation 0.611.36
ResNet18Global0.020.06
Local0.020.06
Ensemble0.040.12
DenseNet161Global0.030.38
Local0.040.38
Ensemble0.070.76
Inception V4.0Global0.030.23
Local0.030.24
Ensemble0.060.47
Table 7. DenseNet161 ensemble performance comparisons in- and excluding data augmentation (Aug) and mini-batch balancing (Bal).
Evaluation MetricControl GroupPneumoniaCOVID-19
No Aug or BalAug + BalNo Aug or BalAug + BalNo Aug or BalAug + Bal
AUC0.933
(0.916, 0.954)
0.943
(0.921, 0.965)
0.921
(0.900, 0.948)
0.923
(0.892, 0.954)
0.991
(0.975, 1.00)
0.998
(0.988, 1.00)
Balanced Accuracy87.3%
(85.2, 90.0)
87.8%
(84.7, 90.9)
85.5%
(82.7, 89.0)
86.4%
(82.4, 90.4)
96.2%
(92.8, 100)
98.5%
(95.5, 100)
Average Precession91.5%
(89.7, 93.7)
93.1%
(90.6, 95.6)
92.6%
(90.6, 95.1)
92.1%
(89.0, 95.2)
90.5%
(85.3, 97.0)
97.5%
(93.5, 100)
F1 Score87.2%
(85.1, 89.9)
87.8%
(84.7, 90.9)
85.5%
(82.7, 89.0)
86.5%
(82.5, 90.5)
97.2%
(94.3, 100)
98.9%
(96.4, 100)
Publisher’s Note: MDPI stays neutral with regard to jurisdictional claims in published maps and institutional affiliations.

