Stream Sediments of the Pestrinsk Silver-Bearing System (Northeastern Russia)


A.P. Vinogradov Institute of Geochemistry, Siberian Branch of the Russian Academy of Sciences, Favorskiy str. 1A, 664033 Irkutsk, Russia
*
Author to whom correspondence should be addressed.
Minerals 2021, 11(1), 65; https://doi.org/10.3390/min11010065
Submission received: 7 December 2020
/
Revised: 7 January 2021
/
Accepted: 8 January 2021
/
Published: 11 January 2021
(This article belongs to the Section Mineral Geochemistry and Geochronology)
Abstract
:The composition, structure, and formation features of the exogenous anomalous geochemical fields (AGCFs) identified through stream sediments (SSs) are considered here within the Pestrinsk silver-bearing system and the Goltsovy silver-polymetallic deposit. The research was performed in the southern part of the Balygychan-Sugoy trough (northeastern Russia). The exogenous AGCFs of the main indicator elements of ores, formed in cryolithogenesis zone conditions, were studied. We used the results of multi-scale areal geochemical surveys of SSs. A survey of SSs at 1:200,000 scale was found to be effective at the stage of regional forecasting. Indeed, it is characterized by simplicity and the possibility of obtaining information operatively regarding the metallogeny of the area. It was found that at the local forecast stage, when prospecting for mineralization, the most effective was a survey of SSs at 1:50,000 scale. The AGCFs identified during this survey were distinguished by a richer component composition, higher contrast, and closer relationship with ores. During the lithochemical sampling of the watercourse heads, where alluvial sediments were found to be almost completely absent, a positive result was obtained by the bryolithochemical method, which is based on moss sampling together with a fine fraction of alluvium held by a moss cushion. The method enabled the sampling of watercourse heads and thus yielded information about the presence or absence of anomalous concentration fields of ore elements.
1. Introduction
Among the most effective geochemical methods for prospecting of mineral deposits are traditional multi-scale area geochemical surveys of stream sediments (SSs). The pioneer results of SS surveys in the former USSR were published in 1959 [1,2]. Well-known Soviet scientists A.P. Solovov and V.V. Polikarpochkin made a huge contribution to the study of stream sediments and the development of geochemical methods for ore and non-metallic mineral deposit prospecting [3,4,5,6]. Their research was continued by their followers [7,8,9,10,11,12,13,14,15,16,17,18,19,20]. Works on the study of stream sediments by scientists from other countries have also proved very popular [21,22,23,24,25,26,27,28,29,30,31,32,33,34,35,36,37,38,39,40,41,42,43,44,45,46,47,48].
During mineralization prospecting in northeastern Russia, traditional geochemical surveys of SSs at 1:200,000 scale are a standard method, enabling vast areas to be evaluated. This method has significant advantages: simplicity and quickness and the possibility to obtain information operatively regarding metallogenic features of the area based on geochemical maps. At the same time, experiences of performing such surveys in the mountainous regions of this territory have indicated that the exogenous anomalous geochemical fields (AGCFs) identified in this way often have no specific features of their development. They are characterized by a poor component composition and low contrast, and irregularity of quantitative and sometimes qualitative relationships between elements [10,14,16,18,19,20,49]. As a result, certain difficulties appear under AGCFs’ typification by their relationship to a certain type of mineralization as well as under zonality identification, used to assess the level of ore zones’ erosive profile and their commercial significance.
Further research is needed to improve and increase the efficiency of areal geochemical surveys of SSs. This is especially true for well-studied areas. Relevant territories in northeastern Russia include the Omsukchan ore district (Magadan region). This is one of the largest areas in terms of the number of silver deposits belonging to gold-silver (Au–Ag), silver-polymetallic (Ag–Pb), and tin-silver (Sn–Ag) formations. The region ranks fourth among Russian regions in terms of such metal reserves. The Pestrinsk silver-bearing system (SBS), located in the territory of the Omsukchan ore district, within which our research was conducted, is one of the most promising areas in this regard. There is a large Goltsovy Ag–Pb deposit and a number of small Ag–Pb and Sn–Ag prospects. The priority for this territory is the problem of prospecting for new deposits. A significant role is assigned to the prospecting and evaluating of exogenous AGCFs (geochemical anomalies) identified during multi-scale area surveys of SSs. At the same time, special importance is attached to a detailed study of AGCF composition and construction in order to develop new methods that can be effectively used in prospecting for mineralization at all stages of exploration works.
2. Characteristics of the Study Area
2.1. Geological Setting
The research area is located in the Okhotsk-Chukotka volcanic belt (OCVB) (Figure 1a). One of the largest linear structures of the OCVB is the Balygychan-Sugoy trough, which is confined to a large Omsukchan deep fault, transverse against the belt. The trough’s construction involves a number of large volcano-tectonic structures (depressions), to which the regional ore systems are confined. One of the largest here is the Pestrinsk SBS. The detailed structural, geological, and metallogenic characteristics of the OCVB, the Balygychan-Sugoy trough, and the Pestrinsk SBS have been described in a great many works, for example [50,51,52,53,54,55,56,57,58,59]. The Pestrinsk system (Figure 1a,b) is located in the southern part of the trough on the edge of a large volcanotectonic depression and structurally represents an intrusive dome uplift, formed during the Late Cretaceous at the junction of deep faults [52,56].
Two structural horizons participate in the system’s geological setting. The lower horizon is composed of Triassic–Jurassic terrigenous sediments of the Upper Yana complex, mainly represented by siltstones, sandstones, and argillites with an admixture of tuffaceous material. Near the Pestrinsk SBSs’ south-western boundary in the Triassic sedimentary rocks, the Late Triassic subvolcanic spilites’ outcrops are marked. The upper horizon is composed of Cretaceous igneous formations typical of the OCVB, combined into two volcanoplutonic complexes: early andesite-diorite and late rhyolite-granite [11,16,51]. The early complex, which is primarily composed of average volcanites, is represented by Early-Late Cretaceous andesite-basalts, andesites, their tuffs and tuffolavas, and less often, by dacites of the Tavatum suite as well as Late Cretaceous subvolcanic andesites and dacites. Among the intrusive formations of this complex, Late Cretaceous small intrusions of diorites, gabbro, and granodiorite porphyry can be distinguished. The late complex composed of acidic effusives is represented by Late Cretaceous rhyolites, rhyolitic ignimbrites, and tuffs, and rhyodacites of the Nayakhan suite as well as Late Cretaceous subvolcanic nevadites, rhyolites, and felsites. Granites of Late Cretaceous age can be distinguished from intrusive formations. The same granites of the late complex form the hypabyssal intrusion of the Pestrinsk massif, which forms the core of the intrusive-domed uplift and outcrops in the central part of the Pestrinsk SBS.
According to the data of V.I. Zaitsev, A.I. Kalinin, and I.A. Afanasiev (materials from geological collections), the main structural element of the Pestrinsk SBS is the Upper Tap deep fault with a northeastern strike, which divides the uplift into two tectonic blocks. The rupture, generally, is a fault-type structure, along which the north-west block of Cretaceous rocks is lowered by almost 1000 m. The south-east uplifted side is maximally eroded. Triassic marine terrigenous-sedimentary deposits and Late Cretaceous granitoids of the lower structural horizon are exposed here. In the north-western lowered and less eroded side, Cretaceous volcanites of the upper horizon expose, which are ore-hosting for the Goltsovy Ag–Pb deposit (see Figure 1).
2.2. Mineralization
Rare metal (Mo–W), tin-rare metal (Sn–W), tin (Sn), Sn–Ag, and Ag–Pb deposits and prospects are known within the Pestrinsk SBS (see Figure 1). From an industrial point of view, Ag–Pb, Sn–Ag, and Sn mineralization is most important. All known Sn deposits and prospects in this area are small and not very promising; Ag–Pb and Sn–Ag deposits are mainly of interest.
Formation of the ore of the Pestrinsk system, as well as other systems of the Omsukchan ore district, occurred mainly in two stages: early pneumatolytic and late hydrothermal [16]. Mo–W, Sn–W, and Sn mineralization belongs to the pneumatolytic stage of ore formation. The unprofitable zones of disseminated sulfide mineralization (ZDSM) and ores of the Sn–Ag and Ag–Pb formations are related to hydrothermal activity.
Mo–W and Sn–W mineralization was detected in a number of unprofitable prospects. The most studied of them are the Pestrinsk Mo–W prospect and the Kalyan Sn–W prospect. These two types of mineralization are spatially and genetically closely related to Late Cretaceous rare metal granitoids, with areas of their hornfelsing and greisenization (stockworks, zones and areas of veining). Hornstones develop both on the granitoids themselves (endocontact zones) and on the Triassic host sand-shale rocks (exocontact zones). Greisens are mainly confined to the roofs of granitoid massifs. The main non-metal minerals are quartz, feldspar, and muscovite. In smaller quantities, biotite, fluorite, apatite, carbonates, chlorites, amphiboles, pyroxenes, beryl, tourmaline, and topaz can be found. The ore minerals are pyrite, scheelite, molybdenite, and wolframite. Less common are chalcopyrite, magnetite, melnikovite, hematite, and galena [11,16,63]. Sn–W and Mo–W mineralization are diverse in their geochemical composition. High contents are typical for W, As, and Bi, less high for Sn, Mo, and Zn, and low for B, Pb, Cu, and Ag [11,16,65].
Tin mineralization is most widely represented in the Ircha and Upper Tap deposits as well as in numerous Sn prospects. These deposits and prospects are localized, in most cases in Late Cretaceous covering volcanites, cross-cut by intrusions of granodiorites and gabbrodiorites of the same age. Mineralization is located in close proximity to the assumed granitoid massifs at depth. Ores are mineralized zones of the stockwork type with veinlet-vein, vein, and metasomatic bodies. The main vein- and rock-forming minerals are quartz, sericite, chlorite, tourmaline, and carbonates. The main ore mineral is cassiterite. Arsenopyrite, chalcopyrite, pyrrhotite, pyrite, marcasite, and Fe hydroxides are common. Stannite, wolframite, scheelite, galena, sphalerite, magnetite, ilmenite, molybdenite, and Ag minerals (Ag sulphosalts and acanthite) are rare [63,66,67,68,69]. Ores are characterized by a very high Sn content, moderate concentrations of Bi, As, B, W, Ag, and Sb, and lower concentrations of Cu, Zn, and Pb [66,69].
The ZDSM mineral composition is quartz, sericite, chlorite, epidote, and carbonate. The main ore minerals are pyrite, pyrrhotite, and arsenopyrite, less often chalcopyrite, galena, and sphalerite [11,16]. ZDSM is characterized by a multi-component and highly variable composition. High concentrations can form Pb, Zn, As, and Cu, while low concentrations can form Ag, Sn, B, Sb, Bi, and Mo [11,16,65].
Sn–Ag ores in the area of the Pestrinsk SBS are locally manifested in the Olymp and Chisty prospects as well as in the deep levels and on the flanks of the Goltsovy Ag–Pb deposit. Ore bodies are disseminated and veined-disseminated linear zones. In regards to vein- and rock-forming minerals, quartz and chlorite predominate, and calcite and sericite are also found. The ore minerals are galena, sphalerite, argentite, stannite, fahlores (tennantite-tetrahedrite), chalcopyrite, pyrite, and pyrrhotite. Less common are arsenopyrite, cassiterite and native silver [11,16,68,70]. The elemental composition is diverse. High concentrations are typical for As, Ag, Sn, and Sb, while lower concentrations are typical for Pb, Zn, Bi, Cu, and B [11,16,65].
Ag–Pb ores are manifested in the Goltsovy deposit and the Porfirovy prospect. Industrially, this type of mineralization is the most important. It is well studied at the Goltsovy Ag–Pb deposit. Ore zones are represented here by areas of veined-disseminated mineralization, less often by extended veins and lenses in Late Cretaceous volcanites of mainly rhyolitic composition. Ore bodies are composed of quartz, hydromica, carbonates, and sericite; chlorite, adularia, and kaolinite are less common. The most common ore minerals are galena, sphalerite, and freibergite. Tetrahedrite, pyrargyrite, miargyrite, polybasite, stephanite, native silver, acanthite, boulangerite, pyrite, pyrrhotite, and marcasite are also typical. Sternbergite, stannite, chalcopyrite, arsenopyrite, cassiterite, magnetite, and hematite are rare [11,16,56,68,69,70,71,72,73]. High concentrations in ores are typical for Ag, Pb, Sb, and As, with fewer high concentrations for Zn, B, Hg, and Sn and low concentrations of Cu and Bi. The presence of Sn and Bi is associated with the influence of Sn–Ag mineralization, which is usually spatially combined with Ag–Pb mineralization [11,16,65].
2.3. Geography and Climate
The main mountain structure of the research area was the Omsukchan ridge. In the territory under consideration, the ridge forms the Kolyma-Okhotsk watershed. The absolute peak altitudes are 1200–1700 m, and the relative elevation is 1000–1400 m. The peaks are rounded or sharp. The mountain slopes are straight and concave, with a steepness of 25–30° and at the foot up to 45°. The mountains’ peaks and slopes are covered with eluvial-deluvial sediments up to 3–5 m thick. The feet of the mountains are overlapped with thick deluvial-colluvial sediments. The bedrock outcrop in the territory is satisfactory.
The drainage system of the area belongs to the Viliga and Kolyma river basins. The main watercourses are the Left and Right Balygychan, Osennyaya, Kolumb, Tap, and Monke rivers. They have a depth of 0.6 m and flow through wide (600–1000 m), sometimes swampy valleys with a trapezoidal profile, which are in the stage of accumulation and lateral erosion. In the upper reaches of these rivers, as well as in the smaller rivers and streams that flow into them, the depth is 0.4–1.6 m, and the valleys are narrow (up to 100 m) and have a V-shaped transverse profile. These valleys are under intense deep and lateral erosion. Most of the side streams are ephemeral.
The climate of the region is subarctic and sharply continental. Winters are frosty and long, whereas summers are short and cool. The temperature of river water in summer rarely exceeds 4 °C; in winter, the streams freeze to the bottom. Solid snow cover can be seen in mid-October and disappears only in early June. The region is characterized by widespread permafrost.
The flora is typical of the forest-tundra zone. In this area, valley larch and floodplain Chosenia poplar forests are widespread. The mountain slopes are covered with impenetrable thickets of cedar elfin. Mosses and lichens are widespread everywhere. The most detailed descriptions of the area’s geography, climate, and flora can be found in [61,63].
3. Materials and Methods
3.1. Methods of Geochemical Sampling
All the lithochemical surveys of SSs were performed according to standard techniques [6,8]. Sampling was carried out from the alluvial sediments of actual watercourses (Figure 2).
A survey at 1:200,000 scale was performed by the Central Geochemical Expedition (Aleksandrov, Russia). The survey at 1:50,000 scale and detailed research-methodological works were carried out by the A.P. Vinogradov Institute of Geochemistry Siberian Branch of the Russian Academy of Sciences (IGC SB RAS, Irkutsk, Russia). Detailed work included bryolithochemical investigations. The bryolithochemical method is based on the sampling of aquatic and semiaquatic mosses growing on the banks and beds of watercourse heads, together with the silt and sandy silt material that is firmly held by the moss cushion [20,74]. The main purpose of these works was to develop methods that can increase the efficiency of ore prospecting through SSs in cryolithogenesis zone conditions.
In the lithochemical survey of SSs at 1:200,000 scale, the sampling traverses started at 50–100 m above the watercourse mouths of the senior order and ended in the stream mouths of the II order (and in rare cases, the I order). The distance between the selection points of samples was 500 m, the average distance between the sampled riverbeds was 2 km, and the sampling density was one sample/km2. The locations of the alluvium samples are shown in Figure 2a. The number of samples taken was ~2000.
In the lithochemical survey of SSs at 1:50,000 scale, the sampling traverses also started at 50–100 m above the watercourse mouths of the senior order but ended (whenever the material could be sampled) in the stream heads of the I order. The sampling step was 100–250 m, the average distance between the sampled riverbeds was 0.5–0.7 km, and the sampling density was 6–10 samples/km2. The locations of the alluvium samples are shown in Figure 2b. The number of samples taken was 590.
Further processing was common for the considered surveys. Sand-gravel or sand (rarely sandy silt) alluvium fractions were sampled. The alluvium sample weight was 200–300 g. All the samples were thoroughly dried and passed through a sieve with a 1 mm mesh. Abrasion was performed mechanically in steel cups on a vibrating grinder to the state of powder (~200 mesh).
During the bryolithochemical studies, the sampling step was 50 m, and each sample weight of raw moss, after squeezing out the moisture, was 300–400 g. All the selected bryolithochemical samples (see Section 4.3) were first converted to a dry state in the field by drying in the sun, after which their mass was reduced to 50 g. The samples were then burned in a muffle furnace at a temperature of about 400 °C. As a result, at least 10 g of material remained, in which the silt part was 80–90 wt %, while the rest was ash. This material was additionally passed through a 0.1 mm mesh sieve to remove coarser sand particles and further analyzed for a wide range of elements.
3.2. Analysis Methods
The analysis of the geochemical samples obtained while performing the SS surveys at 1:200,000 and 1:50,000 scales and research-methodological works was carried out in different years in the Central Analytical Laboratory of the “Sevvostokgeologiya” Company (Magadan, Russia) and IGC SB RAS (Irkutsk, Russia), respectively.
All the samples underwent spectral semiquantitative analysis (SSQA). We used a method of powder blowing-spilling into an AC arc on spectral facilities that included STE-1 (in Magadan) and DFS-8 (in Irkutsk) spectrographs (Leningrad Optical and Mechanical Association, St. Petersburg, Russia) with a USA-5 attachment (Geologorazvedka Experimental Plant of Geophysical Instrumentation, St. Petersburg, Russia) from a DG-2 generator (Sevastopol Instrumentation Plant, Sevastopol, Russia). Visual interpretation of the spectra was conducted on DSP-1 spectroprojectors (Krasnogorsk Optical Plant, Krasnogorsk, Russia). Analysts: M.I. Taskanova, N.G. Tatarnikova and V.A. Anisimova (Magadan); V.S. Kishechnikova, Z.M. Smolyak, and V.N. Melnichuk (Irkutsk).
SSQA result verification of alluvial samples and bryolithochemical sample analysis was undertaken using the quantitative atomic emission method in the analytical laboratories of the IGC SB RAS, Irkutsk [75]. In the analysis of alluvial samples, the method of powder blowing-spilling was used on a spectral complex that included a DFS-458S diffraction spectrograph (Kazan Optical and Mechanical Plant, Kazan, Russia), an automated device “Potok” for introducing samples into an arc discharge with a built-in spectroanalytic generator “Sharovaya molniya”, and a multi-channel atomic emission spectrum analyzer with photodiode rulers for recording spectra (VMK-Optoelectronica, Novosibirsk, Russia). The bryolithochemical samples were analyzed using the method of complete material evaporation from the carbon electrode channel on a spectral facility, including a DFS-458S diffraction spectrograph, a Vesuvy-2 electric arc generator (VMK-Optoelectronica, Novosibirsk, Russia), and a multichannel atomic emission spectrum analyzer with photodiode rulers for recording spectra. Analysts: I.E. Vasilyeva and E.V. Shabanova.
While conducting the SS survey at 1:200,000 scale, mercury was analyzed through the method of SSQA (see above). We used a sample-spilling method on the STE-1 spectrograph with a USA-5 attachment; this element’s detection limit was 1 ppm. Analysts: M.I. Taskanova, V.I. Narutdinova, and N.G. Tatarnikova (Magadan). Later, during the SS survey at 1:50,000 scale, mercury in all samples was determined by the atomic absorption method with acid decomposition. The atomic absorption spectrophotometer RAF-1M (Kazgeofizpribor, Kazan, Russia) was used, followed by the mercury analyzer RA-915+ with an RP-91S attachment (Lumex, St. Petersburg, Russia). The element detection limit in both cases was 0.005 ppm. Analysts: L.D. Andrulaitis and O.S. Ryazantseva (Irkutsk).
3.3. Methods of Data Processing
To process large amounts of analytical data, mathematical methods were widely used. To obtain preliminary information on the distribution of chemical elements as well as various mathematical dependences (statistics, pair correlations, etc.), Golden Software Surfer (V. 11.2.848, Golden Software, LLC, Golden, CO, USA) and Microsoft Office Excel 2003 software (V. 11.8169.8172) were used.
In the study of the exogenous AGCF composition and structure, the plotting of mono- and polyelement geochemical maps was executed using the multidimensional field method [76]. An automatic classification was used, which helped to identify the most common combinations of ore elements in the samples at their close quantitative values. Monoelement geochemical fields were plotted, and chemical element combinations (classes) were sought. The classes’ separation (element associations) was based on the contrast ratios (CR = Ci/Cb, where Ci was the element content and Cb the background) with regard to their dispersion and the dependence between the CRs of various elements. Subsequently, the multidimensional fields were plotted. The final result was presented in the form of mono- and polyelement AGCF maps.
The Cb that we accepted for the main indicator elements of mineralization considered in this work are shown in Table 1 (column 1) and, in general, are comparable with the average contents calculated for rocks of average and acidic composition for the earth’s crust (see Table 1, columns 2–6). The same Cb values were accepted for endogenous geochemical fields. The aim was to render it possible to compare exogenous and endogenous AGCFs with each other, of great importance in the interpretation of geochemical maps.
4. Results
A significant amount of informative material from the geochemical surveys of SSs at 1:200,000 and 1:50,000 scales is presented, alongside with detailed investigations implemented in the framework of scientific works of the IGC SB RAS in close cooperation with production organizations from the Magadan region (northeastern Russia).
4.1. AGCFs of the Pestrinsk Silver-Bearing System, Identified through SSs (Survey at a 1:200,000 Scale)
The exogenous AGCF study of the Pestrinsk SBS identified by SSs was based on regional survey data at a 1:200,000 scale. The survey was executed in the area within the two state sheets: the lower sheet part was P-56-XVIII, and the upper sheet part was P-56-XXIV. This area covers the southern part of the Balygychan-Sugoy trough at its junction with the OCVB (see Figure 1).
The study of geochemical fields was carried out on the examples of Ag, As, Sb, Cu, Pb, Zn, Sn, Bi, Mo, W, and B, the main indicator elements of all known types of mineralization within the Pestrinsk system (Ag–Pb, Sn–Ag, Sn, Sn–W, and Mo–W). Within the area under consideration, all these elements form AGCFs. As regards Hg, another indicator element, its anomalies were not studied when surveying SSs at 1:200,000 scale. Mercury is an element whose content is difficult to detect through the SSQA method due to the latter’s insufficient detection limit (1 ppm). Only single points with a content of 1–3 ppm (CR = 20–60) close to the detection limit were marked. It is impossible to discuss any regularities in the distribution of Hg in SSs.
On the Pestrinsk SBS area, high-contrast exogenous AGCFs were found to form As (up to 2000/1000*), Bi (up to 80/800), Sn (up to 500/250), Sb (up to 40/200), and Pb (up to 1000/100). Medium-contrast AGCFs are characteristic for Zn (up to 3000/60), W (up to 60/60), B (up to 400/40), Ag (up to 3/30), Cu (up to 200/20), and Mo (up to 10/10).
*Here and later, in the numerator, the average element contents (ppm) are given, and in the denominator, the average values of their CR (see Section 3.3).
Silver in the area studied was most manifest in SSs from the Pestrinsk SBS’ central part (Figure 3a). Only here were medium-contrast AGCFs with contents of 1–3 ppm (CR = 10–30) and low-contrast AGCFs with contents of 0.5–1 ppm (CR = 5–10) revealed. All these fields were mainly associated with Ag–Pb (Goltsovy deposit and Porfirovy prospect), Sn–Ag (Olymp and Chisty prospects), and Sn (Upper Tap and Ircha deposits, Otkryty and Bokovoy prospects) ores. Beyond the Pestrinsk SBS, Ag in the SSs was practically not manifested. Anomalies here have a relatively small distribution area and the lowest contrast (no higher than 0.3–0.5 ppm, CR = 3–5).
Antimony. Due to the insufficient detection limit of this element through the SSQA method (20 ppm), only contrast AGCFs (20–40 ppm, CR = 100–200) were detected in the investigation area. They had a local character of development and define deposits and prospects in the Pestrinsk SBS’ central part: Goltsovy Ag–Pb deposit, Olymp Sn–Ag prospect, Upper Tap Sn deposits, and Sn prospects (Vyun and Otkryty).
Arsenic, despite its insufficient detection limit through the SSQA method (30 ppm), forms broad yet very contrasting AGCFs (Figure 3b). Its maximum contents (100–2000 ppm, CR = 50–1000) were identified within the framework of the Pestrinsk SBS. These anomalies are mainly confined to Sn mineralization (Upper Tap and Ircha deposits, Vyun, Otkryty, and Bokovoy prospects) and Pestrinsk Mo–W prospect. High-contrast fields (200–500 ppm, CR = 100–250) also located in the Olymp Sn–Ag prospect. The Goltsovy Ag–Pb deposit in the As SSs was not manifested (<30 ppm, CR < 15). Beyond the Pestrinsk SBS, As concentrations in the AGCFs did not exceed 30–100 ppm (CR = 15–50).
Lead, across the entire area studied, was characterized by very wide AGCFs, with concentrations of 30–1000 ppm (CR = 3–100) (Figure 3c). Medium-contrast fields (100–1000 ppm, CR = 10–100) were identified only within the framework of the Pestrinsk SBS. These anomalies are associated with almost all known deposits and prospects of different types. The most anomalous AGCFs with high concentrations of 250–1000 ppm (CR = 25–100) were confined to the Goltsovy Ag–Pb deposit, Olymp Sn–Ag prospect, Upper Tap, and Ircha Sn deposits. Outside the Pestrinsk SBS, Pb AGCFs had low contents and contrast (30–100 ppm, CR = 3–10).
Zinc forms fairly broad and developed AGCFs across the entire area, with concentrations of 150–3000 ppm at CR = 3–60 (Figure 3d). As in the Pb case, the Pestrinsk SBS is distinguished by medium-contrast Zn AGCFs (500–3000 ppm, CR = 10–60). They were confined to the flanks of the Goltsovy Ag–Pb deposit, Olymp and Chisty Sn–Ag prospects, Sn deposits and prospects (Upper Tap and Ircha, Vyun, Otkryty, and Bokovoy). Beyond the Pestrinsk SBS, abnormal Zn concentrations did not exceed 250–500 ppm (CR = 5–10).
Copper in all of the considered territory was very poorly manifested (Figure 4a). Medium-contrast Cu AGCFs (100–200 ppm, CR = 10–20) had a local distribution, a relatively small development area and are located only in the Pestrinsk SBS’ central part: SSs from the Olymp Sn–Ag prospect, the Upper Tap Sn deposit, the Pestrinsk Mo–W prospect and in areas where no mineralization is known. In the rest of the territory, all Cu AGCFs had low contrast (30–100 ppm, CR = 3–10).
Molybdenum across the whole area was solely characterized by low-contrast AGCFs (3–10 ppm, CR = 3–10) (Figure 4b). Within the framework of the Pestrinsk SBS, the maximum anomalous fields (5–10 ppm, CR = 5–10) were located along its periphery, close to the north-western and south-western borders. They were mainly confined to areas where no ore occurrences are known, and less often, to small Sn prospects in the south-west. The same fields are widespread beyond the Pestrinsk SBS. The central and eastern parts of the system were generally characterized by near-background Mo contents (<3 ppm, CR < 3), with rare local AGCFs having concentrations of 3–5 ppm (CR = 3–5), identified through the SSs of watercourses draining Sn–W and Mo–W prospects.
Tungsten was quite widely manifested in the low-contrast AGCFs (5–10 ppm, CR = 5–10) across the entire territory under consideration (Figure 4c). AGCFs of medium contrast (10–60 ppm, CR = 10–60) had a local distribution and were confined to the Pestrinsk SBS. They were found at the Kalyan and Pestrinsk rare metal prospects, near the Upper Tap Sn deposit, as well as along watercourses in the southern and western parts of the system.
Tin was characterized by a wide range of AGCF contrast, from low to high (Figure 4d). The fields of high (200–500 ppm, CR = 100–250) and medium (20–200 ppm, CR = 10–100) contrast were detected only within the Pestrinsk SBS. High-contrast anomalies are associated with the Upper Tap Sn deposit. Medium-contrast AGCFs were confined to the Ircha Sn deposit and the Vyun, Otkryty, and Bokovoy Sn prospects, and several others. They were also located at the Goltsovy Ag–Pb deposit, the Olymp and Chisty Sn–Ag prospects, and the Kalyan and Pestrinsk rare metal prospects.
Bismuth across the considered area forms exogenous AGCFs that are significant in both size and contrast (Figure 5a). Low-contrast Bi fields (CR < 10) were not studied due to the insufficient detection limit of this element through the SSQA method (1 ppm). High-contrast AGCFs (10–80 ppm, CR = 100–800) were located only within the framework of the Pestrinsk SBS. These anomalies are mainly related to Sn ores (Upper Tap deposit, Vyun, Otkryty, and Bokovoy prospects) as well as with rare metal mineralization. Geochemical fields of medium contrast (1–10 ppm, CR = 10–100) are much more widespread, both within the framework of the Pestrinsk SBS and beyond, closer to the north-west. They were identified through watercourses draining other deposits and prospects and places where no mineralization is known.
Boron was quite well manifested in the SSs across the entire area studied (Figure 5b). It forms low- and medium-contrast AGCFs. Medium-contrast anomalies (100–400 ppm, CR = 10–40) were concentrated only within the Pestrinsk SBS and had a significant size. Such fields clearly define the areas with tin (Upper Tap and Ircha deposits, Vyun, Otkryty, and Bokovoy prospects) and rare metal (Kalyan and Pestrinsk prospects) mineralization. Low-contrast AGCFs (30–100 ppm, CR = 3–10) are very wide. They tend to manifest in other deposits and prospects and areas where mineralization has not been identified.
When identifying the typomorphic composition of exogenous AGCFs (element associations) and the patterns of their distribution across space (zonality), multiple correlations were effective. These correlations can be seen on a polyelement geochemical map (Figure 6, Table 2), plotted using the multidimensional field method (see Section 3.3). Ag–Pb, Sn–Ag, Sn, Sn–W, and Mo–W AGCFs, fields associated with ZDSM were also identified.
Ag–Pb polyelement AGCFs associated with Ag–Pb mineralization, manifested within the framework of the Pestrinsk SBS, extend from its southern to its northern part. Ag–Pb fields were identified in the areas of the Goltsovy Ag–Pb deposit and the Porfirovy Ag–Pb prospect. Such fields, albeit of a smaller size, occurred in the Ircha Sn deposit as well as in areas where no mineralization is known. In the most contrasting AGCFs, the maximum concentrations were marked for Ag, Pb, Bi, and Zn. Sn, B, and Cu were weakly manifested. Towards the flanks, Ag and Pb decreased in content, Bi increased as As appeared.
Sn–Ag polyelement AGCFs with similar dimensions to Ag–Pb fields were also manifested only within the framework of the Pestrinsk SBS and tended to mainly in its central part. They were confined to different types of ores and are found in SSs from the Olymp and Chisty Sn–Ag prospects, in the Ircha and Upper Tap Sn deposits, and in a number of small Sn and rare metal prospects. Very high contents in associations are typical for As and Bi and less high for Sn, B, Pb, Zn, and Ag. Cu was weakly manifested.
Sn polyelement AGCFs were the most common in the area studied. They manifested only within the framework of the Pestrinsk SBS and were mainly confined to Sn ore occurrences (Upper Tap and Ircha deposits and a number of small prospects). In contrast to the Sn–Ag fields, Sn AGCFs were typical by higher contents of As, Bi, and Sn. There are fewer high concentrations for B, W, Zn, Cu, and Pb. Low Ag and Mo contents were characterized.
Sn–W and Mo–W polyelement AGCFs are widely manifested in the area investigated. They have a relatively small size and were identified both within the Pestrinsk SBS and to the north-west of it. Anomalies were confined to rare metal prospects (Sn–W Kalyan and Mo–W Pestrinsk, etc.), to some Sn ore occurrences, and to areas where no ores are known. High concentrations are typical for As and Bi. There were fewer high concentrations for W, Sn, Cu, B, and Pb. Finally, there were low concentrations for Zn, Mo, and Ag.
In addition to the listed AGCFs related to deposits and prospects, the fields associated with unprofitable ZDSM are widespread across the entire area. Their composition is very variable and multi-component. All elements typical for the mineralization types under consideration (As, Bi, Pb, Cu, Zn, B, Sn, Mo, W, and Ag) are present in associations in different ratios. Among these elements, only As can have high contents; other elements are characterized by low contents.
4.2. AGCFs of the Pestrinsk Silver-Bearing System, Identified through SSs (Survey at 1:50,000 Scale)
The study of exogenous AGCFs identified by SSs for the prospecting of ores and to evaluate the erosion level of different ore zones and sectors was carried out on the basis of a geochemical survey at a 1:50,000 scale. The study area covered the central and northern parts of the Pestrinsk SBS, including the Goltsovy Ag–Pb deposit and the Olymp Sn–Ag prospect, the Kalyan, and Pestrinsk rare metal prospects, Upper Tap Sn deposits, Vyun, Otkryty, and Bokovoy Sn prospects (see Figure 1).
The AGCFs of Ag, Hg, Sb, As, Pb, Zn, Cu, Mo, W, Sn, Bi, and B—the main indicator elements of all known mineralization types within the framework of the Pestrinsk SBS (Ag–Pb, Sn–Ag, Sn, Sn–W, and Mo–W)—were found to be distinctly manifested.
Silver was characterized by wide areal AGCFs (Figure 7a). Fields of medium contrast (1–4 ppm, CR = 10–40) had a significant length and were clearly located only on the left tributaries of the Tap River. Here, the most contrasting fields with contents of 2–4 ppm (CR = 20–40) were revealed in streams draining the Ag–Pb, and Sn–Ag ore zones of the Goltsovy deposit and the Olymp Sn–Ag prospect. Low-contrast geochemical anomalies with concentrations of 0.3–1 ppm (CR = 3–10) had a wider distribution. They were detected through SSs from the streams draining the site with Sn mineralization at the head of the Tap River as well as along the Goltsovy and Bystry streams. Only near-background Ag concentrations (<0.3 ppm, CR < 3) were found along the streams that erode the Kalyan Sn–W and Pestrinsk Mo–W prospects.
Mercury forms low-contrast AGCFs, which were developed locally on the left side of the Tap River (Figure 7b). The most anomalous geochemical fields with contents of 0.25–0.5 ppm (CR = 5–10) were clearly confined to the watershed between the Krutoy and Glybisty streams, where the Ag–Pb ore zones of the Goltsovy deposit outcrop. Less contrasting fields with contents of 0.15–0.25 ppm (CR = 3–5) were confined to the watercourses draining the deposit ore zones. They were also detected in the low course of the Glybisty stream.
Antimony had an insufficient detection limit, so only its local high-contrast AGCFs were detected (30–100 ppm, CR = 150–500) (Figure 7c). Almost no regularity was identified in the distribution of Sb fields, these being found at the head of the Tap River, mainly along its left tributaries above the mouth of the Goltsovy stream, where no ores are known.
Arsenic in the SSs is distinctly manifested in the upper reaches of the Tap River and its right tributaries (Figure 7d). In this area, the AGCFs of medium (20–200 ppm, CR = 10–100) and high (200–500 ppm, CR = 100–250) contrast were widespread. High-contrast fields were found in the streams draining the Upper Tap Sn deposit and the Bokovoy Sn prospect as well as in the left tributaries of the Tap River, above the Olymp Sn–Ag prospect, where no mineralization is known. The medium-contrast fields define the remaining prospects: Vyun and Otkryty (Sn), Kalyan (Sn–W), Pestrinsk (Mo–W), and Olymp (Sn–Ag). The section drained by the left tributaries of the Tap River between the Iran and Goltsovy streams, where the Ag–Pb ore zones of the Goltsovy deposit outcrop, was characterized by sharply reduced As concentrations to less than 20 ppm (CR < 10).
Lead was weakly manifested in the area studied (Figure 7e). AGCFs of medium contrast (100–300 ppm, CR = 10–30) had a local distribution and were identified along the Krutoy stream draining the Goltsovy Ag–Pb deposit as well as along streams at the head of the Tap River, where Sn mineralization appears. Low-contrast Pb anomalies (30–100 ppm, CR = 3–10) were more widespread and found in many watercourses in this area. They define the Olymp Sn–Ag prospect and are one of the rare metal prospects along the Bystry stream. The Kalyan (Sn–W) and Pestrinsk (Mo–W) prospects were characterized by near-background Pb fields (<30 ppm, CR < 3). In general, low- and medium-contrast Pb AGCFs were distinctly manifested on the left tributaries of the Tap River. On the right tributaries, except the Bystry stream, only near-background fields were marked.
Zinc in the whole area forms only low-contrast geochemical anomalies (150–500 ppm, CR = 3–10) (Figure 7f). Here, the highest concentrations (250–500 ppm, CR = 5–10) were mainly found at the head of the Tap River, at the site of Sn mineralization development. Anomalies with the same contrast but smaller size could be found at the Tap River between the Pestry and Kalyan streams’ estuaries, along the Bystry stream, draining one of the rare metal prospects, and along the left tributaries of the Tap River above the Olymp Sn–Ag prospect, where no deposits and prospects are known. The Goltsovy Ag–Pb deposit was mainly characterized by near-background Zn fields (<150 ppm, CR < 3).
Copper in the SSs of this area was weakly manifested (Figure 8a). AGCFs of medium contrast (100–200 ppm, CR = 10–20) were identified along the Tap River between the Volok and Kalyan streams’ estuaries. Low-contrast geochemical anomalies (30–100 ppm, CR = 3–10) were widely developed, being revealed in the watercourses that drain Sn ores at the Tap River head and rare metal prospects that outcrop on the right side of this river valley. The area between the Goltsovy and Iran streams, where ore zones of the Goltsovy Ag–Pb deposit appear, was characterized by near-background Cu fields (<30 ppm, CR < 3).
Molybdenum in the investigated area is very weakly manifested in the SSs (Figure 8b). Exogenous Mo AGCFs were of low contrast (3–6 ppm, CR = 3–6) and were mainly found along the Tap River between the Pestry and Kalyan stream mouths, in the influence zone of the Pestrinsk and Kalyan rare metal prospects.
Tungsten, like Mo, was weakly manifested in this area’s SSs (Figure 8c). This element forms local anomalies of low contrast (3–10 ppm, CR = 3–10). They were only revealed in the right tributaries of the Tap River: the Bystry, Pestry, and Kalyan streams, which drain Sn–W and Mo–W mineralization. The remaining area was characterized by near-background W content (<3 ppm, CR < 3).
Tin is very widespread in the SSs. The content of this element in the AGCFs varied in the range of 6–200 ppm at CR 3–100 (Figure 8d). Medium-contrast fields (20–200 ppm, CR = 10–100) were determined at the Tap River head at the site of Sn mineralization development, along the Bystry stream, and along the Tap River between the Pestry and Kalyan streams’ mouths, which drain rare metal mineralization. Low-contrast fields (6–20 ppm, CR = 3–10) were found to be more widespread, being identified through the SSs of many watercourses, including those which drain the Goltsovy Ag–Pb deposit and the Olymp Sn–Ag and Pestrinsk Mo–W prospects.
Bismuth (as well as Sn) was widely manifested in the SSs (Figure 8e). High-contrast AGCFs (10–20 ppm, CR = 100–200) had an extremely localized development and were only revealed along the Volok stream, which drains a rare metal prospect. Medium-contrast fields (1–10 ppm, CR = 10–100) had the maximum distribution, mainly at the Tap River head at the site of Sn mineralization and along its right tributaries draining Sn–W and Mo–W mineralization as well as in the area on the left side of the Tap River valley above the Olymp Sn–Ag prospect, where ores are known. Low-contrast AGCFs (0.3–1 ppm, CR = 3–10) and near-background fields (<0.3 ppm, CR < 3) have the maximum development in the area drained by the left tributaries of the Tap River between the Goltsovy and Iran streams and where ore zones of the Goltsovy Ag–Pb deposit appear.
Boron in the SSs of the greater part of the studied area had abnormal contents (Figure 8f). AGCFs of medium contrast (100–400 ppm, CR = 10–40) were most developed on the right side of the Tap River valley. Here they were identified in the watercourses draining Sn–W and Mo–W prospects, as well as Sn ores at the Tap River head. The most contrasting fields (250–400 ppm, CR = 25–40) were located on the Vyun and Otkryty Sn prospects. On the left side of the Tap River valley, medium-contrast AGCFs had a much smaller area of distribution and were only located along the streams draining the ore zones of the Goltsovy Ag–Pb deposit. In all other watercourses, mostly low-contrast B AGCFs (30–100 ppm, CR = 3–10) were revealed.
The composition of AGCFs (element associations) and their distribution patterns across the area under consideration (zonality) are shown in the polyelement geochemical map (Figure 9, Table 3). Ag–Pb, Sn–Ag, Sn, Sn–W, and Mo–W AGCFs and fields associated with unprofitable ZDSM were identified.
Ag–Pb polyelement AGCFs distinctly tend to the left side of the Tap River. They were mainly found in the area between the Goltsovy and Iran streams—where the Goltsovy Ag–Pb deposit is located—as well as partly in the form of a low-contrast anomaly at the head of the Goltsovy stream. The fields had a simple element composition. Relatively high concentrations in associations are typical for Ag, Pb and B. Low concentrations were notable for Hg, Sn, and sometimes Bi.
Sn–Ag polyelement AGCFs are much larger than Ag–Pb fields. They could be determined, like the Ag–Pb fields, along the left tributaries of the Tap River, including in the area of the Olymp Sn–Ag prospect and along almost the entire length of this river as well. High contents in associations are typical for As and Sb. Fewer high contents are typical for Ag, Sn, Bi, Cu, and B. Low concentrations were found for Pb, Zn, and Mo.
Sn polyelement AGCFs are widely developed in the southern and south-western parts of the area. They were found in the upper reaches of the Tap River and along its right tributaries and were largely confined to Sn deposits and prospects, as well as, less often, rare metal prospects. Sn and As were characterized by high concentrations, Bi, B, and Pb by moderate concentrations of Zn, Ag, and Cu by low concentrations.
Sn–W and Mo–W polyelement AGCFs had a local distribution. They were only identified in the right tributaries of the Tap River: The Bystry, Pestry, and Kalyan streams, which drain rare metal prospects. High concentrations are typical for As, and fewer high for Sn, Bi, and B. Low contents were established for W, Cu, and Mo and very low for Pb and Zn.
In addition to the exogenous AGCFs related to mineralization, fields associated with unprofitable ZDSM could also be determined. They were widely manifested in the area studied and generally had a low contrast. Weakly anomalous contents were typical for B, Sn, and Bi. AGCFs containing As, Pb, Zn, and Cu occurred locally. Fields containing Hg with relatively high Bi contents also occurred locally.
4.3. Sampling Features at the Watercourse Heads
According to standard technique [6,8], when performing an area geochemical survey of SSs at a 1:50,000 scale, all watercourses, including small streams (I-order watercourses), should be sampled. However, this experience of conducting such surveys in northeastern Russia has shown that it is extremely difficult to take a sample of alluvium at the heads of watercourses. In the conditions of cryolithogenesis zones, to which the territory under consideration belongs, loose sediments in watercourses of the I order are almost completely absent. At the same time, at the watercourse heads along the banks and riverbeds on the surface of boulders, one can usually find moss cushions (Figure 10a). Mosses play the role of mechanical filter for loose material migrating in water flow. They are able to capture and firmly hold thin suspensions, silt, and sandy silt material (Figure 10b). In this regard, when sampling watercourses of the I order, it is recommended to use bryolithochemical stream sediments (BSSs) as an alternative to stream sediments. The applicable sampling method is based on the selection of moss cushions, together with the loose material that these cushions capture and hold [20,74].
BSSs were studied in the eastern part of the Goltsovy Ag–Pb deposit, along the I-order watercourse (Pryamoy stream, right tributary of the Iran stream), which drains ore zone I, the richest in Ag (Figure 11). All the sampled mosses belonged to the Bryidae subclass, this being the most widely distributed subclass along the banks and riverbeds of the territory studied. The selected materials were divided into two samples. In the first sample (lithochemical), the silt-sand material was separated from the moss cushion by shaking, whereas the second sample (bryolithochemical) was a moss with mostly silt material that was difficult to separate. In addition, for the purpose of comparison, several lithochemical samples were taken in the traditional way, consisting of sand-gravel and less often sand material (alluvial sediments), locally present in the riverbed.
While studying the elements’ distribution features and concentration levels, most attention was paid to Ag and Pb, the main indicator elements of Ag–Pb mineralization. The contents of these elements in all sample types are shown in Figure 12.
In the upper part of the flow (points 1–9), Ag concentrations in bryolithochemical samples reached 1.5 ppm, Pb—150 ppm. In the lithochemical samples taken from the moss cushion, the Ag content did not exceed 0.6 ppm, Pb—50 ppm. Even lower Ag contents (0.15 ppm or less) were found in lithochemical samples taken by the traditional method. Here, Pb content was 50 ppm and lower that it is in accordance with its content in the lithochemical samples from the moss cushion. It should be noted that in the upper part of the flow, lithochemical samples could only be taken at two points (2 and 7).
In the lower part of the flow (points 10–15), with the appearance of a sufficient amount of fine fraction in the riverbed, the concentrations of indicator elements in all samples were generally comparable. The concentrations of Ag and Pb in the bryolithochemical samples reached 4.5 ppm and 150 ppm, respectively; in all the lithochemical samples, these figures were 4.2 ppm and 100 ppm, respectively.
5. Discussion
5.1. The Composition and Structure of the AGCFs of the Pestrinsk Silver-Bearing System
5.1.1. Survey of Stream Sediments at 1:200,000 Scale
Having considered the results of the lithochemical survey of SSs at a 1:200,000 scale in the territory of the Pestrinsk silver-bearing system, it can be argued that such surveys are the optimum method for regional metallogenic potential assessments of minerals in actively denudating mountainous subarctic regions in northeastern Russia. They are the best way to solve the problem of projected evaluations of large-scale areas in a short time and at a minimal cost. They are characterized by simplicity and the possibility to obtain information operatively about the geochemical and metallogeny features of a region. Metallogenic specialization in the area studied here is clearly manifested primarily in Sn and less in Pb and Ag. Geochemical features are expressed in the high-contrast exogenous AGCFs of As, Bi, Sn, Sb, and Pb and the medium-contrast AGCFs of Zn, W, B, Ag, Cu, and Mo. The elements forming them are the main ones for all types of mineralization known in this area (Ag–Pb, Sn–Ag, Sn, Sn–W, and Mo–W).
The elements’ associations, typomorphic composition, and the nature of their distribution across space (regional zonality) revealed by the multidimensional field method primarily reflect the regional geochemical features of this area and its mineralization distribution pattern (see Figure 6, Table 2). In the central part of the Pestrinsk SBS, Ag–Pb AGCFs were found. The Goltsovy Ag–Pb large deposit is also located here. Ag–Pb AGCFs are changed by Sn–Ag, which also tend mainly to its central part, where Sn–Ag prospects are known. In the western part of the area, Sn AGCFs are widely manifested, which are related to small Sn prospects and two small Sn deposits (Ircha and Upper Tap). Sn–W and Mo–W AGCFs were determined throughout the entire area of the Pestrinsk SBS, have a local development character, and are associated with small tin and rare metal prospects.
For a detailed study of the mineralization distribution and a comparison of its material composition with the qualitative and quantitative composition of mono- and polyelement exogenous AGCFs (see Figure 3, Figure 4, Figure 5 and Figure 6, Table 2), the number of features within the Pestrinsk SBS were determined, which are considered below.
Despite the fact that the maximum concentrations for Ag–Pb polyelement AGCFs were typical for Ag and Pb (the main indicator elements of Ag–Pb mineralization) in particular, their contents were relatively low, and in some cases, similar to those found in the SSs of tin deposits and prospects. The same can be said about Zn, which forms higher contents in the SSs of tin deposits. The Ag–Pb AGCFs were marked by the constant presence of Bi and Sn. In all probability, these features are due to the erosion by streams of not only Ag–Pb ore zones, but also Sn–Ag mineralization zones, which as a rule, are spatially combined with Ag–Pb mineralization and appear at its lower levels [11,16,65]. In this regard, a mixture and concentration of the ore material of two mineralization types take place in alluvial sediments.
The widespread development of Sn–Ag polyelement AGCFs, with a small number of detected Sn–Ag prospects, also requires consideration. In all likelihood, these fields reflect either lower levels of Ag–Pb ores (in the northern part of the Pestrinsk SBS), where Sn–Ag mineralization is manifested, or the upper layers of tin ores (in the central and southern parts of the Pestrinsk SBS), which are characterized by silver-bearing sulfide-polymetallic mineralization [67,68,69]. The latter assumption is supported by the fact that Sn–Ag AGCFs were most often found in the areas of development of tin deposits and prospects. In addition, the CR for Sn in Sn–Ag associations significantly exceeded the CR for Ag, which is not typical for Sn–Ag mineralization.
Sn polyelement AGCFs were widespread in this area, being associated with a significant number of small ore occurrences. They are defined by exogenous high- and medium-contrast As, Bi, Sn and B AGCFs. All these elements are the main indicator elements of Sn mineralization. At the same time, these fields contained relatively high concentrations of elements that are less typical for this type of mineralization, such as W, Zn, Cu, and Pb. In addition, Ag–Pb, Sn–Ag, and rare metal associations appeared in the development areas of tin ores. The appearance of the latter can be explained by the spatial proximity of Sn mineralization with Sn–W and Mo–W. Tin ores are often accompanied by rare metal mineralization in the lower levels [67]. The appearance of Zn, Cu, Pb, and Ag in polyelement Sn AGCFs is most likely associated with a weak erosion level. Watercourses can drain upper- and middle-ore intervals, which are characterized by pyrrhotite-chalcopyrite and the most recent galena-sphalerite silver-containing mineral associations [67,68,69].
When discussing the results of a lithochemical survey of SSs at a 1:200,000 scale within the territory of the Pestrinsk silver-bearing system, special attention should be paid to the behavior of arsenic. This indicator element, which characterizes many types of mineralization, was present in all types of mineralization known within the Pestrinsk SBS (Ag–Pb, Sn–Ag, Sn, Sn–W, Mo–W, and unprofitable ZDSM). In the SSs of the area studied, it was also widespread and formed wide but different-in-contrast exogenous AGCFs (see Figure 3b). As contents in different types of AGCFs (see Figure 6, Table 2) vary within very wide limits. The lowest As concentrations were found in Ag–Pb AGCFs and in low-contrast Sn–Ag AGCFs (see Figure 6, Table 2, AGCFs 1–3 and 6). At the same time, in Sn, Sn–W, and Mo–W, as well as in the more contrasting Sn–Ag fields (see Figure 6, Table 2, AGCFs 4, 5 and 7–13), the As contents were generally found to be high. It should be noted once again that low-contrast Sn–Ag fields are probably associated with Sn–Ag mineralization, while more contrasting fields are associated with sulphide-polymetallic silver-containing mineralization, typical of the upper levels of tin ores.
The contrasting behavior of arsenic in the SSs of diverse ore types is related to the mineral composition and the prevalence of As-containing minerals. For example, at the Goltsovy Ag–Pb deposit, As may be present in small amounts as an impurity in sulfoantimonides (freibergite, tetrahedrite, pyrargyrite, miargyrite, polybasite, stephanite, etc.) [11,16,73]. In supergene environments, these minerals are unstable, easily destroyed, and oxidized, passing into oxide and hydroxide forms with an As impurity. Minerals in which As occurs as a stoichiometric component are extremely rare and are mainly represented by arsenopyrite, the formation of which is associated with the early arsenopyrite-pyrite-quartz association [69,71,73]. This association manifested only rarely, in lower levels of the deposit, with just small amounts of arsenopyrite. Taking into account the weak erosion level of this deposit with outcropping of the upper-middle ore levels, which are characterized by sulfoantimonides and are almost completely lacking in arsenopyrite, the low As concentrations observed locally in the SSs were quite understandable.
Arsenopyrite is often seen in Sn, Sn–W, and Mo–W ores and represents the main As carrier [11,16,67,69]. In supergene environments, arsenopyrite is unstable. On the one hand, some of it is oxidized and converted into the hypergene mineral pitticite, which is poorly soluble and inactive in an aqueous medium, forming local, high-contrast exogenous As AGCFs. On the other hand, another part of arsenopyrite reaching watercourses is completely destroyed. Part of the As changes into easily mobile water-soluble salt forms and is transported over considerable distances, forming broad but less contrasting exogenous AGCFs. Apparently, these processes are quite widespread. Arsenic salt forms in SSs are marked, for example, at the Natalka gold deposit (Tenka ore district, northeastern Russia), where the main binding form of this element in ores is also arsenopyrite [49]. Alternatively, it occurs, for example, in the SSs of the Dukat Au–Ag deposit (Omsukchan ore district, northeastern Russia) [14], where the predominant form of arsenic in ores is sulfoantimonides. It should be noted that arsenopyrite is present not only in ores; it is also commonly manifested in zones of areal arsenopyritization where mineralization is not revealed. In the loose sediments of the watercourses draining these zones, arsenic—in addition to relics of corroded fragments of arsenopyrite grains, its oxide and hydroxide forms—may be present in the form of the supergene mineral pitticite. An example of this is the alluvial sediments of the Dukat Au–Ag deposit, where this mineral is widely distributed (Figure 13), but is unrelated to the ore zones [14,20].
Based on the above, it can be argued that As anomalies could be related to different types of deposits and prospects, or alternatively have nothing to do with them. This is especially important in practical terms. Our experience with mineralization in northeastern Russia regarding the assessment of As anomalies has shown that a significant number of these anomalies are false—being unrelated to ores—and their verification leads to significant wasted expenditure.
The widespread development of exogenous AGCFs identified through SSs within the framework of the Pestrinsk SBS is typical not only for As, but also for other indicator elements of mineralization, such as Ag, Pb, Zn, Cu, Sn, Bi, and B (see Figure 3a,c,d, Figure 4a,d and Figure 5a,b). The detection of anomalies of all these elements, at a great distance from the ores, is most likely associated with their forms that are easily mobile in water. These include water-soluble forms, suspensions, and colloids. Very interesting studies in this regard have been conducted by Chinese scientists [80,81,82,83]. These investigations have provided data on the study of particles from deep and subsurface groundwater in some gold and polymetallic deposits, performed using transmission electron microscopy (TEM). They have identified that the particles have dimensions of 5–400 nm, corresponding to colloids and suspensions. Comparison of groundwater particles and ore particles using TEM showed that they are almost identical in morphology, size, chemical composition, and element associations and may reflect the properties of deeply hidden ores. Particles in groundwater occur in the form of individual particles and their aggregates, with the latter predominating. The tendency of particles to aggregate is explained by nanoparticles’ huge surface energy, which causes them to combine, resulting in thermodynamic stability. These particles and their aggregates have a strong ability to migrate with underground water. Sulfates are the main form of transport in groundwater at polymetallic deposits, while sulfides, oxides, and chlorides are less common. The phenomenon of particle adsorption by Fe, K, and Na oxides and hydroxides is often observed. It should be noted that this phenomenon is quite typical in general for supergene environments.
We identified the same features previously while studying binding forms of the main indicator elements in the SSs of the Dukat deposit [12,13,14]. These elements are closely related to the oxides and hydroxides of Fe and Mn, which are present in significant amounts in the alluvial sediments of the watercourses draining this deposit. These oxides and hydroxides often contain large concentrations of Au, Hg, As, and Sb, as well as relict occurrences of Ag, Pb, and Cu minerals. As can be seen, when studying the formation conditions of SSs in cryolithogenesis zones, where physical weathering is the main process, it is impossible to ignore the role of chemical factors, primarily chemisorption. Thus, it is not excluded that the stream sediments may be characterized by the same features in the transport forms of indicator elements of mineralization as for underground water. Moreover, underground water, in turn, can migrate to the surface beyond the ore bodies, mix with surface water, and along with the latter, form stream sediments.
Summing up the discussion results on the survey of SSs at a 1:200,000 scale, it should be noted that despite the positive aspects, these surveys are not without drawbacks. The AGCFs identified through them had a poor component composition and low contrast. In contrast to the ores, not only quantitative but also qualitative relationships (in element contents and composition of AGCFs) were often violated. Table 4 presents an overall assessment of qualitative and quantitative relationships in a conjugated system “endogenous–exogenous AGCFs” (ores + primary halos → secondary halos → stream sediments) for some ore occurrences of the Pestrinsk SBS. It can be clearly seen that the main typomorphic element composition was simplified in this direction and that alien elements not distinctive to a particular type of mineralization appeared. A significant decrease in the contrast of the AGCFs was marked: for some elements, it was strong, for others, it was weak.
The Ag concentrations (Table 4) in the exogenous Ag–Pb and Sn–Ag AGCFs of the Goltsovy Ag–Pb deposit revealed as a result of the survey of SSs at a 1:200,000 scale were almost an order of magnitude lower than those identified for primary and secondary halos. This is due to elevated Ag solubility in slightly acidic water. Zn, Sn, and Cu appeared in SSs related to Ag–Pb mineralization, which was either absent or had lower concentrations in primary and secondary halos. In the streams of the Kalyan Sn–W prospect, low contents were characteristic of W, the main indicator element of this mineralization type, along with the appearance of B. Elevated concentrations of Zn, Cu, Pb, and Ag, which are rare in these ores, could be observed.
5.1.2. Survey of Stream Sediments at a 1:50,000 Scale
The features listed above complicate the study of the composition, structure, and development scale of exogenous AGCFs, their typification, and as a consequence, the likelihood of finding a relationship with a specific type of mineralization. Their low contrast and poor component composition are mainly due to the sampling feature that when conducting small-scale surveys, sampling is not performed at the heads of watercourses. Our experience has shown that in such situations, it is effective to conduct surveys at a 1:50,000 scale for the prospecting of mineralization, in which all watercourses, including I–II-order streams, are sampled.
The survey at a 1:50,000 scale revealed that Ag, Sb, As, Pb, Hg, Zn, Cu, Sn, Bi, and B AGCFs were the most manifested in the SSs (see Figure 7, Figure 8 and Figure 9). The AGCFs of these elements (except Zn and Hg) had a high and medium contrast and the largest size (see Figure 7 and Figure 8). All these elements are typomorphic for all known profitable types of mineralization in this area (Ag–Pb, Sn–Ag, and Sn), represented not only by prospects, but also by deposits. Less manifested in the form of low-contrast AGCFs were Mo and W. These are among the main elements for Sn–W and Mo–W types of mineralization, which in this area were represented only by small, unprofitable prospects. The contrast and development area of the exogenous AGCFs identified by the results of this survey directly depend on the extent of mineralization to which they are related. It should be noted that the maximum anomalous concentrations of all these elements were located in the alluvium of the I- and II-order watercourses draining the mineralized zones. The main advantage of surveys at a 1:50,000 scale pertains to the well manifested qualitative and quantitative relationships in the following sequence: ores + primary halos → stream sediments.
As mentioned earlier (see Section 2.1), the Pestrinsk SBS is structurally a large intrusive-dome uplift. The Tap River runs along the Upper Tap deep fault, which divides the uplift into two tectonic blocks with a displacement amplitude of almost 1 km. The south-eastern block is elevated and deeply eroded. Sn–W (Kalyan prospect), Mo–W (Pestrinsk prospect), and Sn (Upper Tap deposit and a number of small prospects) mineralization was manifested here. In the lowered and slightly eroded north-western block, Ag–Pb mineralization (Goltsovy deposit) and, to a lesser extent, Sn–Ag mineralization (Olymp prospect, flanks, and deep levels of the Goltsovy deposit) were widely manifested. Summarizing the information obtained from the AGCFs, identified through the SSs when the survey at a 1:50,000 scale, we can conclude that the element distribution within each of the two blocks of different metallogenic and geochemical specialization has a regular character, clearly reflecting their eroding degree. This is clearly seen in the AGCF composition on the polyelement geochemical map (see Figure 9, Table 3).
The polyelement exogenous AGCFs detected through SSs using the 1:50,000-scale survey represent all known mineralization types within the area studied—Ag–Pb, Sn–Ag, Sn, Sn–W, and Mo–W—which were well reflected in the typomorphic element composition of these fields. Geochemical element associations and their qualitative and quantitative composition represent an effective indicator of the ore-formational affiliation of the identified anomalies, and polyelement exogenous AGCFs have a distinct zonal distribution across space. This zonality series is expressed in the change of different types of polyelement AGCFs in accordance with the eroding degree of the area (from smaller to larger): Ag–Pb → Sn–Ag → Sn → Sn–W, and Mo–W. The exogenous zonality detected through SSs within the Pestrinsk SBS is a reflection of the previously identified for this system endogenous and exogenous zonality revealed by primary and secondary halos, respectively [11,16,65].
Summarizing the results of the areal geochemical survey at 1:50,000 scale for the AGCF study identified through SSs and comparing them with the survey data at 1:200,000 scale, we can see a number of advantages: The confinement to ore occurrences, the clearly manifested zonal character of development and the close qualitative and quantitative functional relationships in a sequence of endogenous AGCFs (ores + primary halos) → exogenous AGCFs (secondary halos + stream sediments).
At the same time, akin to surveys at a 1:200,000 scale but much less often, there are cases when the qualitative relationships between elements are inconsistent, as foreign elements appear that are not characteristic of a certain mineralization type. Cases, where quantitative relationships were disturbed, were recorded. Let us consider some specific examples.
At the sites of Sn–W mineralization (Kalyan prospects), boron, which is not typical for these ores, appeared in the SSs, while the main indicator elements of Sn–W mineralization, W and Sn, had extremely low contents (see AGCF 18, Figure 9, Table 3 and Table 4). This is because streams drain the lower intervals of ore zones, which are characterized by low Sn, W, and B contents. The main factor here was the lower position of the hydrogeological sinkhole regarding the current erosion level of the Sn–W ore zones.
The Ag content in the SSs of the Iran stream’s right tributaries, which drain areas with profitable Ag–Pb ores of the Goltsovy deposit, was relatively low (see AGCFs 1 and 3, Figure 9, Table 3 and Table 4). Almost the same contents were found in the AGCFs along the left tributaries of the Tap River, draining the less Ag-rich ore zones of this deposit (see AGCF 2, Figure 9, Table 3). All these features of Ag behavior in the SSs were due, in our case, to the weak degree of the drainage system branching and the ore bodies’ morphology represented by vein zones as well as the position of these zones in relation to the watercourses that drain them.
High Pb concentrations not typical for this type of mineralization were marked in the SSs of the Upper Tap Sn deposit (see AGCF 13, Figure 9, Table 3), being higher than in the SSs related to the Ag–Pb ores of the Goltsovy deposit (see AGCFs 1 and 3, Figure 9, Table 3). In the first case, the key factor in the Pb concentration was the better-formed riverbed sediments of the minimum II-order watercourses. Their characteristics are continuity, the predominance of sand and silt fractions in the alluvium, increased heavy metal portion, and as a result, the enrichment of the material with ore elements with a relatively uniform distribution. In the second case, the low Pb contents could be explained by direct erosion of the rich ore zone and the poorly sorted and formed loose riverbed sediments of the I-order watercourses. The riverbed’s coarse-grained sediments were strongly washed out here, and the fine fraction of alluvium was either removed, or its accumulations were fragmentary.
In all of the above situations, more detailed research is needed. When interpreting data on the contents of indicator elements of mineralization in the SSs, it is necessary to take into account the following factors: the spatial position of watercourses in relation to the drained ores, the length and size of the catchment area, the branching degree of the drainage system and the ore body morphology. When studying the elemental composition of the I-order watercourses’ sediments, the lithochemical material sampling concentrated on moss cushions is effective.
When conducting such detailed research in order to improve the effectiveness of assessments of the anomalies identified through SSs, it is recommended to study the material composition of loose alluvial sediments of watercourses, namely the identification of indicator elements of mineralization and the study of their binding forms. We previously conducted such work in the area of the Dukat Au–Ag deposit with respect to the main elements typomorphic for this mineralization type: Au, Ag, Hg, As, Sb, Pb, Zn, and Cu [12,13,14,74]. It is expected that this method will also prove effective when prospecting for deposits in the Pestrinsk SBS area and the territories connected with it.
5.1.3. Erosion Level Estimation of the Pestrinsk Silver-Bearing System
The zonality details revealed within the framework of the Pestrinsk SBS are repeated within the less eroded volcanoplutonogenic ore-forming systems also located in the Omsukchan ore district. For example, the Dukat gold-silver-bearing system, where Ag and Au–Ag mineralization changes with depth to Ag–Pb, then Sn–Ag and ultimately Sn, Sn–W and Mo–W (Figure 14) [16,84].
According to this scheme, the total range of mineralization formation from Sn, Sn–W, and Mo–W to Au–Ag and Ag corresponds to an interval of 0–1.7 km relative to the palaeosurface. The interval between rare metal mineralization and Ag–Pb mineralization was about 1 km. The same parameters were marked for the amplitude of block displacement along the Upper Tap deep fault, which were identified earlier from geological data during the Pestrinsk SBS study (see Section 2.1). These comparative data make it possible to refer the Pestrinsk SBS to Au–Ag systems, only largely eroded, where there are no upper Ag and Au–Ag levels.
Further confirmation that the Pestrinsk SBS can be attributed to deeply eroded Au–Ag systems was provided by the anomalous concentrations of Au that we detected during the study of the ores and primary halos of the Goltsovy Ag–Pb deposit. The number of geochemical samples taken at the deposit from mine workings and boreholes was about six thousand. The Au content in most of them was close to the background: 0.002–0.008 ppm (Cb = 0.005 ppm). Abnormal concentrations of this element were found in 60 geochemical samples taken from host rocks and ores. In the first case, Au contents of 0.01–0.06 ppm were found; in the second case, there were higher contents (0.08–0.2 ppm). Only in two ore samples were high anomalous Au contents (0.36 ppm and 0.92 ppm) detected. Such contents are probably associated with fine particles of native gold, very rare findings of which in the ores of this deposit have been reported by S.S. Dvurechenskaya (geological funds of the “Sevvostokgeologiya” company) and other researchers [71,73]. The data obtained here using the SS survey at a 1:50,000 scale do not contradict these conclusions. Low, close-to-background Au content (0.002–0.006 ppm) was found in loose sediments in the Goltsovy Ag–Pb deposit area in a sampling consisting of 160 geochemical alluvium samples. However, eight samples taken from the Krutoy and Iran streams (see Figure 2b), which directly drain the ore zones of this deposit, showed Au contents from 0.009 ppm to 0.016 ppm. Such contents were abnormal for this deposit’s SSs.
Analyzing geological data and the results obtained from this work, it can be assumed that the less eroded areas interfaced with the Pestrinsk SBS may be promising for identifying not only silver but also gold-silver mineralization. Au–Ag prospects in such areas are known. These prospects are most widespread to the north of the Pestrinsk SBS, in weakly eroded volcanogenic rocks of the Balygychan-Sugoy trough. These prospects occur in the Late Cretaceous acidic volcanites of the Nayakhan suite, which have a large development area here. At the same time, these rocks are absent within the framework of the Pestrinsk SBS (see Figure 1) due to its higher erosion level.
5.2. Bryolithochemical Research under Prospecting for Silver Mineralization
Our bryolithochemical investigations of the loose sediments of a I-order watercourse (Pryamoy stream) draining the Goltsovy Ag–Pb deposit (see Figure 11) showed the effectiveness of their use in prospecting for Ag–Pb mineralization based on SSs. It was found that the contents of Ag and Pb—the main typomorphic indicator elements of this mineralization type—in almost all bryolithochemical samples exceeded those found in the lithochemical material separated from the moss cushion and in alluvium samples taken by the traditional method (see Figure 12). The difference in the content levels of Ag and Pb in these samples was particularly characteristic for the beginning of the stream, where alluvial sediments were either absent or fragmentary. In the lower part of the stream, where a sufficient amount of fine alluvium fraction appeared in the riverbed, the concentrations of the indicator elements in all samples became more or less comparable. It should be noted that the lithochemical material in the upper part of the stream had to be sampled at only two points. At the same time, bryolithochemical samples were taken at all the intended locations in this part of the stream.
The effectiveness of bryolithochemical research in prospecting for ores was confirmed by our previous work performed in the area of the Dukat Au–Ag ore field. Loose sediments of watercourses draining Ag–Pb mineralization areas on the flanks of the ore field (Pyritovy prospect, Pyritovy stream) and Au–Ag mineralization zones in its central part (Dukat deposit, Chaika stream), were studied [20,74]. The concentration levels of the main indicator elements of Ag–Pb (Ag and Pb) and Au–Ag (Au, Ag and Pb) mineralization in the bryolithochemical samples significantly exceeded those found in the lithochemical material taken both from the moss cushion and in the traditional way. This feature was typical not only for Ag–Pb ores, but also for Au–Ag mineralization. At the Pyritovy Ag–Pb prospect (Pyritovy stream), compared with the Goltsovy Ag–Pb deposit (Pryamoy stream) (see Figure 12), features of element concentration levels were manifested even more clearly. The Ag (up to 50.9 ppm) and Pb (up to 6200 ppm) contents in the bryolithochemical samples were an order of magnitude higher than those in all types of lithochemical samples (Ag up to 15.7 ppm and Pb up to 580 ppm).
The stronger enrichment of bryolithochemical samples with Ag particles in the section of the Pyritovy Ag–Pb prospect (Pyritovy stream) compared to the lithochemical material was confirmed by scintillation emission semi-quantitative analysis (Table 5). In all bryolithochemical samples, the number of these particles was so large that it was impossible to calculate their exact number (see Table 5, column 1). At the same time, in almost all lithochemical samples, the number of Ag particles was noticeably lower, allowing us to calculate their approximate number, which was more than 2000–3000. There was a clear predominance of fine particles over small ones.
When conducting bryolithochemical investigations at the Dukat Au–Ag deposit (Chaika stream), the same regularities were revealed. They were found to be characteristic not only for Ag and Pb, but also for Au, the main element of the Au–Ag mineralization [20,74]. The levels of Au concentrations in the bryolithochemical samples reached 0.80 ppm, which was significantly higher than the content of this element in the lithochemical material from the moss cushion (<0.21 ppm) and also exceeded the content of Au in the lithochemical samples taken by the traditional method (<0.09 ppm). The same distribution features were found to be characteristic for Ag. Maximum concentrations (up to 100 ppm) were found in the bryolithochemical samples. In the lithochemical samples, they did not tend to exceed 20 ppm in the vast majority of cases. Pb concentrations in the bryolithochemical samples were generally comparable to those found in the lithochemical samples taken by the traditional method.
The bryolithochemical method showed its effectiveness not only in detecting Ag–Pb mineralization but also in prospecting for Au–Ag ores. It allowed us to obtain reliable information regarding the presence of indicator elements’ anomalies when prospecting for different types of mineralization. This was especially true for cryolithogenesis zones, where loose sediments of I-order watercourses are poorly formed and often do not exist at all. There are many reasons for such a situation, including the sod cover of streams’ heads, the action of low temperatures on mechanical and chemical weathering processes, and the influence of all these factors on the rate and proportions of material transport. The sediments were absent or formed with a shortage of the sandy silt material that typically concentrates most of the heavy minerals.
The bryolithochemical samples are deprived of all these deficiencies. Due to their filtering ability, mosses are able to capture and firmly hold fine suspensions, silt, and sandy silt material carried by water flow (see Figure 10). Mosses’ accumulation ability in relation to watercourses’ loose material is so great that an ashy bryolithochemical sample represents 80–90 wt % of a silt part. In this regard, bryolithochemical stream sediments are formed, which can be considered an integral part of SSs. They can be successfully used to interpret geochemical anomalies and their ore-formational affiliation and to estimate the erosion level of specific sites and mineralization zones. There is no doubt about BSSs’ effectiveness. The method we have developed can be used at all stages of forecasting and prospecting for Au–Ag, Ag–Pb, and other types of mineralization.
6. Conclusions
Survey of SSs at a 1:200,000 scale in the mountainous regions of northeastern Russia was effective at the stage of regional forecasting in poorly studied territories. Such a survey allows preliminary information about the metallogeny and geochemical features of the region to be obtained in a relatively short time. At the same time, exogenous AGCFs had lower contrast and a poorer component composition compared to the fields detected by both primary and secondary halos. All this complicates the study of the composition and structure of AGCFs, their typification, and zonality, the main indicator used to assess the erosion level of ore zones.
At the local forecast stage, when prospecting for ores, it is effective to conduct geochemical survey of SSs at a 1:50,000 scale. The exogenous AGCFs identified as a result of this survey conformed almost fully to the composition and structure of deposits and prospects and effectively reflect both their ore-formational affiliation and the erosion level of drained zones and sites. Geochemical fields are more significant in scale, composition, and contrast than those found in regional surveys at a 1:200,000 scale. All this is due to the fact that when conducting surveys at a 1:50,000 scale, not only large watercourses but smaller watercourses (I–II orders), being the most informative, are sampled.
When lithochemical sampling is applied to I-order watercourses in which alluvium is fragmentary or absent, as is typical for cryolithogenesis zones, a positive result can be obtained by using the bryolithochemical method. It is based on sampling mosses together with a fine fraction of the alluvium held by a moss cushion. The method allows researchers to carry out sampling in stream heads and makes possible the discovery of anomalies. In the example of the behavior of Ag and Pb, which are the main indicator elements of the Ag–Pb ores, it was found that their content in bryolithochemical samples was generally higher than in lithochemical ones. Previous research has shown that this method can also be successfully used for Au–Ag mineralization prospecting [74].
The regularities revealed here can be successfully applied at all stages of the geochemical study of ore-bearing areas, from expectation assessment is poorly studied territories to detailed work on already known deposits. The methods proposed for identifying exogenous AGCFs are simple and effective.
Author Contributions
Conceptualization, R.G.K.; methodology, A.S.M., R.G.K.; formal analysis, A.S.M.; investigation, R.G.K., A.S.M.; writing—original draft preparation, A.S.M.; writing—review and editing, R.G.K.; visualization, A.S.M., R.G.K. All authors have read and agreed to the published version of the manuscript.
Funding
This study was performed within the framework of the State Assignment Projects No. IX.125.3.4 (0350-2019-0003) and IX.130.3.1 (0350-2019-0010), with support from the Russian Federation President Foundation (Grant No. MK-2645.2019.5). We used the scientific equipment of the “Isotope-Geochemical Research” Centre for Common Use of IGC SB RAS, Irkutsk, Russia.
Institutional Review Board Statement
Not applicable.
Informed Consent Statement
Not applicable.
Data Availability Statement
The data presented in this study are mainly contained within the article and available in the references listed. To a minor degree, the data presented are not publicly available due to privacy and available on request from the corresponding author.
Acknowledgments
The authors would like to express special thanks to the leadership of the “Sevvostokgeologiya” company (Magadan, Russia) for providing geological documentation and material of the survey at 1:200,000 scale. The authors are also sincerely grateful to all the geological services of the Dukat geological exploration enterprise (Magadan) for their comprehensive assistance in performing fieldwork and their technical support.
Conflicts of Interest
The authors declare no conflict of interest.
References
- Bogolyubov, A.N.; Sochevanov, N.N. Small-scale metallometric searches for polymetals on halos and stream sediments. Razved. Okhrana Nedr. 1959, 10, 9–12. (In Russian) [Google Scholar]
- Krasnikov, V.I. Rational Method Fundamentals of Ore Deposit Prospecting; Gosgeoltekhizdat: Moscow, Russia, 1959; p. 412. (In Russian) [Google Scholar]
- Polikarpochkin, V.V. Geochemical methods for ore deposit prospecting on stream sediments. Sov. Geol. 1963, 4, 63–76. (In Russian) [Google Scholar]
- Polikarpochkin, V.V. Secondary Halos and Stream Sediments; Nauka: Novosibirsk, Russia, 1976; p. 408. (In Russian) [Google Scholar]
- Solovov, A.P. Geochemical Methods for Mineral Deposit Prospecting; Nedra: Moscow, Russia, 1985; p. 294. (In Russian) [Google Scholar]
- Solovov, A.P.; Arkhipov, A.Y.; Bugrov, V.A.; Vorobyev, S.A.; Gershman, D.M.; Grigoryan, S.V.; Kvyatkovsky, E.M.; Matveev, A.A.; Milyaev, S.A.; Nikolaev, V.A.; et al. Handbook of Geochemical Prospecting for Minerals; Nedra: Moscow, Russia, 1990; p. 335. (In Russian) [Google Scholar]
- Kvyatkovsky, E.M. Lithochemical Methods of Prospecting for Endogenous Ore Deposits; Nedra: Leningrad, Russia, 1977; p. 189. (In Russian) [Google Scholar]
- Grigoryan, S.V.; Solovov, A.P.; Kuzin, M.F. Instruction on Geochemical Prospecting for Ore Deposits; Ovchinnikov, L.N., Ed.; Nedra: Moscow, Russia, 1983; p. 191. (In Russian) [Google Scholar]
- Pitul’ko, V.M.; Kritsuk, I.N. Data Interpretation Basics of Prospecting Geochemistry; Nedra: Leningrad, Russia, 1990; p. 336. (In Russian) [Google Scholar]
- Tauson, L.V.; Kravtsova, R.G.; Zaripov, R.H. Geochemical mapping of primary and secondary settings in ore-bearing regions. In Exploration Geochemistry 1990, Proceedings of the 3rd International Joint Symposium of the IAGC and the AEG, Prague, Czechoslovakia, 21–25 May 1990; Mrňa, F., Ed.; Prague Geological Survey: Prague, Czechoslovakia, 1991; pp. 376–381. [Google Scholar]
- Kravtsova, R.G.; Zakharov, M.N.; Ivanov, O.P. Combined geochemical investigations of the Pestrinsk silver-bearing field (Northeast Russia). Geol. Ore Depos. 1996, 38, 378–389. [Google Scholar]
- Kravtsova, R.G.; Pavlova, L.A.; Rogozina, Y.I. Modes of Ag occurrence in the loose deposits of dispersal trains at Au-Ag mineral deposits. Geochem. Int. 2010, 48, 731–736. [Google Scholar] [CrossRef]
- Kravtsova, R.G.; Pavlova, L.A.; Rogozina, Y.I.; Makshakov, A.S. First data on forms of gold occurrence in lithochemical sedimental streams of the gold-silver Dukat deposit (Northeastern Russia). Dokl. Earth Sci. 2010, 434, 1184–1191. [Google Scholar] [CrossRef]
- Kravtsova, R.G.; Tarasova, Y.I.; Makshakov, A.S.; Pavlova, L.A. Distribution and modes of occurrence of Au, Ag, and associated elements in the sediment streams of Au-Ag zones at the Dukat deposit (Northeastern Russia). Russ. Geol. Geophys. 2016, 57, 529–548. [Google Scholar] [CrossRef]
- Romanov, V.A. Stream sediments: Theory, methodology and practice. Ways of further development. Otechestvennaya Geol. 2008, 1, 78–82. (In Russian) [Google Scholar]
- Kravtsova, R.G. Geochemistry and Forming Conditions of Gold-Silver Ore-Forming Systems, Northern Pre Okhotsk Region; Academic Publishing House “Geo”: Novosibirsk, Russia, 2010; p. 292. (In Russian) [Google Scholar]
- Sokolov, S.V. The prediction and estimation of resource potential ore fields, nodes and areas of stray flux on the stages of a regional study of subsurface. Razved. Okhrana Nedr. 2010, 5, 48–53. (In Russian) [Google Scholar]
- Kravtsova, R.G.; Makshakov, A.S. Streams sediments of gold-silver ore-forming systems (Balygychan-Sugoisk depression, Northeast of Russia). In Gold of the North Pacific Rim, Proceedings of the Geology & Mining Conference and II International Geology & Mining Forum dedicated to Yu. A. Bilibin’s 110th Anniversary, Magadan, Russia, 3–5 September 2011; Goryachev, N.A., Ed.; NEISRI FEB RAS: Magadan, Russia, 2011; pp. 249–250. [Google Scholar]
- Kravtsova, R.G.; Makshakov, A.S. Anomalous geochemical fields of Au-Ag ore-forming systems of the Northern Priokhotje (Russia). In Geoanalysis 2012, Proceedings of the 8th International Conference on the Analysis of Geological and Environmental Materials, Buzios, Brazil, 16–20 September 2012; International Association of Geonalysts: Buzios, Brazil, 2012; p. 123. [Google Scholar]
- Makshakov, A.S.; Kravtsova, R.G.; Tatarinov, V.V. Lithochemical stream sediments of the Dukat gold-silver ore-forming system (North-East of Russia). Minerals 2019, 9, 789. [Google Scholar] [CrossRef] [Green Version]
- Hawkes, H.E.; Webb, J.S. Geochemistry in Mineral Exploration; Harper & Row: Evanston, NY, USA, 1962; p. 415. [Google Scholar]
- Brown, B.W. Error in lead anomalous stream sediments. Econ. Geol. 1970, 65, 514–515. [Google Scholar] [CrossRef]
- Bradshaw, P.M.D.; Clews, D.R.; Walker, J.L. Exploration Geochemistry; Barringer Research Ltd.: Rexdale, ON, Canada, 1972; p. 304. [Google Scholar]
- Hawkes, H.E. The downstream dilution of stream sediment anomalies. J. Geochem. Explor. 1976, 6, 345–358. [Google Scholar] [CrossRef]
- Rose, A.W.; Hawkes, H.E.; Webb, J.S. Geochemistry in Mineral Exploration, 2nd ed.; Academic Press: London, UK, 1979; p. 657. [Google Scholar]
- Levinson, A.A. Introduction to Exploration Geochemistry, 2nd ed.; Applied Publishing: Wilmette, IL, USA, 1980; p. 924. [Google Scholar]
- Chork, C.Y.; Cruikshank, B.I. Statistical map analysis of regional stream-sediment data from Australia. J. Geochem. Explor. 1984, 21, 405–419. [Google Scholar] [CrossRef]
- Day, S.J.; Fletcher, W.K. Effects of valley and local channel morphology on the distribution of gold in stream sediments from Harris Creek, British Columbia, Canada. J. Geochem. Explor. 1989, 32, 1–16. [Google Scholar] [CrossRef]
- Siegel, F.R. Exploration for Mississippi-Valley type stratabound Zn ores with stream suspensates and stream sediments, Virginia, USA. J. Geochem. Explor. 1990, 38, 265–283. [Google Scholar] [CrossRef]
- Fletcher, W.K.; Loh, C.H. Transport equivalence of cassiterite and its application to stream sediment surveys for heavy minerals. J. Geochem. Explor. 1996, 56, 47–57. [Google Scholar] [CrossRef]
- Xie, X.; Mu, X.; Ren, T. Geochemical mapping in China. J. Geochem. Explor. 1997, 60, 99–113. [Google Scholar] [CrossRef]
- Melo, G.; Fletcher, W.K. Dispersion of gold and associated elements in stream sediments under semi-arid conditions, northeast Brazil. J. Geochem. Explor. 1999, 67, 235–243. [Google Scholar] [CrossRef]
- Naseem, S.; Sheikh, S.A.; Qadeeruddin, M.; Shirin, K. Geochemical stream sediment survey in Winder Valley, Balochistan, Pakistan. J. Geochem. Explor. 2002, 76, 1–12. [Google Scholar] [CrossRef]
- Ohta, A.; Imai, N.; Terashima, S.; Tachibana, Y. Influence of surface geology and mineral deposits on the spatial distributions of elements concentrations in the stream sediments of Hokkaido, Japan. J. Geochem. Explor. 2005, 86, 86–103. [Google Scholar] [CrossRef]
- Macdonald, E.H. Handbook of Gold Exploration and Evaluation; Woodhead Publishing Limited: Cambridge, UK, 2007; p. 647. [Google Scholar]
- Carranza, E.J.M. Analysis and mapping of geochemical anomalies using logratio-transformed stream sediment data with censored values. J. Geochem. Explor. 2011, 110, 167–185. [Google Scholar] [CrossRef]
- Yousefi, M.; Carranza, E.J.M.; Kamkar-Rouhani, A. Weighted drainage catchment basin mapping of geochemical anomalies using stream sediment data for mineral potential modeling. J. Geochem. Explor. 2013, 128, 88–96. [Google Scholar] [CrossRef]
- Ali, L.; Williamson, B.J.; Moon, C.J.; Shah, M.T.; Khattak, S.A. Distribution of gold in different size fractions of stream sediments as a guide to bedrock gold mineralisation along the Shyok Suture Zone and adjacent areas of the Kohistan Island Arc, Pakistan. Arab. J. Geosci. 2015, 8, 2227–2235. [Google Scholar] [CrossRef]
- Yilmaz, H.; Sonmez, F.N.; Carranza, E.J.M. Discovery of Au-Ag mineralization by stream sediment and soil geochemical exploration in metamorphic terrain in western Turkey. J. Geochem. Explor. 2015, 158, 55–73. [Google Scholar] [CrossRef]
- Yilmaz, H.; Ghezelbash, R.; Cohen, D.R.; Sari, R.; Sonmez, F.N.; Maghsoudi, A. Comparison between the geochemical response of BLEG and fine fraction stream sediments to mineralization in the Eastern Black Sea region, Turkey. J. Geochem. Explor. 2020, 217, 106609. [Google Scholar] [CrossRef]
- Chen, X.; Zheng, Y.; Xu, R.; Wang, H.; Jiang, X.; Yan, H.; Cai, P.; Guo, X. Application of classical statistics and multifractals to delineate Au mineralization-related geochemical anomalies from stream sediment data: A case study in Xinghai-Zeku, Qinghai, China. Geochem. Explor. Environ. Anal. 2016, 16, 253–264. [Google Scholar] [CrossRef]
- Xiao, F.; Chen, J.; Hou, W.; Wang, Z.; Zhou, Y.; Erten, O. A spatially weighted singularity mapping method applied to identify epithermal Ag and Pb-Zn polymetallic mineralization associated geochemical anomaly in Northwest Zhejiang, China. J. Geochem. Explor. 2018, 189, 122–137. [Google Scholar] [CrossRef]
- Chen, D.; Wei, J.; Wang, W.; Shi, W.; Li, H.; Zhan, X. Comparison of methods for determining the thresholds of geochemical anomalies and the prospecting direction—A case of gold deposits in the Gouli exploration area, Qinghai Province. Minerals 2019, 9, 368. [Google Scholar] [CrossRef] [Green Version]
- Shahrestani, S.; Mokhtari, A.R.; Carranza, E.J.M.; Hosseini-Dinani, H. Comparison of efficiency of techniques for delineating uni-element anomalies from stream sediment geochemical landscapes. J. Geochem. Explor. 2019, 197, 184–198. [Google Scholar] [CrossRef]
- Yu, X.; Xiao, F.; Zhou, Y.; Wang, Y.; Wang, K. Application of hierarchical clustering, singularity mapping, and Kohonen neural network to identify Ag-Au-Pb-Zn polymetallic mineralization associated geochemical anomaly in Pangxidong district. J. Geochem. Explor. 2019, 203, 87–95. [Google Scholar] [CrossRef]
- Zomorrodian, M.; Shayestehfar, M.R. Indicator ratios and additive composite halos in stream sediment samples as a geochemical indicator for identifying promising epithermal gold deposit in the north of Kashmar. Arab. J. Geosci. 2019, 12, 331. [Google Scholar] [CrossRef]
- Lin, X.; Hu, Y.; Meng, G.; Zhang, M. Geochemical patterns of Cu, Au, Pb and Zn in stream sediments from Tongling of East China: Compositional and geostatistical insights. J. Geochem. Explor. 2020, 210, 106457. [Google Scholar] [CrossRef]
- Wang, J.; Zuo, R. Quantifying the Distribution Characteristics of Geochemical Elements and Identifying Their Associations in Southwestern Fujian Province, China. Minerals 2020, 10, 183. [Google Scholar] [CrossRef] [Green Version]
- Milyaev, S.A.; Chekvaidze, V.B.; Isakovich, I.Z. Conjugated systems: Ore body + primary halo—Secondary halo—Stream sediments on the Natalkinskoe ore field example, North-East Russia. Otechestvennaya Geol. 2010, 1, 47–54. (In Russian) [Google Scholar]
- Goncharov, V.I.; Alshevsky, A.V.; Vortsepnev, V.V. Geology and Minerals of North-East Asia; Nauka: Vladivostok, Russia, 1984; p. 128. (In Russian) [Google Scholar]
- Umitbaev, R.B. Okhotsk-Chaun Metallogenic Province; Nauka: Moscow, Russia, 1986; p. 286. (In Russian) [Google Scholar]
- Grigor’yev, N.V.; Livach, A.E. Goltsovy deposit. In Predictive Exploration Models for Gold and Silver Deposits in Northeast Russia; Konstantinov, M.M., Rosenblum, I.S., Zinnatullin, M.Z., Eds.; North-Eastern Geological Committee: Moscow, Russia, 1992; pp. 54–59. [Google Scholar]
- Belyi, V.F. Geology of the Okhotsk-Chukotsk Volcanogenic Belt; NEISRI FEB RAS: Magadan, Russia, 1994; p. 76. (In Russian) [Google Scholar]
- Belyi, V.F. Problems of geological and isotopic age of the Okhotsk-Chukotsk Volcanogenic Belt (OCVB). Stratigr. Geol. Correl. 2008, 16, 639–649. [Google Scholar] [CrossRef]
- Akinin, V.V.; Khanchuk, A.I. The Okhotsk-Chukotka volcanogenic belt: Age revision based on new 40Ar/39Ar and U-Pb isotope data. Dokl. Earth Sci. 2005, 405, 1131–1135. [Google Scholar]
- Struzhkov, S.F.; Konstantinov, M.M. The Metallogeny of Gold and Silver in the Okhotsk-Chuckchee Volcanogenic Belt; Nauchny Mir: Moscow, Russia, 2005; p. 320. (In Russian) [Google Scholar]
- Sidorov, A.A.; Volkov, A.V.; Belyi, V.F.; Alekseev, V.Y.; Kolova, E.E. The gold-silver Okhotsk-Chukotka volcanic belt. Geol. Ore Depos. 2009, 51, 441–455. [Google Scholar] [CrossRef]
- Sidorov, A.A.; Chekhov, A.D.; Volkov, A.V.; Alekseev, V.Y. Metallogeny of the inner and outer zones of the Okhotsk-Chukotsk volcanogenic belt. Dokl. Earth Sci. 2011, 439, 949–954. [Google Scholar] [CrossRef]
- Ganelin, A.V.; Vatrushkina, E.V.; Luchitskaya, M.V. New data on volcanism of the Central Chukotka segment of the Okhotsk-Chukotka volcanogenic belt. Dokl. Earth Sci. 2019, 485, 252–256. [Google Scholar] [CrossRef]
- Filatov, S.I. USSR Geological Map. Scale 1:200,000; Upper-Kolyma Series. P-56-XVIII; Gosgeoltekhizdat: Moscow, Russia, 1960; 1 sheet. (In Russian) [Google Scholar]
- Filatov, S.I. USSR Geological Map of 1:200,000 Scale; Upper-Kolyma Series. Sheet P-56-XVIII. Explanatory Note; Nedra: Moscow, Russia, 1965; p. 88. (In Russian) [Google Scholar]
- Silinsky, A.D. USSR Geological Map Scale 1:200,000; Magadan Series. P-56-XXIV; Factory No 9: Moscow, Russia, 1963; 1 sheet. (In Russian) [Google Scholar]
- Silinsky, A.D. USSR Geological Map of 1:200,000 Scale; Magadan Series. Sheet P-56-XXIV. Explanatory Note; Nedra: Moscow, Russia, 1968; p. 60. (In Russian) [Google Scholar]
- Livach, A.E.; Churavtsov, A.P.; Tret’yakova, N.I. Russian Federation State Geological Map of 1:200,000 Scale, 2nd ed.; Sugoy Series. P-56-XVIII (Omsukchan); VSEGEI: Saint Petersburg, Russia, 2007; 1 sheet. (In Russian) [Google Scholar]
- Tauson, L.V.; Kravtsova, R.G.; Zakharov, M.N. Petrogeochemical factors of the distribution of ore fields in rare-metal ore magmatic systems, North-East of the USSR. Dokl. Akad. Nauk SSSR 1990, 313, 700–704. (In Russian) [Google Scholar]
- Anan’in, V.A.; Pridatko, M.R. Geological structure of the Upper Tap ore field. In Materials on Geology and Mineral Resources of North-East USSR; Tsopanov, O.K., Ed.; Book Publishing House: Magadan, Russia, 1978; pp. 136–141. (In Russian) [Google Scholar]
- Anan’in, V.A.; Pridatko, M.R.; Terent’yev, V.B. A new promising type of tin mineralization in the Omsukchan district. Kolyma 1980, 10, 36–38. (In Russian) [Google Scholar]
- Sidorov, A.A.; Konstantinov, M.M.; Eremin, R.A.; Savva, N.E.; Kopytin, V.I.; Safronov, D.N.; Naiborodin, V.I.; Goncharov, V.I. Silver: Geology, Mineralogy, Genesis, and Deposits’ Localization Regularities; Nauka: Moscow, Russia, 1989; p. 240. (In Russian) [Google Scholar]
- Plyashkevich, A.A. Mineralogy and Geochemistry of North-East Russian Tin-Silver Polymetallic Deposits; NEISRI FEB RAS: Magadan, Russia, 2002; p. 72. (In Russian) [Google Scholar]
- Kravtsova, R.G.; Zakharov, M.N.; Shatkov, N.G. Mineralogical and geochemical features of host rocks of the Gol’tsovoe silver-base metal deposit (Northeastern Russia). Geol. Ore Depos. 1998, 40, 197–210. [Google Scholar]
- Shilo, N.A.; Sakharova, M.S.; Krivitskaya, N.N.; Riakhovskaya, S.K.; Bryzgalov, I.A. Mineralogy and Origin Features of Gold-Silver Ores of the North-East Part of Pacific Ocean Frame; Nauka: Moscow, Russia, 1992; p. 256. (In Russian) [Google Scholar]
- Konstantinov, M.M.; Rosenblum, I.S.; Strujkov, S.F. Types of epithermal silver deposits, northeastern Russia. Econ. Geol. 1993, 88, 1797–1809. [Google Scholar] [CrossRef]
- Savva, N.E. Mineralogy of Silver in the North-East of Russia; Triumph: Moscow, Russia, 2018; p. 544, (In Russian). [Google Scholar] [CrossRef]
- Makshakov, A.S.; Kravtsova, R.G. Bryolithochemical studies in the search for and evaluation of gold-silver mineralization based on stream sediments (Northeastern Russia). Russ. Geol. Geophys. 2018, 59, 1836–1851. [Google Scholar] [CrossRef]
- Vasileva, I.E.; Shabanova, E.V. Arc atomic-emission analysis in geochemical research. Zavod. Lab. Diagn. Mater. 2012, 78, 14–24. (In Russian) [Google Scholar]
- Kitaev, N.A. Multidimensional Analysis of Geochemical Fields; Nauka: Novosibirsk, Russia, 1990; p. 120. (In Russian) [Google Scholar]
- Vinogradov, A.P. An average chemical elements content in main types of igneous crust rocks. Geokhimiya 1962, 7, 555–571. (In Russian) [Google Scholar]
- Clarke, F.W.; Washington, H.S. The Composition of the Earth’s Crust; US Geological Survey: Preston, VA, USA, 1924; pp. 127–140.
- Taylor, S.R. Trace element abundances and the chondritic Earth model. Geochim. Cosmochim. Acta 1964, 28, 1989–1998. [Google Scholar] [CrossRef]
- Li, Y.; Cao, J.; Hopke, P.K.; Holub, R.F.; Jiang, T. The discovery of the metallic particles of groundwater from the Dongshengmiao polymetallic deposit, Inner Mongolia, and their prospecting significance. J. Geochem. Explor. 2016, 161, 49–61. [Google Scholar] [CrossRef]
- Hu, G.; Cao, J. Occurrence and significance of natural ore-related Ag nanoparticles in groundwater systems. Chem. Geol. 2019, 515, 9–21. [Google Scholar] [CrossRef]
- Cao, J.; Cheng, S. Characteristics of particles in groundwater and their prospecting significance for the Shijiangshan Pb-Zn-Ag deposit, Inner Mongolia, China. J. Geochem. Explor. 2020, 217, 106592. [Google Scholar] [CrossRef]
- Liu, X.; Cao, J.; Dang, W.; Lin, Z.; Qiu, J. Nanoparticles in groundwater of the Qujia deposit, eastern China: Prospecting significance for deep-seated ore resources. Ore Geol. Rev. 2020, 120, 103417. [Google Scholar] [CrossRef]
- Kravtsova, R.G.; Borovikov, A.A.; Borisenko, A.S.; Prokof’ev, V.Y. Formation conditions of gold–silver deposits in the northern Okhotsk region, Russia. Geol. Ore Depos. 2003, 45, 395–415. [Google Scholar]
Figure 1.
The investigation area location in the Okhotsk-Chukotka volcanic belt (OCVB) (a); schematic geological map of the Balygychan-Sugoy trough’s southern part (including the Pestrinsk silver-bearing system (SBS)) (b). The image was constructed by the authors of the present paper using data from [53,60,61,62,63,64] with additions by [56] and materials from the Dukat geological exploration enterprise. On the legend: 1—Quaternary sediments; 2—Late Cretaceous rhyolites, rhyolitic ignimbrites and tuffs and rhyodacites (Nayakhan suite); 3—Early-Late Cretaceous andesites, andesite-basalts, tuffs and tuffolavas and dacites (Tavatum suite); 4—Jurassic siltstones, argillites, sandstones, tuffaceous sandstones, tuffites and ash tuffs; 5—Triassic sandstones, siltstones, argillites, tuffs, tuffites, sandy argillites and calcareous sandstones; 6–8—Late Cretaceous intrusions: 6—granites, 7—granodiorite porphyry and 8—diorites and gabbro; 9 and 10—subvolcanic formations: 9—Late Cretaceous rhyolites, nevadites and felsites (a), dacites (b) and andesites (c) and 10—Late Triassic spilites; 11—faults ((a)—reliable, (b)—estimated); 12—the boundaries of the Pestrinsk SBS; 13–16—deposits (a) and prospects (b): 13—silver-polymetallic (1—Goltsovy, 2—Porfirovy), 14—tin-silver (3—Olymp, 4—Chisty), 15—tin (5—Upper Tap, 6—Ircha, 7—Vyun, 8—Otkryty, 9—Bokovoy) and 16—rare metal and tin-rare metal prospects (10—Kalyan, 11—Pestrinsk); 17—area of geochemical survey of stream sediments at 1:50,000 scale; 18—section of detailed research-methodological works (bryolithochemical research).

Figure 2.
The alluvium samples’ locations (red points) in the survey of stream sediments (SSs) at 1:200,000 (a) and 1:50,000 (b) scales.
Figure 2.
The alluvium samples’ locations (red points) in the survey of stream sediments (SSs) at 1:200,000 (a) and 1:50,000 (b) scales.

Figure 3.
The Pestrinsk SBS. Exogenous Ag (a), As (b), Pb (c), and Zn (d) anomalous geochemical fields (AGCFs) identified through SSs (survey at 1:200,000 scale). For the legend to Figure 3, Figure 4, Figure 5 and Figure 6, see Figure 1.

Figure 4.
The Pestrinsk SBS. Exogenous Cu (a), Mo (b), W (c) and Sn (d) AGCFs identified through SSs (survey at 1:200,000 scale).
Figure 4.
The Pestrinsk SBS. Exogenous Cu (a), Mo (b), W (c) and Sn (d) AGCFs identified through SSs (survey at 1:200,000 scale).

Figure 5.
The Pestrinsk SBS. Exogenous Bi (a) and B (b) AGCFs identified through SSs (survey at 1:200,000 scale).
Figure 5.
The Pestrinsk SBS. Exogenous Bi (a) and B (b) AGCFs identified through SSs (survey at 1:200,000 scale).

Figure 6.
The Pestrinsk SBS. Polyelement AGCFs identified through SSs (survey at 1:200,000 scale). 1–17—geochemical associations of elements (see Table 2): 1–3—Ag–Pb; 4–6—Sn–Ag; 7–10—Sn; 11–13—Sn–W, and Mo–W; 14–16—variable composition in disseminated sulfide mineralization (ZDSM); and 17—near-background (contrast ratio (CR) average values for all elements less than 3).

Figure 7.
The Pestrinsk SBS (fragment). Exogenous Ag (a), Hg (b), Sb (c), As (d), Pb (e), and Zn (f) AGCFs identified through SSs (survey at a 1:50,000 scale). Here and in Figure 8, the contents of all elements are given in ppm.
Figure 7.
The Pestrinsk SBS (fragment). Exogenous Ag (a), Hg (b), Sb (c), As (d), Pb (e), and Zn (f) AGCFs identified through SSs (survey at a 1:50,000 scale). Here and in Figure 8, the contents of all elements are given in ppm.

Figure 8.
The Pestrinsk SBS (fragment). Exogenous Cu (a), Mo (b), W (c), Sn (d), Bi (e), and B (f) AGCFs identified through SSs (survey at a 1:50,000 scale).
Figure 8.
The Pestrinsk SBS (fragment). Exogenous Cu (a), Mo (b), W (c), Sn (d), Bi (e), and B (f) AGCFs identified through SSs (survey at a 1:50,000 scale).

Figure 9.
The Pestrinsk SBS (fragment). Polyelement AGCFs identified through SSs (survey at a 1:50,000 scale). 1–24—geochemical associations of elements (see Table 3): 1–6—Ag–Pb; 7–12—Sn–Ag; 13–17—Sn; 18–21—Sn–W and Mo–W; and 22–25—variable composition in ZDSM.
Figure 9.
The Pestrinsk SBS (fragment). Polyelement AGCFs identified through SSs (survey at a 1:50,000 scale). 1–24—geochemical associations of elements (see Table 3): 1–6—Ag–Pb; 7–12—Sn–Ag; 13–17—Sn; 18–21—Sn–W and Mo–W; and 22–25—variable composition in ZDSM.

Figure 10.
Moss cushion growing in the upper reaches of the stream (a) and its captured sandy silt material of alluvium (b).
Figure 10.
Moss cushion growing in the upper reaches of the stream (a) and its captured sandy silt material of alluvium (b).

Figure 11.
The Goltsovy Ag–Pb deposit (fragment). The scheme of bryolithochemical and lithochemical sampling of the I-order watercourse (Pryamoy stream). 1—ore bodies, 2—sampling points and their numbers.
Figure 11.
The Goltsovy Ag–Pb deposit (fragment). The scheme of bryolithochemical and lithochemical sampling of the I-order watercourse (Pryamoy stream). 1—ore bodies, 2—sampling points and their numbers.

Figure 12.
The Goltsovy Ag–Pb deposit. Ag and Pb contents in samples taken along the I-order watercourse (Pryamoy stream): 1—bryolithochemical, 2—lithochemical from the moss cushion, and 3—lithochemical.
Figure 12.
The Goltsovy Ag–Pb deposit. Ag and Pb contents in samples taken along the I-order watercourse (Pryamoy stream): 1—bryolithochemical, 2—lithochemical from the moss cushion, and 3—lithochemical.

Figure 13.
Aggregates of kidney-shaped pitticite covered with Fe hydroxides in loose sediments of the watercourses draining the Au–Ag zones of the Dukat deposit. Images are taken in: (a) backscattered electrons; (b,c) X-rays.
Figure 13.
Aggregates of kidney-shaped pitticite covered with Fe hydroxides in loose sediments of the watercourses draining the Au–Ag zones of the Dukat deposit. Images are taken in: (a) backscattered electrons; (b,c) X-rays.

Figure 14.
A distribution scheme of mineralization and endogenous AGCFs of the Ducat Au–Ag system [16,84]. 1—granites, 2—leucogranites, and 3—rhyodacites. Below the line, the average CR values of the elements are given, determined in the field contours of their maximum concentrations.


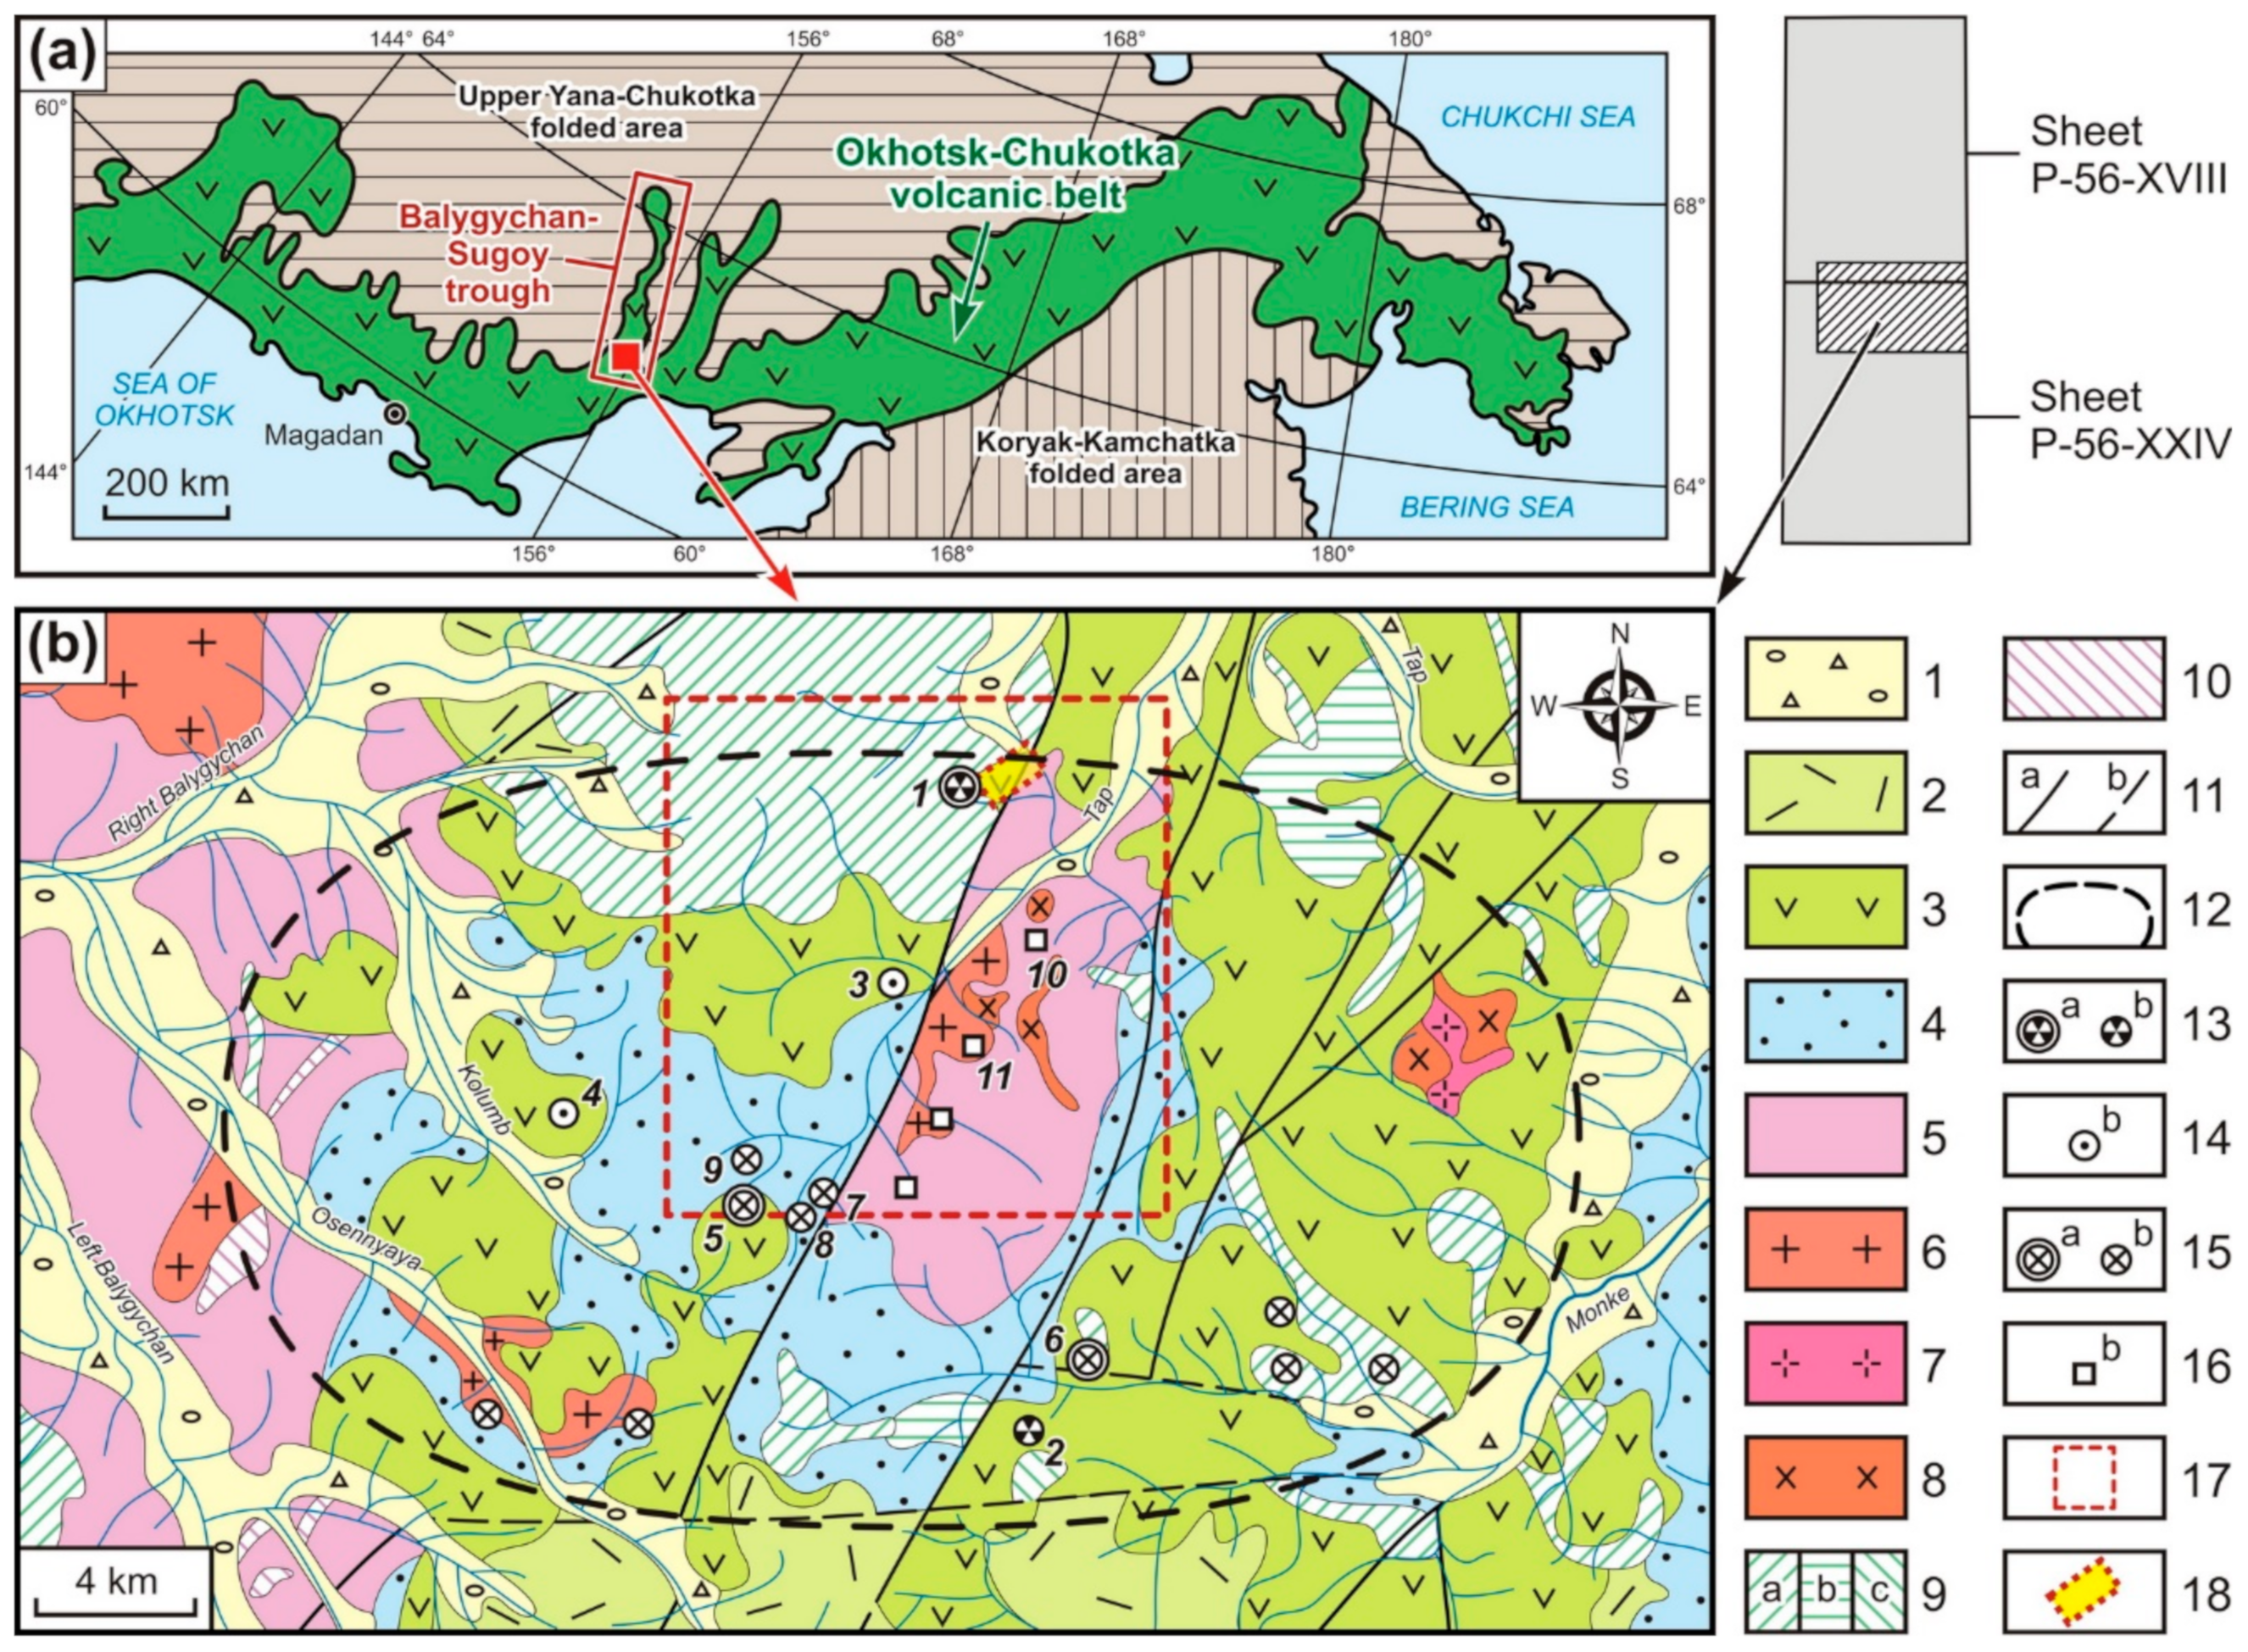
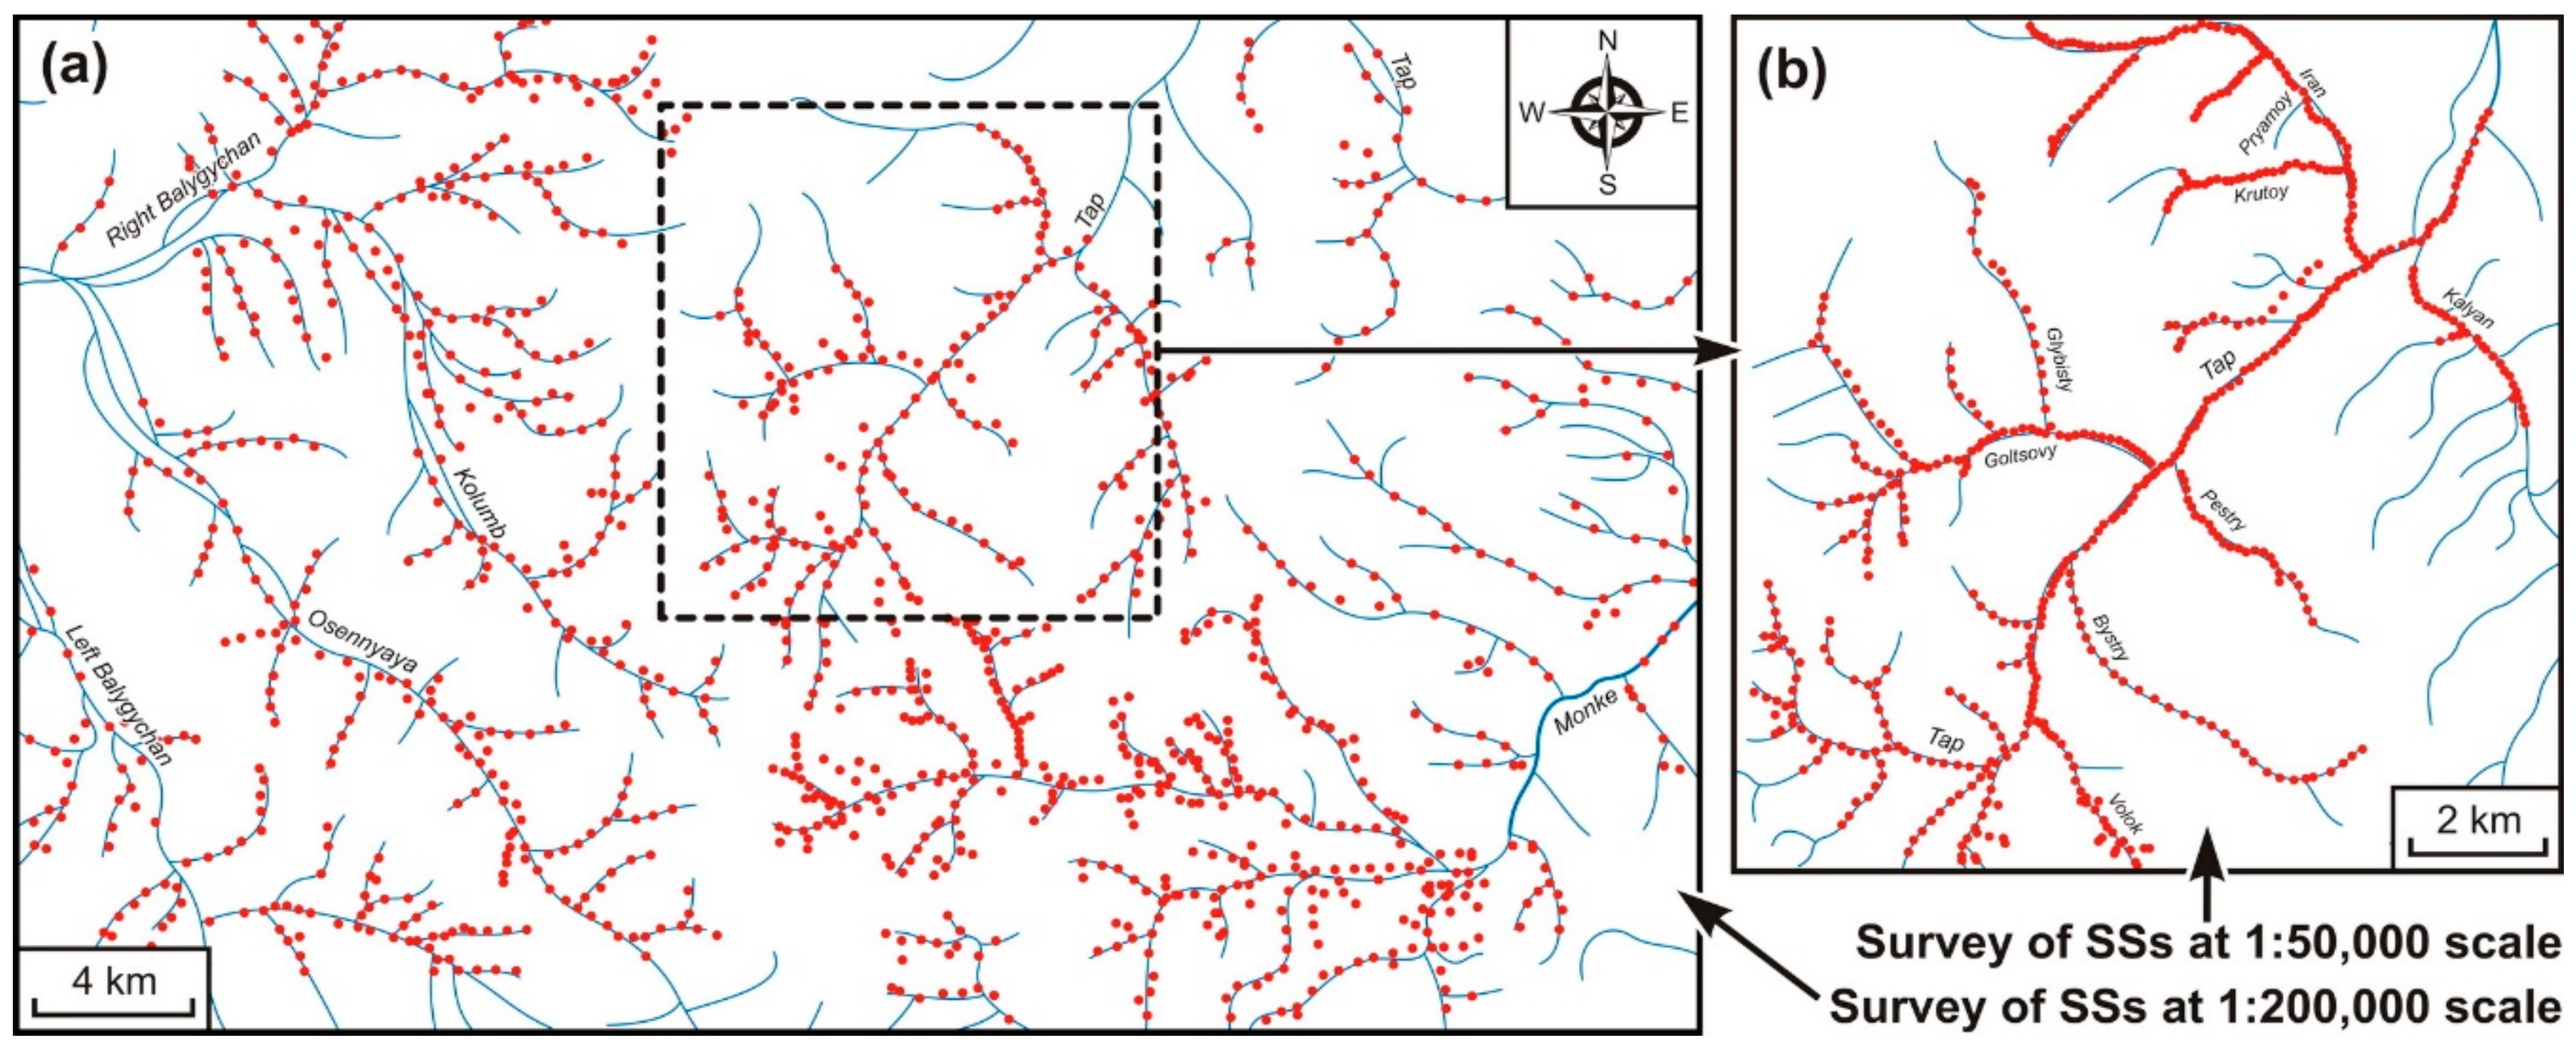
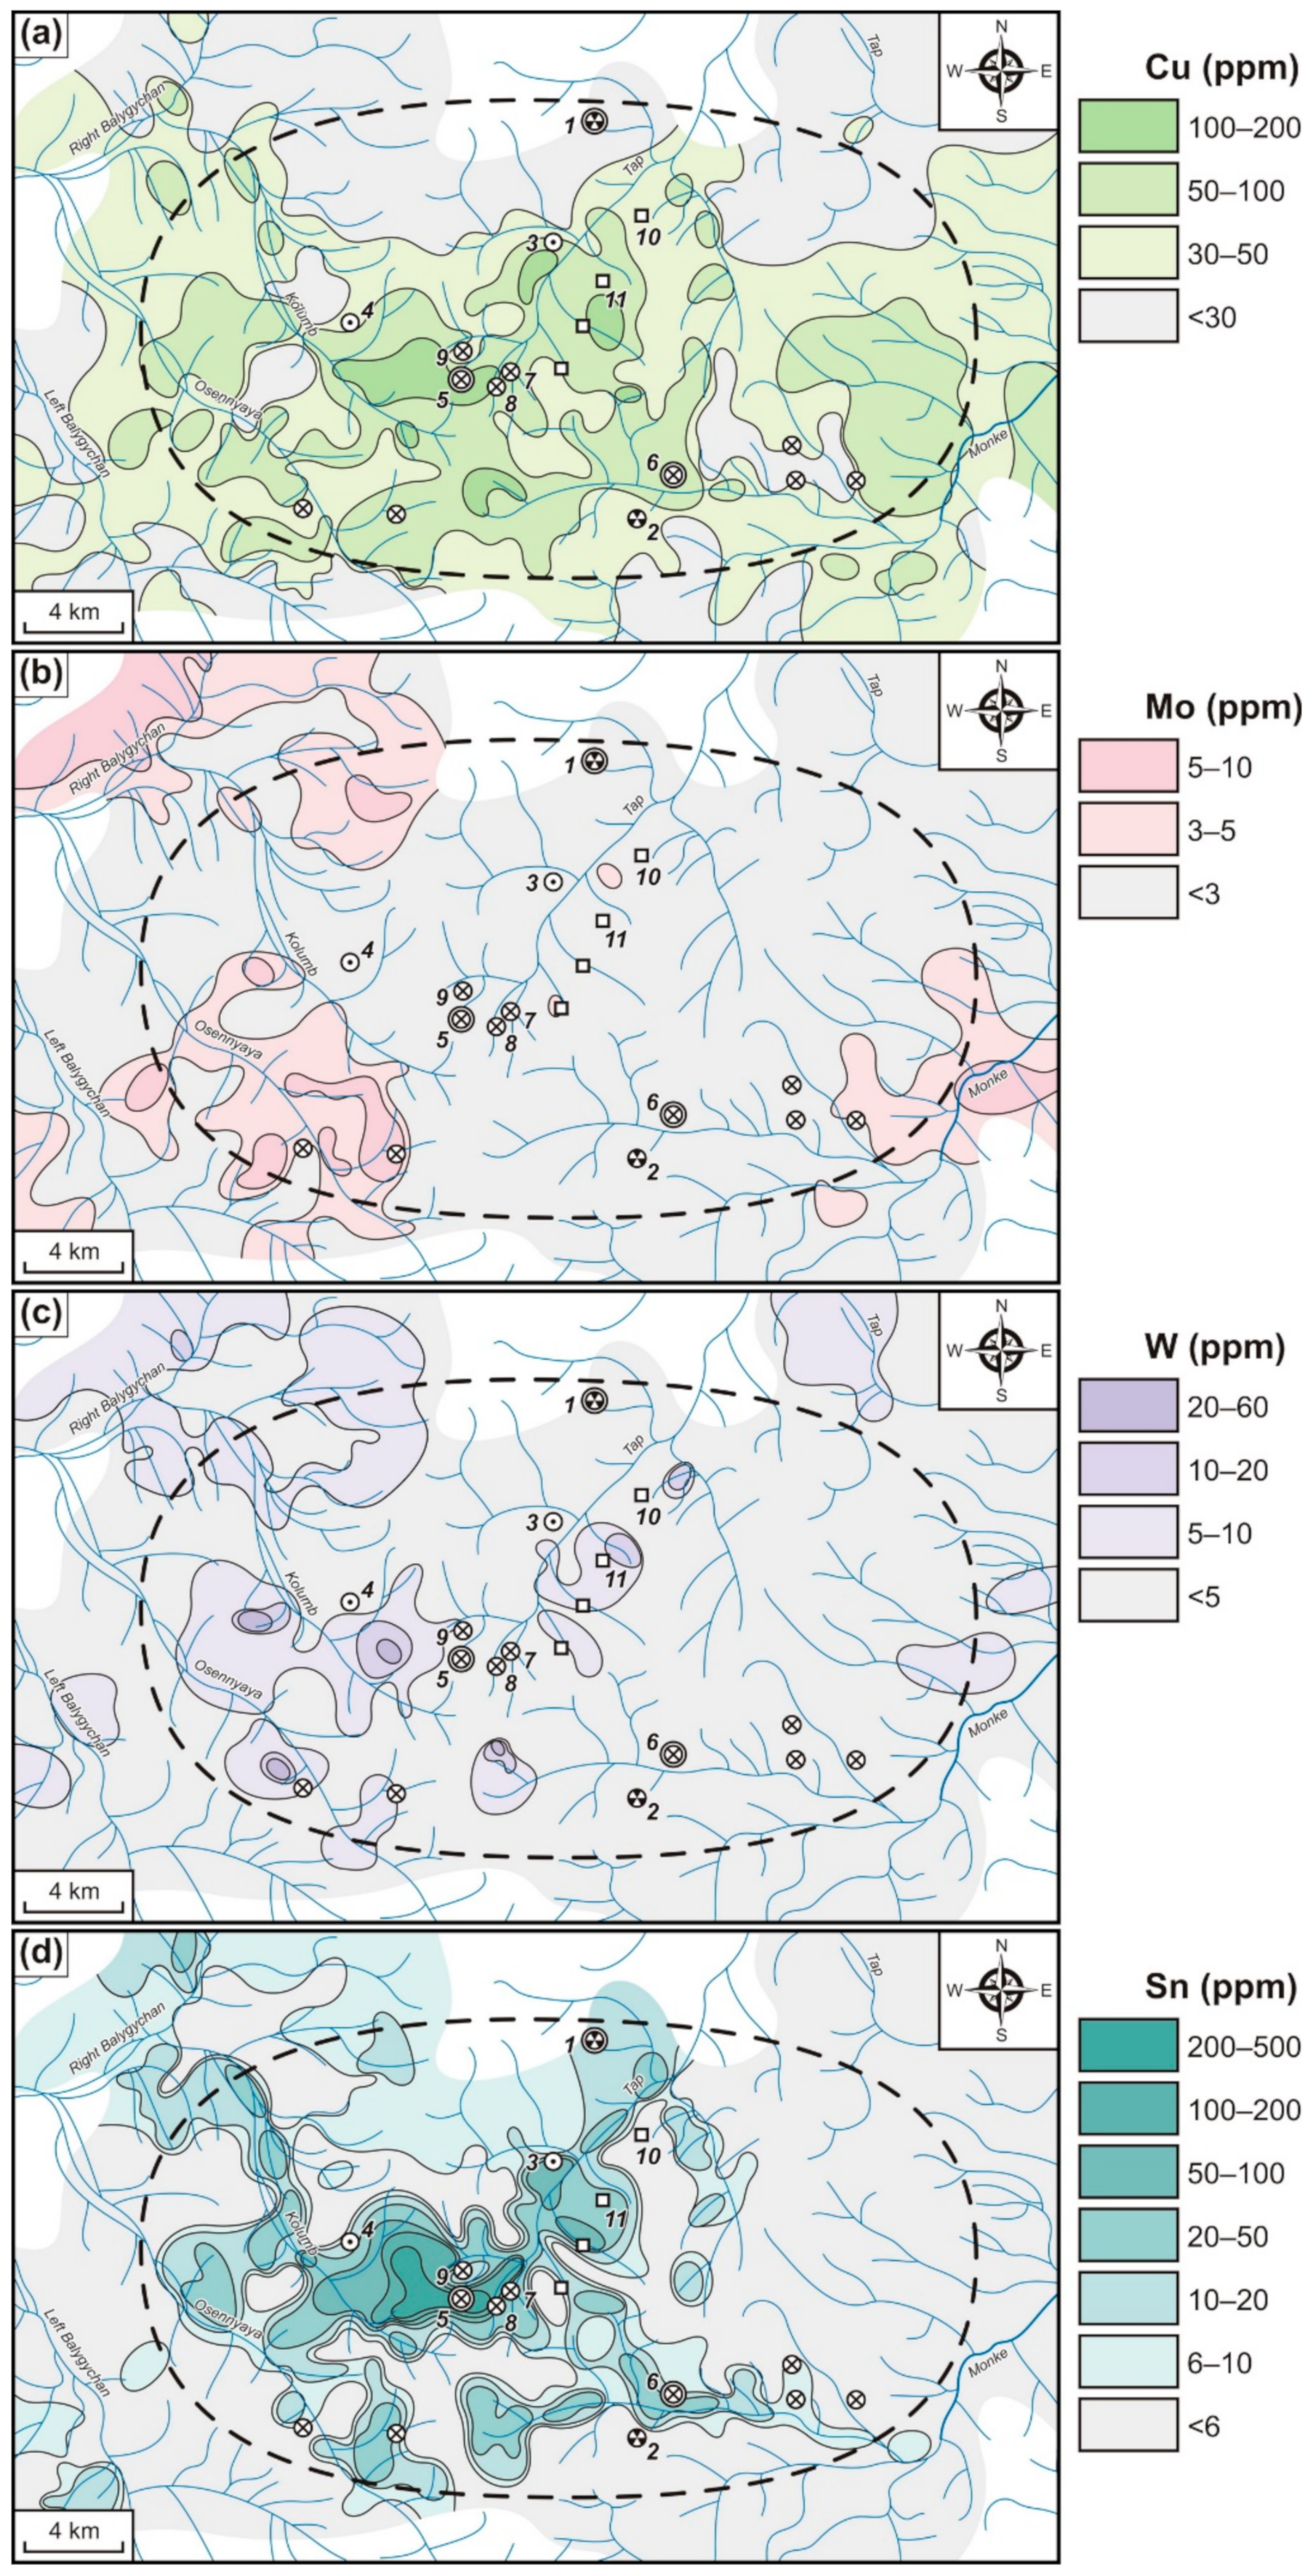
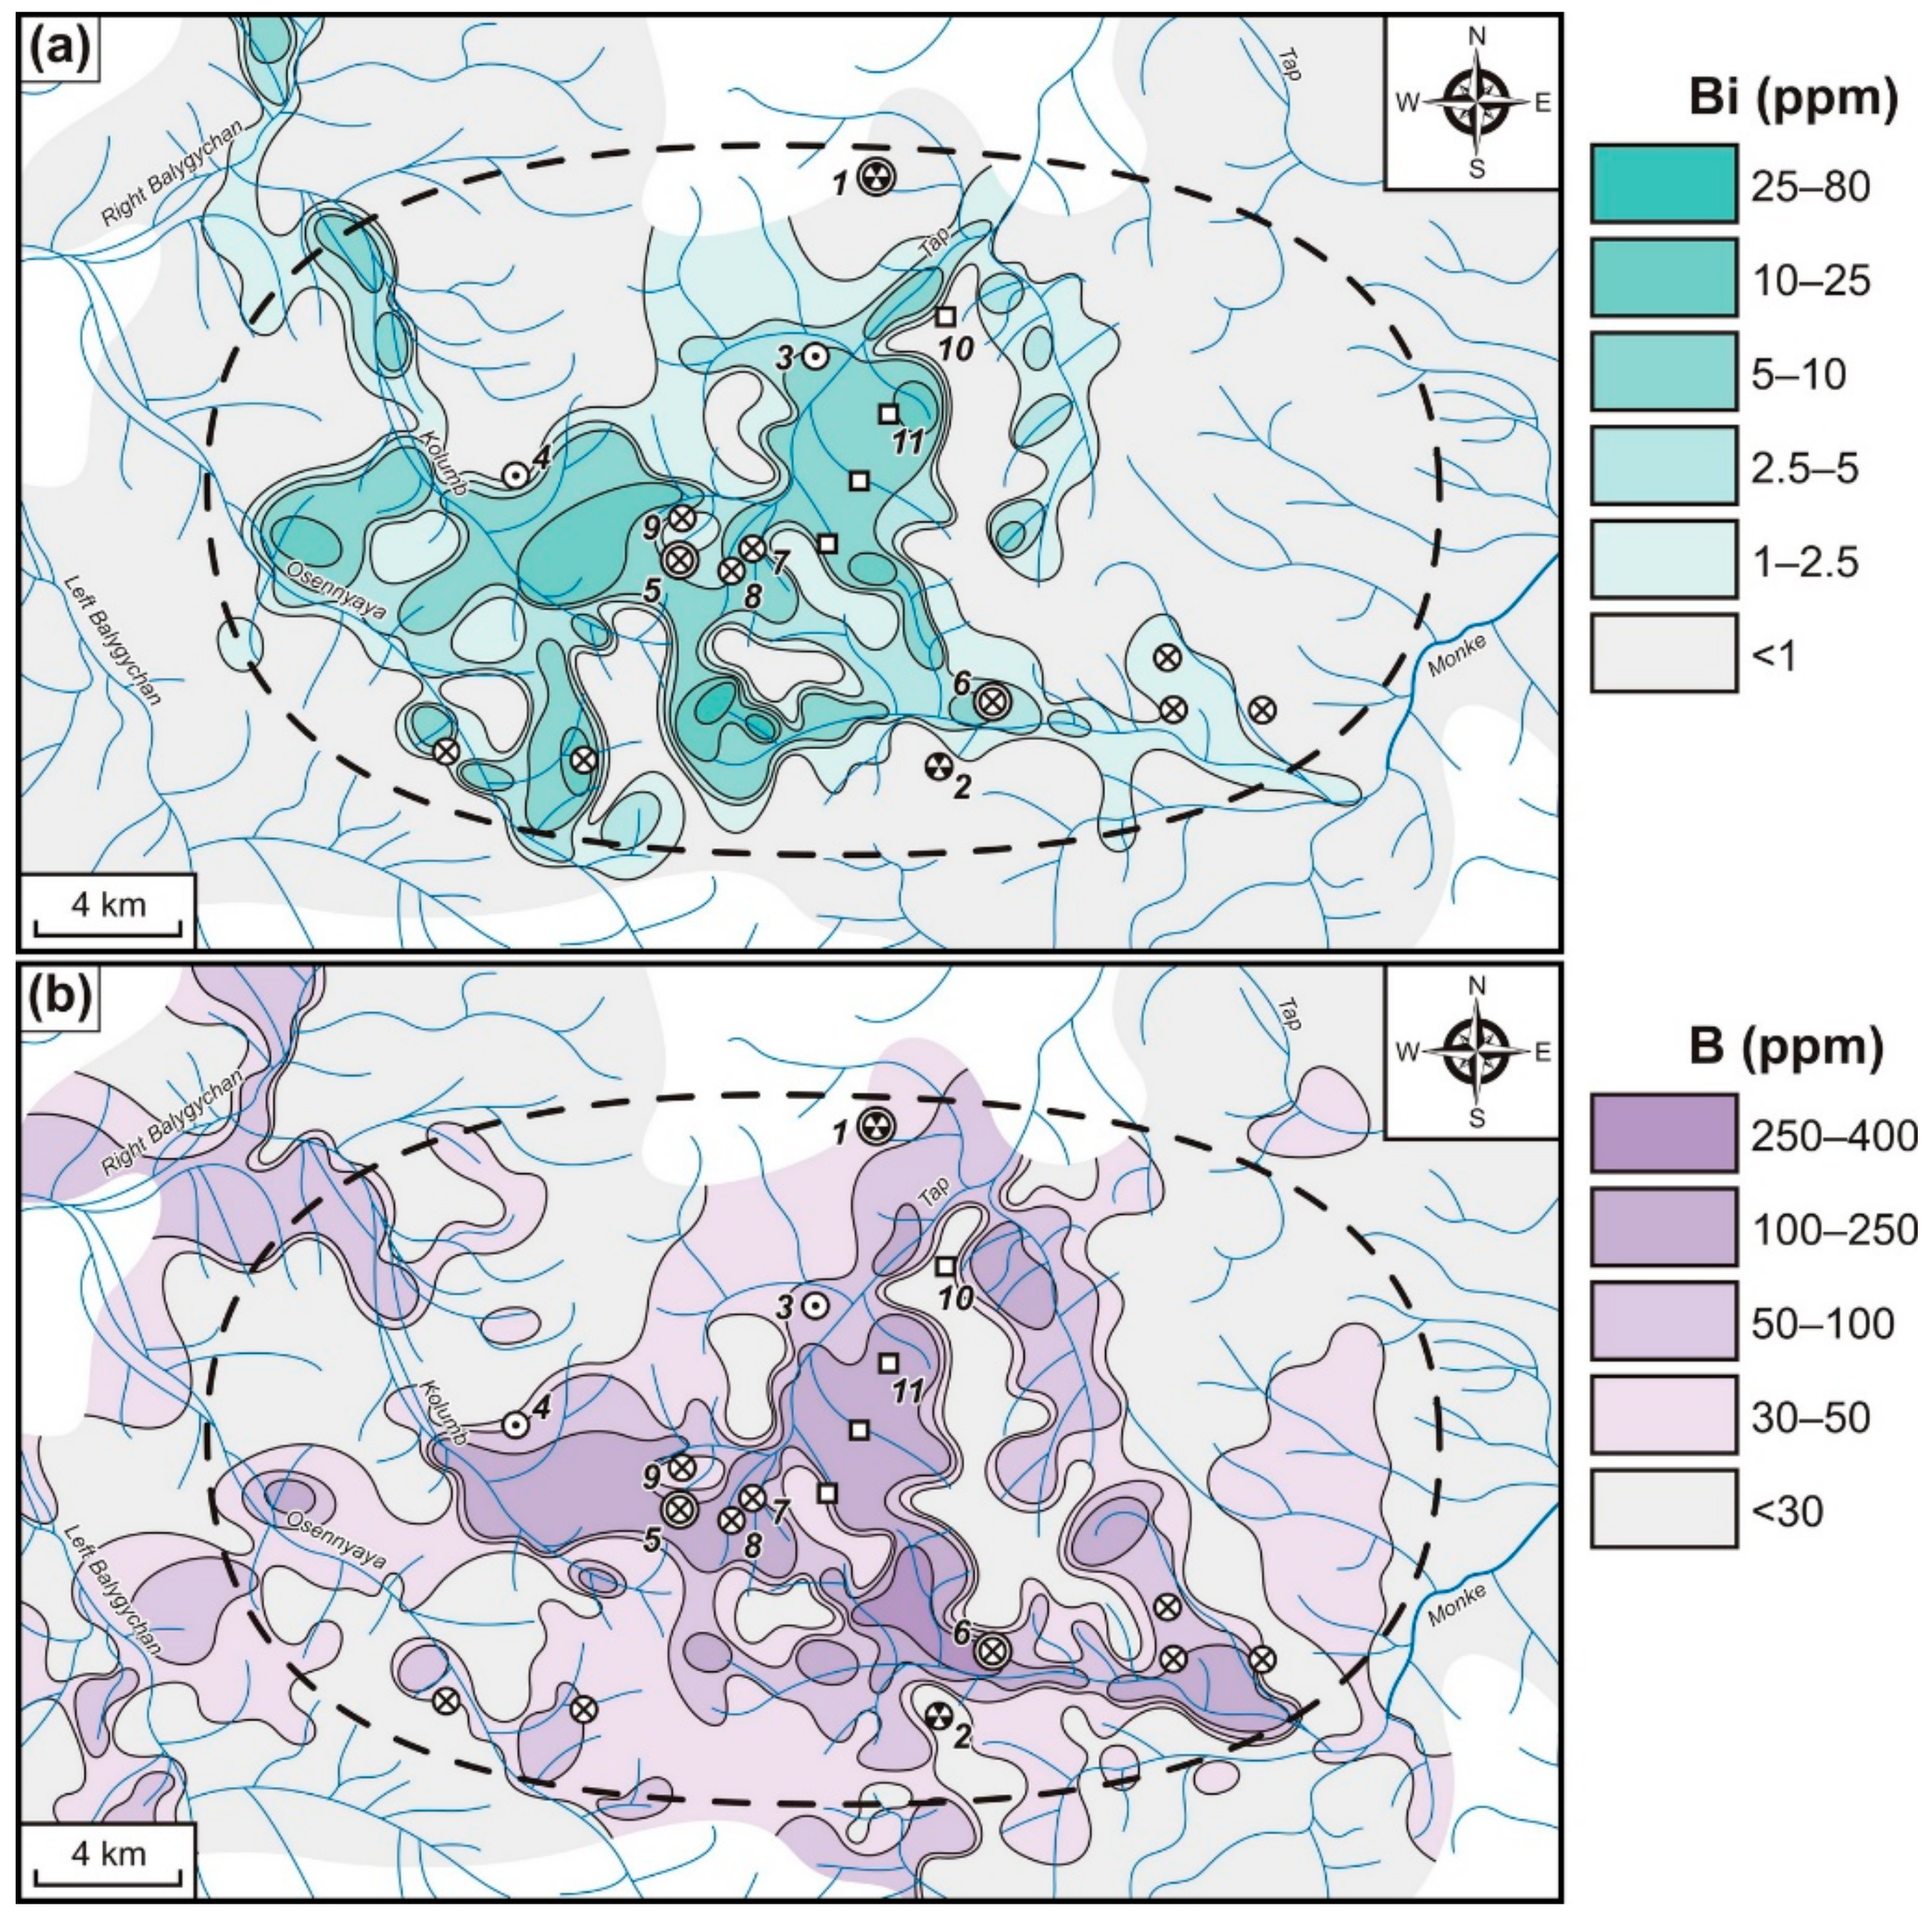
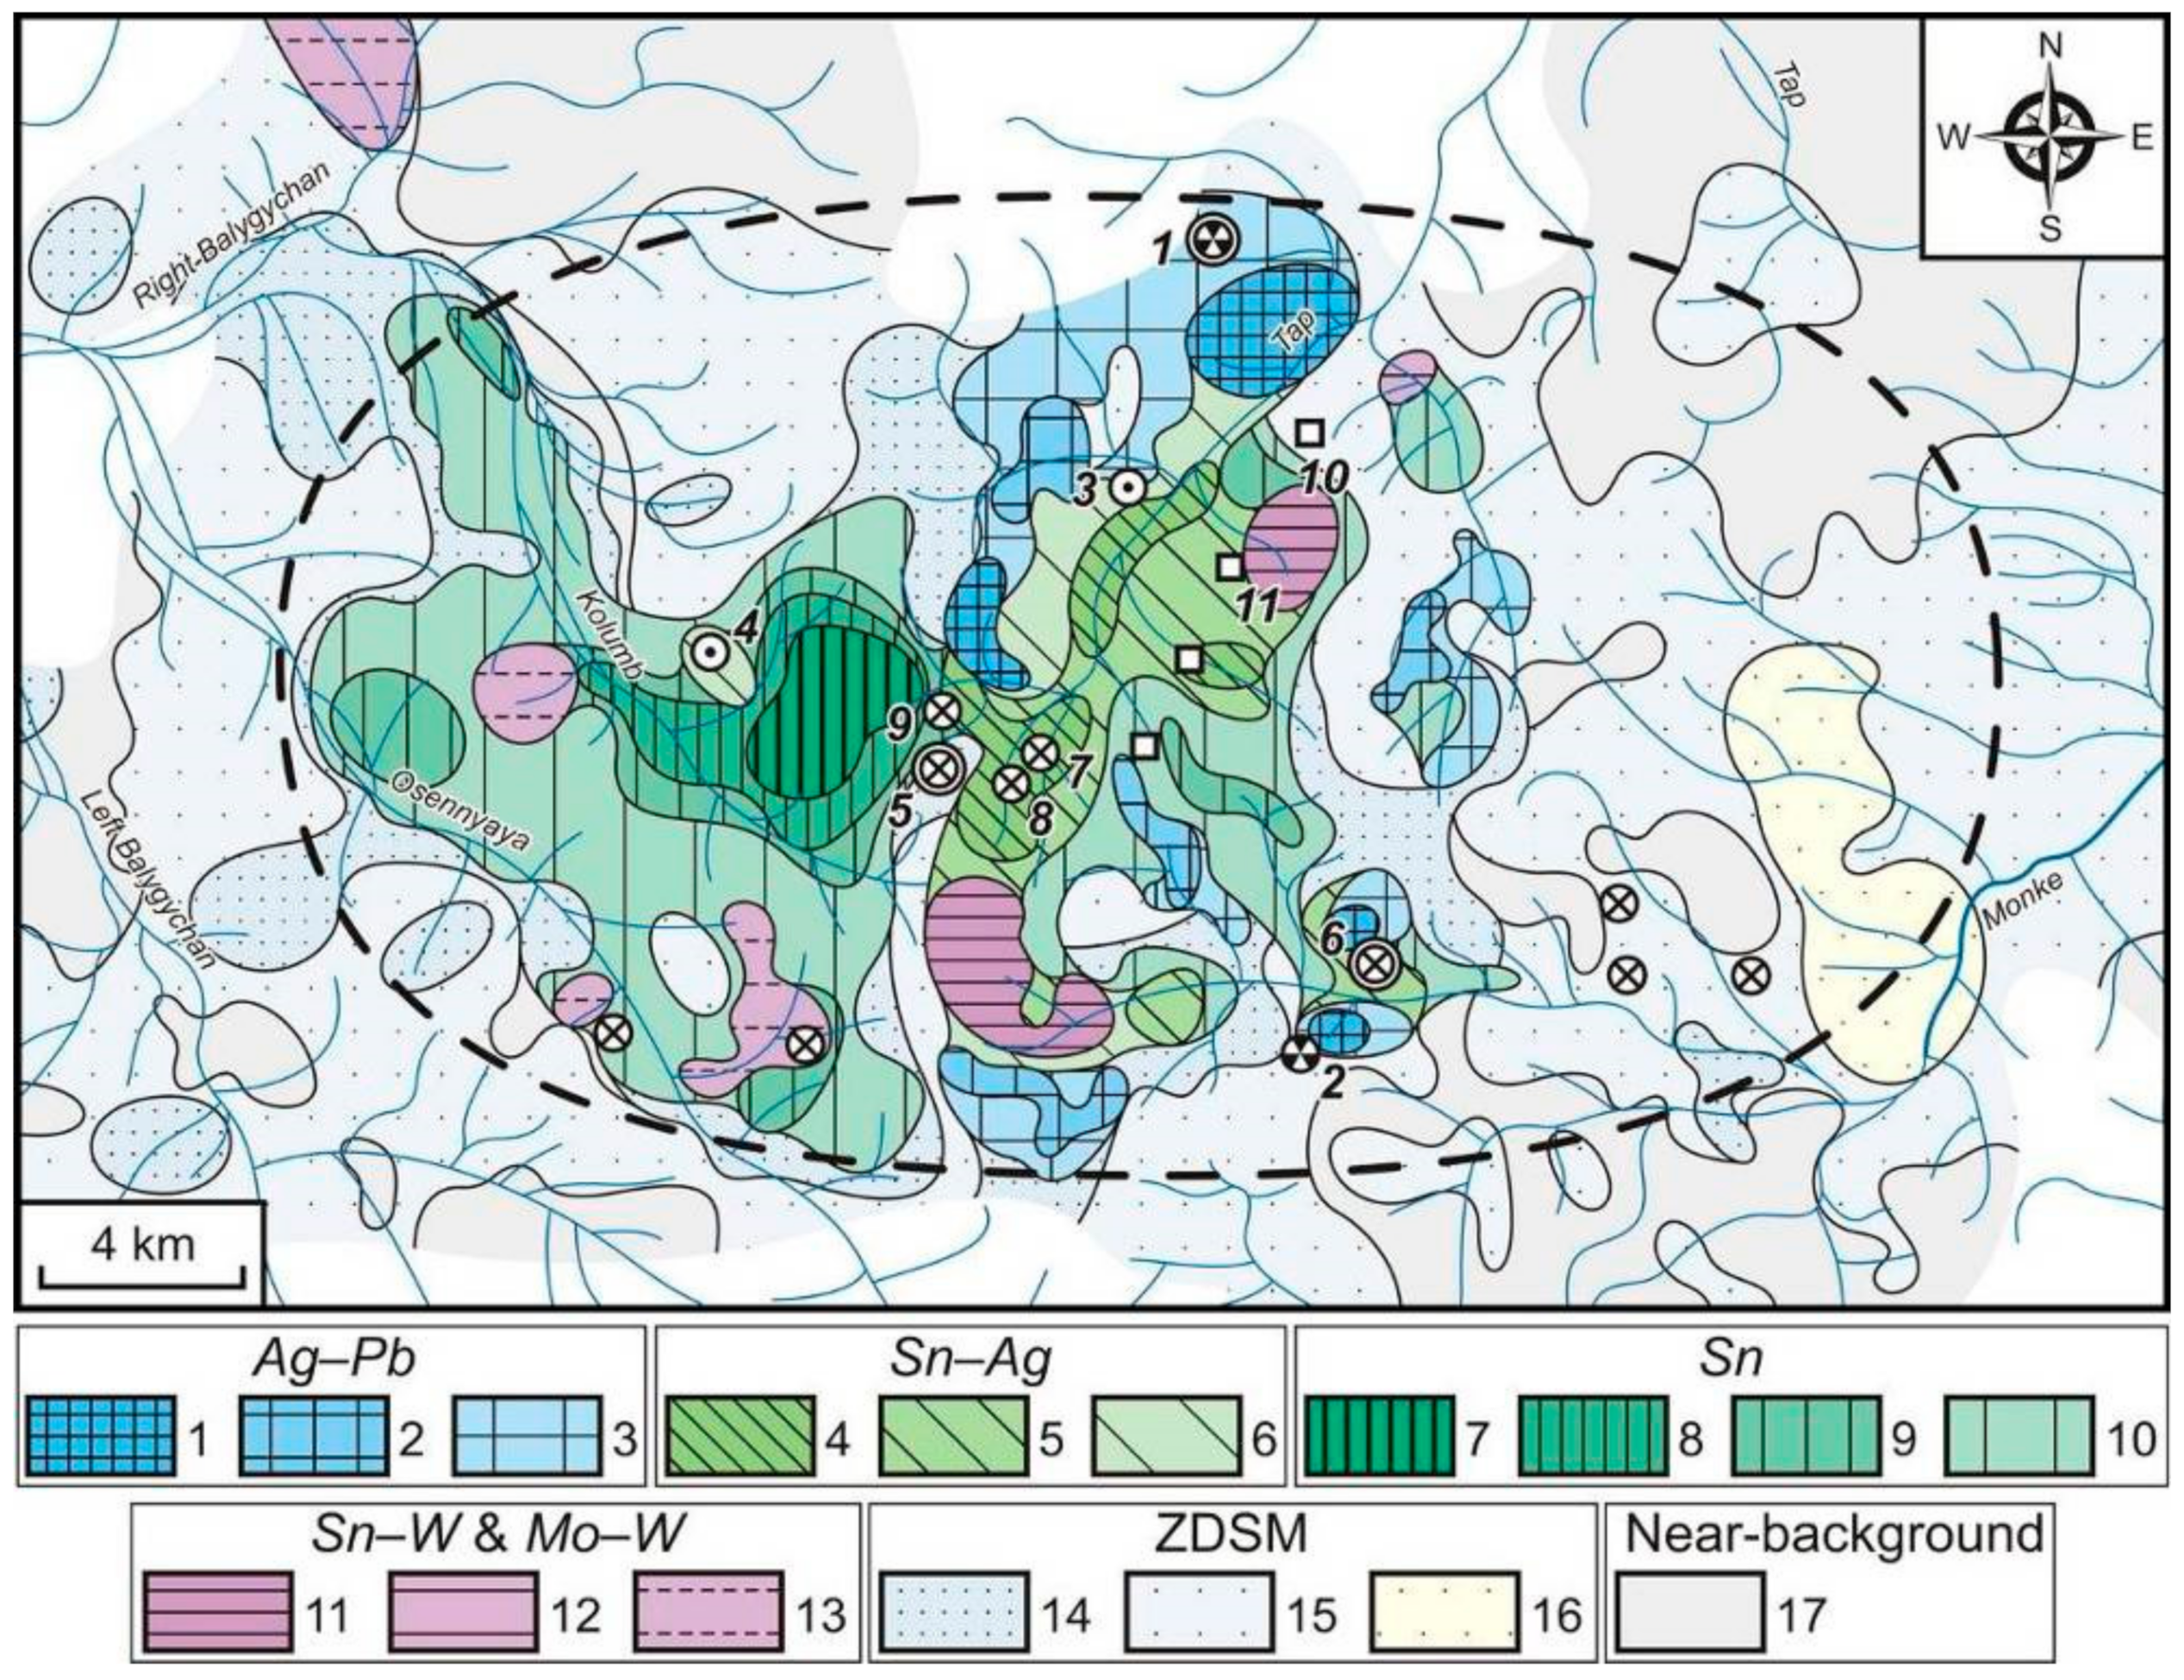
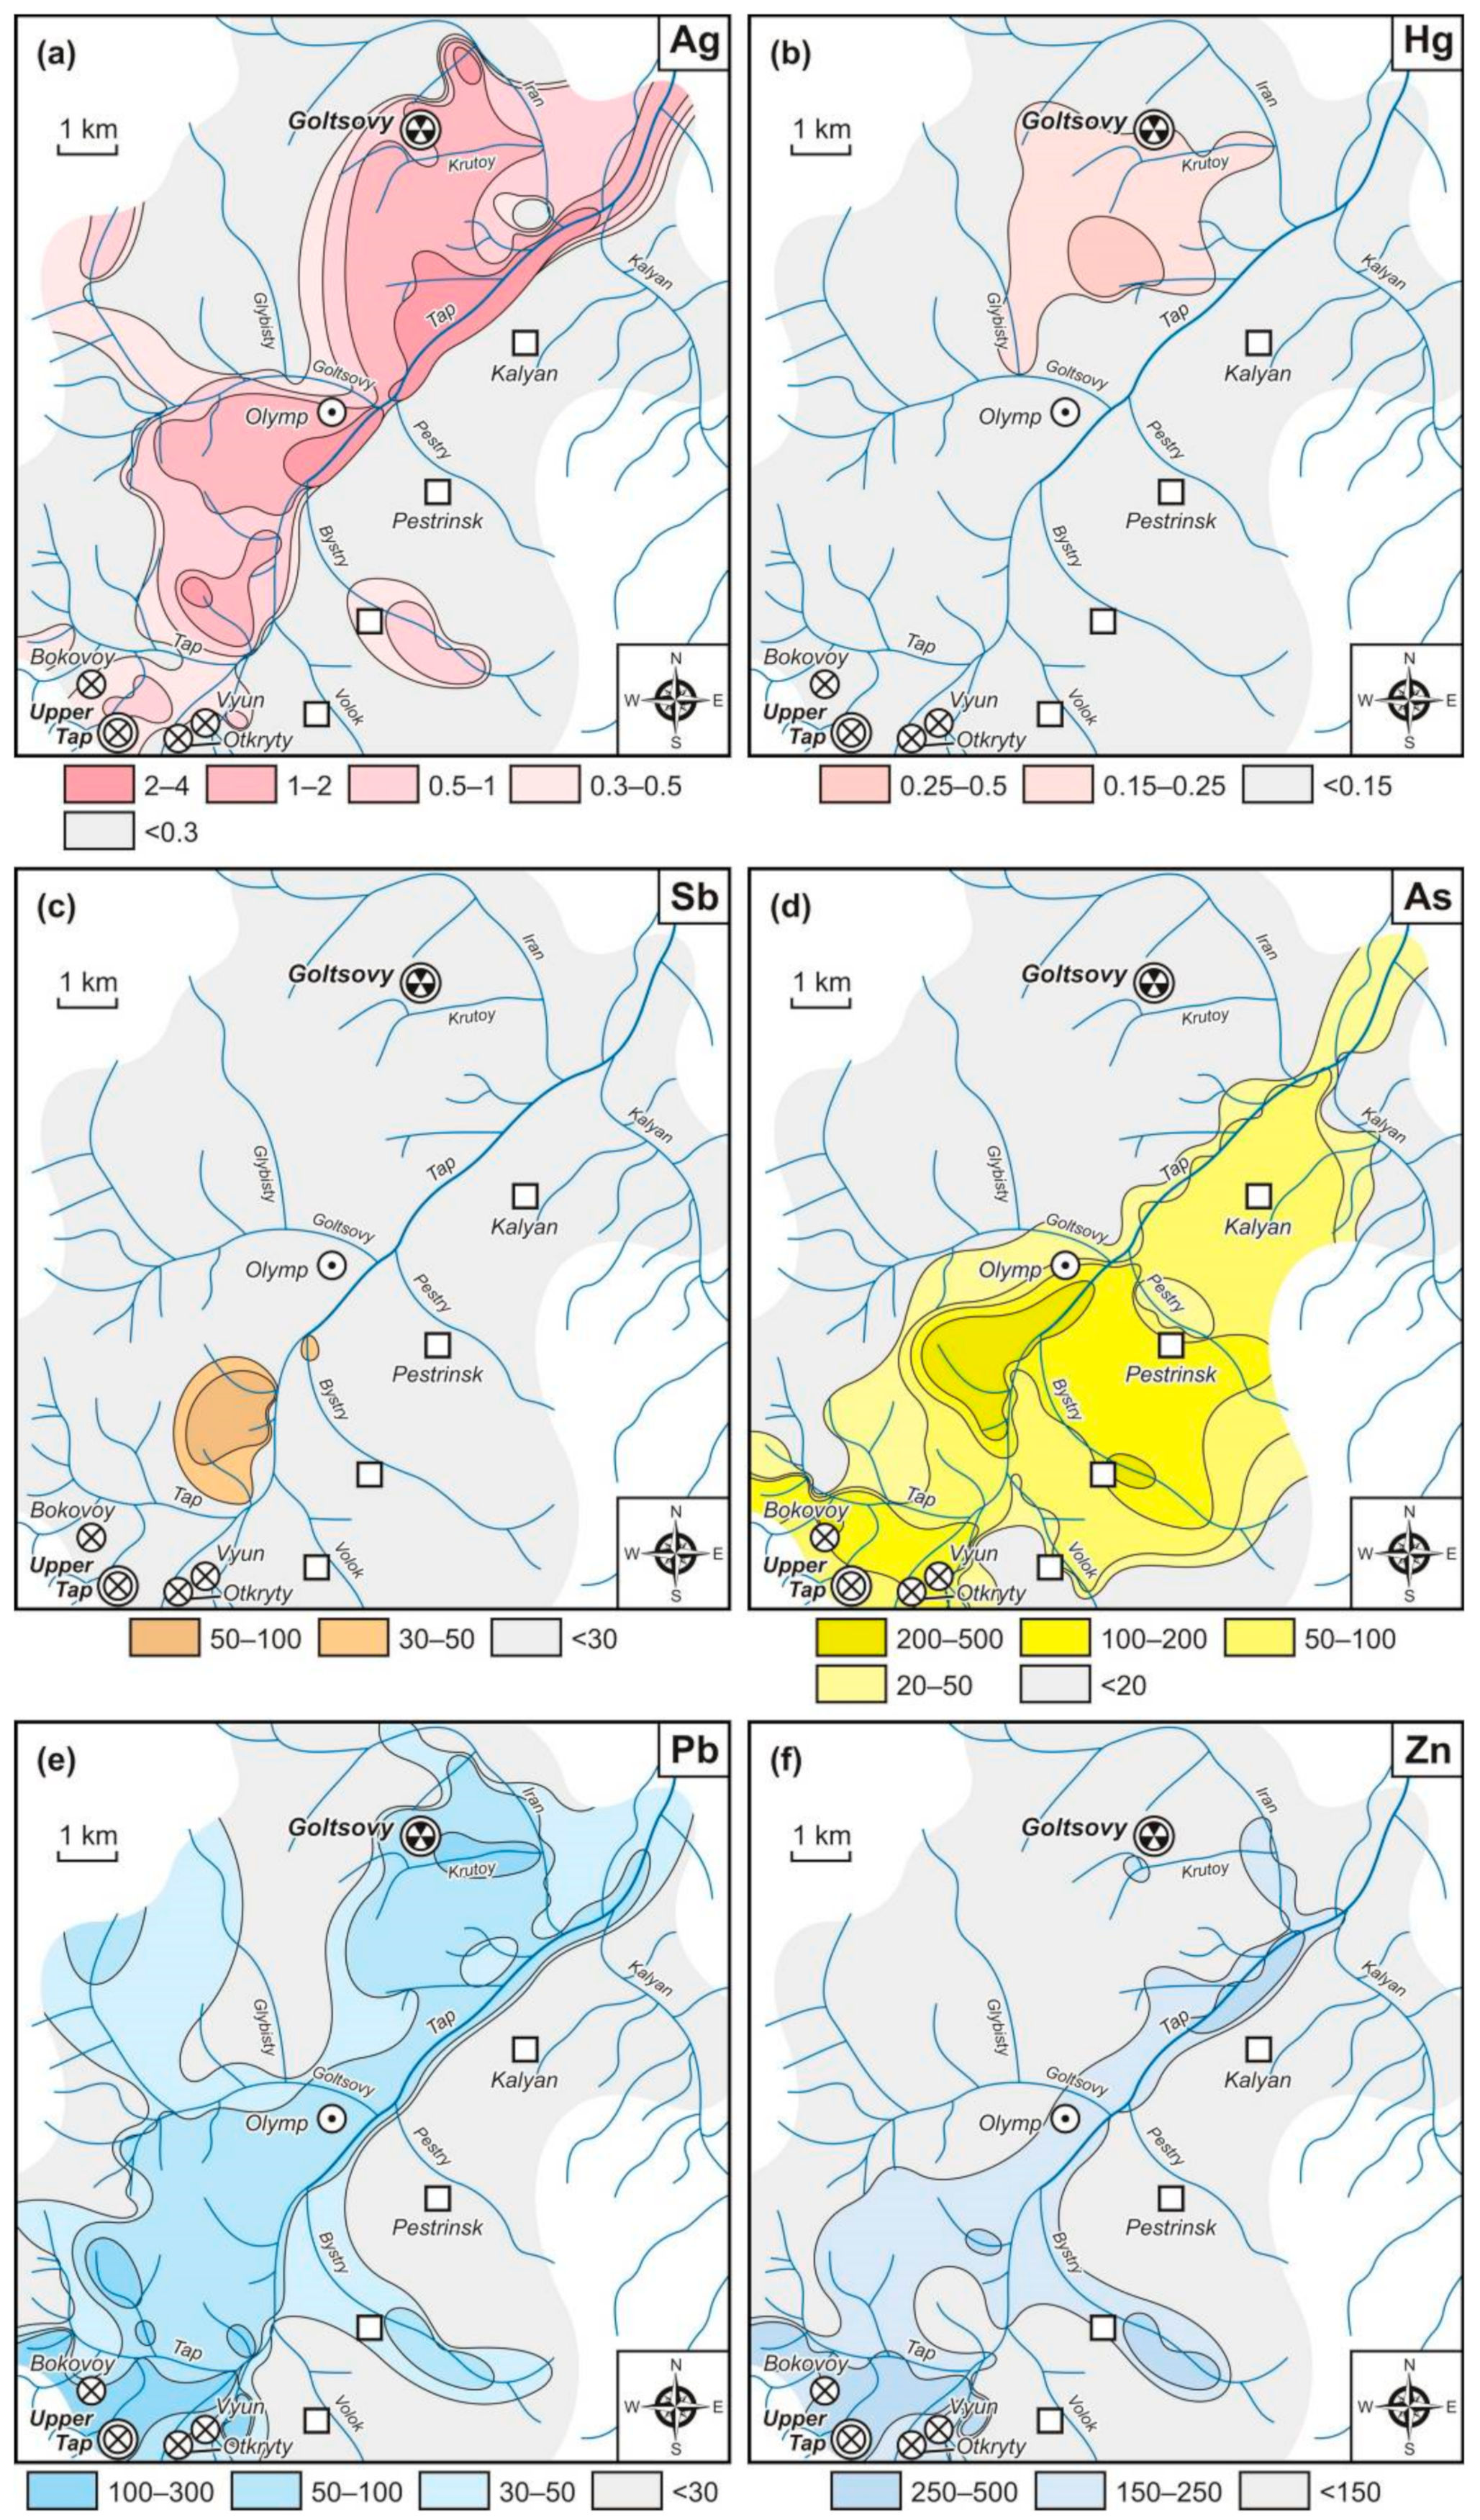
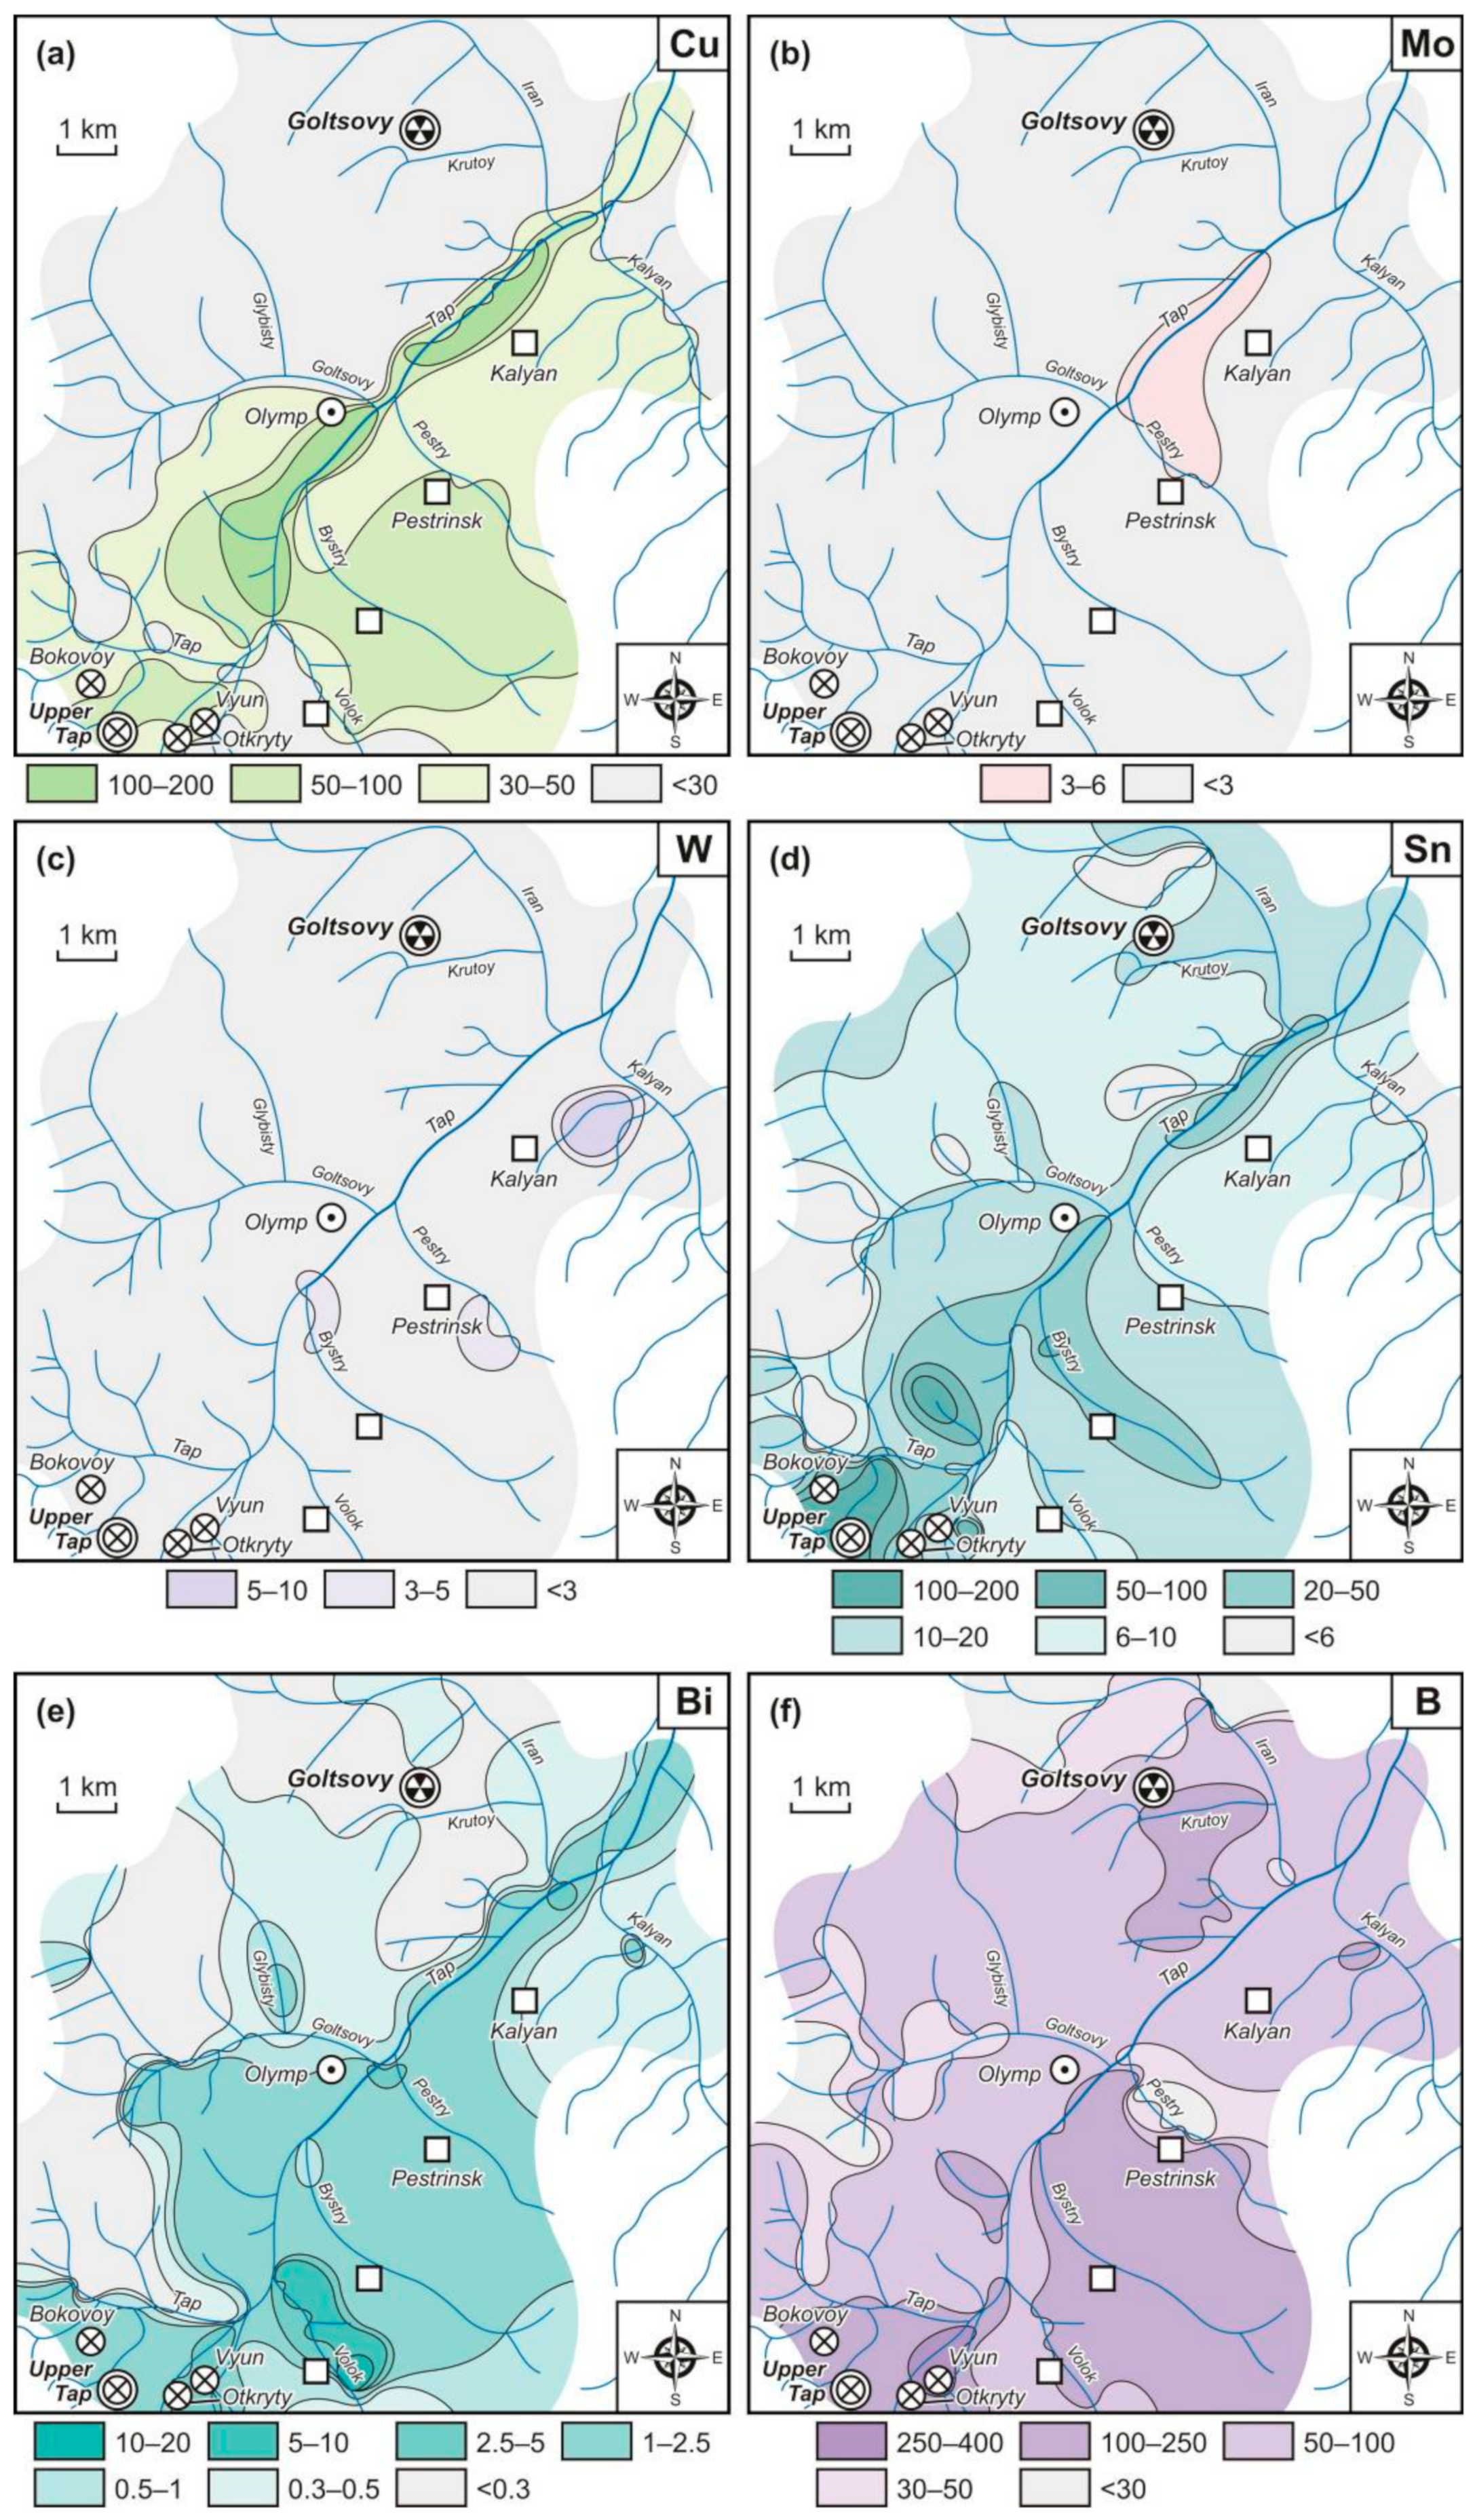
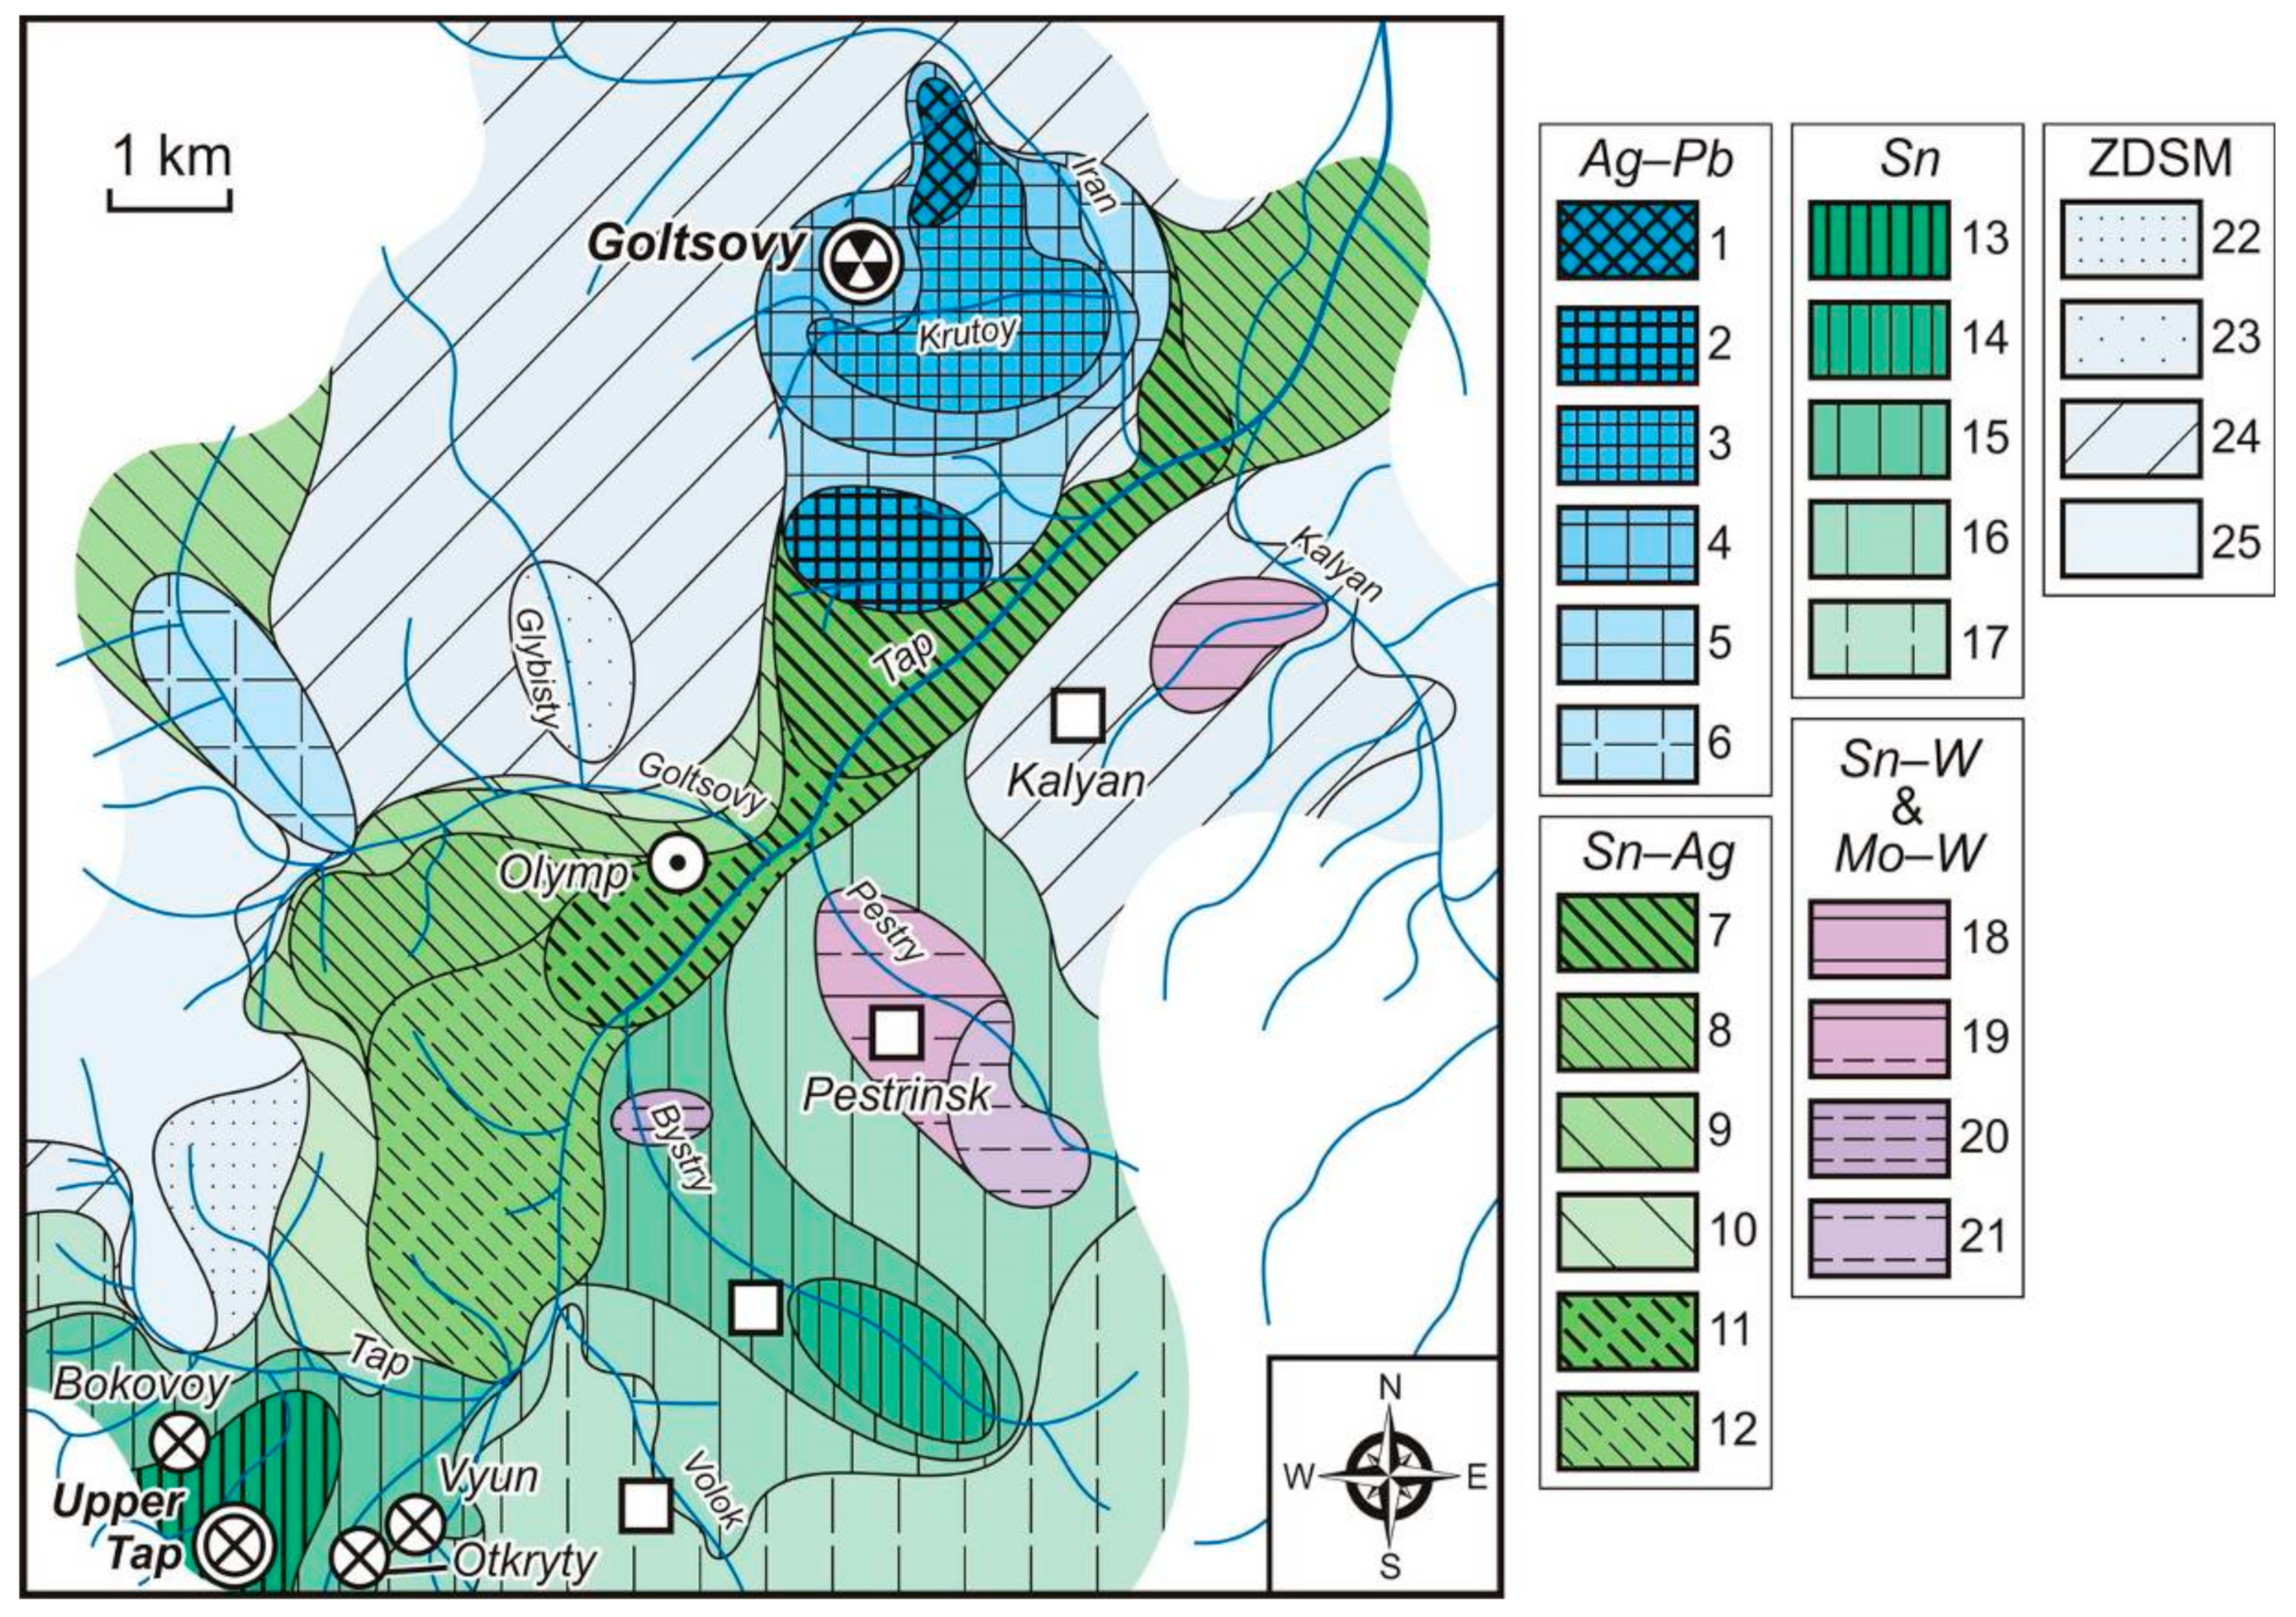
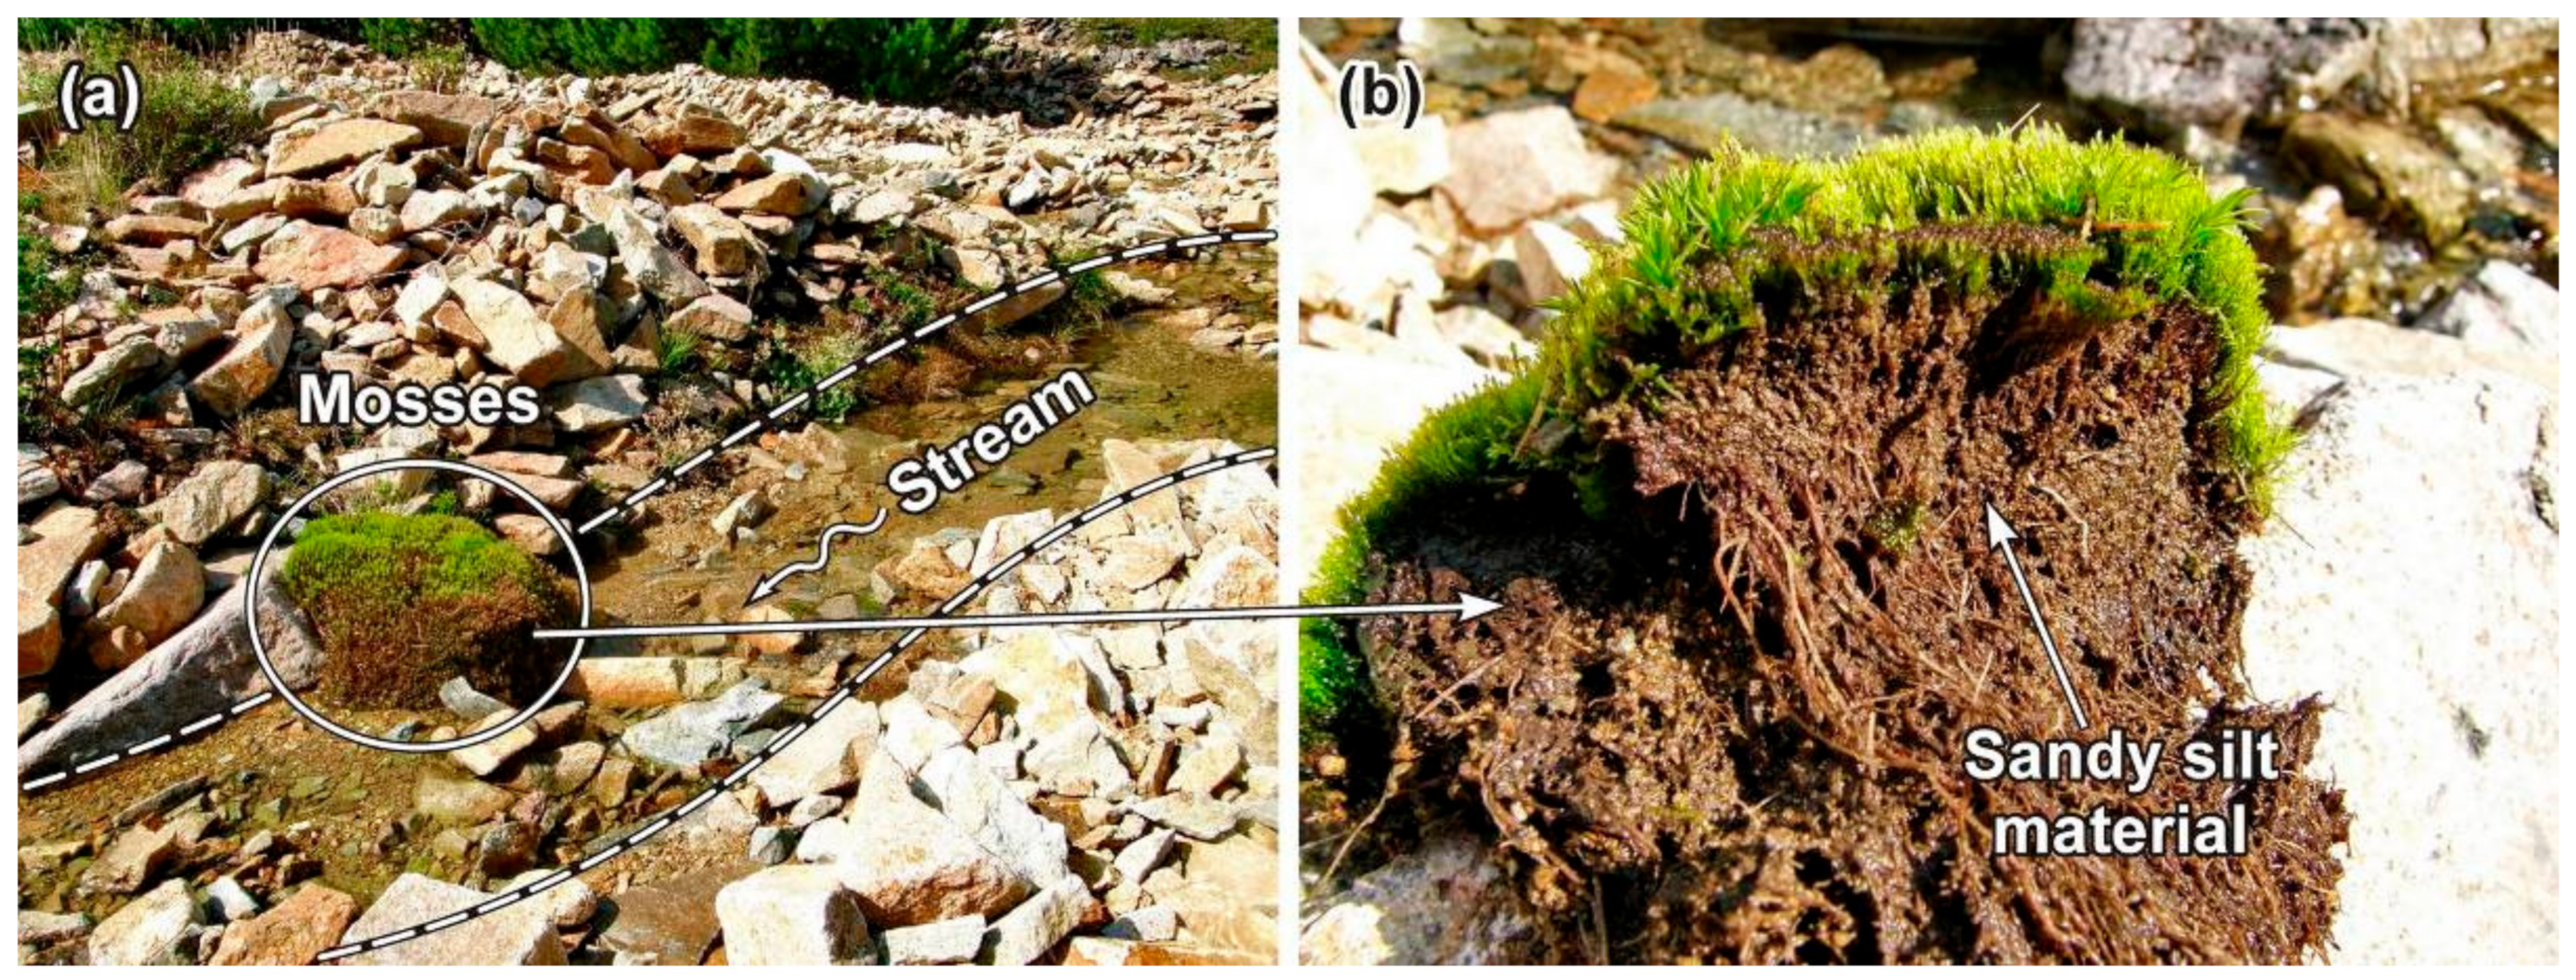
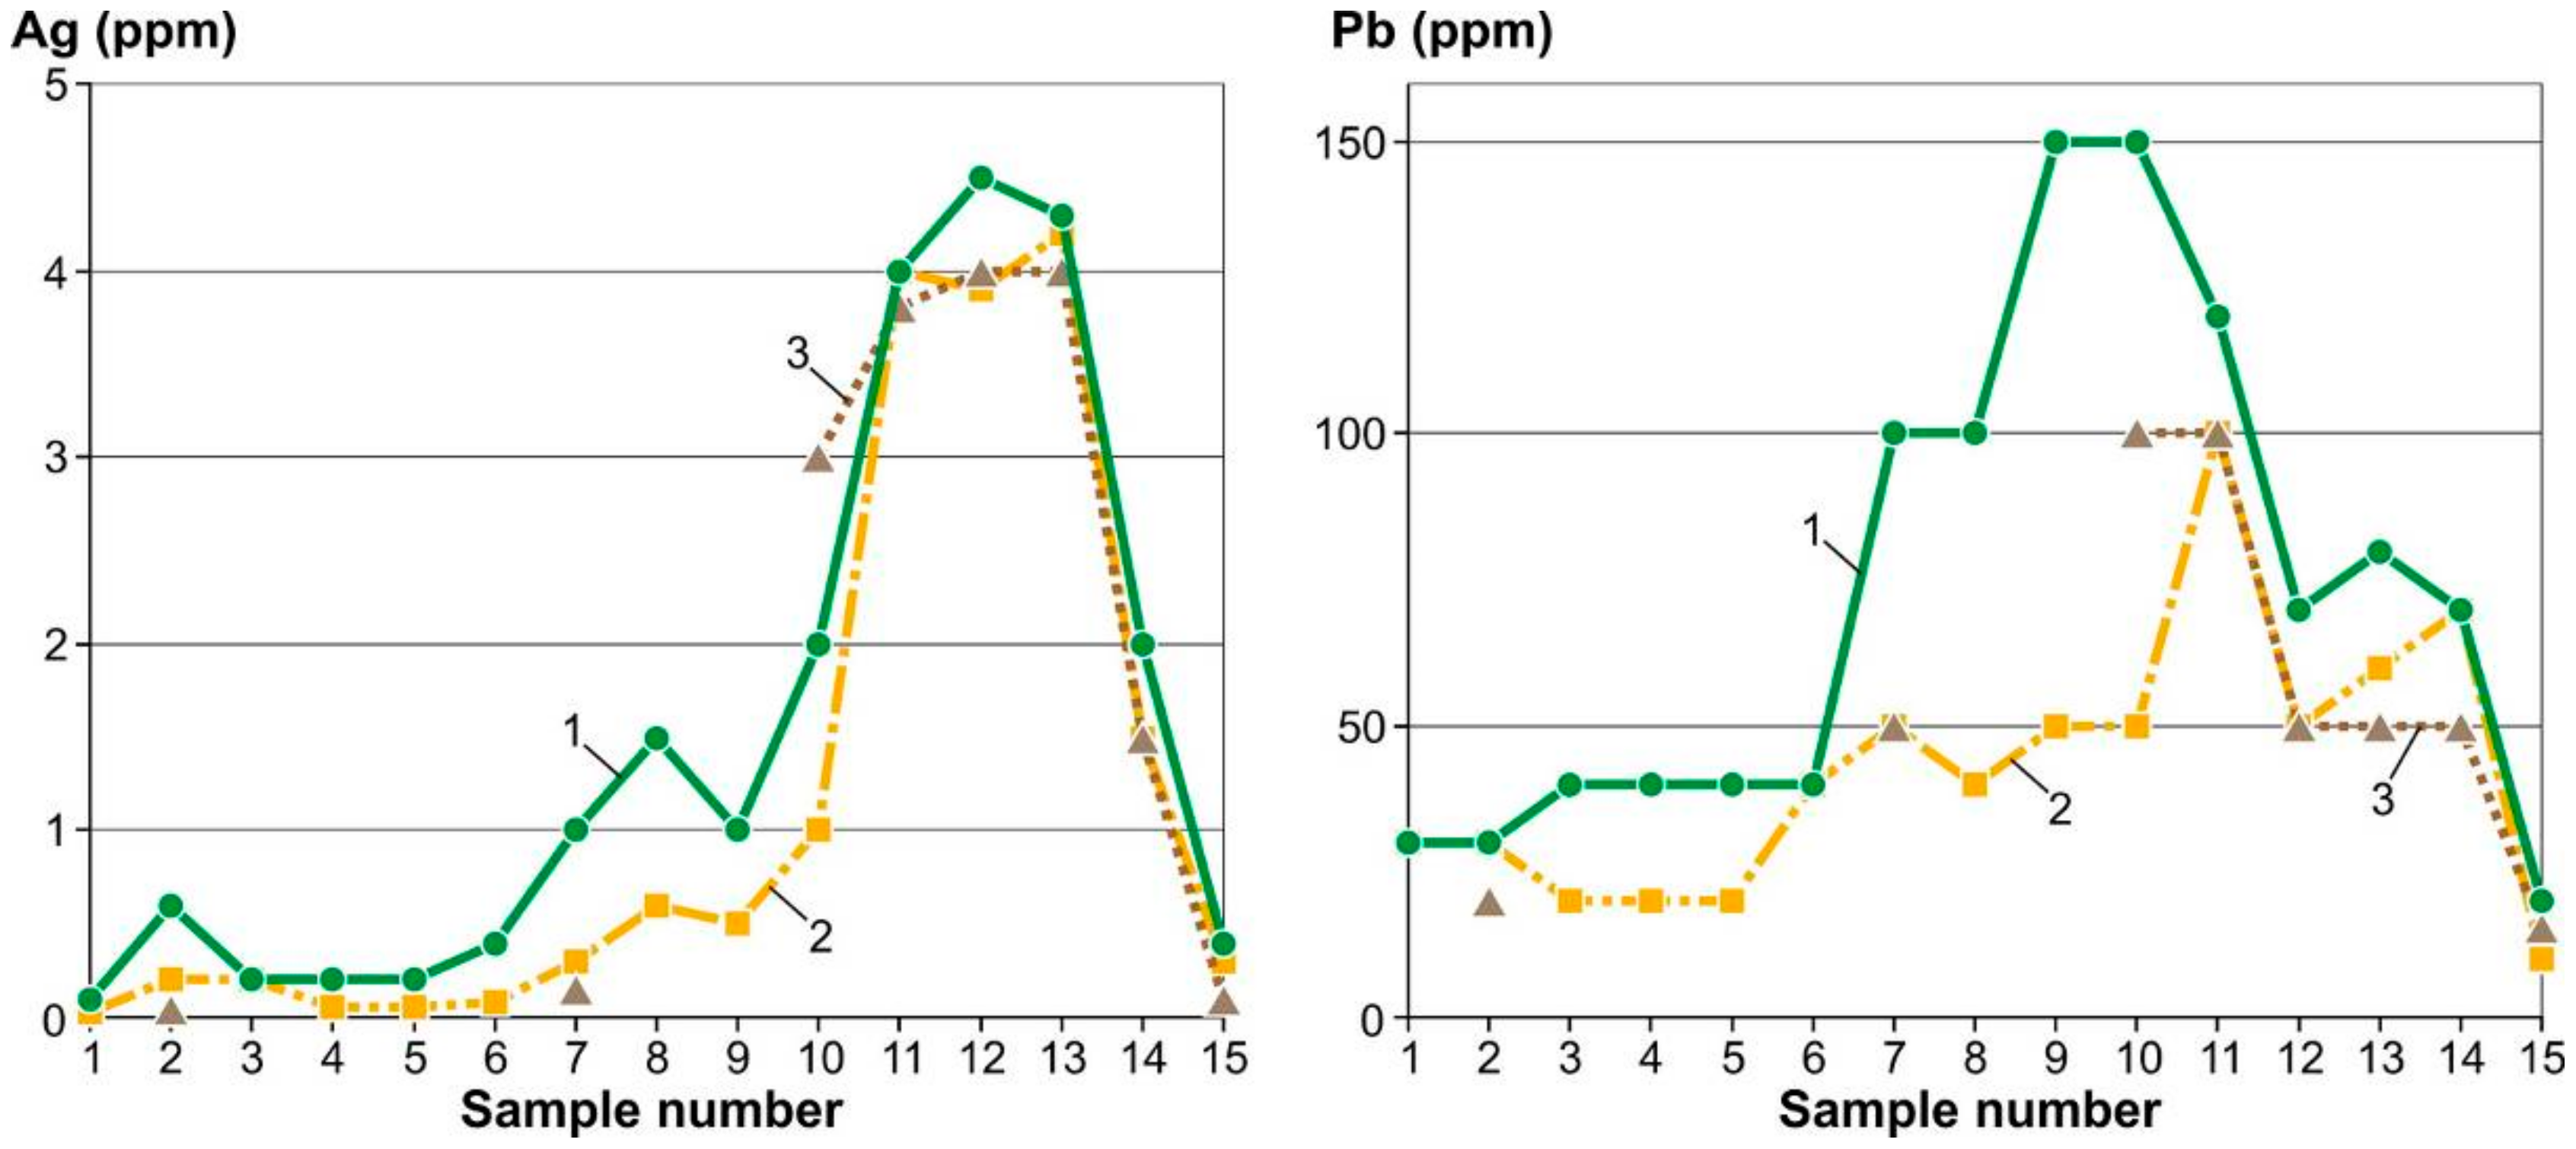
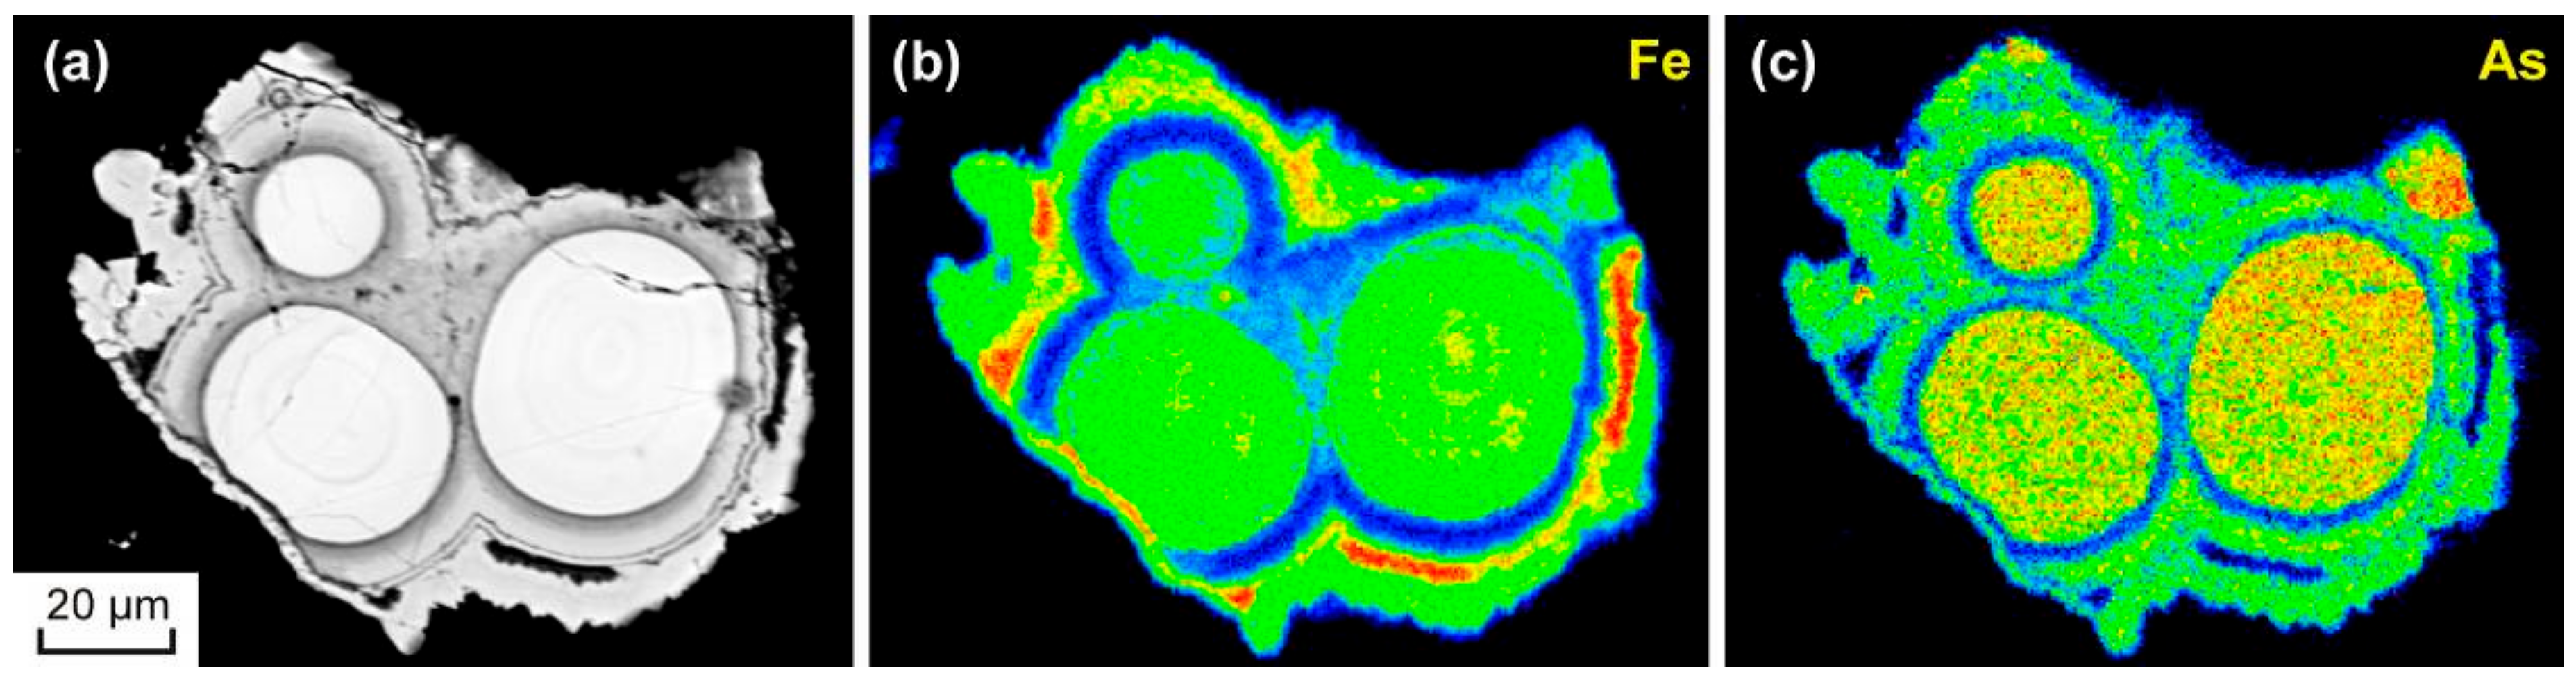
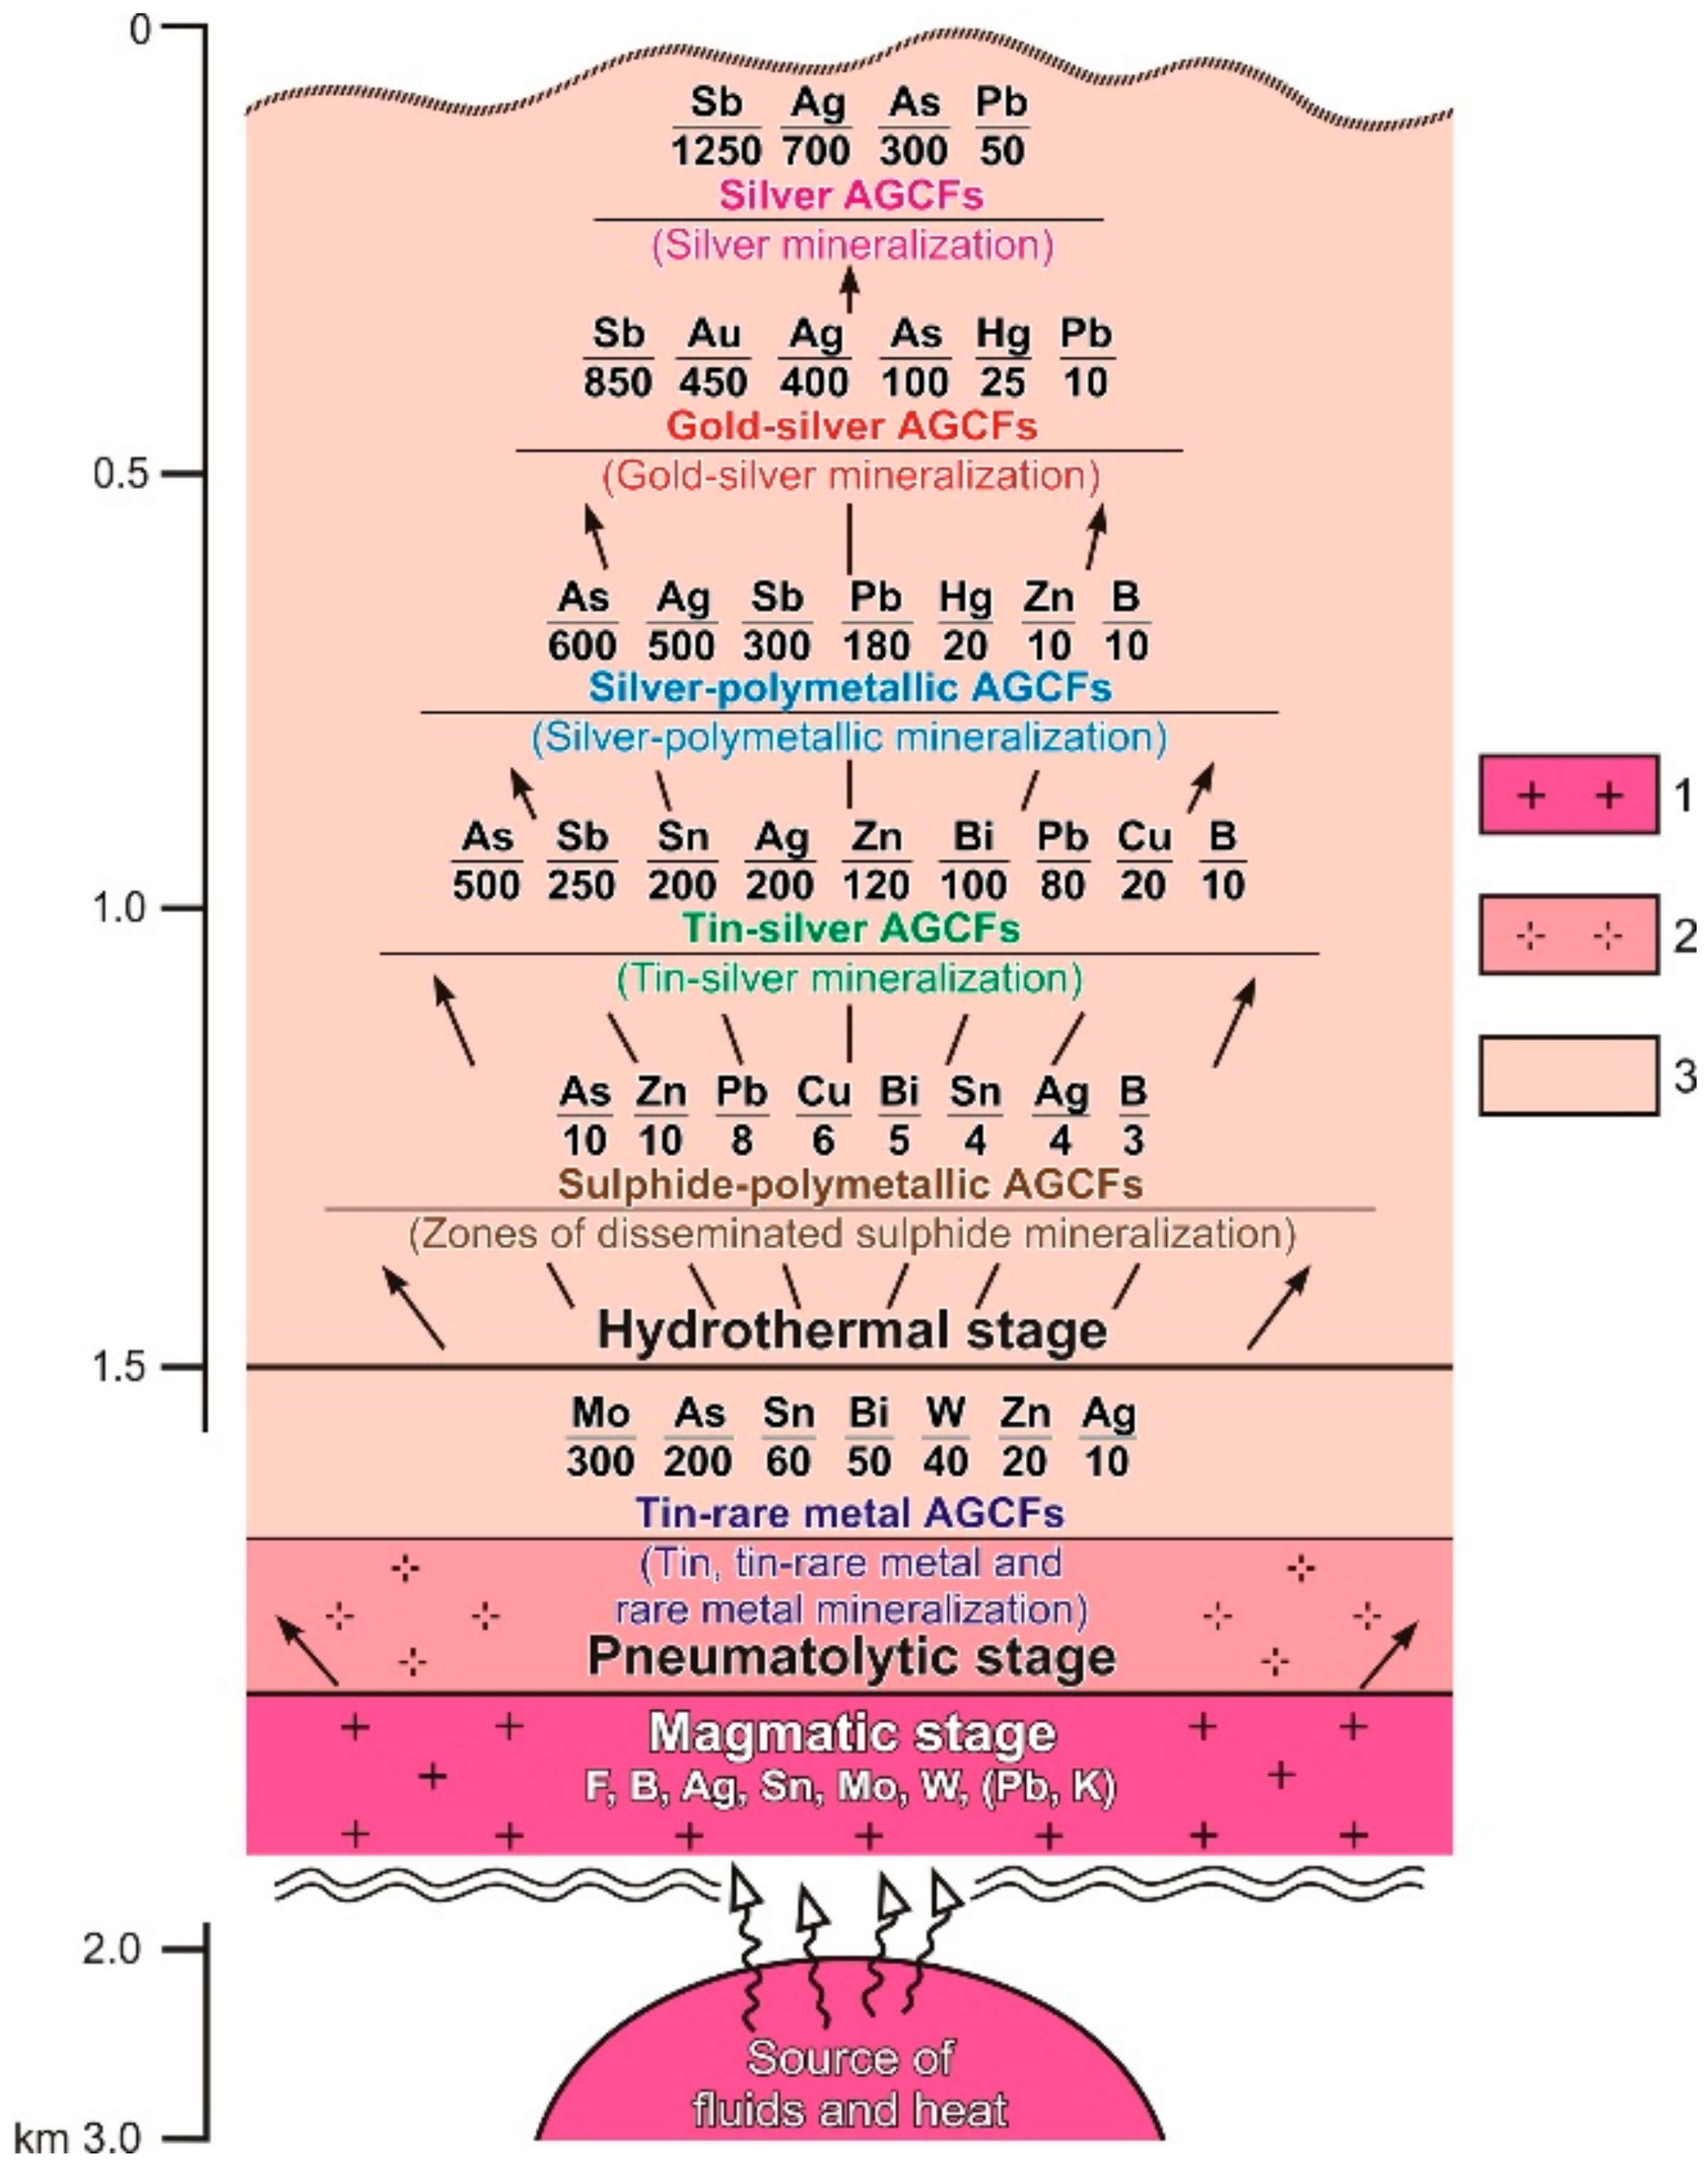
Table 1.
Average element contents (ppm).
| Element | Cb | In Average Rocks | In Acidic Rocks | In the Crust | ||
|---|---|---|---|---|---|---|
| 1 | 2 | 3 | 4 | 5 | 6 | |
| Ag | 0.1 | 0.07 | 0.05 | 0.07 | 0.0n | 0.07 |
| Hg | 0.05 | - | 0.08 | 0.083 | 0.n | 0.08 |
| Sb | 0.2 | 0.2 | 0.26 | 0.5 | 0.n | 0.2 |
| As | 2 | 2.4 | 1.5 | 1.7 | n | 1.8 |
| Pb | 10 | 15 | 20 | 16 | 20 | 12.5 |
| Zn | 50 | 72 | 60 | 83 | 40 | 70 |
| Cu | 10 | 35 | 20 | 47 | 100 | 55 |
| Mo | 1 | 0.9 | 1 | 1.1 | n | 1.5 |
| W | 1 | 1 | 1.5 | 1.3 | 50 | 1.5 |
| Sn | 2 | - | 3 | 2.5 | n | 2 |
| Bi | 0.1 | 0.01 | 0.01 | 0.009 | 0.0n | 0.17 |
| B | 10 | 15 | 15 | 12 | 10 | 10 |
Table 2.
The Pestrinsk SBS. Associations of elements (survey of SSs at 1:200,000 scale).
| No. | Element Associations |
|---|---|
| Ag–Pb | |
| 1 | Pb (280/28), Ag (1.5/15), Bi (1.5/15), Zn (750/15), Sn (18/9), B (70/7), Cu (50/5) |
| 2 | Bi (2.7/27), As (32/16), Pb (90/9), Ag (0.8/8), Zn (350/7), B (60/6), Cu (60/6), Sn (8/4) |
| 3 | Bi (2.4/24), Pb (80/8), B (60/6), Zn (250/5), Ag (0.4/4), Sn (8/4), Cu (40/4) |
| Sn–Ag | |
| 4 | As (360/180), Bi (9/90), Sn (60/30), B (150/15), Pb (150/15), Zn (750/15), Ag (0.9/9), Cu (90/9) |
| 5 | As (420/210), Bi (13/130), Sn (32/16), B (140/14), Zn (550/11), Cu (90/9), Pb (90/9), Ag (0.8/8) |
| 6 | Bi (6/60), As (80/40), Sn (30/15), Zn (600/12), Pb (110/11), Ag (1/10), Cu (70/7), B (60/6) |
| Sn | |
| 7 | As (880/440), Bi (16.5/165), Sn (230/115), B (190/19), W (14/14), Zn (650/13), Cu (110/11), Pb (70/7), Ag (0.4/4) |
| 8 | As (260/130), Bi (8.5/85), Sn (60/30), B (120/12), Zn (600/12), Pb (90/9), Cu (80/8), W (6/6), Mo (3/3), Ag (0.3/3) |
| 9 | As (280/140), Bi (8.5/85), Sn (24/12), Pb (100/10), B (100/10), Cu (90/9), Zn (350/7), W (5/5), Mo (3/3), Ag (0.3/3) |
| 10 | Bi (4/40), As (60/30), Sn (16/8), B (80/8), Zn (350/7), Pb (70/7), Cu (50/5), Mo (3/3), Ag (0.3/3) |
| Sn–W and Mo–W | |
| 11 | As (460/230), Bi (11/110), W (14/14), Sn (26/13), Cu (120/12), B (110/11), Pb (100/10), Zn (400/8), Ag (0.7/7) |
| 12 | Bi (4/40), As (46/23), W (15/15), B (120/12), Zn (350/7), Sn (12/6), Pb (60/6), Cu (60/6), Ag (0.4/4) |
| 13 | Bi (6/60), As (100/50), Sn (20/10), W (10/10), Mo (7/7), Pb (70/7), Zn (350/7), Cu (60/6), B (40/4), Ag (0.3/3) |
| Variable composition in ZDSM | |
| 14 | As (34/17), Bi (1/10), Pb (60/6), Zn (250/5), Cu (50/5), B (50/5), Sn (6/3), Ag (0.3/3), Mo (3/3) |
| 15 | W (5/5), Zn (200/4), Cu (40/4), B (40/4) |
| 16 | As (200/100), Cu (60/6), Zn (250/5), B (40/4), Mo (3/3) |
Note: Due to the insufficient detection limit of the spectral semiquantitative analysis (SSQA) method, Sb could not be determined in all element associations (<20 ppm, CR < 100); for As, only contents >30 ppm (CR > 15) are shown.
Table 3.
The Pestrinsk SBS. Associations of elements (survey of SSs at a 1:50,000 scale).
| No. | Element Associations |
|---|---|
| Ag–Pb | |
| 1 | Ag (3.7/37), Pb (100/10), B (60/6) |
| 2 | Ag (2.3/23), B (100/10), Pb (60/6), Hg (0.3/6) |
| 3 | Ag (1.5/15), Pb (100/10), B (100/10), Sn (10/5), Hg (0.15/3) |
| 4 | Ag (0.9/9), B (80/8), Pb (60/6), Sn (10/5), Bi (0.3/3) |
| 5 | B (80/8), Ag (0.6/6), Pb (50/5), Sn (10/5), Bi (0.4/4) |
| 6 | B (50/5), Pb (40/4), Ag (0.4/4), Sn (8/4) |
| Sn–Ag | |
| 7 | As (60/30), Ag (2.6/26), Bi (1.9/19), Sn (20/10), Cu (90/9), B (70/7), Pb (50/5), Zn (250/5), Mo (5/5), |
| 8 | As (24/12), Bi (1.1/11), Ag (1/10), B (80/8), Sn (14/7), Pb (60/6), Cu (30/3) |
| 9 | Ag (0.6/6), Sn (10/5), B (50/5), Bi (0.5/5), Pb (40/4) |
| 10 | As (22/11), Pb (70/7), B (70/7), Sn (10/5), Bi (0.4/4), Ag (0.4/4), Zn (150/3), Cu (30/3) |
| 11 | As (150/75), Ag (2.3/23), Cu (160/16), Bi (1.5/15), Sn (18/9), B (90/9), Pb (50/5), Zn (200/4), Mo (3/3) |
| 12 | Sb (34/170), As (200/100), Sn (36/18), Bi (1.7/17), Cu (120/12), Ag (1/10), B (90/9), Pb (70/7), Zn (200/4) |
| Sn | |
| 13 | Sn (190/95), As (130/65), Pb (220/22), B (130/13), Bi (1.1/11), Zn (350/7), Ag (0.6/6), Cu (50/5) |
| 14 | As (160/80), Sn (36/18), Bi (1.5/15), B (140/14), Cu (80/8), Pb (60/6), Ag (0.6/6), Zn (250/5) |
| 15 | As (120/60), B (180/18), Bi (1.7/17), Sn (30/15), Pb (90/9), Cu (40/4), Zn (200/4), Ag (0.3/3) |
| 16 | As (90/45), Bi (3.8/38), B (150/15), Sn (10/5), Cu (40/4), Pb (30/3), Zn (150/3) |
| 17 | Bi (1.7/17), As (24/12), B (110/11), Sn (10/5), Cu (40/4) |
| Sn–W and Mo–W | |
| 18 | As (36/18), Bi (1.1/11), B (100/10), W (6/6), Sn (8/4), Cu (40/4) |
| 19 | As (34/17), Bi (1.4/14), Mo (5/5), Sn (8/4), Cu (30/3), B (30/3) |
| 20 | As (200/100), Sn (76/38), B (200/20), Bi (1.3/13), Cu (50/5), W (4/4), Pb (40/4), Zn (150/3) |
| 21 | As (170/85), Bi (2/20), B (150/15), Cu (60/6), Sn (10/5), Mo (5/5), W (4/4) |
| Variable composition in ZDSM | |
| 22 | As (24/12), Pb (120/12), B (50/5), Zn (200/4), Sn (8/4), Cu (30/3) |
| 23 | Bi (1.1/11), B (80/8), Sn (10/5), Hg (0.15/3) |
| 24 | B (50/5), Sn (8/4), Bi (0.3/3) |
| 25 | B (50/5) |
Note: For Sb and As, only contents >30 ppm (CR > 150) and >20 ppm (CR > 10) are shown, respectively, in element associations, due to their insufficient detection limit by the SSQA method.
Table 4.
Comparative characteristics of qualitative and quantitative relationships in a sequence of endogenous AGCFs → exogenous AGCFs for mineralization of the Pestrinsk SBS.
Table 4.
Comparative characteristics of qualitative and quantitative relationships in a sequence of endogenous AGCFs → exogenous AGCFs for mineralization of the Pestrinsk SBS.
| Mineralization Type | AGCFs’ Types | |||
|---|---|---|---|---|
| Endogenous (Ores + Primary Halos) | Exogenous (Secondary Halos) | Exogenous (Stream Sediments, Survey at a 1:200,000 Scale) | Exogenous (Stream Sediments, Survey at a 1:50,000 Scale) | |
| Ag–Pb (Goltsovy deposit) | Sb (140/700), Ag (40/400), Pb (2600/260), As (180/90), Hg (0.8/16), B (80/8), Zn (250/5), Bi (0.5/5), Sn (8/4) | Ag (20/200), Sb (20/100), Pb (500/50), As (30/15), Hg (0.35/7), B (50/5) | Ag (1.1/11), Pb (100/10), B (90/9), Sn (12/6), Zn (300/6), Cu (30/3) | Ag (1.8/18), Pb (90/9), B (90/9), Sn (10/5), Hg (0.15/3) |
| Sn–Ag (Goltsovy deposit) | As (300/150), Sb (20/100), Sn (200/100), Ag (8/80), Bi (4/40), Zn (1500/30), Pb (300/30), B (200/20), Cu (100/10) | Ag (5/50), Sn (40/20), As (40/20), Bi (0.8/8), Zn (400/8), Pb (80/8), B (60/6), Cu (40/4) | As (90/45), Bi (2/20), Sn (22/11), Zn (500/10), Pb (100/10), B (100/10), Ag (0.7/7), Cu (50/5) | As (66/33), Ag (2.5/25), Bi (2.3/23), Sn (24/12), Cu (80/8), B (70/7), Zn (300/6), Pb (50/5) |
| Sn–W (Kalyan prospect) | W (1100/1100), As (500/250), Bi (17.5/175), Sn (130/65), Mo (10/10) | W (600/600), As (130/65), Bi (3.5/35), Sn (20/10), Mo (6/6) | Bi (4.3/43), As (72/36), W (15/15), B (120/12), Sn (16/8), Zn (300/6), Cu (60/6), Pb (60/6), Ag (0.4/4) | As (36/18), Bi (1.1/11), B (100/10), W (6/6), Sn (8/4), Cu (40/4) |
Note: In the numerator, the average element concentrations (ppm) in the maximum anomalous geochemical fields are given; in the denominator, the average values of their CR are given. Bold indicates the main elements of each type of mineralization. For Sb and As, only contents >20 ppm (CR > 100) and >30 ppm (CR > 15) are shown, respectively, due to the insufficient detection limit of these elements. A comparison of the qualitative and quantitative composition of AGCFs related to Sn mineralization is not given, as the authors of the article did not study primary and secondary halos for this type of mineralization.
Table 5.
The Piritovy Ag–Pb prospect. Distribution of Ag particles by diameter in bryolithochemical and lithochemical samples taken along a I-order watercourse (Pyritovy stream).
Table 5.
The Piritovy Ag–Pb prospect. Distribution of Ag particles by diameter in bryolithochemical and lithochemical samples taken along a I-order watercourse (Pyritovy stream).
| Particle Diameter, μm | Number of Ag Particles | ||
|---|---|---|---|
| 1 | 2 | 3 | |
| 3–7 | >> | 932 | 1612 |
| 7–11 | >> | 829 | 1305 |
| 11–15 | >> | 352 | 193 |
| 15–18 | >> | 159 | 90 |
| 18–25 | >> | 28 | 28 |
| Total number of particles | >> | 2300 | 3228 |
| Average Ag content (ppm) | 26.5 | 4.4 | 3.3 |
| Sample number | 19 | 19 | 16 |
Note: 1—bryolithochemical samples, 2—lithochemical samples from the moss cushion, and 3—lithochemical samples. The “>>” sign indicates that the number of particles was off the scale. Results of scintillation emission semi-quantitative analysis (analyst: S.I. Prokopchuk).
Publisher’s Note: MDPI stays neutral with regard to jurisdictional claims in published maps and institutional affiliations. |
© 2021 by the authors. Licensee MDPI, Basel, Switzerland. This article is an open access article distributed under the terms and conditions of the Creative Commons Attribution (CC BY) license (http://creativecommons.org/licenses/by/4.0/).
Share and Cite
MDPI and ACS Style
Makshakov, A.S.; Kravtsova, R.G. Stream Sediments of the Pestrinsk Silver-Bearing System (Northeastern Russia). Minerals 2021, 11, 65. https://doi.org/10.3390/min11010065
AMA Style
Makshakov AS, Kravtsova RG. Stream Sediments of the Pestrinsk Silver-Bearing System (Northeastern Russia). Minerals. 2021; 11(1):65. https://doi.org/10.3390/min11010065
Chicago/Turabian StyleMakshakov, Artem S., and Raisa G. Kravtsova. 2021. "Stream Sediments of the Pestrinsk Silver-Bearing System (Northeastern Russia)" Minerals 11, no. 1: 65. https://doi.org/10.3390/min11010065
Note that from the first issue of 2016, this journal uses article numbers instead of page numbers. See further details here.