Stochastic Uncertainty in a Dam-Break Experiment with Varying Gate Speeds


School of Environment and Society, Tokyo Institute of Technology, Tokyo 152-8550, Japan
*
Author to whom correspondence should be addressed.
J. Mar. Sci. Eng. 2021, 9(1), 67; https://doi.org/10.3390/jmse9010067
Submission received: 5 December 2020
/
Revised: 29 December 2020
/
Accepted: 5 January 2021
/
Published: 11 January 2021
(This article belongs to the Section Ocean Engineering)
Abstract
:Uncertainties inherent in gate-opening speeds are rarely studied in dam-break flow experiments due to the laborious experimental procedures required. For the stochastic analysis of these mechanisms, this study involved 290 flow tests performed in a dam-break flume via varying gate speeds between 0.20 and 2.50 m/s; four pressure sensors embedded in the flume bed recorded high-frequency bottom pressures. The obtained data were processed to determine the statistical relationships between gate speed and maximum pressure. The correlations between them were found to be particularly significant at the sensors nearest to the gate (Ch1) and farthest from the gate (Ch4), with a Pearson’s coefficient r of 0.671 and −0.524, respectively. The interquartile range (IQR) suggests that the statistical variability of maximum pressure is the largest at Ch1 and smallest at Ch4. When the gate is opened faster, a higher pressure with greater uncertainty occurs near the gate. However, both the pressure magnitude and the uncertainty decrease as the dam-break flow propagates downstream. The maximum pressure appears within long-period surge-pressure phases; however, instances considered as statistical outliers appear within short and impulsive pressure phases. A few unique phenomena, which could cause significant bottom pressure variability, were also identified through visual analyses using high-speed camera images. For example, an explosive water jet increases the vertical acceleration immediately after the gate is lifted, thereby retarding dam-break flow propagation. Owing to the existence of sidewalls, two edge waves were generated, which behaved similarly to ship wakes, causing a strong horizontal mixture of the water flow.
1. Introduction
A dam-break flow is a type of surge that can be generated by the sudden release of water over a bed. In several branches of water engineering, a dam-break flow experiment is commonly used as a benchmark to validate the performance of a numerical model. For example, in the field of coastal engineering, this type of experiment is acknowledged as a reliable technique for evaluating the effect of a tsunami-like solitary wave on structures. The widespread use of this test is probably due in part to the fact that it can be easily equipped by attaching a movable gate to the end of an existing wave flume. A typical application of the dam-break flow test in coastal engineering is the examination of tsunami forces acting on a fixed near-shore or inland structure, such as breakwaters, coastal dikes, oil storage tanks, self-elevating seawalls, and general buildings. Relatively light-weight objects or objects subjected to a buoyancy force, such as armor brock, shipping containers, and cars, are often tested to investigate scatter or displacement caused by a tsunami impact [1,2,3,4,5,6,7]. In addition, scouring due to strong flows can be investigated in a dam-break flume [8,9].
The dynamics of the dam-break test, specifically near the gate, are particularly complex and influenced by various physical phenomena. For example, the collapse of the water column immediately after the release exhibits highly turbulent motion, which generates a mushroom-like jet [10] that may not be represented by the well-known Ritter’s solution [11]. Two-dimensional (2-D) dam-break flows are often assumed in numerical models based on the Saint–Venant equations. However, they are often not valid for the initiation of the dam break because the bore motion is fully three-dimensional (3-D) with high turbulence. Strong 3-D effects appear in regions of strong curvature, sudden constrictions, and obstacles in the channel [12,13,14]. The initial water height of the reservoir is primarily responsible for the scattering of experimental results [15]. The wave front velocity increases with decreasing water depth ratio before and after the gate [16]. With a wet-bed downstream condition, water leaps are formed downstream of the gate [17]. The dam-break wave behaves differently over rigid and erodible beds as the flow regime, and either inertial or viscous flow predominate, thereby significantly strongly influencing the dam-break inundation depth [18,19].
Numerous types of dam-break apparatus have been used experimentally. Among these, the vertical gate type mechanism is the most widely used, wherein the gate is lifted mechanically or manually with a weight and rope connection using a pulley [2,6,10,20,21]. Meanwhile, the swing gate system is gaining popularity owing to its economic advantage, particularly in the case of large-sized flumes [4,22]. The upper reservoir type is a mechanism that releases water from the top of the reservoir into a lower tank, and it has the advantage of generating waves with different hydrodynamic characteristics [5]. Similarly, a pneumatic-type dam-break generator is an advanced mechanism in which water is released instantaneously from a chamber at one end of the flume [3].
According to Lauber and Hager [12], gate lifting should be limited to a short critical time , which is calculated as
where is the initial height of the water level in the dam-break tank, and is the gravitational acceleration. A gate opening time shorter than would not be able to significantly influence the generation of a dam-break flow. von Häfen et al. [23] confirmed that the Lauber-Hager criterion provides a conservative estimation of the required gate opening time. Although experiments in previous studies describe a gate lifting speed, only a few explain the details of the dam-break mechanisms. For example, in a study by Cagatay and Kocaman [24], a gate made of Plexiglas holding 0.25 m (height) of water at rest was lifted using a 15 kg weight; for this condition, a of 0.2 s was calculated. The removal time in their experiment was estimated to be between 0.06 and 0.08 s, thus confirming that their dam-break test satisfied the criteria. Hsu et al. [16] used an automatic gate system with an air compressor, which enabled them to uplift the gate at a constant speed of approximately 1.5 m/s.
Ritter [11] derived the theory of the dam-break problem based on simplified Saint–Venant equations, excluding the effects of frictional and turbulent resistance. According to this theory, the speed of the dam-break-induced wave () is formulated as a function of gravitational acceleration () and water depth in the tank () as
However, this classical solution was not supported by experimental studies [25]. Schoklitsch [26] highlighted that dam-break experiments on a horizontal bed indicated that actual velocities for the wave front were as low as 40% of the theoretical values obtained using Ritter’s solution. To include the effect of resistance, Dressler [27] incorporated the Chezy resistance term in the momentum equation and found that resistance elevates the water surface and decreases the velocity. This effect is more predominant, particularly in the wave front. A boundary-layer phenomenon in the wave front plays a similar role to that in the steady-state flow past a body [28]. Furthermore, velocity profiles are affected by the convection and deceleration of the upper dam-break flow [29].
Although all parameters are stochastic in nature to a certain extent, previous studies often treated a dam-break flow test in a deterministic manner. In this study, the stochastic characteristics of a dam-break flow are investigated by repeating the same experimental test at different gate speeds. Multiple uncertainties are induced because of the various specifications of the dam-break flow experiment including the size, shape, and material of flume, dam-break mechanisms, and total water volume. Various errors are also caused by characteristics in measuring sensors. For example, in the case of pressure measurements, the positioning of the pressure sensor, measurement frequency, vibration, and temperature will have an effect on the final result. However, it is difficult to accurately quantify the magnitude of each error and the contribution of each factor. As it is almost impossible to derive a generalized dam-break formula while incorporating several parameters, this study focuses only on the variability in hydrodynamic pressure caused by changes in the gate opening speed.
The main objective of this study is to investigate the influence of gate opening speed on hydrodynamics and the time-series distribution of pressure. Additionally, we want to assess whether changes in gate speed cause any distinctive phenomenon or reveal any further effect. Finally, outliers that typically occurred in the measurements are addressed.
2. Materials and Methods
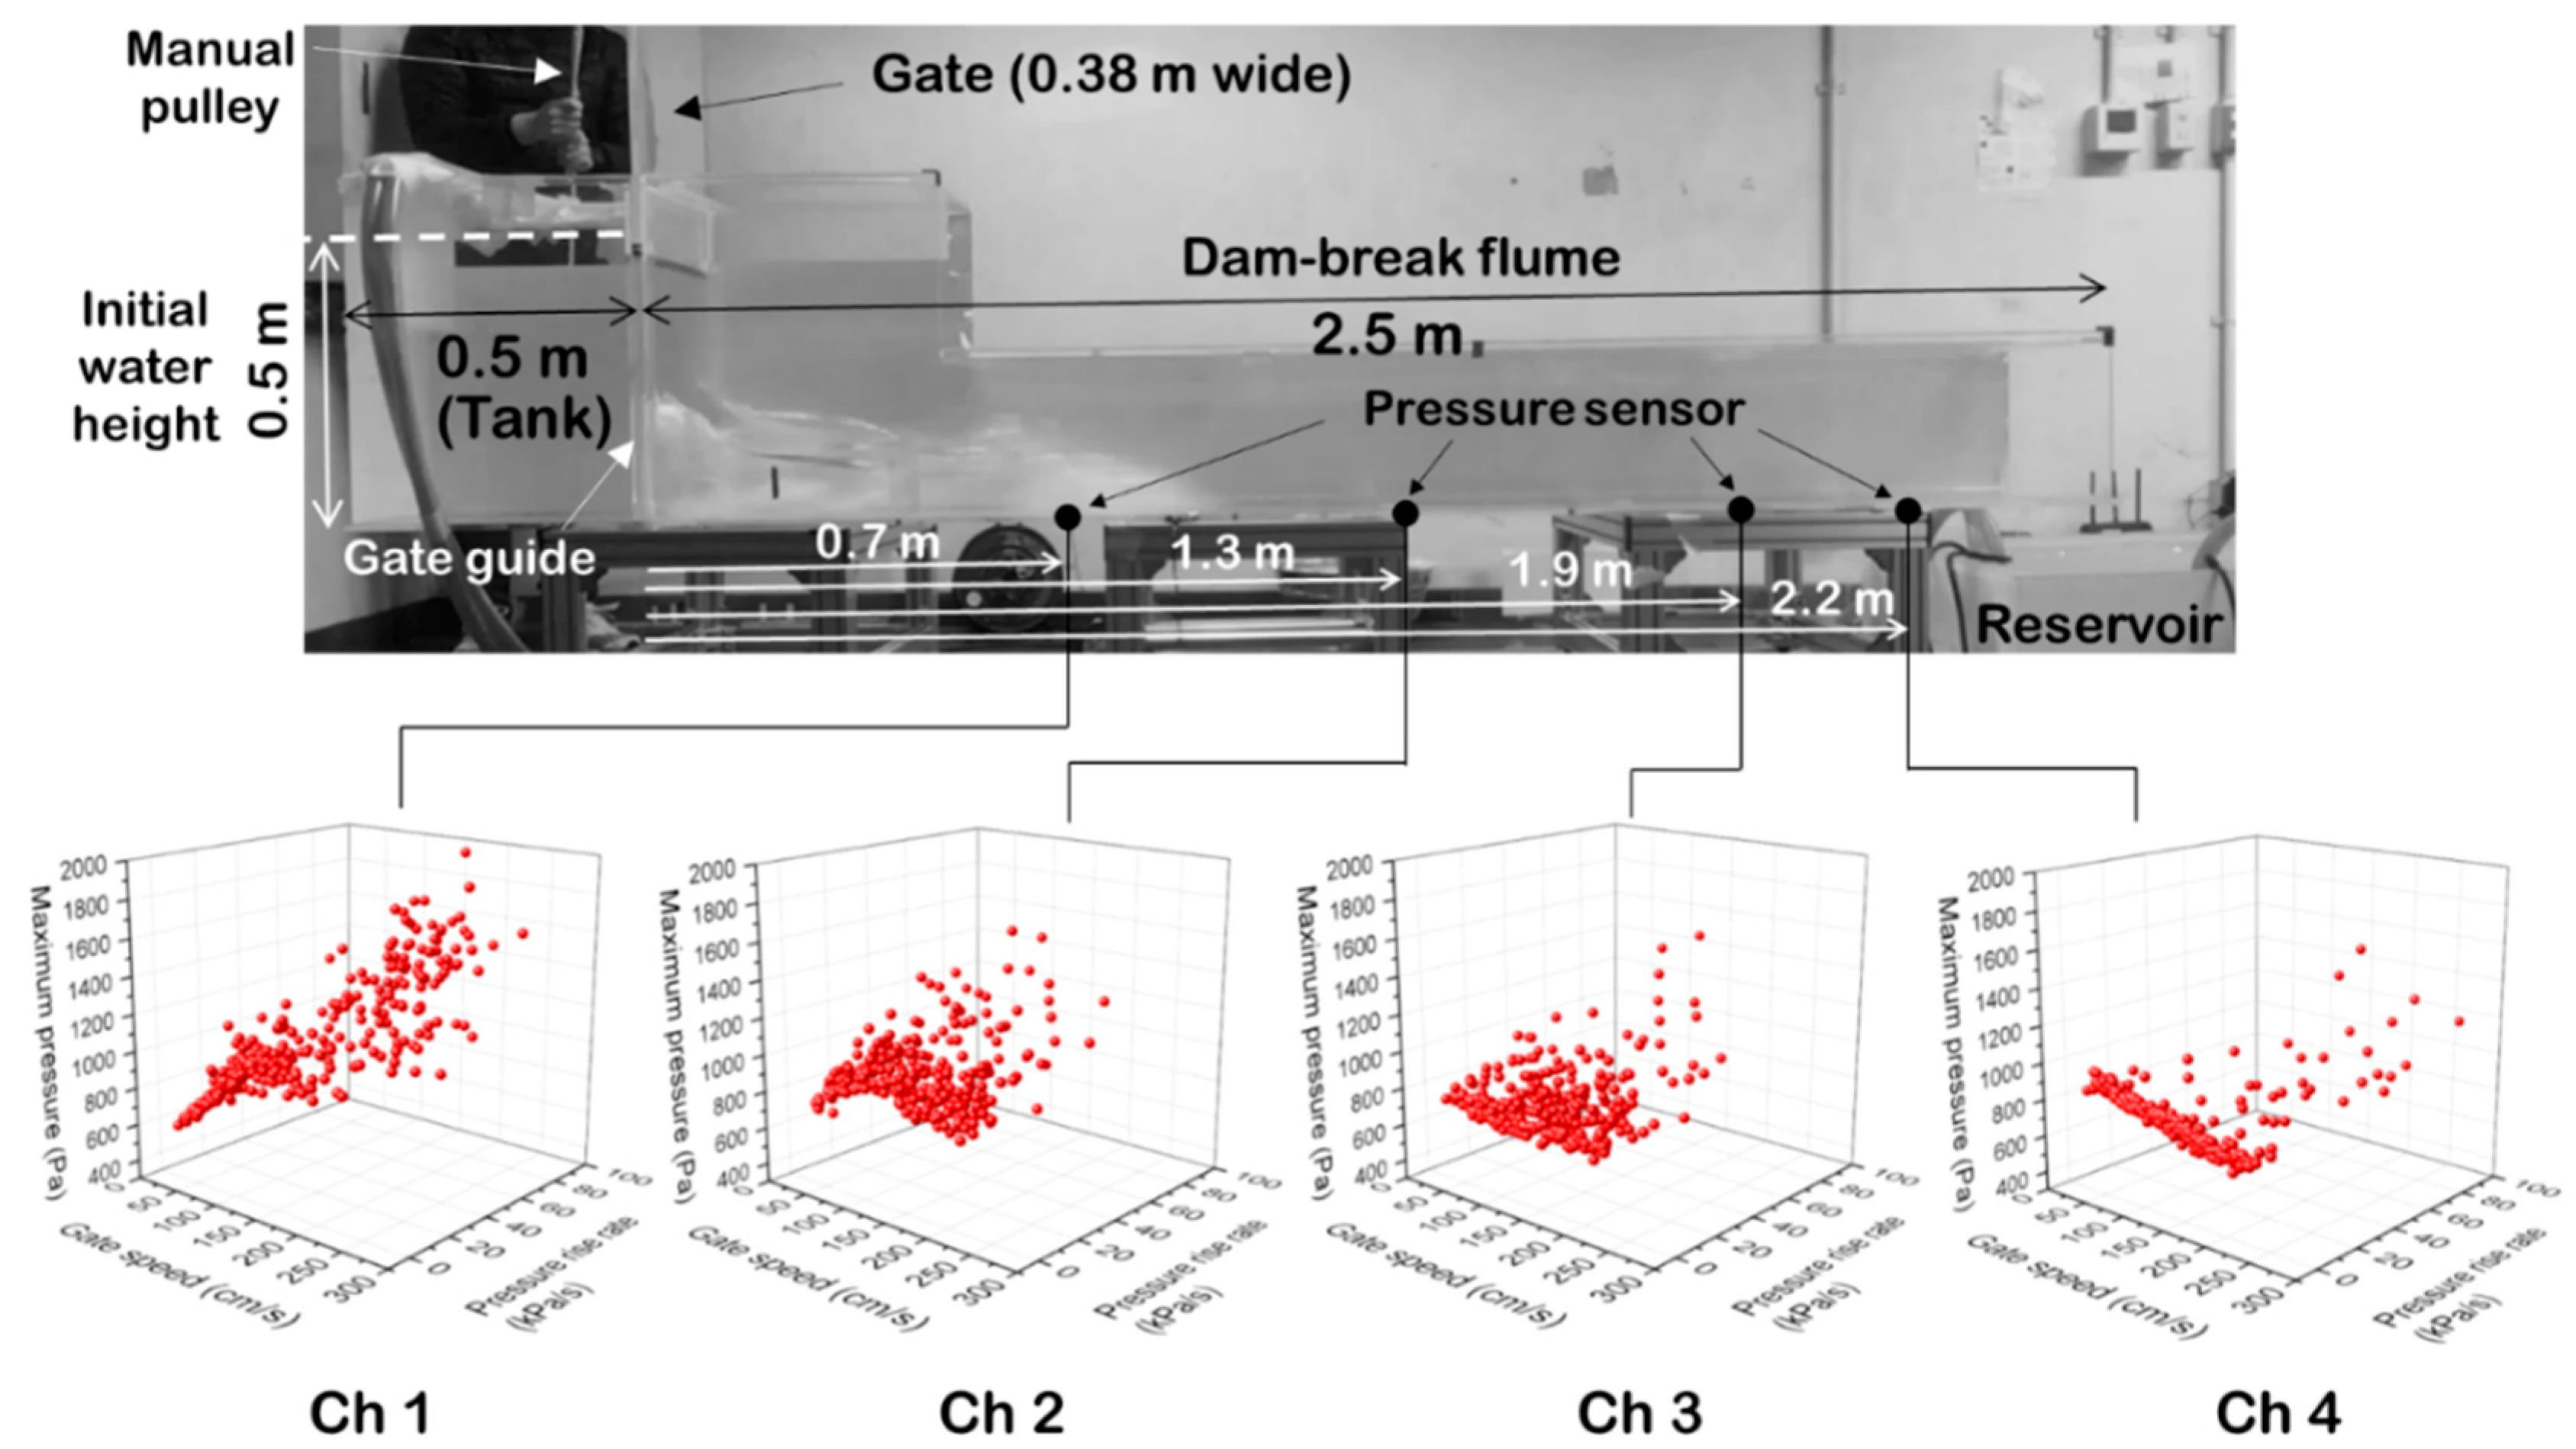
The experiment was conducted using a small acrylic discharge flume (length: 3 m; width: 0.38 m) with a 15-mm-thick vertical movable gate. The tank was mounted on three base flames whose heights could be fine-tuned to ensure the levelness of the tank. A water column (0.5 m × 0.5 m × 0.38 m) is initially maintained at rest, as shown in Figure 1. A small gap between the gate and sidewalls causes water to leak out. To reduce this leakage as much as possible, two guides are used to press the gate on each side. Thus, the present flume was equipped with a gate guide, which protruded 2 cm from the face of the sidewalls. Because the experiment started immediately after the water level in the reservoir reached a predetermined level, the effect of the leak is considered negligible. The gate was quickly lifted in the vertical direction using a rope connected to a pulley installed on the ceiling. The pulley is placed directly above the gate, and the gate is pressed between two guides so that it can be pulled vertically without wobble. The water was released and surged towards the 2.5-m-long horizontal section of the flume; thereafter, it was released into a reservoir placed beneath the end of the flume. Dam-break experiments can be performed in two different downstream floor conditions, i.e., dry-bed and wet-bed conditions. This study investigates the dam-break flow under dry-bed conditions because the event of a tsunami propagating on land is a typical application of particular interest in the coastal engineering field. Therefore, after each trial, the flume was carefully wiped and mopped to dry the bed. The dam-break flow test was repeated 290 times. The gate opening speed was intentionally changed at each trial, while the initial height of the water in the tank was maintained at 50 cm.
The precise motion of the gate was captured at a frame rate of 2400 fps using a high-speed camera (Phantom Miro LC311, Nobby Tech Ltd., Tokyo, Japan). Among the captured photos, two images—when the gate detached from the floor and from the water surface—were employed to calculate the average gate speed. A frame rate of 2400 fps is sufficiently high to detect the timing of detachment. There may be a small error due to human visual reading, but it should be within 2% (see Appendix A). The experiment was conducted 290 times with gate speeds varying in the range of 0.20–2.50 m/s, as shown in Figure 2. Four pressure sensors, referred to as Ch1–Ch4 (PS-1KD, Kyowa Co Ltd., rated capacity = 50 kPa, natural frequency = 10 kHz), were installed at 0.7, 1.3, 1.9, and 2.2 m, respectively, from the gate position on the centerline of the tank. The pressure sensors were embedded at the bottom of the acrylic board such that their faces (φ = 6 mm) were leveled with the flume bed without bumps. The pressure sensors are threaded using an R1/8 size screw, and the acrylic plate at the bottom of the tank is threaded with the same size screw, which keeps the sensors in a horizontal position. All sensors were synchronized with each other using a strain gauge converter (PCD-430A, Kyowa Co Ltd., Tokyo, Japan). The recording frequency was set at 500 Hz to capture impulsive components that comprised a short pressure signal. There are other devices available to measure the water level in the water flume, such as capacitance wave height gauges. However, the water elevation is measured by a capacitance line, making it impossible to measure a few centimeters at the tip of the line. Nevertheless, a pressure sensor can measure the water level change in the order of a few millimeters if it is properly installed at the bottom of the tank. Therefore, the pressure sensors can measure the characteristics of the dam-break wave, such as wave tip arrival time and water level, more accurately.
Two recent studies [5,6] measured dam-break pressures exerted on a vertical structure against tsunami impacts at a sampling frequency of 1 kHz. Although the sampling frequency in this study (i.e., 500 Hz) is relatively low, the peak signals of bottom pressures were sufficiently recorded, possibly because the water jet is not obstructed by any objects but merely flows on a smooth bed. The accuracy of the recorded pressure is also subject to other influencing factors, such as temperature, sensor type, and installation mechanism. The uncertainties associated with measuring sensors, which are essentially unavoidable, further justify the necessity for analyzing the measured data statistically.
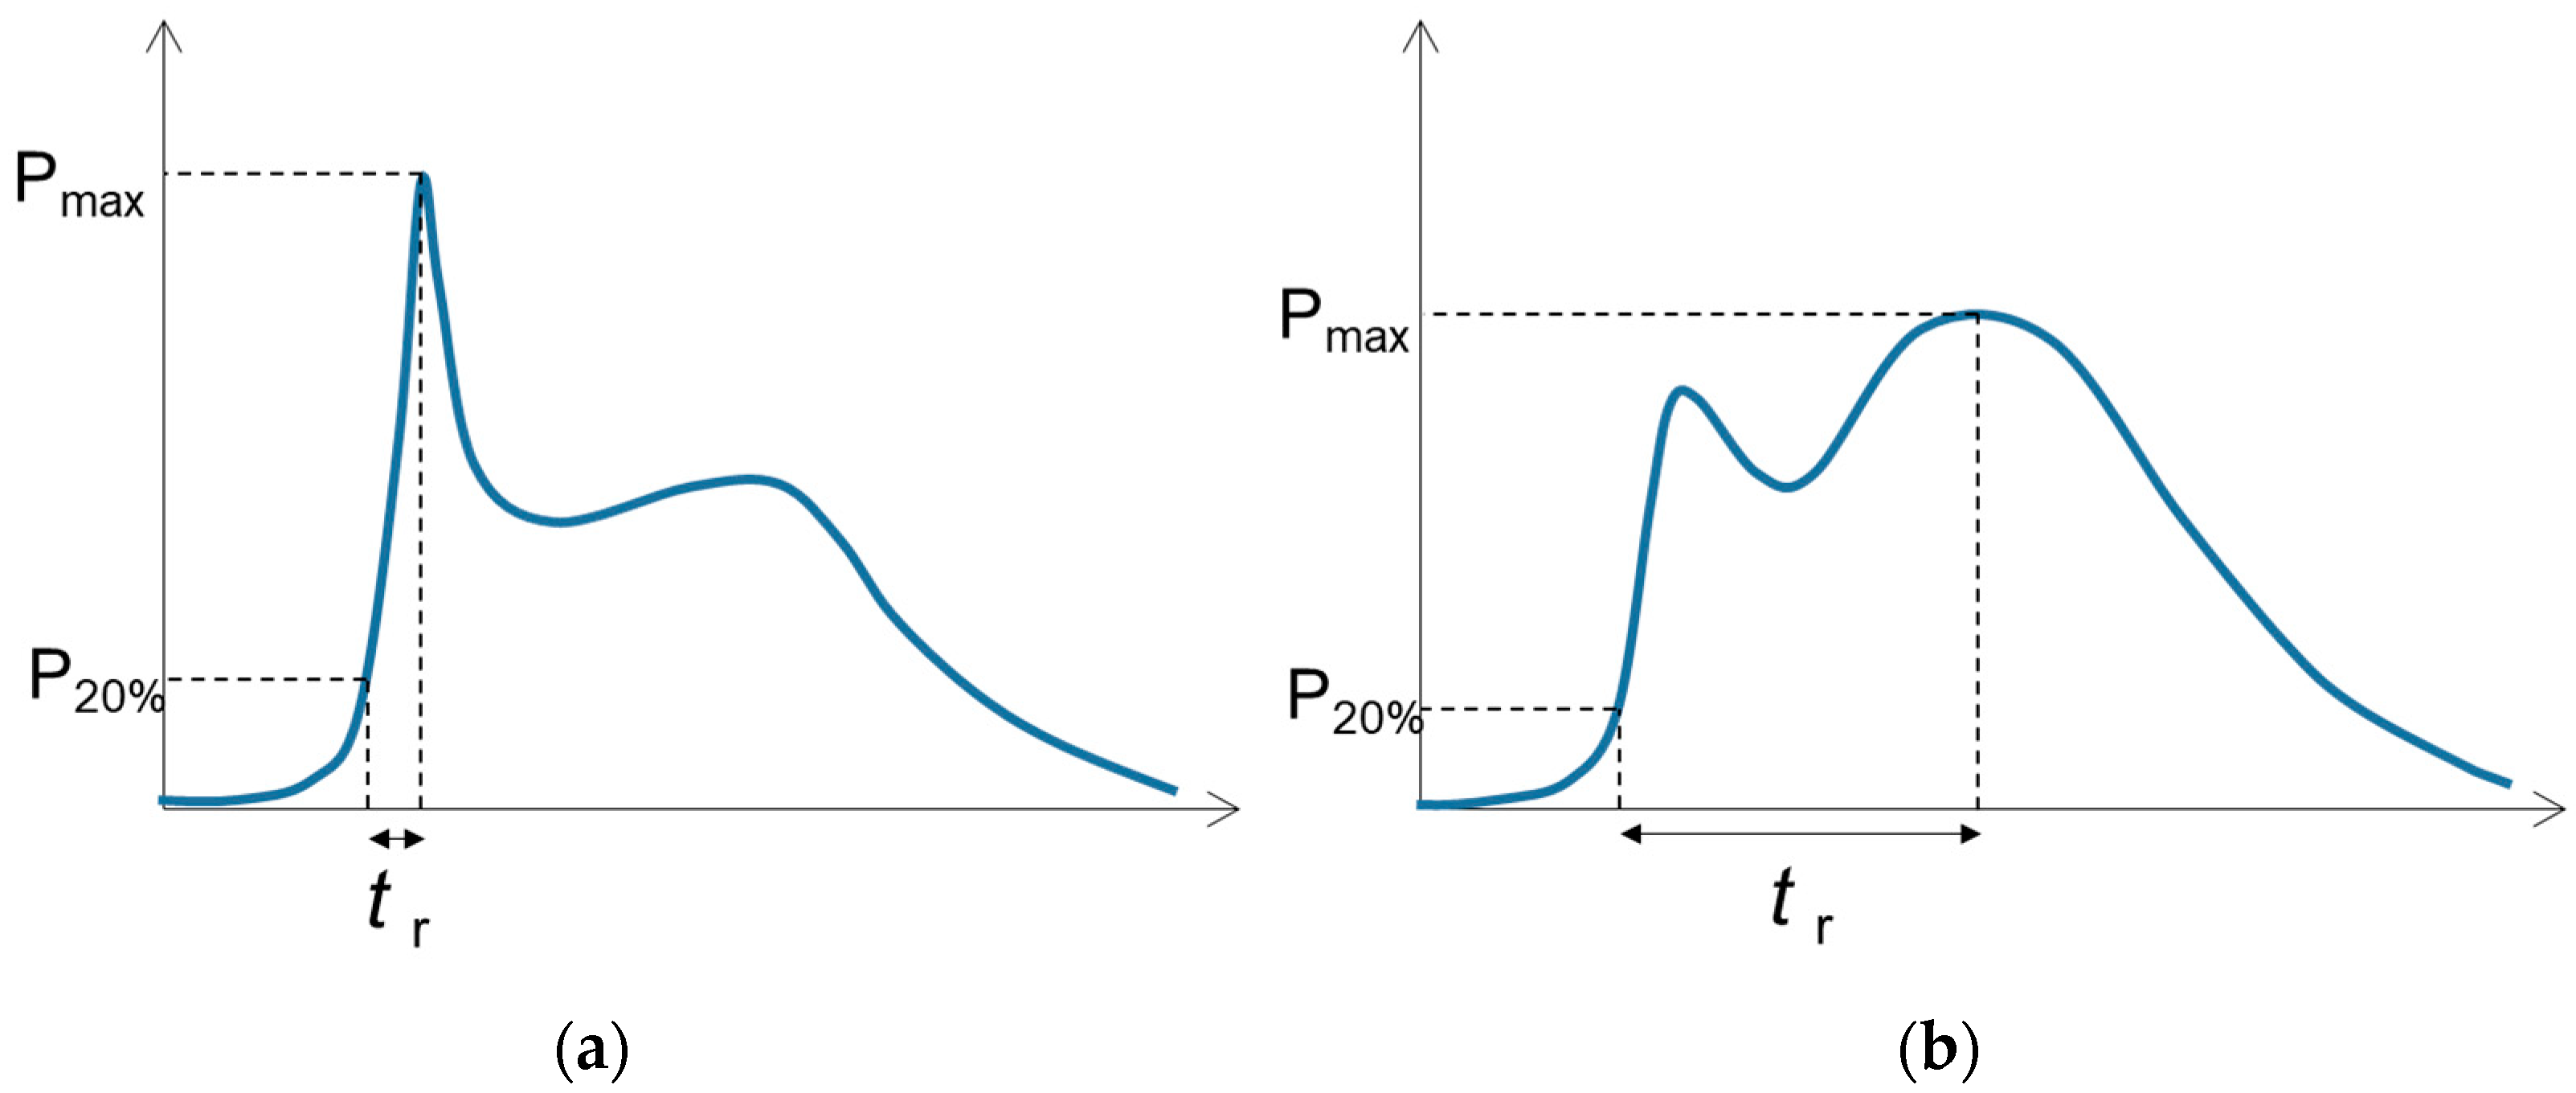
It was assumed that the maximum pressure and the pressure rise rate are two fundamental parameters used to derive statistical uncertainties involved in gate speed. In this study, pressure rise rate is defined as the maximum pressure divided by the prescribed rise time (unit: kPa/s). Rise time is defined as the duration between the time at which the pressure reaches the maximum value and 20% of the maximum value, as shown in Figure 3. A code was developed to automatically calculate . The 20% criterion was selected because the algorithm inadvertently recognized insignificant fluctuations as the pressure started to rise at smaller percentages (e.g., 10%). The sensors recorded impulsive and surge pressure components; the pressure rise rate in the impulsive component (Figure 3a was considerably lower than that in the surge component (Figure 3b), resulting in a broad range of rising rates (between 0.3–100 kPa/s).
3. Results
3.1. Statistical Analysis
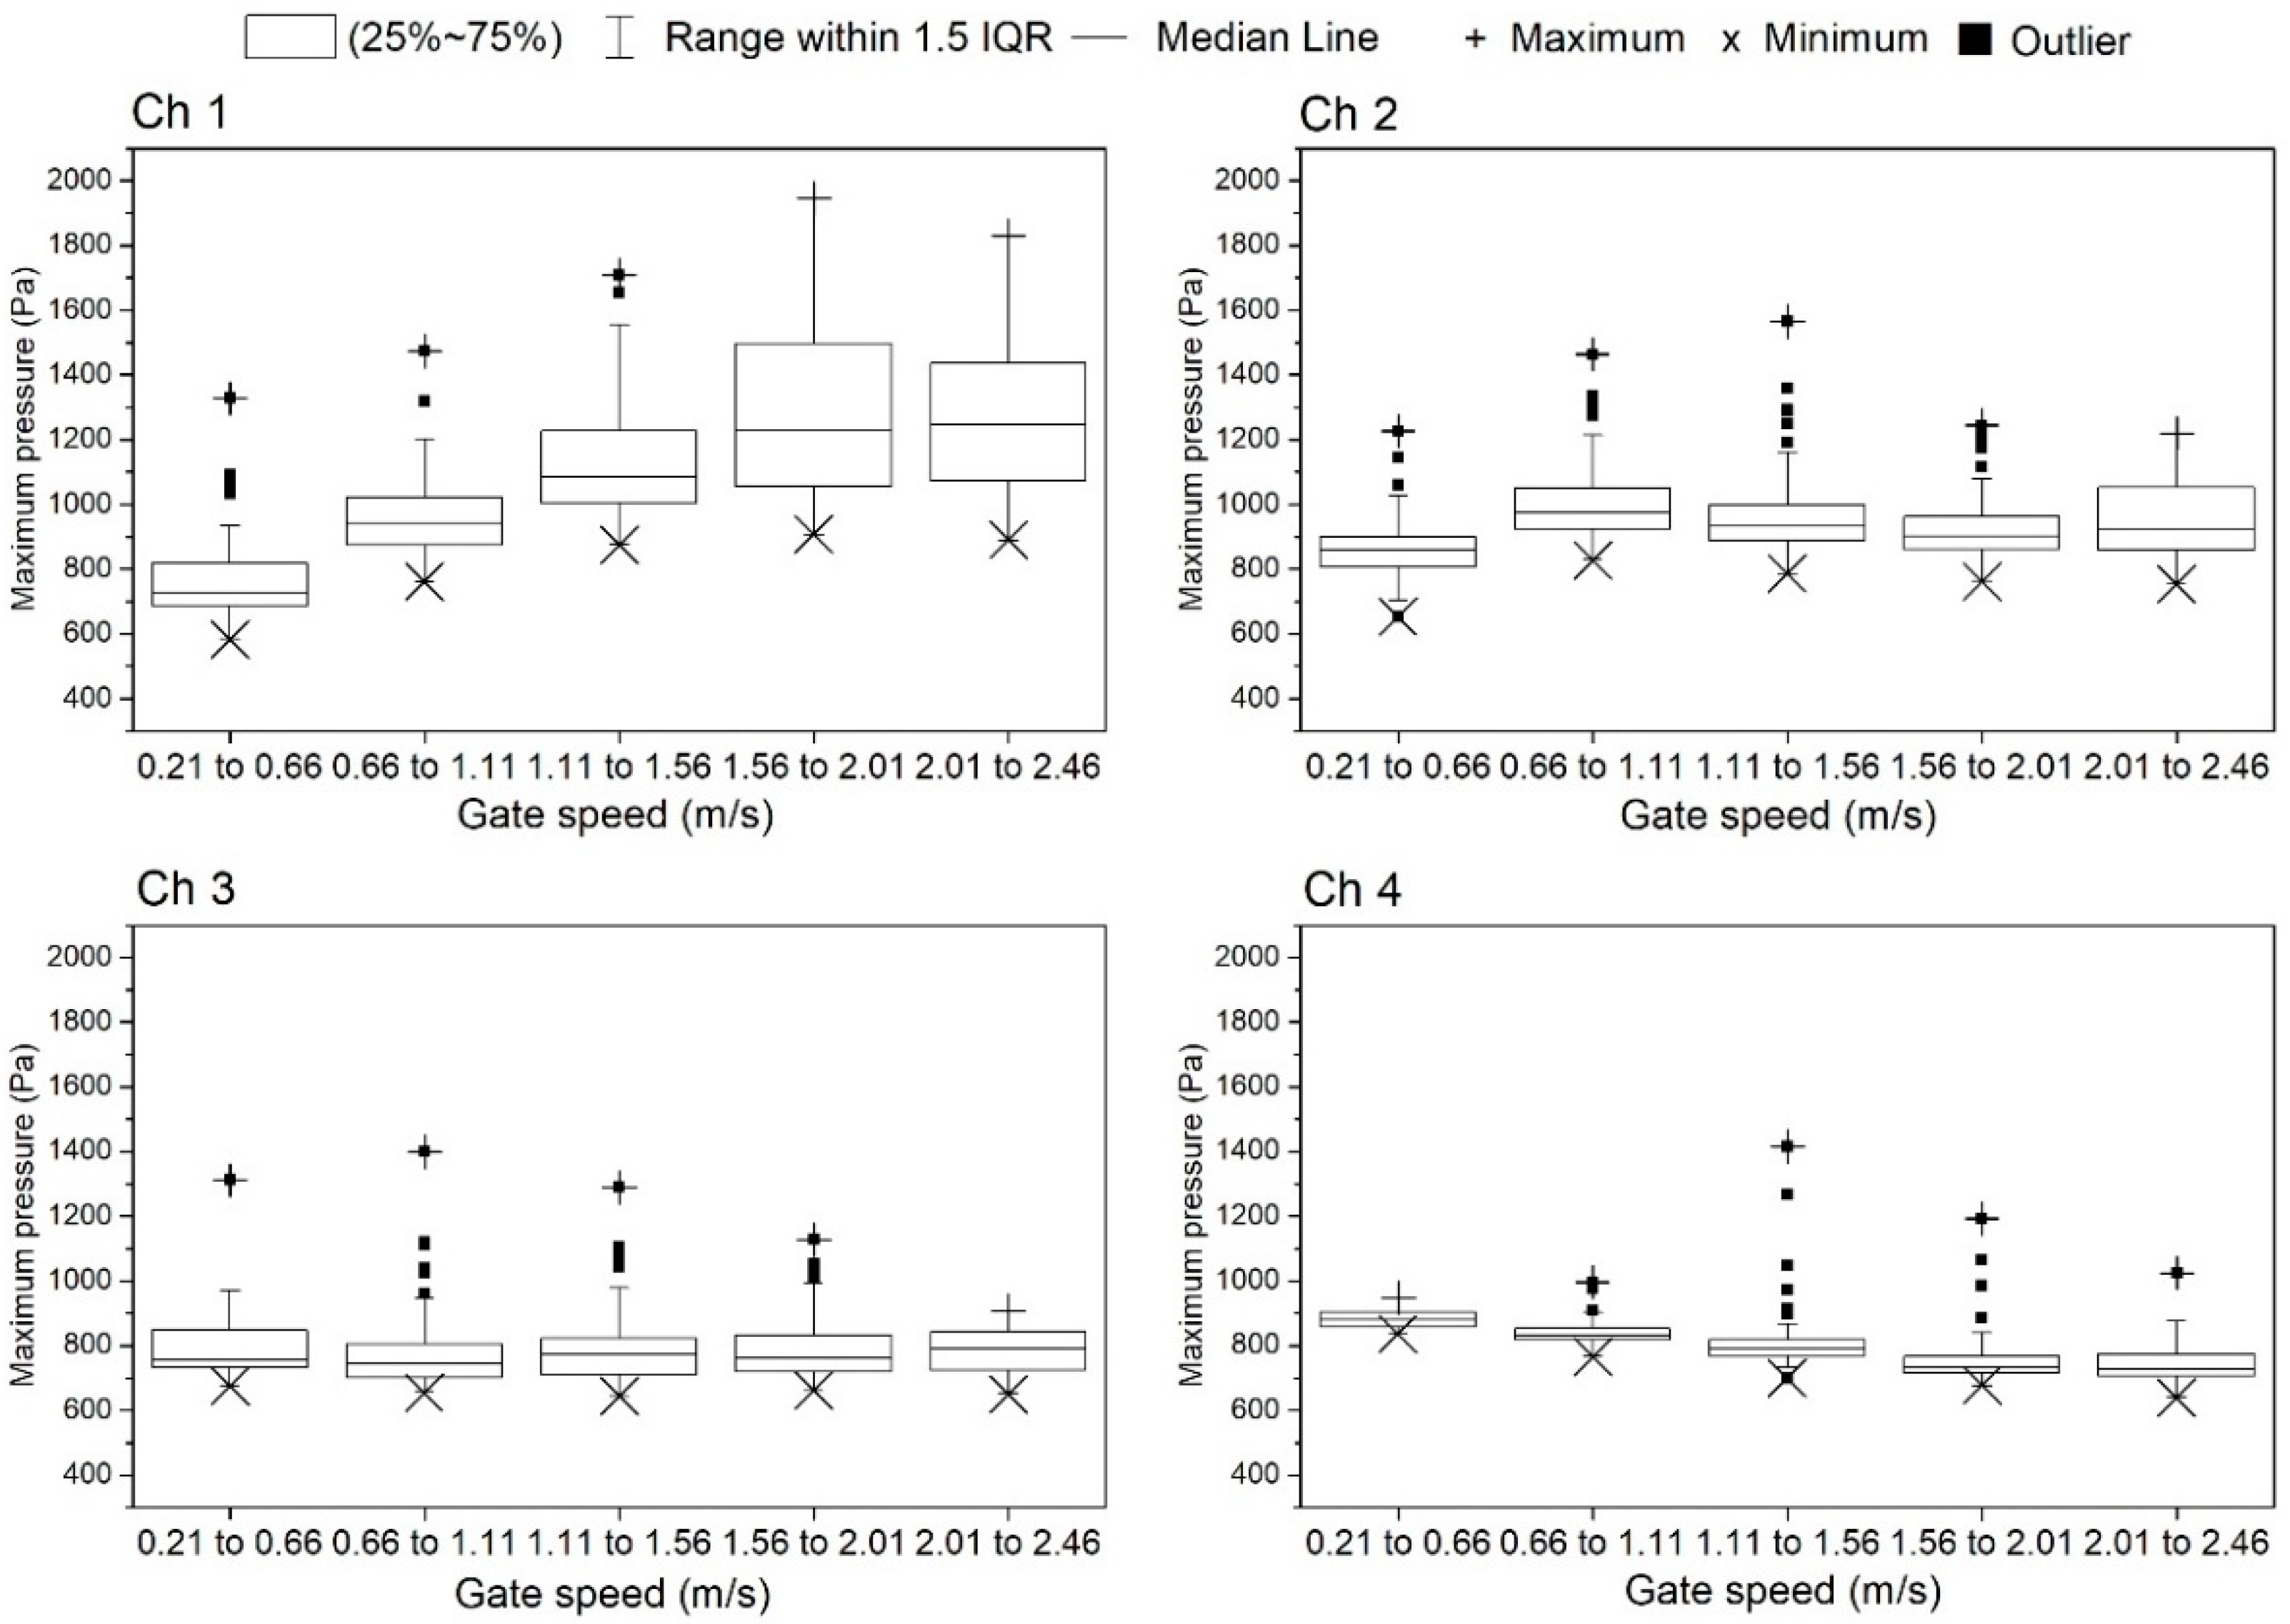
The data were classified into five sub-groups to examine whether the gate speed influenced the maximum pressure. Each group contained at least 30 samples within a bin range of 0.45 m/s. The box plot shown in Figure 4 indicates the range of the first to third quartile (Q1–Q3), referred to as the interquartile range (IQR), which represents the range in which half of the data are plotted.
The IQR was found to be the smallest in Ch4 (35–63 Pa), whereas it was the largest in Ch1 (127–433 Pa). In Ch1 (nearest to the gate), the IQR tended to increase as the gate speed increased, which implies that lifting the gate at a higher speed will induce more pressure variability. Furthermore, the maximum pressure becomes larger with an increase in gate speed. This seems to be apparent as a considerably higher amount of water instantaneously flashed when the gate was lifted faster. However, this positive trend is not observed in the data collected at Ch2, Ch3, and Ch4, which implies that the influence of gate speed on maximum pressure reduces as water propagates downstream. The Pearson’s r values for the overall correlation between gate speed and maximum pressure was calculated to be 0.671, 0.03, 0.005, and −0.524 at Ch1–Ch4, respectively (see Appendix B). The trends at Ch1 and Ch4 were particularly significant. The statistical significance at the 95% level was examined using an ANOVA test to evaluate whether the slope of the maximum pressure was different from zero. Interestingly, Ch1 and Ch4 demonstrated a similar r value, but along opposite gradients. It seems that a fast gate operation generates a more dynamical water jet, thereby promoting the dissipation of waves and decreasing water pressure in the downstream end.
The black dot in Figure 4 denotes a statistical outlier positioned above Q3 by an amount greater than 1.5 times the IQR. All figures contain a certain number of outliers. For example, 6 out of 75 samples within the group of 1.11–1.56 m/s were determined as outliers for Ch4. In addition, the data at Ch4 were plotted within a small range. Among the four channels, the largest pressure was more frequently recorded at Ch1, accounting for 62% of all samples (181 out of 290 samples), as shown in Table 1. In approximately half of the cases (149 out of 290 samples), the pressure tended to decrease as water propagated downstream (e.g., Ch1 > Ch2 > Ch3 > Ch4 or Ch1 > Ch2 > Ch4 > Ch3). However, 25 samples exhibited the largest pressure at Ch4. These exceptional data cases appear to be caused by the said outliers.
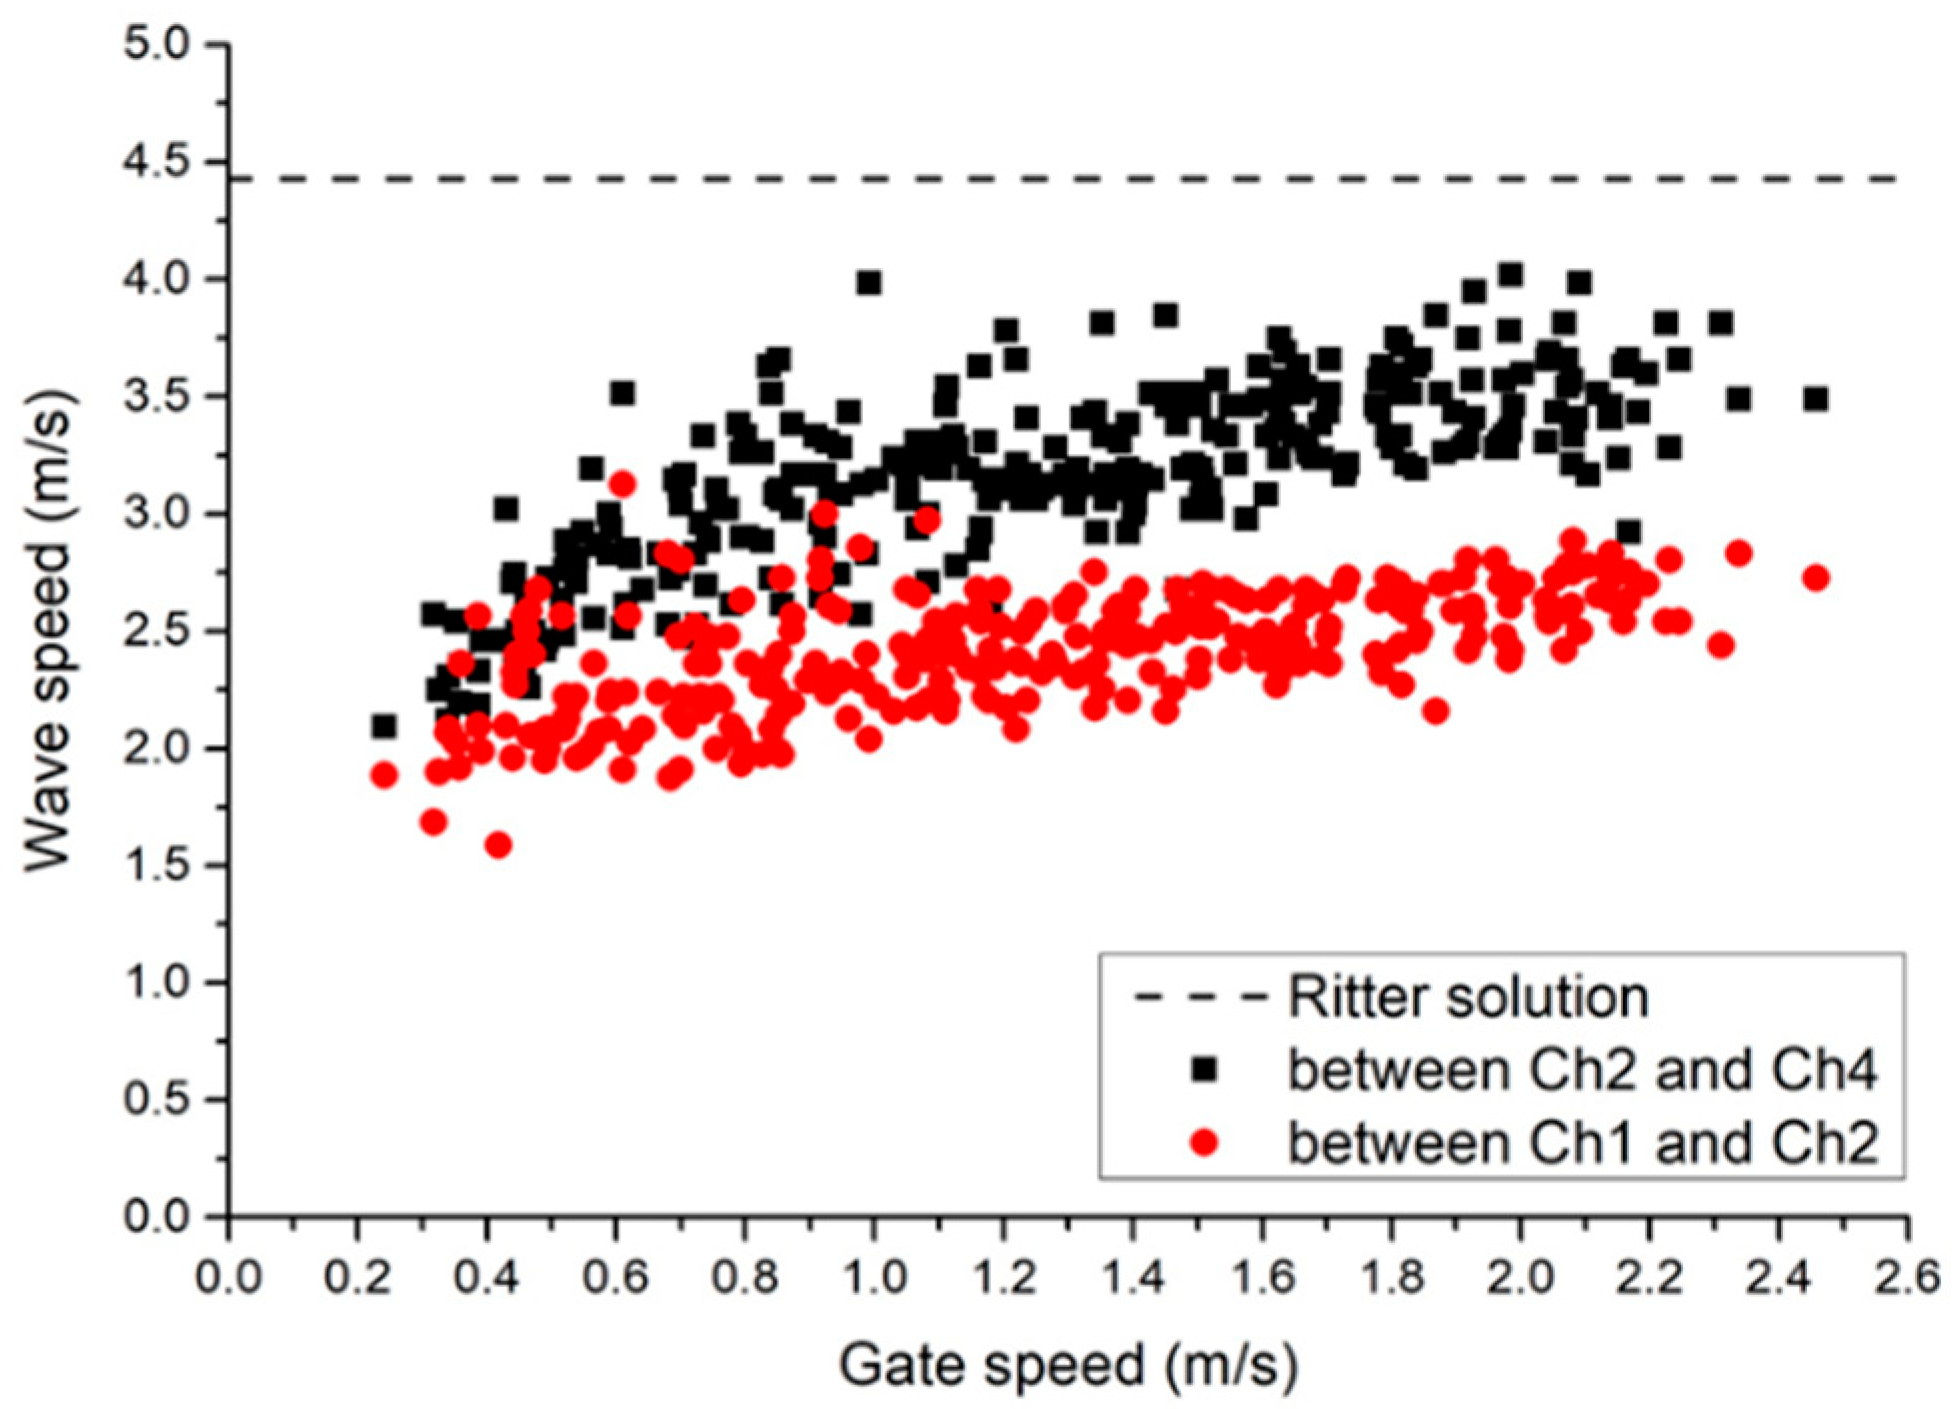
In Figure 5, the observed wave speeds are plotted along with a theoretical velocity calculated using Ritter’s solution (Equation (2)). The wave speed was calculated as the distance between the two pressure sensors divided by the duration of the propagation. A threshold corresponding to 20% of the maximum pressure introduced earlier was used to define the wave arrival time. Because the wave speed is calculated by a systematic method based on data, it may be slightly different from the actual velocity of the flow tip. However, this error is estimated as less than 10% compared to the analysis performed using the high-speed camera images (see Appendix C). The wave speed among the different experimental trials was vastly scattered in the range of 1.5–4.0 m/s, which was 9–64% smaller than that calculated using Ritter’s solution (4.4 m/s), thereby implying the influence of resistance and turbulence. It is intuitively understandable that the faster the gate speed, the faster is the wave speed. This characteristic was also confirmed by [22,30]. These two studies demonstrated that the speed of the dam-break flow would become faster with an increase in the gate velocity. Thus, the wave arrival time was linearly influenced by the gate opening time. Additionally, a numerical analysis reproducing a vertical lifting gate shows that the wave tip is delayed compared to an instantaneous opening of the dam gate [31]. Moreover, the present study finds that waves get slightly more accelerated as they approach the end of the flume. This acceleration may be due to the flow smoothing process, in which it is transformed from an explosive jet to a uniform smoothed flow in a short distance, as demonstrated in the next section. Furthermore, this acceleration may have been more pronounced because the present experimental flume is short and is made of an acrylic board with low roughness. In a longer flume, water flow is expected to decelerate over distance.
3.2. High-Speed Image Analysis
Figure 6 illustrates the water jet after 0.3 s of opening the gate for three different gate speeds, namely, 0.70, 1.30, and 2.00 m/s. The water inside the tank was still partially supported by the gate in the case with the lower gate speed, whereas the gate was totally detached from the water surface in the other two faster cases. All high-speed images show that a waterfall formed on the smooth free surface beneath the gate, which is connected by an instantaneous hydraulic jump. It appears that the front of the three waves reached approximately the same distance, irrespective of how fast the gate was lifted; this implies that the initial water height predominantly determines an incipient speed of the water jet. However, the thickness of the jet appears to be different at different gate speeds. The faster the gate opens, the thicker the wave front is. This is consistent with the box plots for Ch1 in Figure 4, wherein the maximum pressure tends to significantly increase with gate speed. Figure 7 shows the depth profile of the three dam-break flows at each sensor location (i.e., Ch1–Ch4), drawn manually based on the high-speed camera images. The waveforms at the point where the tip reaches are compared. The arrival time of the wave depends on the gate speed. Hydraulic jumps occurred immediately after the gate. The water profile was significantly different at Ch1, and it was highly dependent on gate speed. However, the wave front tended to quickly dissipate, flatten, and smoothen as it surged on the flatbed. All profiles became similar when they arrived at Ch2. When the wave reached Ch4, all profiles changed to an almost similar shape, exhibiting smooth elongated ellipses. The waveforms when reaching Ch2–Ch4 do not differ with gate speed, which is similar to the finding in a study conducted by [22]. Their experiments show that the gate opening time and speed do not have a significant effect on the waveform profile.
3.3. Pressure Rise Analysis
As demonstrated in Figure 4, a few data that included extraordinarily large pressures were considered statistical outliers. Figure 8a,b help to explain if these outliers were caused by random errors and if they should be excluded. Six outliers at Ch4 were compared with six normal samples (they were ranked within the IQR). All outliers demonstrated high-intensity short-duration pressures, known as impulsive pressures [32], which are significantly larger than the following surge pressures. An impulsive pressure pulse occurs in a very short period, on the order of 0.01 s. In contrast, the six normal samples did not contain such impulsive spikes, despite demonstrating a short and steep pressure rise before the arrival of the main surge. In terms of long duration pressure—the pressures reached up to 800 Pa within a period of approximately 1 s—the surge components exhibit a similar profile for all cases. Hence, statistical outliers may be explained as impulsive pressures from a physical phenomenon perspective. In the experiment, the flow was released as an explosive jet, and it fluctuated significantly as it propagated downstream. Furthermore, the waterfront in the experiment demonstrated a concave upward shape, which implies retardation caused by bottom resistance from the dry bed and momentum dispersion due to strong turbulence.
3.4. Horizontal Turbulence Analysis
In theory, a dam-break flow is considered a pure 2-D phenomenon. In our experiment, however, the dam-break flow was regulated by sidewalls, which act similarly to the flume bed. Frictional stresses from the sidewalls inevitably generate horizontal turbulence, eventually affecting the main free stream. To observe the horizontal behavior of a dam-break flow, snapshots of the cross-sectional view for three different experimental trials are shown in Figure 9. The high-speed images were captured from the downstream end when a wave front reached Ch1 and Ch4. These images demonstrated that the water jet entrapped air. In the experimental images at Ch4, notch-shaped flows were observed in the middle of the flume, which indicated separation of the edge waves from the sidewalls. Two edge waves collided and developed strong horizontal turbulence, forming a cross wave. The water on the sidewalls was slightly raised, and it propagated as edge waves. As the edge waves propagated further downstream, they deflected into the center of the flume. Interestingly, the propagation of the edge waves resembled the surface waves caused by a ship, referred to as the ship wake, which is considered to be the cumulative result of impulses delivered at each point along its course [33].
4. Discussion
The variability in the generated dam-break flows appears to change wave velocity, flow velocity, and water depth, thereby resulting in a change in the drag and buoyancy forces acting on the object of interest. Therefore, the location at which the object should be placed is a critical issue to ensure a successful experiment. Figure 4 suggests that experimental results adjacent to the gate are not trustworthy due to the wide range of uncertainty observed in the maximum pressure. Explosive water jets entrapping air, as captured in Figure 6, are likely to be responsible for the higher bottom pressures near the gate. Figure 10 illustrates how a dam-break flow behaves immediately after release, compared to the idealized streamline obtained using Ritter’s solution. The actual water jet appears to be highly nonlinear, and it is influenced by bed friction, turbulence, and other complex mechanisms. Stansby et al. [10] used the term “mushroom-like jet” to describe this explosive water jet. Cagatay and Kocaman [34] proved that the jet tends to be more explosive in a wet-bed condition rather than in a dry-bed condition. In addition, the present study confirmed that the faster the gate opening speed, the thicker is the water jet. It is considered that this occurs not only because of bottom friction, but also because of the directional dispersion of momentum due to the rapid release of water. The streamline is deformed vertically upward by the hydraulic jump that occurs immediately after the gate is opened, thereby reducing the horizontal flow velocity; thus, this implies that the wave front in the experiment propagates at a slower speed when compared with theoretical results. Because the flume used in this study was short in length, it is considered that the waves were less affected by bottom friction, and the momentum dispersion process near the gate may have been the determining factor for the wave speed.
Figure 5 and Figure 8 reveal that the range of uncertainty tends to decrease as the dam-break wave propagates on the flatbed. Although the data measured at Ch4 fluctuate less, the gate speed and maximum pressure were negatively correlated, with a Pearson’s r of −0.524. The speed at which the gate should be lifted may be a fundamental question for researchers. To investigate this, Equation (1) is reformulated to calculate the least required gate speed as
Given a water depth of 0.5 m, is calculated as 1.77 m/s under the current experimental conditions. Although a total of 224 (77%) test cases in Figure 5 fail to meet this criterion, the data plotted within the range of 2.01–2.46 m/s may be closer to the theoretical dam-break flow.
The slower the gate opening speed is, the greater the uncertainty is in the dam break flow propagation process [23]. Therefore, when pulling the gate up manually, it needs to be opened as quickly as possible. However, as the experimental results are subject to change, it is necessary to repeat the experiment sufficient number of times to ensure statistical reliability. In contrast with manual operation, the gate lifting with a mechanical system can reproduce constant dam break flows anytime. Nevertheless, to obtain reliable data, von Häfen et al. [23] repeated the dam break experiments three times and confirmed that outputs were mostly identical. Although it may pose extra laborious work, this type of quality assurance process is required to increase the reliability of experimental data.
A turbulent boundary layer is developed at a large Reynolds number. For the layer over a flat plate, the boundary-layer thickness is given as a function of distance x [35] as follows:
where is the free stream velocity and is the kinematic viscosity. Assuming that = 3.0 m/s (approximately the average velocity in the present experiment; see Figure 5) and = at 20 °C, is calculated to be 3.3 cm when the water reaches = 2 m. This magnitude of the boundary layer would be negligible in a real dam-break phenomenon. However, it could be significant for an experimental condition in a small flume (e.g., the flume in this study has a width of only 38 cm). Figure 9 shows that two edge waves collide and generate complex turbulence in the middle of the flume. The occurrence of an impulsive pressure, as shown in Figure 8a, can also be attributed to the complex interaction between the turbulent flows.
Several recent studies verified that 2-D dam-break dynamics can be adequately reproduced with a state-of-the-art algorithm, such as smoothed particle hydrodynamics [23,36] and constrained interpolation profile [30]. In a real experimental flume, however, the dam-break flow propagates in both the cross-sectional and horizontal directions. Therefore, measuring the water level and pressure at the centerline of the tank and near the wall of the tank may produce different results. As the present experiment used a small flume with a length of 3 m, it seems the flows were not fully mixed vertically or horizontally. Particularly, the dam-break flow exhibits a strong three-dimensionality immediately after the gate, as already demonstrated by previous studies (e.g., [10,34]). Asadollahi et al. [37] also compared the OpenFOAM 3-D numerical results with the water levels measured in a dam break flume with a length of approximately 15 m. Their results show a discrepancy between experiment and simulation at the nearest wave gauge (2.77 m from the gate), in which the water level in the experiment appeared significantly higher than in the model. However, after the bore propagated downstream, the numerical simulation was observed to conform well with the experimental measurements of the water level at two gauges located at 3.9 and 4.9 m from the gate.
5. Conclusions
Previous studies have presented dam-break experimental results; however, many of them do not adequately explain the experimental uncertainties introduced by the gate lifting operation. This study, through statistical analyses, revealed that gate lifting speed significantly impacts on the hydrodynamics of the generated dam-break flow. A total of 290 dam-break experimental trials were conducted at gate opening speeds ranging between 0.20–2.50 m/s, while maintaining the initial water depth at a constant value (0.5 m). Statistical and physical findings were derived, and these results are considered useful for performing dam-break experiments in a reliable manner. In conclusion, the experimental findings of this study can be summarized as follows:
- The gate speed significantly influences the volume of the water jet, and thus, the pressure near the gate is particularly sensitive to the gate operation.
- The dam-break flow tends to be flattened as the wave advances because of dissipation effects, and this is promoted by a strong vertical and horizontal turbulence.
- The gate speed affects the shape of the wave immediately after opening. However, as the wave advances some distance, the gate speed no longer makes a noticeable difference.
- The wave propagation speed in the experiment is considerably slower than that calculated theoretically, which indicates the significant contribution of bed friction and turbulence.
- The bottom pressure near the end of the flume exhibits a relatively small range of statistical uncertainty, and thus, it may be considered reliable.
- The experimental data may contain statistical outliers, which resemble an error at first glance, but may be physically interpreted as impulsive pressures.
- Because the experimental results are subject to chance, it is necessary to repeat the experiment sufficient number of times to ensure statistical reliability.
Furthermore, this study addresses the significance of three-dimensionality, which is inevitable in a limited size flume. This effect is expected to contribute to the generation of complex hydrodynamics, such as two edge waves developed on the sidewalls and propagated downstream, similar to a ship wake, collide in the center of the flume, forming a cross wave. In future studies, the 3-D nature of the dam-break flow as a function of flume length and width should be investigated in more detail.
Author Contributions
Conceptualization, H.T.; methodology, H.T. and F.F.; experiment F.F.; writing H.T.; funding acquisition, H.T. All authors have read and agreed to the published version of the manuscript.
Funding
This research was supported by the Japan Society for the Promotion of Science (JSPS KAKENHI) (Grant Nos. 16KK0121 and 19K04964).
Institutional Review Board Statement
Not applicable.
Informed Consent Statement
Not applicable.
Data Availability Statement
Data corrected during the experiment are available from the corresponding author upon reasonable request.
Conflicts of Interest
The authors declare no conflict of interest.
Appendix A
Three snapshots of the high-speed camera when the tip of the acrylic gate (covered by a rubber strip) was about to detach from the water. The estimated gate speed was 2.458 m/s, which was ranked as the fastest among the 290 trials conducted. As the detection was performed based on a human visual observation, there may be some randomness in reading the timing of the detachment. However, the error is estimated as 1% at most. The same detection error could arise when the gate detaches from the floor. Thus, a total error of up 2%. may be involved in the estimated gate speed.
Figure A1.
Three snapshots when the tip of the acrylic gate was about to detach from the water.

Appendix B
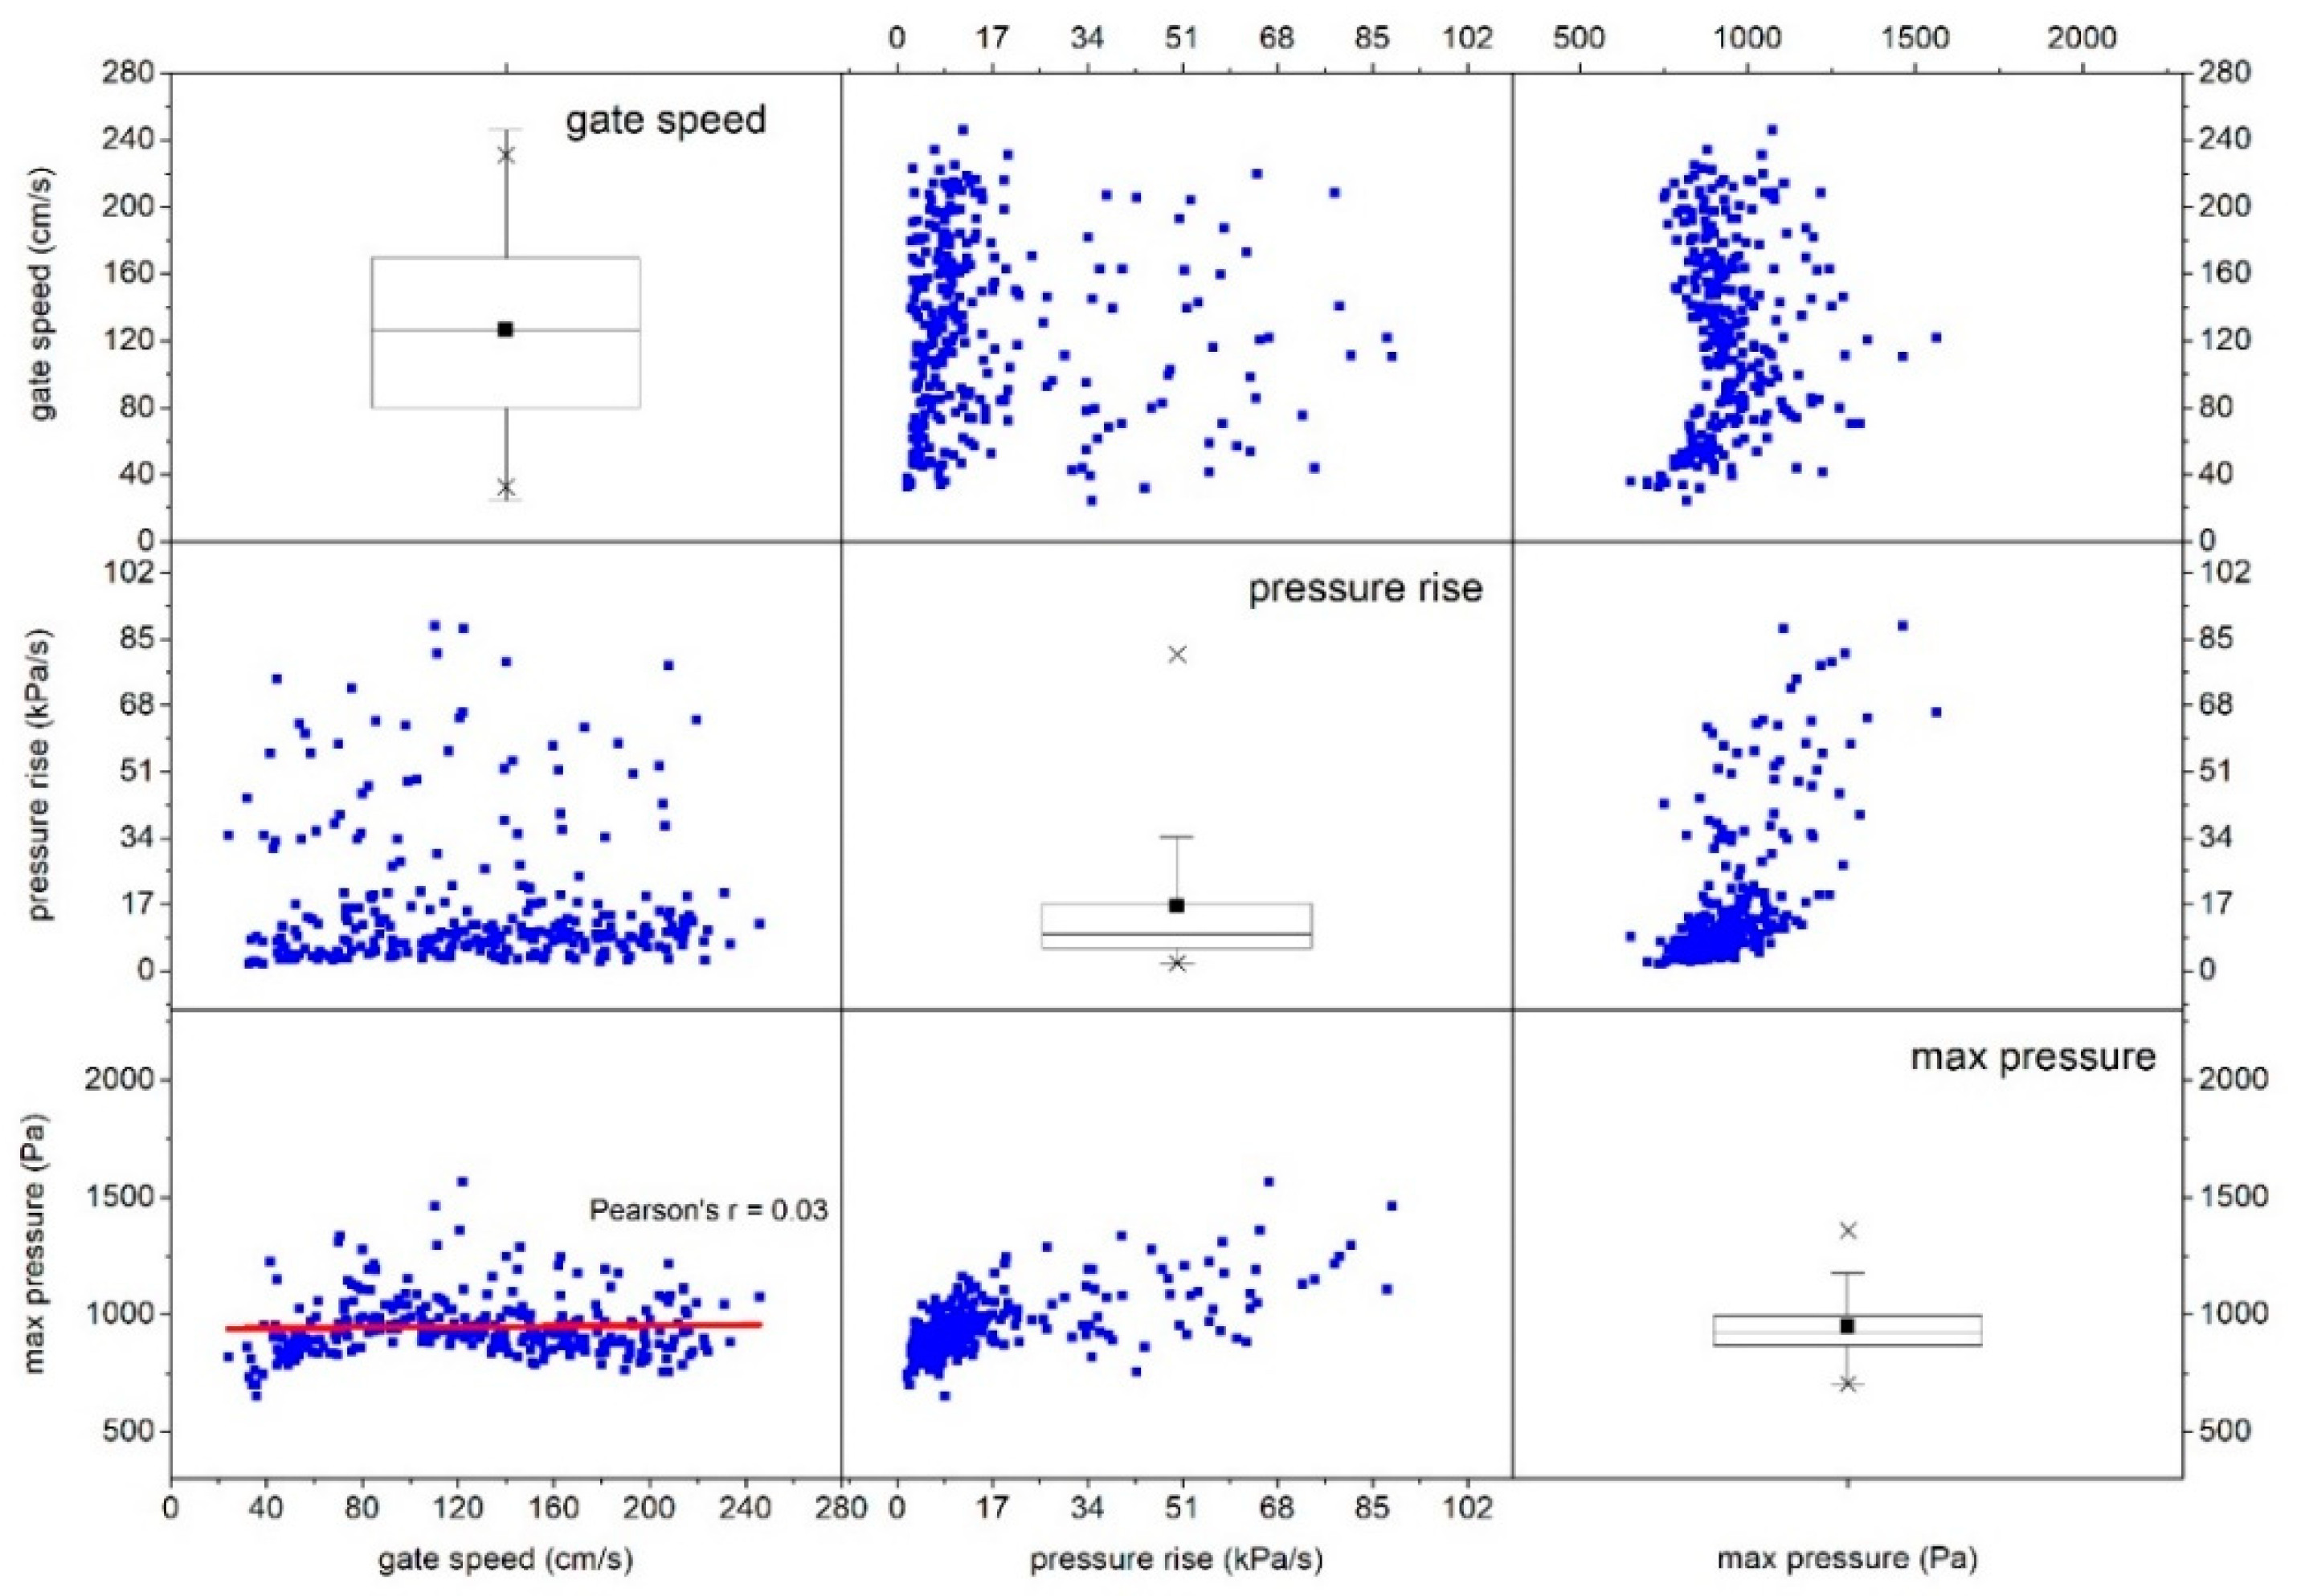
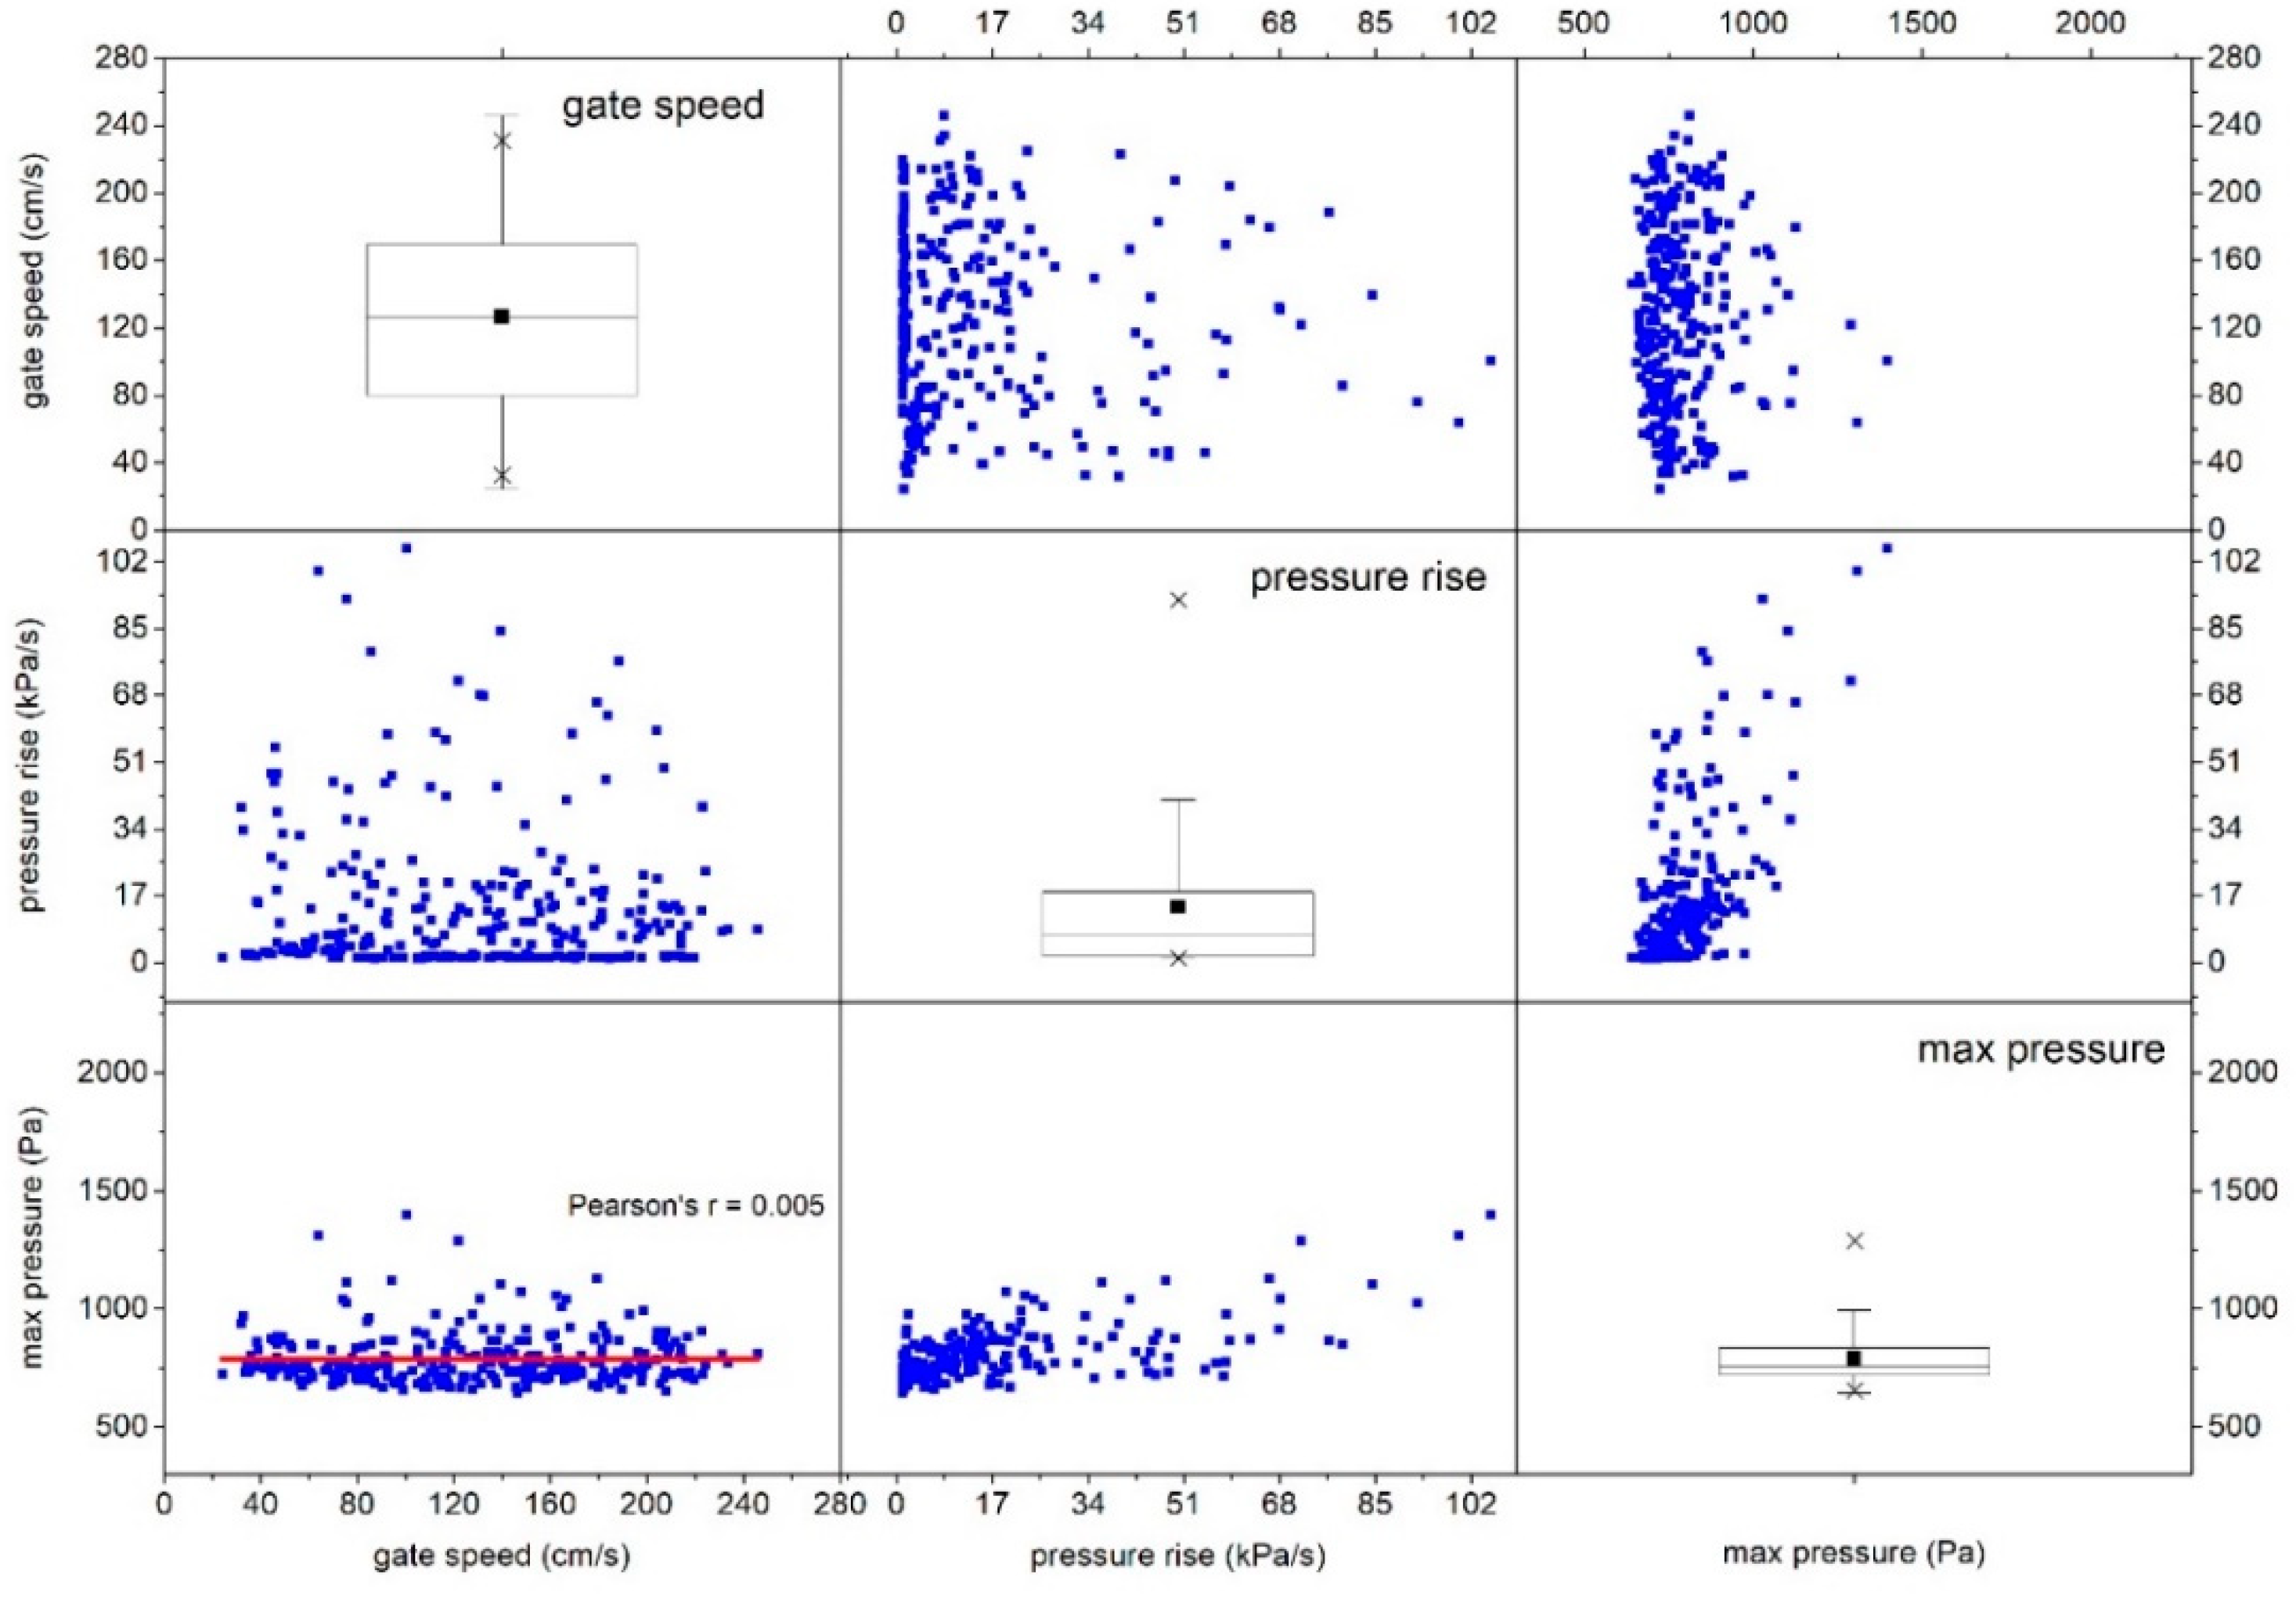
Blue scatter plot: Entire data (290 samples); : 1% and 99%; ∎: Mean value
Figure A2.
The matrix presenting the relationship between maximum pressure, pressure rise rate, and gate speed at Ch1.
Figure A2.
The matrix presenting the relationship between maximum pressure, pressure rise rate, and gate speed at Ch1.

Figure A3.
The matrix presenting the relationship between maximum pressure, pressure rise rate, and gate speed at Ch2.
Figure A3.
The matrix presenting the relationship between maximum pressure, pressure rise rate, and gate speed at Ch2.

Figure A4.
The matrix presenting the relationship between maximum pressure, pressure rise rate, and gate speed at Ch3.
Figure A4.
The matrix presenting the relationship between maximum pressure, pressure rise rate, and gate speed at Ch3.

Figure A5.
The matrix presenting the relationship between maximum pressure, pressure rise rate, and gate speed at Ch4.
Figure A5.
The matrix presenting the relationship between maximum pressure, pressure rise rate, and gate speed at Ch4.

Appendix C
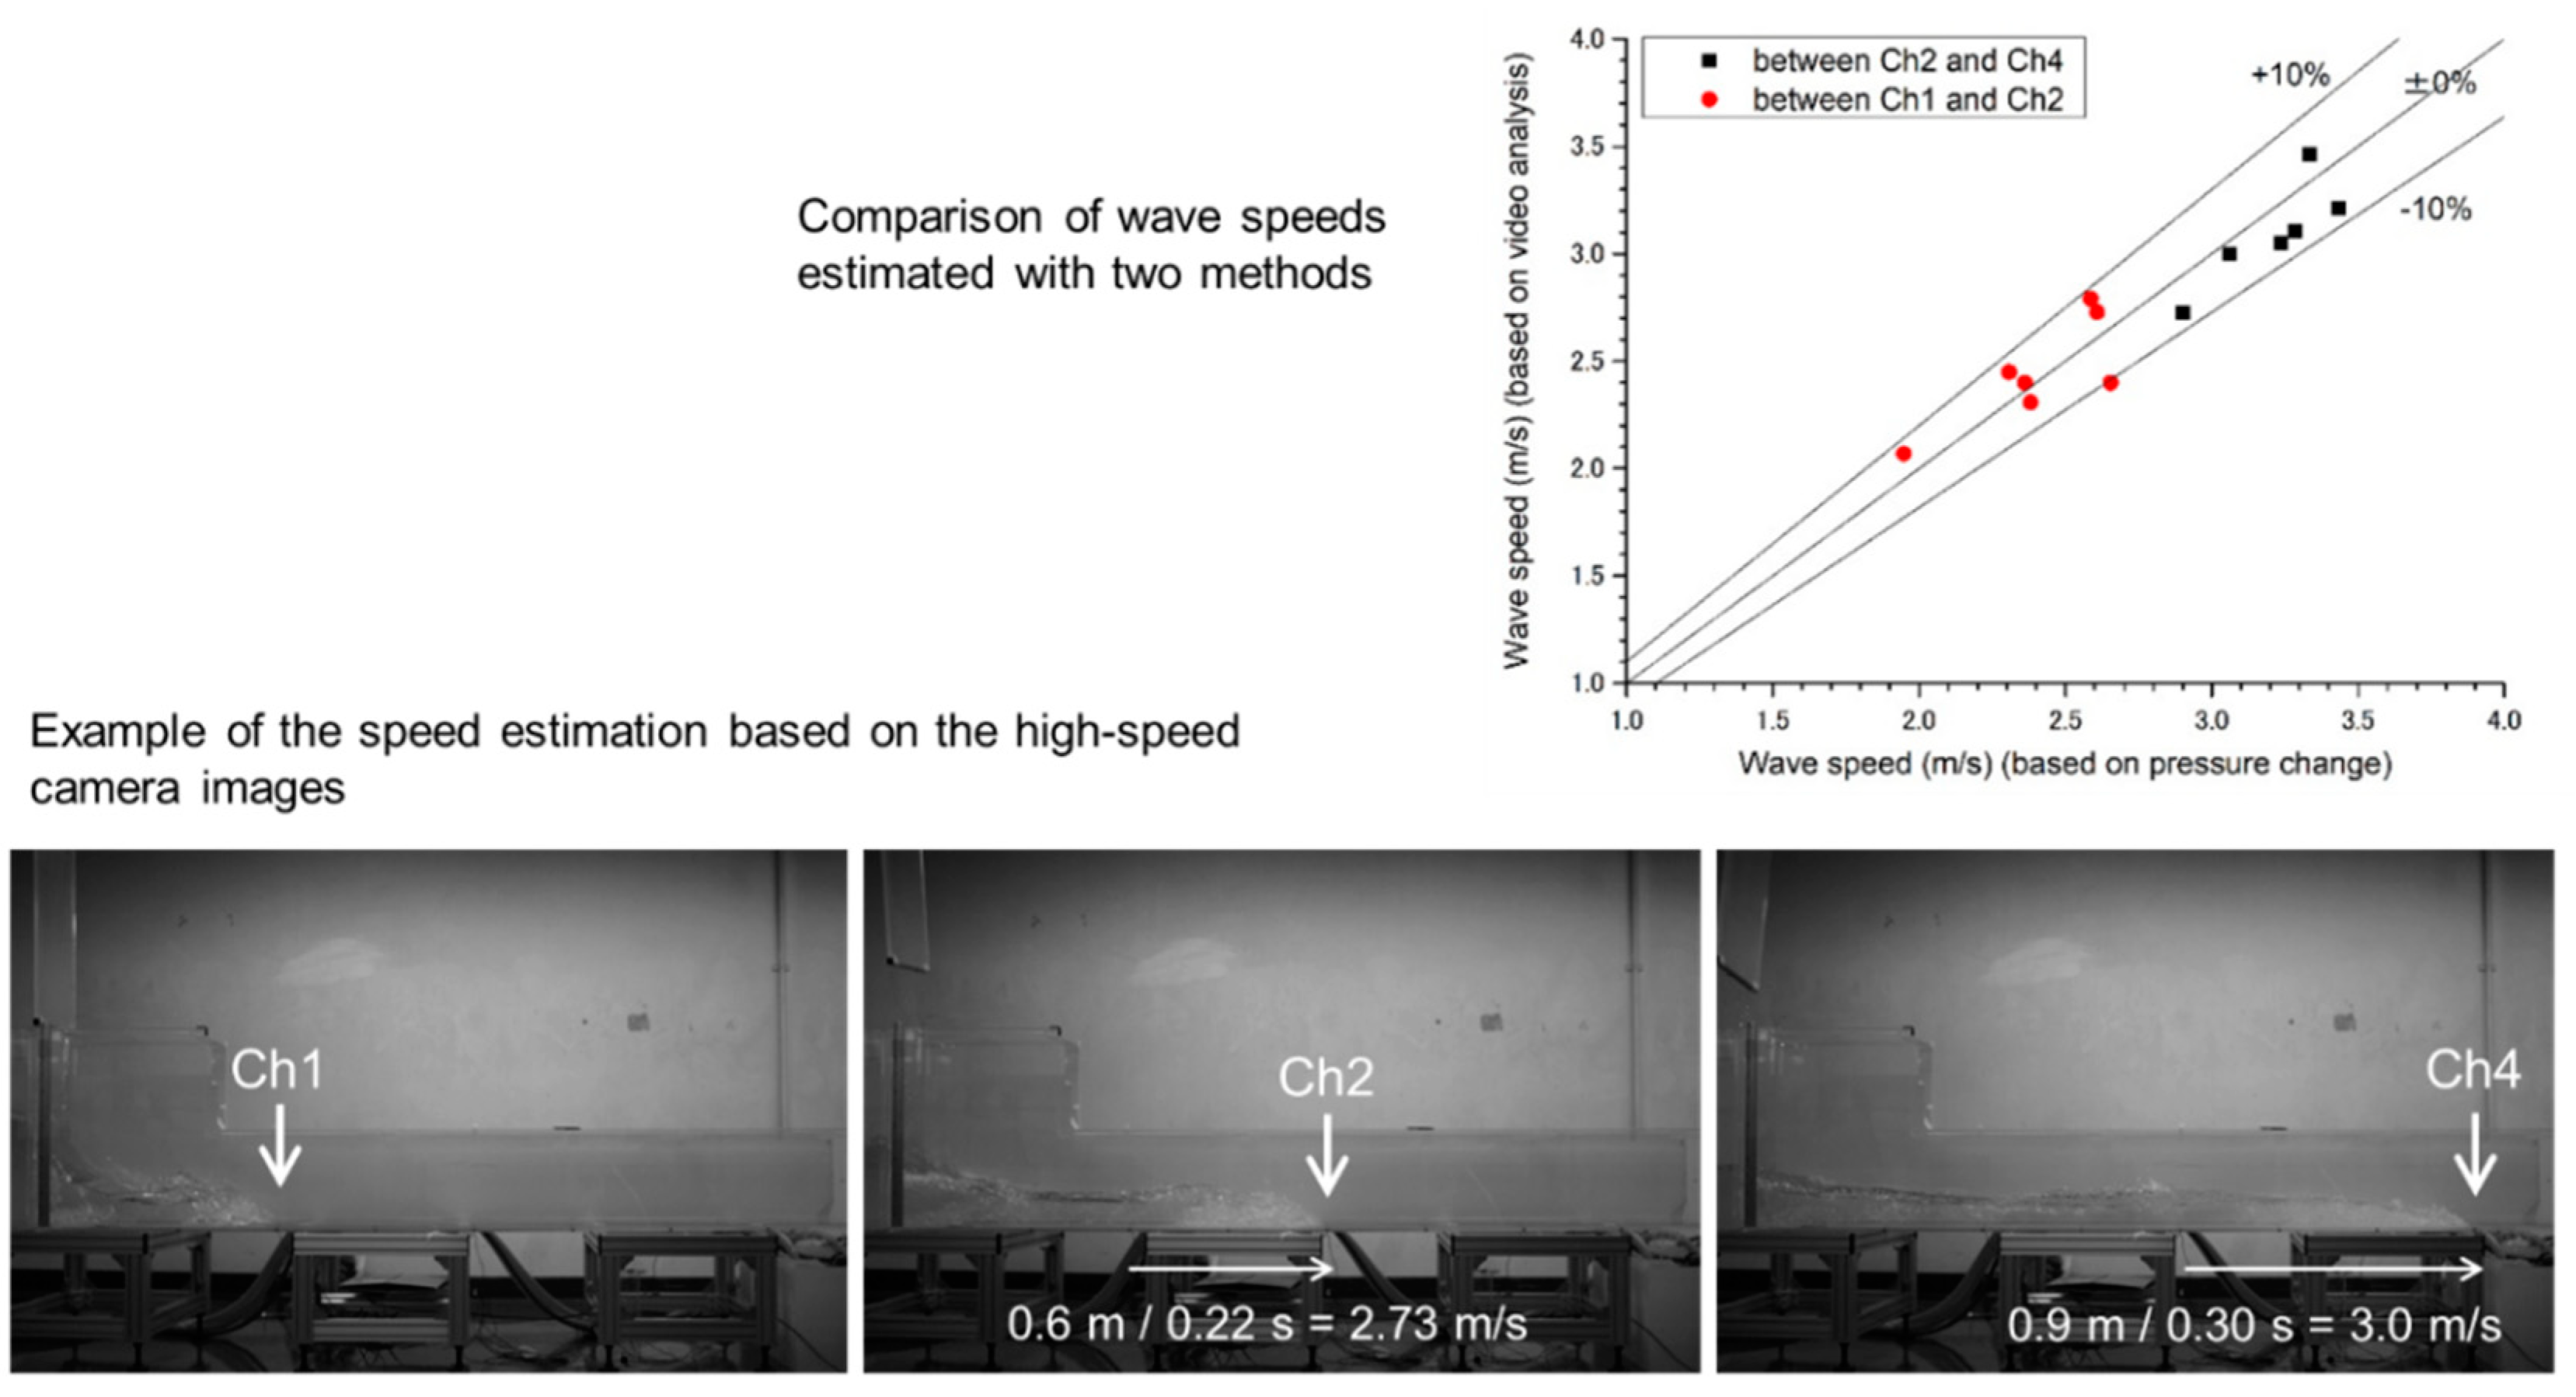
Figure 5 shows the wave speed calculation based on the pressure measured by the sensors. We believe this method is appropriate because it can process numerous experimental data systematically in a uniform manner. However, this method does not necessarily detect the tip of the wave. The actual wave speed may differ to some extent. Therefore, we calculated the wave speed based on the wave tip detected visually from the image taken by the high-speed camera and compared it with the pressure method. The difference between the two methods was less than 10% for seven experimental samples. In both methods, it was confirmed that the velocity increased in the downstream side of the flume.
Figure A6.
Wave speed estimation based on the pressure measured by the sensors vs that based on video analysis.
Figure A6.
Wave speed estimation based on the pressure measured by the sensors vs that based on video analysis.

References
- Ikeno, M.; Tanaka, H. Experimental study on impulse force of drift body and tsunami running up to land. Ann. J. Coast. Eng. 2003, 50, 721–725. [Google Scholar]
- Esteban, M.; Thao, N.D.; Takagi, H.; Shibayama, T. Analysis of rubble mound foundation failure of a caisson breakwater subjected to tsunami attack. Proc. Int. Offshore Polar Eng. Conf. 2008, 4, 528–534. [Google Scholar]
- Foster, A.S.J.; Rossetto, T.; Allsop, W. An experimentally validated approach for evaluating tsunami inundation forces on rectangular buildings. Coast. Eng. 2017, 128, 44–57. [Google Scholar] [CrossRef]
- Derschum, C.; Nistor, I.; Stolle, J.; Goseberg, N. Debris impact under extreme hydrodynamic conditions part 1: Hydrodynamics and impact geometry. Coast. Eng. 2018, 141, 24–35. [Google Scholar] [CrossRef]
- Wüthrich, D.; Pfister, M.; Nistor, I.; Schleiss, A.J. Experimental study on forces exerted on buildings with openings due to extreme hydrodynamic events. Coast. Eng. 2018, 140, 72–86. [Google Scholar] [CrossRef]
- Mokhtar, Z.A.; Mohammed, T.A.; Yusuf, B.; Lau, T.L. Experimental investigation of tsunami bore impact pressure on a perforated seawall. Appl. Ocean Res. 2019, 84, 291–301. [Google Scholar] [CrossRef]
- Takagi, H.; Tomiyasu, R.; Oyake, T.; Araki, T.; Mori, K.; Matsubara, Y.; Ninomiya, Y.; Takata, Y. Tsunami intrusion through port breakwaters enclosed with self-elevating seawalls. Ocean Eng. 2020, 199, 107028. [Google Scholar] [CrossRef]
- Jayaratne, M.P.R.; Premaratne, B.; Adewale, A.; Mikami, T.; Matsuba, S.; Shibayama, T.; Esteban, M.; Nistor, I. Failure Mechanisms and Local Scour at Coastal Structures Induced by Tsunami. Coast. Eng. J. 2016, 58, 1640017. [Google Scholar] [CrossRef] [Green Version]
- Hu, P.; Tan, L.; He, Z. Numerical Investigation on the Adaptation of Dam-Break Flow-Induced Bed Load Transport to the Capacity Regime over a Sloping Bed. J. Coast. Res. 2020, 36, 1237–1246. [Google Scholar] [CrossRef]
- Stansby, P.K.; Chegini, A.; Barnes, T.C.D. The initial stages of dam-break flow. J. Fluid Mech. 1998, 374, 407–424. [Google Scholar] [CrossRef]
- Ritter, A. Die fortpflanzung der wasserwellen. Z. Ver. Dtsch. Ing. 1892, 36, 947–954. [Google Scholar]
- Lauber, G.; Hager, W.H. Experiments to dambreak wave: Horizontal channel. J. Hydraul. Res. 1998, 36, 291–307. [Google Scholar] [CrossRef]
- Nistor, I.; Palermo, D.; Nouri, Y.; Murty, T.; Saatcioglu, M. Tsunami-Induced Forces on Structures. In Handbook of Coastal and Ocean Engineering; World Scientific: Singapore, 2009; pp. 261–286. [Google Scholar]
- Munoz, D.H.; Constantinescu, G. 3-D dam break flow simulations in simplified and complex domains. Adv. Water Resour. 2020, 137, 103510. [Google Scholar] [CrossRef]
- Lobovský, L.; Botia-Vera, E.; Castellana, F.; Mas-Soler, J.; Souto-Iglesias, A. Experimental investigation of dynamic pressure loads during dam break. J. Fluids Struct. 2014, 48, 407–434. [Google Scholar] [CrossRef] [Green Version]
- Hsu, H.C.; Freyermuth, A.T.; Hsu, T.J.; Hwung, H.H.; Kuo, P.C. On dam-break wave propagation and its implication to sediment erosion. J. Hydraul. Res. 2014, 52, 205–218. [Google Scholar] [CrossRef]
- Wang, B.; Liu, W.; Wang, W.; Zhang, J.; Chen, Y.; Peng, Y.; Liu, X.; Yang, S. Experimental and numerical investigations of similarity for dam-break flows on wet bed. J. Hydrol. 2020, 583, 124598. [Google Scholar] [CrossRef]
- Capart, H.; Young, D.L. Formation of a jump by the dam-break wave over a granular bed. J. Fluid Mech. 1998, 372, 165–187. [Google Scholar] [CrossRef]
- Carrivick, J.L. Dam break–Outburst flood propagation and transient hydraulics: A geosciences perspective. J. Hydrol. 2010, 380, 338–355. [Google Scholar] [CrossRef]
- Çağatay, H.; Kocaman, S. Experimental study of tailwater level effects on dam break flood wave propagation. Proc. River Flow 2008, 1, 635–644. [Google Scholar]
- Esteban, M.; Glasbergen, T.; Takabatake, T.; Hofland, B.; Nishizaki, S.; Nishida, Y.; Stolle, J.; Nistor, I.; Bricker, J.; Takagi, H.; et al. Overtopping of Coastal structures by tsunami waves. Geoscience 2017, 7, 121. [Google Scholar] [CrossRef] [Green Version]
- Stolle, J.; Ghodoosipour, B.; Derschum, C.; Nistor, I.; Petriu, E.; Goseberg, N. Swing gate generated dam-break waves. J. Hydraul. Res. 2019, 57, 675–687. [Google Scholar] [CrossRef]
- von Häfen, H.; Goseberg, N.; Stolle, J.; Nistor, I. Gate-opening criterial for generating dam-break waves. J. Hydraul. Eng. 2019, 145, 1–13. [Google Scholar] [CrossRef]
- Cagatay, H.O.; Kocaman, S. Dam-break flow in the presence of obstacle: Experiment and CFD simulation. Eng. Appl. Comput. Fluid Mech. 2011, 5, 541–552. [Google Scholar]
- Chow, V.T. Open-Channel Hydraulics; McGraw-Hill: New York, NY, USA, 1959; p. 680. [Google Scholar]
- Schoklitsch, A. Uber Dambruchwellen. Sitzber Akad. Wiss. Wien. 1917, 126, 1489–1514. [Google Scholar]
- Dressler, R.F. Hydraulic Resistance Effect Upon the Dam-Break Functions. Natl. Bur. Stand. 1952, 49, 217–225. [Google Scholar] [CrossRef]
- Witham, G.B. The effects of hydraulic resistance in dam-break problem. Proc. R. Soc. A 1955, 227, 399–407. [Google Scholar]
- Mano, A. Boundary layer developed near surging front. Coast. Eng. Jpn. 1994, 37, 23–39. [Google Scholar] [CrossRef]
- Ye, Z.; Zhao, X.; Deng, Z. Numerical investigation of the gate motion effect on a dam break flow. J. Mar. Sci. Technol. 2016, 21, 579–591. [Google Scholar] [CrossRef]
- Shigematsu, T.; Liu, P.L.-F.; Oda, K. Numerical modeling of the initial stages of dam-break waves. J. Hydraul. Res. 2004, 42, 183–195. [Google Scholar] [CrossRef]
- Goda, Y. Dynamic response of upright breakwaters to impulsive breaking wave forces. Coast. Eng. 1994, 22, 135–158. [Google Scholar] [CrossRef]
- Stoker, J.J. Water Waves; Wiley: Hoboken, NJ, USA, 1957; pp. 451–509. [Google Scholar]
- Cagatay, H.O.; Kocaman, S. Dam-break flows during initial stage using SWE and RANS approaches. J. Hydraul. Res. 2010, 48, 603–611. [Google Scholar] [CrossRef]
- Schlichting, H.; Gersten, K. Boundary-Layer Theory; McGraw Hill: New York, NY, USA, 1979. [Google Scholar]
- Soleimani, K.; Ketabdari, M.J. Meshfree modeling of near field two-liquid mixing process in the presence of different obstacles. Ocean. Eng. 2020, 213, 107625. [Google Scholar] [CrossRef]
- Asadollahi, N.; Nistor, I.; Mohammadian, A. Numerical investigation of tsunami bore effects on structures, part I: Drag coefficients. Nat. Hazards 2019, 96, 285–309. [Google Scholar] [CrossRef]
Figure 1.
Side view of the experimental dam-break flume, immediately after the gate manually lifted. Bottom pressures were measured with four sensors (Ch1–Ch4). The data on gate speed, maximum pressure, and pressure rise rate are compared in order to investigate the statistical relationship.
Figure 1.
Side view of the experimental dam-break flume, immediately after the gate manually lifted. Bottom pressures were measured with four sensors (Ch1–Ch4). The data on gate speed, maximum pressure, and pressure rise rate are compared in order to investigate the statistical relationship.

Figure 2.
Test count histogram in terms of gate speed over a range of 0.20–2.50 m/s.

Figure 3.
Definition of pressure rise time . (a) Impulse-dominant and (b) Surge-dominant pressures.

Figure 4.
Box plots showing the relationship between gate speed and maximum pressure; the box plots also display the position of the minimum, first quartile (Q1), median, third quartile (Q3), and maximum pressure. The dots denote statistical outliers. Ch1, Ch2, Ch3, and Ch4 are located at 0.7, 1.3, 1.9, and 2.2 m from the gate, respectively.

Figure 5.
Wave speed comparison. The squares and circles represent the observed wave speeds and the dashed line represents the wave speed calculated with Ritter’s solution.
Figure 5.
Wave speed comparison. The squares and circles represent the observed wave speeds and the dashed line represents the wave speed calculated with Ritter’s solution.

Figure 6.
Water jet 0.3 s after opening the gate for three different gate speeds.

Figure 7.
Wave profiles generated at gate speeds of 0.70, 1.30, and 2.00 m/s. All profiles tend to become smooth as the wave propagates downstream.
Figure 7.
Wave profiles generated at gate speeds of 0.70, 1.30, and 2.00 m/s. All profiles tend to become smooth as the wave propagates downstream.

Figure 8.
Time-series of pressure rise at Ch4 (gate speed = 1.11–1.56 m/s). (a) Experimental data for six statistically evaluated outliers; (b) Experimental data for six samples evaluated as normal and positioned within the interquartile range (IQR). Note that the time is started from the moment when each wave showed 20% of the maximum pressure at Ch1 to compare all profiles on the same time scale.

Figure 9.
Snapshots of three different dam-break experiment trials taken from the downstream end of the flume. Upper and lower panels show the flow when it reached Ch1 and Ch4, respectively. The three gate speeds considered were: slow (0.43 m/s), medium (1.14 m/s), and fast (2.10 m/s).
Figure 9.
Snapshots of three different dam-break experiment trials taken from the downstream end of the flume. Upper and lower panels show the flow when it reached Ch1 and Ch4, respectively. The three gate speeds considered were: slow (0.43 m/s), medium (1.14 m/s), and fast (2.10 m/s).

Figure 10.
Initial stage of dam-break flow: Ideal vs. realistic profile.


Table 1.
Number of cases for each pressure sensor that recorded the largest pressure.
| Largest Pressure occurred at Ch1 | Largest Pressure occurred at Ch3 | ||||
|---|---|---|---|---|---|
| Order | Count | Total | Order | Count | Total |
| Ch1 > Ch2 > Ch3 > Ch4 | 74 | 181 | Ch3 > Ch1 > Ch2 > Ch4 | 3 | 10 |
| Ch1 > Ch2 > Ch4 > Ch3 | 75 | Ch3 > Ch1 > Ch4 > Ch2 | 1 | ||
| Ch1 > Ch3 > Ch2 > Ch4 | 20 | Ch3 > Ch2 > Ch1 > Ch4 | 1 | ||
| Ch1 > Ch3 > Ch4 > Ch2 | 1 | Ch3 > Ch2 > Ch4 > Ch1 | 1 | ||
| Ch1 > Ch4 > Ch2 > Ch3 | 10 | Ch3 > Ch4 > Ch1 > Ch2 | 0 | ||
| Ch1 > Ch4 > Ch3 > Ch2 | 1 | Ch3 > Ch4 > Ch2 > Ch1 | 4 | ||
| Largest pressure occurred at Ch2 | Largest pressure occurred at Ch4 | ||||
| Order | Count | Total | Order | Count | Total |
| Ch2 > Ch1 >Ch3 > Ch4 | 11 | 74 | Ch4 > Ch1 > Ch2> Ch3 | 3 | 25 |
| Ch2 > Ch1 > Ch4 > Ch3 | 40 | Ch4 > Ch1 > Ch3> Ch2 | 1 | ||
| Ch2 > Ch3 > Ch1 > Ch4 | 2 | Ch4 > Ch2 > Ch1> Ch3 | 5 | ||
| Ch2 > Ch3 > Ch4 > Ch1 | 1 | Ch4 > Ch2 > Ch3> Ch1 | 9 | ||
| Ch2 > Ch4 > Ch1 > Ch3 | 13 | Ch4 > Ch3 > Ch1> Ch2 | 1 | ||
| Ch2 > Ch4 > Ch3 > Ch1 | 7 | Ch4 > Ch3 > Ch2> Ch1 | 6 | ||
Publisher’s Note: MDPI stays neutral with regard to jurisdictional claims in published maps and institutional affiliations. |
© 2021 by the authors. Licensee MDPI, Basel, Switzerland. This article is an open access article distributed under the terms and conditions of the Creative Commons Attribution (CC BY) license (http://creativecommons.org/licenses/by/4.0/).
Share and Cite
MDPI and ACS Style
Takagi, H.; Furukawa, F. Stochastic Uncertainty in a Dam-Break Experiment with Varying Gate Speeds. J. Mar. Sci. Eng. 2021, 9, 67. https://doi.org/10.3390/jmse9010067
AMA Style
Takagi H, Furukawa F. Stochastic Uncertainty in a Dam-Break Experiment with Varying Gate Speeds. Journal of Marine Science and Engineering. 2021; 9(1):67. https://doi.org/10.3390/jmse9010067
Chicago/Turabian StyleTakagi, Hiroshi, and Fumitaka Furukawa. 2021. "Stochastic Uncertainty in a Dam-Break Experiment with Varying Gate Speeds" Journal of Marine Science and Engineering 9, no. 1: 67. https://doi.org/10.3390/jmse9010067
Note that from the first issue of 2016, this journal uses article numbers instead of page numbers. See further details here.