The Tsunami Caused by the 30 October 2020 Samos (Aegean Sea) Mw7.0 Earthquake: Hydrodynamic Features, Source Properties and Impact Assessment from Post-Event Field Survey and Video Records


Abstract
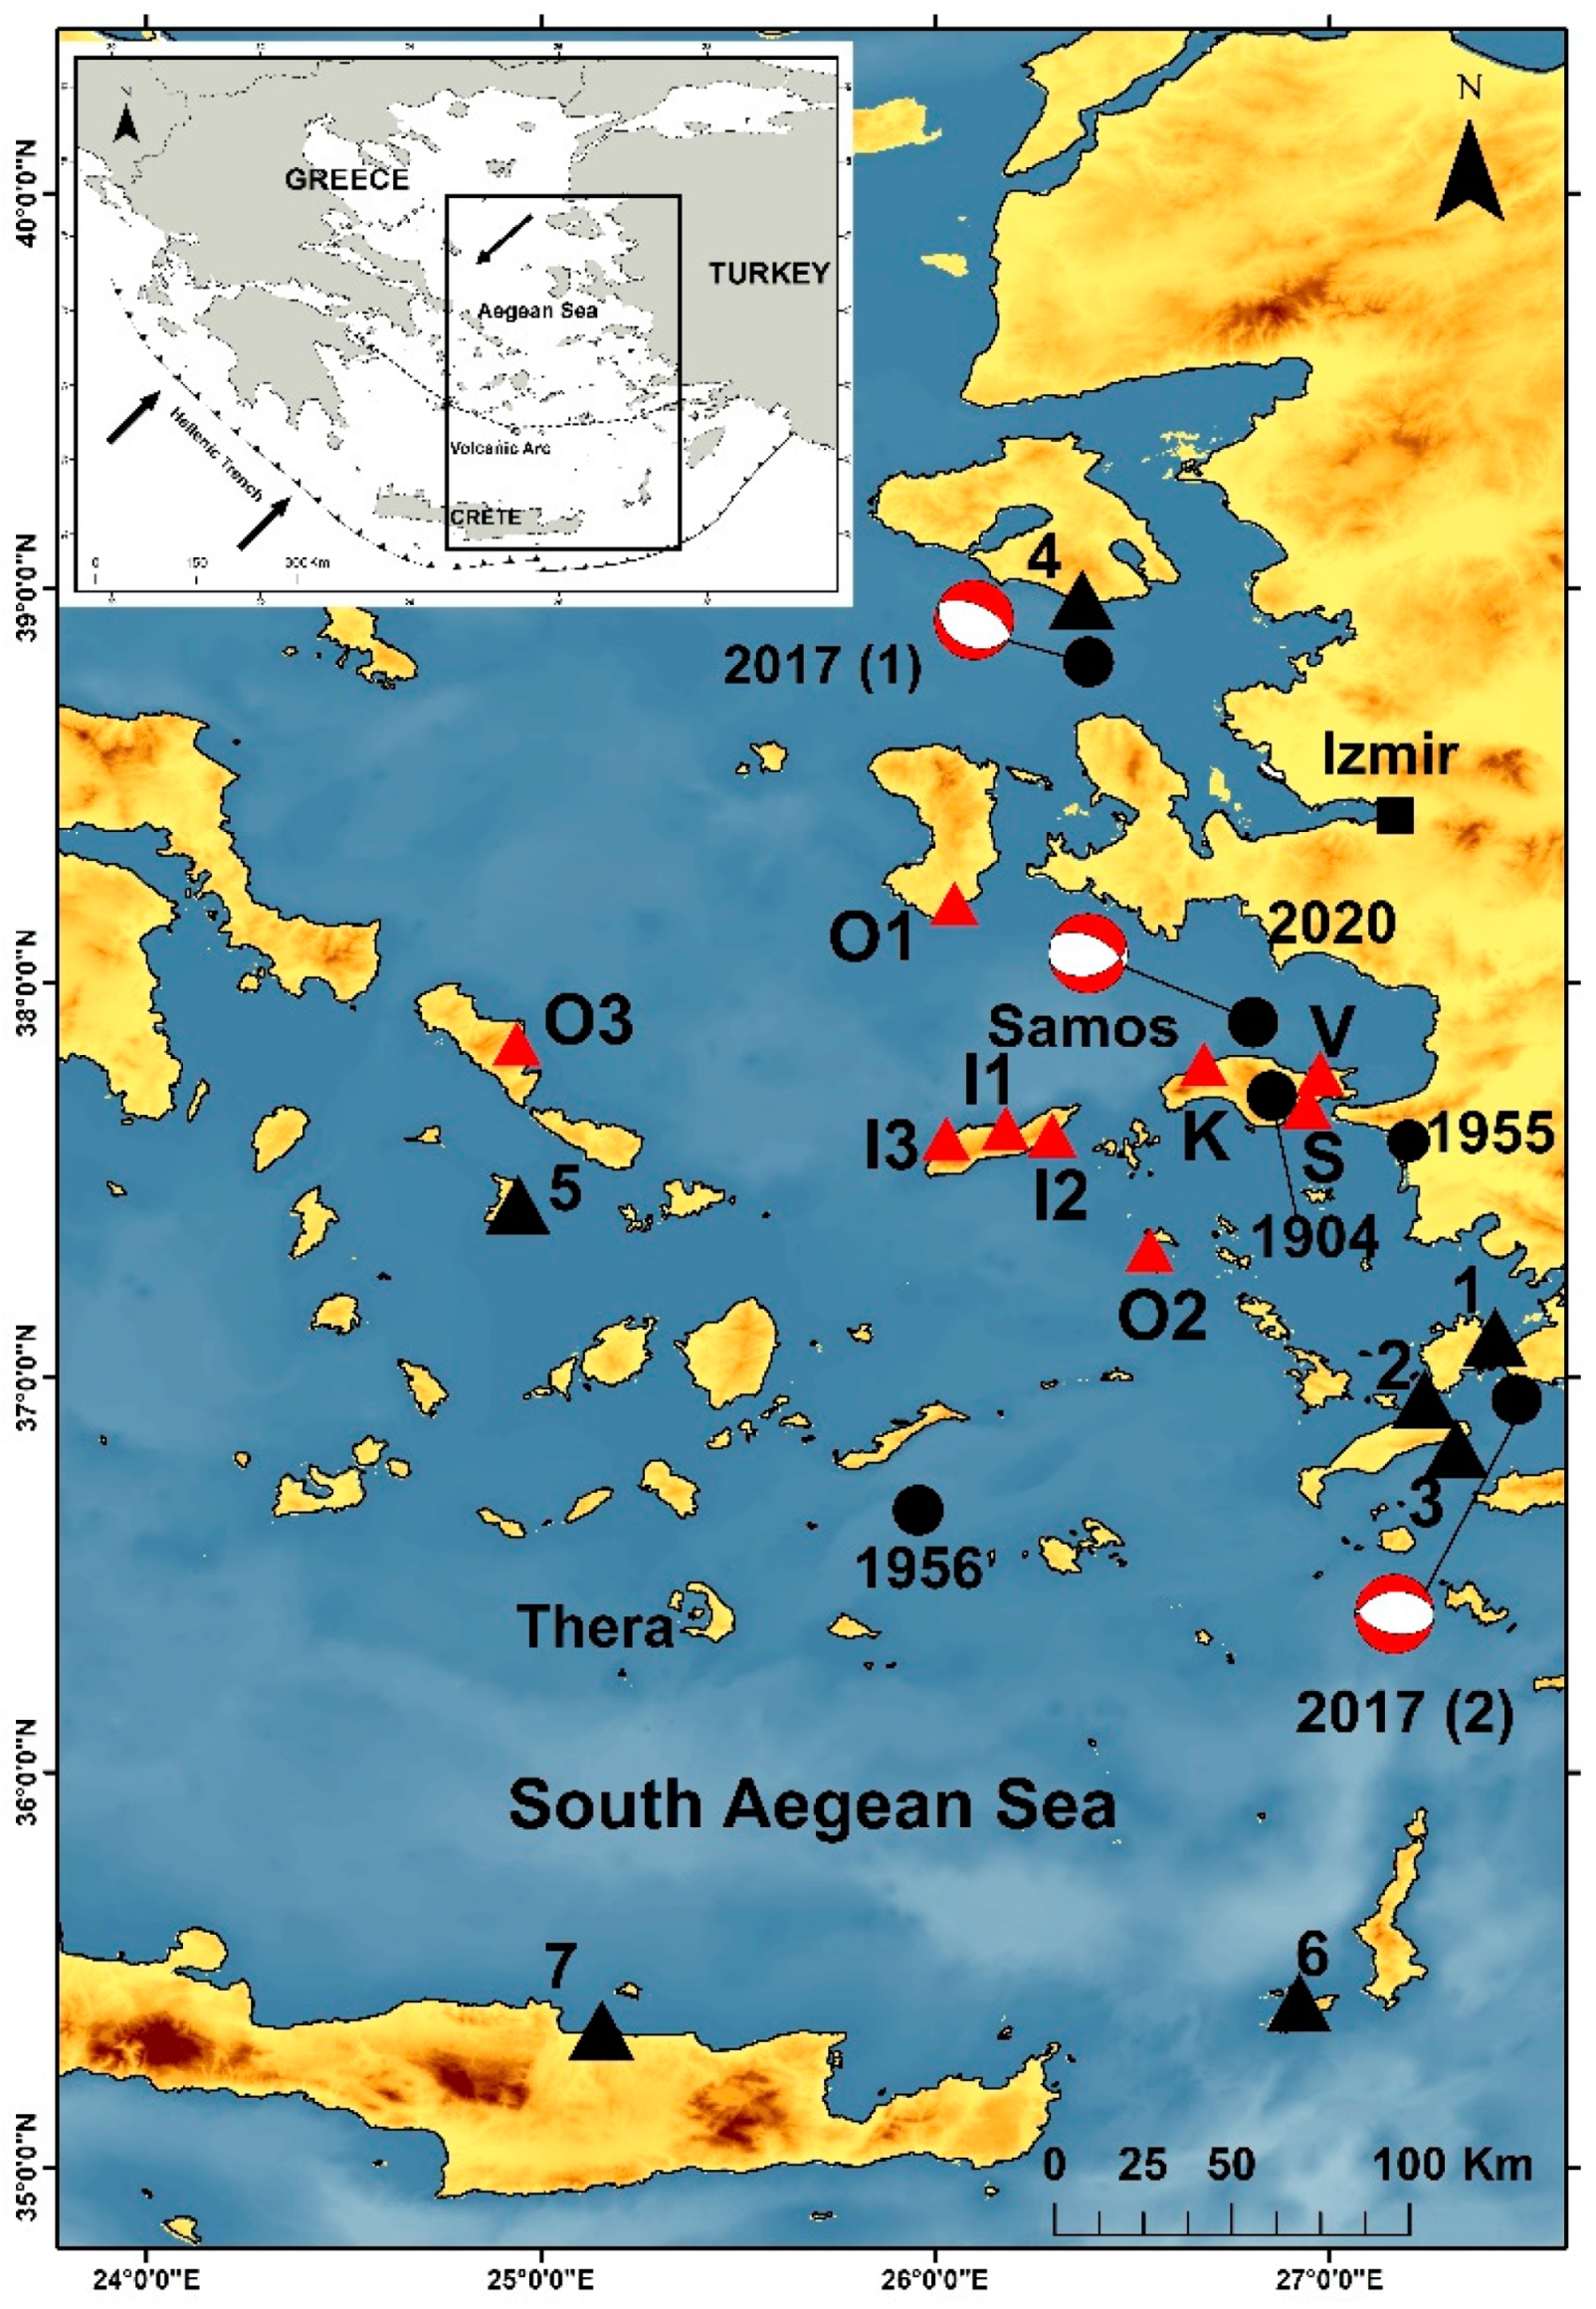
:1. Introduction
2. Materials and Methods
2.1. Methods Outline
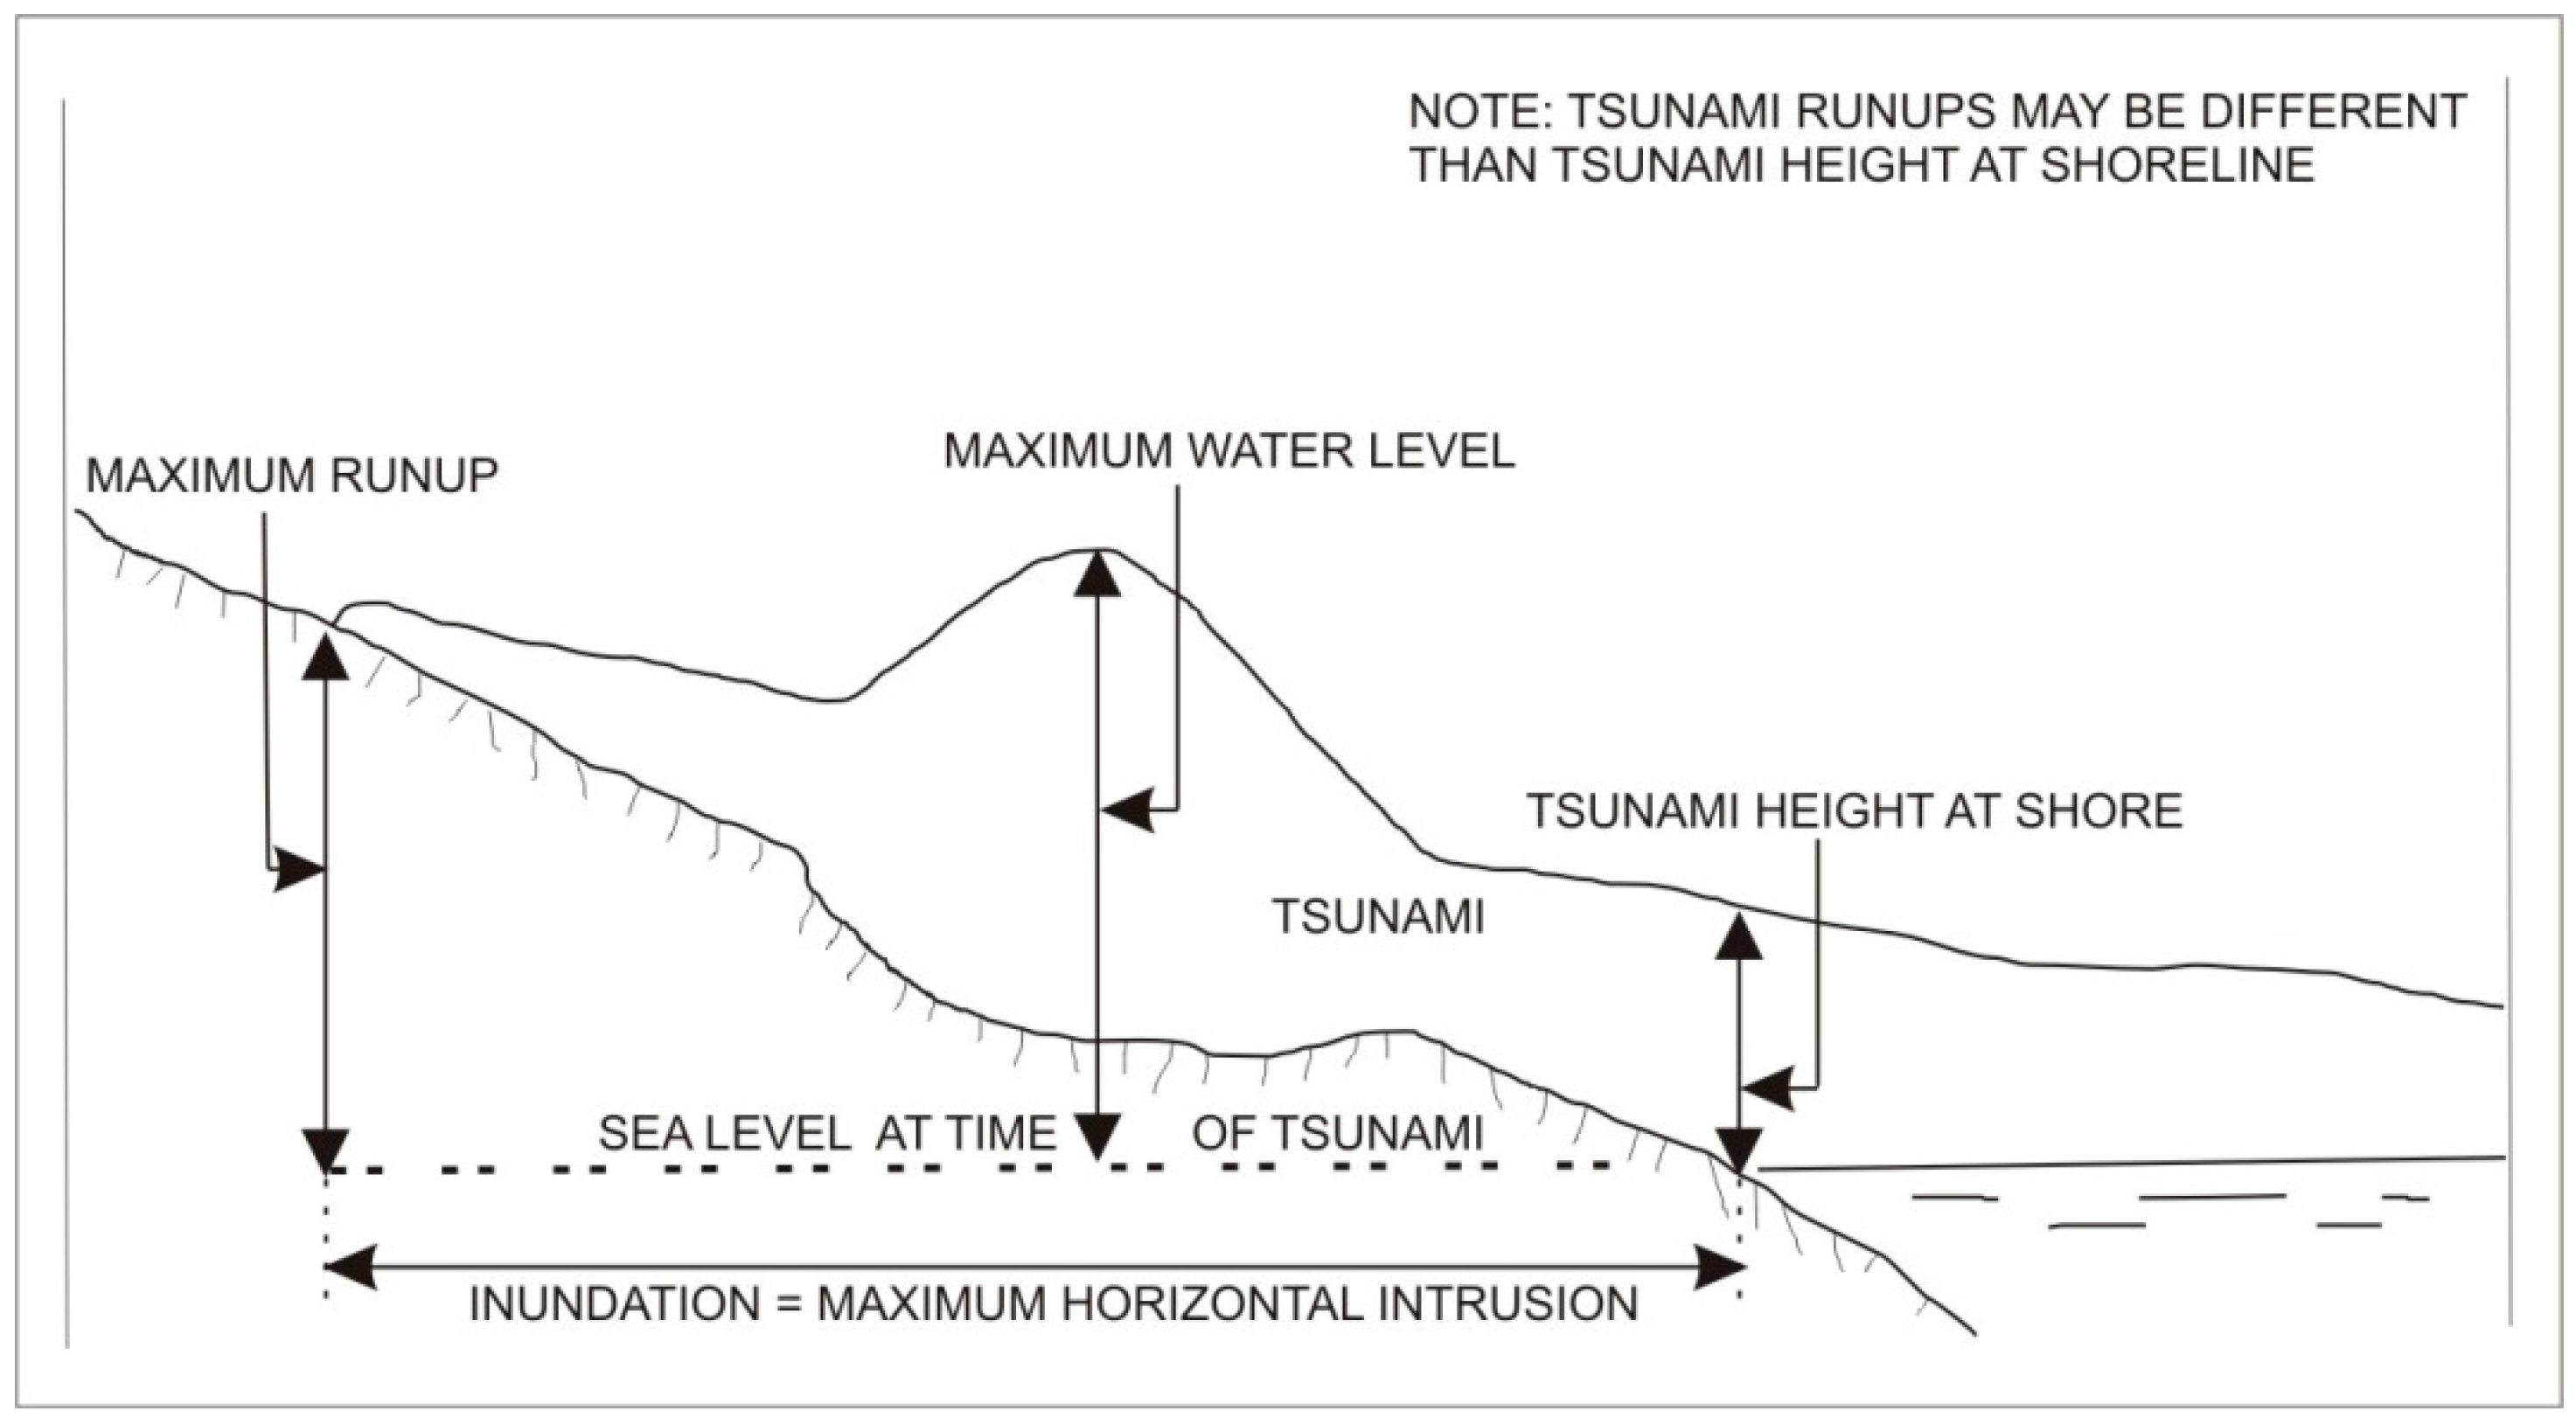
2.2. Tsunami Observations
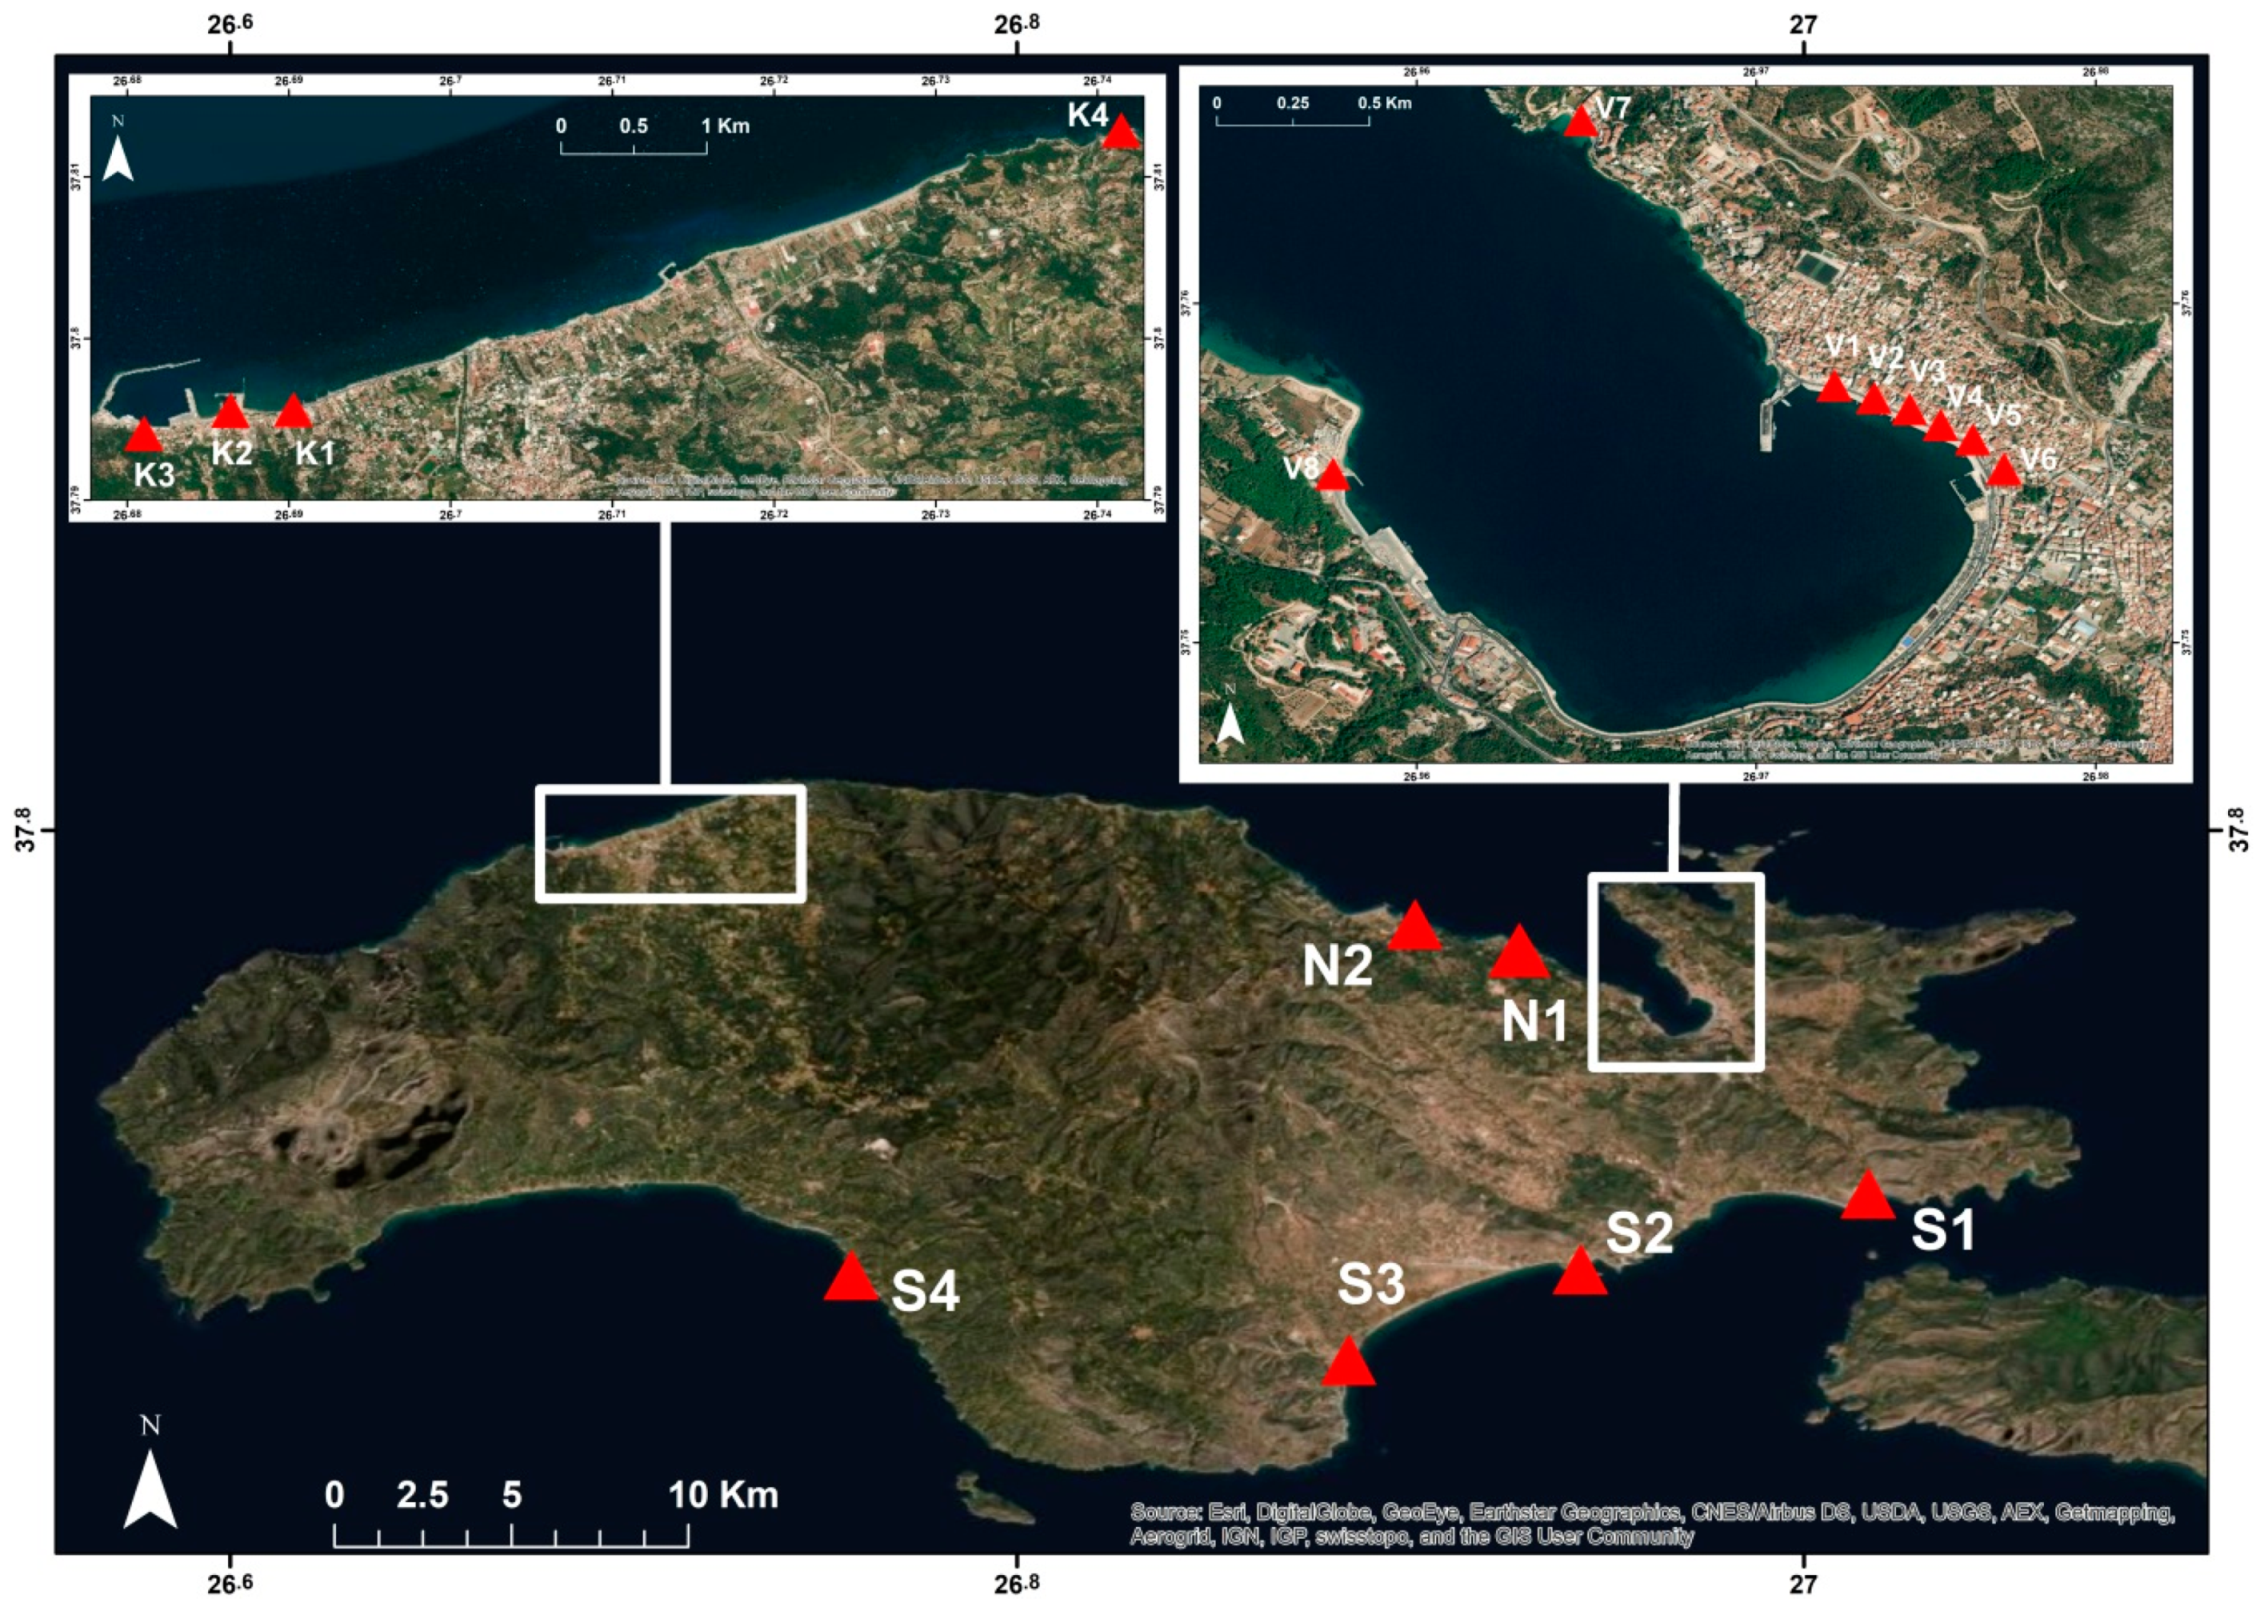
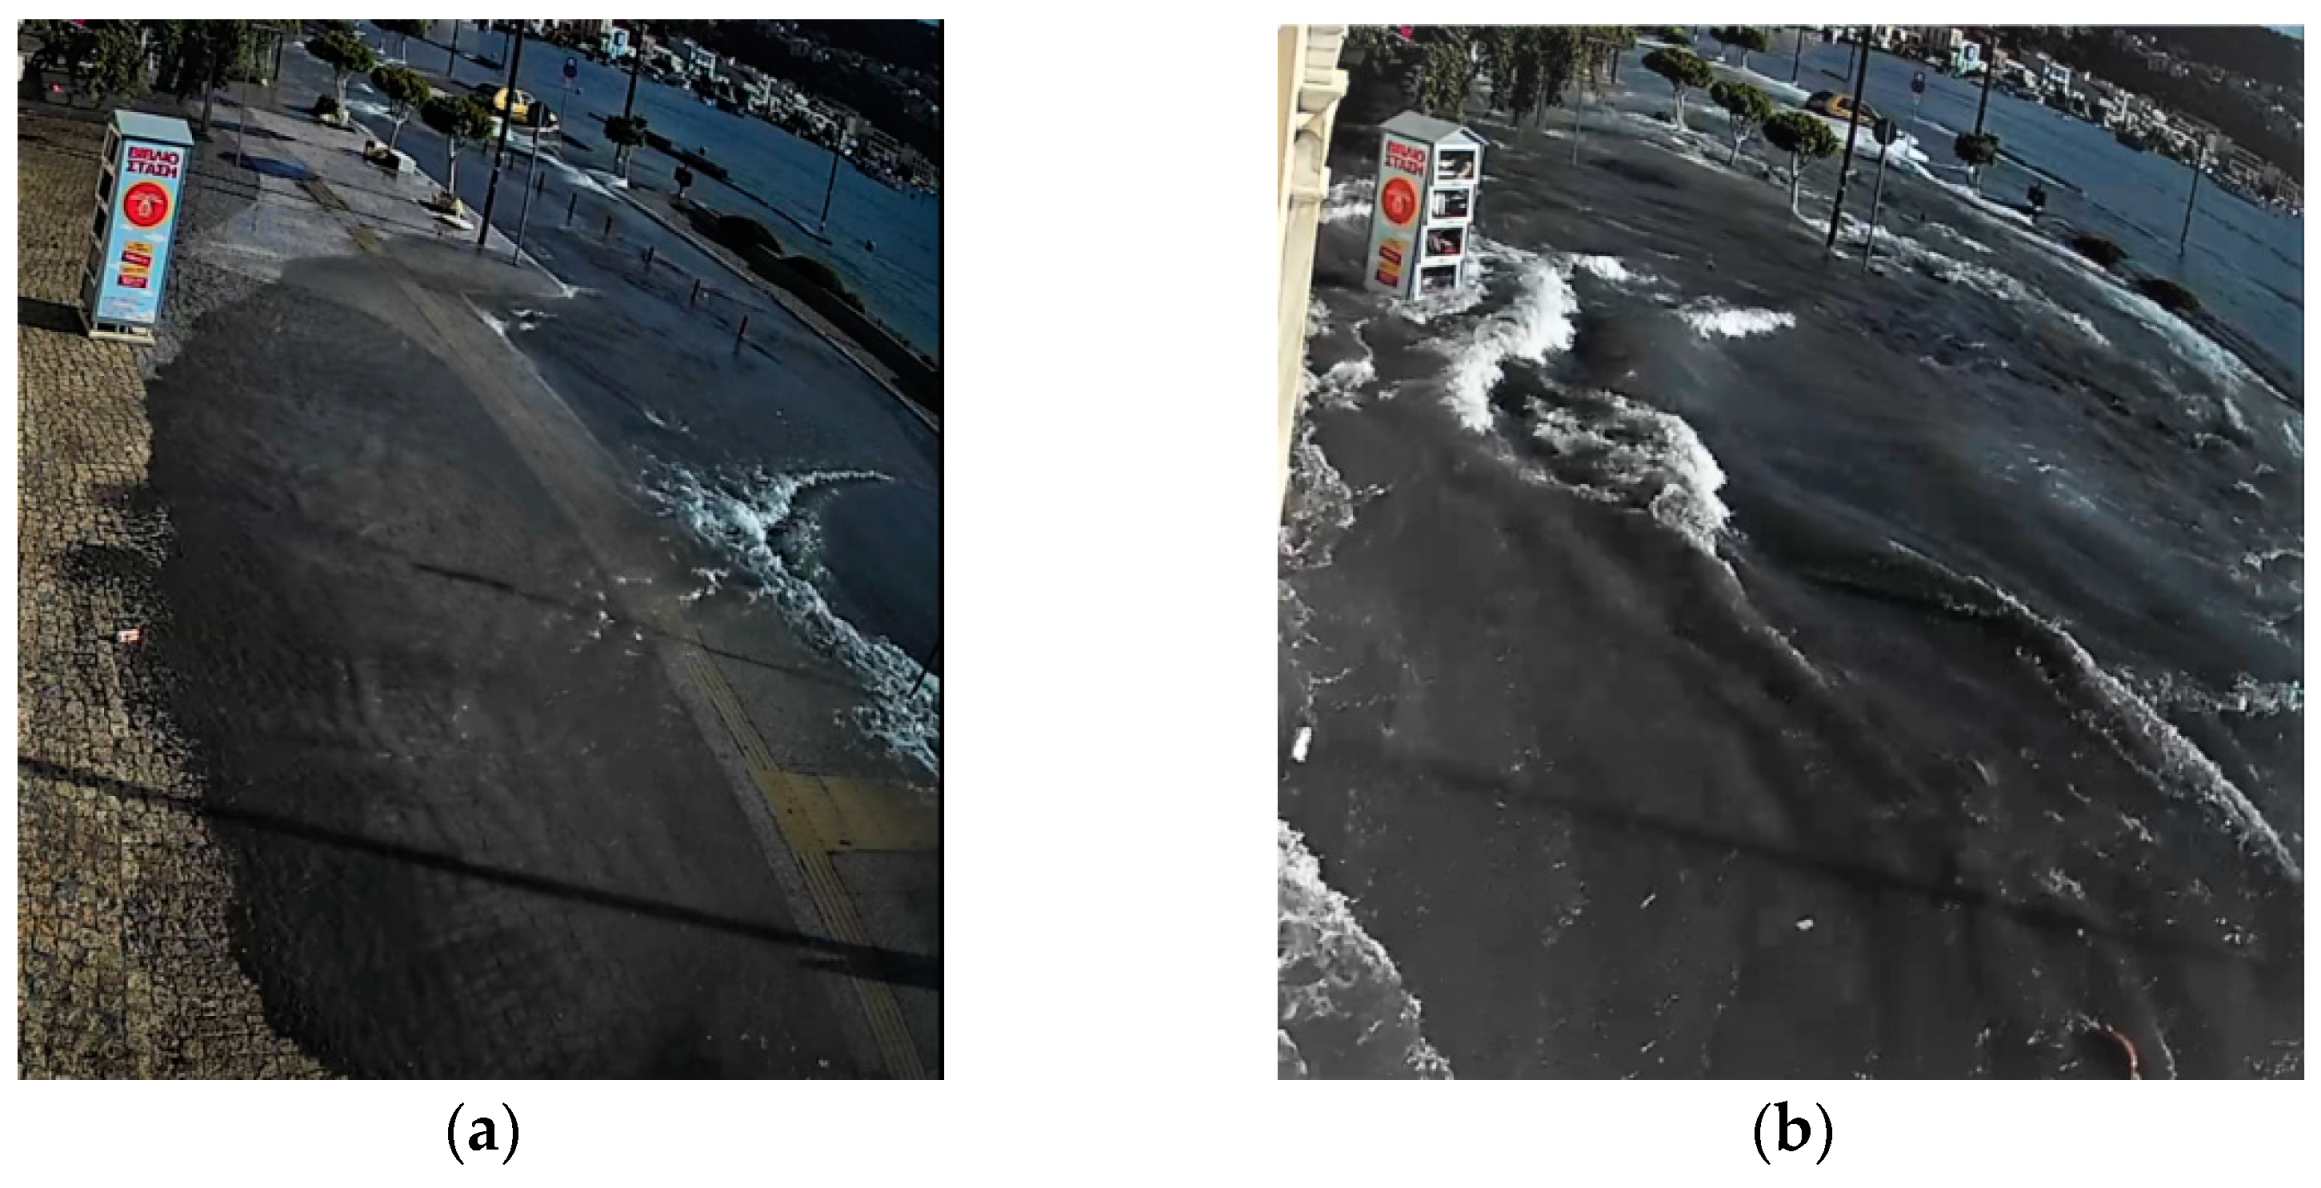
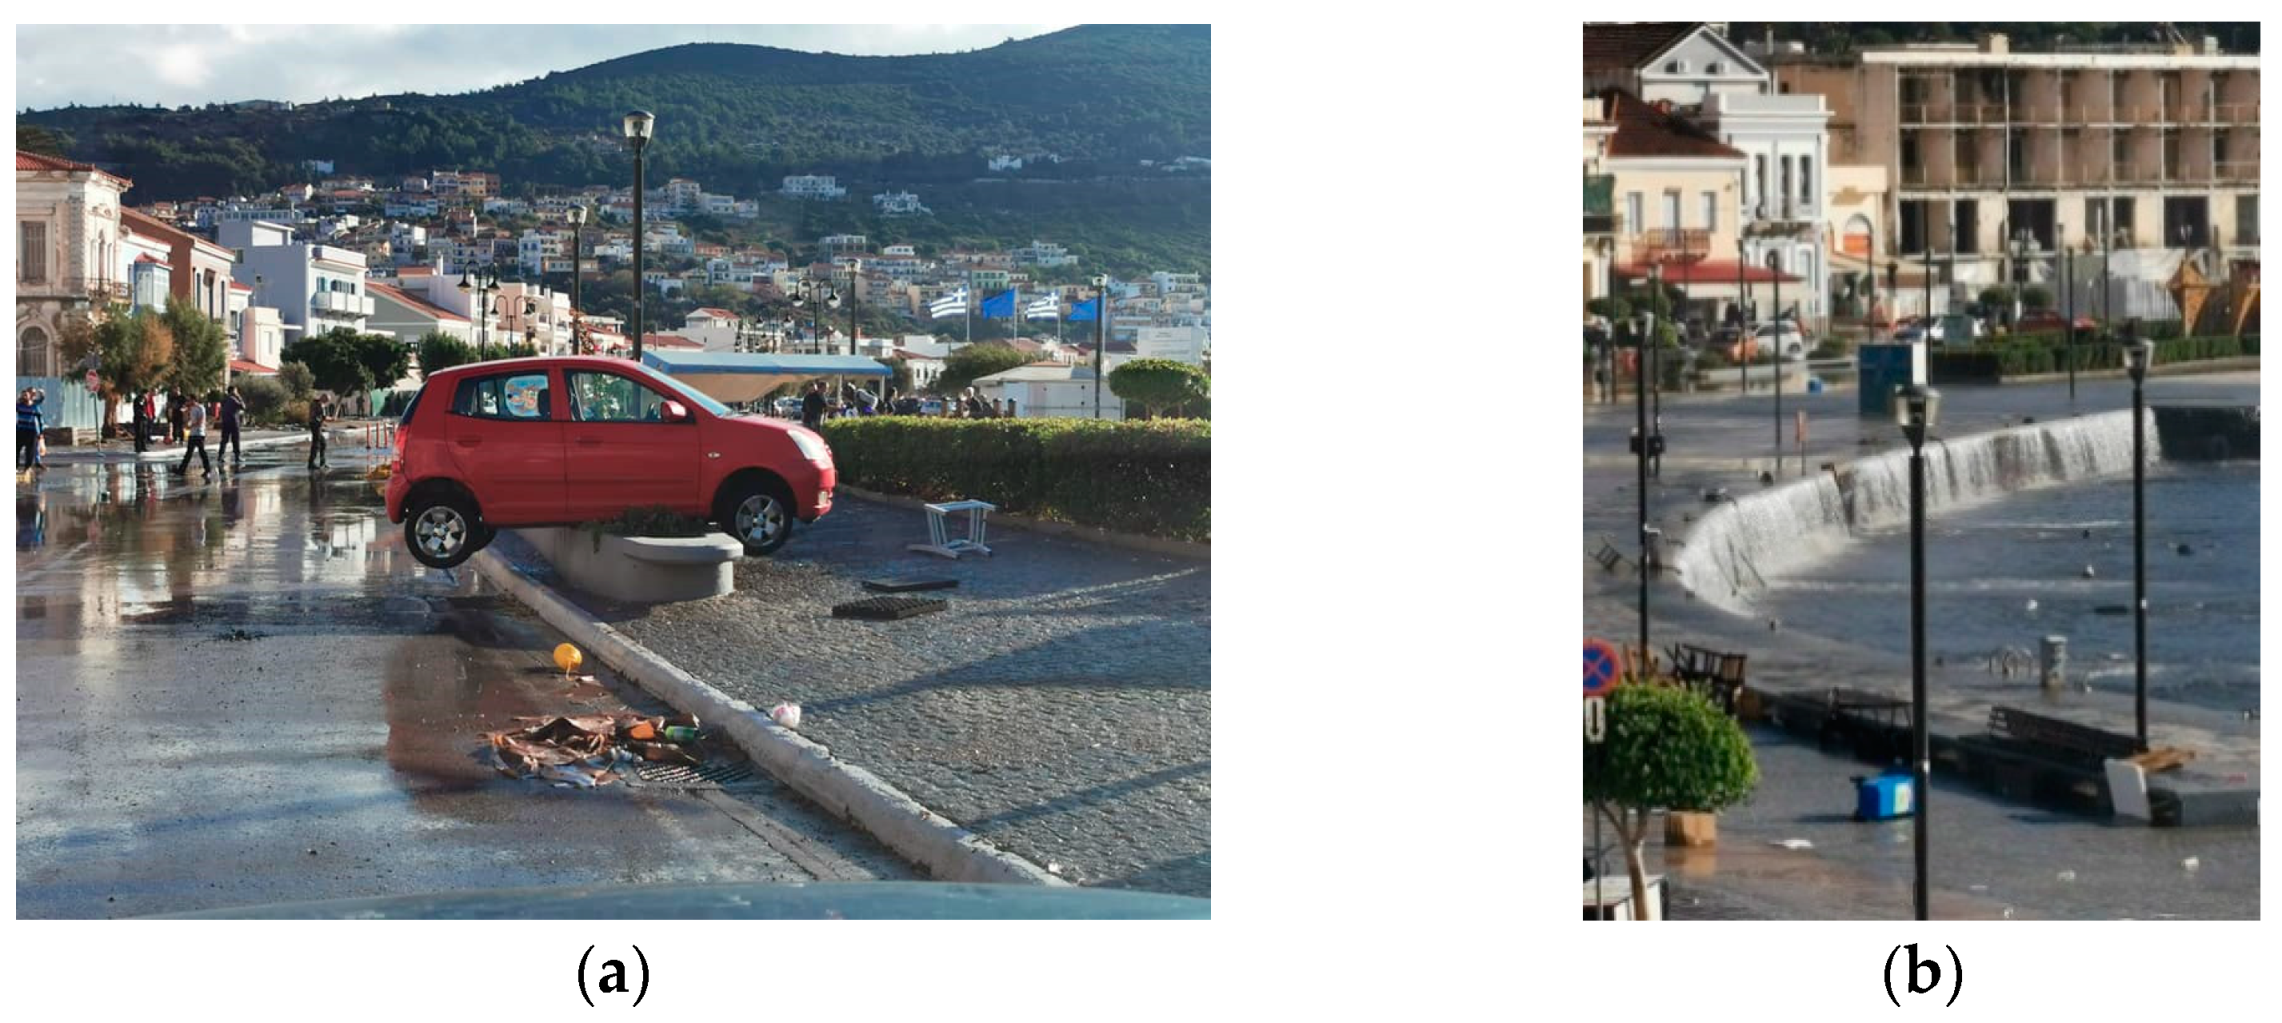
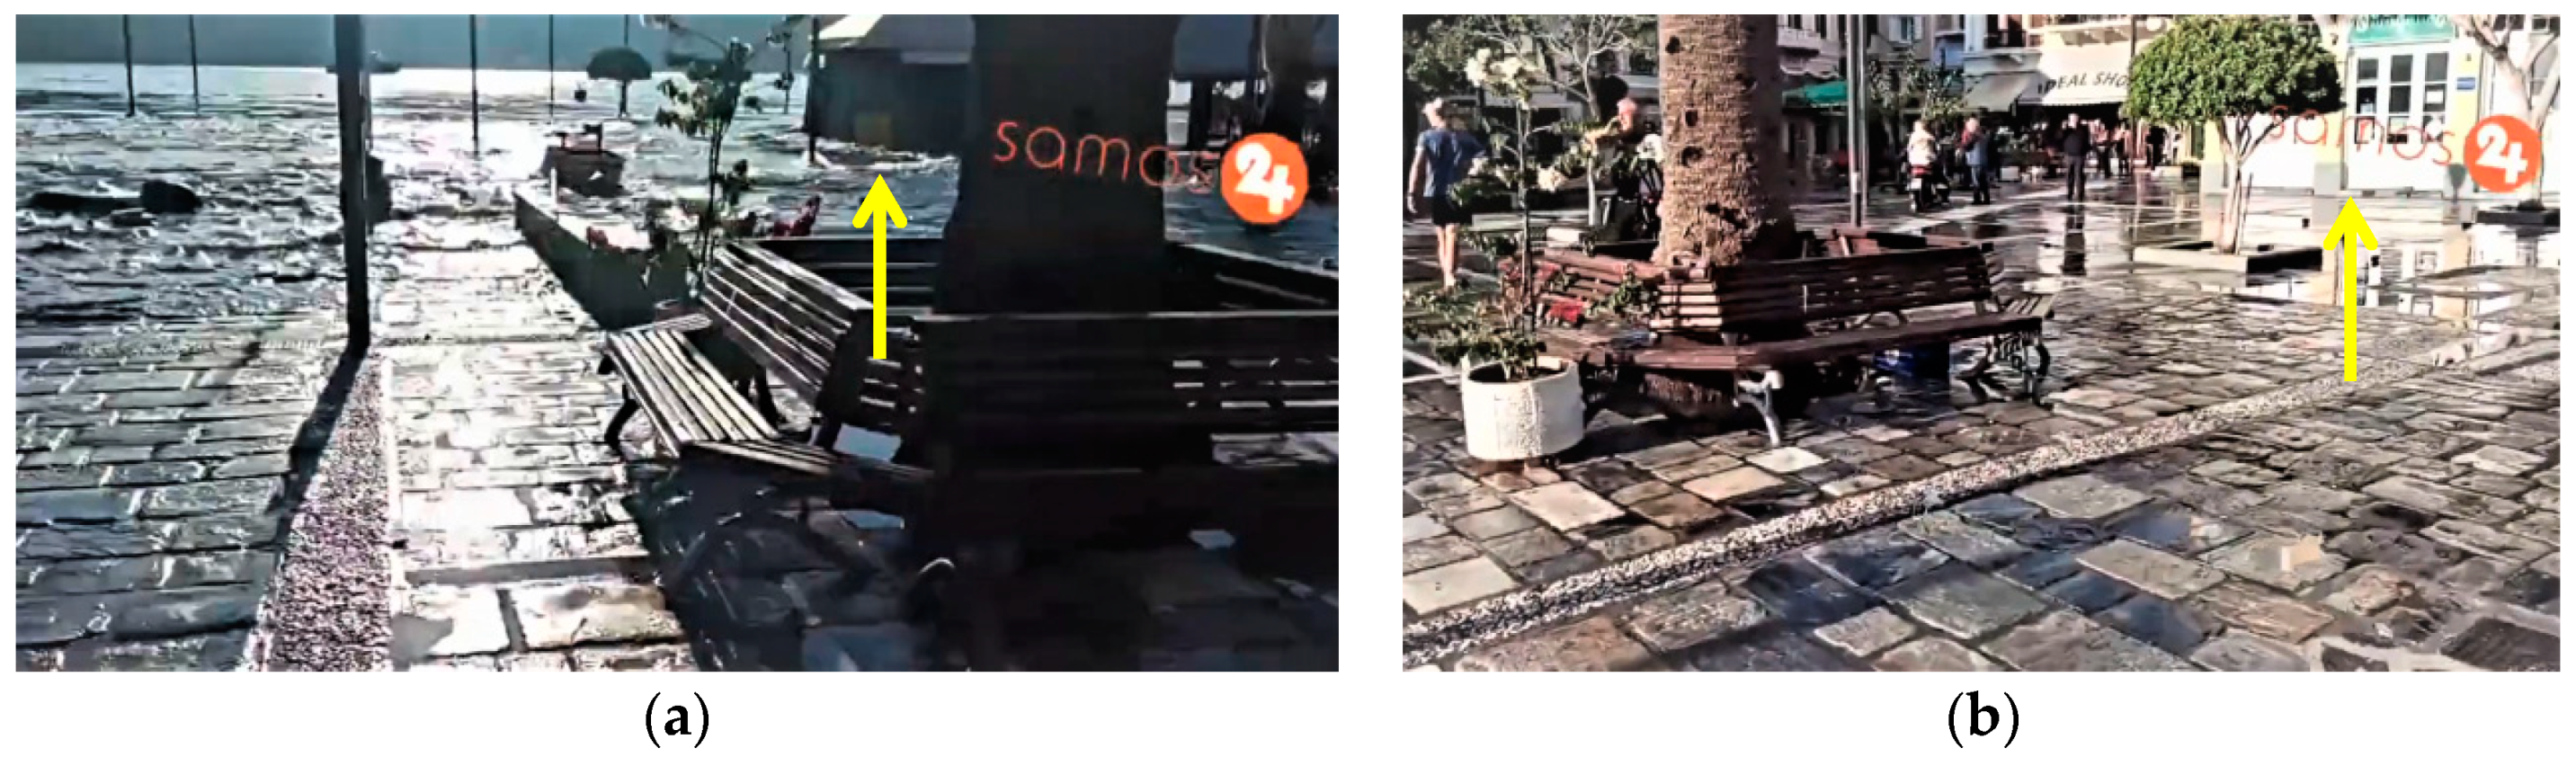
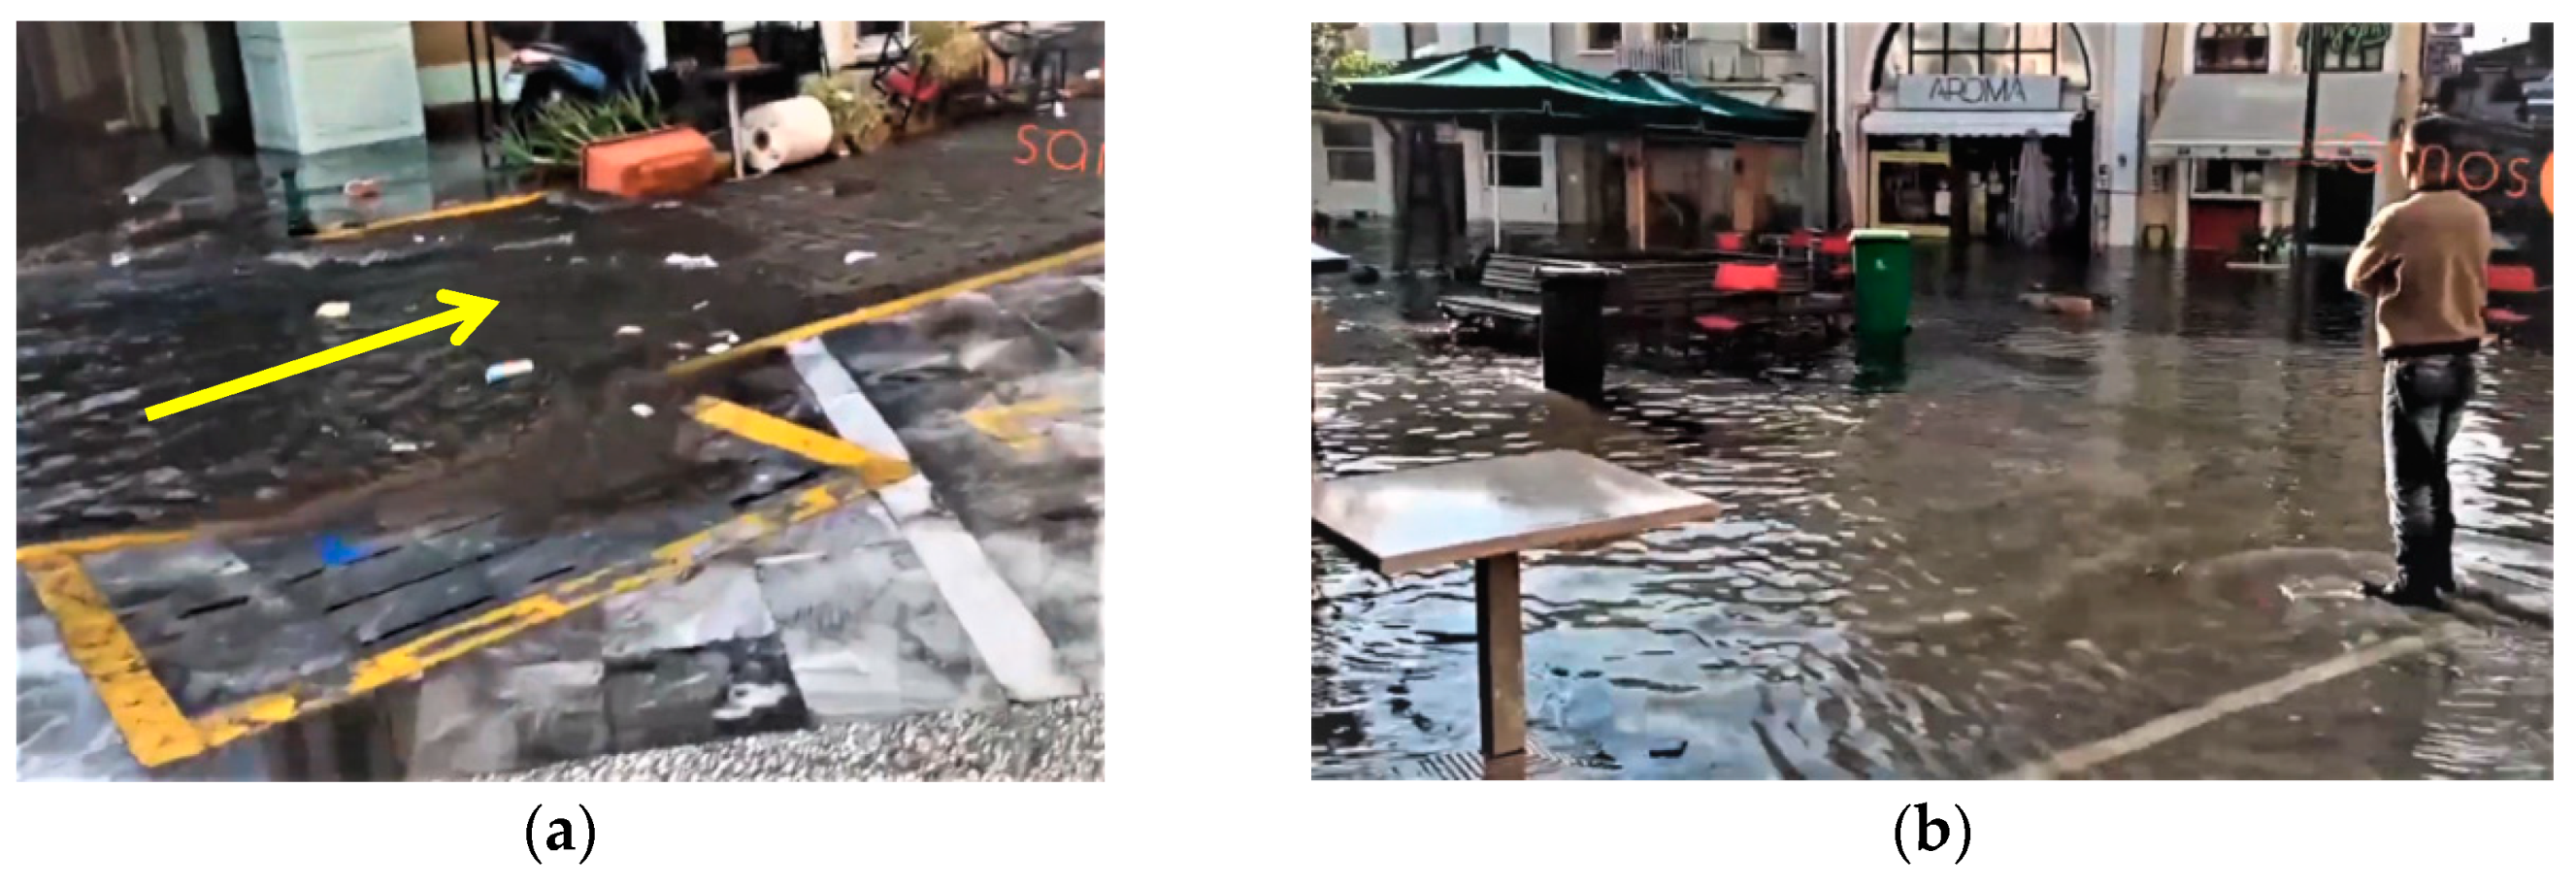
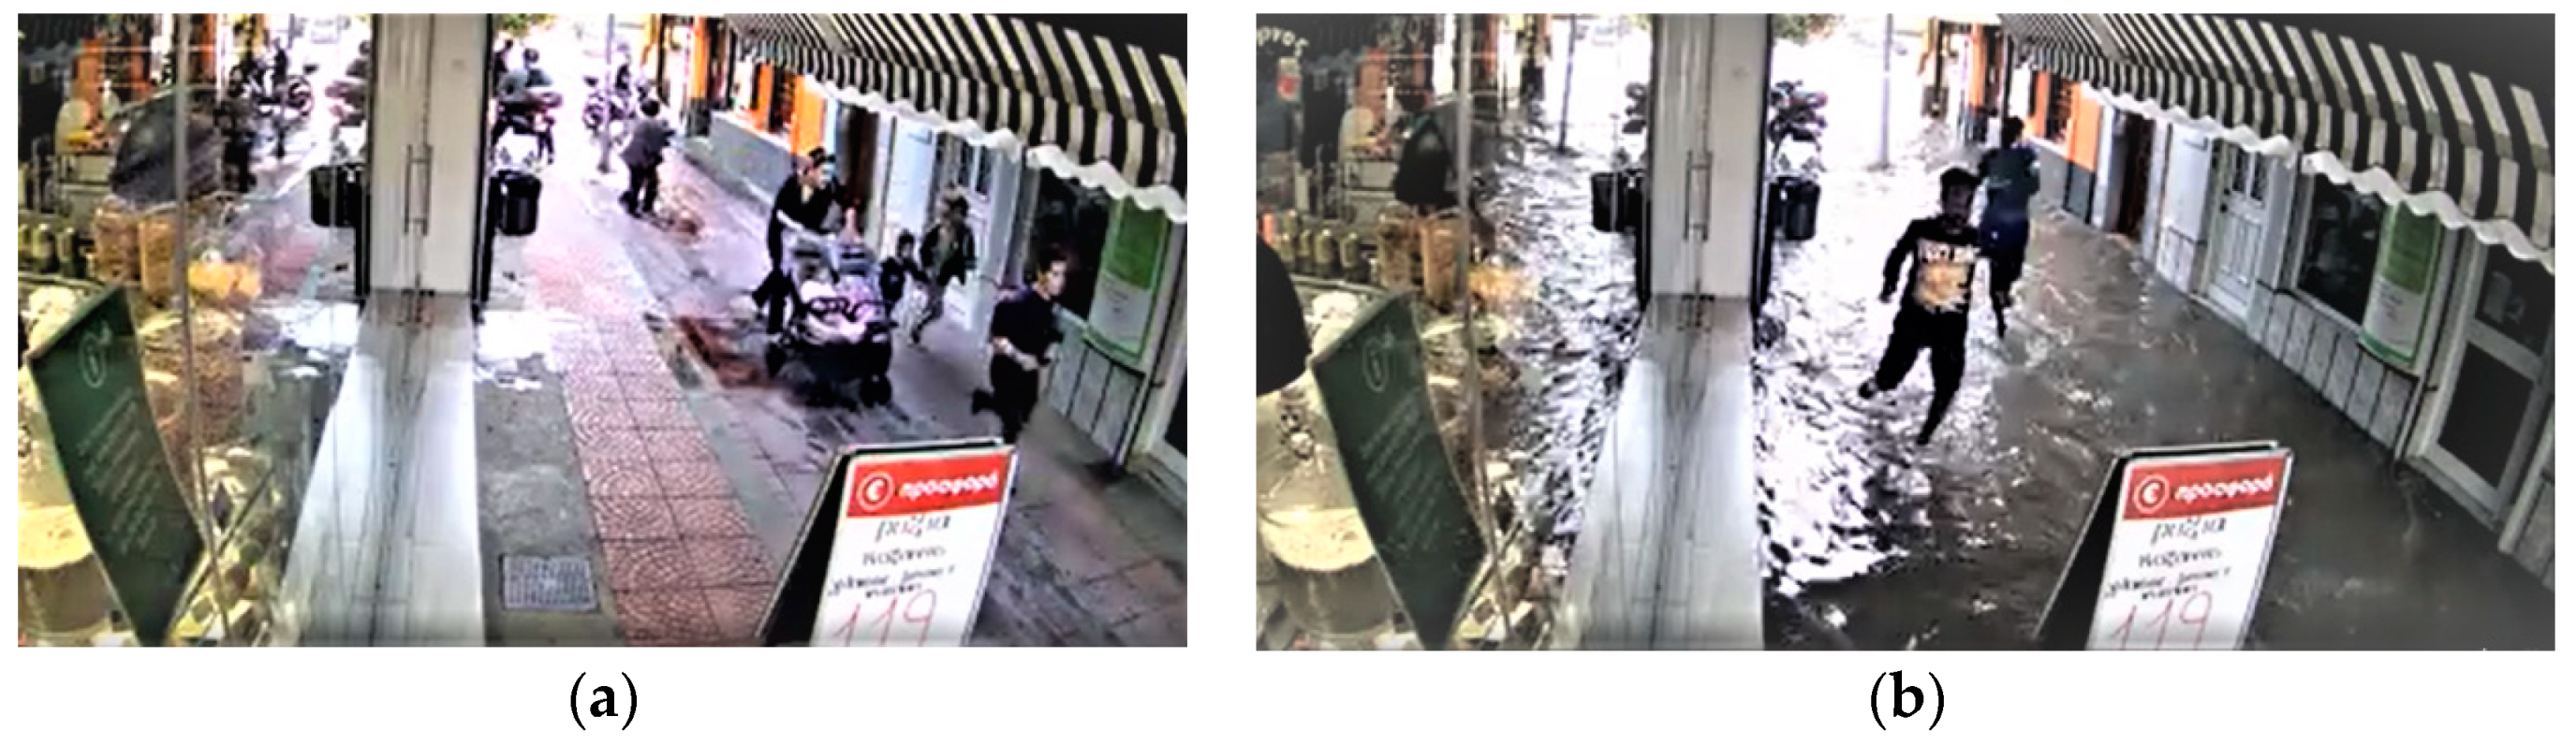
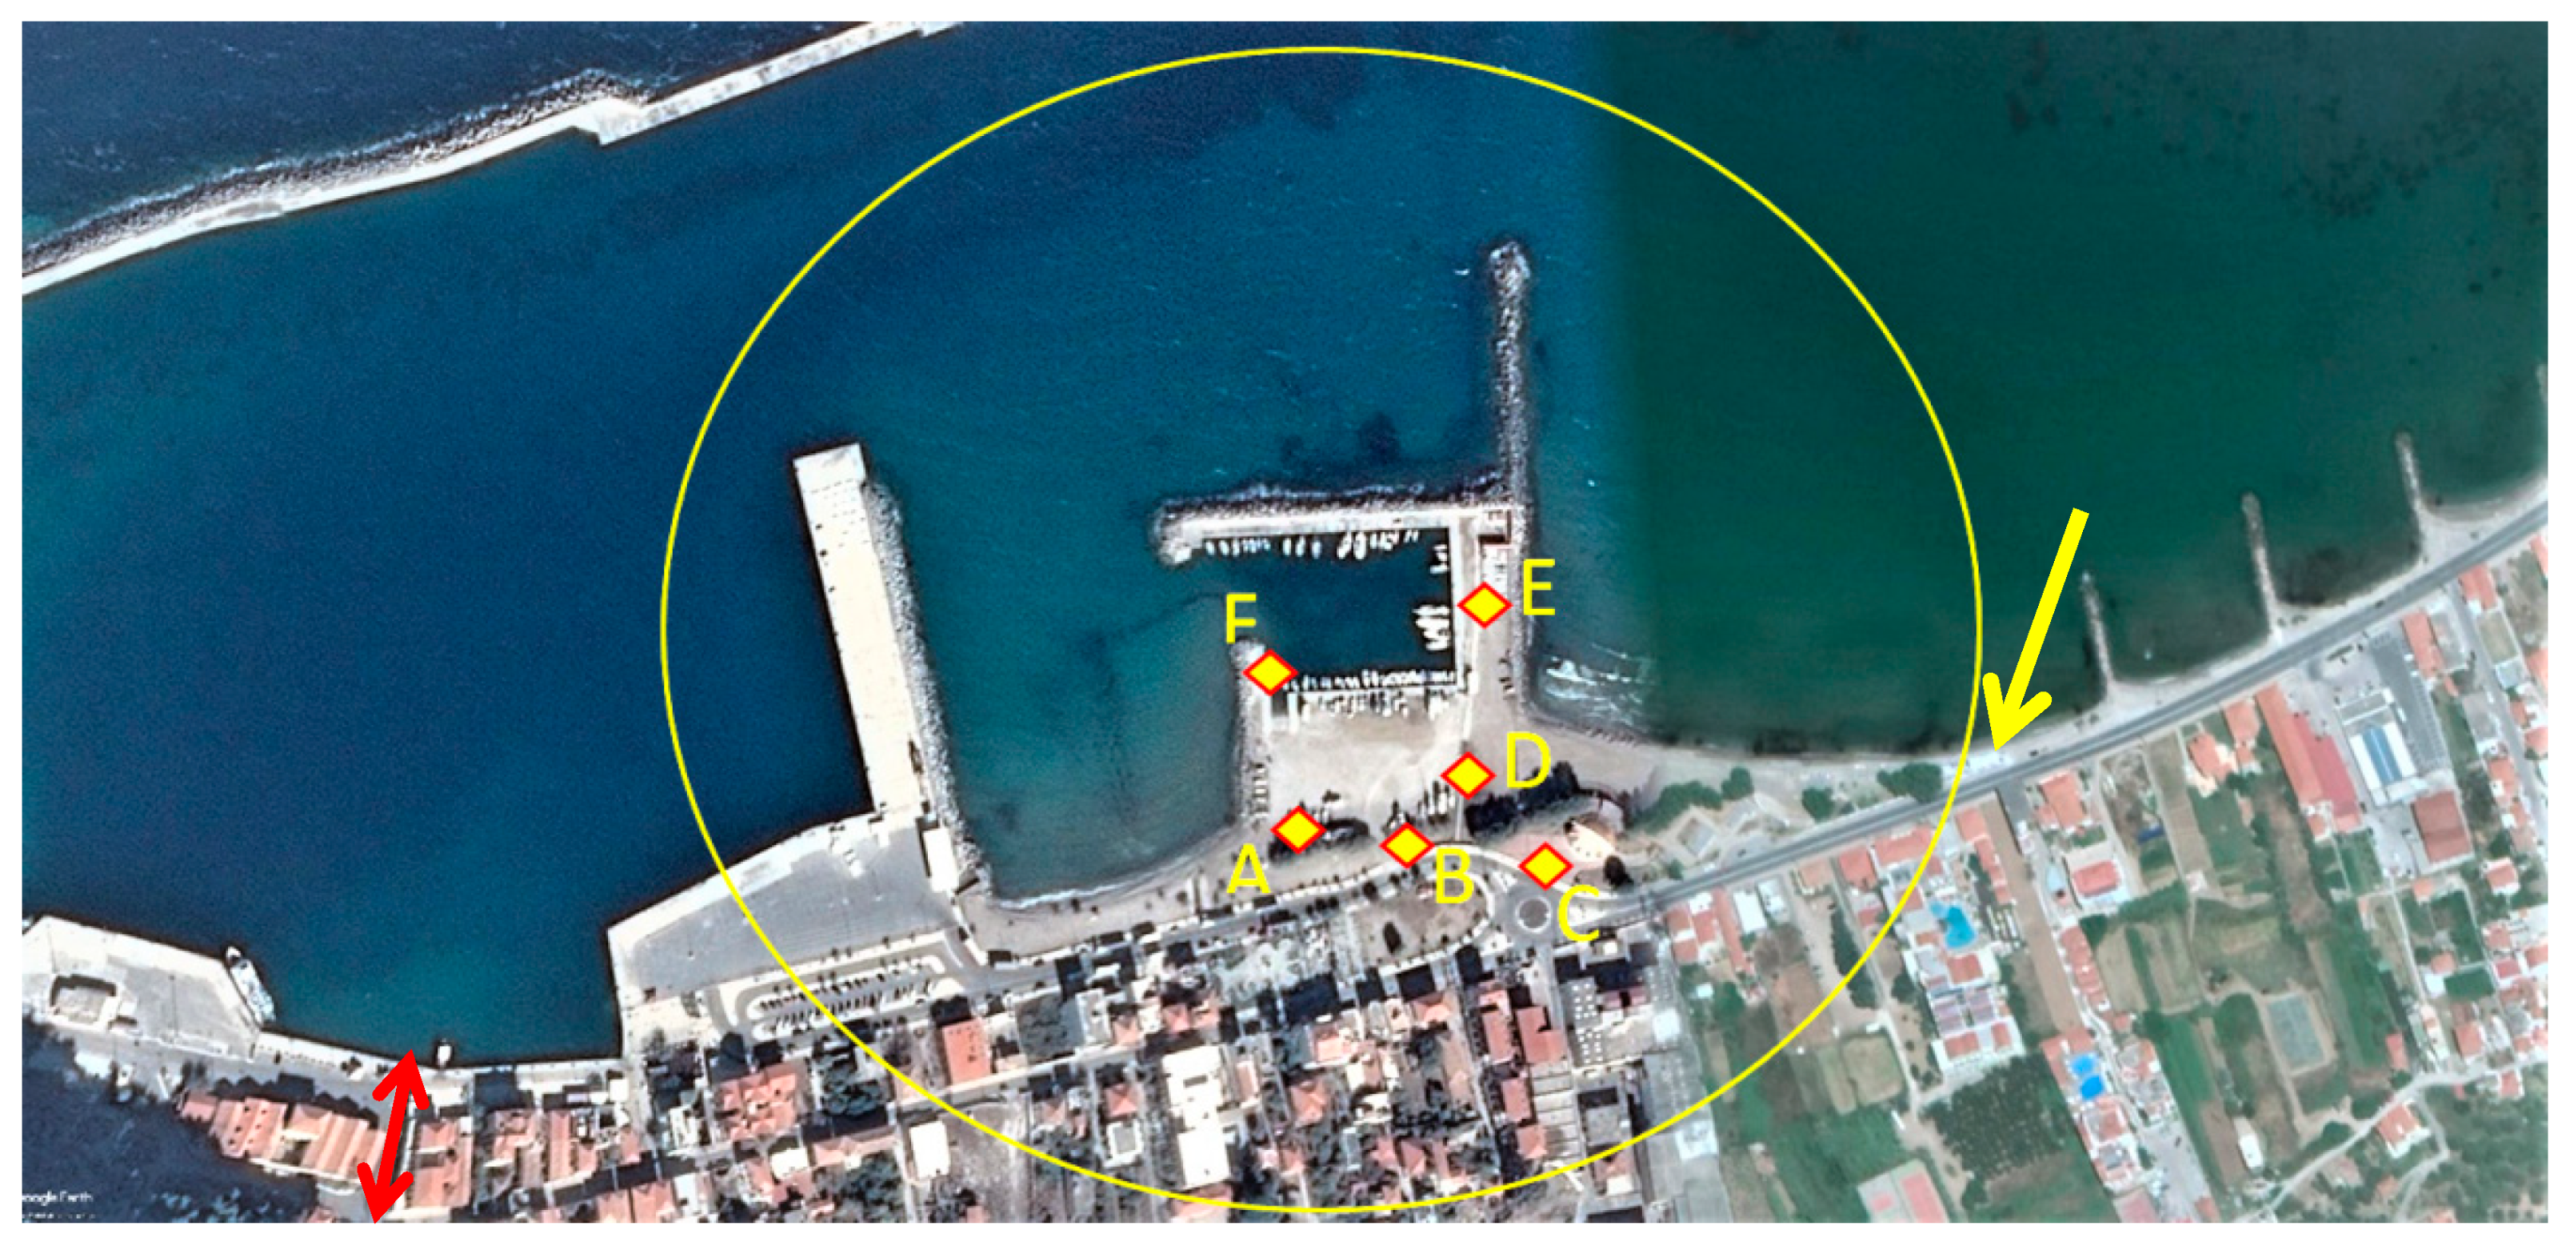
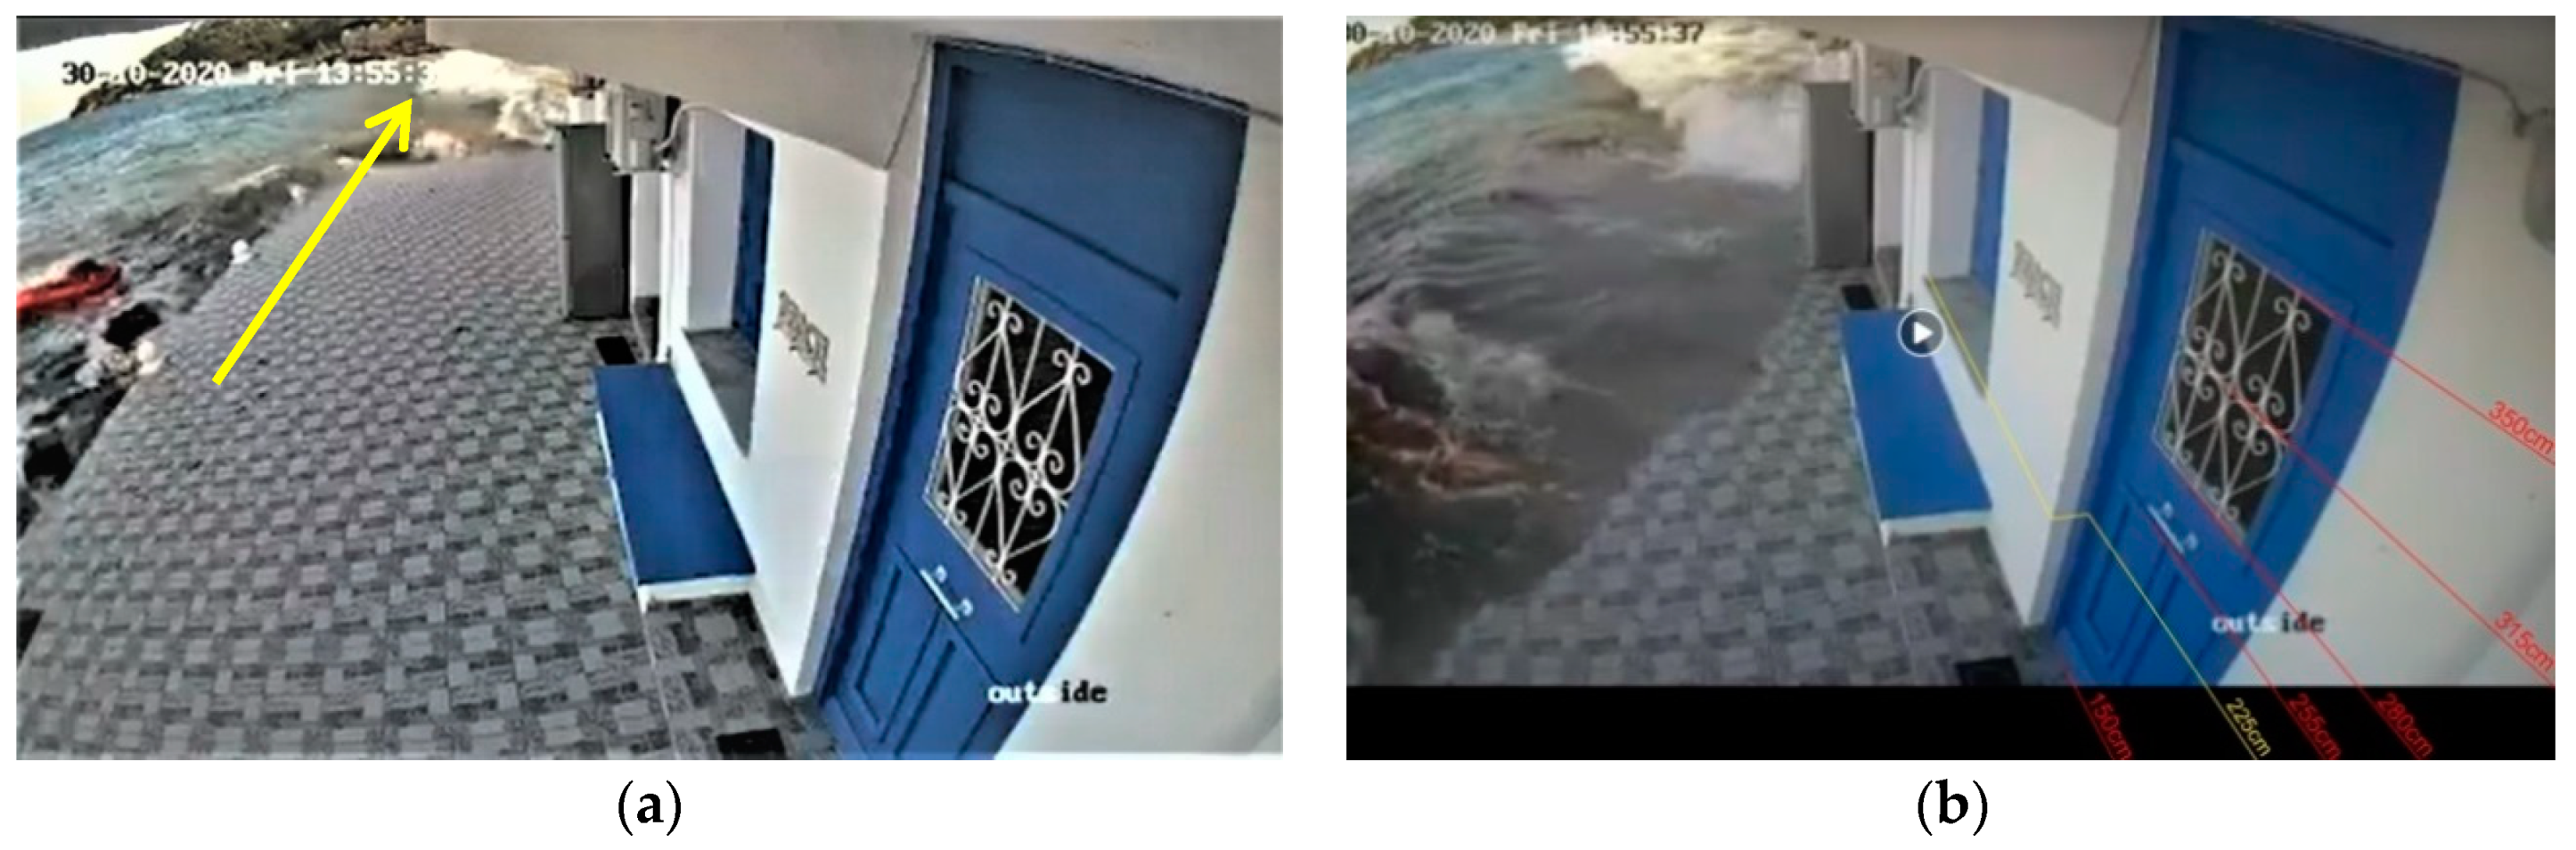
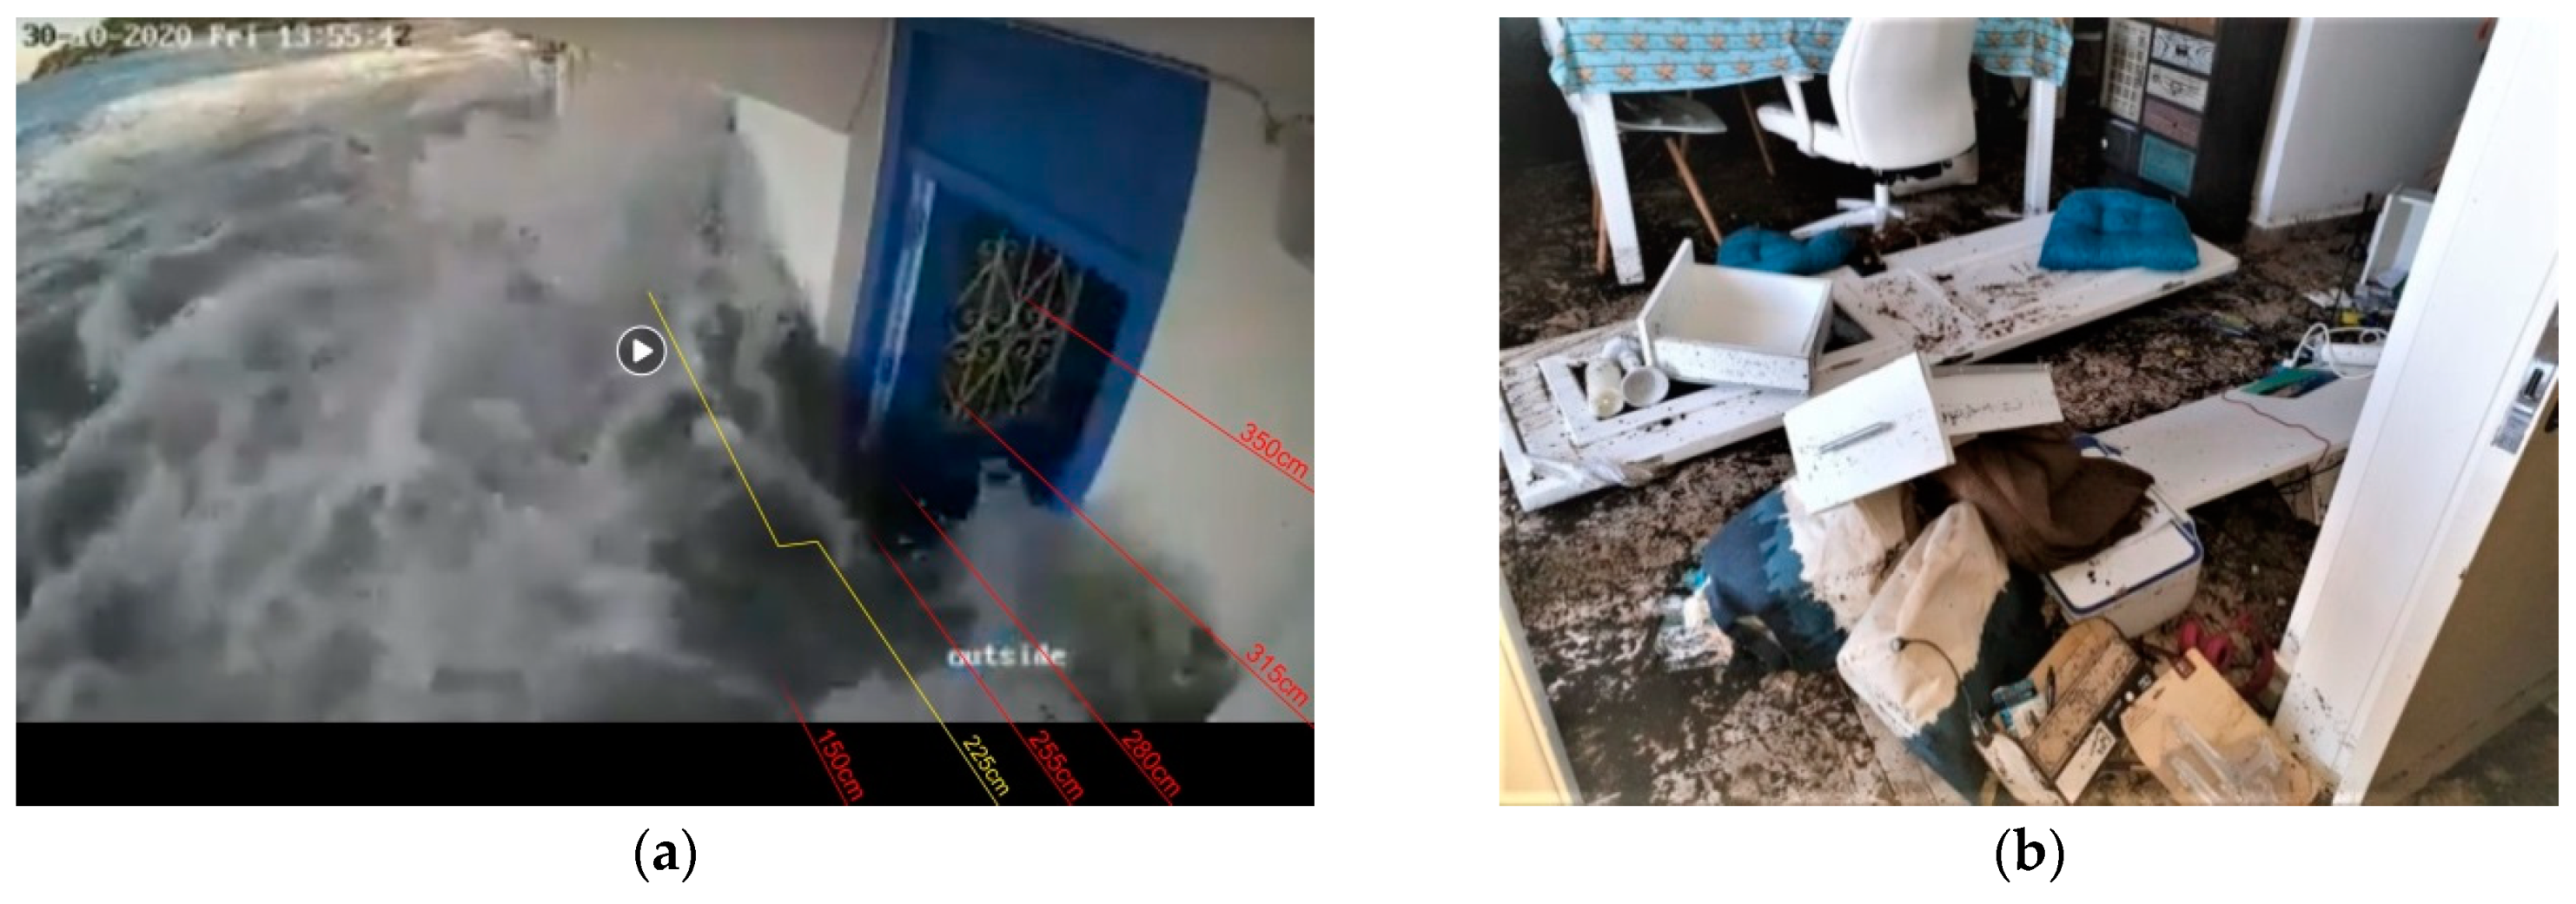
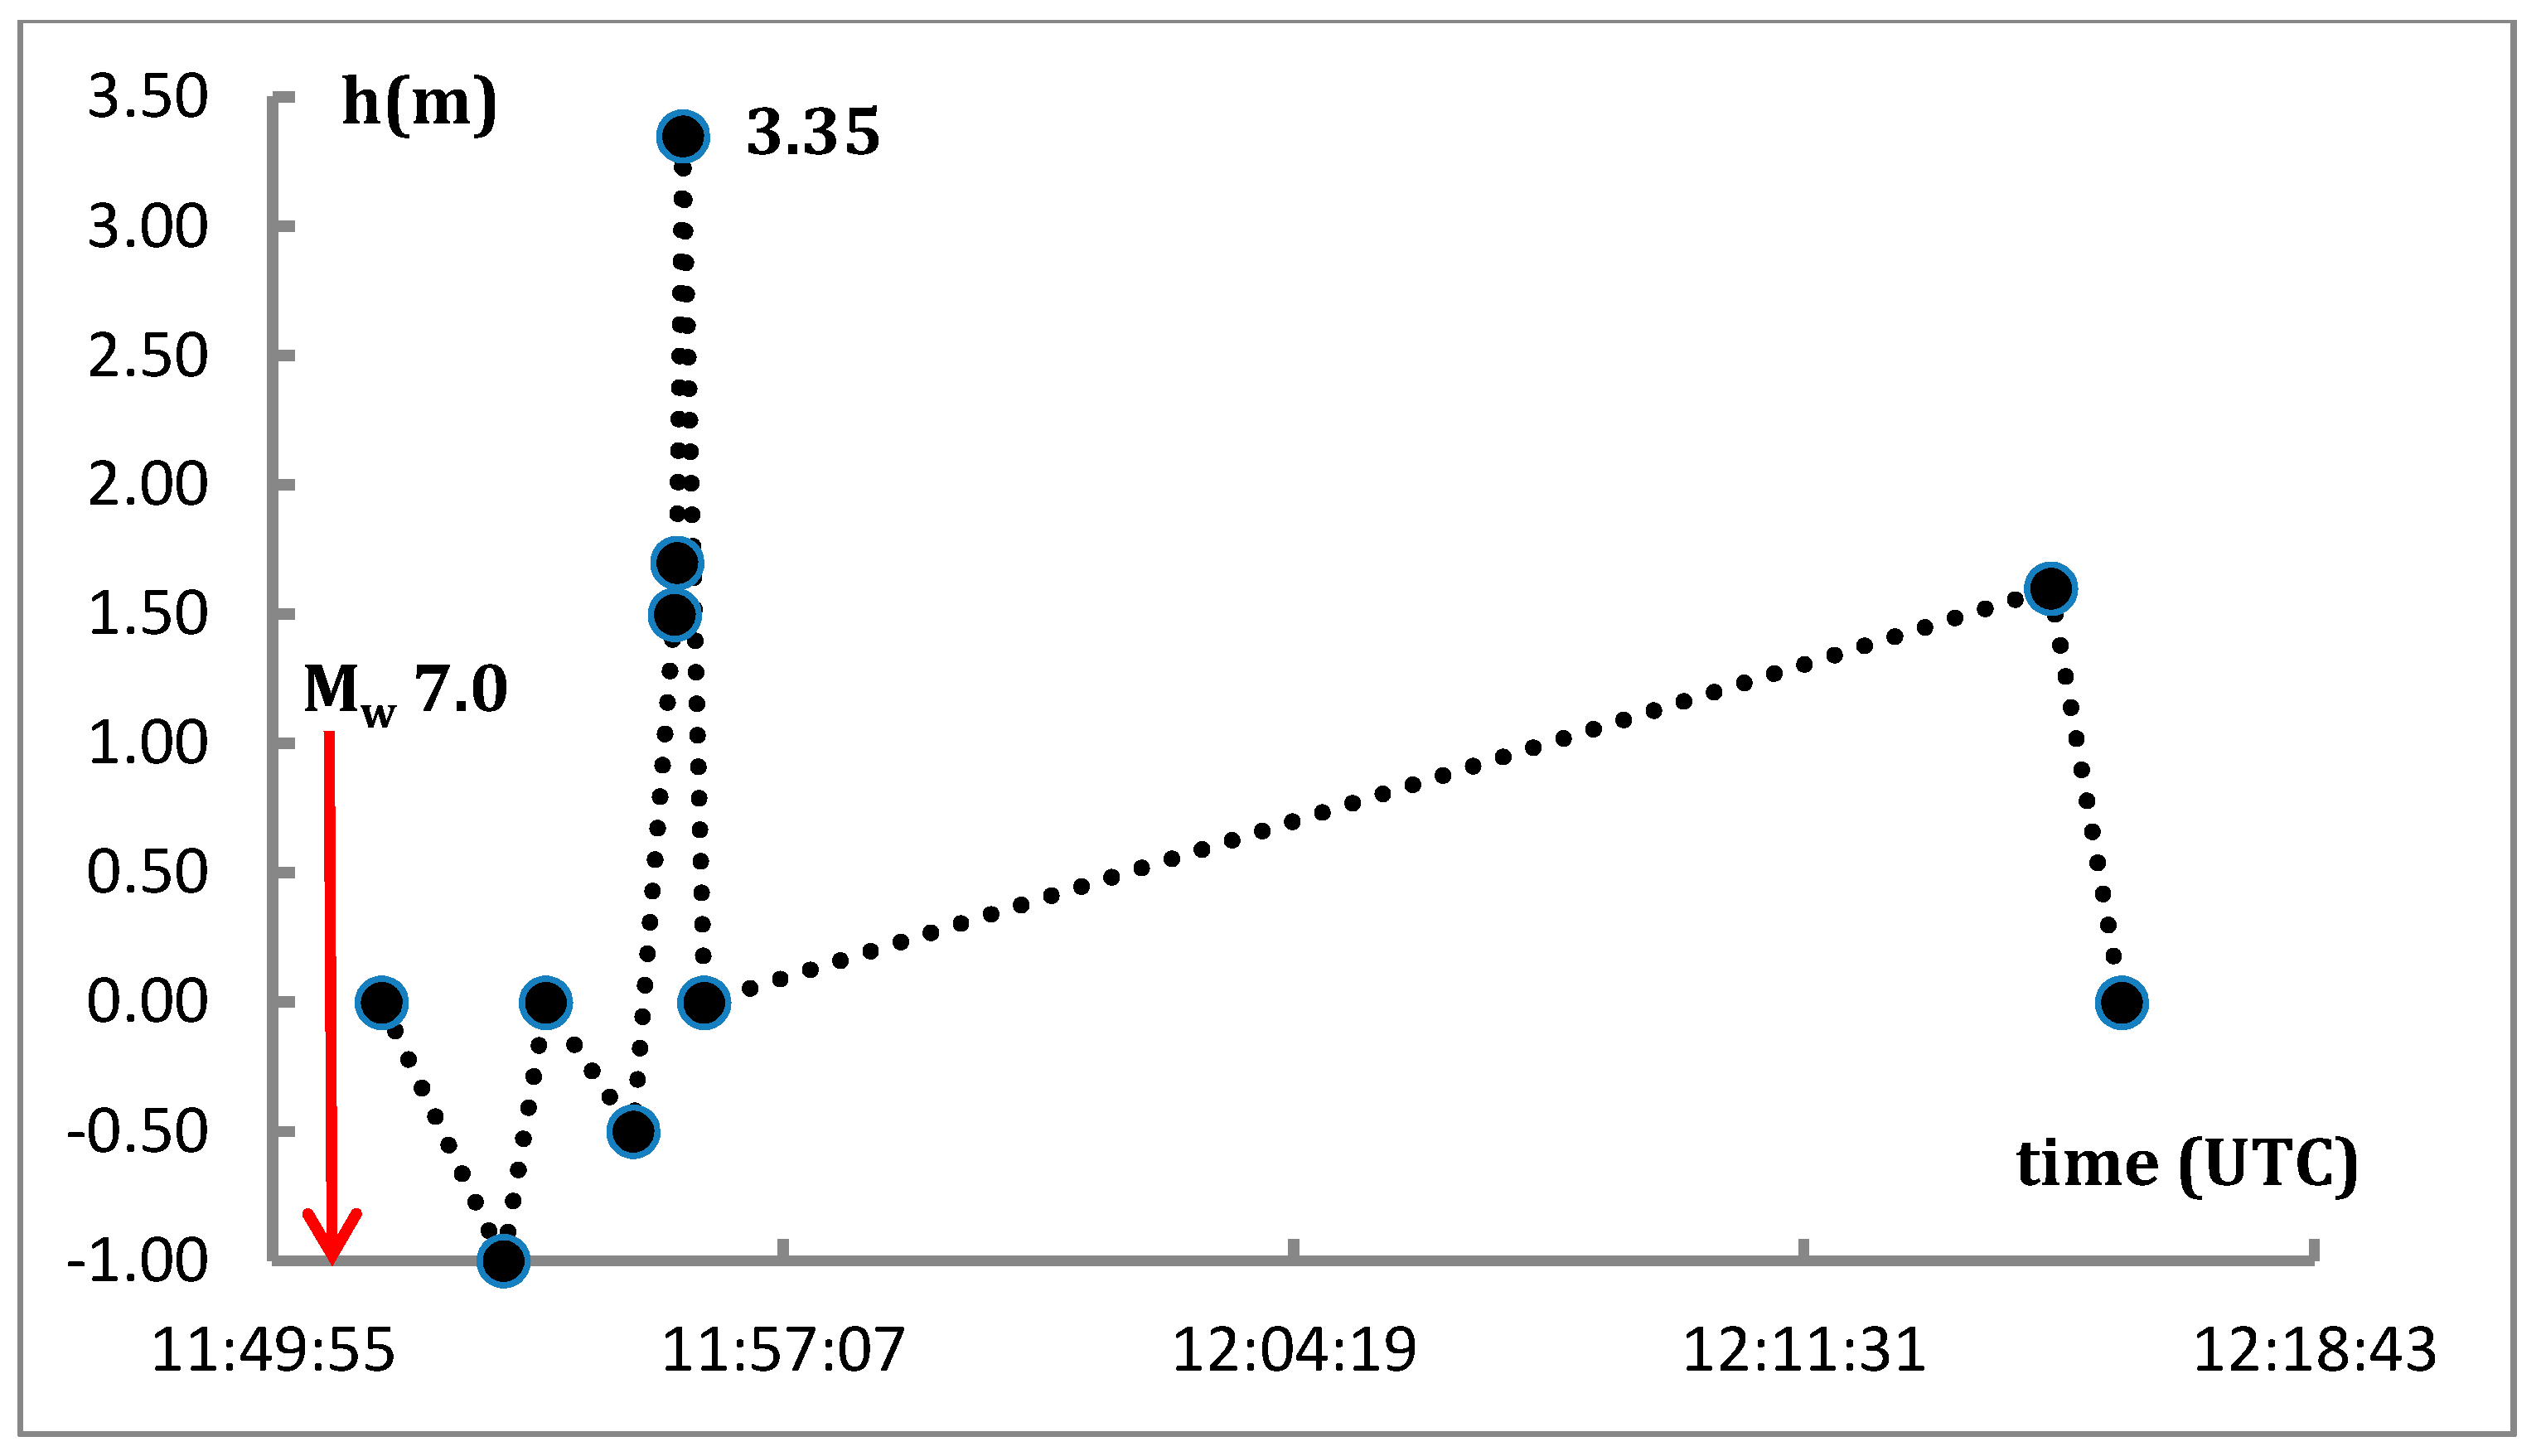
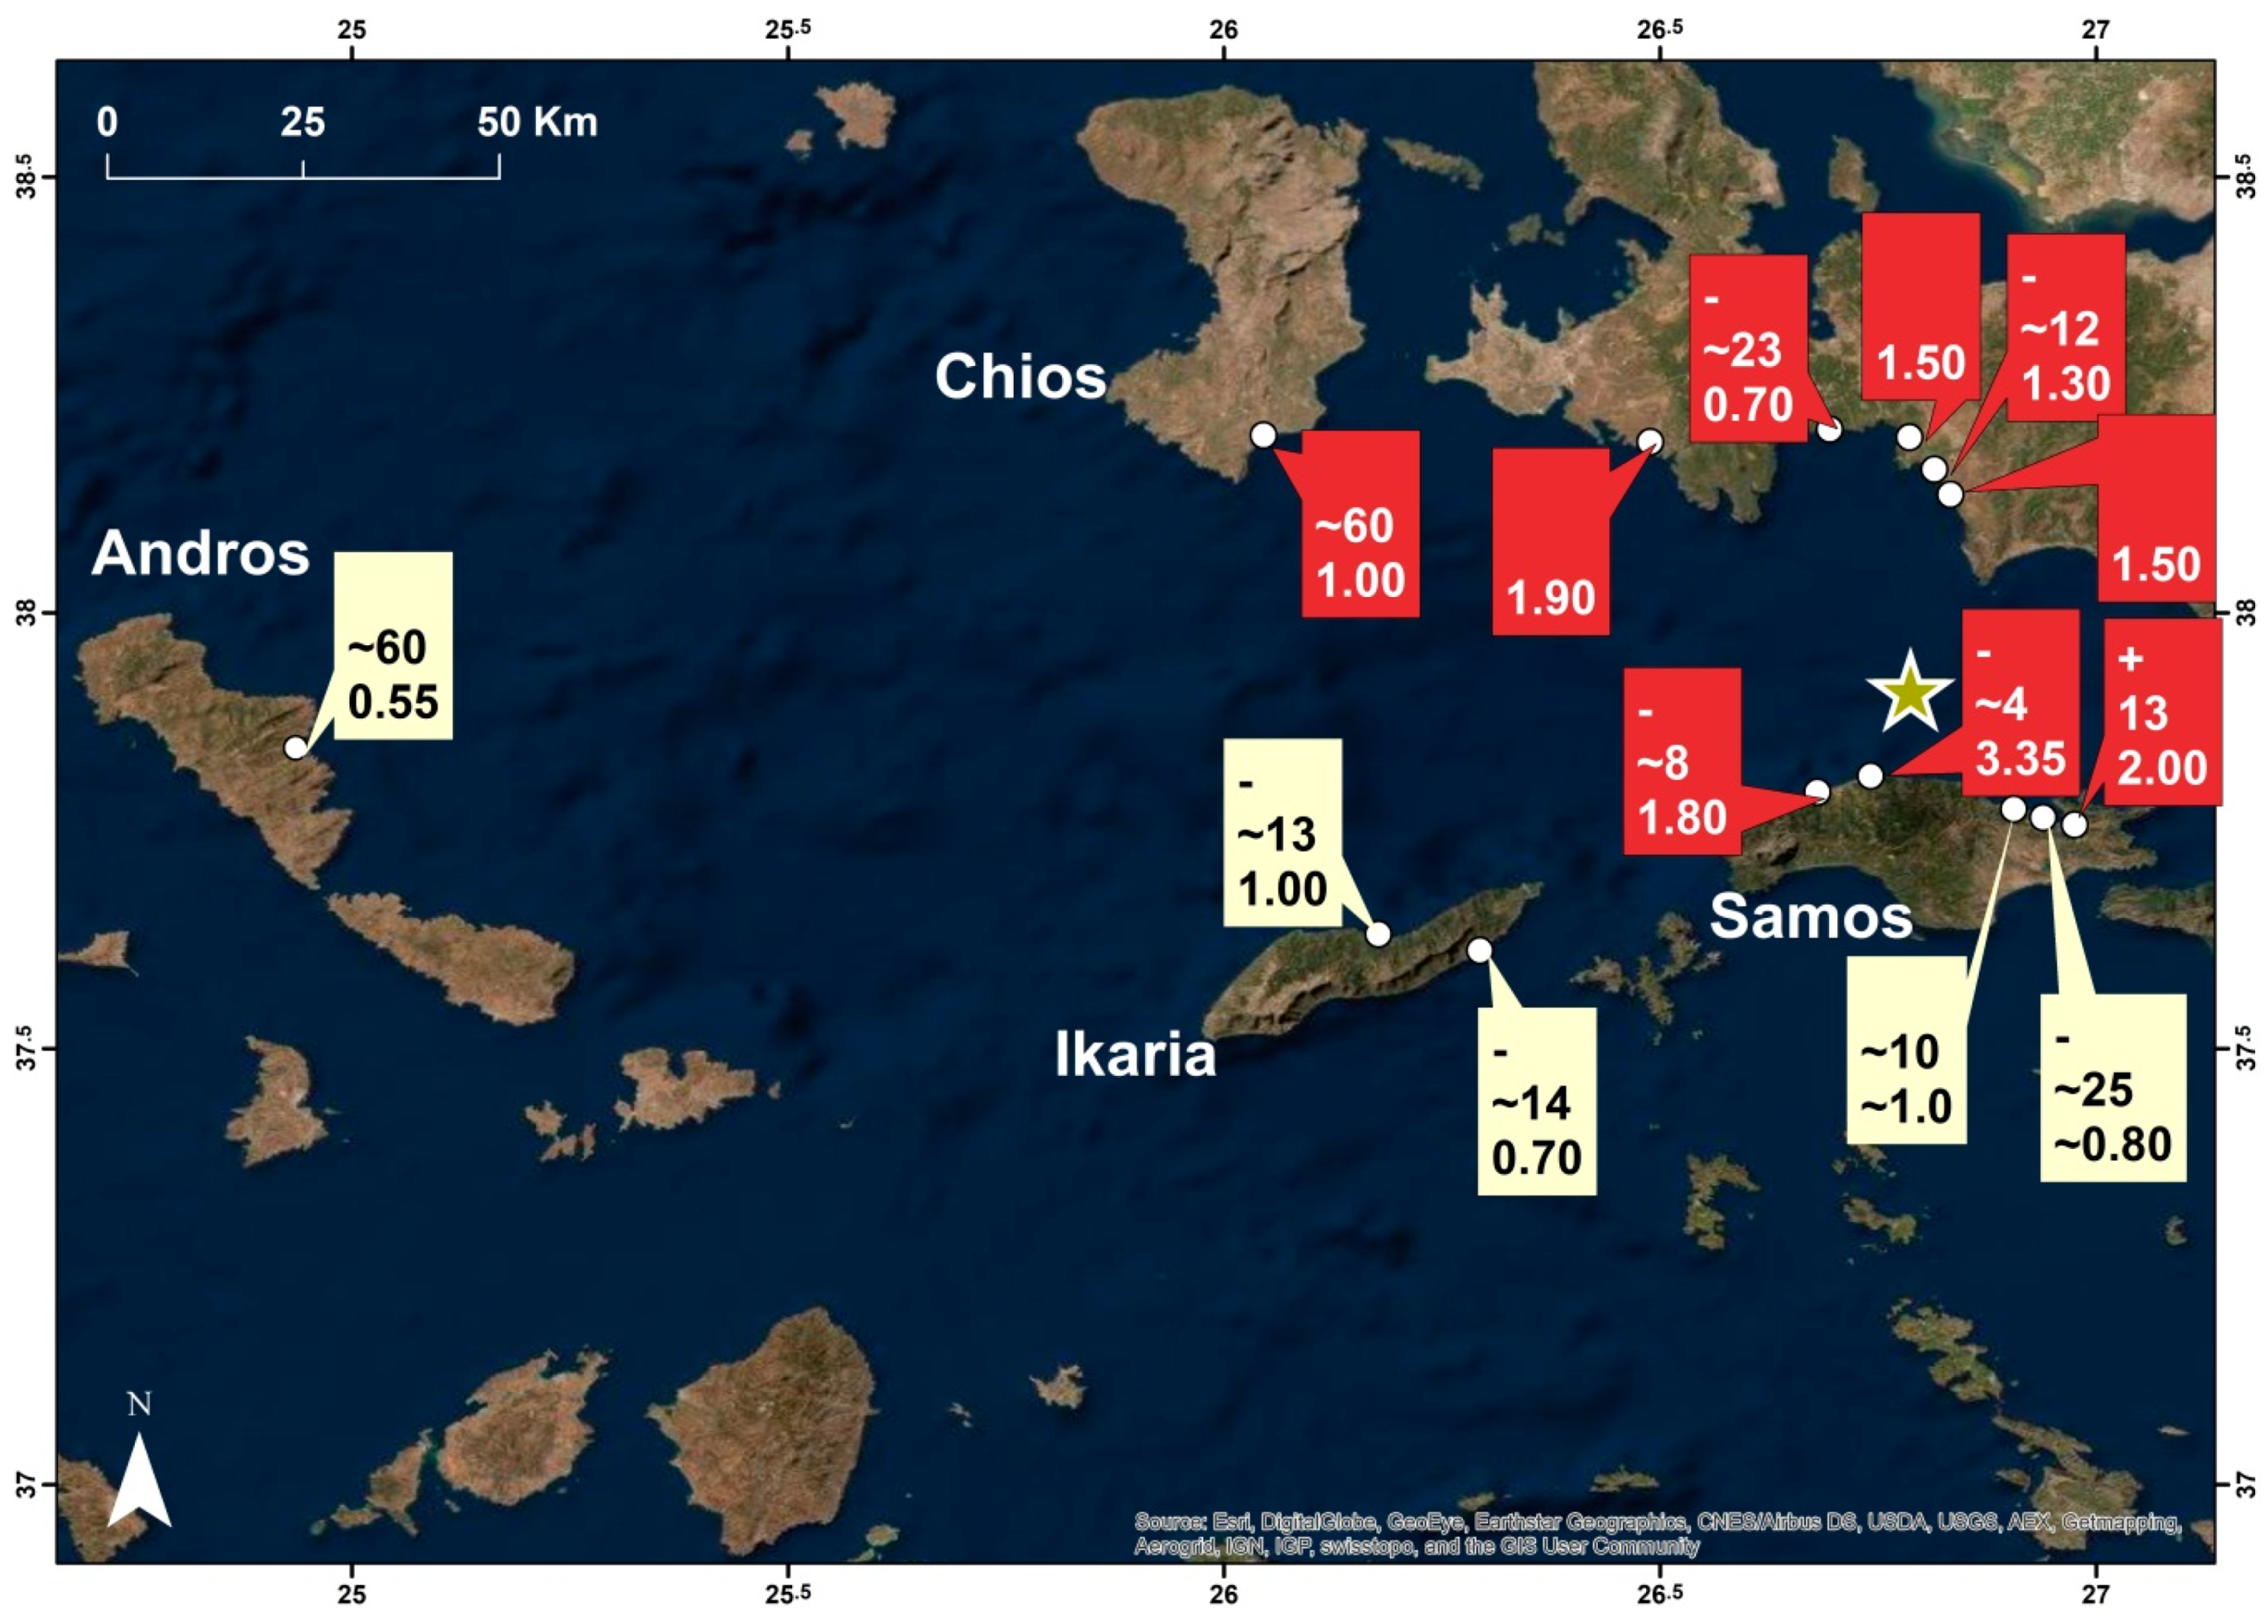
2.2.1. Samos Island
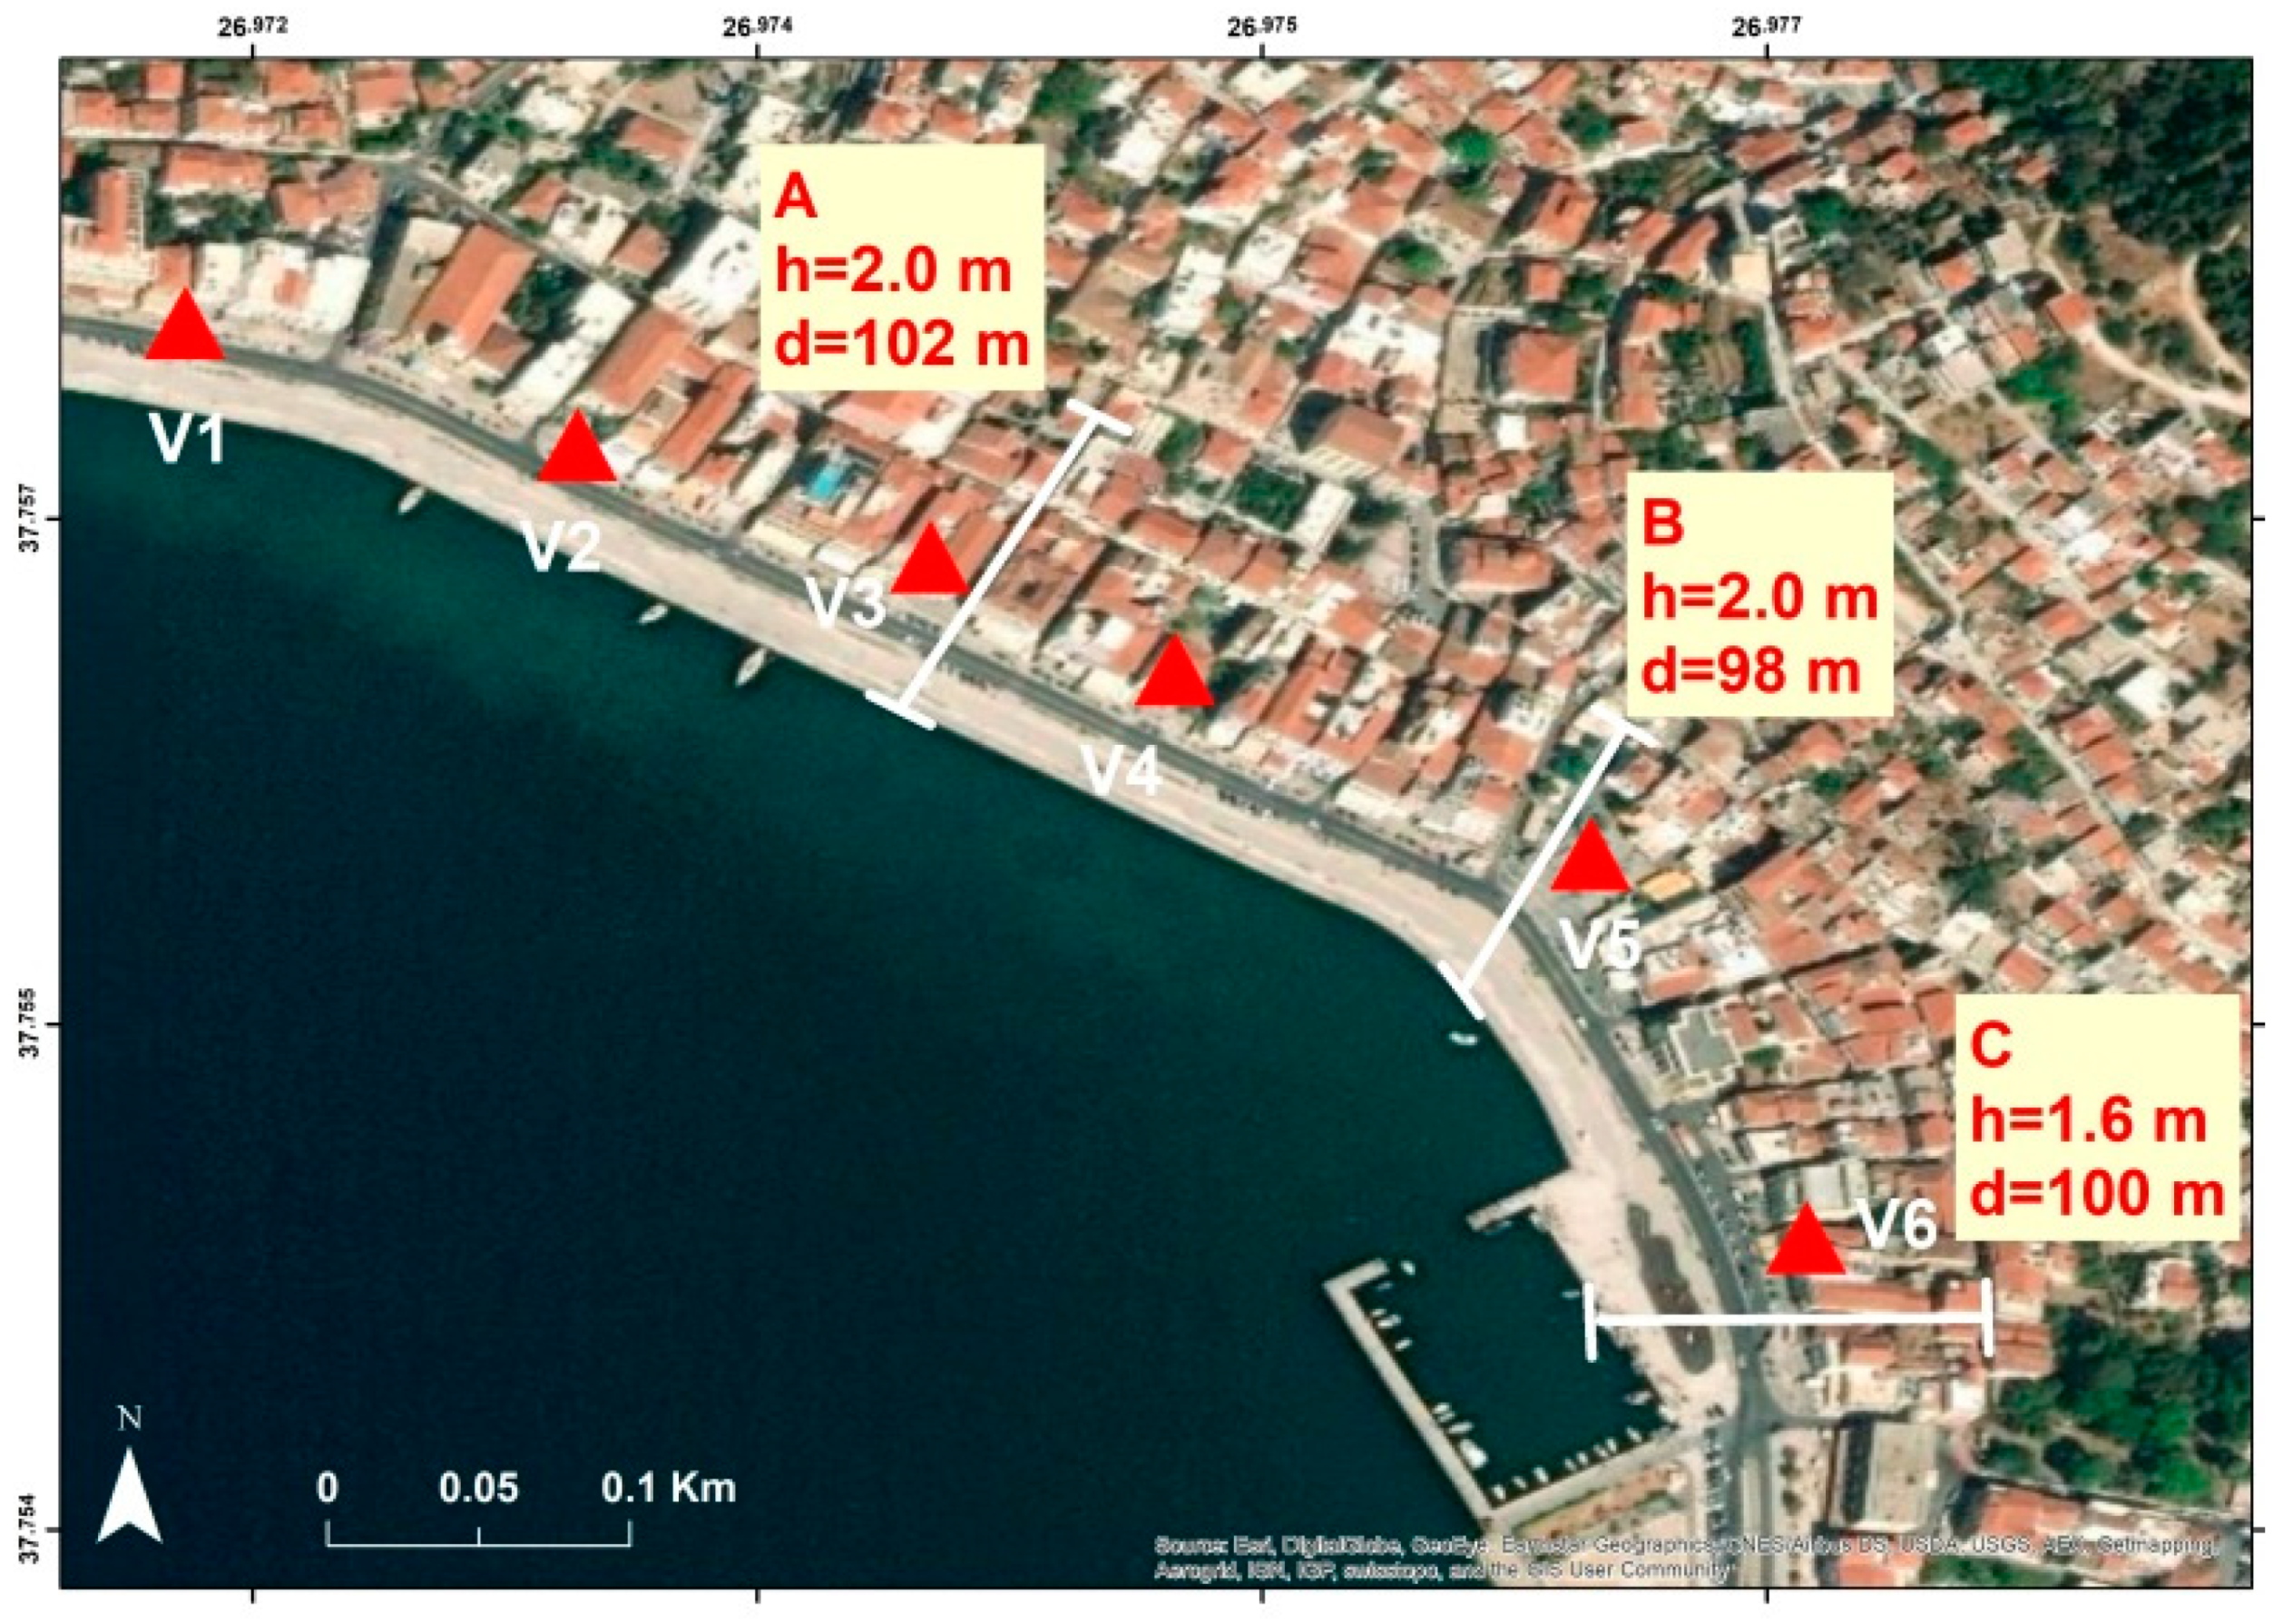
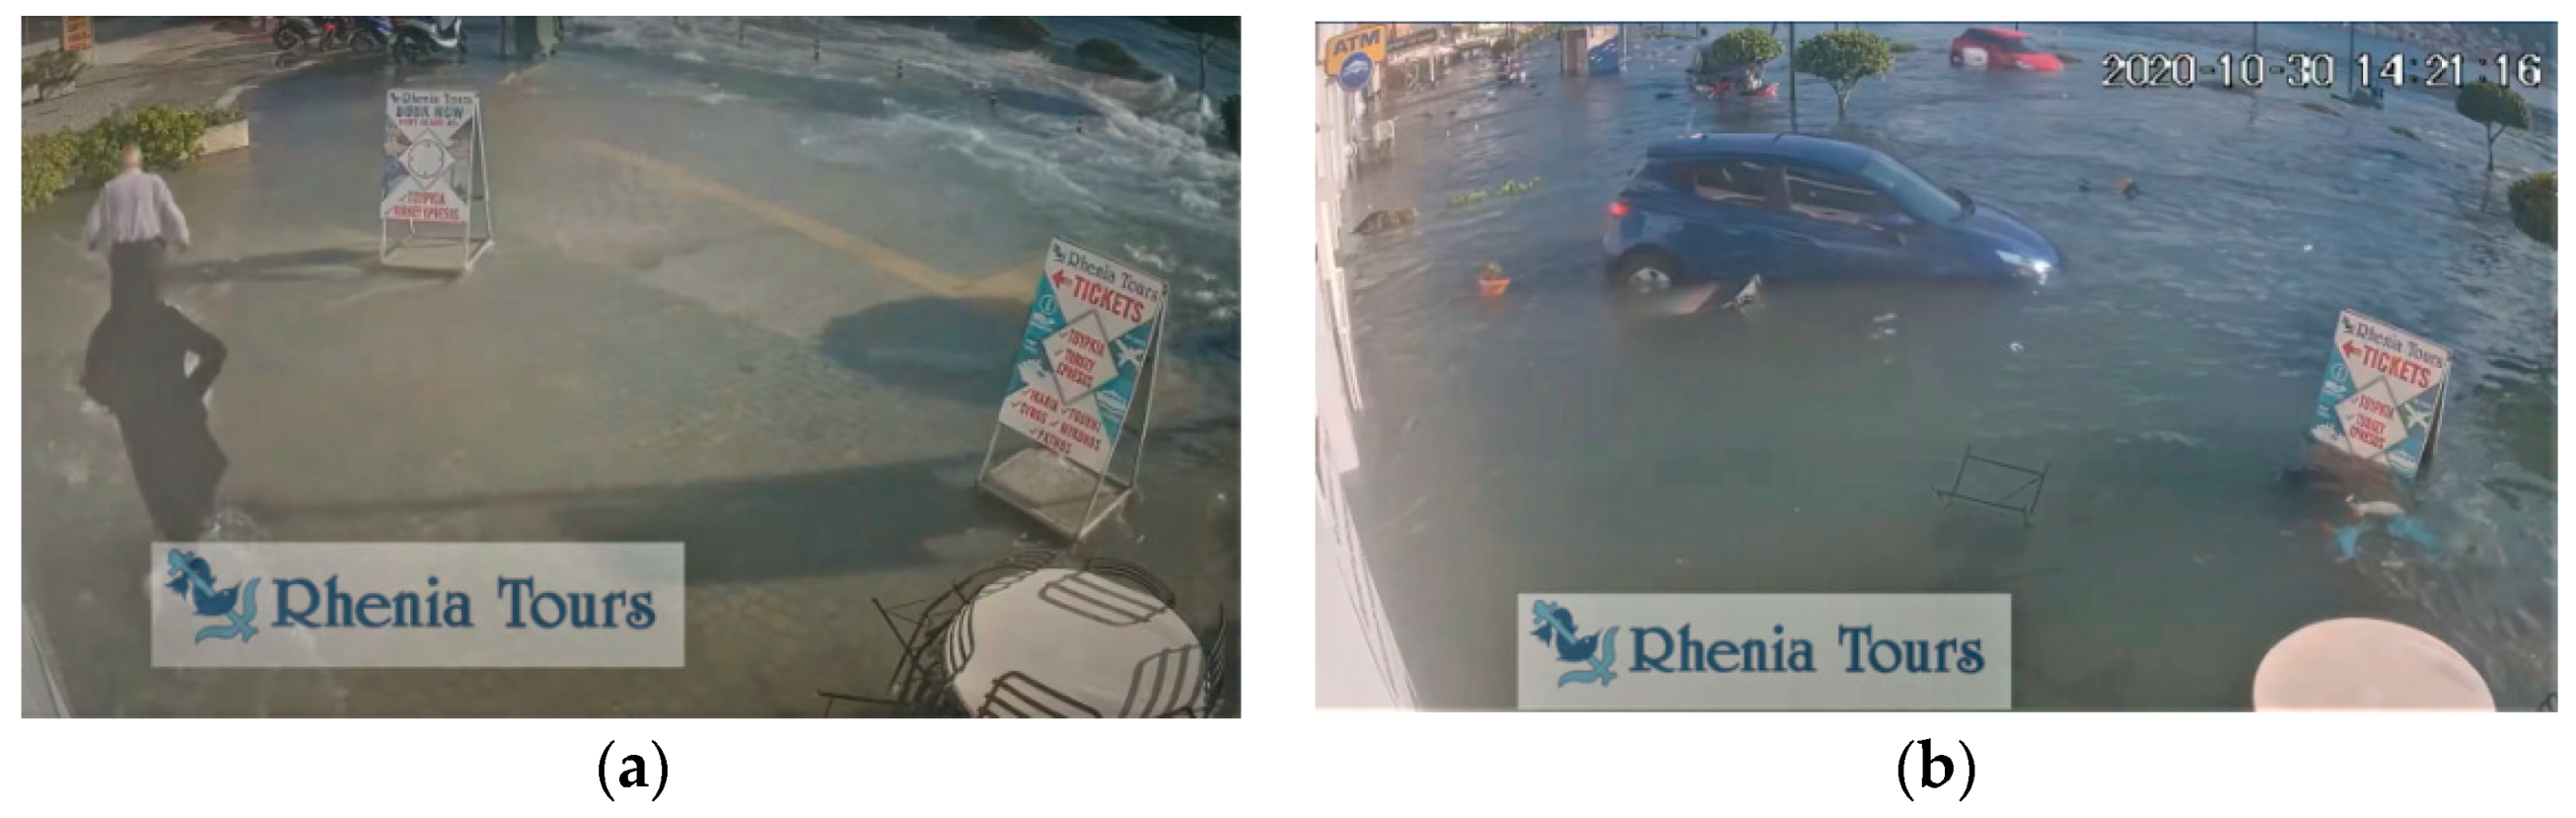
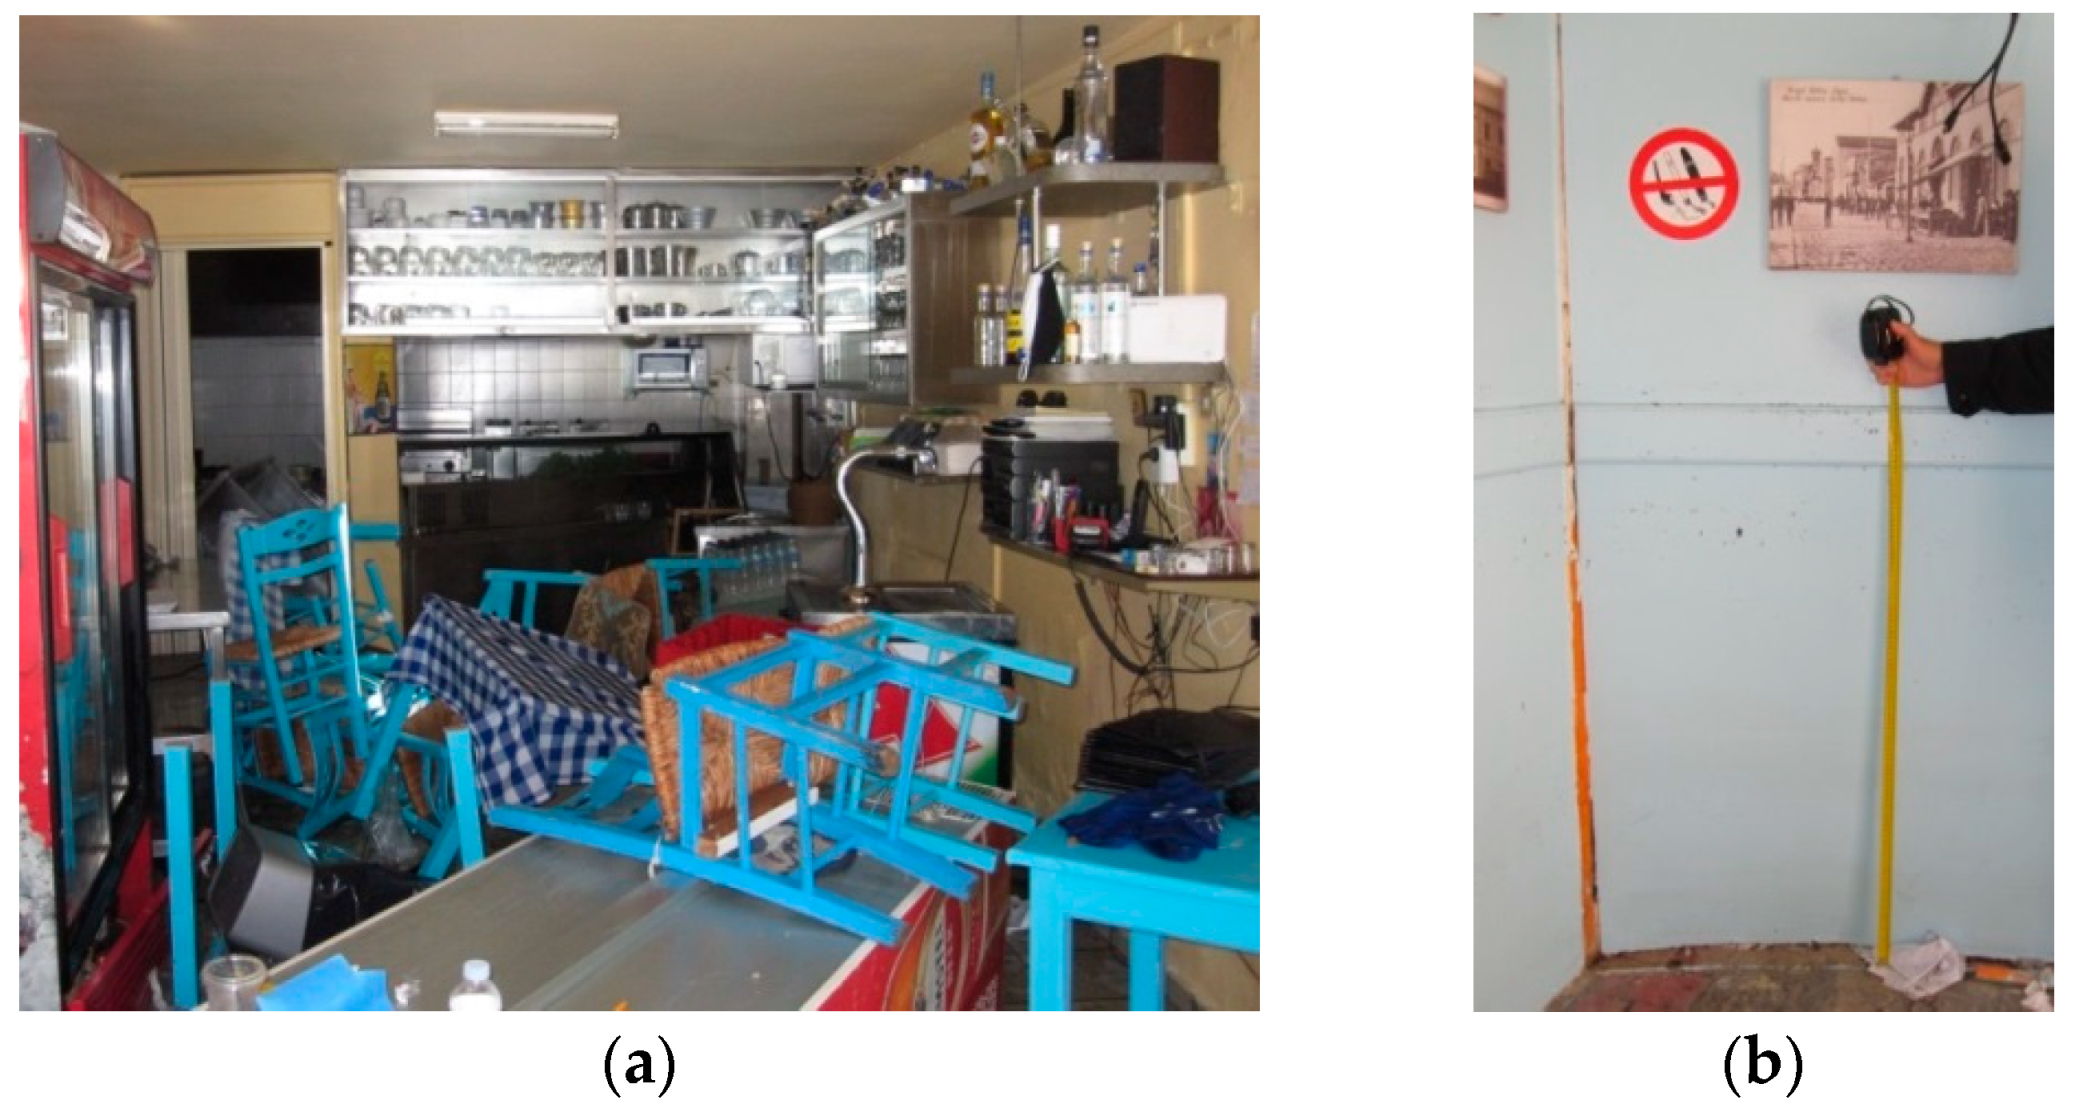
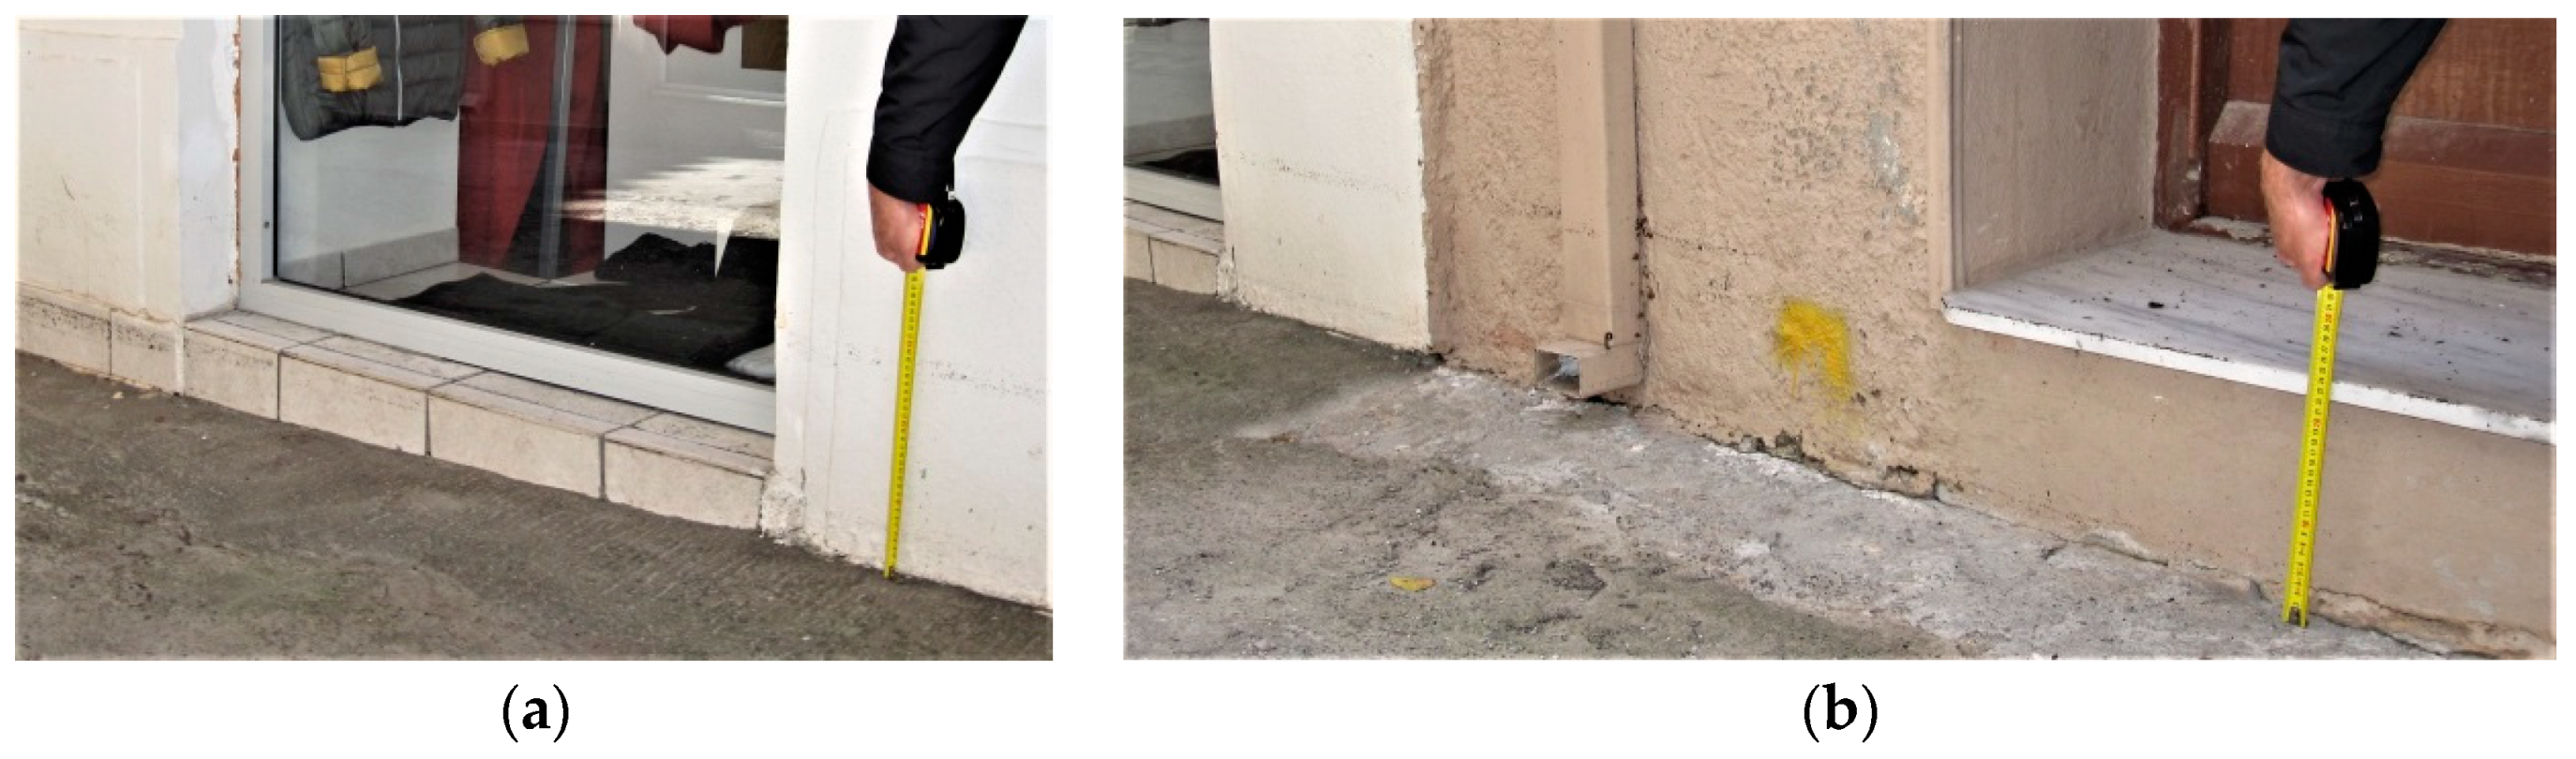
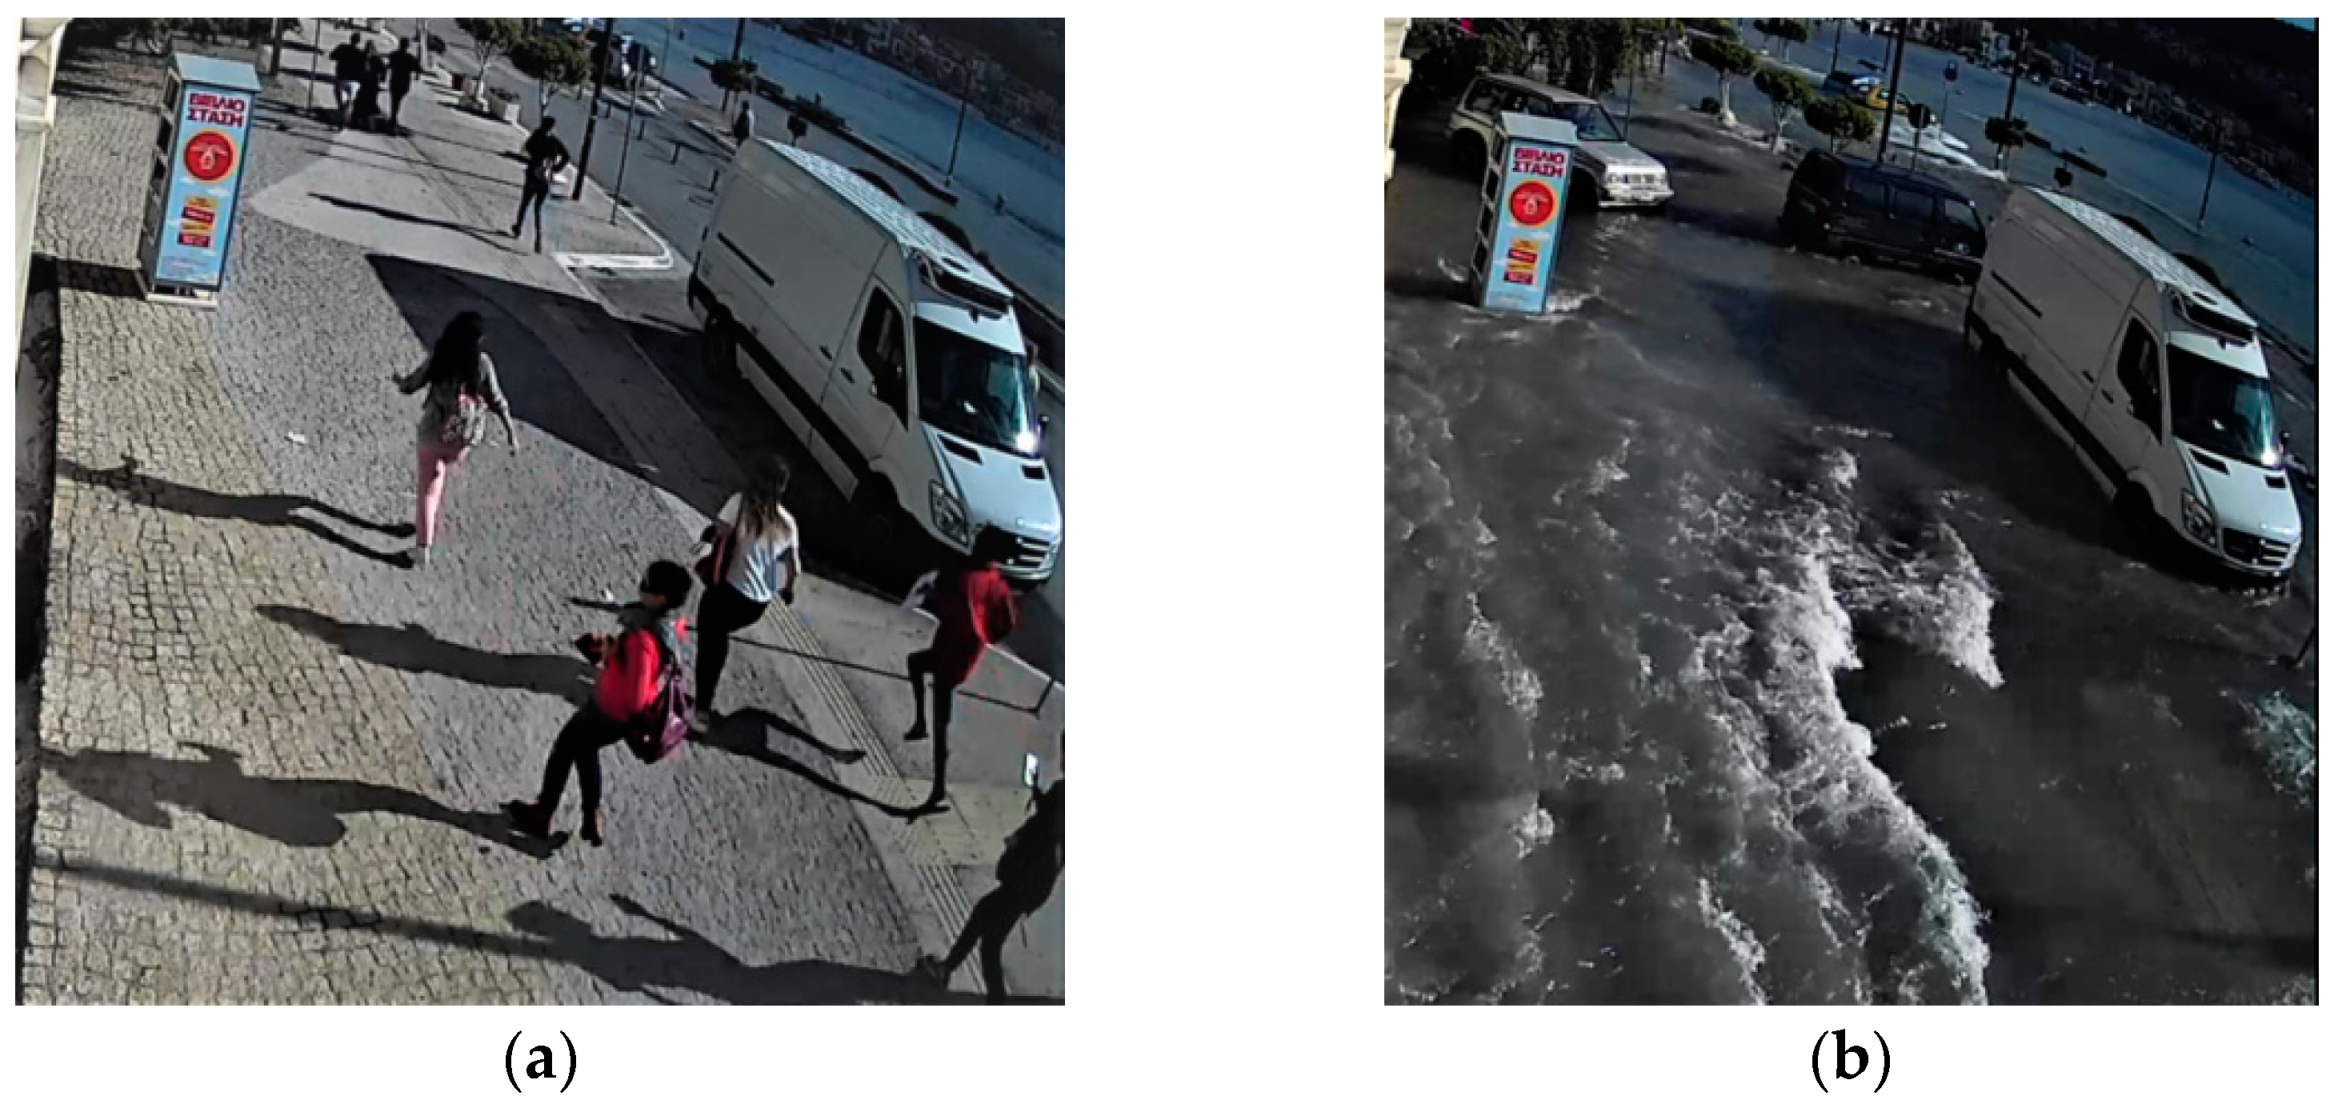
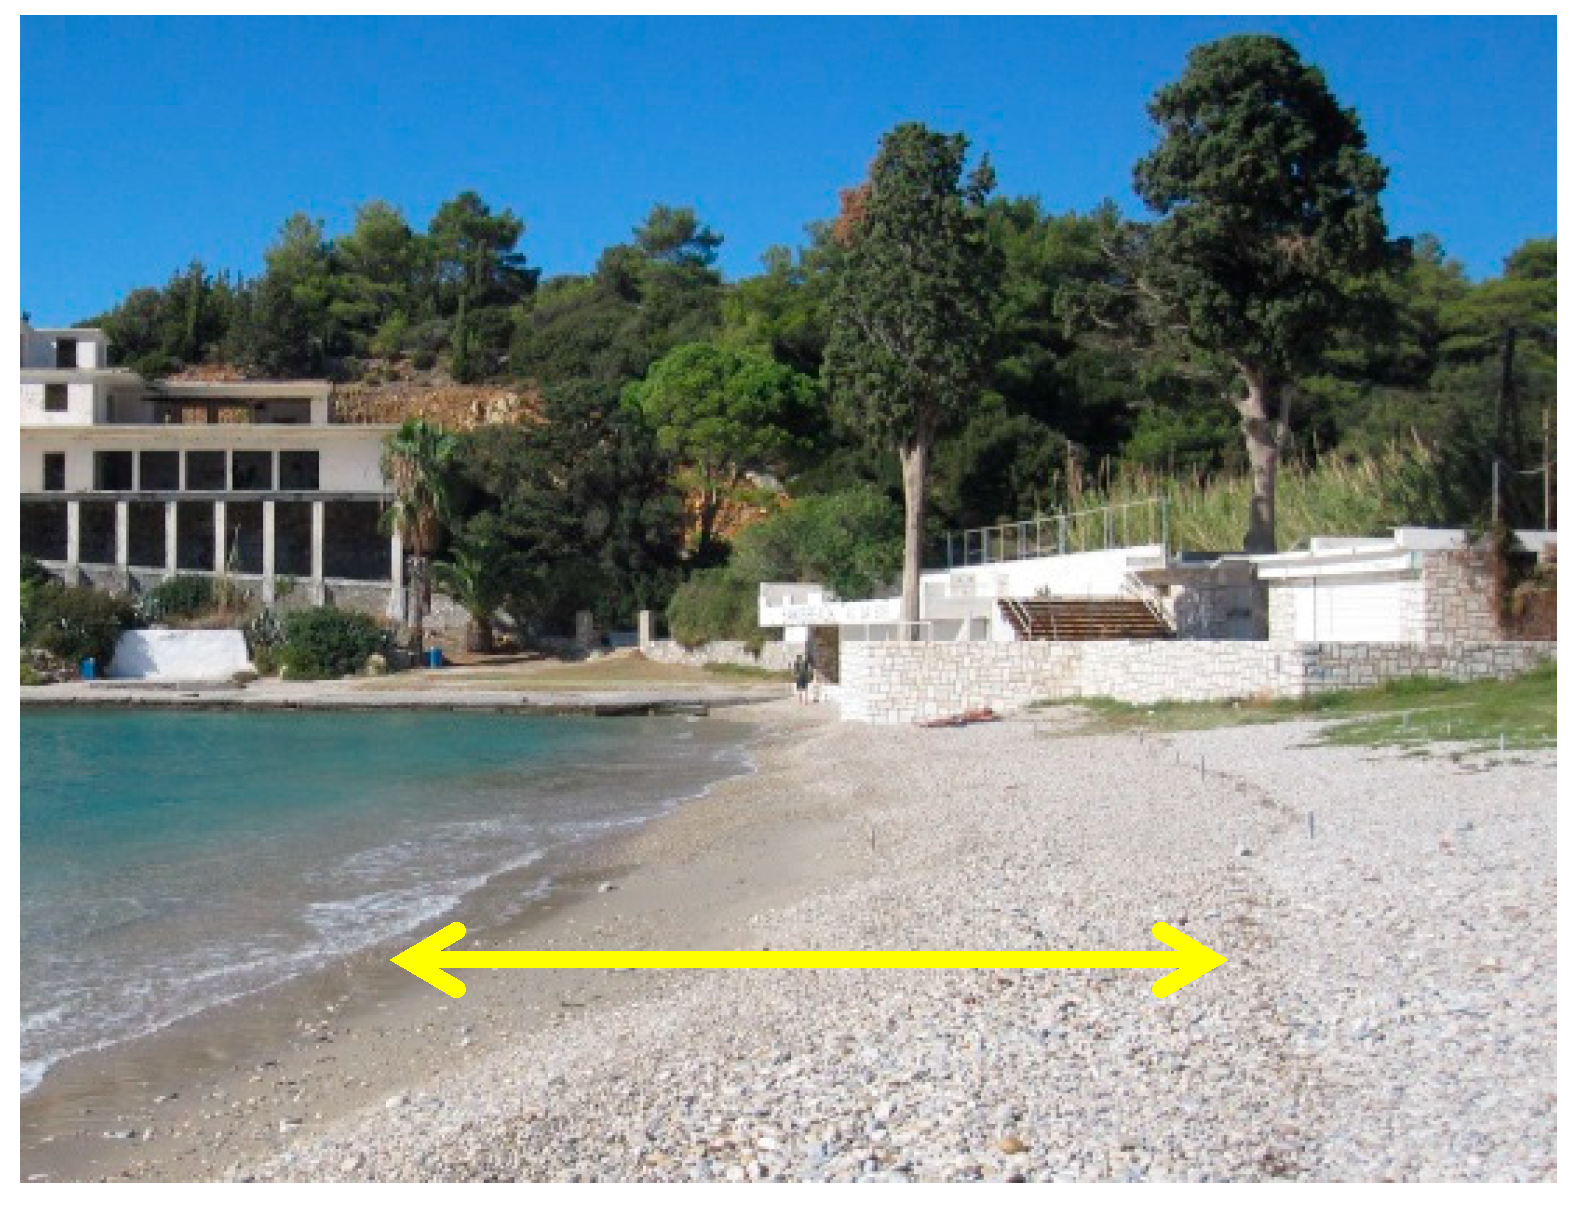
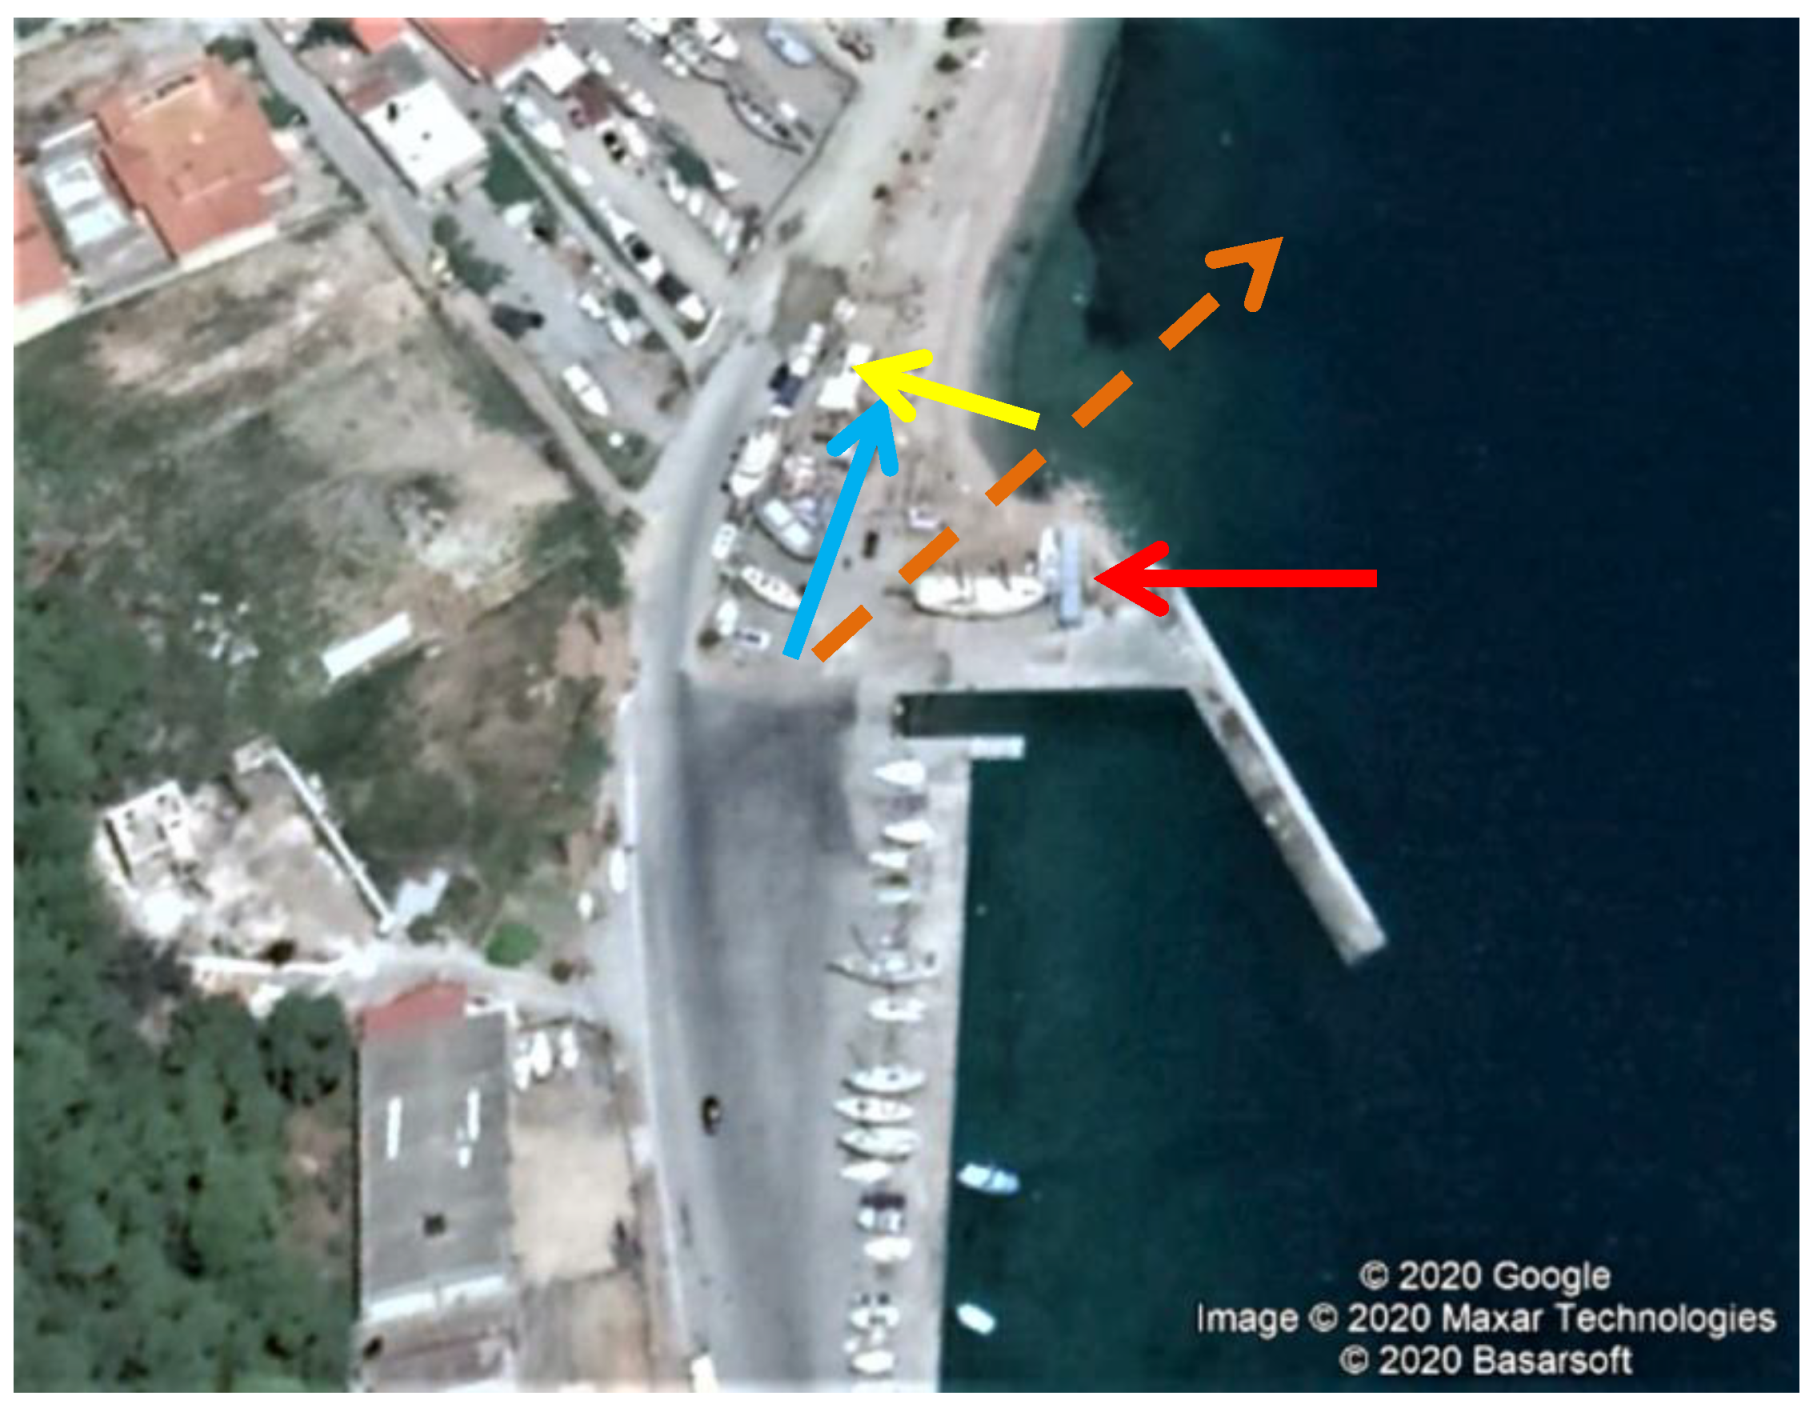
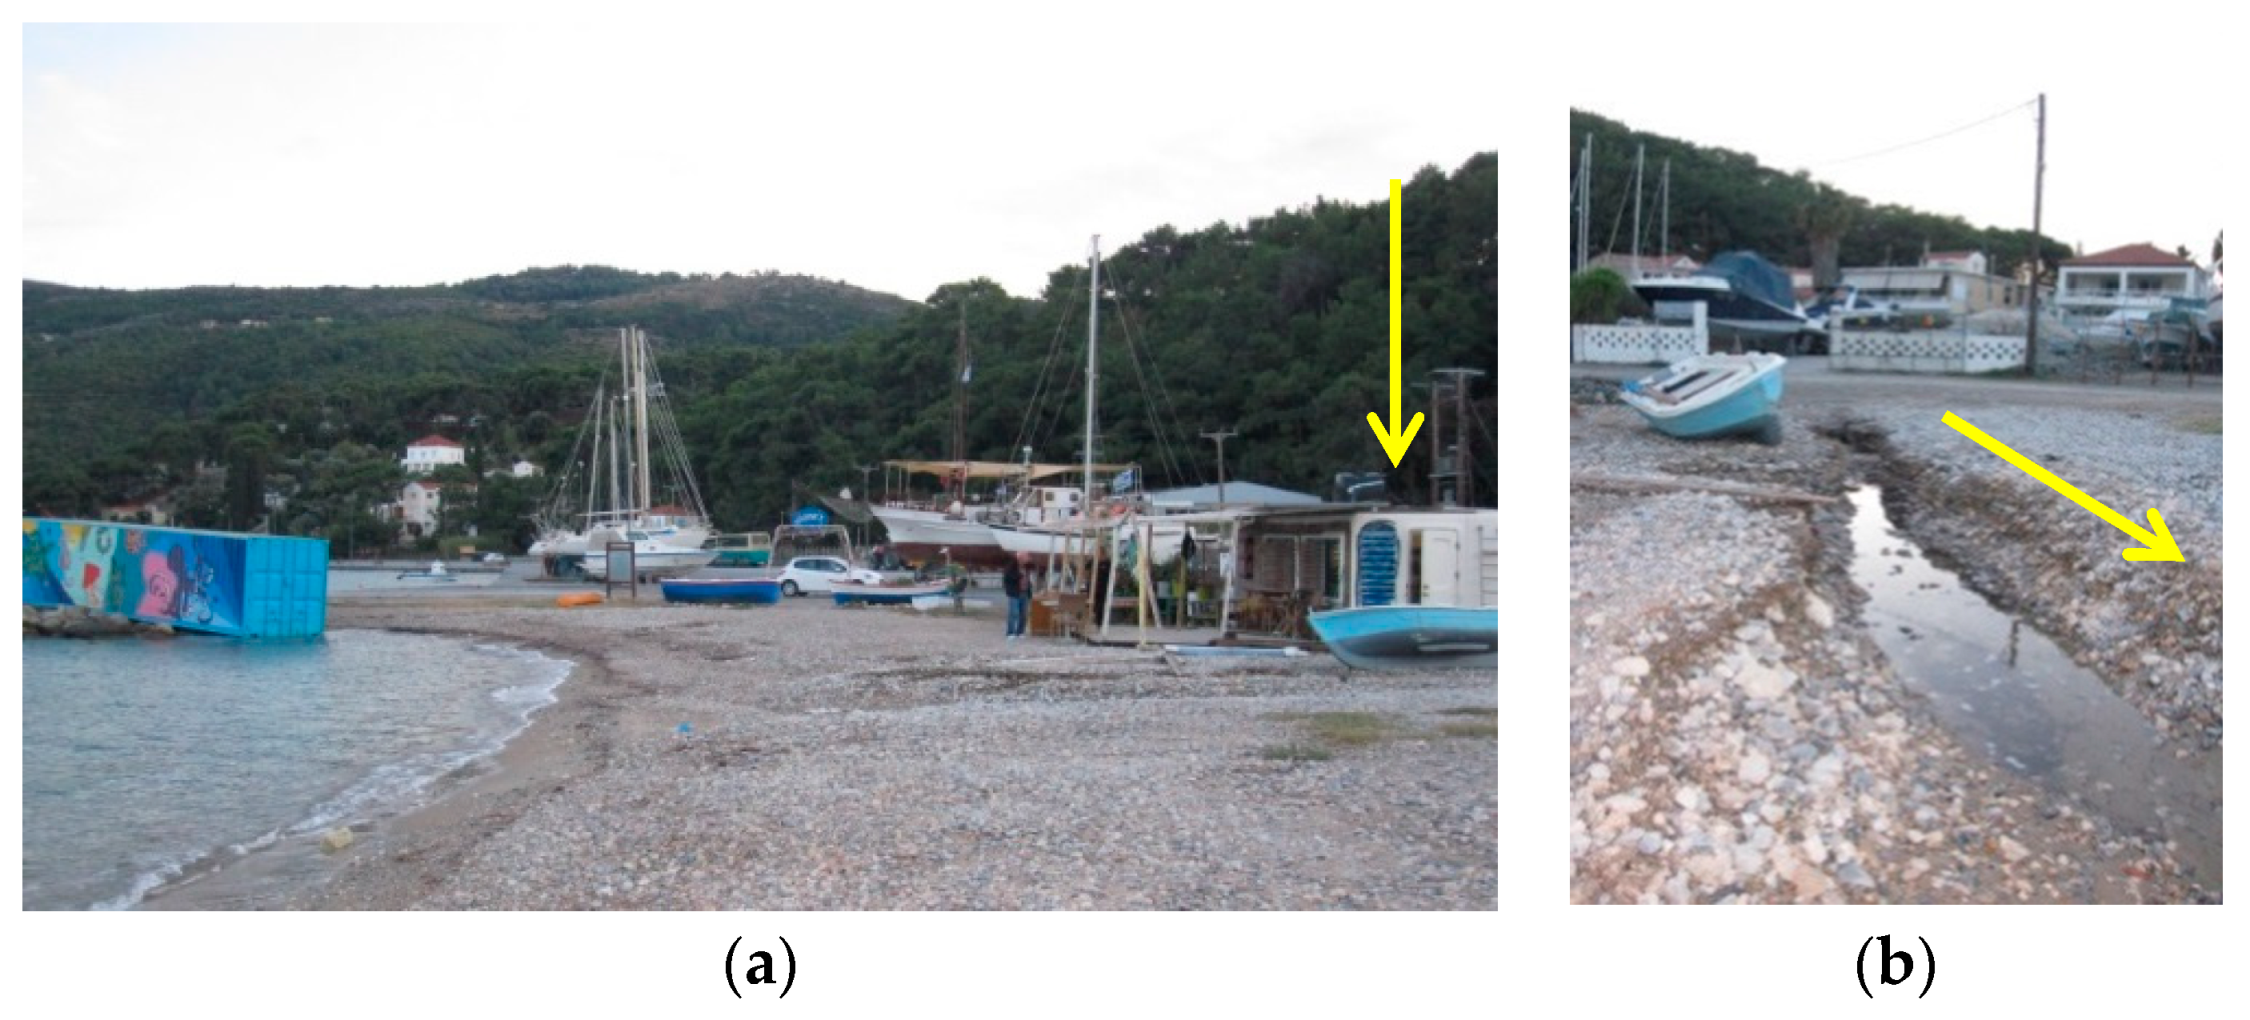
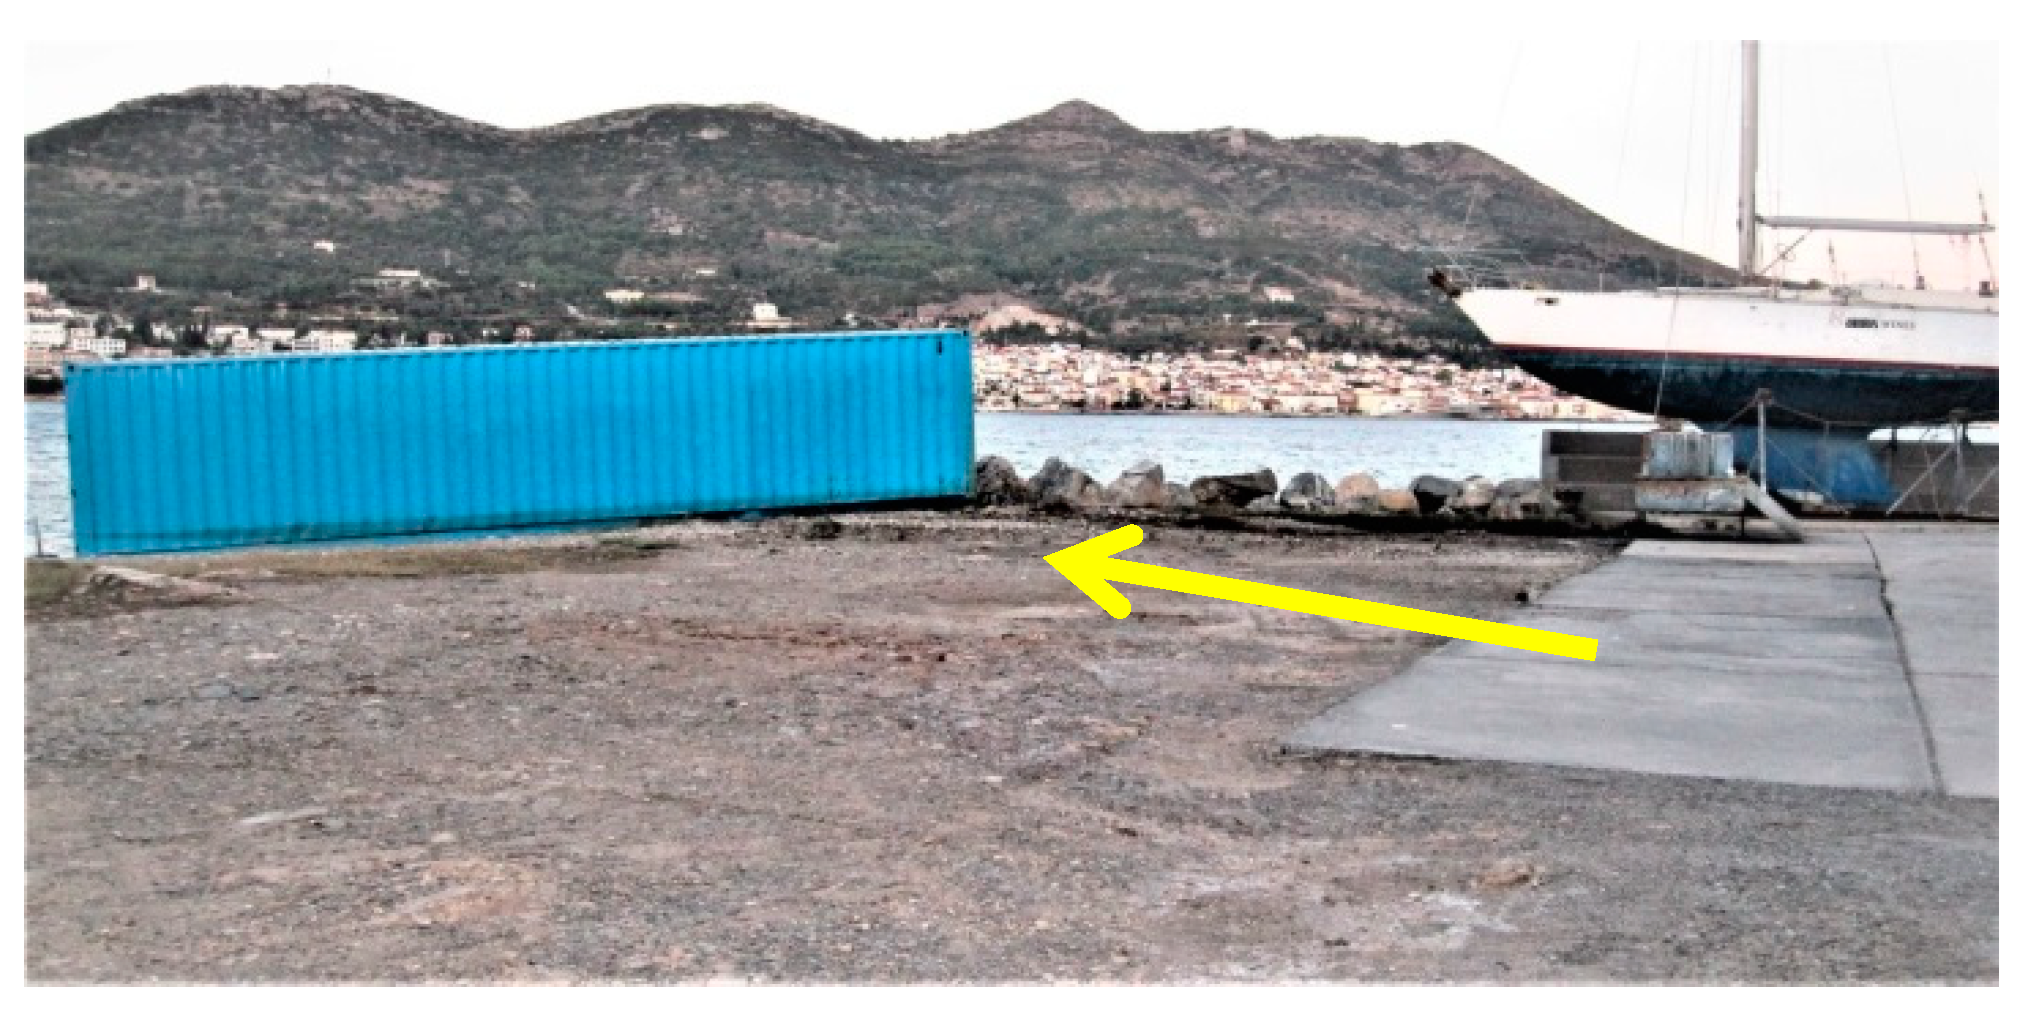
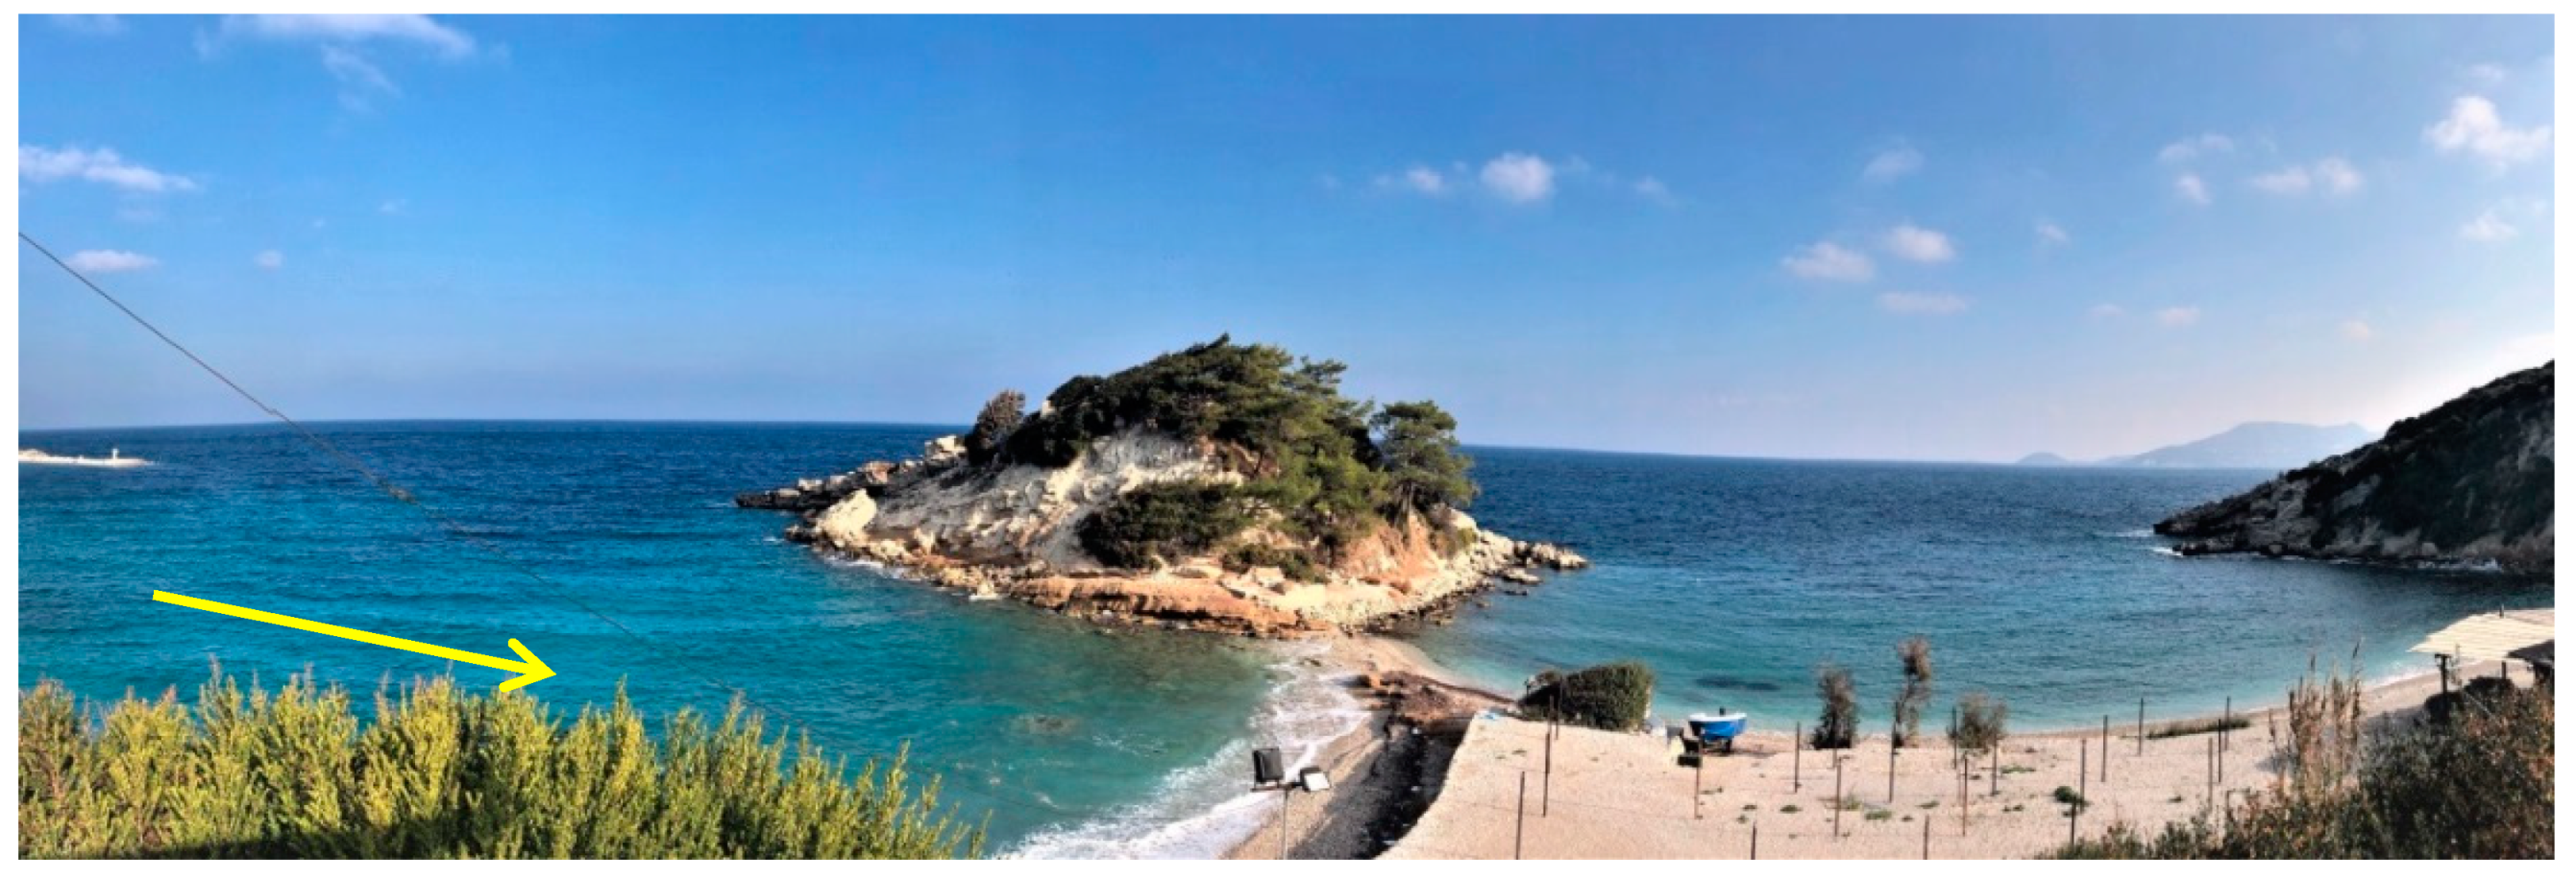
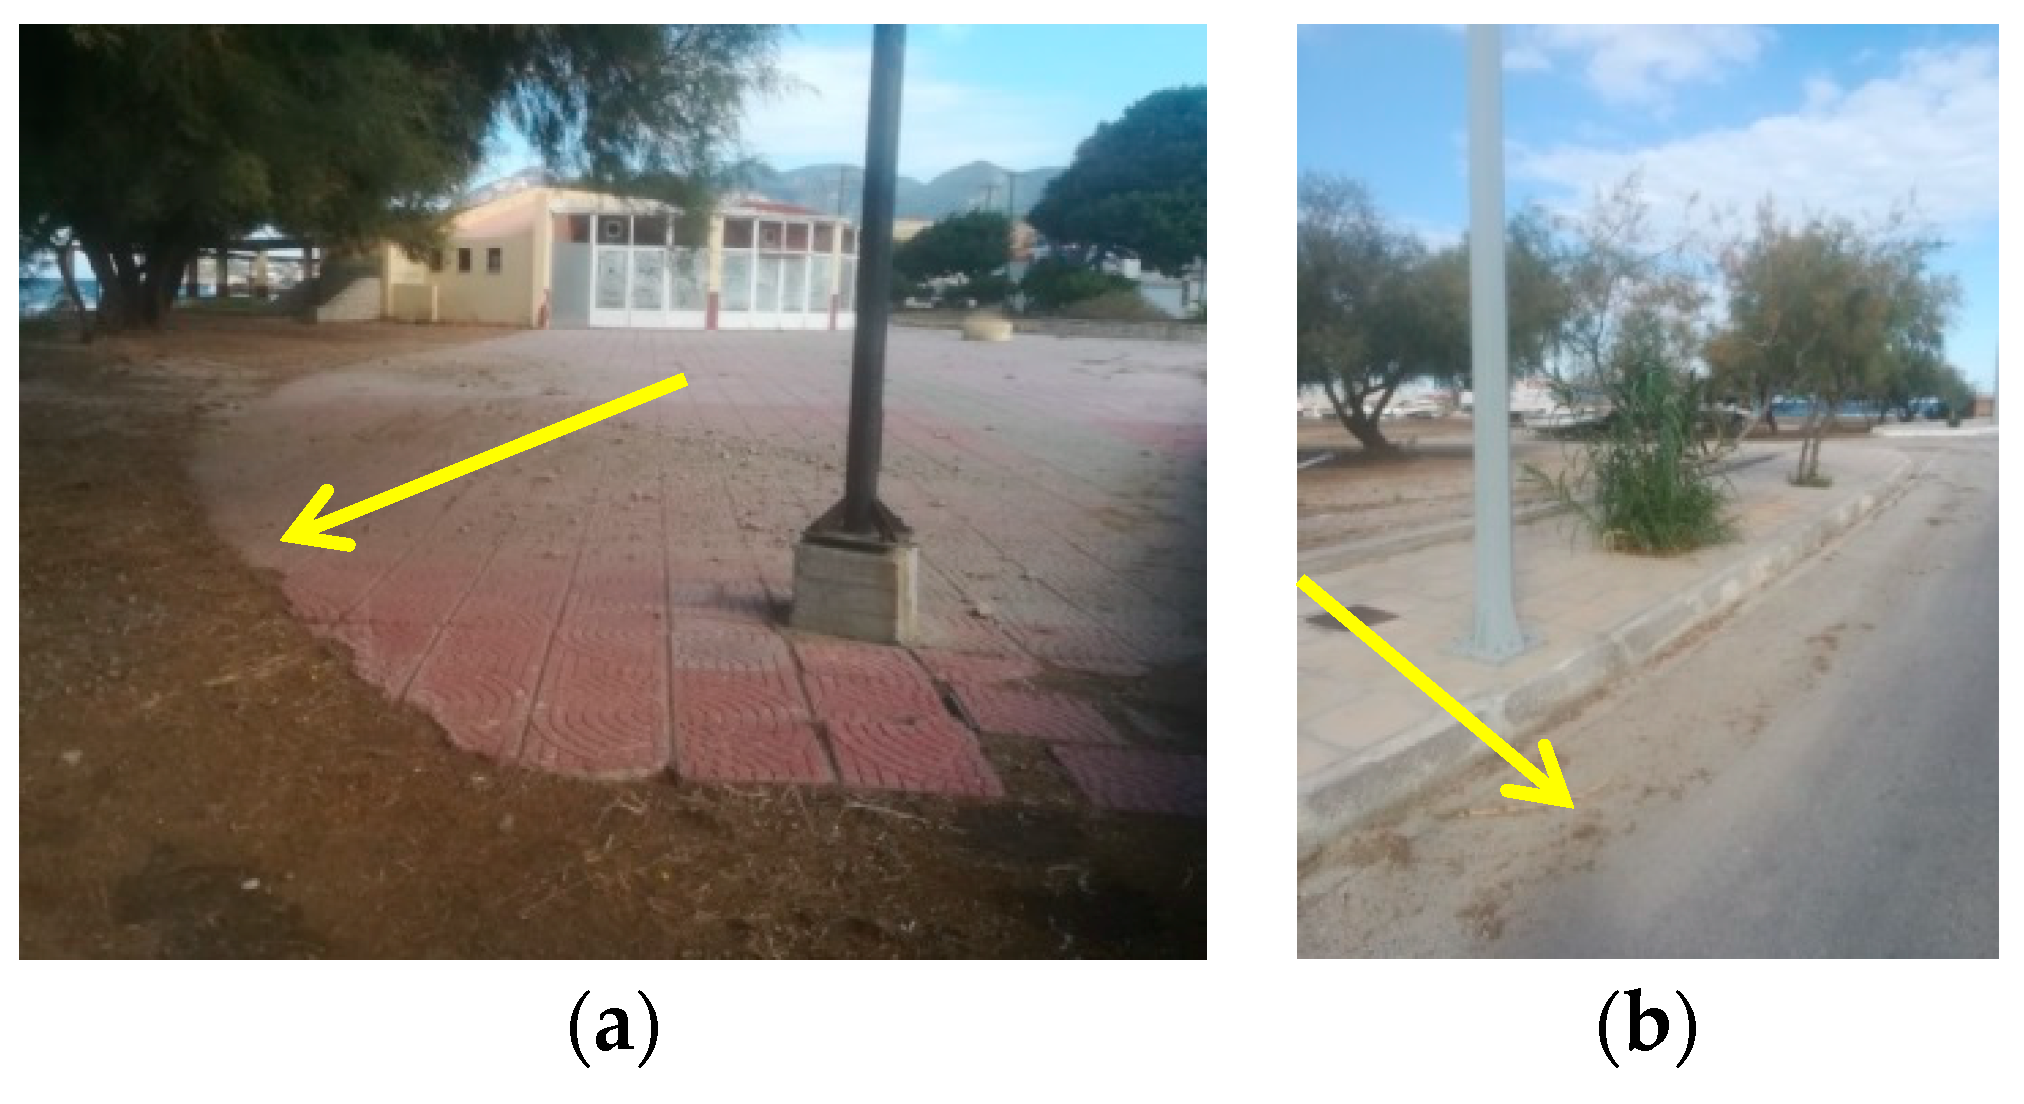
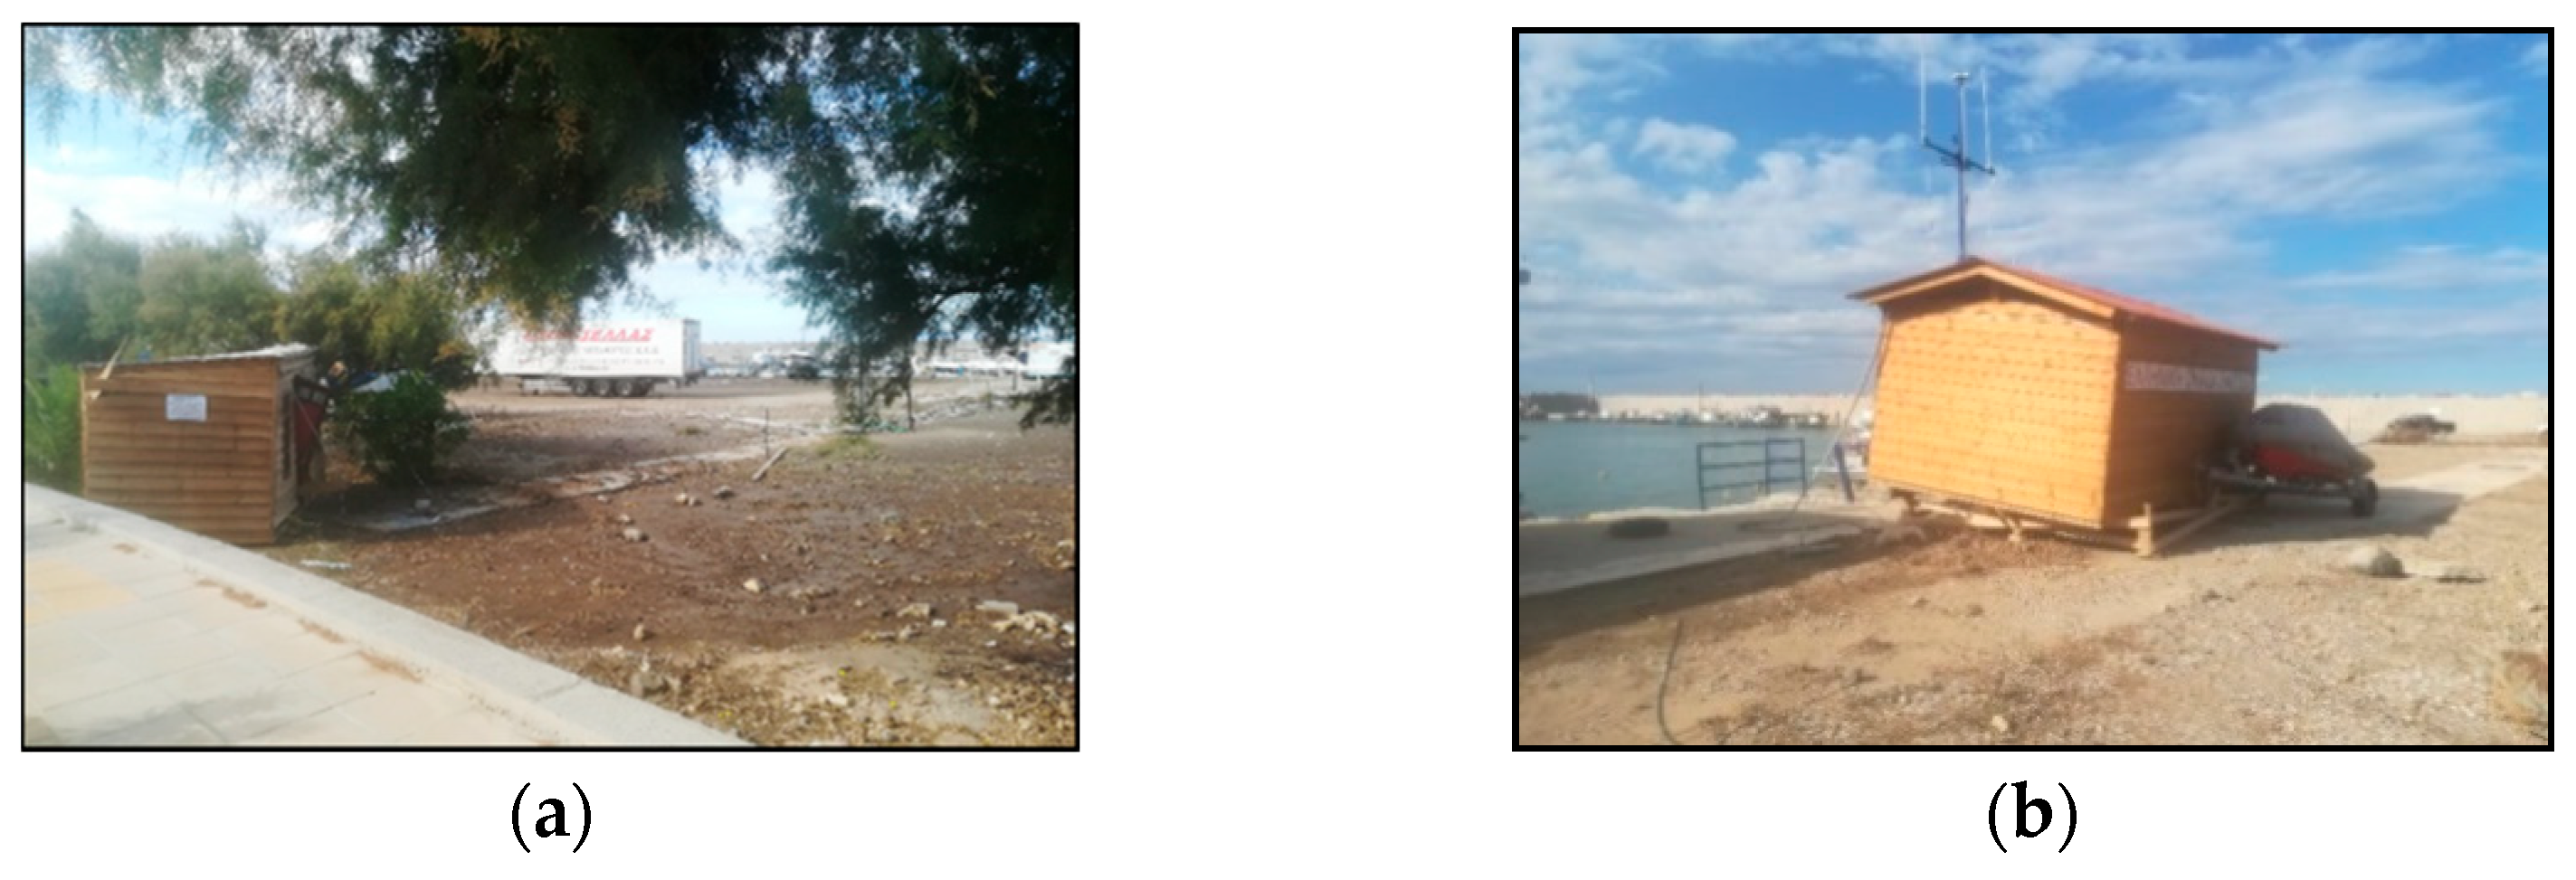
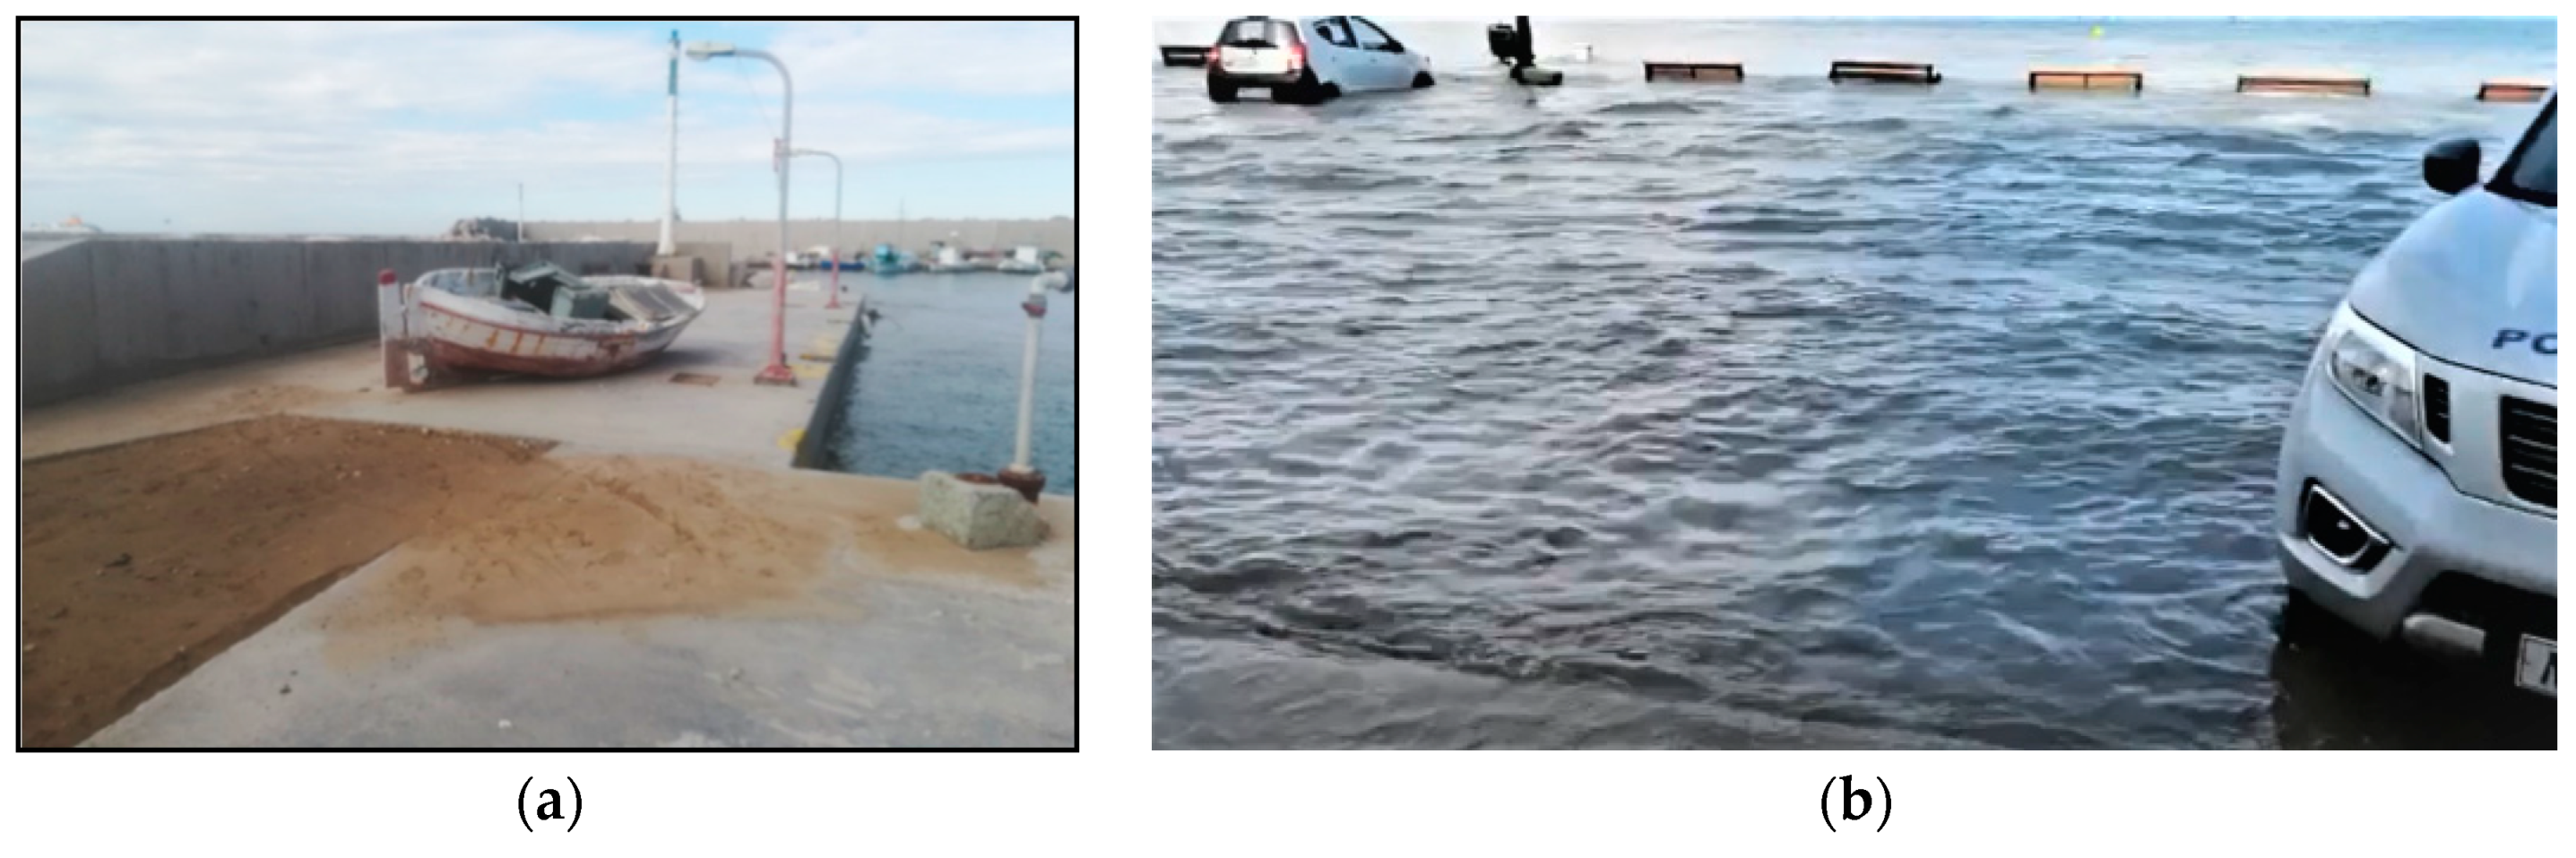
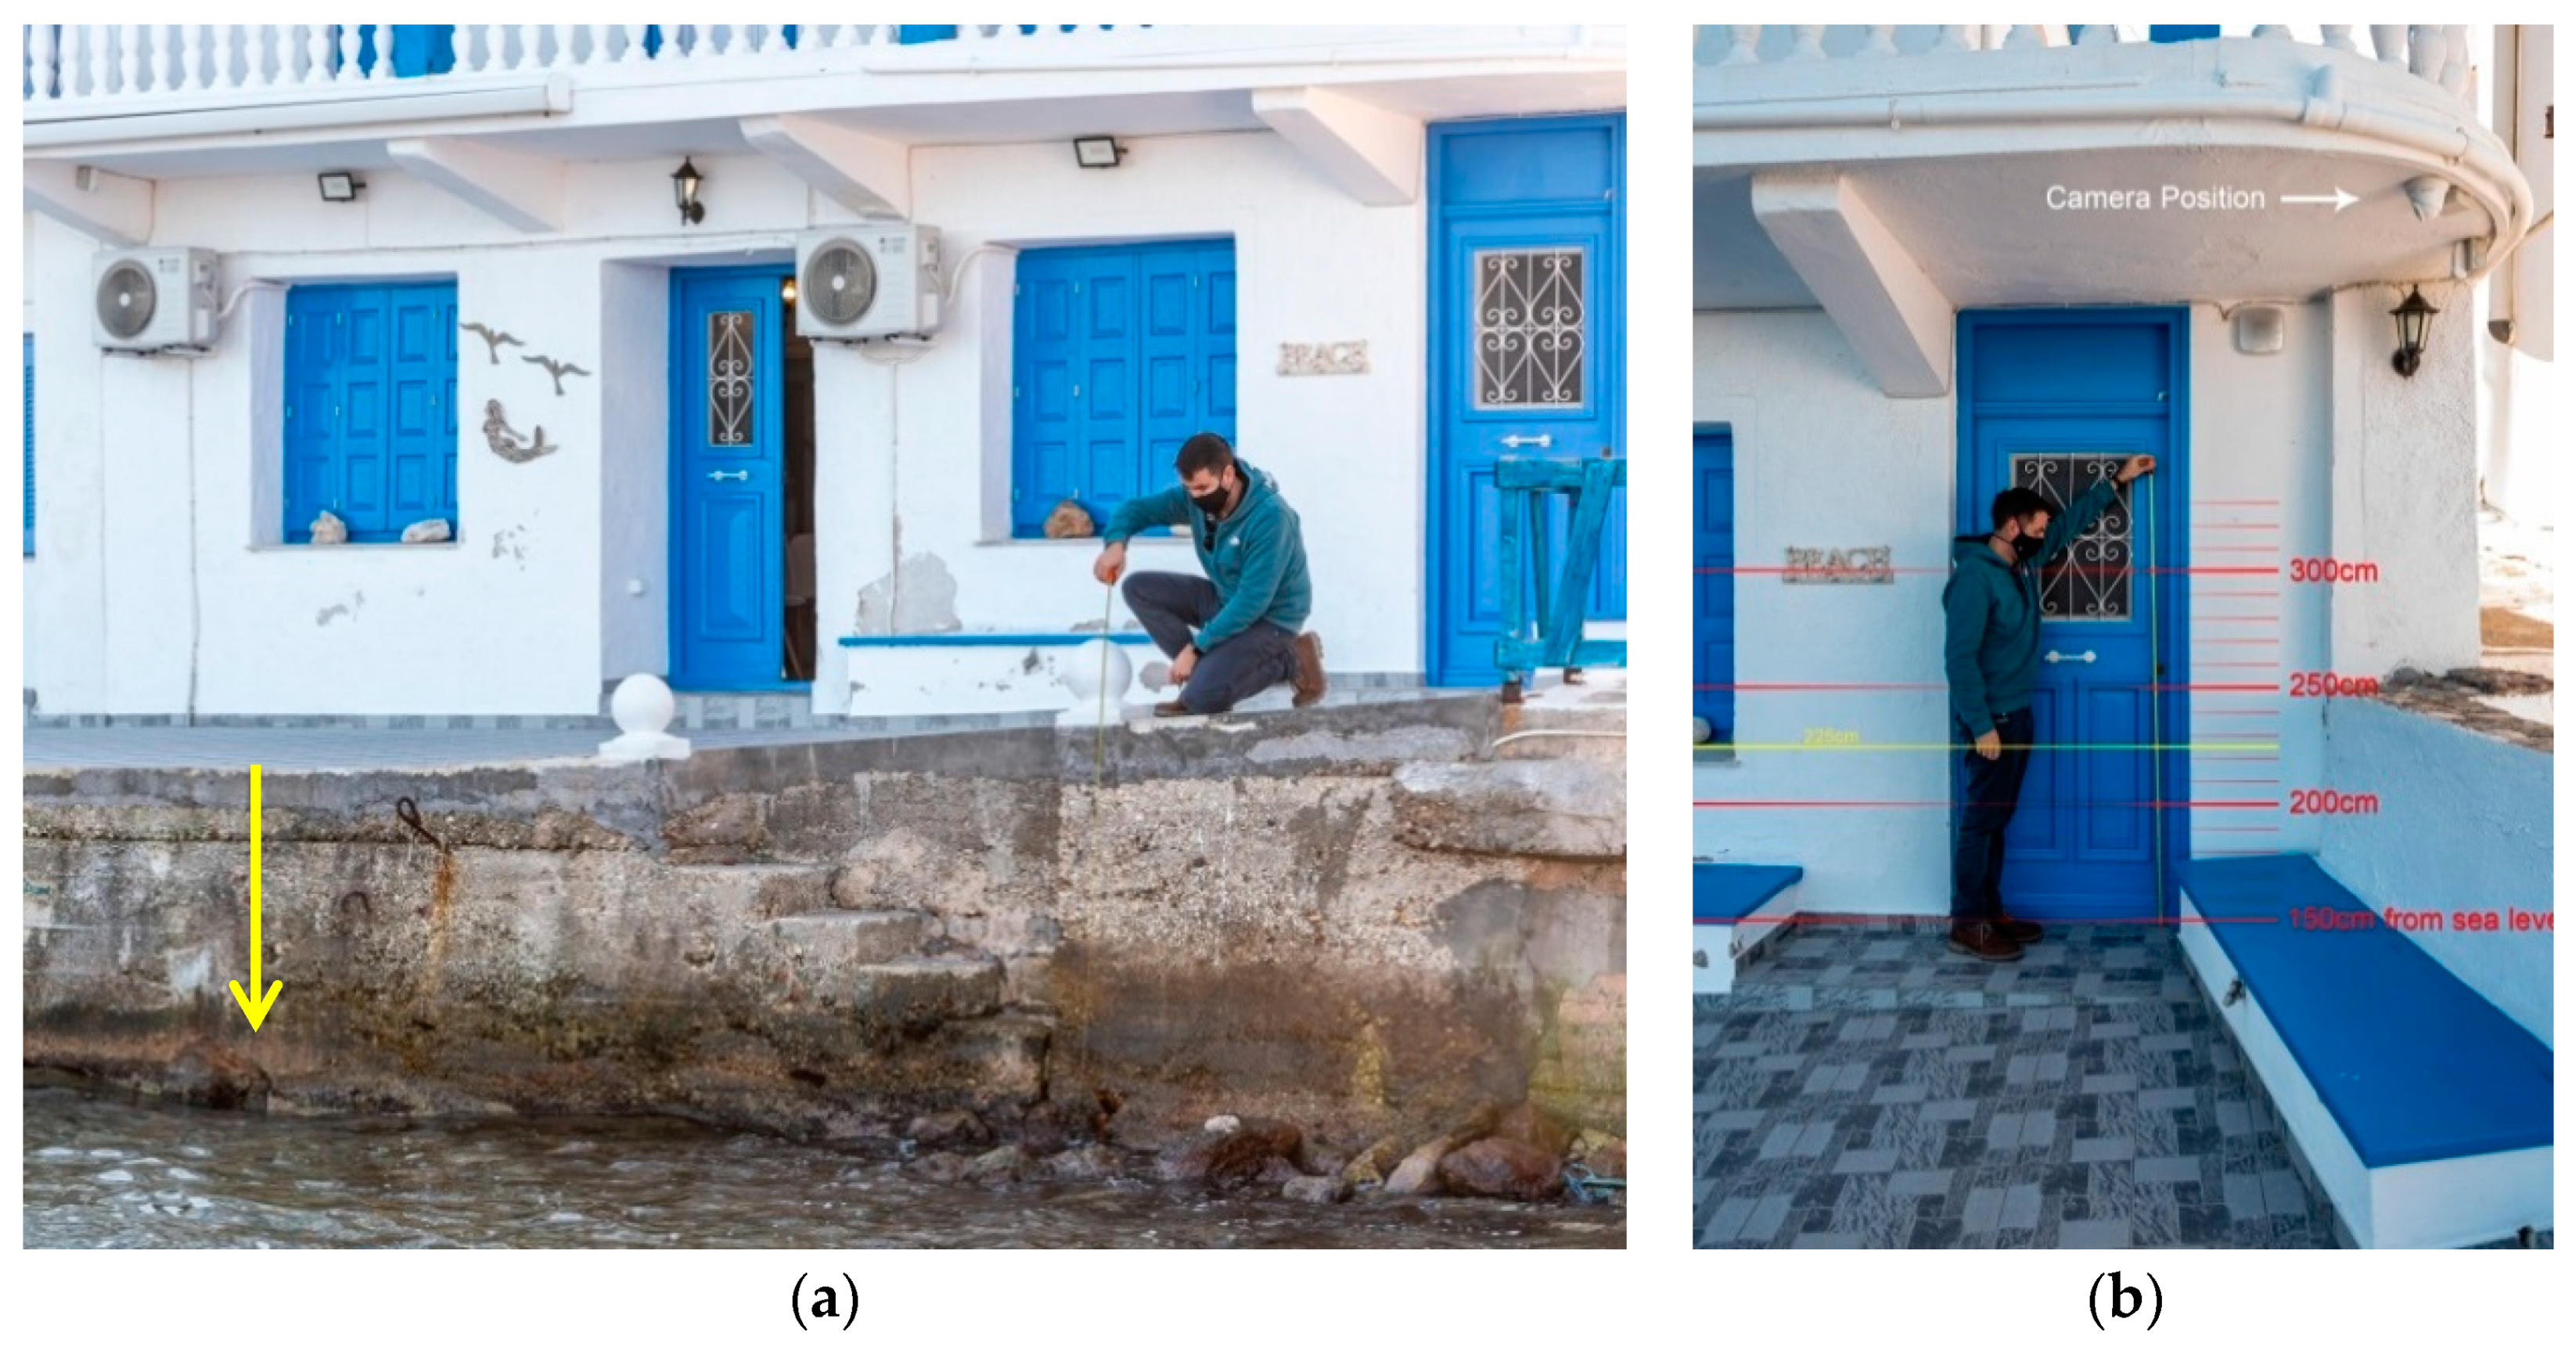
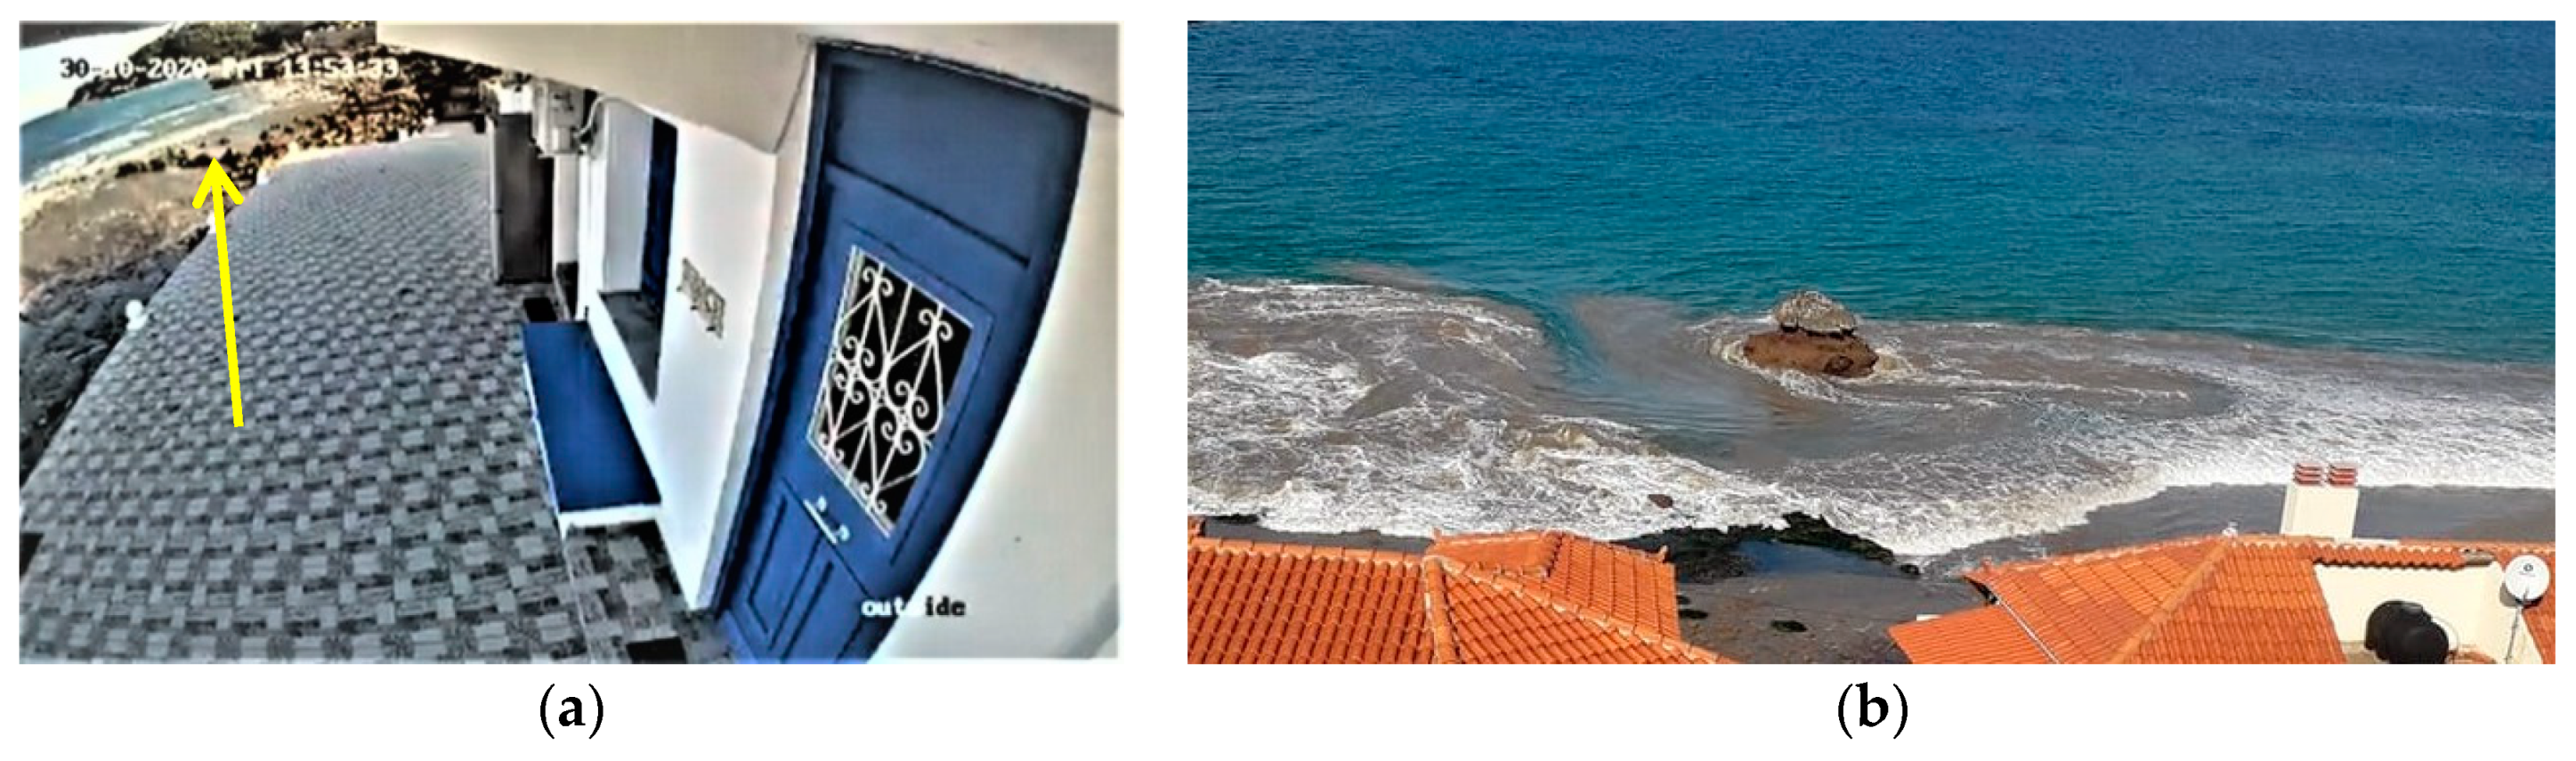
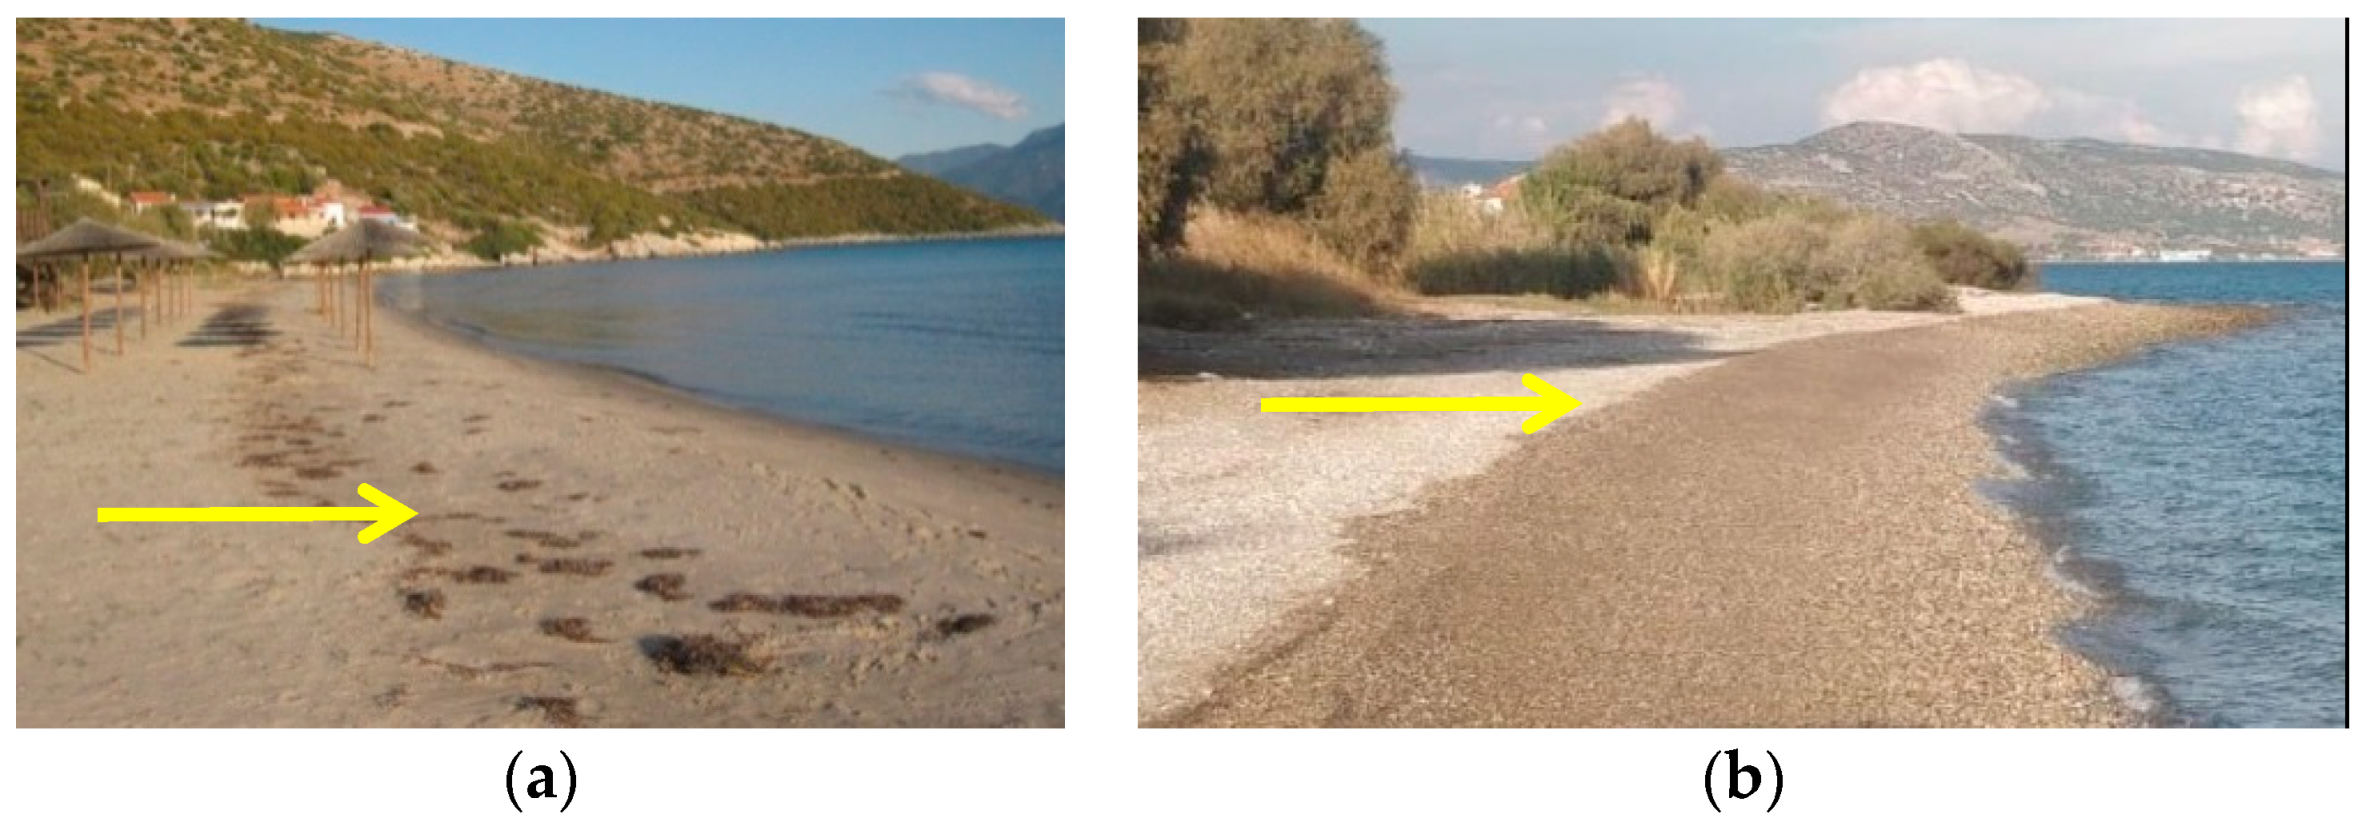
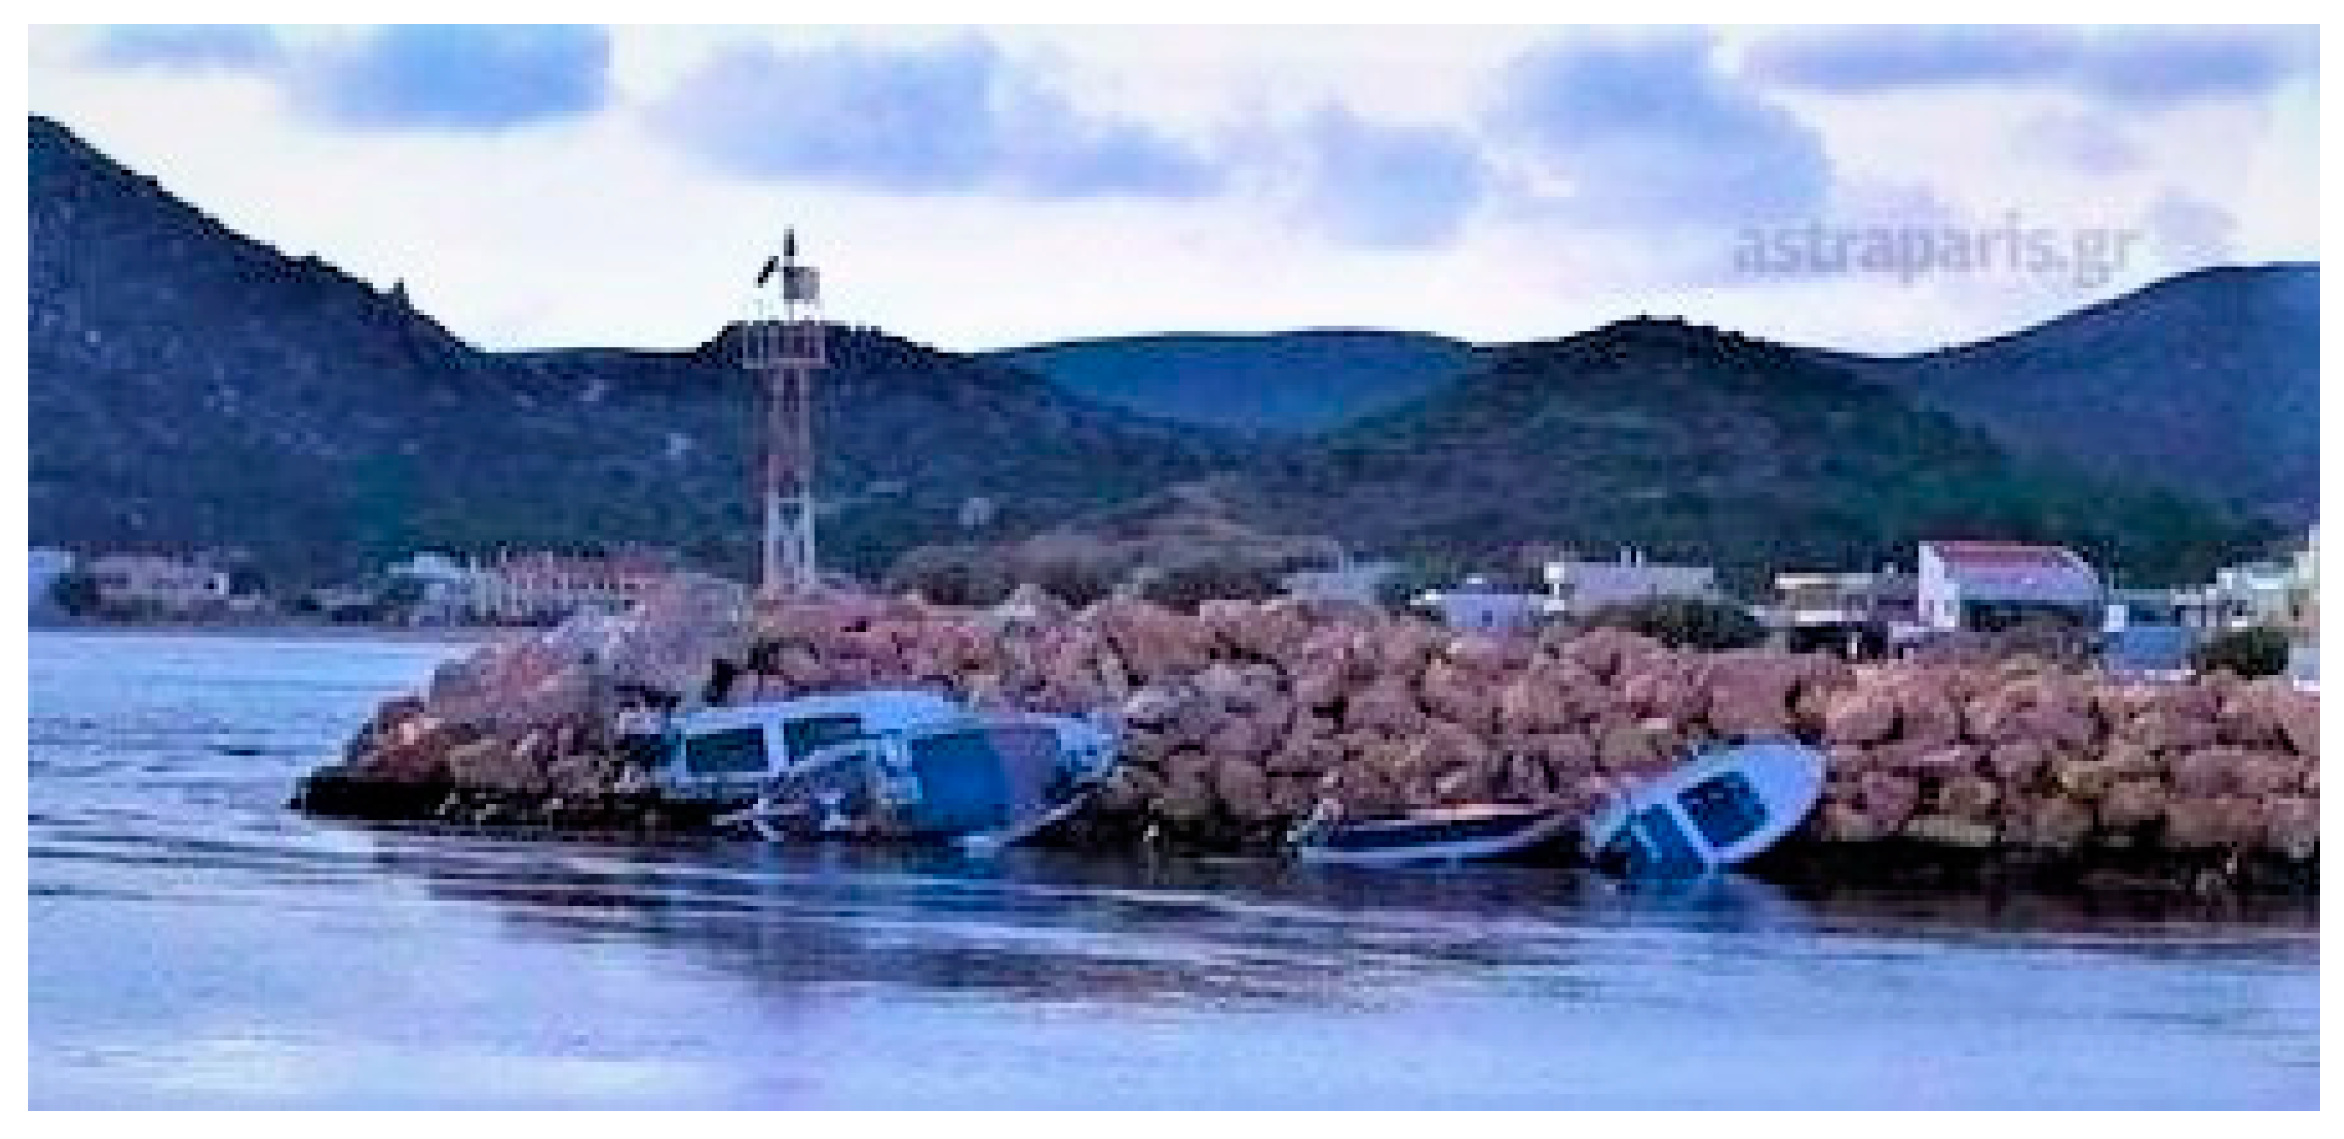
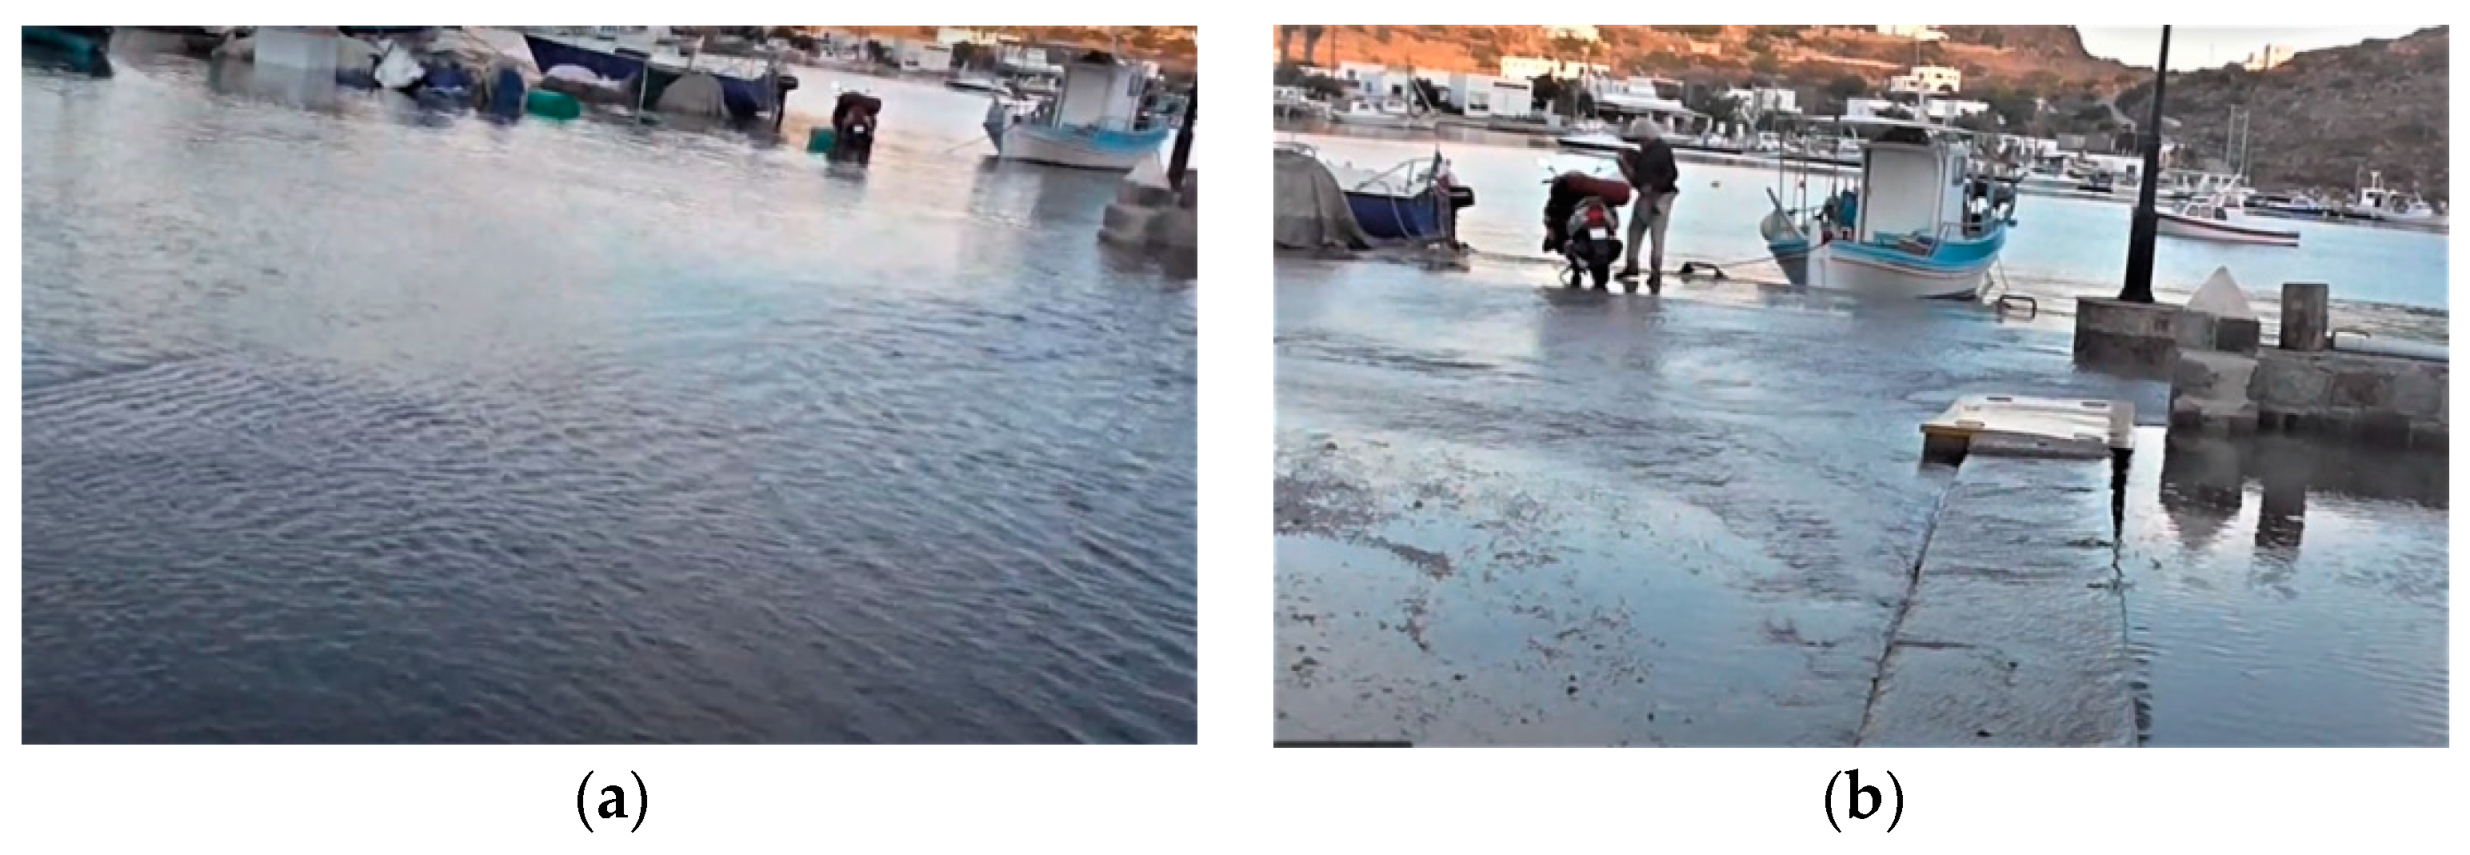
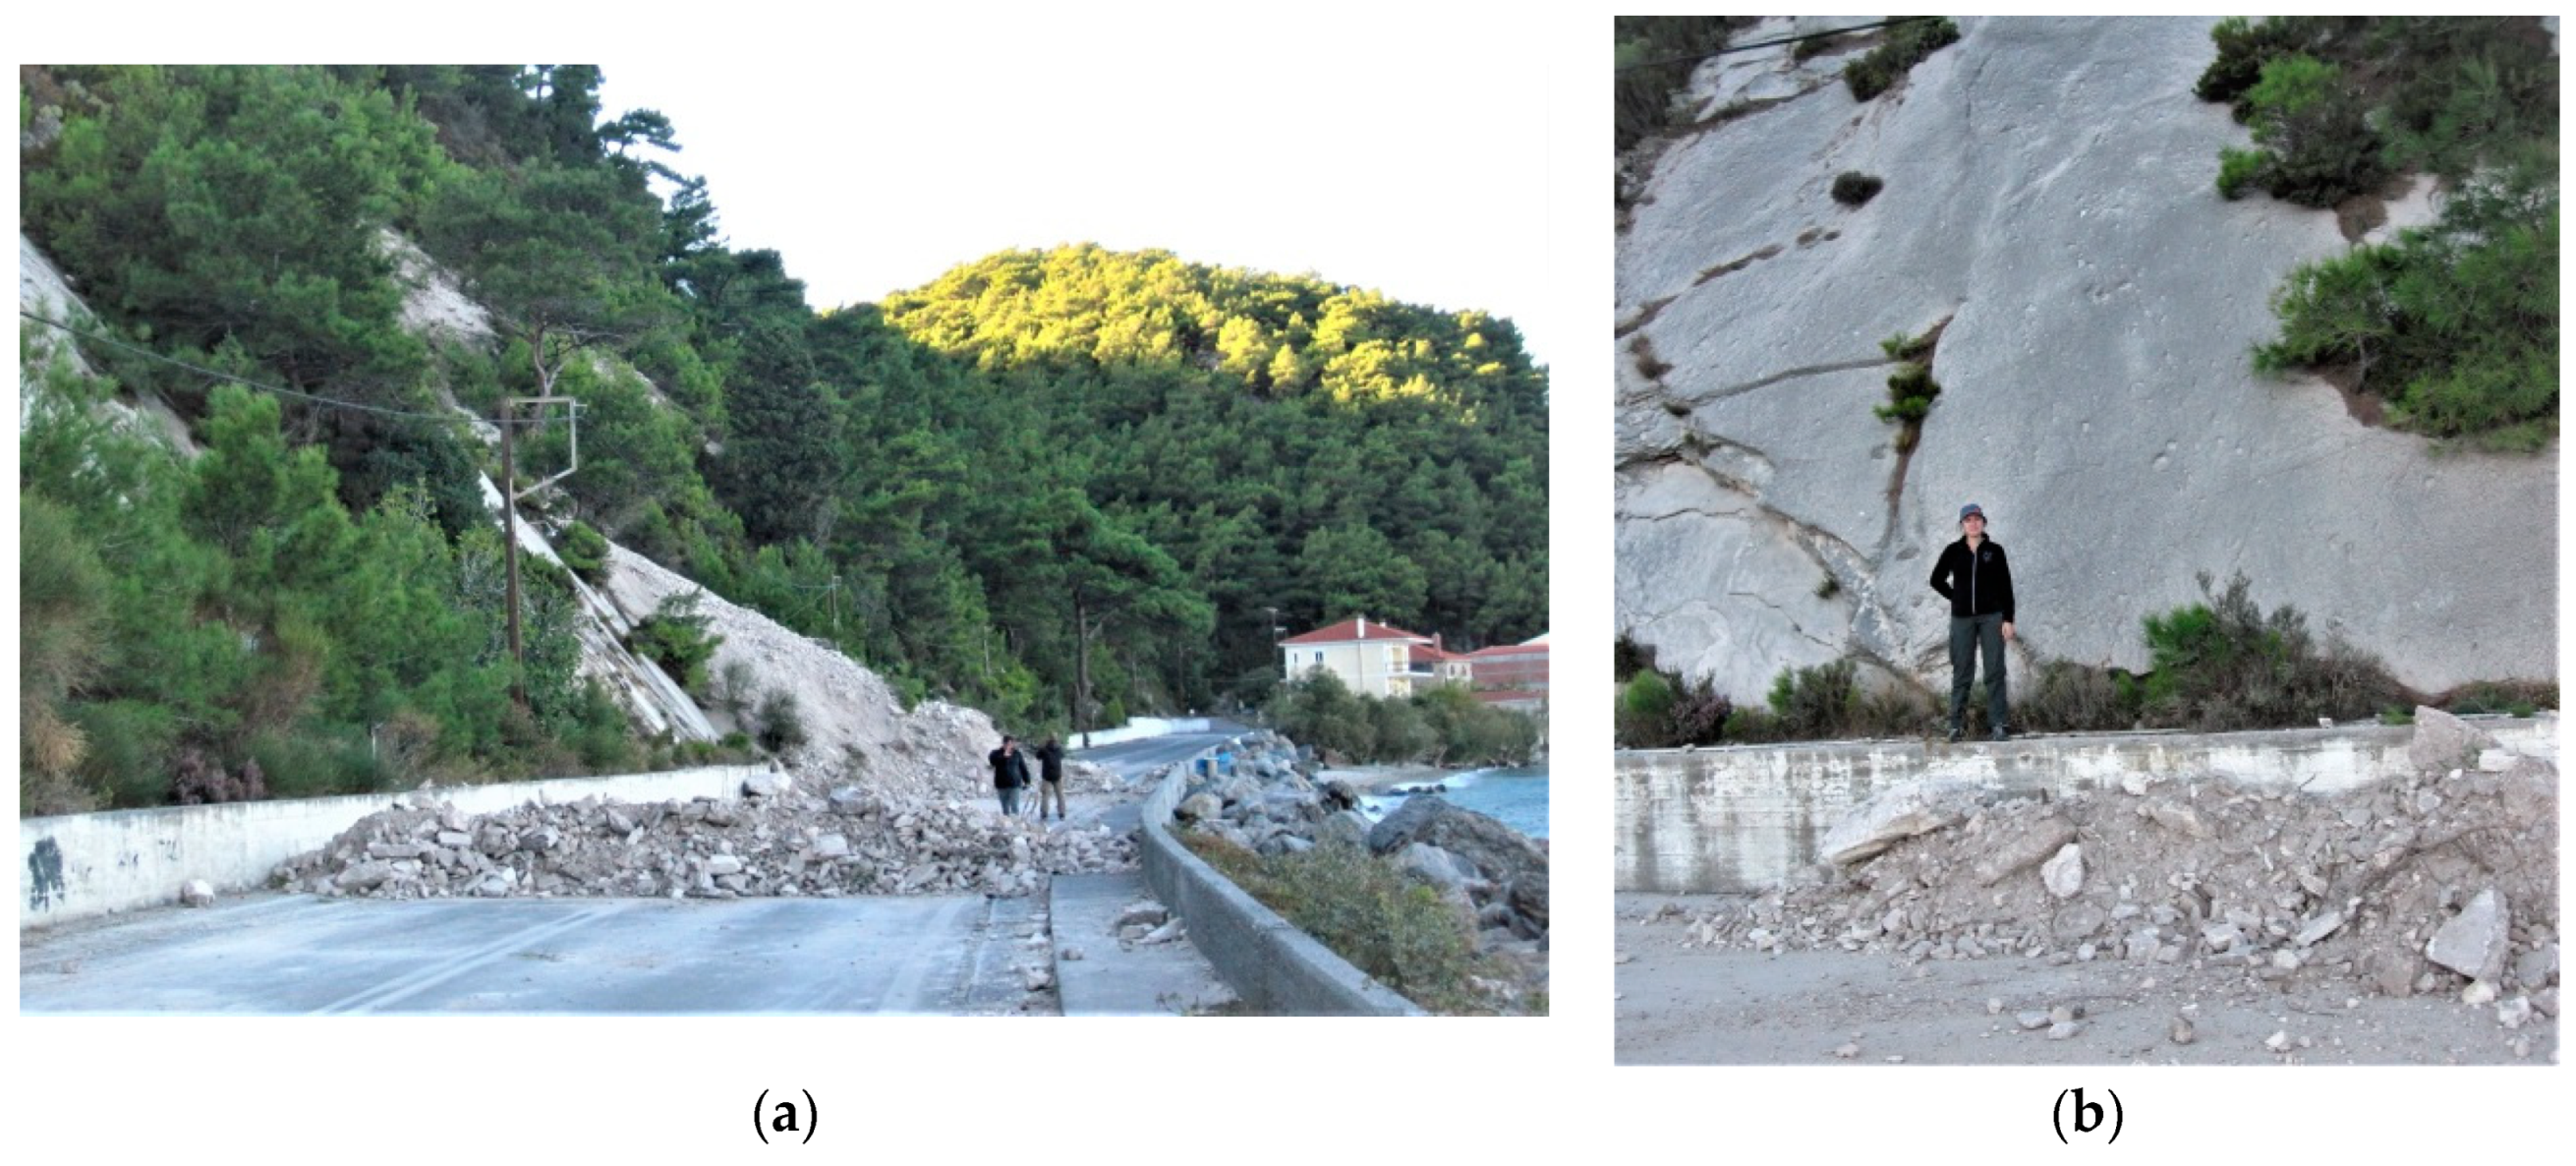
Samos North Coast
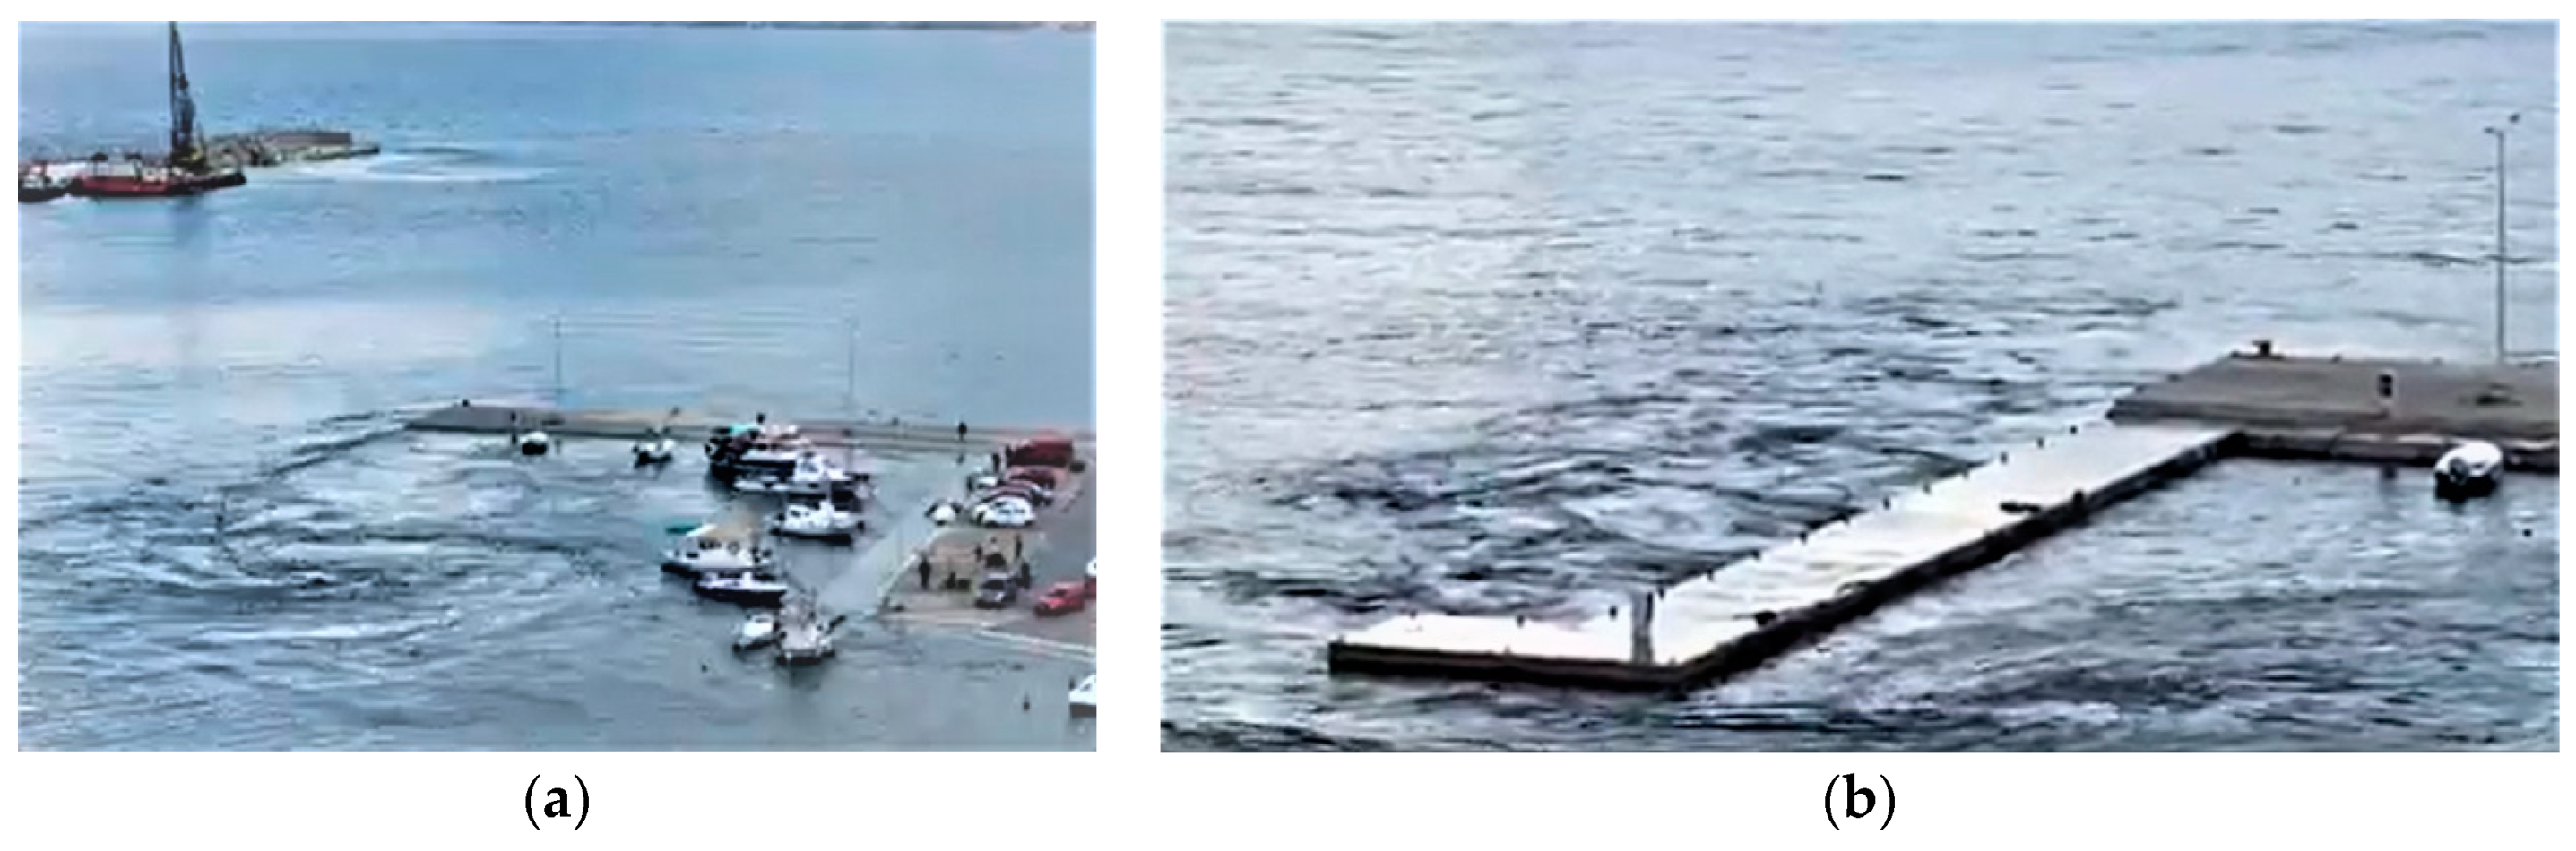
Samos South Coast
2.2.2. Ikaria Island
2.2.3. Other Islands
Summary of Observations
3. Results
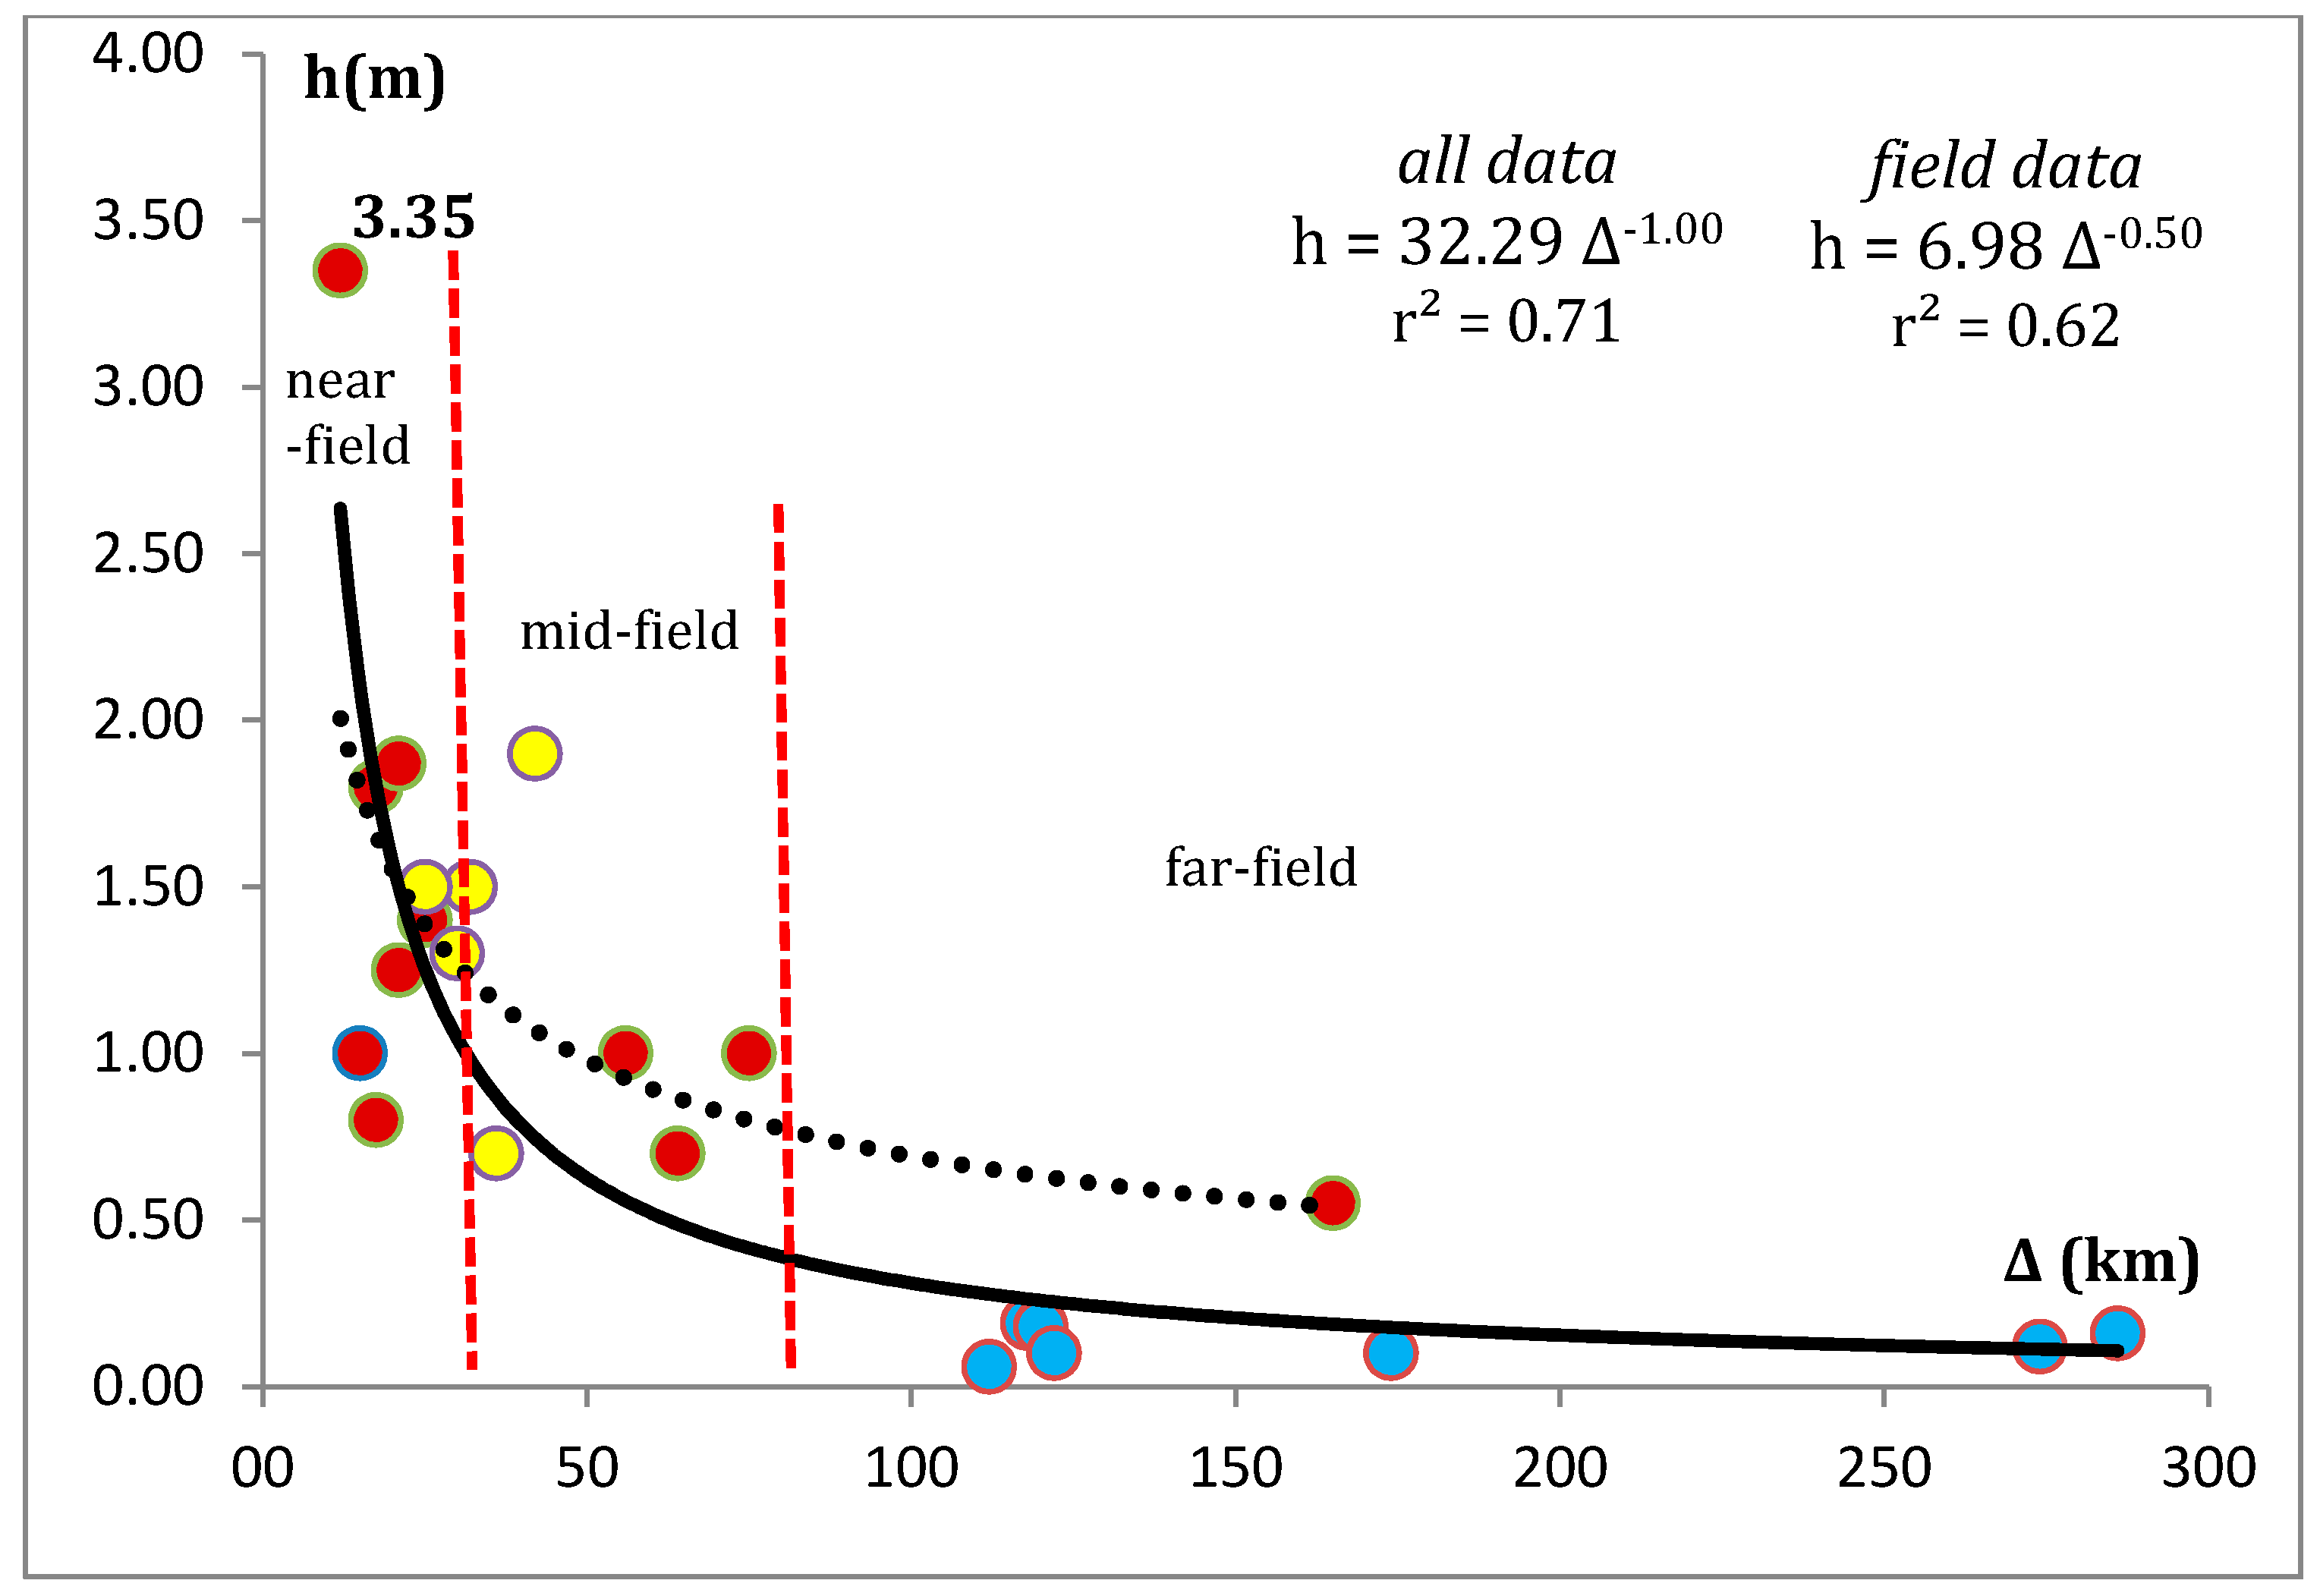
3.1. Tsunami Attenuation
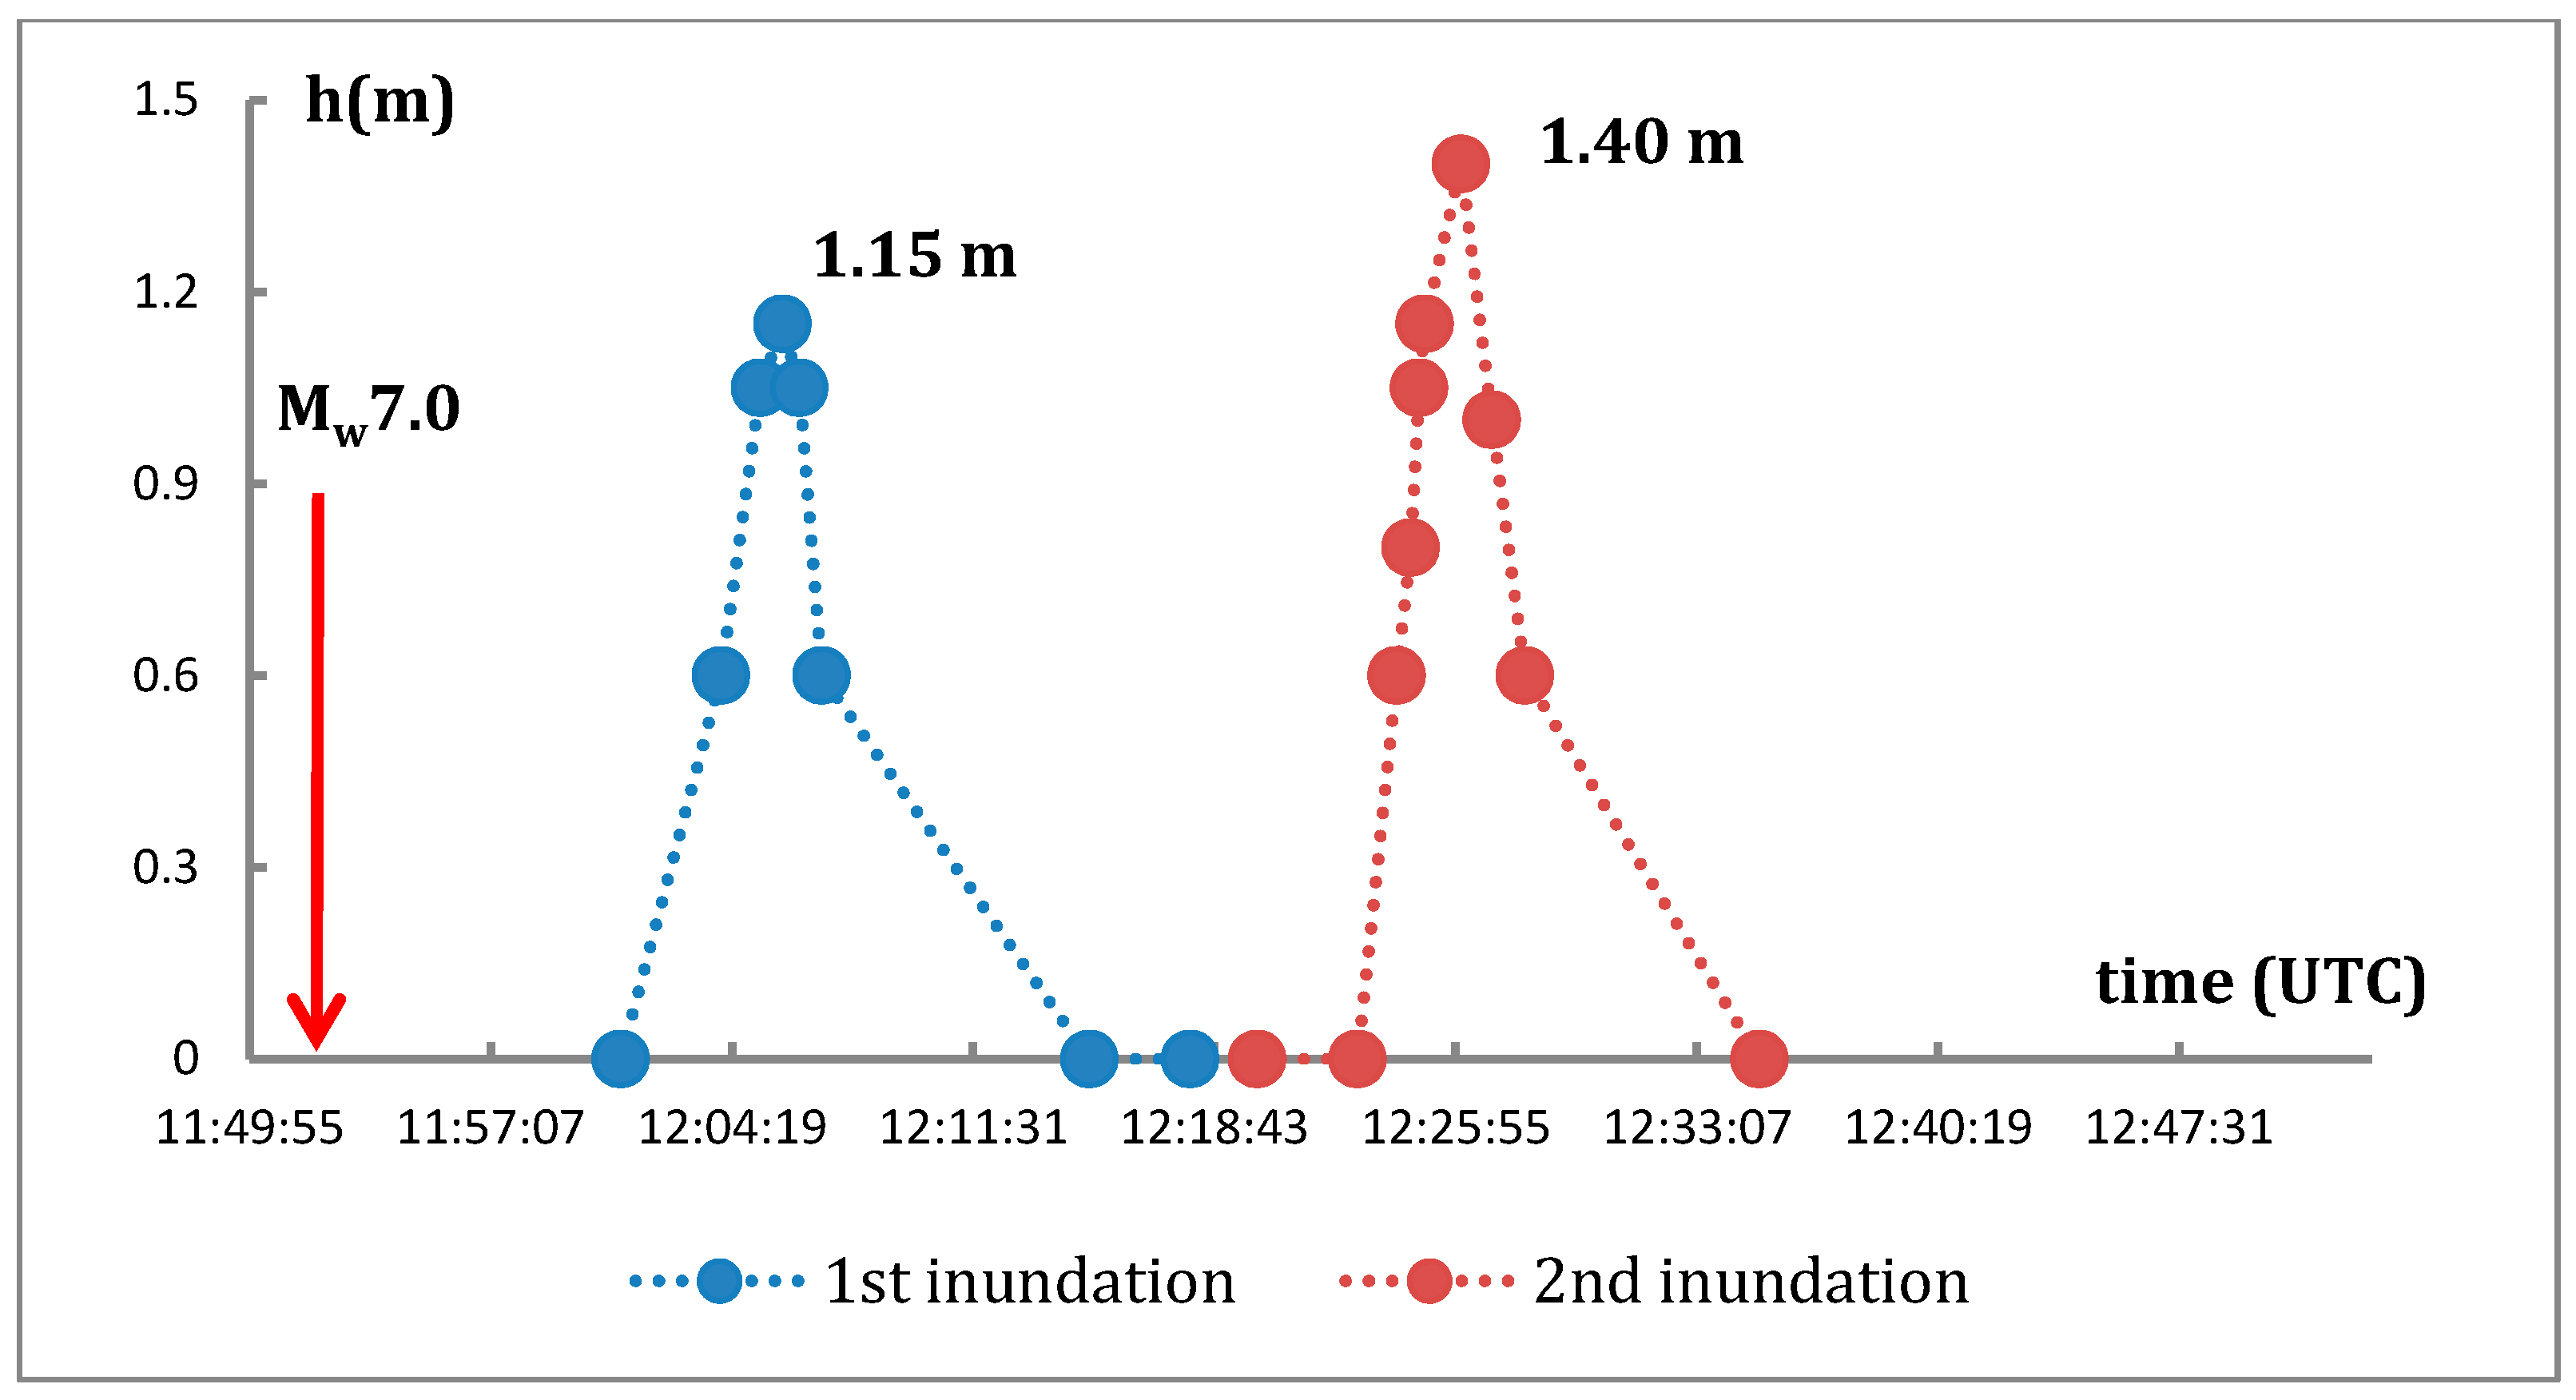
3.2. Tsunami Run-Up Timeline
3.3. Tsunami Source Properties
3.3.1. Tsunami Magnitude
3.3.2. Tsunami Source Area and Displacement Amplitude
3.4. Tsunami Impact
4. Discussion
5. Conclusions
Author Contributions
Funding
Institutional Review Board Statement
Informed Consent Statement
Data Availability Statement
Acknowledgments
Conflicts of Interest
Appendix A
Appendix B
References
- Triantafyllou, I.; Gogou, M.; Mavroulis, S.; Katsetsiadou, K.-N.; Lekkas, E.; Papadopoulos, G.A. The Tsunami Caused by the 30 October 2020 Samos (Greece), East Aegean Sea, Mw6.9 Earthquake: Impact Assessment from Post-Event Field Survey and Video Records, Version 2 ed; Department of Dynamic, Tectonic & Applied Geology, Faculty of Geology & Geoenvironment, National & Kapodistrian University of Athens: Athens, Greece, 2020; Report; p. 20. [Google Scholar] [CrossRef]
- Yalciner, A.C.; Dogan, G.G.; Ulutaş, E.; Polat, O.; Tarih, A.; Yapa, E.R.; Yavuz, E. The 30 October 2020 (11:51 UTC) Izmir-Samos Earthquake and Tsunami: Post-Tsunami Field Survey Preliminary Results. Report. 3 November 2020, p. 28. Available online: https://drive.google.com/file/d/1HzVFjMsZ5zei2UTAoIdrcWFtPpzGr8U9/view (accessed on 17 November 2020).
- Lekkas, E.; Mavroulis, S.; Gogou, M.; Papadopoulos, G.A.; Triantafyllou, I.; Katsetsiadou, K.-N.; Kranis, H.; Skourtsos, E.; Carydis, P.; Voulgaris, N.; et al. The October 30, 2020 Mw6.9 Samos (Greece) earthquake. In Newsletter of Environmental, Disaster and Crises Management Strategies; Department of Dynamic, Tectonic & Applied Geology, Faculty of Geology & Geoenvironment, National & Kapodistrian University of Athens: Athens, Greece, 2020; Volume 21, p. 156, ISSN 2653-9454. [Google Scholar] [CrossRef]
- Ganas, A.; Elias, P.; Briole, P.; Tsironi, V.; Valkaniotis, S.; Escartin, J.; Karasante, I.; Efstathiou, E. Fault responsible for Samos earthquake identified. Temblor 2020. [Google Scholar] [CrossRef]
- Mountrakis, D.; Kilias, A.; Vavliakis, E.; Psilovikos, A.; Karakaisis, G.; Papazachos, C.; Thomaidou, E.; Seitanidis, G. Neotectonic Map of Greece, “Samos” Sheet, Scale 1:75.000; Institute of Geology and Mining Exploration: Athens, Greece, 2006. [Google Scholar]
- Pavlides, S.; Tsapanos, T.; Zouros, N.; Sboras, S.; Koravos, G.; Chatzipetros, A. Using Active Fault Data for Assessing Seismic Hazard: A Case Study from NE Aegean Sea, Greece. In Proceedings of the XVIIth International Conference on Soil Mechanics and Geotechnical Engineering, Alexandria, Egypt, 2–3 October 2009. [Google Scholar]
- Chatzipetros, A.; Kiratzi, A.; Sboras, S.; Zouros, N.; Pavlides, S. Active faulting in the north eastern Aegean Sea Islands. Tectonophysics 2013, 597–598, 106–122. [Google Scholar] [CrossRef]
- Greek Database of Seismogenic Sources. Available online: http://gredass.unife.it/gredassGM/ (accessed on 24 December 2020).
- Papadopoulos, G.A.; Gràcia, E.; Urgeles, R.; Sallares, V.; De Martini, P.M.; Pantosti, D.; González, M.; Yalciner, A.C.; Mascle, J.; Sakellariou, D.; et al. Historical and pre-historical tsunamis in the Mediterranean and its connected seas: Geological signatures, generation mechanisms and coastal impacts. Mar. Geol. 2014, 354, 81–109. [Google Scholar] [CrossRef]
- Papadopoulos, G.A. Tsunamis in the European-Mediterranean Region: From Historical Record to Risk Mitigation; Elsevier: Amsterdam, The Netherlands, 2016; p. 271. ISBN 987-0-12-4202245. [Google Scholar]
- Ambraseys, N.N. Earthquakes in the Mediterranean and Middle East, a Multidisciplinary Study of Seismicity up to 1900; Cambridge University Press: Cambridge, UK, 2009; p. 947. [Google Scholar]
- Papazachos, B.C.; Papazachou, C. The Earthquakes of Greece; Ziti Publ.: Thessaloniki, Greece, 2003; p. 286. (In Greek) [Google Scholar]
- Makropoulos, K.; Kaviris, G.; Kouskouna, V. An updated and extended earthquake catalogue for Greece and adjacent areas since 1900. Nat. Hazards Earth Syst. Sci. 2012, 12, 1425–1430. [Google Scholar] [CrossRef] [Green Version]
- ISC-GEM. The ISC-GEM Global Instrumental Earthquake Catalogue, # Version 7.0-Released on 2020-04-09. 2020. Available online: http://doi.org/10.31905/D808B825 (accessed on 5 November 2020).
- Galanopoulos, A.G. The seismic sea-wave of 9 July 1956. Prakt. Acad. Athens 1957, 32, 90–101, (In Greek with English abstract). [Google Scholar]
- Ambraseys, N.N. The seismic sea-wave of July 1956 in the Greek Archipelago. J. Geophys. Res. 1960, 65, 1257–1265. [Google Scholar] [CrossRef]
- Farreras, S.F. Post-Tsunami Field Survey Procedures: An Outline. In Natural Hazards; Papadopoulos, G.A., Murty, T., Venkatesh, S., Blong, R., Eds.; Springer: Dordrecht, The Netherlands, 2000. [Google Scholar] [CrossRef]
- International Tsunami Survey Team (ITST). Post-Tsunami Survey Field Guide, 2nd ed.; IOC Manuals and Guides No. 37; UNESCO: Paris, France, 2014; p. 108. [Google Scholar]
- Watanabe, H. Amplitude coefficient of maximum tsunami by traveling distance and tsunami magnitude. In Tsunami ’93-Proc. of the IUGG/IOC International Tsunami Symposium; Tsuchiya, Y., Shuto, N., Eds.; Japan Society of Civil Engineers: Wakayama, Japan, 1993; pp. 271–276. [Google Scholar]
- Abe, K. Estimate of tsunami run-up heights from earthquake magnitudes. In Tsunami: Progress in Prediction, Disaster Prevention and Warning; Tsuchiya, Y., Shuto, N., Eds.; Kluwer: Amsterdam, The Netherlands, 1995; pp. 21–35. [Google Scholar]
- Papazachos, B.C.; Koutitas, C.; Hatzidimitriou, P.M.; Karacostas, B.G.; Papaioannou, C.A. Tsunami hazard in Greece and the surrounding area. Ann. Geophys. 1986, 4, 79–90. [Google Scholar]
- Papadopoulos, G.A.; Imamura, F.; Nosov, M.; Charalampakis, M. Tsunami magnitude scales. In Geological Records of Tsunamis and Other Extreme Waves, 1st ed.; Engel, M., Pilarczyk, J., May, S.M., Brill, D., Garrett, E., Eds.; Elsevier: Amsterdam, The Netherlands, 2020; pp. 33–45. ISBN 978-0-12-815686-5. [Google Scholar]
- Papadopoulos, G.A.; Lekkas, E.; Katsetsiadou, K.-N.; Rovythakis, E.; Yahav, A. Tsunami Alert Efficiency in the Eastern Mediterranean Sea: The 2 May 2020 Earthquake (Mw6.6) and Near-Field Tsunami South of Crete (Greece). GeoHazards 2020, 1, 5. [Google Scholar] [CrossRef]
- Kanamori, H.; Brodsky, E. The physics of earthquakes. Rep. Prog. Phys. 2004, 67, 1429–1496. [Google Scholar] [CrossRef]
- Levin, B.; Nosov, M. Physics of Tsunamis; Springer: Berlin/Heidelberg, Germany, 2009; p. 327. ISBN 978-1-4020-8855-1. [Google Scholar]
- Konstantinou, K.I.; Papadopoulos, G.A.; Fokaefs, A.; Orphanogiannaki, K. Empirical relationships between aftershock area dimensions and magnitude for earthquakes in the Mediterranean Sea region. Tectonophysics 2005, 403, 95–115. [Google Scholar] [CrossRef]
- Wells, D.L.; Coppersmith, K.J. New empirical relationships among magnitude, rupture length, rupture width, rupture area, and surface displacement. Bull. Seismol. Soc. Am. 1994, 84, 974–1002. [Google Scholar]
- Papadimitriou, P.; Kapetanidis, V.; Karakonstantis, A.; Spingos, I.; Kassaras, I.; Sakkas, V.; Kouskouna, V.; Karatzetzou, A.; Pavlou, K.; Kaviris, G.; et al. Preliminary Report on the Mw=6.9 Samos Earthquake of 30 October 2020. Available online: https://www.emsc-csem.org/Doc/Additional_Earthquake_Report/915787/Samos2020_preliminary-report_nkua.pdf (accessed on 30 November 2020).
- Wang, Y.; Heidarzadeh, M.; Satake, K.; Mulia, I.E.; Yamada, M. A tsunami warning system based on offshore bottom pressure gauges and data assimilation for Crete Island in the Eastern Mediterranean Basin. J. Geophys. Res. Solid Earth 2020, 125, e2020JB020293. [Google Scholar] [CrossRef]
- Sakellariou, D.; Tsampouraki-Kraounaki, K. Plio-Quaternary Extension and Strike-Slip Tectonics. In Transform Plate Boundaries and Fracture Zones in the Aegean, Chapter 14; Duarte, J.C., Ed.; Elsevier: Amsterdam, The Netherlands, 2019; pp. 339–374. ISBN 9780128120644. [Google Scholar] [CrossRef]
- Aránguiz, R.; Esteban, M.; Takagi, H.; Mikami, T.; Takabatake, T.; Gómez, M.; González, J.; Shibayama, T.; Okuwaki, R.; Yagi, Y.; et al. The 2018 Sulawesi tsunami in Palu city as a result of several landslides and coseismic tsunamis. Coast. Eng. J. 2020, 62, 445–459. [Google Scholar] [CrossRef]
- Omira, R.; Dogan, G.G.; Hidayat, R.; Husrin, S.; Prasetya, G.; Annunziato, A.; Proietti, C.; Probst, P.; Paparo, M.A.; Wronna, M.; et al. The September 28th, 2018, tsunami in Palu-Sulawesi, Indonesia: A post-event field survey. Pure Appl. Geophys. 2019, 176, 1379–1395. [Google Scholar] [CrossRef]
- Papadopoulos, G.A.; Kortekaas, S. Characteristics of landslide generated tsunamis from observational data. In Submarine Mass Movements and Their Consequences; Locat, J., Mienert, J., Eds.; Kluwer: Dordrecht, The Netherlands, 2003; pp. 367–374. [Google Scholar]
- Kajiura, K. The directivity of energy radiation of the tsunami generated in the vicinity of a continental shelf. J. Oceanogr. Soc. Jpn. 1972, 28, 260–277. [Google Scholar] [CrossRef]
- Carrier, G.F. On-shelf tsunami generation and coastal propagation. In Tsunami: Progress in Prediction, Disaster Prevention and Warning; Tsuchiya, Y., Shuto, N., Eds.; Kluwer: Dordrecht, The Netherlands, 1995; pp. 1–20. [Google Scholar]
- Geist, E.L. Near-Field Tsunami Edge Waves and Complex Earthquake Rupture. Pure Appl. Geophys. 2013, 170, 1475–1491. [Google Scholar] [CrossRef]
- Lynett, P.J.; Liu, P.L.-F. A numerical study of run-up generated by three-dimensional landslides. J. Geophys. Res. 2005, 10. [Google Scholar] [CrossRef] [Green Version]
- Sahal, A.; Roger, J.; Allgeyer, S.; Lemaire, B.; Hébert, H.; Schindelé, F.; Lavigne, F. The tsunami triggered by the 21 May 2003 Boumerdès-Zemmouri (Algeria) earthquake: Field investigations on the French Mediterranean coast and tsunami modelling. Nat. Hazards Earth Syst. Sci. 2009, 9, 1823–1834. [Google Scholar] [CrossRef]
- Dogan, G.G.; Annunziato, A.; Papadopoulos, G.A.; Guler, H.G.; Yalciner, A.C.; Cakir, T.E.; Sozdinler, C.O.; Ulutas, E.; Arikawa, T.; Suzen, M.L. The 20th July 2017 Bodrum–Kos tsunami field survey. Pure Appl. Geophys. 2019, 176, 2925–2949. [Google Scholar] [CrossRef]
- Heidarzadeh, M.; Necmioglu, O.; Ishibe, T.; Yalciner, A.C. Bodrum–Kos (Turkey-Greece) Mw6.6 earthquake and tsunami of 20 July 2017: A test for the Mediterranean tsunami warning system. Geosci. Lett. 2017, 4, 31. [Google Scholar] [CrossRef] [Green Version]
- Amato, A. Some reflections on tsunami Early Warning Systems and their impact, with a look at the NEAMTWS. Boll. Geofis. Teor. Appl. 2020, 61, 403–420. [Google Scholar] [CrossRef]
- Evelpidou, N.; Karkani, A.; Kampolis, I. Relative Sea Level Changes and Morphotectonic Implications Triggered by the Samos Earthquake of 30th October 2020. J. Mar. Sci. Eng. 2021, 9, 40. [Google Scholar] [CrossRef]


| Institute | Epicenter (No/Eo) | h (km) | Mw |
|---|---|---|---|
| GCMT | 37.76/26.68 | 12 | 7.0 |
| NOA | 37.9001/26.8057 | 6 | 6.9 |
| EMSC | 37.91/26.84 | 10 | 7.0 |
| GFZ | 37.90/26.82 | 10 | 7.0 |
| USGS | 37.918/26.790 | 21 | 7.0 |
| Observation Site | Δ (km) | t (UTC) | h (m) | d(m) | hmax(m) | dmax(m) | dam |
|---|---|---|---|---|---|---|---|
| SE Vathy, V4 (Samos Isl.) SE Vathy, V1 to V6 (Samos Isl.) | 21.0 21.0 | 12:04:15 (+) 12:22:46(+) 12:30 (−) | 1.15 (+) 1.40 (+) | 35 (+) 35 (+) | 2.0 (+) ~0.7 (−) | 102 (+) | yes yes |
| NW Vathy, V8 (Samos Isl.) | 21.0 | 1.25 (+) | 20 (+) | yes | |||
| Kedros, N1 | 17.5 | ~12.11 (−) ~12.16 (+) | ~0.8 (+) | ~5 (−) ~5 (+) | no no | ||
| Kokkari, N2 | 15.0 | ~12.01 (?) | ~1.0 (?) | no | |||
| Karlovasi, K2 (Samos Isl.) | 17.0 | ~11:59 (+) | ≥0.7 (+) | ≥84 (+) | yes | ||
| Karlovasi, K3 (Samos Isl.) | 17.5 | 11:57:30 (−) 11:59:30 (+) | ~1.0 (−) 1.80(+) | ~15 (−) 53 (+) | yes | ||
| A. Nikolaos, K4 (Samos Isl.) | 12.0 | 11:53:10 (−) 11:55:36 (+) 11:55:42 (+) | ~1.0 (-) 1.2 (+) 3.55 (+) | ~15 (−) | yes | ||
| Evdilos Port, I1 (Ikaria Isl.) | 64.0 | ~12:02 (−) ~12:04 (+) ~12:28 (+) | 0.70 (+) ~0.70 (+) | ~10 (−) | no no | ||
| A. Kirykos, I3 (Ikaria Isl.) | 56.0 | ~12:04 (−) ~12:10 (+) ~12:43 (+) | ~1.0 (+) ~1.0 (+) | ~10(-) | no no | ||
| Komi, O1 (Chios Isl.) | 75.0 | ~12:35 (−) ~12:40 (+) | ~1.00 (+) | ~15 (−) ~20 (+) | yes | ||
| Nimporio, O3 (Andros Isl.) | 165.0 | ~12:50 (+) | 0.55 (+) | no |
| Locality | φοΝ | λοΕ | Δ (km) | t (UTC) | hmax (m) | Polarity | dam |
|---|---|---|---|---|---|---|---|
| Zeytineli | 38.19600 | 26.48859 | 1.9 | yes | |||
| Dermicily | 38.210438 | 26.694419 | ~12.14 | 0.7 | (−) | yes | |
| Sigacik | 38.201305 | 26.785967 | 1.5 | yes | |||
| Akarca | 38.1647 | 26.8146 | ~12.03 | 1.3 | (−) | yes | |
| Tepecik | 38.1355660 | 26.8330510 | 1.5 | no |
| No. | Tide Station | Latο Ν | Lonο Ε | Δ (km) | H (m) |
|---|---|---|---|---|---|
| 1 | BODRUM, TGCM | 37.03217 | 27.423453 | 112 | 0.03 |
| 2 | KOS, IDSL-25 | 36.898362 | 27.287792 | 118 | 0.095 |
| 3 | KOS-MARINA, IDSL-33 | 36.891013 | 27.303632 | 120 | 0.09 |
| 4 | PLOMARI, IDSL-41 | 38.97188 | 26.37055 | 122 | 0.05 |
| 5 | SYROS, HNHS | 37.438 | 24.9411 | 174 | 0.05 |
| 6 | KASOS, NOA-03 | 35.4186 | 26.92184 | 274 | 0.06 |
| 7 | HERAKLION, NOA-10 | 35.3484 | 25.15254 | 286 | 0.08 |
Publisher’s Note: MDPI stays neutral with regard to jurisdictional claims in published maps and institutional affiliations. |
© 2021 by the authors. Licensee MDPI, Basel, Switzerland. This article is an open access article distributed under the terms and conditions of the Creative Commons Attribution (CC BY) license (http://creativecommons.org/licenses/by/4.0/).
Share and Cite
Triantafyllou, I.; Gogou, M.; Mavroulis, S.; Lekkas, E.; Papadopoulos, G.A.; Thravalos, M. The Tsunami Caused by the 30 October 2020 Samos (Aegean Sea) Mw7.0 Earthquake: Hydrodynamic Features, Source Properties and Impact Assessment from Post-Event Field Survey and Video Records. J. Mar. Sci. Eng. 2021, 9, 68. https://doi.org/10.3390/jmse9010068
Triantafyllou I, Gogou M, Mavroulis S, Lekkas E, Papadopoulos GA, Thravalos M. The Tsunami Caused by the 30 October 2020 Samos (Aegean Sea) Mw7.0 Earthquake: Hydrodynamic Features, Source Properties and Impact Assessment from Post-Event Field Survey and Video Records. Journal of Marine Science and Engineering. 2021; 9(1):68. https://doi.org/10.3390/jmse9010068
Chicago/Turabian StyleTriantafyllou, Ioanna, Marilia Gogou, Spyridon Mavroulis, Efthymios Lekkas, Gerassimos A. Papadopoulos, and Manolis Thravalos. 2021. "The Tsunami Caused by the 30 October 2020 Samos (Aegean Sea) Mw7.0 Earthquake: Hydrodynamic Features, Source Properties and Impact Assessment from Post-Event Field Survey and Video Records" Journal of Marine Science and Engineering 9, no. 1: 68. https://doi.org/10.3390/jmse9010068