Article

Mitigation of Gaseous Emissions from Stored Swine Manure with Biochar: Effect of Dose and Reapplication on a Pilot-Scale

1
Department of Agricultural and Biosystems Engineering, Iowa State University, Ames, IA 50011, USA
2
Department of Civil, Construction and Environmental Engineering, Iowa State University, Ames, IA 50010, USA
3
Department of Animal Biosystems Science, Chungnam National University, Daejon 34134, Korea
4
Department of Applied Bioeconomy, Wroclaw University of Environmental and Life Sciences, 37a Chełmonskiego Str., 51-630 Wroclaw, Poland
5
Bioeconomy Institute and Department of Mechanical Engineering, Iowa State University, Ames, IA 50011, USA
*
Author to whom correspondence should be addressed.
Atmosphere 2021, 12(1), 96; https://doi.org/10.3390/atmos12010096
Submission received: 23 December 2020 / Accepted: 8 January 2021 / Published: 11 January 2021
(This article belongs to the Special Issue Livestock Odor and Air Quality)

Abstract

:
Rural communities are affected by gaseous emissions from intensive livestock production. Practical mitigation technologies are needed to minimize emissions from stored manure and improve air quality inside barns. In our previous research, the one-time surficial application of biochar to swine manure significantly reduced emissions of NH3 and phenol. We observed that the mitigation effect decreased with time during the 30-day trials. In this research, we hypothesized that bi-weekly reapplication of biochar could improve the mitigation effect on a wider range of odorous compounds using a larger scale and longer trials. The objective was to evaluate the effectiveness of biochar dose and reapplication on mitigation of targeted gases (NH3, odorous, volatile organic compounds VOCs, odor, greenhouse gases (GHG)) from stored swine manure on a pilot-scale setup over 8-weeks. The bi-weekly reapplication of the lower biochar dose (2 kg/m2) showed much higher significant percentage reductions in emissions for NH3 (33% without and 53% with reapplication) and skatole (42% without and 80% with reapplication), respectively. In addition, the reapplication resulted in the emergence of a statistical significance to the mitigation effect for all other targeted VOCs. Specifically, for indole, the percentage reduction improved from 38% (p = 0.47, without reapplication) to 78% (p = 0.018, with reapplication). For phenol, the percentage reduction improved from 28% (p = 0.71, without reapplication) to 89% (p = 0.005, with reapplication). For p-cresol, the percentage reduction improved from 31% (p = 0.86, without reapplication) to 74% (p = 0.028, with reapplication). For 4-ethyl phenol, the percentage emissions reduction improved from 66% (p = 0.44, without reapplication) to 87% (p = 0.007, with reapplication). The one-time 2 kg/m2 and 4 kg/m2 treatments showed similar effectiveness in mitigating all targeted gases, and no statistical difference was found between the dosages. The one-time treatments showed significant percentage reductions of 33% and 42% and 25% and 48% for NH3 and skatole, respectively. The practical significance is that the higher (one-time) biochar dose may not necessarily result in improved performance over the 8-week manure storage, but the bi-weekly reapplication showed significant improvement in mitigating NH3 and odorous VOCs. The lower dosages and the frequency of reapplication on the larger-scale should be explored to optimize biochar treatment and bring it closer to on-farm trials.

1. Introduction

Livestock production always plays a very important role in our daily life. This industry provides millions of people with jobs and food. However, along with all the benefits of livestock production, unwanted gas emissions, such as ammonia (NH3), greenhouse gases (GHG), volatile organic compounds (VOCs), and odor are raising world-wide concerns regarding their impact on the environment [1]. NH3 emissions are a major nitrogen (N) pollutant and responsible for the formation of secondary particulate matter (PM2.5) aerosols. GHGs, such as carbon dioxide (CO2), methane (CH4), and nitrous oxide (N2O), are related to concerns about climate change [2]. VOCs, such as phenolics, fatty acids, sulfur-containing compounds, are major contributors to the odorous emissions from the swine barns [3].
Research has been conducted to mitigate gas emissions from livestock agriculture. The user-friendly Air Management Practices Assessment Tool (AMPAT) organized 12 different mitigation technologies targeting gaseous emissions from stored manure [4]. Manure additives (i.e., proprietary mixtures of bacteria or chemicals) are popular low-cost products used by some United States (US) farmers. Small doses of manure additives can be easily applied to manure without changes to the current waste management structures. However, in recent research, 12 commercial manure additives did not show significant impacts on the targeted gases in controlled side-by-side trials [5,6]. Thus, there is still a need to develop and test manure additives that are adaptable to current animal farming systems.
Research shows that some experimental manure additives can have a positive impact on the targeted emissions. Zeolite applications to laying hen manure showed significant effectiveness in controlling odorous VOCs; the average reduction in the total odor was reduced up to 67% [7]. The pilot-scale study of using soybean peroxidase with calcium peroxide to mitigate the emissions from stored swine manure showed significant reductions of NH3 by up to 68%, dimethyl disulfide (DMDS) by up to 85%, p-cresol by up to 90%, and skatole by up to 93%; also, significant generations were observed in CH4 by up to ~200% and in CO2 by up to ~124% [8]. Furthermore, the farm-scale testing of soybean peroxidase and calcium peroxide in the deep-pit swine barns observed significant reductions in NH3 by 22%, H2S by 80%, and some targeted VOCs by 30% to 40%; no significant changes to GHGs [9].
Surficial (one-time) application of biochar as a manure additive was proposed for the comprehensive mitigation of gas emissions from stored manure. Biochar (a carbonaceous material) can be made from various types of biomass and waste through pyrolysis or torrefaction. Different feedstock and process conditions will produce biochar with different physicochemical properties [10,11,12,13,14,15,16]. Thus, biochar with desired properties (e.g., pH, porosity, chemical moiety) could be explored and used to mitigate targeted gaseous emissions.
Recent research using biochar as a manure additive to mitigate gas emissions from livestock manure focused on a one-time application. For example, Maurer et al. reported that a thin layer of biochar (pH: 7.28) resulted in a significant reduction in NH3 and a significant generation of CH4 as applied to stored swine manure in a pilot-scaled setup [9]. Dougherty et al. showed that biochar (pH: 9.32) had a significant reduction in NH3 up to 22% when applied to dairy manure [17]. Meiirkhanuly et al. showed that the one-time surficial application of biochar to swine manure significantly reduced NH3 and phenol [18]. However, we observed that the mitigation effect decreased with time during the 30-day trials [18].
In this research, we hypothesize that bi-weekly reapplication of biochar can improve the mitigation effect on a wider range of compounds and their gaseous emissions using larger scale and longer trials. The objective of this study is to evaluate the effectiveness of highly alkaline and porous (HAP) biochar (pH 9.2) reapplication and dose on mitigation of targeted gases (NH3, GHG, and odorous VOCs) from stored swine manure on a pilot-scale setup over eight weeks.

2. Materials and Methods

Four triplicated treatments were evaluated during 8-week long trials:
  • Control—Manure not treated with biochar.
  • Treatment 1—manure treated (one-time) with a ~2 kg/m2 of HAP biochar.
  • Treatment 2—manure treated (one-time) with a ~4 kg/m2 of HAP biochar.
  • Treatment 3—manure treated with a ~2 kg/m2 of HAP biochar and bi-weekly reapplications of ~2 kg/m2 of HAP biochar after manure addition.
The pilot-scale experimental setup aimed to simulate deep pit swine manure storage structure. A detailed description of the pilot-scale setup, manure properties, and collection, gas (NH3, CO2, CH4, N2O), 11 odorous VOCs), and odor concentration measurements are presented elsewhere [5,19]. Briefly, fresh manure was collected from 3 different deep pit swine farms in Iowa. Twelve manure storage simulators were filled with 74.6 L of fresh swine manure. Bi-weekly, 9.5 L of the same type of manure (Control, Treatments 1–3) and biochar for reapplication (Treatment 3 only) were added into the simulators from the top. The ranges of total solids, volatile solids, total Kjeldahl nitrogen, and total phosphorus in the manure were 4.6–8.2%, 3.6–6.7%, 4340–7350 mg/L, 3050–5300 mg/L, and 940–2450 mg/L, respectively. The highly alkaline (pH = 9.2) and porous (HAP) biochar resulted from autothermal corn stover pyrolysis at 500 °C. Detailed properties of the biochar are presented elsewhere [19].

2.1. Ammonia

NH3 concentrations were measured with the real-time analyzer OMS-300 equipped with an NH3/CR-1000 electrochemical gas sensor (Membrapro, Wallisellen, Switzerland) [5,19].

2.2. Greenhouse Gases

GHG samples were analyzed with gas chromatography (GC) (SRI Instruments, Torrance, CA, USA) equipped with a flame ionization detector (FID) and electron capture detector (ECD) [5,8].

2.3. Volatile Organic Compounds

VOC samples were collected using 1 L gas sampling glass bulbs (Supelco). Then, a 2 cm divinylbenzene/Carboxen/polydimethylsiloxane (DVB/Carboxen/PDMS) solid-phase microextraction (SPME) fiber (57384-U, Supelco, Bellefonte, PA, USA) was used to extract the VOCs from the sampling glass bulbs for 50 min at lab temperature (23–24 °C). Finally, the fiber with extracted VOCs was inserted into a 260 °C GC (Microanalytics, Round Rock, TX, USA) inlet; VOCs were thermally desorbed for 2 min and analyzed by a mass spectrometer (MS) (Agilent, model 5973N, Santa Clara, CA, USA) [5].

2.4. Odor

Gas samples were collected in 10 L Tedlar sample bags using Vac-U-Chamber (SKC Inc., Eighty-Four, PA, USA). Then, the samples were analyzed with AC’SCENT International Olfactometer (St. Croix Sensory Inc., Stillwater, MN, USA) using dynamic triangular forced-choice methods. Each sample was evaluated twice by four panelists [5].

2.5. Mitigation and Statistical Analyses

NH3, CO2, N2O, and CH4 were all measured in units of parts per million (ppm). The concentrations were converted to flux in units of (mg/m2/h) using measured environmental conditions [2]. For VOCs, all analyses of treatment effectiveness were completed in the units of peak area counts (PACs) as an MS detector response to compounds abundance in the gas sample. Although the PAC unit is arbitrary, it is sufficient for estimating the percent reduction due to each treatment by comparing the PACs for Treatment with Control. The overall mean percent reduction was calculated with Equation (1):
% R = E C o n t r o l E T r e a t m e n t E C o n t r o l 100 %
where %R is the overall mean percent reduction, EControl and ETreatment are the means (n = 3 replicates) of flux, odor concentrations, or PACs from Control and Treatment, respectively.
The one-way Analysis of Variance (ANOVA) and Tukey–Kramer Method were used to determine the p-values of the reduction. All statistical analyses were completed using JMP software (version Pro 15, SAS Institute, Inc., Cary, NC, USA). When a p-value was less than or equal to 0.05, the reduction was considered statistically significant. Tables S1–S10 report detailed statistical results, including the least-square means, standard errors, 95% confident intervals, and letters indicating significance.

3. Results

The 8-weeks of performance of biochar on mitigation of gaseous emissions (evaluated as the percentage reduction) are summarized in Table 1 for the one-time application (Treatments 1 and 2, 2 and 4 kg/m2) and bi-weekly reapplication (Treatment 3, 2 kg/m2). The one-time biochar treatment could significantly reduce NH3 (up to 33%) and skatole (up to 48%) emissions. There were no significant impacts of biochar on the mitigation of odor and GHGs. However, there was a clear advantage to biochar reapplication. The percentage reduction of NH3 and skatole emissions improved to 53% and 80%, respectively. In addition, the emissions of all other targeted VOCs (indole, phenol, p-cresol, 4-ethyl phenol) were significantly reduced (78%, 89%, 74%, 87%). However, still, no statistically significant impacts were found on the mitigation of odor and GHGs.
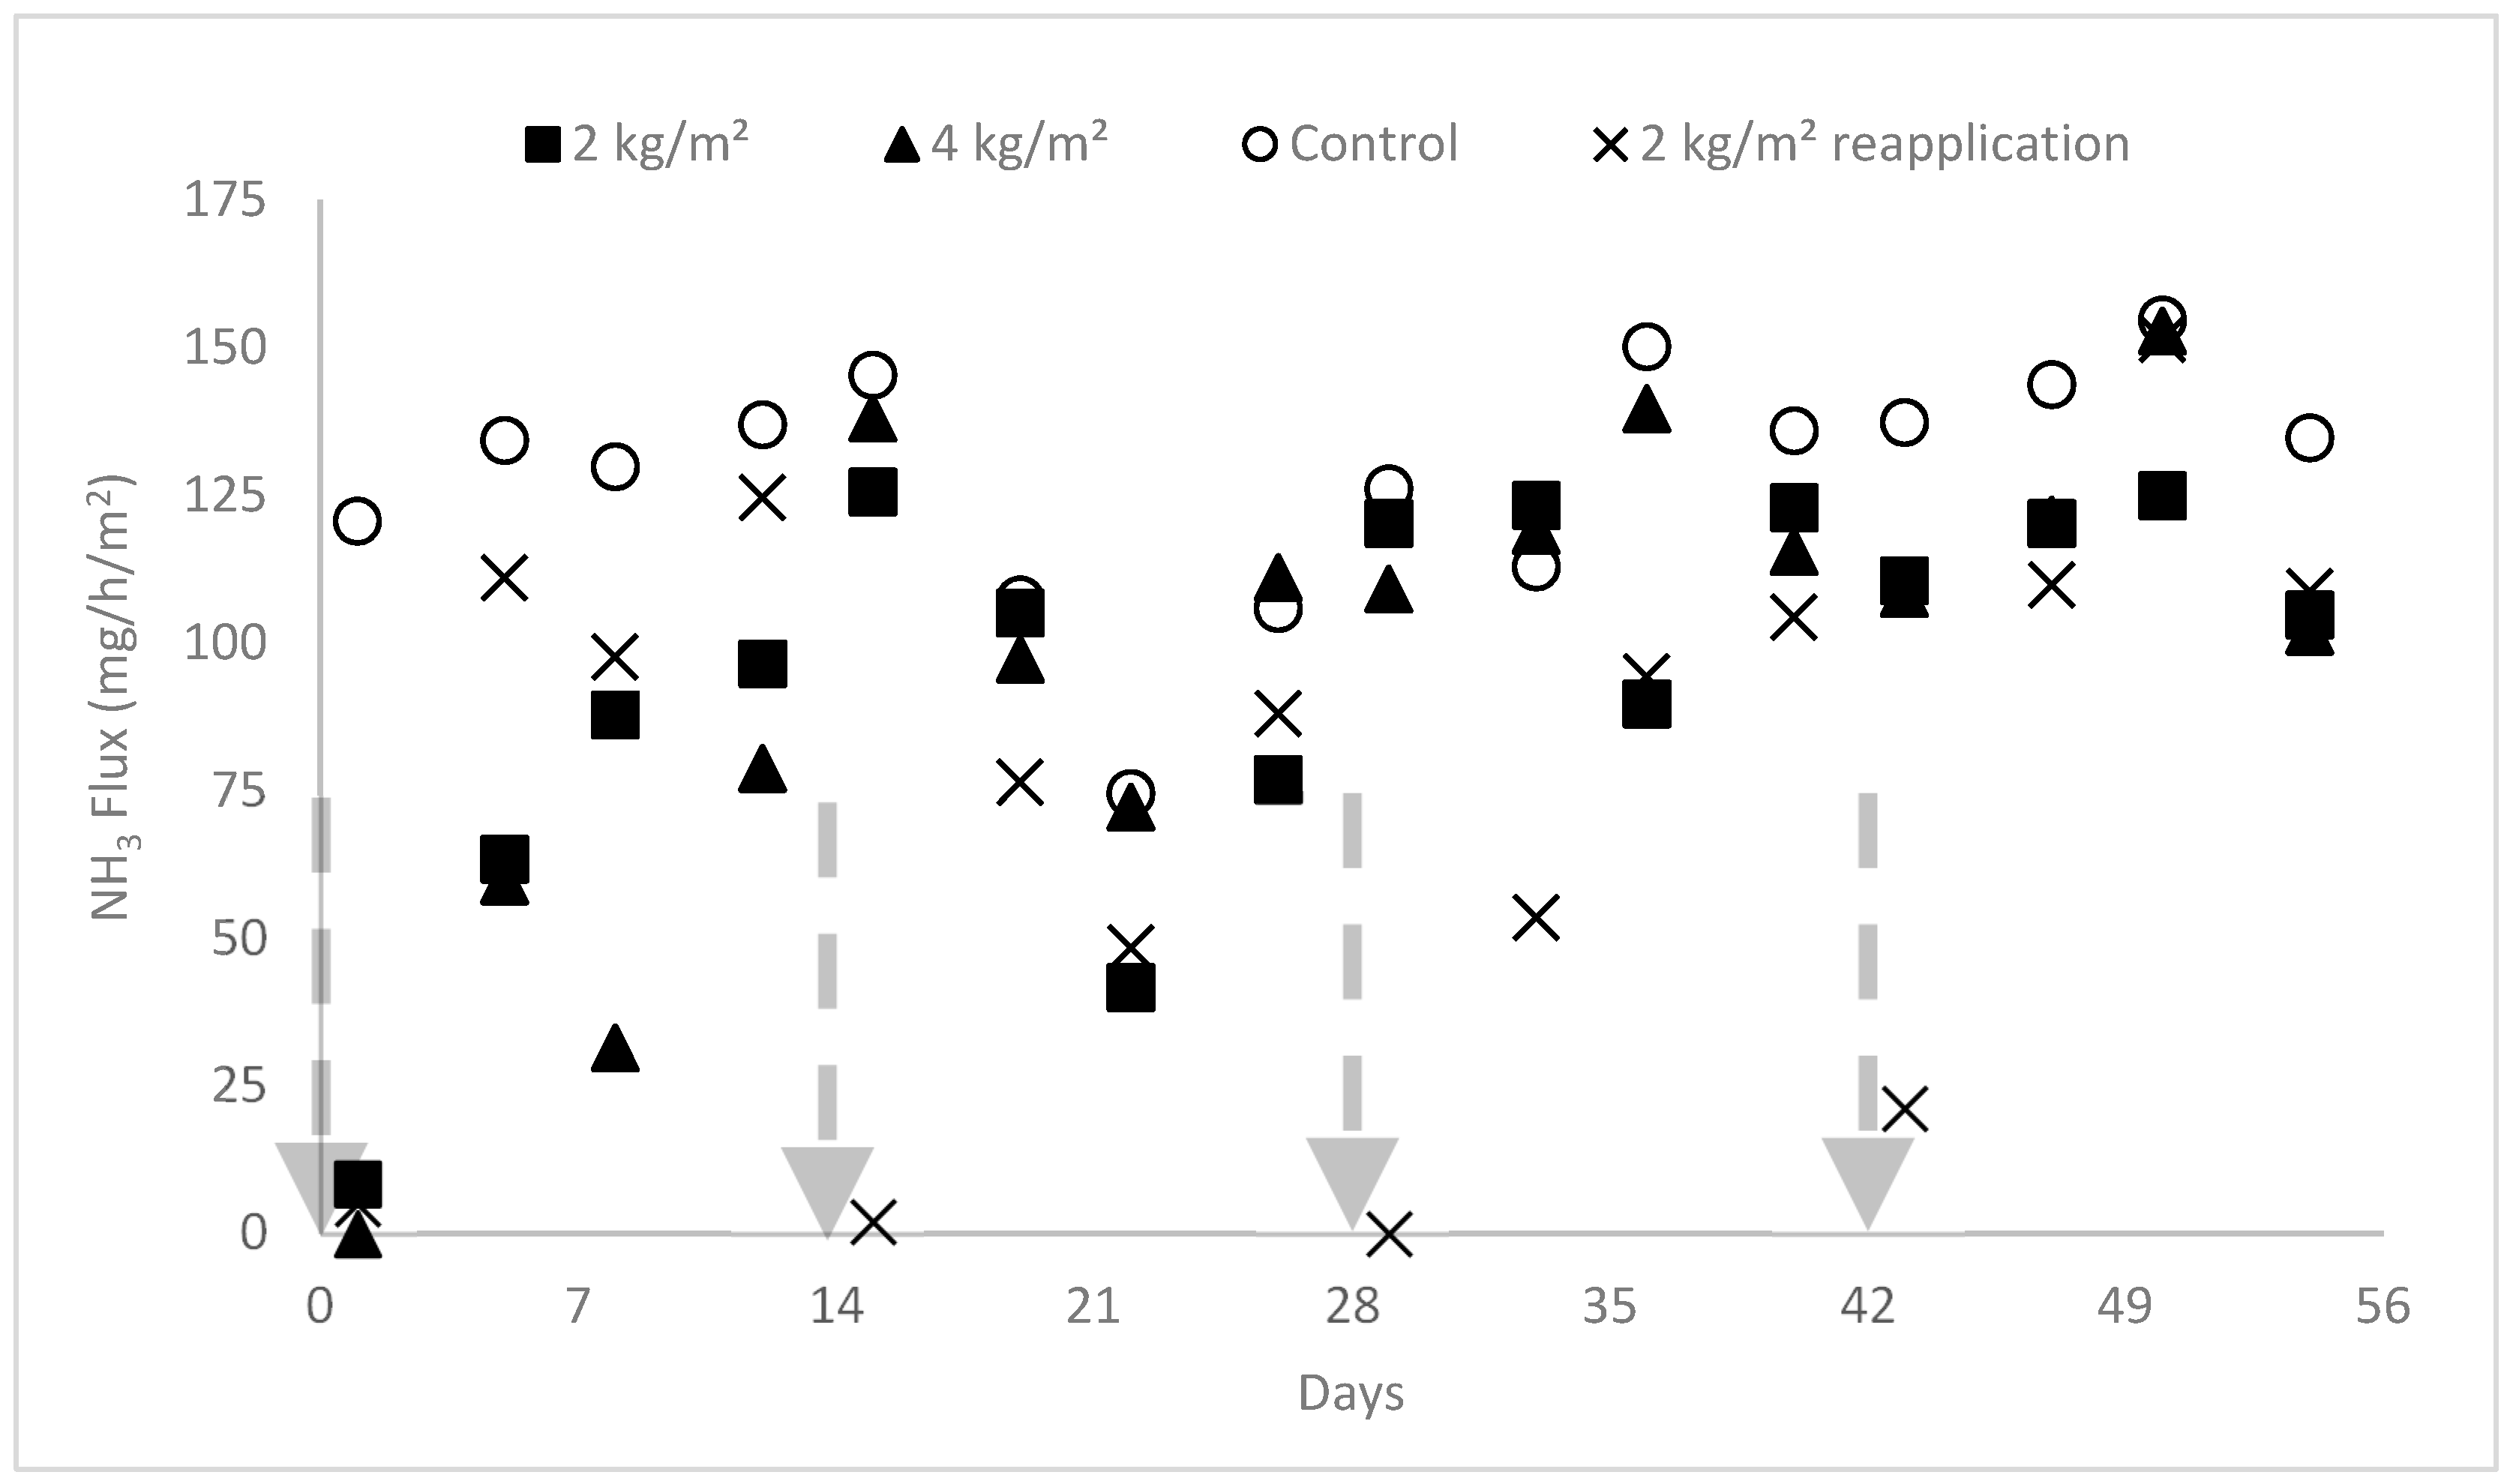
In case of NH3 (Table 1, Figure 1), both one-time biochar treatments (2 kg/m2 and 4 kg/m2) significantly (p < 0.05) reduced emissions by 33% and 25%, respectively; the 2 kg/m2 with reapplication treatment showed significant (
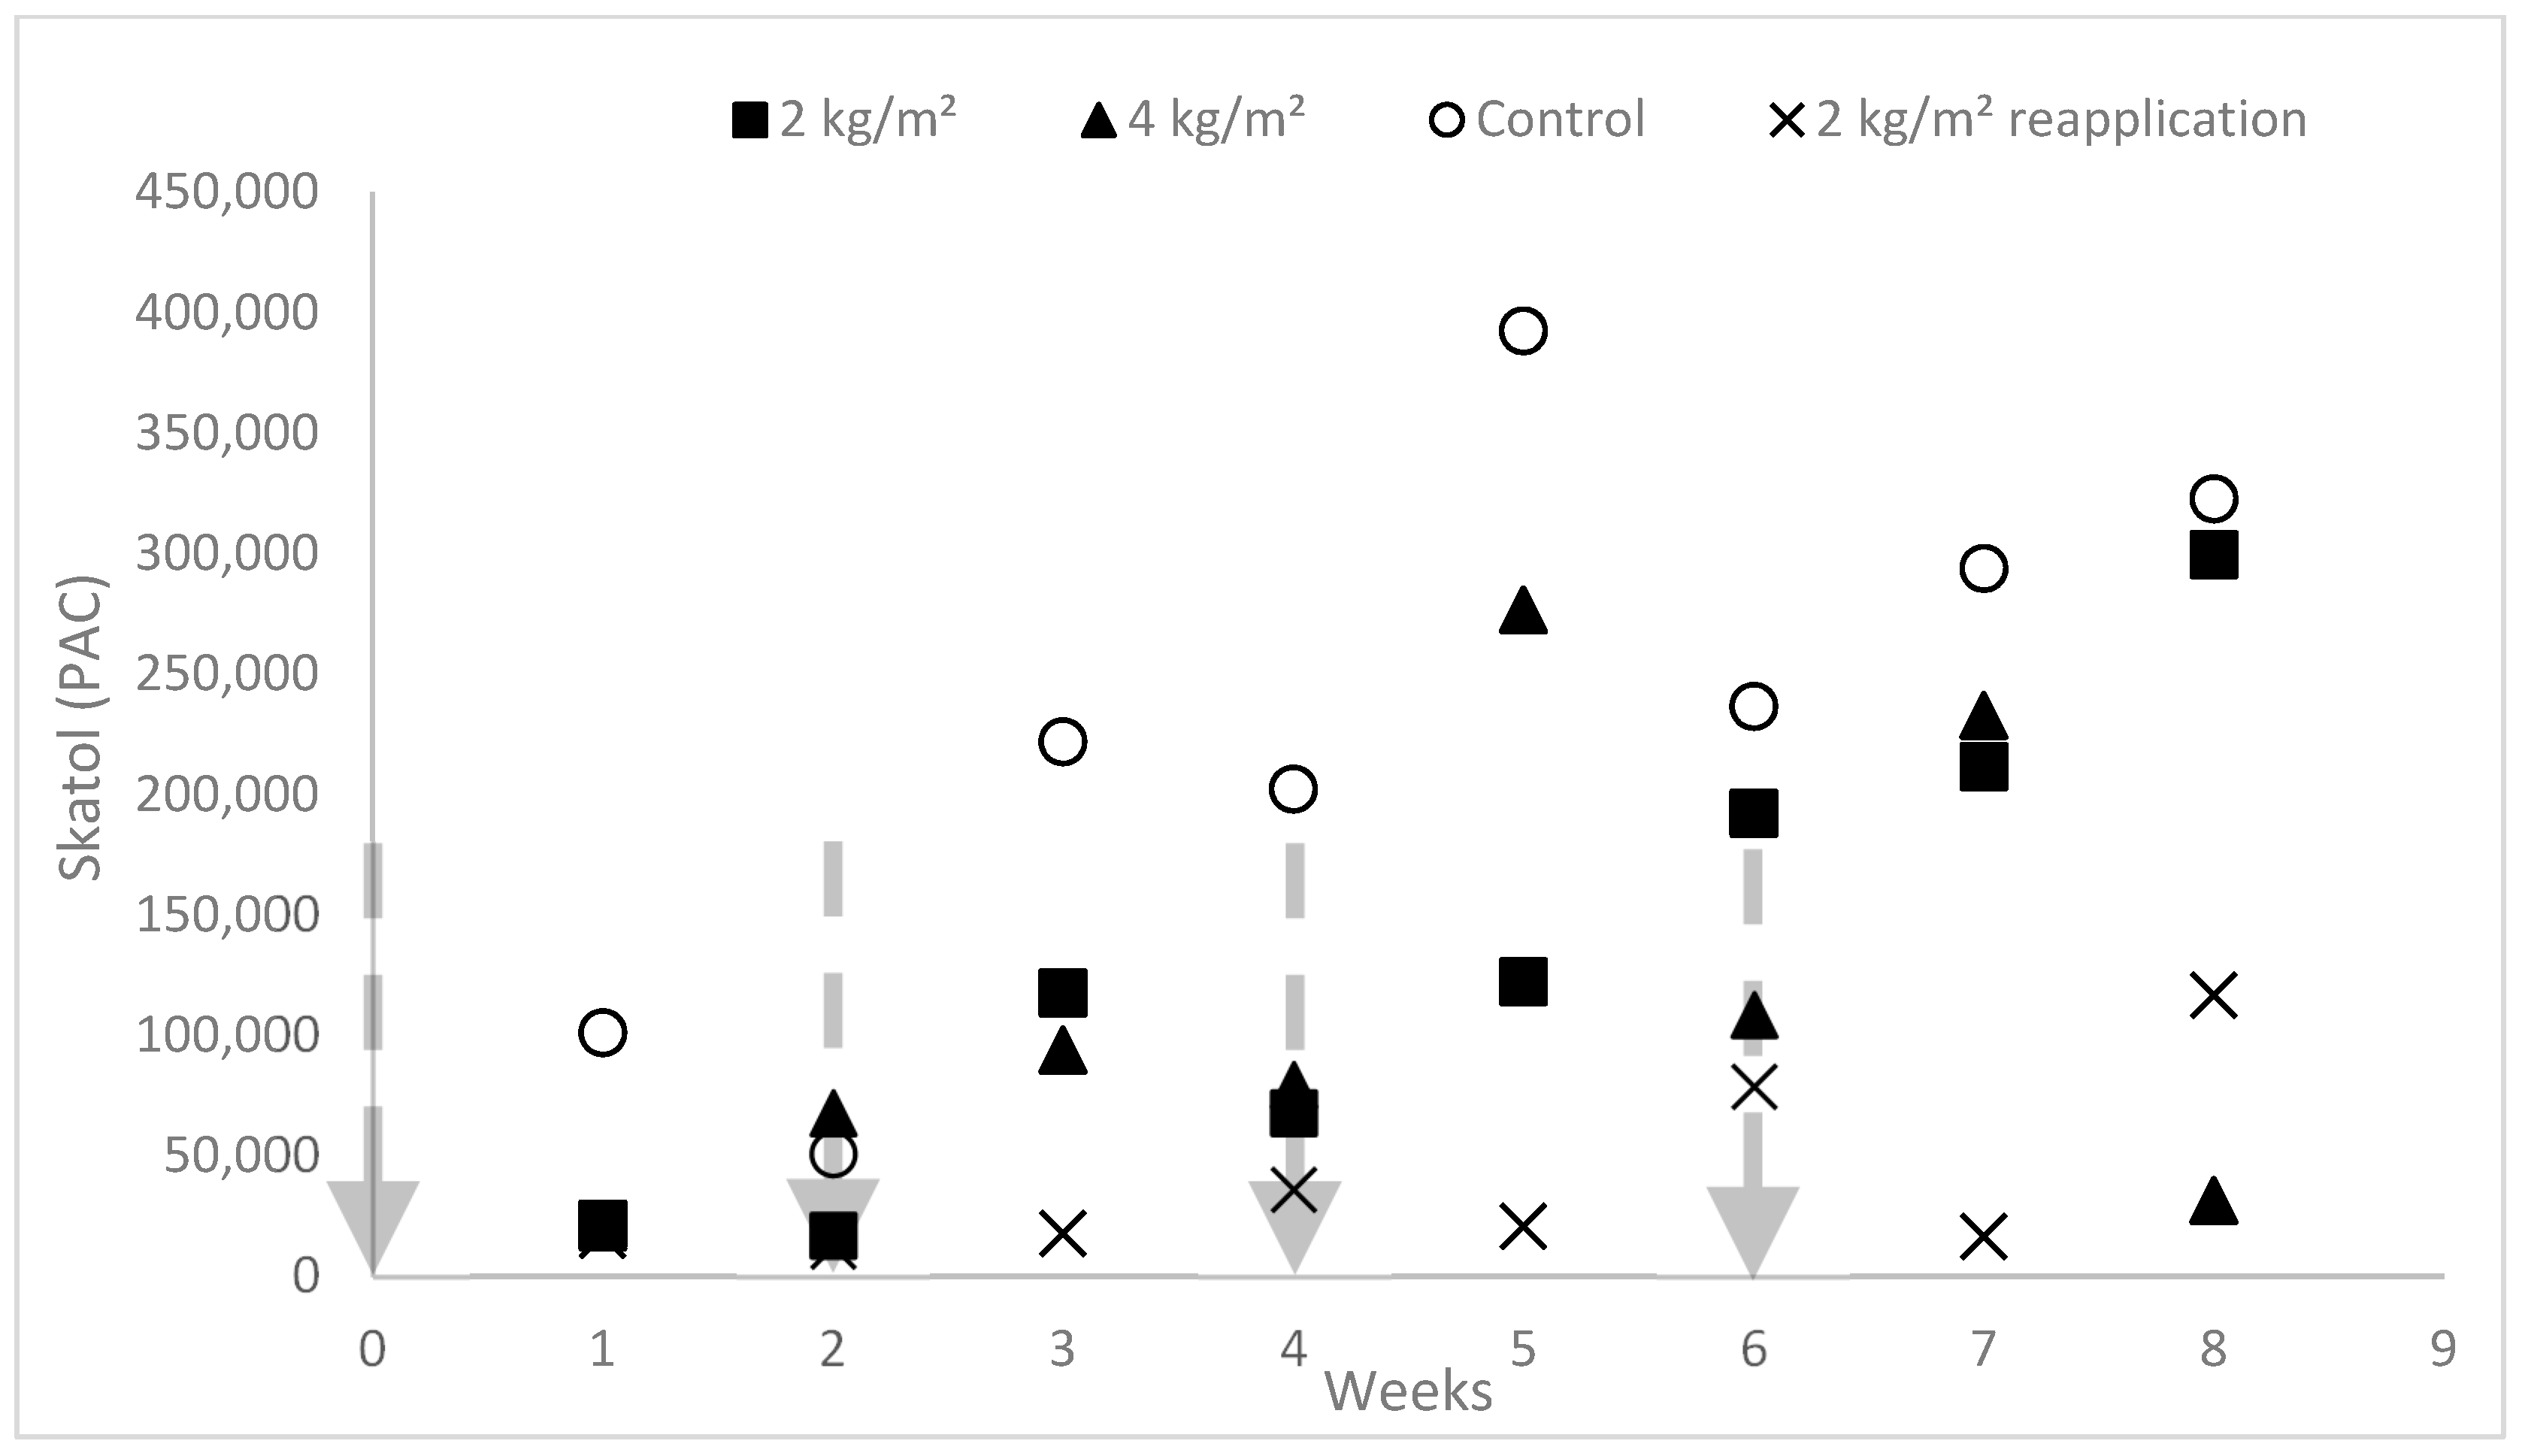
p < 0.05) reduction by 53%. In case of skatole (Table 1, Figure 2), both one-time biochar treatments (2 kg/m2 and 4 kg/m2) significantly (p < 0.05) reduced emissions by 25% and 48%; the 2 kg/m2 with reapplication treatment showed significant (p < 0.05) reduction by 80%.
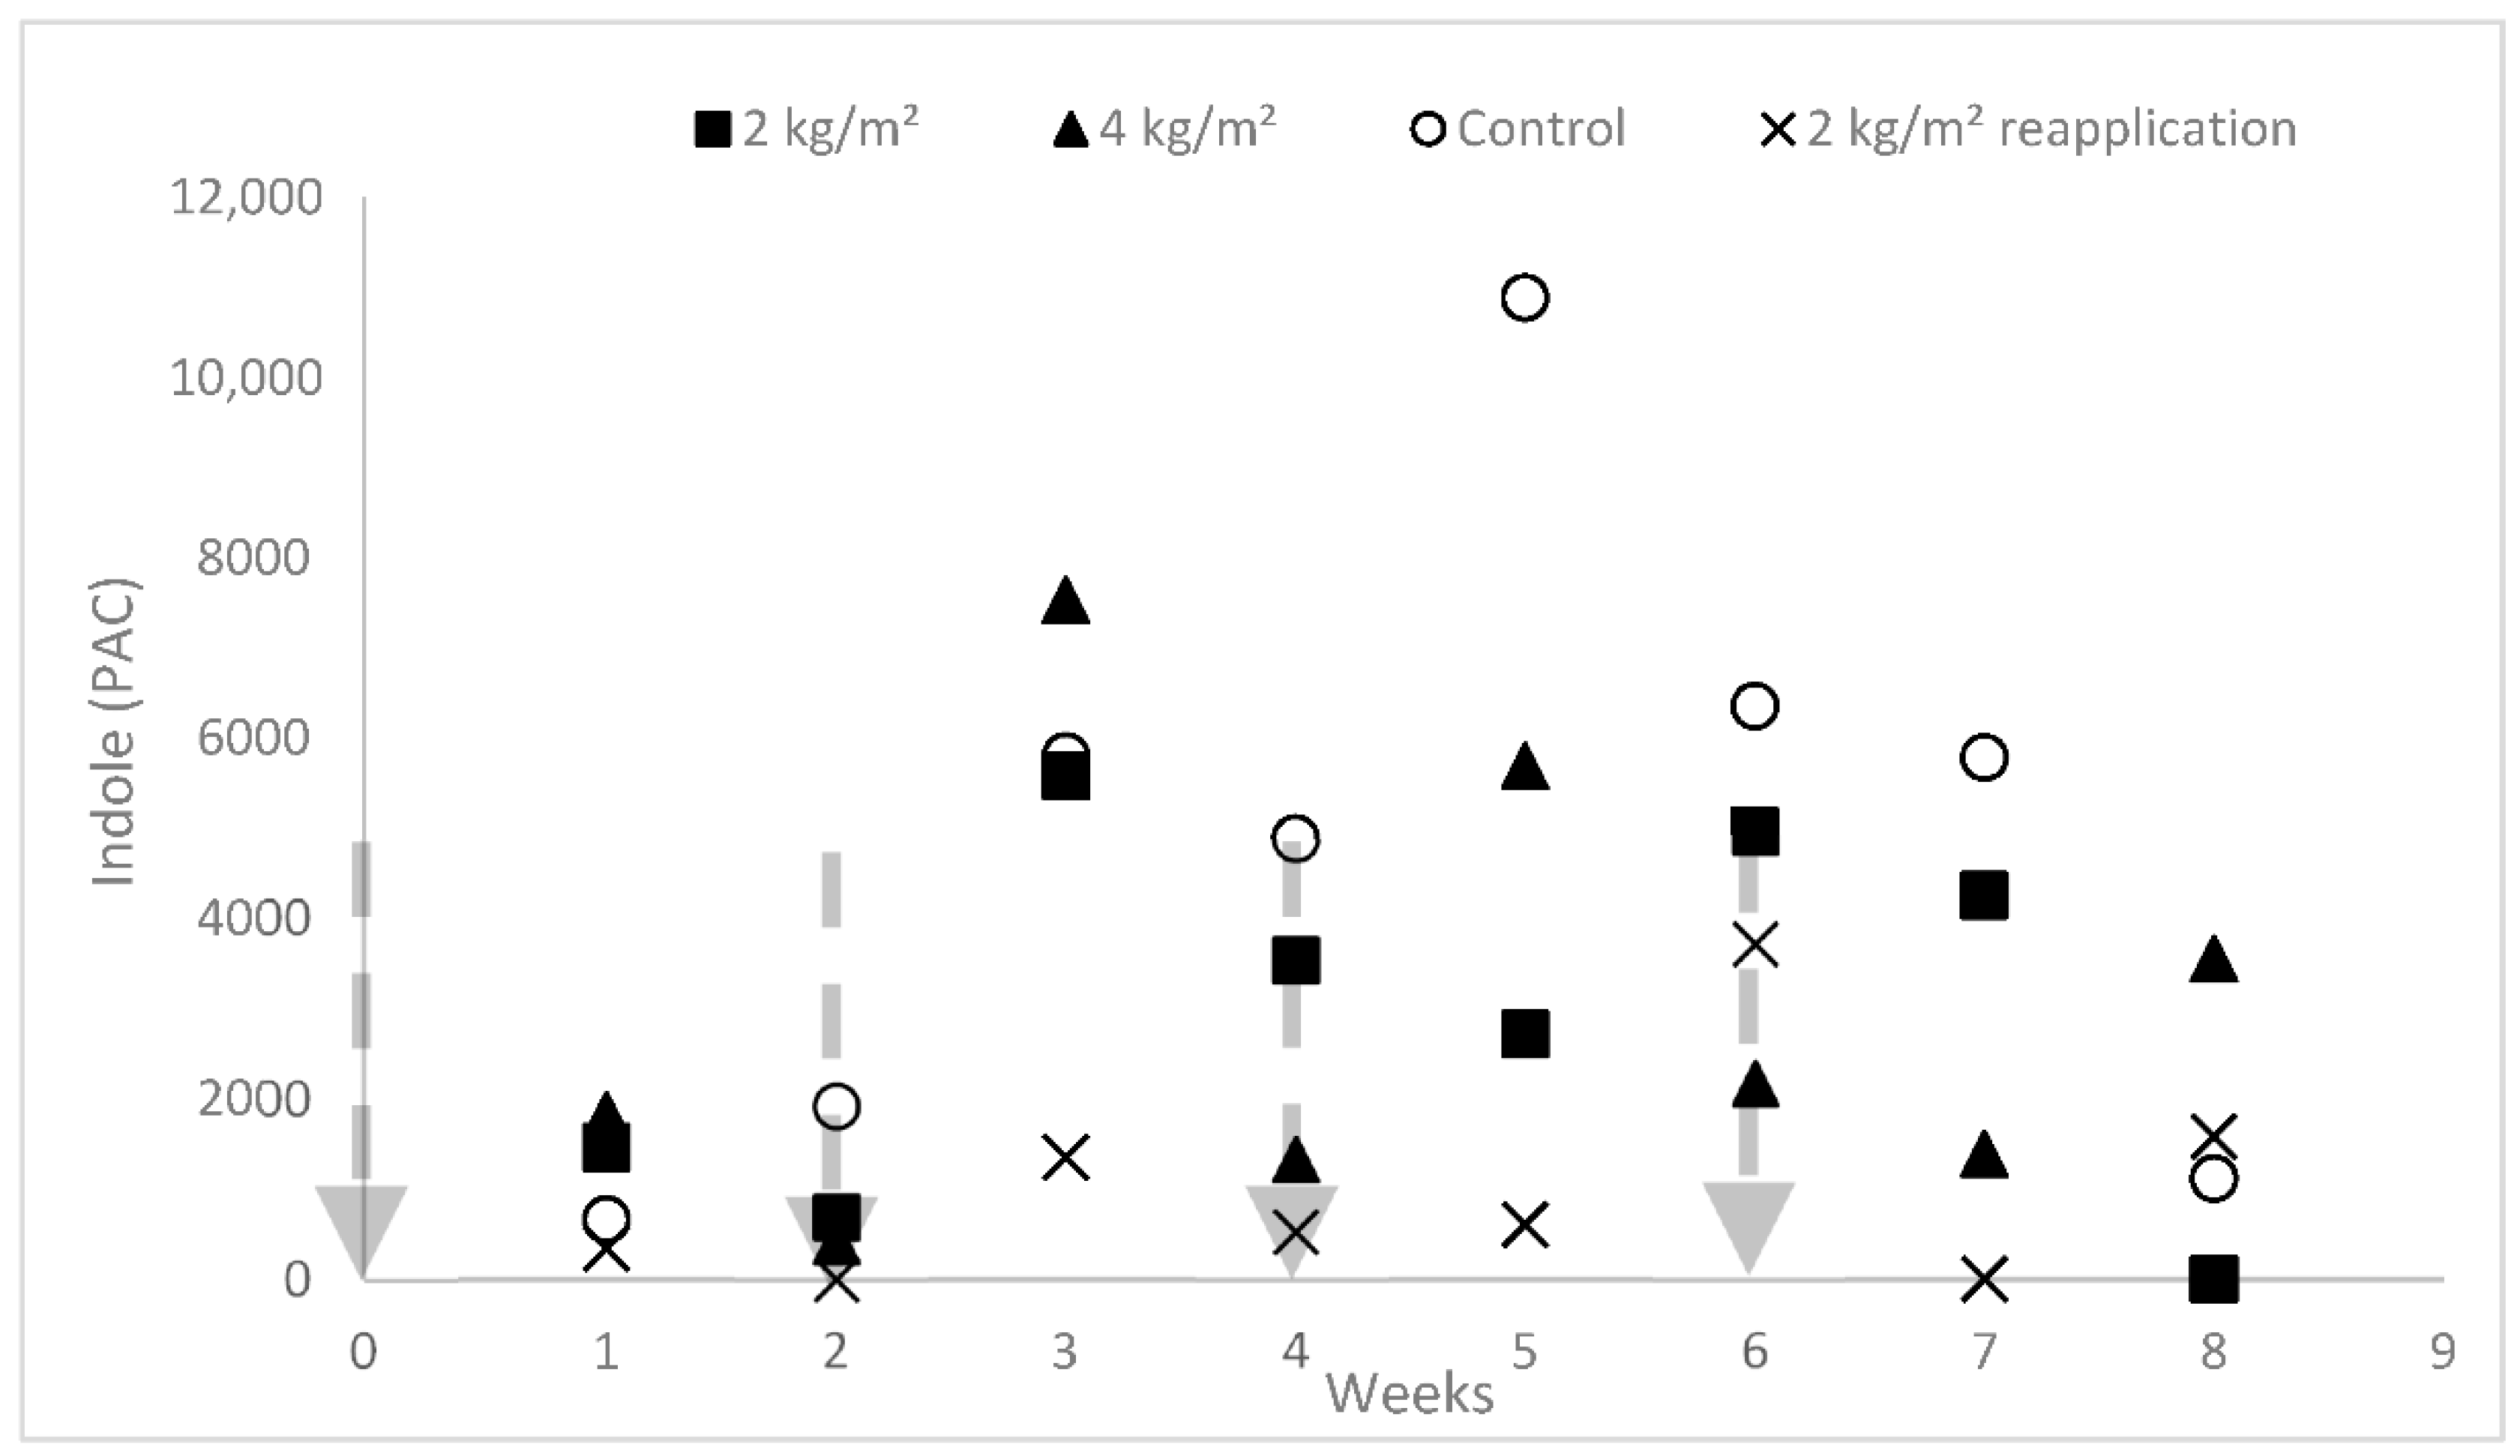
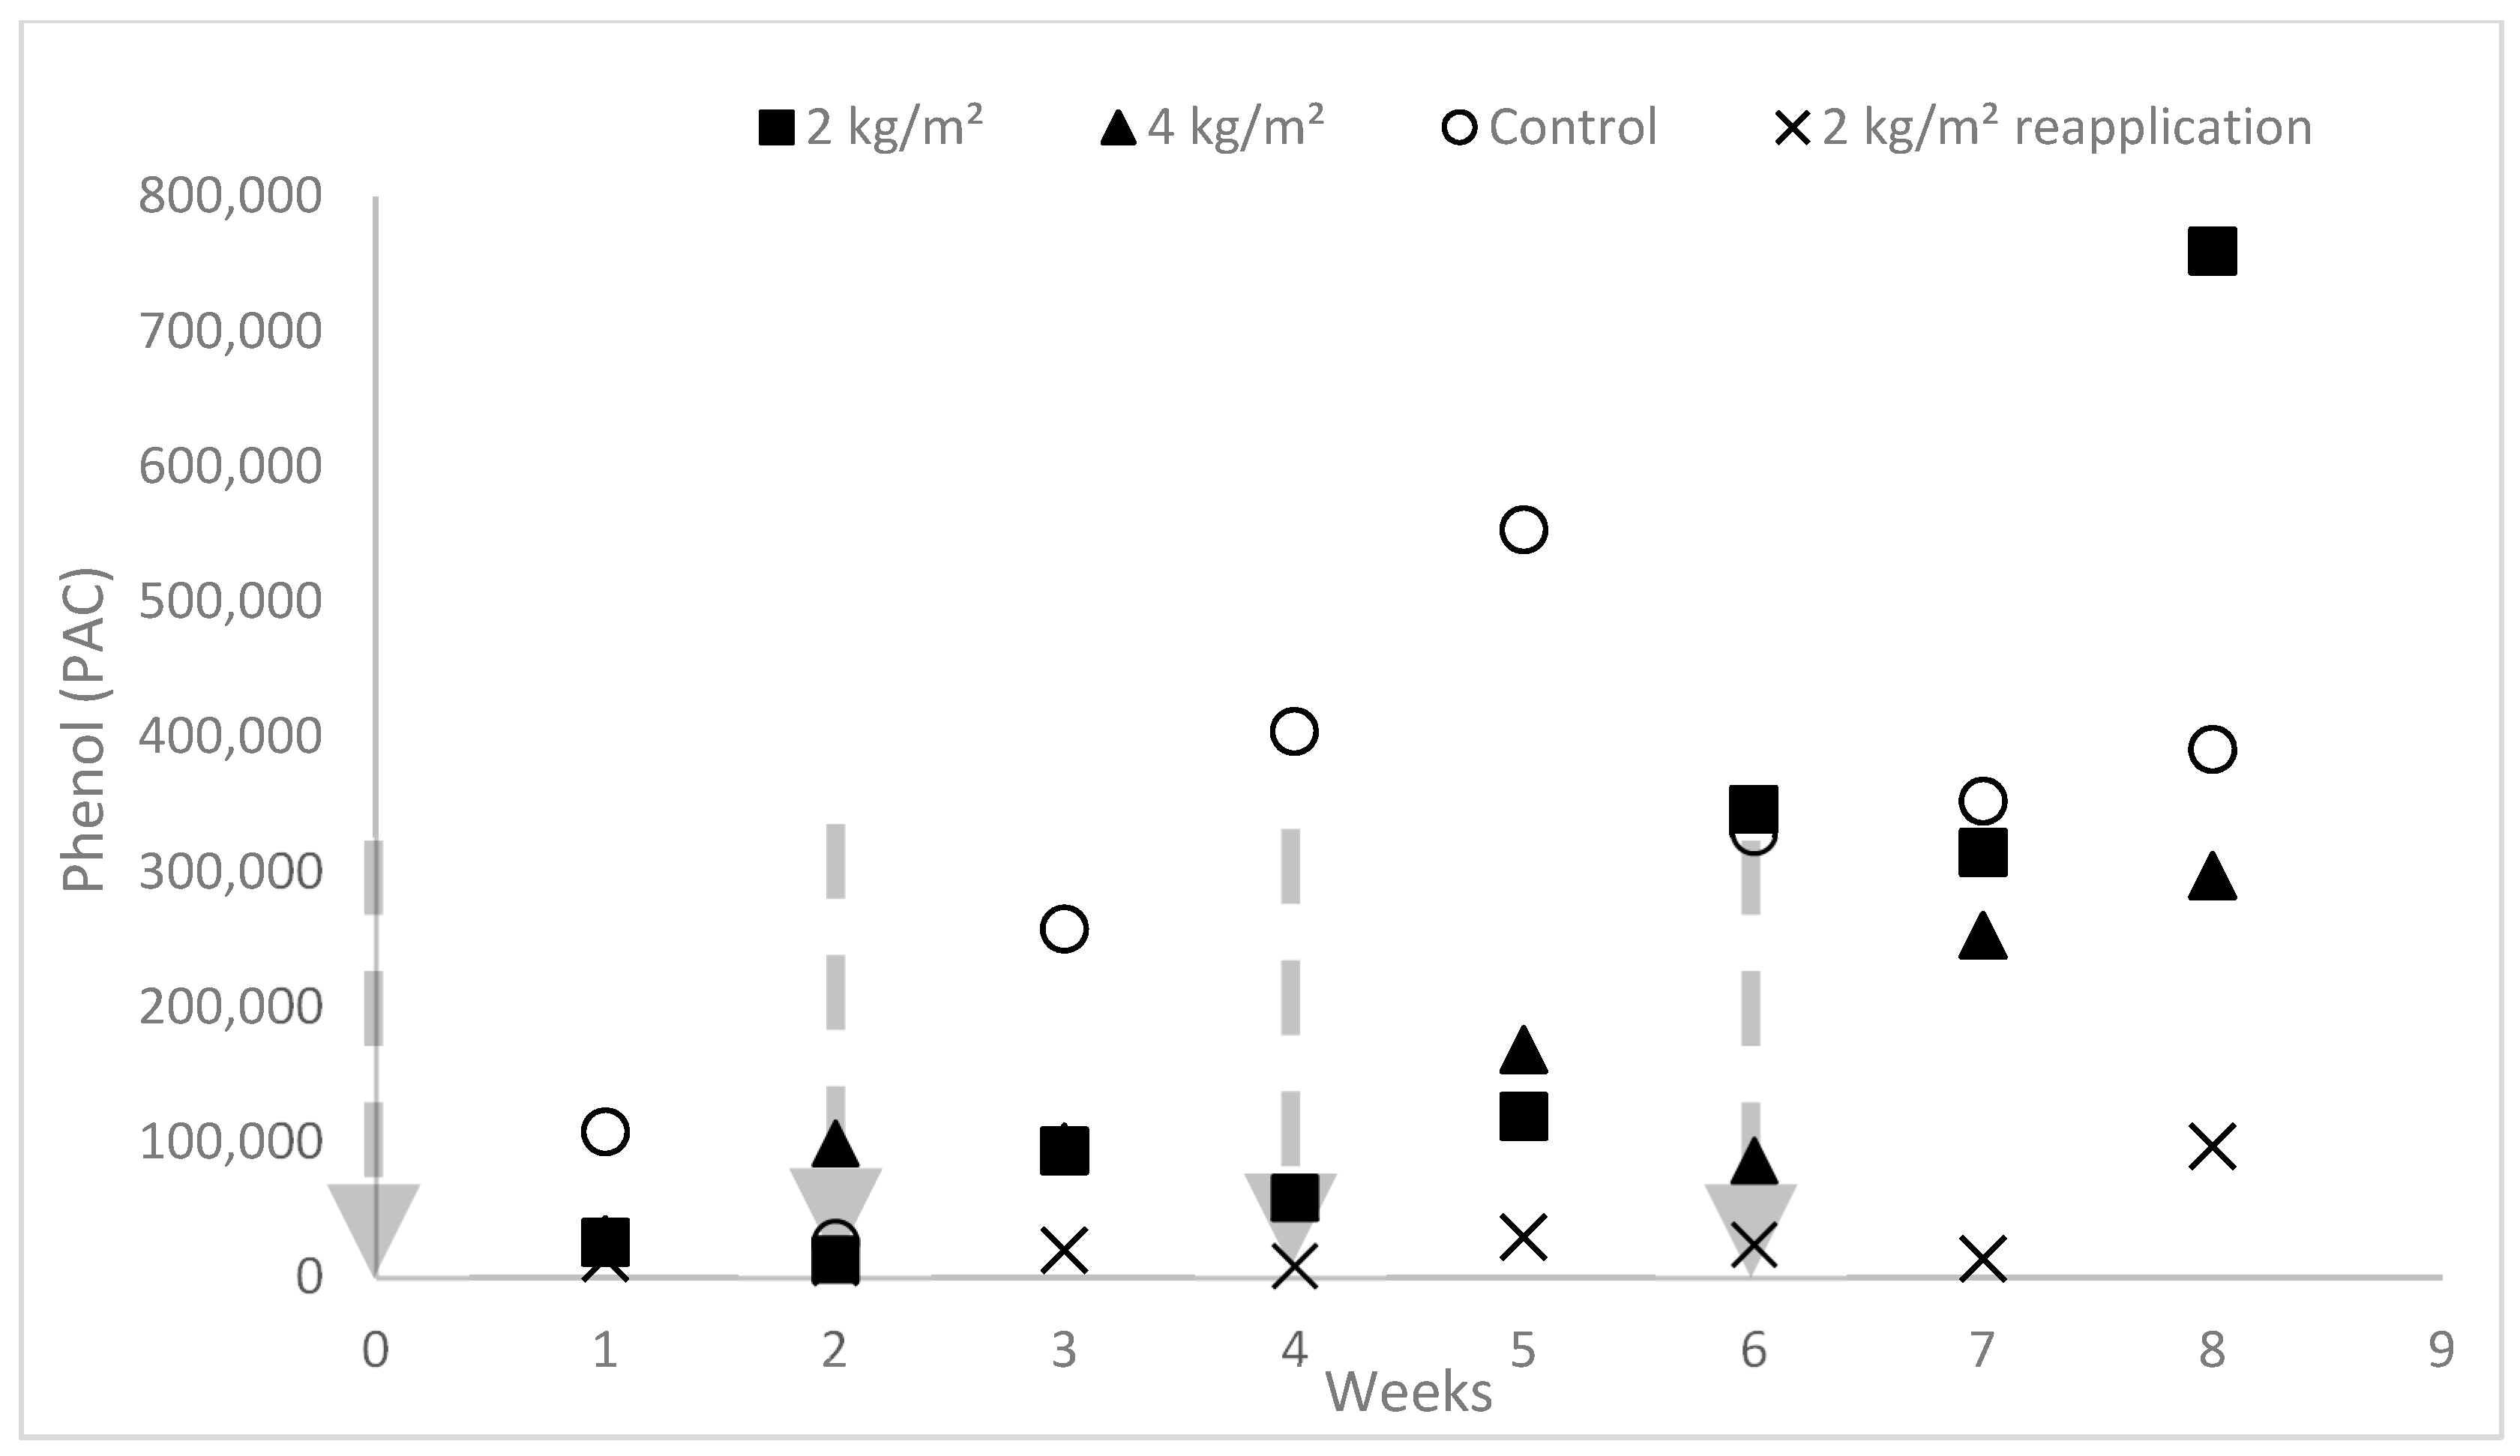
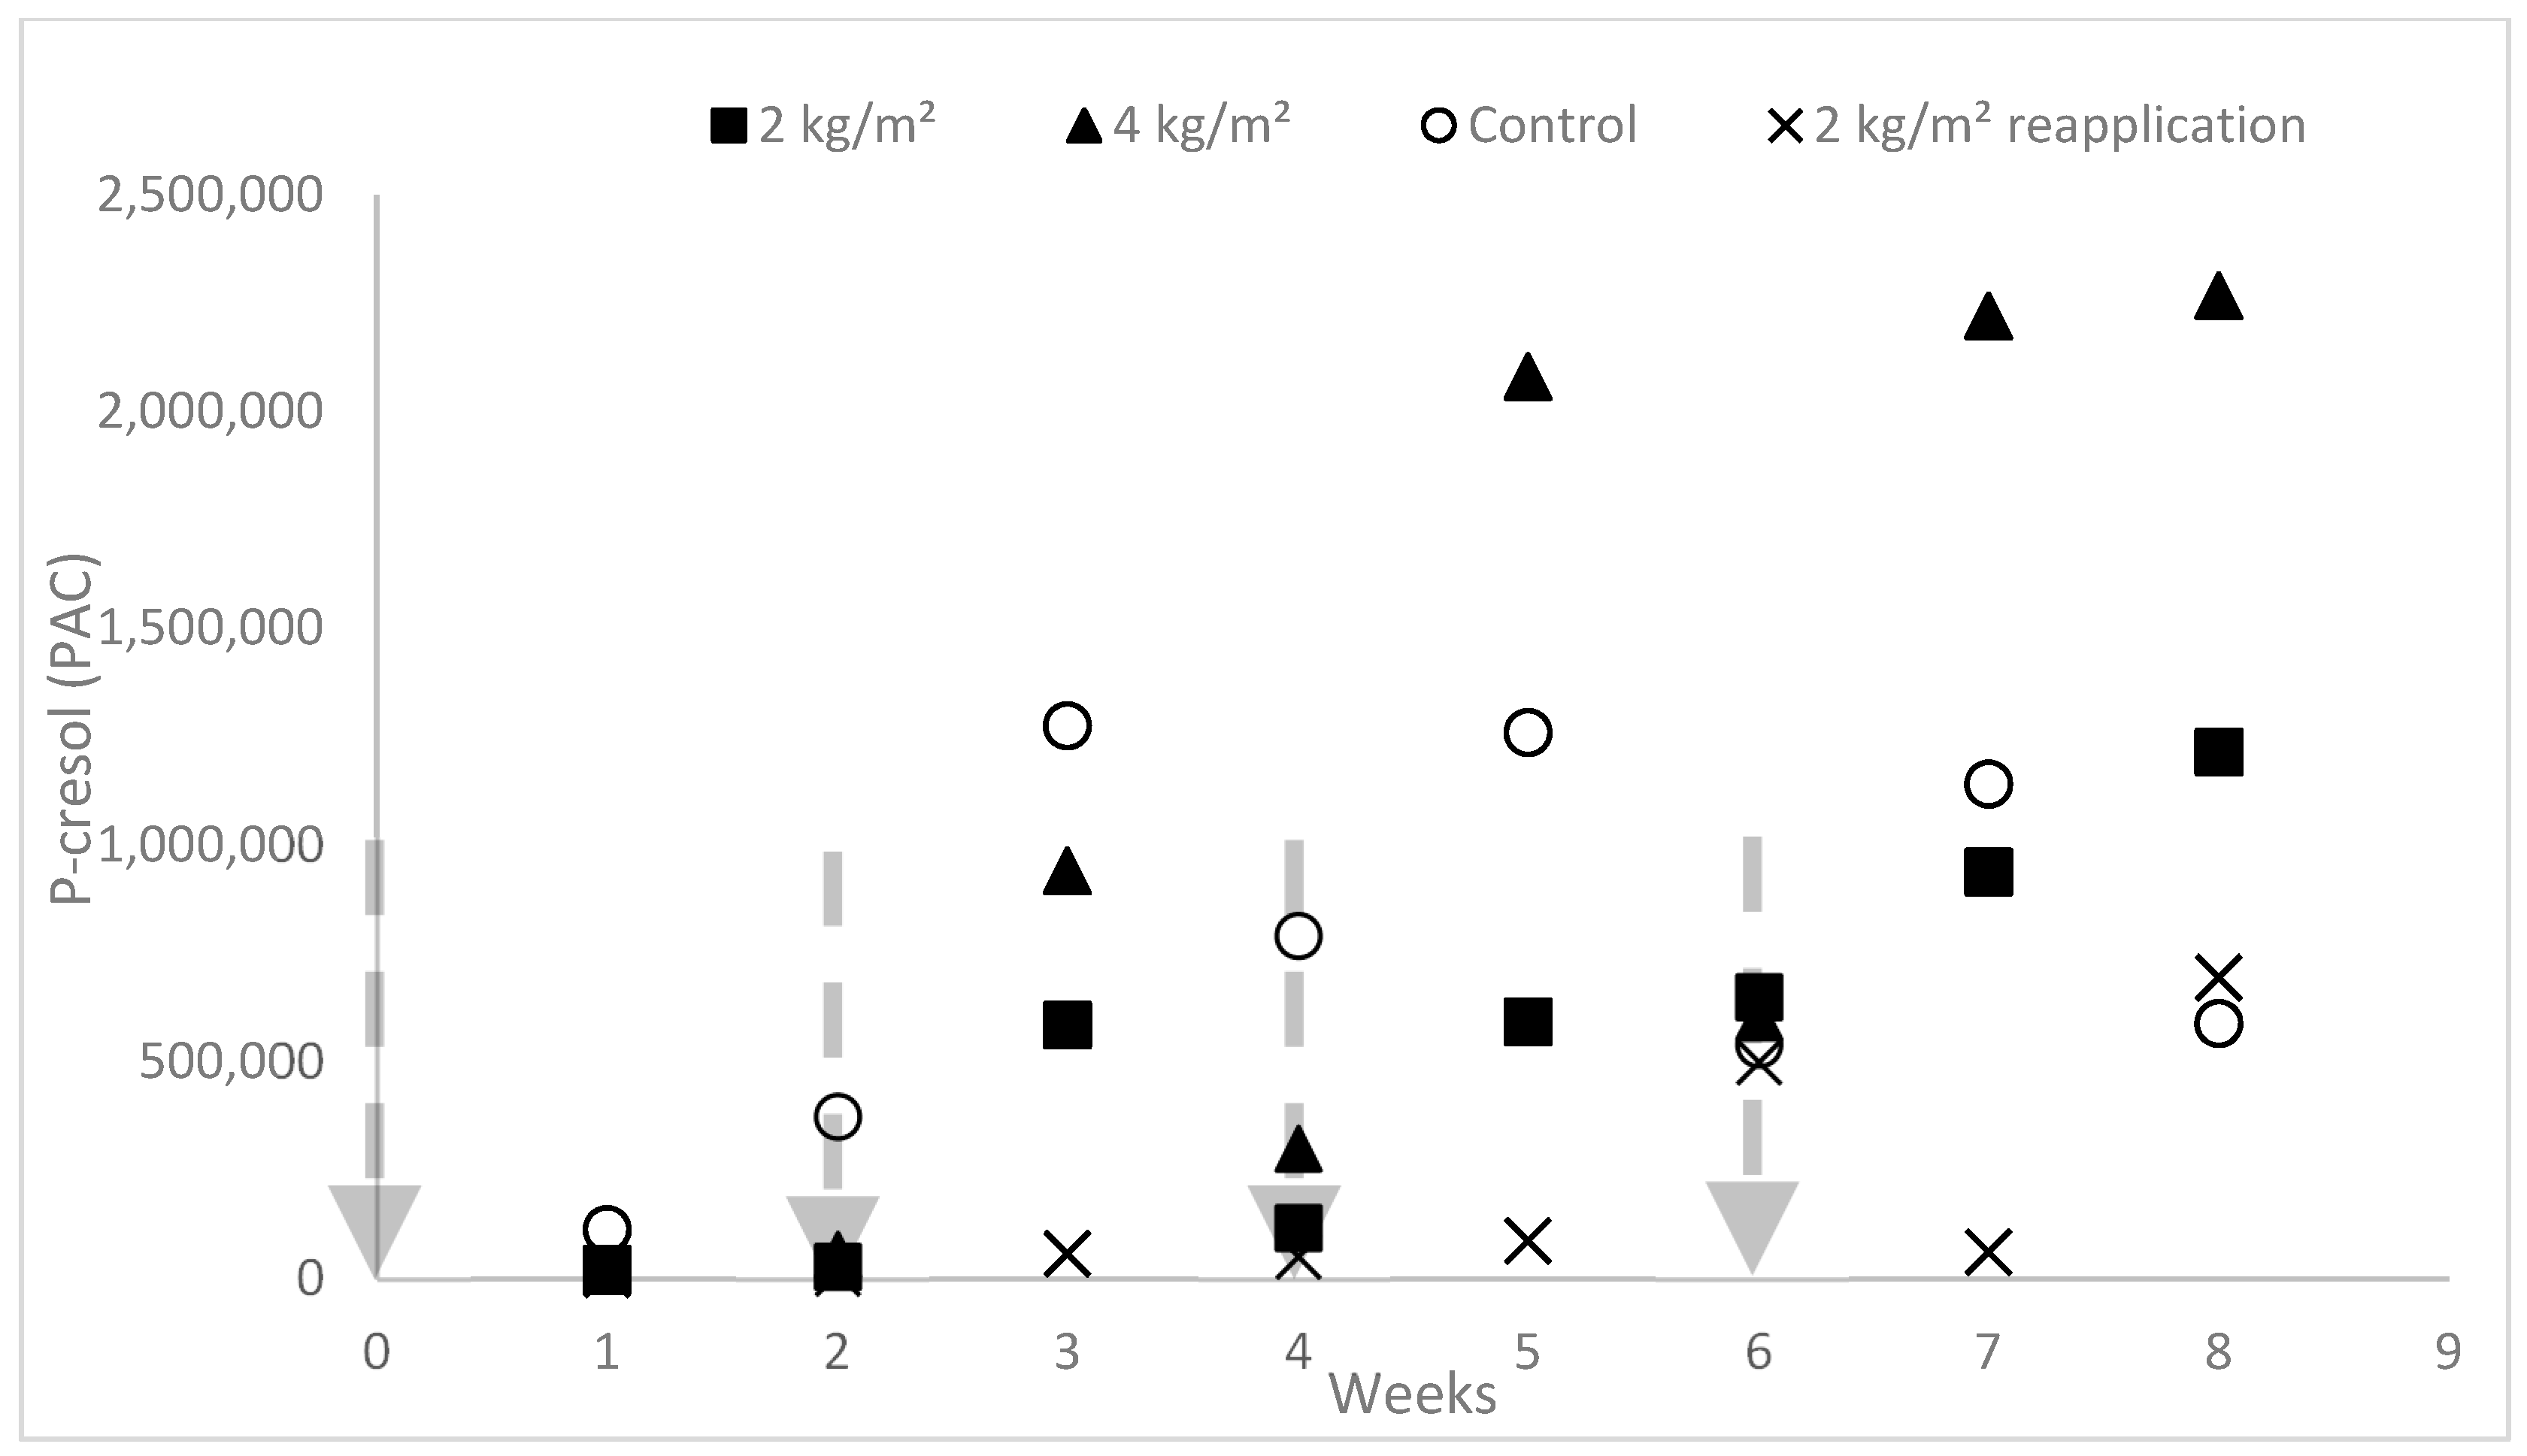
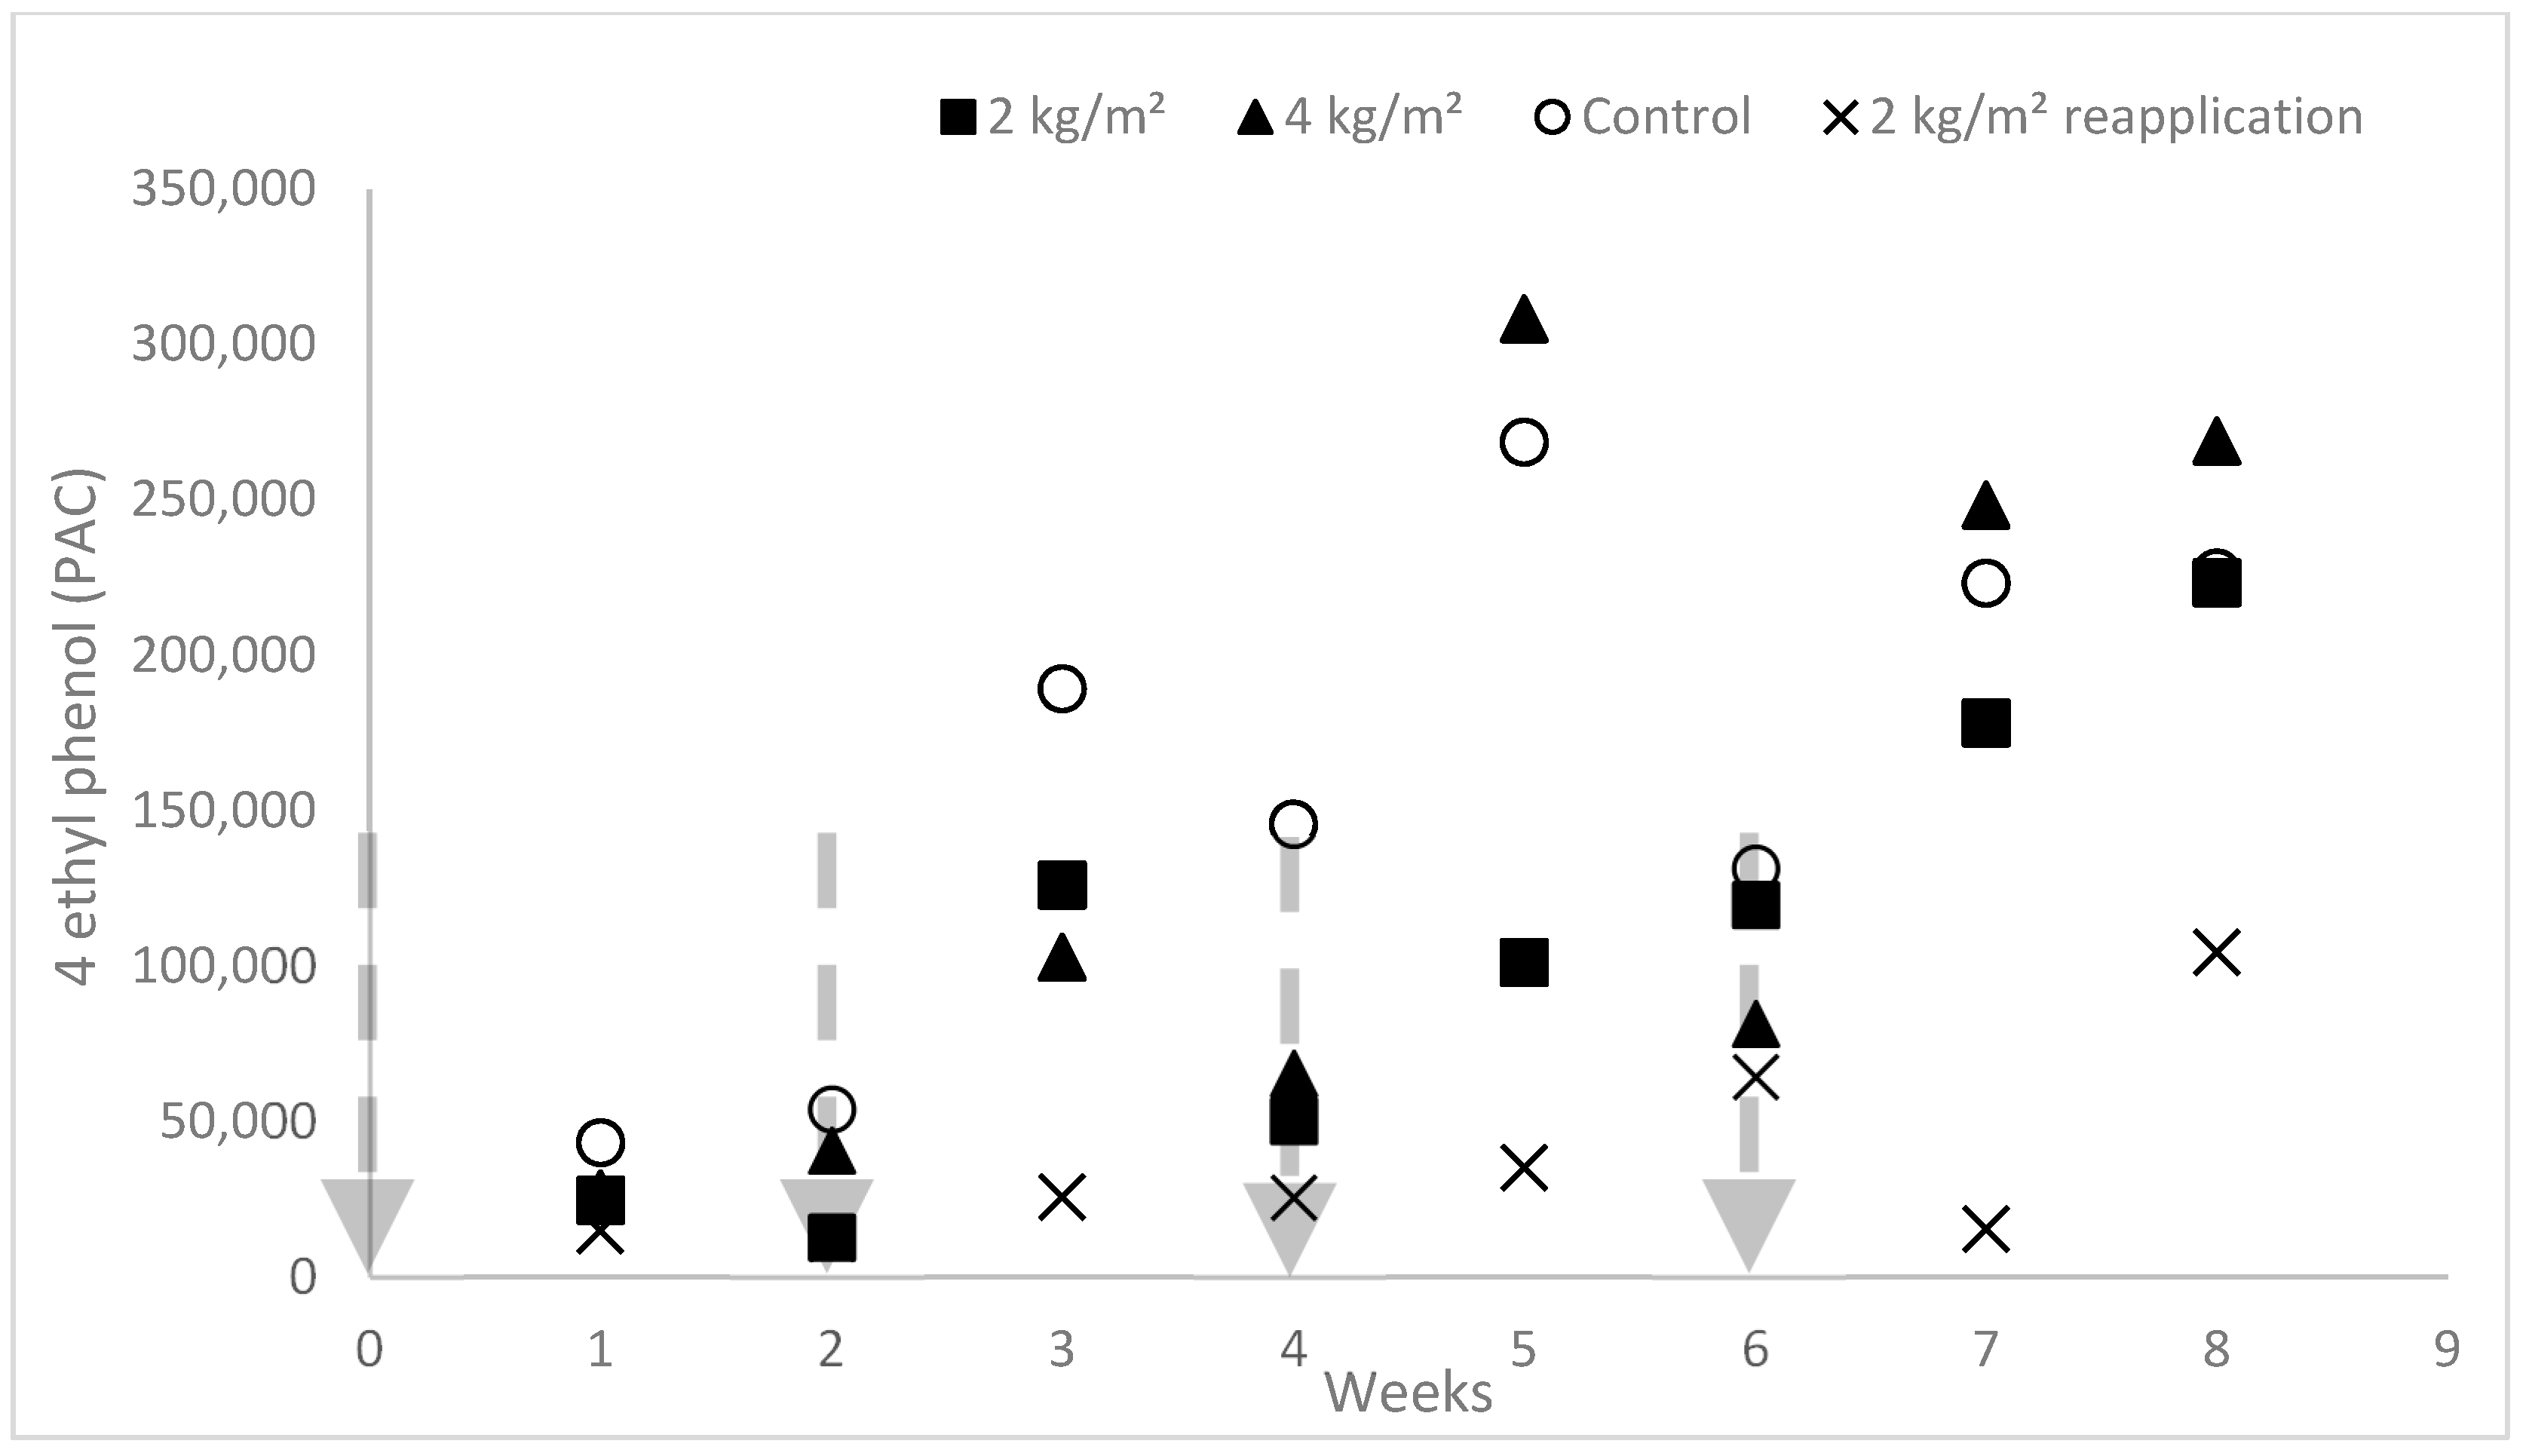
In case of other targeted odorous VOCs (Table 1), the one-time 2 kg/m2 and 4 kg/m2 biochar treatments showed ~36–38% reduction in indole (Figure 3), ~28–49% in phenol (Figure 4), ~−40–31% in p-cresol (Figure 5), ~53–66% in 4-ethyl phenol (Figure 6) without statistical significance. However, bi-weekly 2 kg/m2 reapplication treatment showed significantly (p < 0.05) reduced phenol, p-cresol, and 4-ethyl phenol by 89%, 74%, and 87%, respectively (Table 1).
In the case of odor (Table 1, Figure S1), no significant mitigation impact was observed. The 2 kg/m2 bi-weekly reapplication treatment reduced the odor concentration by 22%, whereas 2 kg/m2 and 4 kg/m2 showed 11% and 4.2% reductions, respectively (Table 1). All three treatments did not show statistical impacts on odor and GHGs (Figures S2–S4). The treatments showed no significant impact of CO2 (−1.4~1.7%) and N2O (−2~4.4%). Interestingly, the HAP biochar showed the generation of CH4 emission with the range of −46 to −15%, without statistical significance. These findings are consistent with Meiirkhanuly et al. [18] and Maurer et al. [2], i.e., HAP and red oak and pine biochar addition to swine manure resulted in the generation of CH4 on lab- and pilot-scales, respectively. This finding should be developed as a potential application of HAP in biogas plants for increasing the biomethane yield.

4. Discussion

4.1. Effect of One-Time Biochar Dose

There was no statistical significance to the mitigation effect between the two one-time biochar dosages. The 2 kg/m2 (Treatment 1) and 4 kg/m2 (Treatment 2) showed very similar percentage reduction in gaseous emissions from swine manure. Both treatments significantly (p < 0.05) reduced NH3 and skatole with a very similar percentage reduction (33% and 25%; 42% and 48%, respectively). These results are consistent with Meiirkhanuly et al., where HAP biochar treatments at a lab-scale showed a significant (two out of three trials) percentage reduction of NH3 emissions by 18–21% and a significant (all three trials) percentage reduction of skatole by 74–95% [18].
For the rest of the targeted gases, no statistical significance was found (Table 1). The 2 kg/m2 (Treatment 1) showed a 28% reduction of phenol, a 31% reduction of p-cresol, a 38% reduction of indole, and a 66% reduction of 4-ethyl phenol; the 4 kg/m2 (Treatment 2) showed a 49% reduction of phenol, a 40% generation of p-cresol, a 36% reduction of indole, and a 53% reduction of 4-ethyl phenol. This lack of statistical significance to mitigation was observed in CO2 and N2O, whereas both dosages generated CH4 emissions by 15% and 16%, respectively.
The practical significance of this finding is that a lower dose of HAP biochar treatment could be as effective as a higher dose. A lower than 2 kg/m2 dosage could be evaluated in future experiments to explore the possibility of reducing the cost and improving the sustainability of this proposed treatment.

4.2. Effect of Bi-Weekly Biochar Reapplication

Overall, the bi-weekly biochar reapplication resulted in much higher percentage reductions and a greater number of odorous VOCs with statistically significant percentage reductions. The percentage reductions for NH3 and all the targeted VOCs (phenol, p-cresol, indole, skatole, and 4-ethyl phenol) were statistically significant. In the case of skatole, the biochar reapplication increased the percentage reduction from 42% to 80%. The 2 kg/m2 bi-weekly reapplication showed an 89% reduction of phenol, a 74% reduction of p-cresol, a 78% reduction of indole, an 80% reduction of skatole, and an 87% reduction of 4-ethyl phenol.
Considering NH3, the reapplication doubled the percentage reduction from 33% to 53% compared to the one-time 2 kg/m2 treatment. As shown in Figure 1, NH3 emissions were significantly reduced immediately after each addition of biochar. The biochar reapplication was clearly solving the main motivation for this research, i.e., addressing the decreasing effectiveness over time reported for the 30-day trials with one-time biochar application [2].
The reapplication nearly doubled the percentage reduction of odor (from 11% to 22%), and an almost tripled generation of CH4 (from −15% to −46%) was also observed, yet without statistical significance. HAP biochar had no significant impact on CO2 and N2O emissions regardless of the treatment.
Several recommendations could be made for future research directions. There is an opportunity to further explore short-term biochar application to stored manure immediately before agitation and pump out. We already showed significant percentage reductions of NH3 and H2S emissions during swine manure agitation [19,20]. The testing of biochar addition on mitigating odor and odorous VOCs emissions during agitation, pump out, and land application is warranted. Treatment of gaseous emissions from open sources, such as manure lagoons, open dirt feedlots, could also be explored. Biochars with different physicochemical properties should be explored to target the mitigation of specific gases. Since biochar is a very fine powder, the pelletization of biochar along with different application and reapplication methods should be explored before testing at the farm-scale. Enhanced generation of biogas (and its main component, CH4) from biochar-treated manure could provide additional options for biorenewable energy production on a farm biogas plant. Furthermore, the biochar and manure mixture has shown the potential to be better fertilizers and helps stop leaching [21]. In addition, biochar treatment of manure from other types of livestock and poultry and other gaseous emissions sources, such as municipal and industrial wastewater and landfills, could be explored.
Thus, biochars can still be considered for a comprehensive solution on the food–energy–water nexus that could improve the sustainability of animal and crop agriculture. Specifically, mitigating gaseous emissions with biochar, a byproduct of biorenewable energy production, followed by the benefits stemming from the application of manure and biochar mixture on soil, minimizing risks to runoff and water quality, and enhancing crop production.

5. Conclusions

This pilot-scale experiment evaluated the effectiveness of different one-time biochar dose and bi-weekly reapplication on the mitigation of gaseous emissions from stored swine manure. The bi-weekly reapplication of the lower biochar dose (2 kg/m2) showed much higher significant percent reductions of emissions for NH3 (33% without and 53% with reapplication) and skatole (42% without and 80% with reapplication), respectively. In addition, the reapplication resulted in the emergence of statistical significance to the mitigation effect for all other targeted VOCs. Specifically, for indole, the percent reduction improved from 38% (p = 0.47, without reapplication) to 78% (p = 0.018, with reapplication). For phenol, the percentage reduction improved from 28% (p = 0.71, without reapplication) to 89% (p = 0.005, with reapplication). For p-cresol, the percentage reduction improved from 31% (p = 0.86, without reapplication) to 74% (p = 0.028, with reapplication). For 4-ethyl phenol, the percent emissions reduction improved from 66% (p = 0.44, without reapplication) to 87% (p = 0.007, with reapplication). The one-time 2 kg/m2 and 4 kg/m2 treatments showed similar effectiveness in mitigating all targeted gases, and no statistical difference was found between the dosages. The one-time treatments showed significant percentage reductions of 33% and 42% and 25% and 48% for NH3 and skatole, respectively. The practical significance is that the higher (one-time) biochar dose may not necessarily result in improved performance over the 8-week manure storage, but the bi-weekly reapplication showed significant improvement in mitigating NH3 and odorous VOCs. The lower dosages and the frequency of reapplication on the larger-scale should be explored to optimize biochar treatment and bring it closer to on-farm trials.

Supplementary Materials

The following are available online at https://www.mdpi.com/2073-4433/12/1/96/s1, Table S1: Mitigation of NH3 emissions utilizing different treatments with HAP biochar. Different letters indicate statistical significance, Table S2: Mitigation of skatole peak area counts (PAC) utilizing different treatments of HAP biochar, Table S3: Mitigation of indole peak area counts (PAC) utilizing different treatments of HAP biochar, Table S4: Mitigation of phenol peak area counts (PAC) utilizing different treatments of HAP biochar, Table S5: Mitigation of p-cresol peak area counts (PAC) utilizing different treatments of HAP biochar, Table S6: Mitigation of 4-ethyl phenol peak area counts (PAC) utilizing different treatments of HAP biochar, Table S7: Mitigation of odor concentrations (OU/m3) utilizing different treatments with HAP biochar, Table S8: Mitigation of CO2 emissions utilizing different treatments of HAP biochar, Table S9: Mitigation of CH4 emissions utilizing different treatments of HAP biochar, Table S10: Mitigation of N2O emissions utilizing different treatments of HAP biochar. Figure S1: Mitigation of odor emissions from swine manure treated with biochar—effects of one-time dose (2 and 4 kg/m2) and 2 kg/m2 bi-weekly reapplication, Figure S2: Mitigation of CO2 emissions from swine manure treated with biochar—effects of one-time dose (2 and 4 kg/m2) and 2 kg/m2 bi-weekly reapplication, Figure S3: Mitigation of CH4 emissions from swine manure treated with biochar—effects of one-time dose (2 and 4 kg/m2) and 2 kg/m2 bi-weekly reapplication, Figure S4: Mitigation of N2O emissions from swine manure trated with biochar—effects of one-time dose (2 and 4 kg/m2) and 2 kg/m2 bi-weekly reapplication.

Author Contributions

Conceptualization, J.A.K.; methodology, B.C., J.A.K.; validation, J.A.K. and D.A. (manure analyses); formal analysis, B.C.; investigation, B.C., H.M., M.L., P.L. and C.B.; resources, J.A.K. and D.S.A.; data curation, B.C., S.C.O. and J.A.K.; writing—original draft preparation, B.C.; writing—review and editing, B.C., J.A.K., S.C.O. and A.B.; visualization, B.C. and M.L.; supervision, J.A.K. and A.B.; project administration, J.A.K., R.C.B.; funding acquisition, J.A.K., R.C.B. All authors have read and agreed to the published version of the manuscript.

Funding

This research was partially funded by the U.S. Department of Energy—National Institute for Food and Agriculture, grant # 2018-10008-28616: Valorization of biochar: Applications in anaerobic digestion and livestock odor control (2018–2020, P.I. R.B.). Partial support came from (1) the Iowa Agriculture and Home Economics Experiment Station, Ames, Iowa. Project no. IOW05556 (Future Challenges in Animal Production Systems: Seeking Solutions through Focused Facilitation) sponsored by the Hatch Act and State of Iowa funds. The authors would also like to thank the Fulbright Foundation for funding the project titled “Research on pollutants emission from Carbonized Refuse Derived Fuel into the environment,” completed by A.B. at the Iowa State.

Institutional Review Board Statement

Not applicable.

Informed Consent Statement

Not applicable.

Data Availability Statement

The original contributions presented in the study are included in the article and the Supplementary Materials; further inquiries can be directed to the corresponding author.

Conflicts of Interest

The authors declare no conflict of interest. The funders had no role in the design of the study; in the collection, analyses, or interpretation of data; in the writing of the manuscript, or in the decision to publish the results.

References

  1. Ni, J.Q.; Heber, A.J.; Sutton, A.L.; Kelly, D.T. Mechanisms of gas releases from swine wastes. Trans. ASABE 2009, 52, 2013–2025. [Google Scholar] [CrossRef]
  2. Maurer, D.L.; Koziel, J.A.; Kalus, K.; Anderson, D.S.; Opalinski, S. Pilot-Scale Testing of Non-Activated Biochar for Swine Manure Treatment and Mitigation of Ammonia, Hydrogen Sulfide, Odorous Volatile Organic Compounds (VOCs) and Greenhouse Gas Emissions. Sustainability 2017, 9, 929. [Google Scholar] [CrossRef] [Green Version]
  3. Koziel, J.A.; Cai, L.; Wright, D.W.; Hoff, S.J. Solid phase microextraction as a novel air sampling technology for improved, GC-Olfactometry-based, assessment of livestock odors. J. Chromatogr. Sci. 2006, 44, 451–457. [Google Scholar] [CrossRef] [PubMed] [Green Version]
  4. Maurer, D.L.; Koziel, J.A.; Harmon, J.D.; Hoff, S.J.; Rieck-Hinz, A.M.; Andersen, D.S. Summary of performance data for technologies to control gaseous, odor, and particulate emissions from livestock operations: Air management practices assessment tool (AMPAT). Data Brief 2016, 7, 1413–1429. [Google Scholar] [CrossRef] [PubMed] [Green Version]
  5. Chen, B.; Koziel, J.A.; Banik, C.; Ma, H.; Lee, M.; Wi, J.; Meiirkhanuly, Z.; Andersen, D.S.; Białowiec, A.; Parker, D.B. Emissions from Swine Manure Treated with Current Products for Mitigation of Odors and Reduction of NH3, H2S, VOC, and GHG Emissions. Data 2020, 5, 54. [Google Scholar] [CrossRef]
  6. Chen, B.; Koziel, J.A.; Banik, C.; Ma, H.; Lee, M.; Wi, J.; Meiirkhanuly, Z.; O’Brien, S.C.; Li, P.; Andersen, D.S.; et al. Mitigation of odor, NH3, H2S, GHG, and VOC emissions with current products for use in deep-pit swine manure storage structures. Front. Environ. Sci. 2020, 8, 613646. [Google Scholar] [CrossRef]
  7. Cai, L.; Koziel, J.A.; Liang, Y.; Nguyen, A.T.; Xin, H. Evaluation of zeolite for Control of odorants emissions from simulated poultry manure storage. J. Environ. Qual. 2007, 36, 184–193. [Google Scholar] [CrossRef] [Green Version]
  8. Maurer, D.L.; Koziel, J.A.; Bruning, K.; Parker, D.B. Farm-scale testing of soybean peroxidase and calcium peroxide for surficial swine manure treatment and mitigation of odorous VOCs, ammonia and hydrogen sulfide emissions. Atmos. Environ. 2017, 166, 467–478. [Google Scholar] [CrossRef] [Green Version]
  9. Maurer, D.L.; Koziel, J.A.; Bruning, K.; Parker, D.B. Pilot-scale testing of renewable biocatalyst for swine manure treatment and mitigation of odorous VOCs, ammonia and hydrogen sulfide emissions. Atmos. Environ. 2017, 150, 313–321. [Google Scholar] [CrossRef] [Green Version]
  10. Stępień, P.; Świechowski, K.; Hnat, M.; Kugler, S.; Stegenta-Dąbrowska, S.; Koziel, J.A.; Manczarski, P.; Białowiec, A. Waste to Carbon: Biocoal from Elephant Dung as New Cooking Fuel. Energies 2019, 12, 4344. [Google Scholar] [CrossRef] [Green Version]
  11. Stępień, P.; Serowik, M.; Koziel, J.A.; Białowiec, A. Waste to carbon: Estimating the demand for production of carbonized refuse-derived fuel. Sustainability 2019, 11, 5685. [Google Scholar] [CrossRef] [Green Version]
  12. Świechowski, K.; Stegenta-Dąbrowska, S.; Liszewski, M.; Bąbelewski, P.; Koziel, J.A.; Białowiec, A. Oxytree Pruned Biomass Torrefaction: Process Kinetics. Materials 2019, 12, 3334. [Google Scholar] [CrossRef] [PubMed] [Green Version]
  13. Syguła, E.; Koziel, J.A.; Białowiec, A. Proof-of-Concept of Spent Mushrooms Compost Torrefaction—Studying the Process Kinetics and the Influence of Temperature and Duration on the Calorific Value of the Produced Biocoal. Energies 2019, 12, 3060. [Google Scholar] [CrossRef] [Green Version]
  14. Pulka, J.; Manczarski, P.; Koziel, J.A.; Białowiec, A. Torrefaction of Sewage Sludge: Kinetics and Fuel Properties of Biochars. Energies 2019, 12, 565. [Google Scholar] [CrossRef] [Green Version]
  15. Kalus, K.; Koziel, J.A.; Opaliński, S. A Review of Biochar Properties and Their Utilization in Crop Agriculture and Livestock Production. Appl. Sci. 2019, 9, 3494. [Google Scholar] [CrossRef] [Green Version]
  16. Białowiec, A.; Micuda, M.; Koziel, J.A. Waste to Carbon: Densification of Torrefied Refuse-Derived Fuel. Energies 2018, 11, 3233. [Google Scholar] [CrossRef] [Green Version]
  17. Dougherty, B.; Gray, M.; Johnson, M.G.; Kleber, M. Can Biochar Covers Reduce Emissions from Manure Lagoons While Capturing Nutrients? J. Environ. Qual. 2017, 46, 659–666. [Google Scholar] [CrossRef]
  18. Meiirkhanuly, Z.; Koziel, J.A.; Chen, B.; Białowiec, A.; Lee, M.; Wi, J.; Banik, C.; Brown, R.C.; Bakshi, S. Mitigation of Gaseous Emissions from Swine Manure with the Surficial Application of Biochars. Atmosphere 2020, 11, 1179. [Google Scholar] [CrossRef]
  19. Chen, B.; Koziel, J.A.; Białowiec, A.; Lee, M.; Ma, H.; Li, P.; Meiirkhanuly, Z.; Brown, R.C. The Impact of Surficial Biochar Treatment on Acute H2S Emissions during Swine Manure Agitation before Pump-Out: Proof-of-the-Concept. Catalysts 2020, 10, 940. [Google Scholar] [CrossRef]
  20. Chen, B.; Koziel, J.A.; Białowiec, A.; Lee, M.; Ma, H.; O’Brien, S.; Li, P.; Meiirkhanuly, Z.; Brown, R.C. Mitigation of Acute Ammonia Emissions During Swine Manure Agitation Before Pump-Out with Biochar: Proof-of-the-Concept. Front. Environ. Sci. 2021. independent review stage. [Google Scholar]
  21. Banik, C.; Koziel, J.; De, M.; Bonds, D.; Chen, B.; Singh, A.; Licht, M. Soil Nutrients and Carbon Dynamics in the Presence of Biochar-swine Manure Mixture Under Controlled Leaching Experiment Using a Midwestern USA Soil. Preprints 2020, 2020090551. [Google Scholar] [CrossRef]
Figure 1. Mitigation of NH3 emissions from swine manure treated with biochar—effects of one-time dose (2 and 4 kg/m2) and 2 kg/m2 bi-weekly reapplication. Vertical arrows represent the application or reapplication of biochar and manure to storage simulators. Each data point represents the mean of (n = 3) measurements. Detailed statistical analysis is provided in Table S1.
Atmosphere 12 00096 g001
Figure 2. Mitigation of skatole emissions from swine manure treated with biochar—effects of one-time dose (2 and 4 kg/m2) and 2 kg/m2 bi-weekly reapplication. Vertical arrows represent the application or reapplication of biochar and manure to storage simulators. Each data point represents the mean of (n = 3) measurements. Detailed statistical analysis is provided in Table S2. A surrogate abundance of indole is represented by (PAC), i.e., peak area counts for indole in the headspace above manure measured by SPME and analyzed by GC-MS. PACs are arbitrary units of M.S. detector response.
Atmosphere 12 00096 g002
Figure 3. Mitigation of indole emissions from swine manure treated with biochar—effects of one-time dose (2 and 4 kg/m2) and 2 kg/m2 bi-weekly reapplication. Vertical arrows represent the application or reapplication of biochar and manure to storage simulators. Each data point represents the mean of (n = 3) measurements. Detailed statistical analysis is provided in Table S3. A surrogate abundance of indole is represented by (PAC), i.e., peak area counts for indole in the headspace above manure measured by solid-phase microextraction (SPME) and analyzed by GC-MS. PACs are arbitrary units of an MS detector response.
Atmosphere 12 00096 g003
Figure 4. Mitigation of phenol emissions from swine manure treated with biochar—effects of one-time dose (2 and 4 kg/m2) and 2 kg/m2 bi-weekly reapplication. Vertical arrows represent the application or reapplication of biochar and manure to storage simulators. Each data point represents the mean of (n = 3) measurements. Detailed statistical analysis is provided in Table S4. A surrogate abundance of indole is represented by (PAC), i.e., peak area counts for indole in the headspace above manure measured by SPME and analyzed by GC-MS. PACs are arbitrary units of M.S. detector response.
Atmosphere 12 00096 g004
Figure 5. Mitigation of p-cresol (4-methyl phenol) emissions from swine manure treated with biochar—effects of one-time dose (2 and 4 kg/m2) and 2 kg/m2 bi-weekly reapplication. Vertical arrows represent the application or reapplication of biochar and manure to storage simulators. Each data point represents the mean of (n = 3) measurements. Detailed statistical analysis is provided in Table S5. A surrogate abundance of indole is represented by (PAC), i.e., peak area counts for indole in the headspace above manure, sampled by SPME and analyzed by GC-MS. PACs are arbitrary units of M.S. detector response.
Atmosphere 12 00096 g005
Figure 6. Mitigation of 4-ethyl phenol emissions from swine manure treated with biochar—effects of one-time dose (2 and 4 kg/m2) and 2 kg/m2 bi-weekly reapplication. Vertical arrows represent the application or reapplication of biochar and manure to storage simulators. Each data point represents the mean of (n = 3) measurements. Detailed statistical analysis is provided in Table S6. A surrogate abundance of indole is represented by (PAC), i.e., peak area counts for indole in the headspace above manure measured by SPME and analyzed by GC-MS. PACs are arbitrary units of M.S. detector response.
Atmosphere 12 00096 g006
Table 1. Mitigation of gaseous emissions with highly alkaline and porous (HAP) biochar treatments. Effects of the dose (biochar mass/manure surface area) and bi-weekly reapplication. Statistically significant percentage reduction (Control vs. Treatment) of emissions are in bold. Negative percentage reduction signifies gas generation.
Targeted Gases% Reduction
(p-Value)
2 kg/m2
One-Time Application
(Treatment 1)
4 kg/m2
One-Time Application
(Treatment 2)
2 kg/m2
Bi-Weekly Reapplication
(Treatment 3)
NH333
(0.008)
25
(0.0152)
53
(0.0001)
Skatole42
(0.0442)
48
(0.0119)
80
(0.0001)
Indole38
(0.4715)
36
(0.5153)
78
(0.0184)
Phenol28
(0.7054)
49
(0.1686)
89
(0.0049)
P-cresol31
(0.8619)
−40
(0.7653)
74
(0.0282)
4-Ethyl phenol66
(0.4445)
53
(0.9664)
87
(0.0074)
Odor11
(0.8806)
4.2
(0.9923)
22
(0.4733)
CO2−1.4%
(0.9916)
1.7
(0.9842)
−0.3
(0.9999)
CH4−15
(0.9536)
−16
(0.9435)
−46
(0.3588)
N2O−2
(0.9963)
2.3
(0.9947)
4.4
(0.964)
Publisher’s Note: MDPI stays neutral with regard to jurisdictional claims in published maps and institutional affiliations.

