Dynamic and Post-Dynamic Recrystallization of Haynes 282 below the Secondary Carbide Solvus


Department of Physics, Chalmers University of Technology, 411 33 Gothenburg, Sweden
*
Author to whom correspondence should be addressed.
Metals 2021, 11(1), 122; https://doi.org/10.3390/met11010122
Submission received: 1 December 2020
/
Revised: 29 December 2020
/
Accepted: 30 December 2020
/
Published: 9 January 2021
Abstract
:Thermomechanical processes, such as forging, are important steps during manufacturing of superalloy components. The microstructural development during processing, which controls the final component properties, is complex and depends on e.g., applied strain, strain rate and temperature. In this study, we investigate the effect of process parameters on the dynamic and post-dynamic recrystallization during hot compression of Ni-base superalloy Haynes 282. Specifically, we address the effect of deformation below the grain boundary carbide solvus temperature. During deformation, discontinuous and continuous dynamic recrystallization was observed at the grain boundaries, and particle-stimulated nucleation occurred at primary carbides. Strain rate was determined to be the governing factor controlling the recrystallization fraction for strain rates up to 0.5 s−1 above which adiabatic heating became the dominating factor. Careful examination of the temperature development during deformation showed that the response of the closed-loop temperature control system to adiabatic heating can have important effects on the interpretation of the observed behavior. During a 90 s post-deformation hold, grain growth and an increasing fraction of twin boundaries significantly changed the deformation-induced microstructure and texture. The microstructure developed during post-dynamic recrystallization was mainly controlled by the temperature and only weakly coupled to the prior deformation step.
1. Introduction
Ni-base superalloys offer excellent combinations of high-temperature mechanical properties and oxidation/corrosion resistance [1]. Typical applications include hot sections in aero engines, stationary gas turbines and oil and gas industry. With the increasing demands for reduced emission, developing and improving alloy properties to withstand e.g., increased operation temperatures is of importance.
To obtain the optimal performance, the microstructure must be controlled precisely. However, due to the chemical complexity and phase distribution of superalloys, the processing is generally very demanding. Thermomechanical processes involve deformation at high temperatures (hot working), where the thermal energy allows numerous phenomena to occur: dynamic recovery (DRV), discontinuous and/or continuous dynamic recrystallization (dDRX and/or cDRX) and post-dynamic recrystallization (pDRX). A particular form of pDRX, occurring when the deformation is stopped but the temperature remains, is the growth of grains and nuclei formed during the preceding DRX process without further need for nucleation. This is usually referred to as meta-dynamic recrystallization (mDRX). Further microstructural changes can occur due to static recovery (SRV), static recrystallization (SRX) and grain growth during subsequent annealing and heat treatment [2,3,4]. Therefore, understanding the effects of the processing parameters on the microstructural evolution during hot working is essential to allow proper control of the final properties. In general, the low stacking fault energy of Ni-base superalloys typically lead to dDRX, as exemplified by [5], although the occurrence of simultaneous cDRX is also reported [6]. The DRX process in such alloys is also characterized by pronounced development of annealing twins [7]. However, as a result of the complex microstructure in Ni-base superalloys, the material response during thermomechanical processing depends strongly on the specific alloy.
Haynes 282 (H282), a new strengthened Ni-base superalloy developed by Haynes International, which belongs to the same class of alloys as Waspaloy and René 41 [8]. Due to slow precipitation kinetics it exhibits high fabricability and weldability while maintaining strength, creep and oxidation resistance [8]. The equilibrium fraction of (L1 Ni3(Ti,Al)) in the disordered gamma FCC matrix is approximately 20% in the fully heat-treated condition. Secondary M23C6 and M6C carbides precipitate at grain boundaries [8,9] which improve creep resistance and prevent grain boundary sliding.
Most previous research into the microstructure and processing of H282 has focused on microstructure-property relationships [10,11,12,13,14,15], microstructure stability and related effects [16,17] and heat treatments [18,19] of already forged material. Limited efforts have been made towards understanding the effects of prior thermomechanical processing steps, i.e., forging. Joseph et al. [20,21] showed that alignment of primary carbides from forging can lead to inhomogeneous grain size distributions and anisotropy in the ductility. Gardner et al. [22] applied multistep processing, and showed that SRX during interpass annealing is an important factor, but also that the effects of previous steps on the final microstructure is negligible if the processing conditions during the final step allows sufficient DRX. Metzler and Fahrman [23] studied the effect of thermomechanical processing in the temperature range 1100–1200 °C by hot compression of H282 bar stock material to total strains of 0.4 and 0.8 at strain rates between 0.5 and 8.5 s−1. Samples were also subjected to post-deformation annealing at the deformation temperature for times between 10 s and 2 h. It was demonstrated that under these conditions the grain size in the as-deformed state was only weakly dependent on the deformation parameters, but was mainly controlled by post-deformation annealing. Shi et al. [24] investigated the hot deformation behavior of H282 at temperatures between 950 and 1210 °C, and strain rates between 0.01 and 10 s−1, and concluded that the optimal hot working range is 1100–1180 °C and 0.01–0.1 s−1, in order to produce a fine and uniform microstructure.
Notably, all these studies, with the exception of [24] were performed at deformation temperatures of 1100 °C or above, thus removing all or most of the grain boundary carbides during pre-deformation soaking, as the solvus for these carbides has been measured to be in the range 1100–1120 °C [25]. However, the pre-deformation soaking in [24] was performed at 1200 °C (above the grain boundary carbide solvus) and the time for stabilization at the deformation temperature below the solvus was only 180 s, which is not expected to lead to significant carbide precipitation. Thus, although testing was performed below the carbide solvus, no or only small amounts of grain boundary carbides would have been present. On the other hand, in many industrial situations it is desirable to forge at temperatures well below the solvus temperature of grain boundary carbides to provide an additional means to control the grain size. Since typical pre-deformation soaking times in industrial processes are in the order of 0.5–1 h, significant carbide precipitation can be expected, and hence the microstructural evolution of starting conditions containing grain boundary carbides is of great interest. Similarly, pDRX is always expected to occur in industrial sized forgings, due to the limited cooling rates achievable, which was not considered when determining the optimal hot working range in [24]. Furthermore, none of the above-mentioned studies have reported the quantitative evolution of other important microstructural characteristics, such as texture, annealing twin density etc.
In this study, we attempt to further elucidate aspects of the microstructural development during hot deformation of H282 at temperature below the grain boundary carbide solvus temperatures. In particular, we investigate the effect of pDRX during a post-deformation hold and the texture evolution resulting from dDRX and pDRX. Cylindrical samples were subjected to hot compression under deformation conditions chosen to be representative of industrial applications, and the deformed specimens were investigated using electron backscatter diffraction (EBSD) in order to characterize the resulting microstructures. We observe several nucleation mechanisms during DRX, including dDRX, cDRX and particle-stimulated nucleation (PSN) at primary MC carbides. At lower strain rates (0.05 and 0.5 s), the temperature did not affect the DRX microstructure (grain size and DRX area fraction), which were instead controlled by the applied strain rate. At 5 s−1 the contribution from adiabatic heating dominated the response, leading to a strong temperature effect. The deformation texture inherited by the DRX grains was removed during the 90 s post-deformation hold through the formation of annealing twins during mDRX. The final microstructure after the hold period was determined by the temperature, with no influence of strain rate. We also discuss the complicating effects of adiabatic heating on the results, which must be considered in the interpretation of hot compression studies at non-quasistatic strain rates. Notably, we do not study the explicit effect of the grain boundary carbides, as their influence is difficult to distinguish from pure thermal effects. Here we aim to provide a detailed study of the microstructure formed under sub-solvus deformation conditions in order to provide a solid base for further dedicated studies of the DRX kinetics and to allow design of dedicated tests to probe the role of grain boundary carbides in this process.
2. Materials and Method
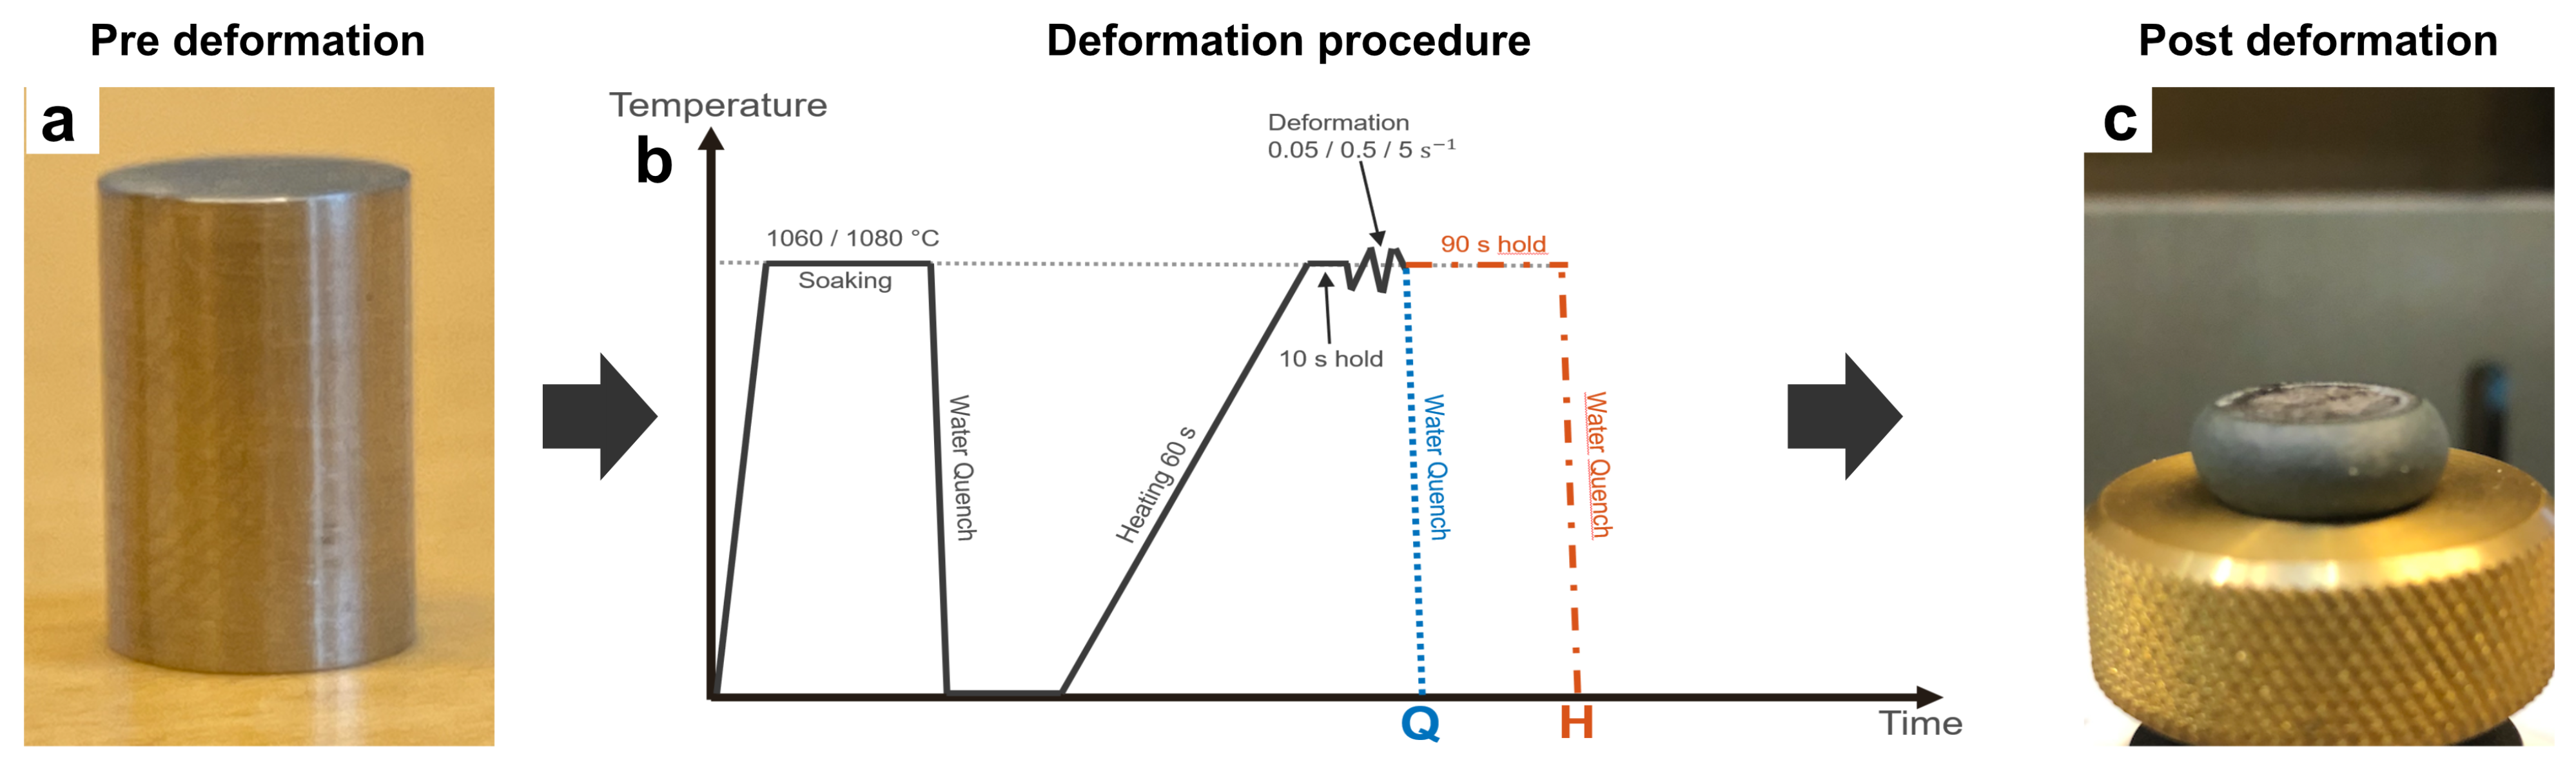
The chemical composition of H282 (in wt.%) can be found in Table 1. The material was obtained in the form of 15 mm thick slices cut from a billet with a diameter of 152 mm (6 inches). The billet corresponds to a typical starting condition for industrial forging operations. Cylindrical samples with a diameter of 8 mm and a height of 12 mm (with the axis of symmetry in the thickness direction of the slice), Figure 1a, were machined along the mid-radius of the slice to maintain a constant microstructure. Prior to deformation, the samples were soaked at the deformation temperature for 30 min in a muffle furnace with atmospheric environment and subsequently water quenched. This was done to mimic the pre-deformation soaking applied before deformation in industrial forging processes.
Hot compression testing was performed in a Gleeble 3800 thermomechanical simulator, (Dynamic Systems Inc., Austin, TX, USA). Thin graphite discs were placed between the sample and grips in order to minimize friction [26], and the temperature was measured by a thermocouple spot welded to the middle of the gauge length. The samples were heated resistively to the deformation temperature over a period of 60 s (heating rates of approximately 17 °C s−1) and held for 10 s in order to stabilize the temperature prior to deformation. Hot compression to a nominal (true) strain of approximately (height reduction of around 0.55) was performed with constant deformation rate corresponding to strain rates of 0.05 s, 0.5 s and 5 s at two temperatures, 1060 and 1080 °C. Two samples were tested for each condition. One was water quenched directly after deformation (delay time between end of deformation and start of the water quenching was measured to be approximately 0.5 s), and the other was held at the deformation temperature for 90 s at constant displacement (leading to rapid stress relaxation) after deformation before being water quenched. Hereafter, the subset of samples quenched directly after deformation are denoted Q, and the samples with the subsequent hold at deformation temperature, prior to quenching, are referred to as H. Figure 1b schematically shows the entire process, including pre-deformation soaking.
Despite the attempts to reduce friction, barreling was observed after compression, Figure 1c. Importantly, this is also an indication that the strains and strain rates (and thereby also the temperatures) will be inhomogeneously distributed within the sample. Finite element simulations of hot deformation of superalloy specimens under similar conditions have shown that the effective strain differs throughout the sample volume [27,28] and a sample compressed to a nominal strain of 0.8 can easily exceed 1 in the central region [28]. Another factor affecting the strain, strain rate and temperature distribution within the sample is the significant temperature gradients introduced by the heat conduction to the cooler grips. This was quantified by testing samples with additional thermocouples spot welded at both end of the samples around 1–2 mm away from the contact points with the grips, showing that the difference between the control thermocouple at the center and the edges of the specimen is typically in the order of 50–150 °C prior to deformation, which is consistent with finite element simulations [29,30]. An additional important aspect to consider, which will be discussed more in detail later, is the occurrence of adiabatic heating during deformation which is important in terms of thermal activation. Due to the larger strains in the central region of the samples, the temperature at the center will be even higher than what was measured by the thermocouple at the surface, but according to finite element simulations for similar set-ups the difference is expected to be in the order of 10 °C [31,32].
Due to these well know issues in hot compression testing, which are very difficult to resolve, we limited the microstructural investigations to the central region of the specimens in this study. As the exact conditions in terms of local strain, strain rate and temperature history is therefore not precisely known, the microstructure is representative of a given nominal hot deformation condition. Furthermore, due to the unknown inhomogeneous distribution of strain, strain rate and temperature discussed above, we did not attempt to compensate the stress-strain response for adiabatic heating, as such compensation is dependent on the invalid assumption of homogeneous deformation. Iterative finite element simulations, as suggested by Daniel et al. [33] and Jedrasiak and Shercliff [34], in order to identify the true constitutive response of the materials during hot compression is outside the scope of the present work.
Each sample was cut at the center with a Beuhler low speed saw to allow examination of the cross-section. The samples were ground using SiC paper, down to a grit of P4000, polished with 3 μm, 1 μm and 0.25 μm diamond particles and finished with a colloidal silica suspension polishing. EBSD measurements of the central regions of the samples were made in Tescan GAIA3 (TESCAN, Brno, Czech Republic), and LEO Ultra 55 FEG-SEMs (ZEISS, Oberkochen, Germany), equipped with NordLys II detectors, at acceleration voltages of 20–30 keV with step sizes between 0.125 μm to 1 μm, based on magnification and resolution required. Data analysis was performed in HKL Channel5 software (version 5.12.74.0, Oxford Instruments, Abingdon, UK).
3. Results
3.1. Initial Microstructure and Effect of Pre-Deformation Soaking
Figure 2 shows the microstructure for the as-received billet ((a)–(e)), a sample soaked at 1060 °C for 30 min ((f)–(j)), and a sample soaked at 1080 °C for 30 min ((k)–(o)). The microstructure consisted of equiaxed grains with an average size of approximately 75 μm (which did not change during soaking) and no strong texture. Although the grain boundaries in as-received billet was free from secondary carbides, Figure 2c, these precipitated during soaking, Figure 2h,m. Primary MC carbides were observed in all three conditions. Twin boundaries were prevalent in all three samples and a slight increase in fraction of twin boundaries could be observed with increasing soaking temperature. This increase could be due to growth of the annealing twins which have been seen in pure nickel [35], but the effect is very small and not statistically verified.
3.2. Adiabatic Heating
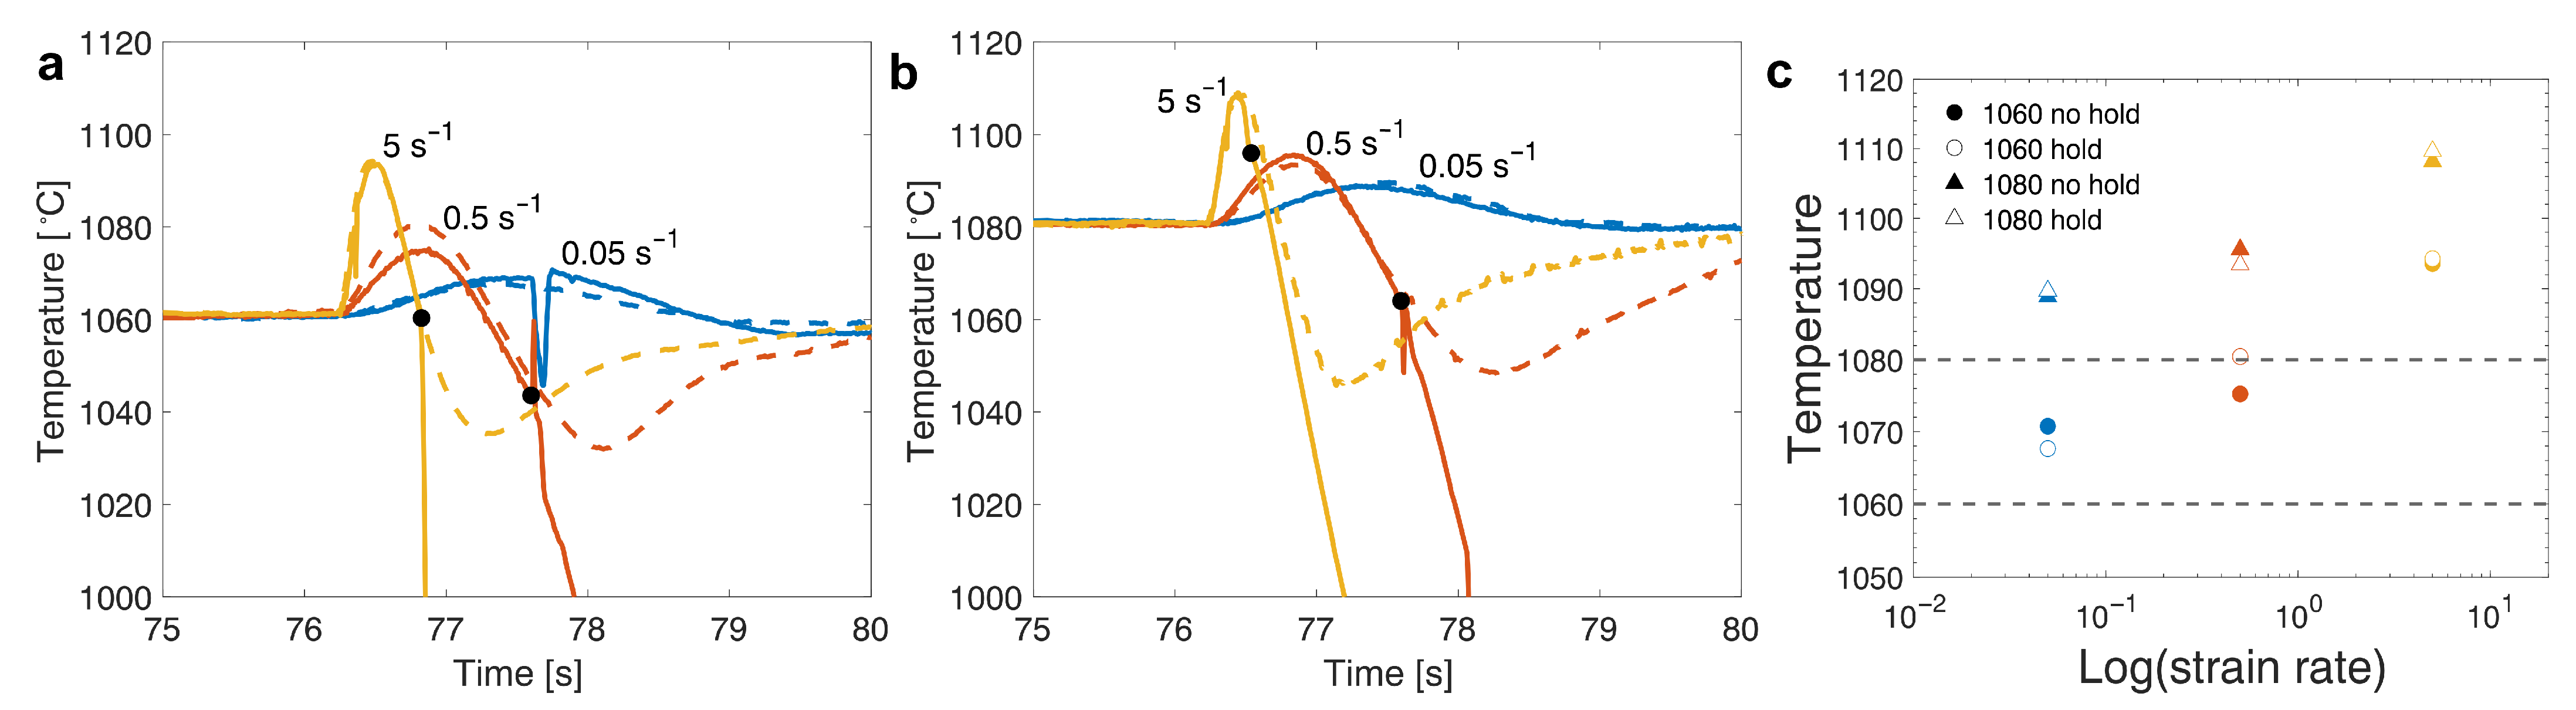
Figure 3a,b shows the temperature measured by the thermocouple at the surface of the samples during deformation at 1060 °C and 1080 °C, respectively. The surface temperature increased with increasing strain rate (Figure 3c), and for 5 s at 1080 °C it even exceeded the carbide solvus (1100 °C), but the test times were too short to allow for any significant carbide dissolution. The increase in temperature due to adiabatic heating agrees with similar studies [26,36].
The expected duration of the deformation at strain rates 0.05 s, 0.5 s and 5 s were 14 s, 1.4 s and 0.14 s, respectively. However, due to acceleration and deceleration of the deformation lead to non-linear scaling of times and the true deformation duration for samples compressed at 5 s was 0.3–0.4 s. The maximum temperatures were measured to occur at 1.5 s, 0.6 s and 0.2 s for 0.05 s, 0.5 s and 5 s, respectively. In response to the adiabatic heating the closed-loop control system attempted to correct for the temperature rise, which resulted in an undershoot in temperature. As a result, the samples were quenched from different temperatures, displayed with black circles in Figure 3a,b. At 0.05 s, the temperature returned to the target temperature after about 2–3 s, where it remained until quenching (which occurred at time >80 s and therefore not seen in Figure 3). At 0.5 s, the quenching occurred during the undershoot, at temperatures approximately 20 °C below the target. At the highest strain rate, 5 s, the quench occurred before the undershoot, and samples were therefore slightly above the target. Adiabatic heating and temperature undershoots also occurred in the H samples, but the temperature was stabilized after 3 s and should not have a significant effect on the response during the 90 s hold.
3.3. Mechanical Response
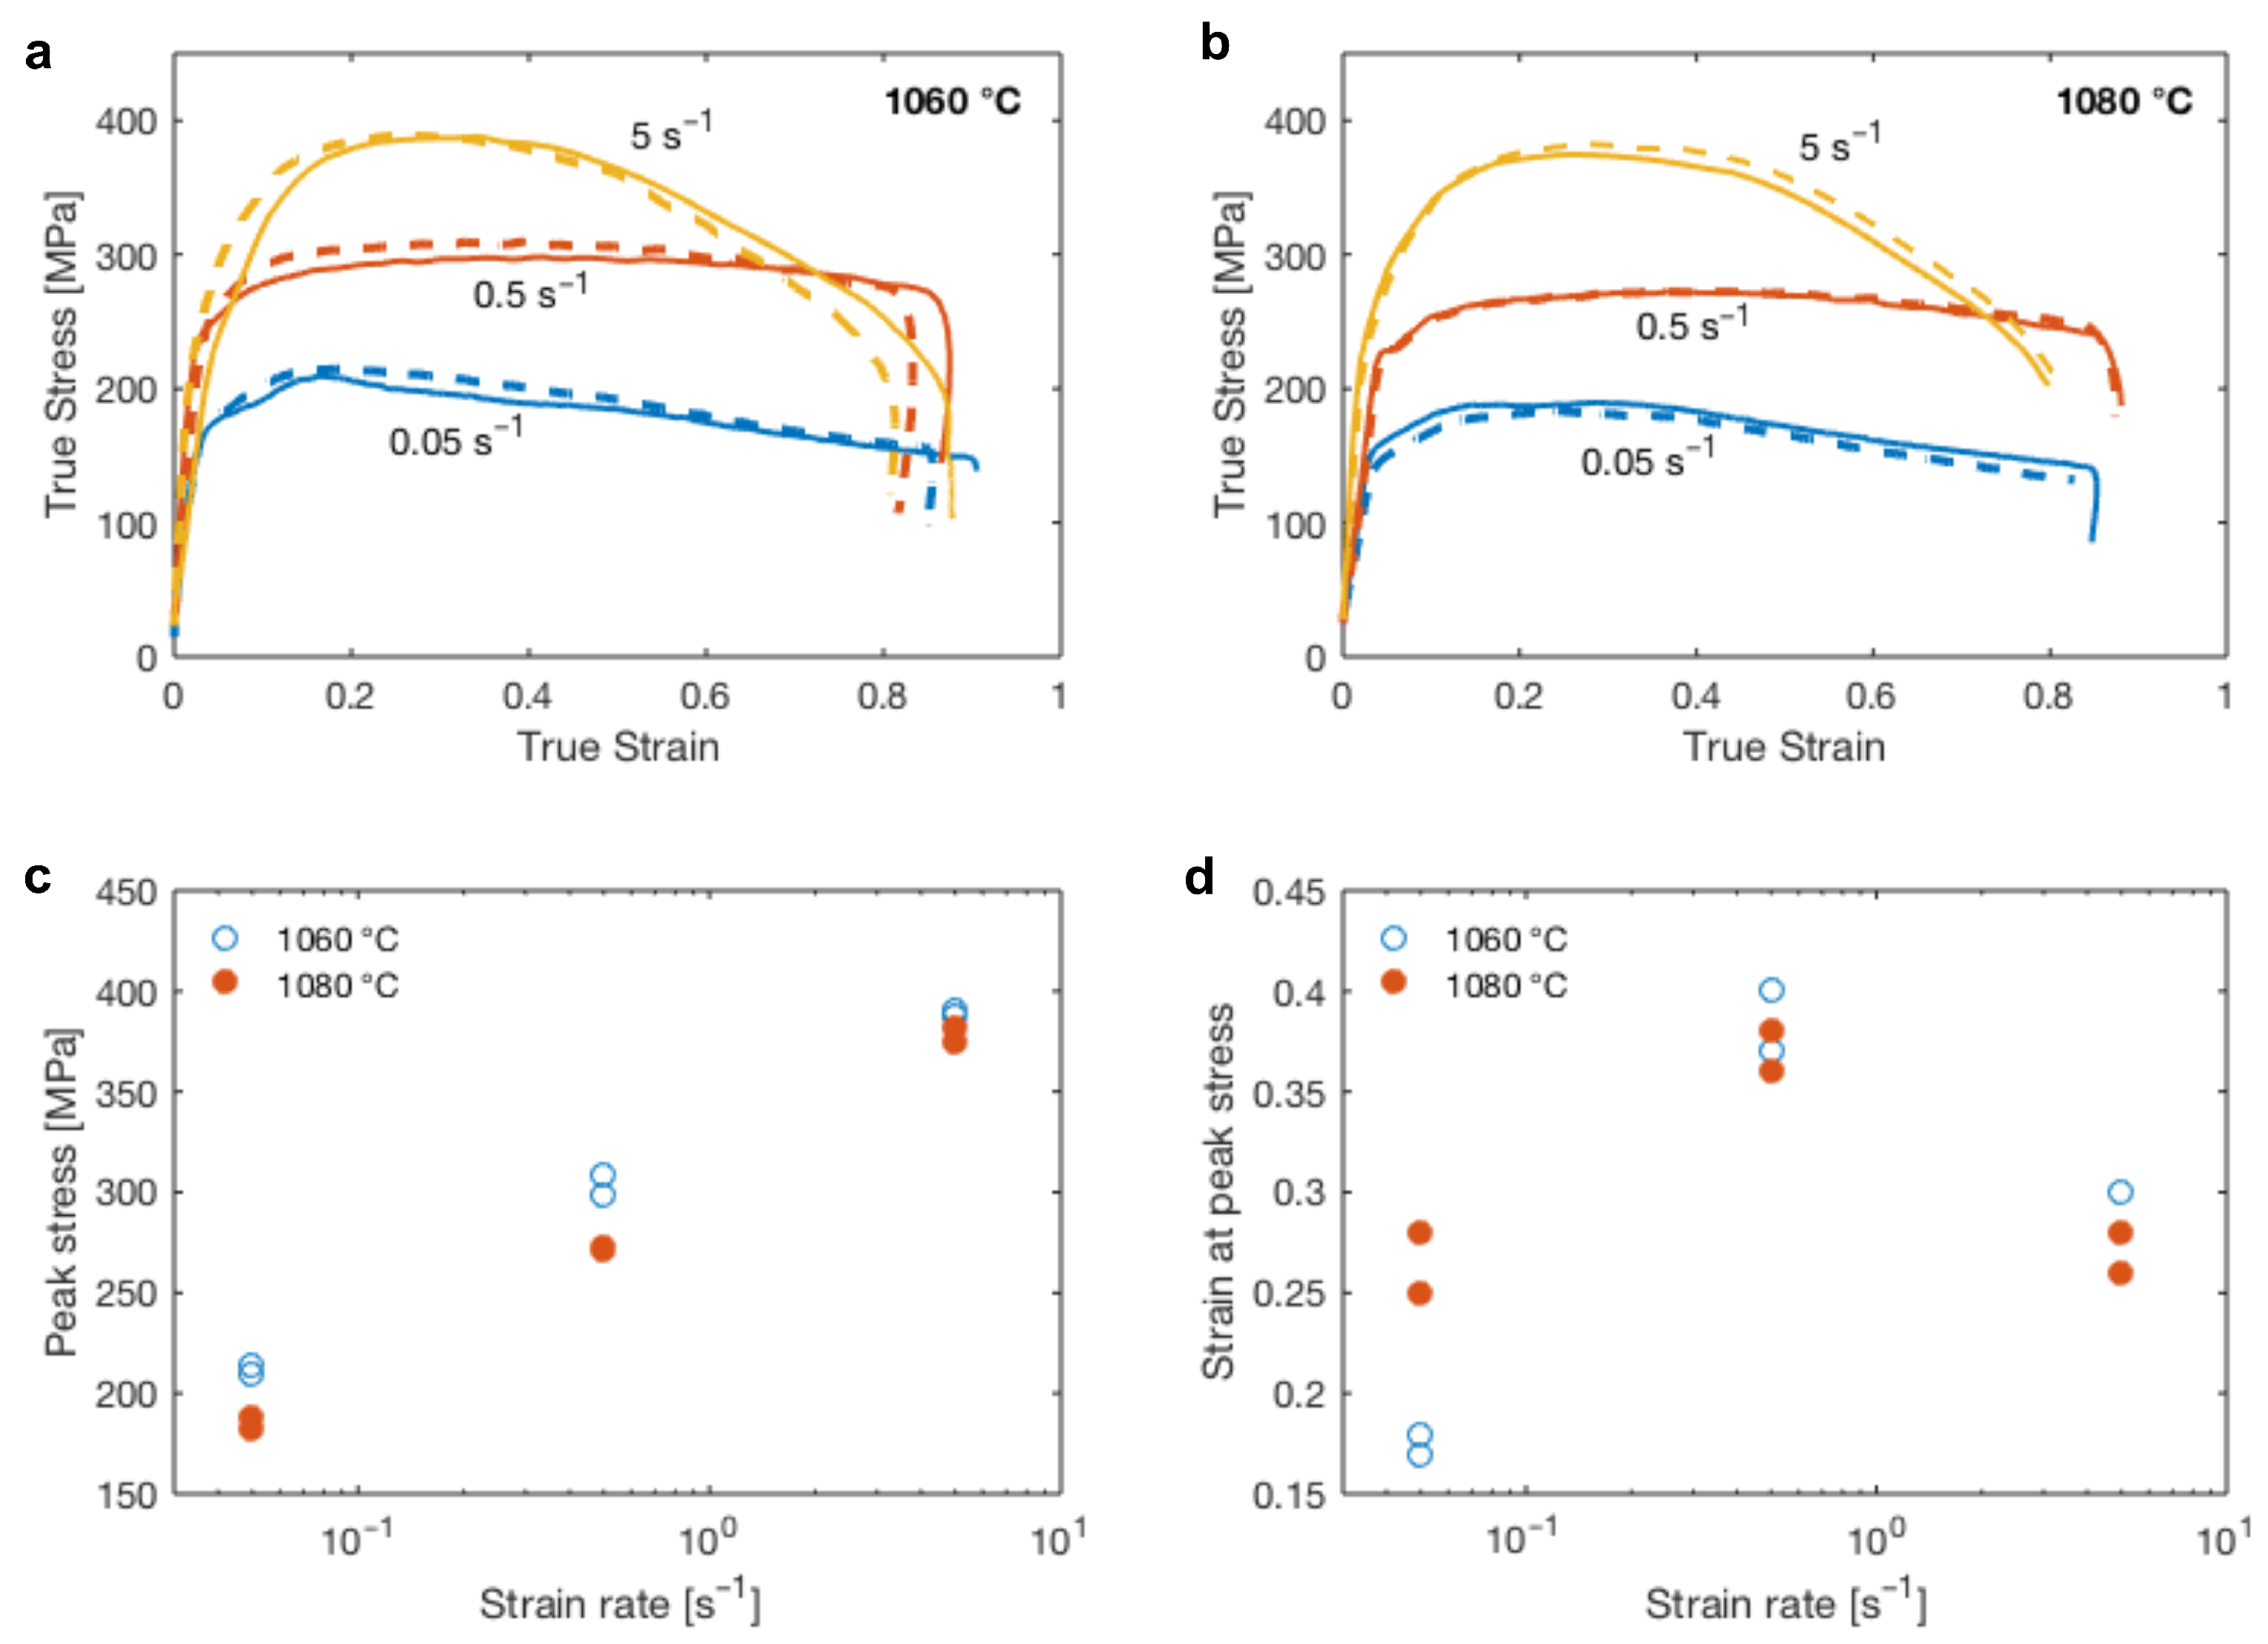
Figure 4a,b shows the true stress–strain curves for each deformation condition. Stresses and strains were calculated from the force–displacement data based on the assumption of homogeneous deformation. However, this assumption was not valid, as discussed in the experimental procedure, so the stress-strain data should therefore be considered for qualitative comparison only. The mechanical response of the Q and H samples was very similar for all cases, indicating good repeatability.
The stress levels were higher at the lower temperature, and increased with increasing strain rate. The peak stress () increased approximately linearly with the logarithm of the strain rate, Figure 4c, whereas the strain at which the peak stress occurred () did not shift monotonously to higher levels with increasing strain rate (Figure 4d). Instead, was highest for the intermediate strain rate, 0.5 s, for both temperatures. Based on interrupted hot compression tests of Ni-base superalloy Inconel 718, it was argued by Nicolay et al. [37] that the decrease in at higher strain rates is a result of adiabatic heating. Furthermore, the softening was also less pronounced for 0.5 s compared to both higher and lower strain rates. This could possibly be related to the observed temperature undershoot during the last third of the deformation at 0.5 s (as discussed above), which would increase the flow stress. A comparison can be made to the results in Shi et al. [24], where hot compression tests were performed at a range of strain rates and temperatures, where 1050 and 1100 °C were the closest temperatures bounding the present test conditions. Examining the stress-strain curves for these particular temperatures in [24], similar trends could be observed. The strain corresponding to peak stress was higher at 1 s, compared to 0.1 and 10 s, at least before the 10 s curve was corrected for adiabatic heating. Furthermore, the softening rate after peak stress was lower at 1 s, although not as pronounced as in the present results.
An additional quantitative comparison with Shi et al. [24] can be made in terms of the strain rate and temperature dependence of . Figure 5a compiles from [24] as a function of strain rate for the different temperatures, as well as the current results. Clearly the peak stress obtained here falls in the range between measurements at the bounding temperatures (1050 and 1100 °C) with a very similar strain rate dependence. Shi et al. [24] used the following relationship between the temperature compensated strain rate (Zener-Hollomon parameter), Z, and peak stress:
here is the strain rate, Q is the activation energy, R is the gas constant, A and n are material constants and an adjustable parameter. Using from [24] the strain rate and temperature dependence of can be compared with the data from literature, Figure 5b,c, showing very good agreement. As the slopes of vs. agree well, the same activation energy as in [24] ( kJ mol) was used to compare the results in terms of Z-dependence of . As seen from Figure 5d, the current data falls very close to the best fit obtained by [24]. In total, the agreement between our data and the results previously obtained is excellent, which is encouraging for the generalization of the results.
3.4. Post-Deformation Microstructure
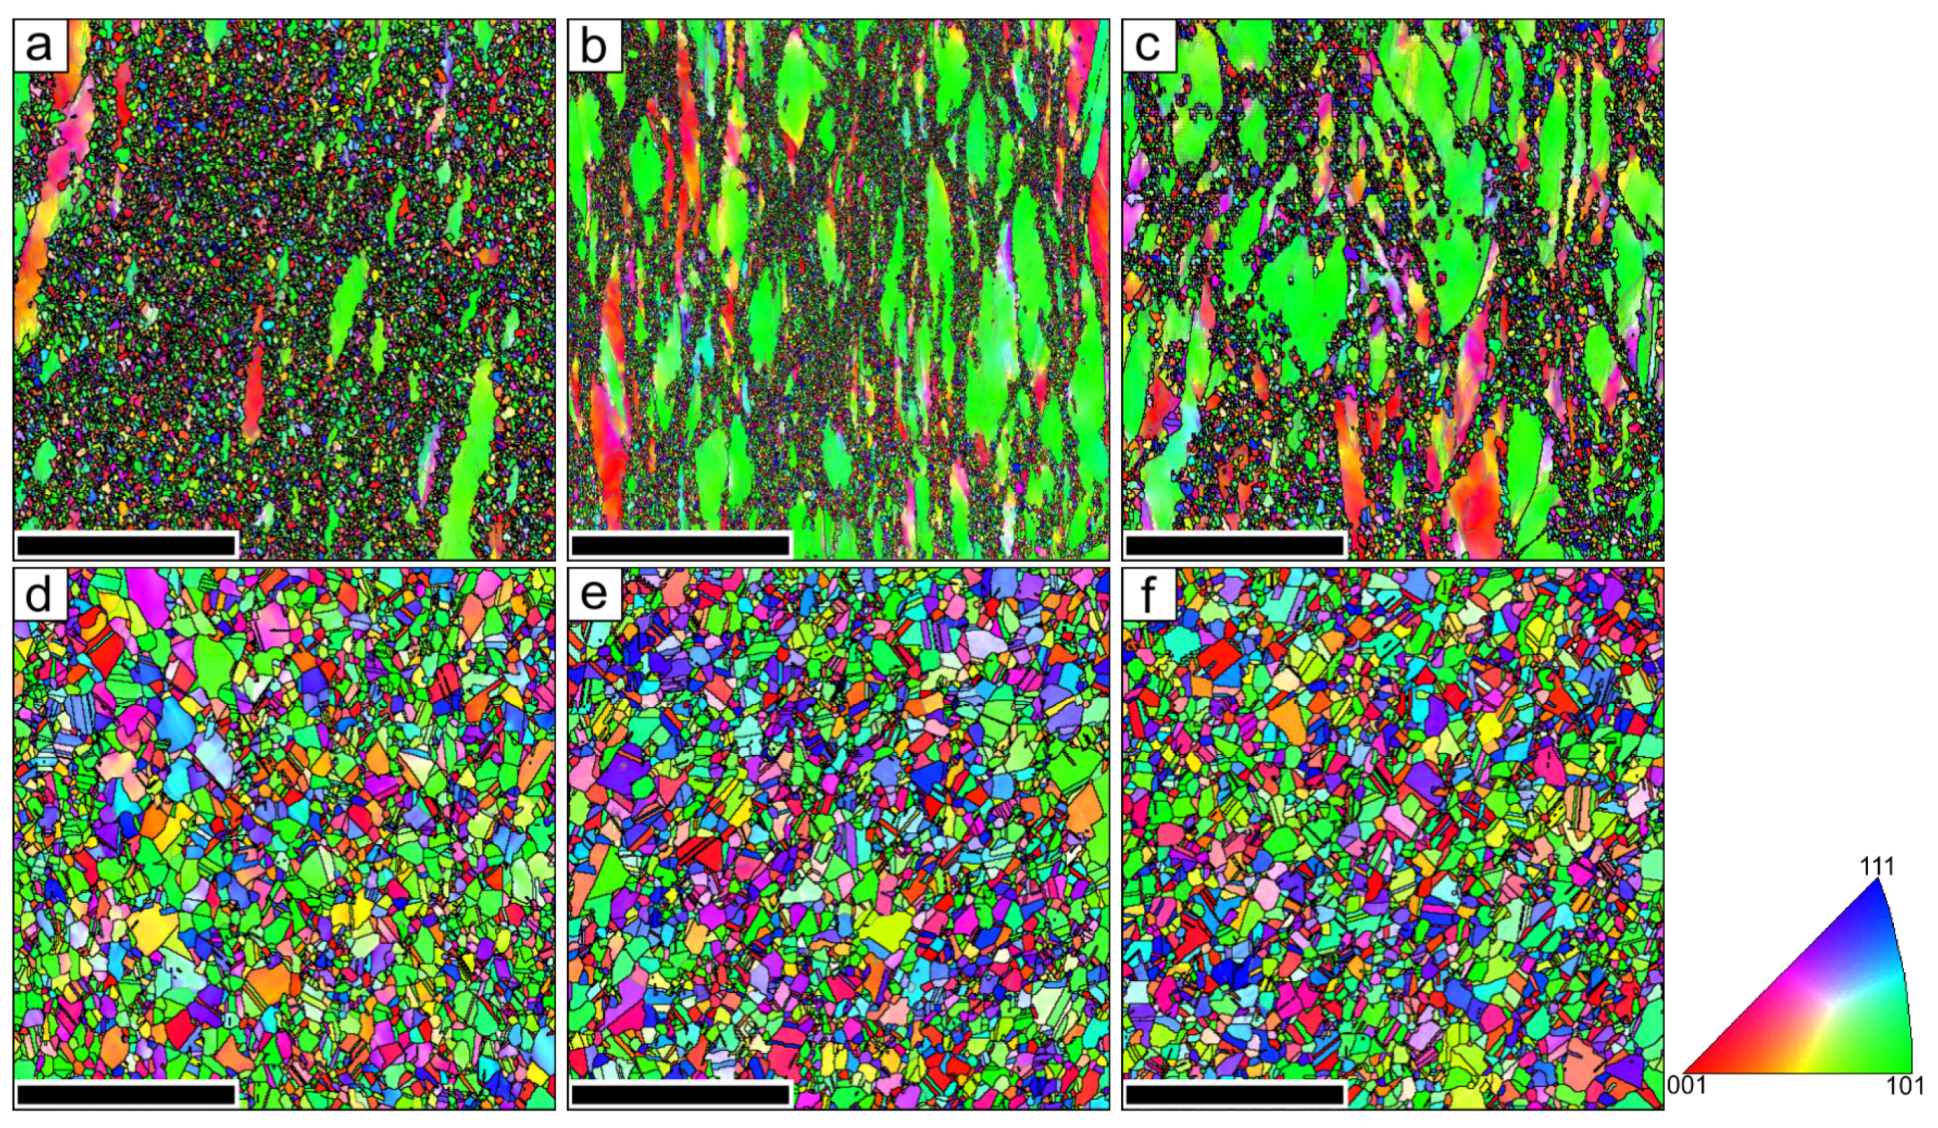
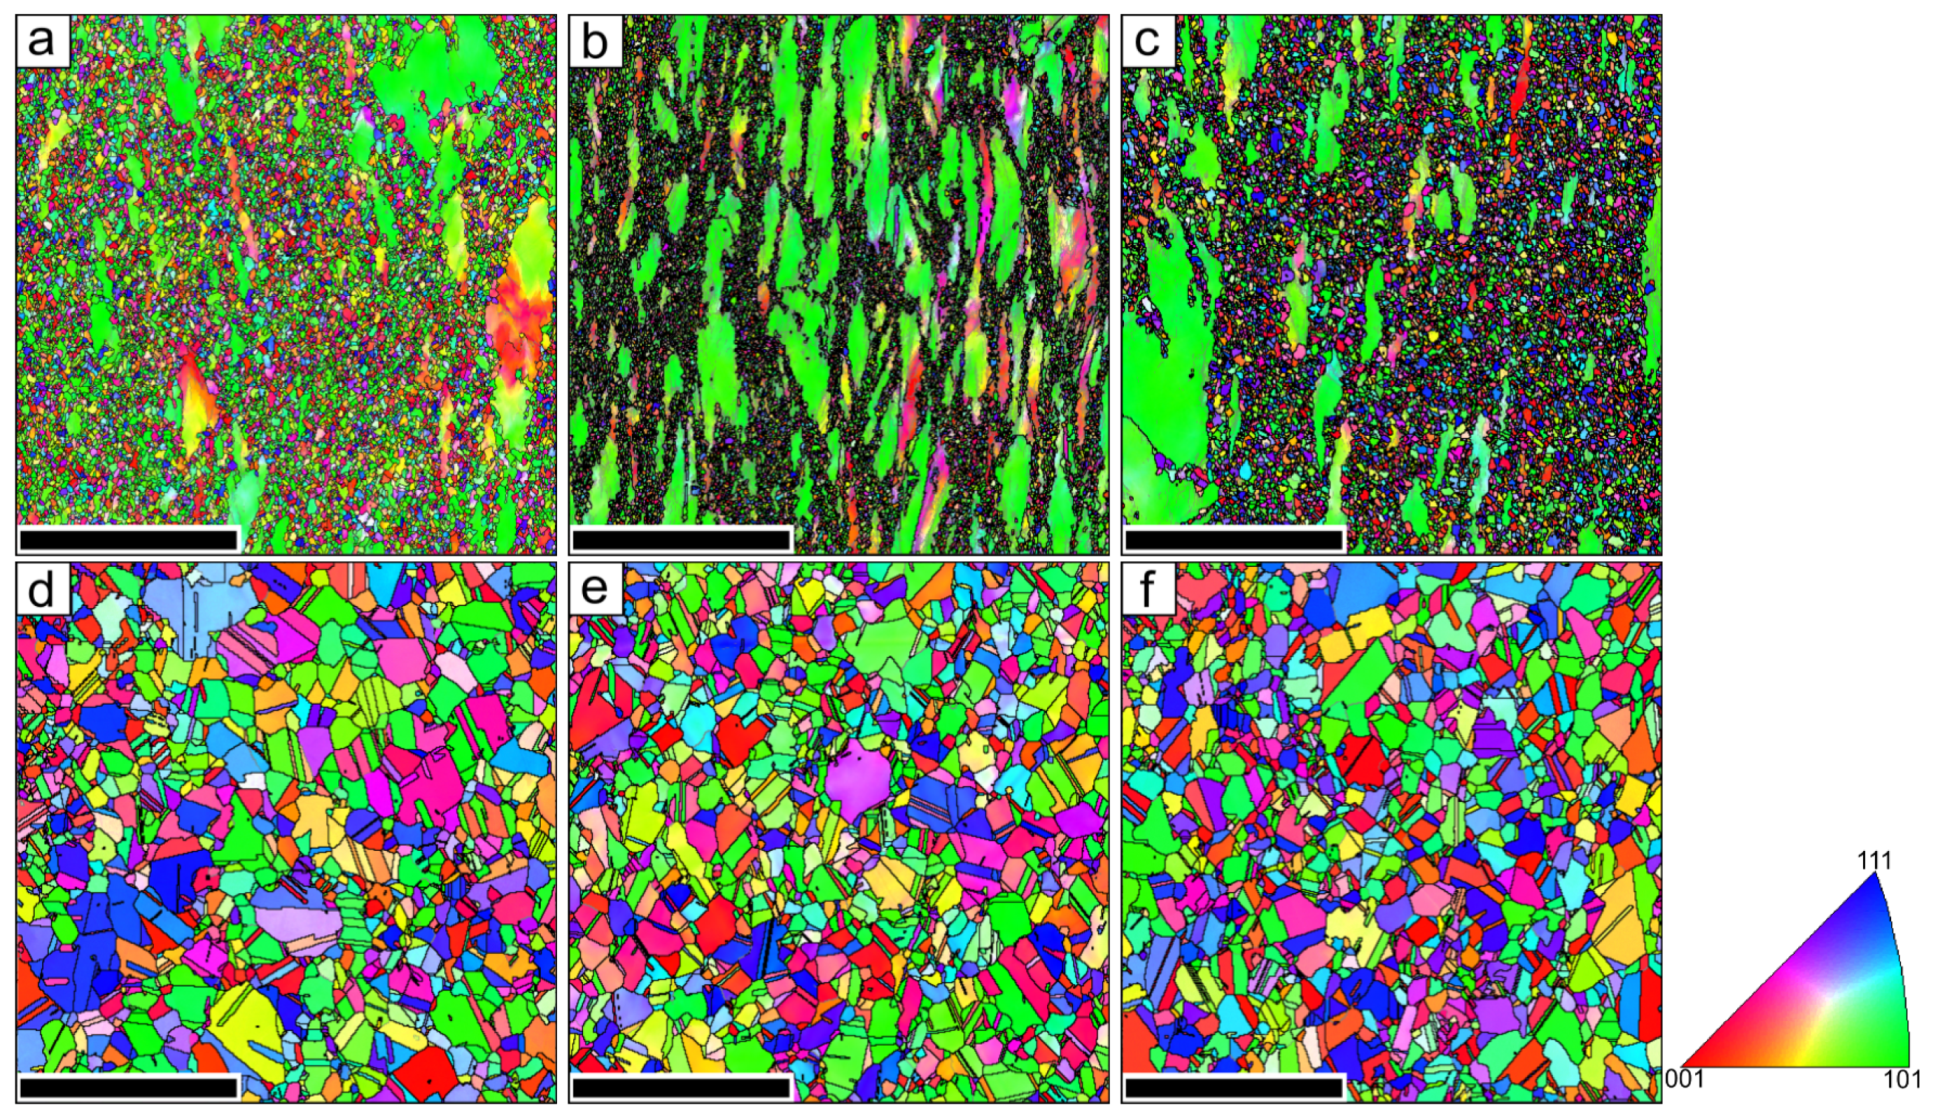
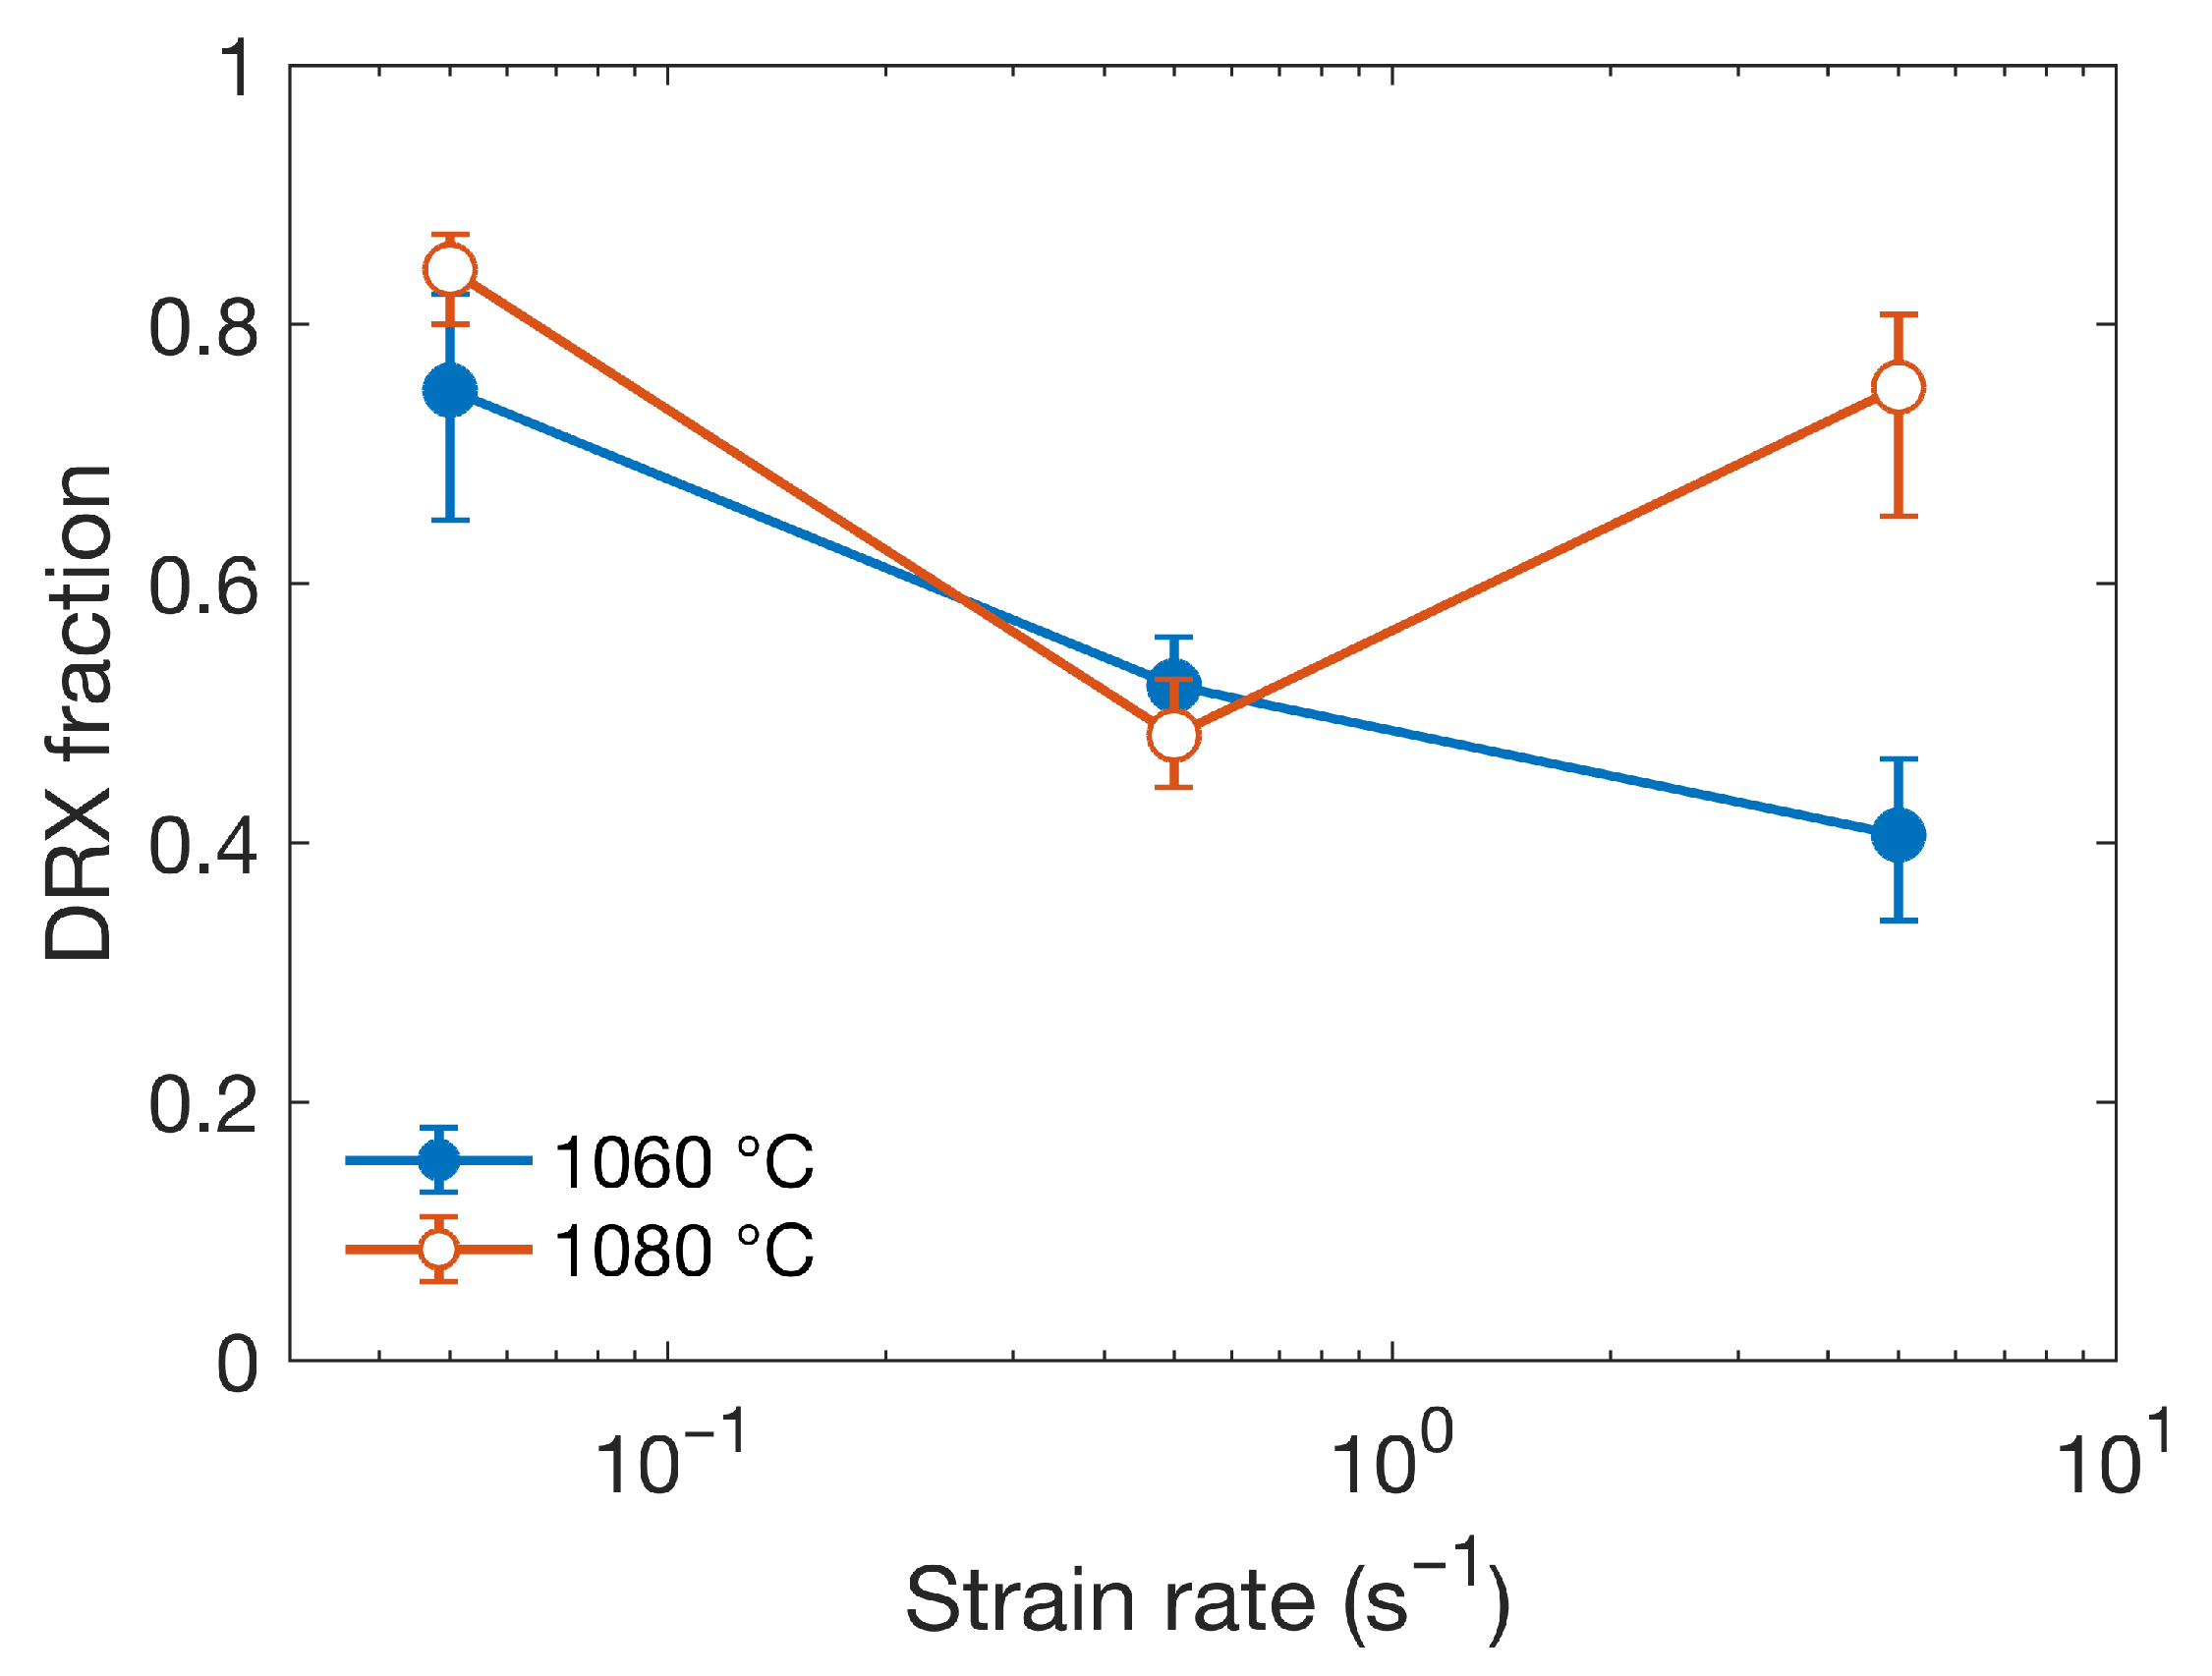
None of the Q samples showed a fully recrystallized microstructure, Figure 6a–c and Figure 7a–c. The large deformed grains were elongated as a result of the compression, and were surrounded by small DRX grains. During deformation at 1060 °C, the area fraction of DRX grains decreases monotonously with increasing strain rate, Figure 8. At 1080 °C, on the other hand, a minimum is observed at the intermediate strain rate, 0.5 s. Such behavior is frequently seen in the literature (see e.g., [37] for a summary), and will be discussed later. Note here that the separation of DRX and deformed grains were made based on grain size, where the threshold grain size was adjusted manually for each map using visual inspection until satisfactory separation was obtained, Figure 9.
The calculated DRX fraction was, however, relatively insensitive to the selected threshold grain size, as shown by the error bars in Figure 8. The error bars represent the span corresponding to a 20% decrease or a 50% increase the threshold compared to the selected values. After post-deformation hold, Figure 6d–f and Figure 7d–f, the microstructures in samples deformed at both 1060 and 1080 °C were fully recrystallized as a result of pDRX.
3.5. Grain Size
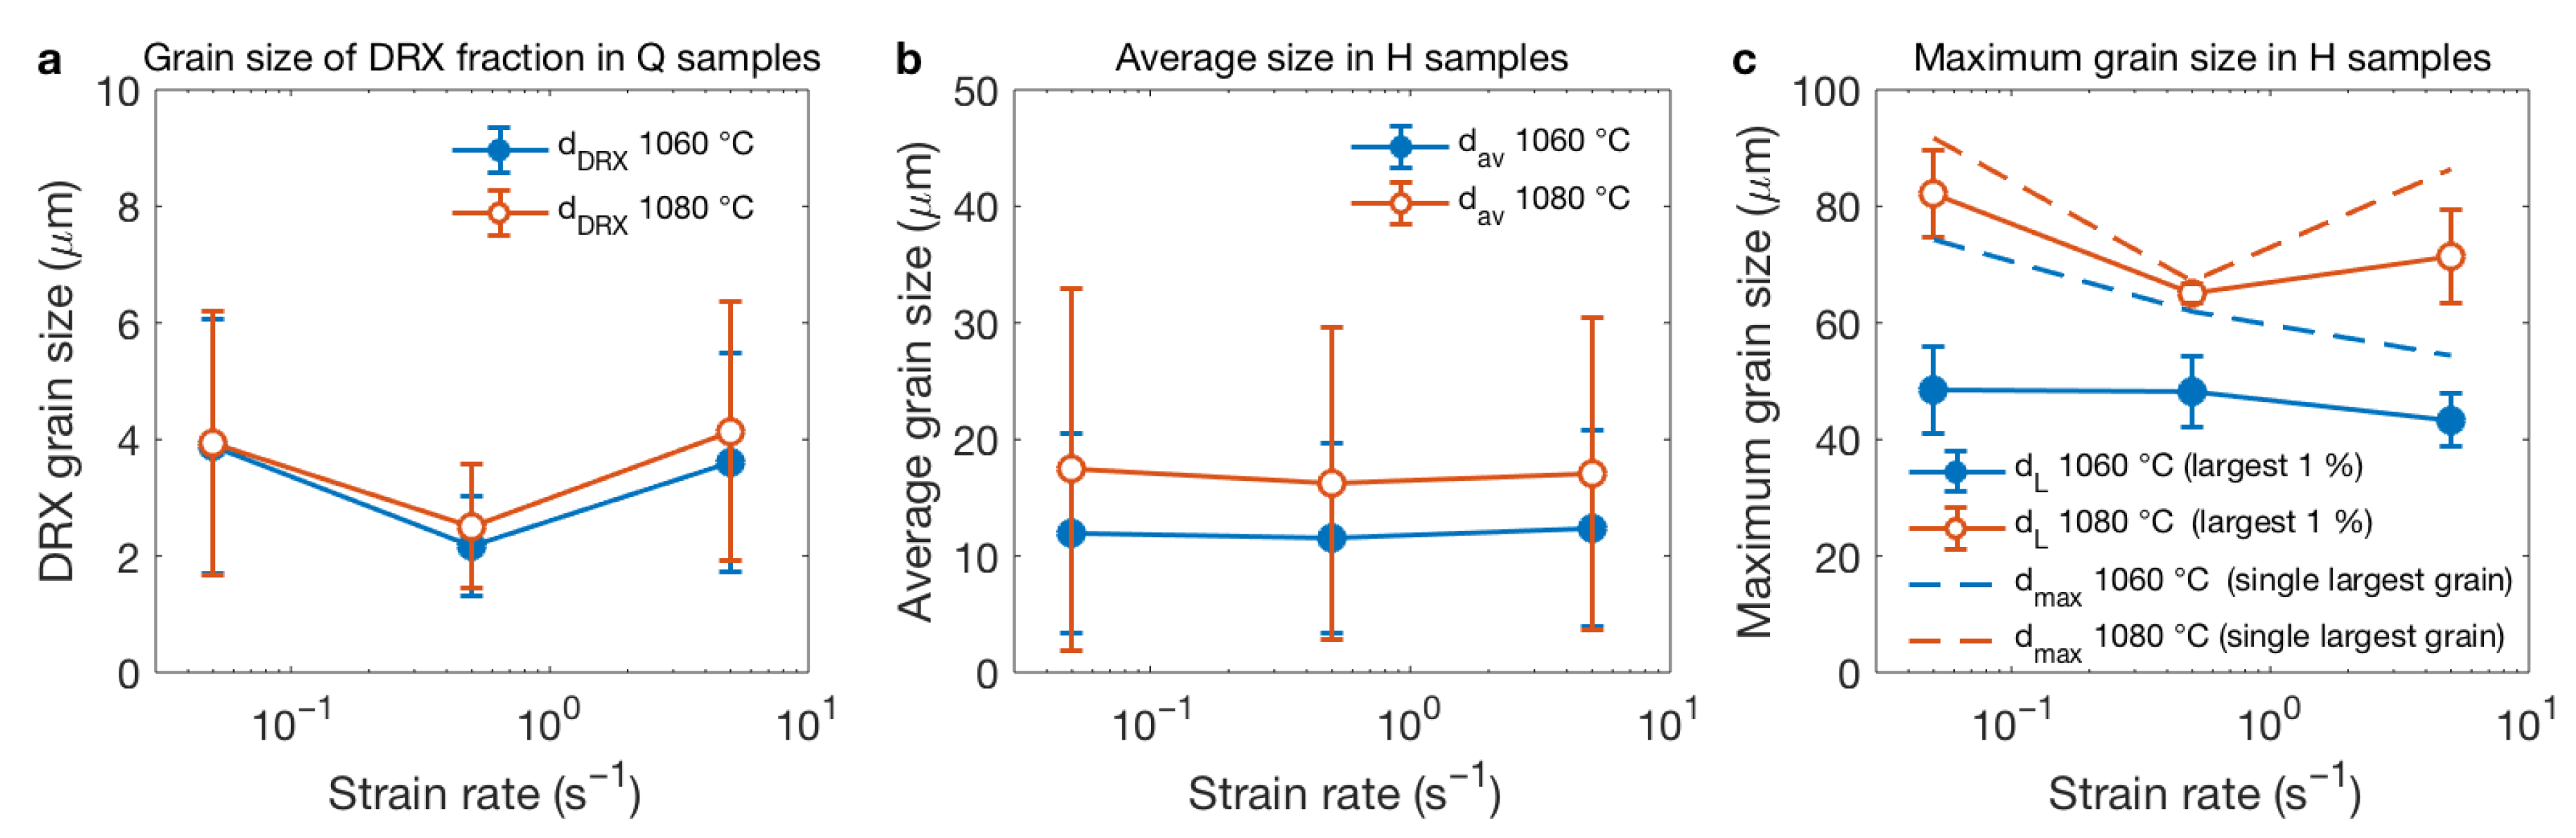
Figure 10a shows the strain rate dependence of the average grain size (equivalent circle diameter) of the DRX fraction in the Q samples, . The difference between 1060 and 1080 °C is negligible, and a minimum can be observed at 0.5 s in both cases. After the post-deformation hold, on the other hand, no effect of strain rate can be seen, whereas the average grain size in the samples deformed at 1080 °C is slightly larger than in those deformed at 1060 °C, Figure 10b, although the spread in grain size is too large to draw firm conclusions. Additionally, looking at the maximum grain size observed after the post-deformation hold, Figure 10c, significantly larger grains were present in the 1080 °C samples. As there was no difference in the average grain size of the DRX fraction for the two temperatures, Figure 10a, this shows that the grain growth occurring during pDRX is strongly temperature dependent. The maximum grain size, measured as the average of the largest 1% of the grains in the data set (), shows a minimum at 0.5 s at 1080 °C, but no such effect is seen at 1060 °C. Only looking at the single largest grain in the data set () gives similar results, although a smaller difference between the temperatures can be observed.
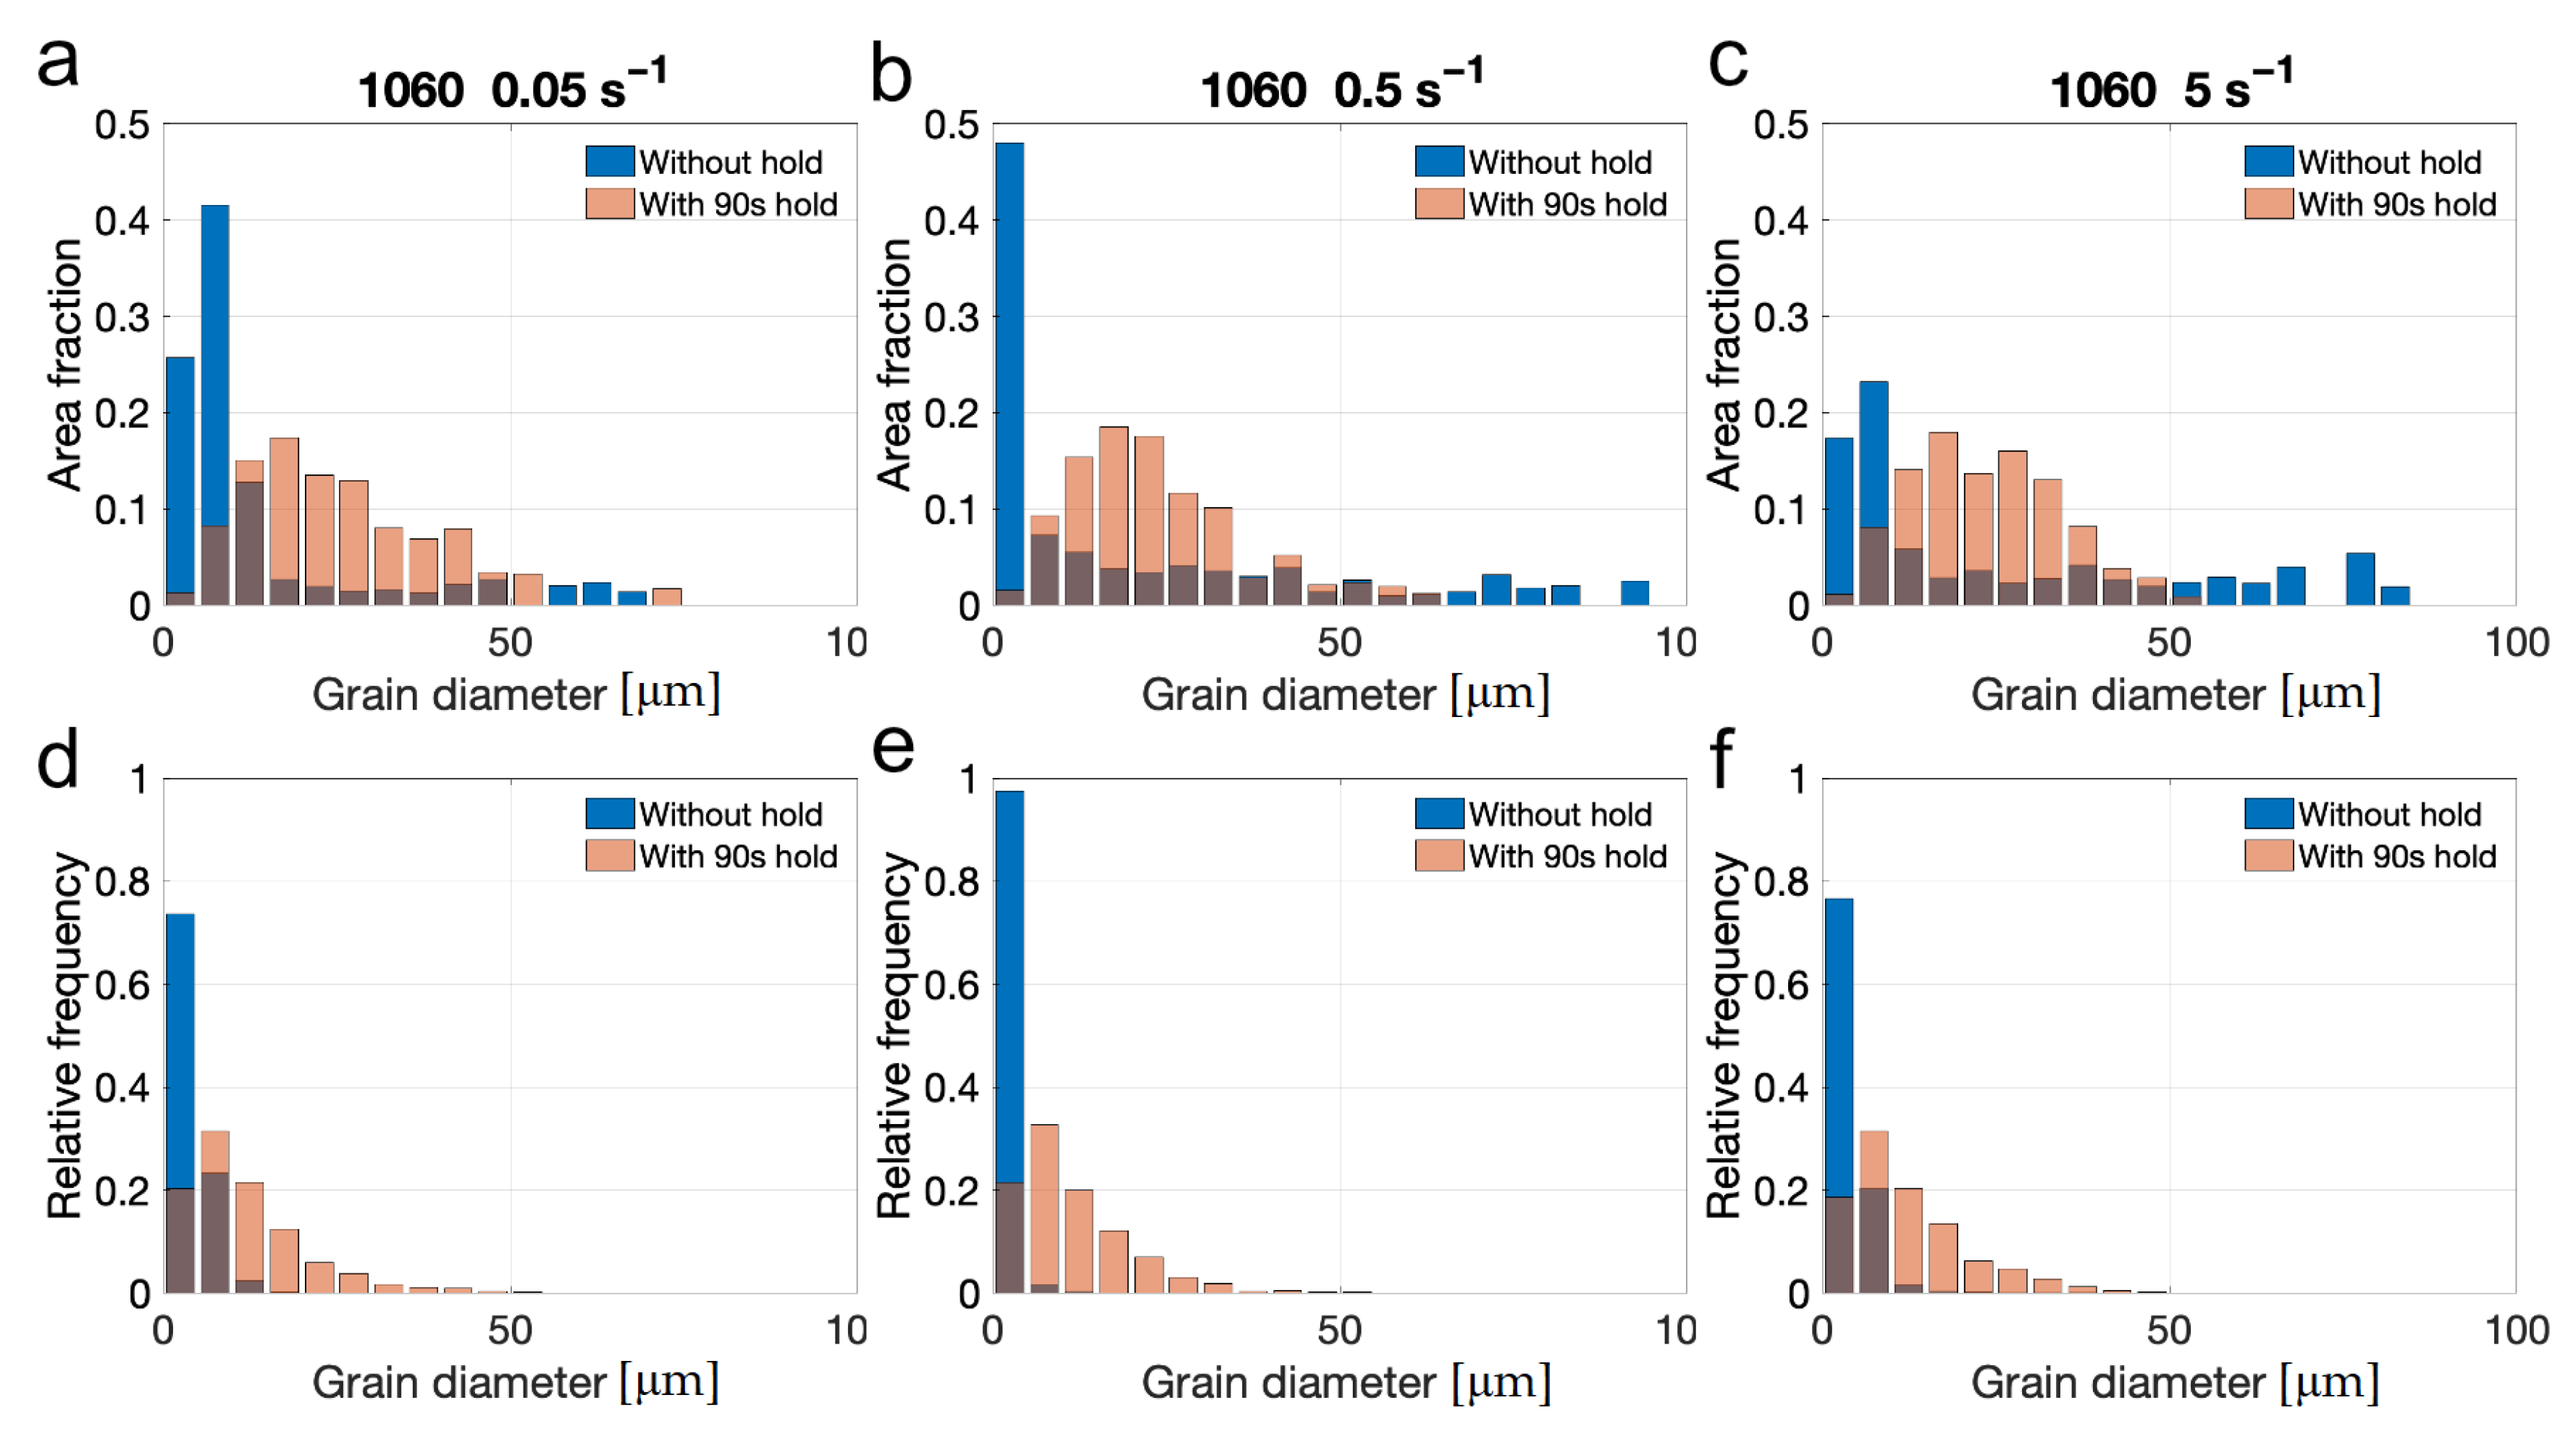
As grain size is not usually normally distributed, the mean and standard deviation does not provide a complete picture. Further information can be obtained from the grain size distributions shown in Figure 11 and Figure 12. The histograms were derived from 500 × 500 μm2 areas, and were not weighted for edge or corner intersection. This is not expected to have a significant impact, since that would predominantly affect the large deformed grains, which are of no interest in the present study. Please note that the x-axis in Figure 11 and Figure 12 are limited to an equivalent circle diameter of 100 μm. Some of the largest grains will fall outside this limit, but since the size of the large deformed grains were of no interest this does not affect the interpretation. All grains (including those outside the axis limits) are included in the calculation of the histograms in Figure 11 and Figure 12.
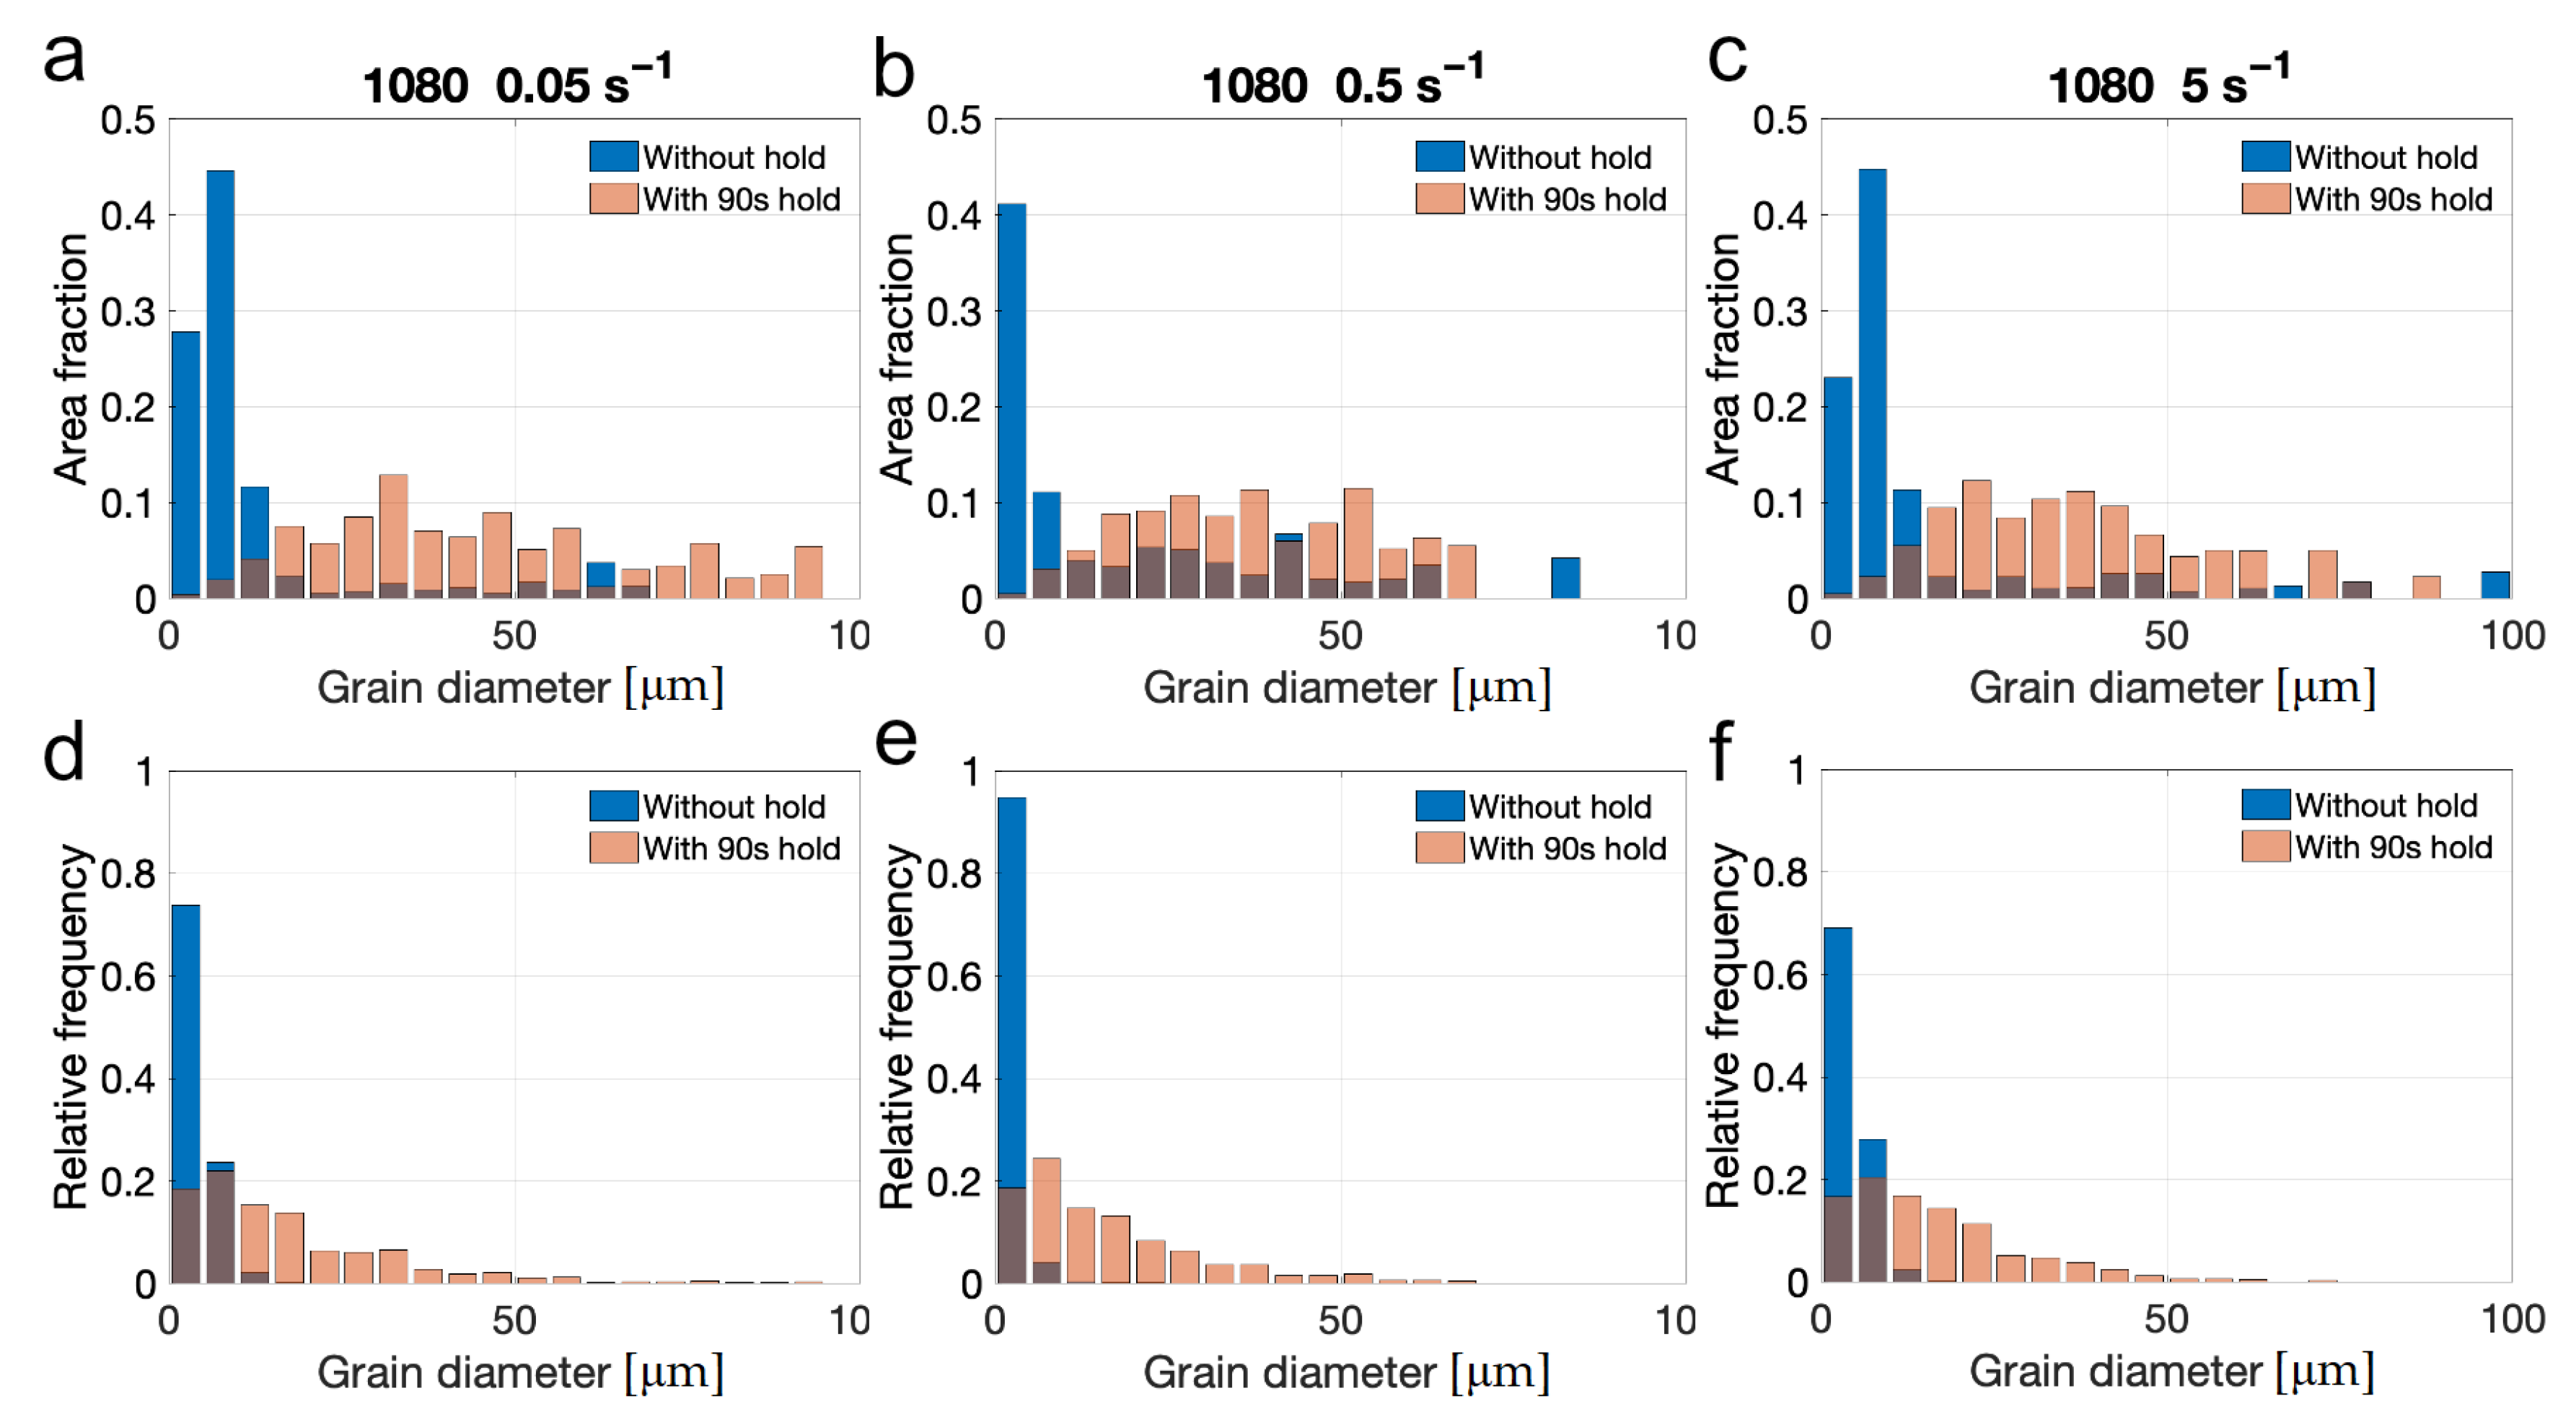
The behavior is similar for both temperatures. In the Q samples, the bin with the highest area fraction of DRX grains is 5–10 μm in samples deformed at 0.05 and 5 s−1, whereas the 0.5 s−1 samples showed a larger fraction in the smallest bin (0–5 μm). This is also seen in the relative frequency distributions, where the frequency in the 0–5 μm bin is highest at 0.5 s−1, indicating a larger number of very small grains. The low area fractions of small DRX grains in the sample deformed at 1060 °C/5 s−1 is an artefact due to the presence of a few very large grains (equivalent diameters around 150 μm, outside the axis limits) occupying a large fraction of the area. This is symptomatic of EBSD grain size measurements from limited areas arising from statistical variations. However, in order to not risk being affected by spatial variations from inhomogeneous strains, strain rates and temperatures we limited the scan area to 500 × 500 μm2 in the central region of the samples.
During the post-deformation hold, the microstructure became more uniform and did not seem affected by the previous strain rate. The relative frequency of grain sizes for the H samples were rather uniform for all strain rates at each temperature, Figure 11d–f and Figure 12d–f. Deformation temperature did have an effect however, as deformation at the higher temperature resulted in a microstructure with a larger maximum size and a wider grain size distribution, which explains the lager error bars for 1080 °C in Figure 10b.
To further study the grain size after DRX and pDRX, Figure 13 shows the relative frequency of the logarithm of the grain size of the DRX fraction in the Q samples and the full data set from the H samples. Here the differences in the distribution of the smallest grains can be clearly seen, where the distribution is shifted to much smaller grain sizes at 0.5 s−1 compared to 0.05 and 5 s−1, which are very similar. The distribution in the H samples is broader at 1080 °C, as previously noted, but here we also see a truncation at smaller grain sizes which will contribute to a slightly larger measured average grain size, as seen in Figure 10b.
3.6. Texture
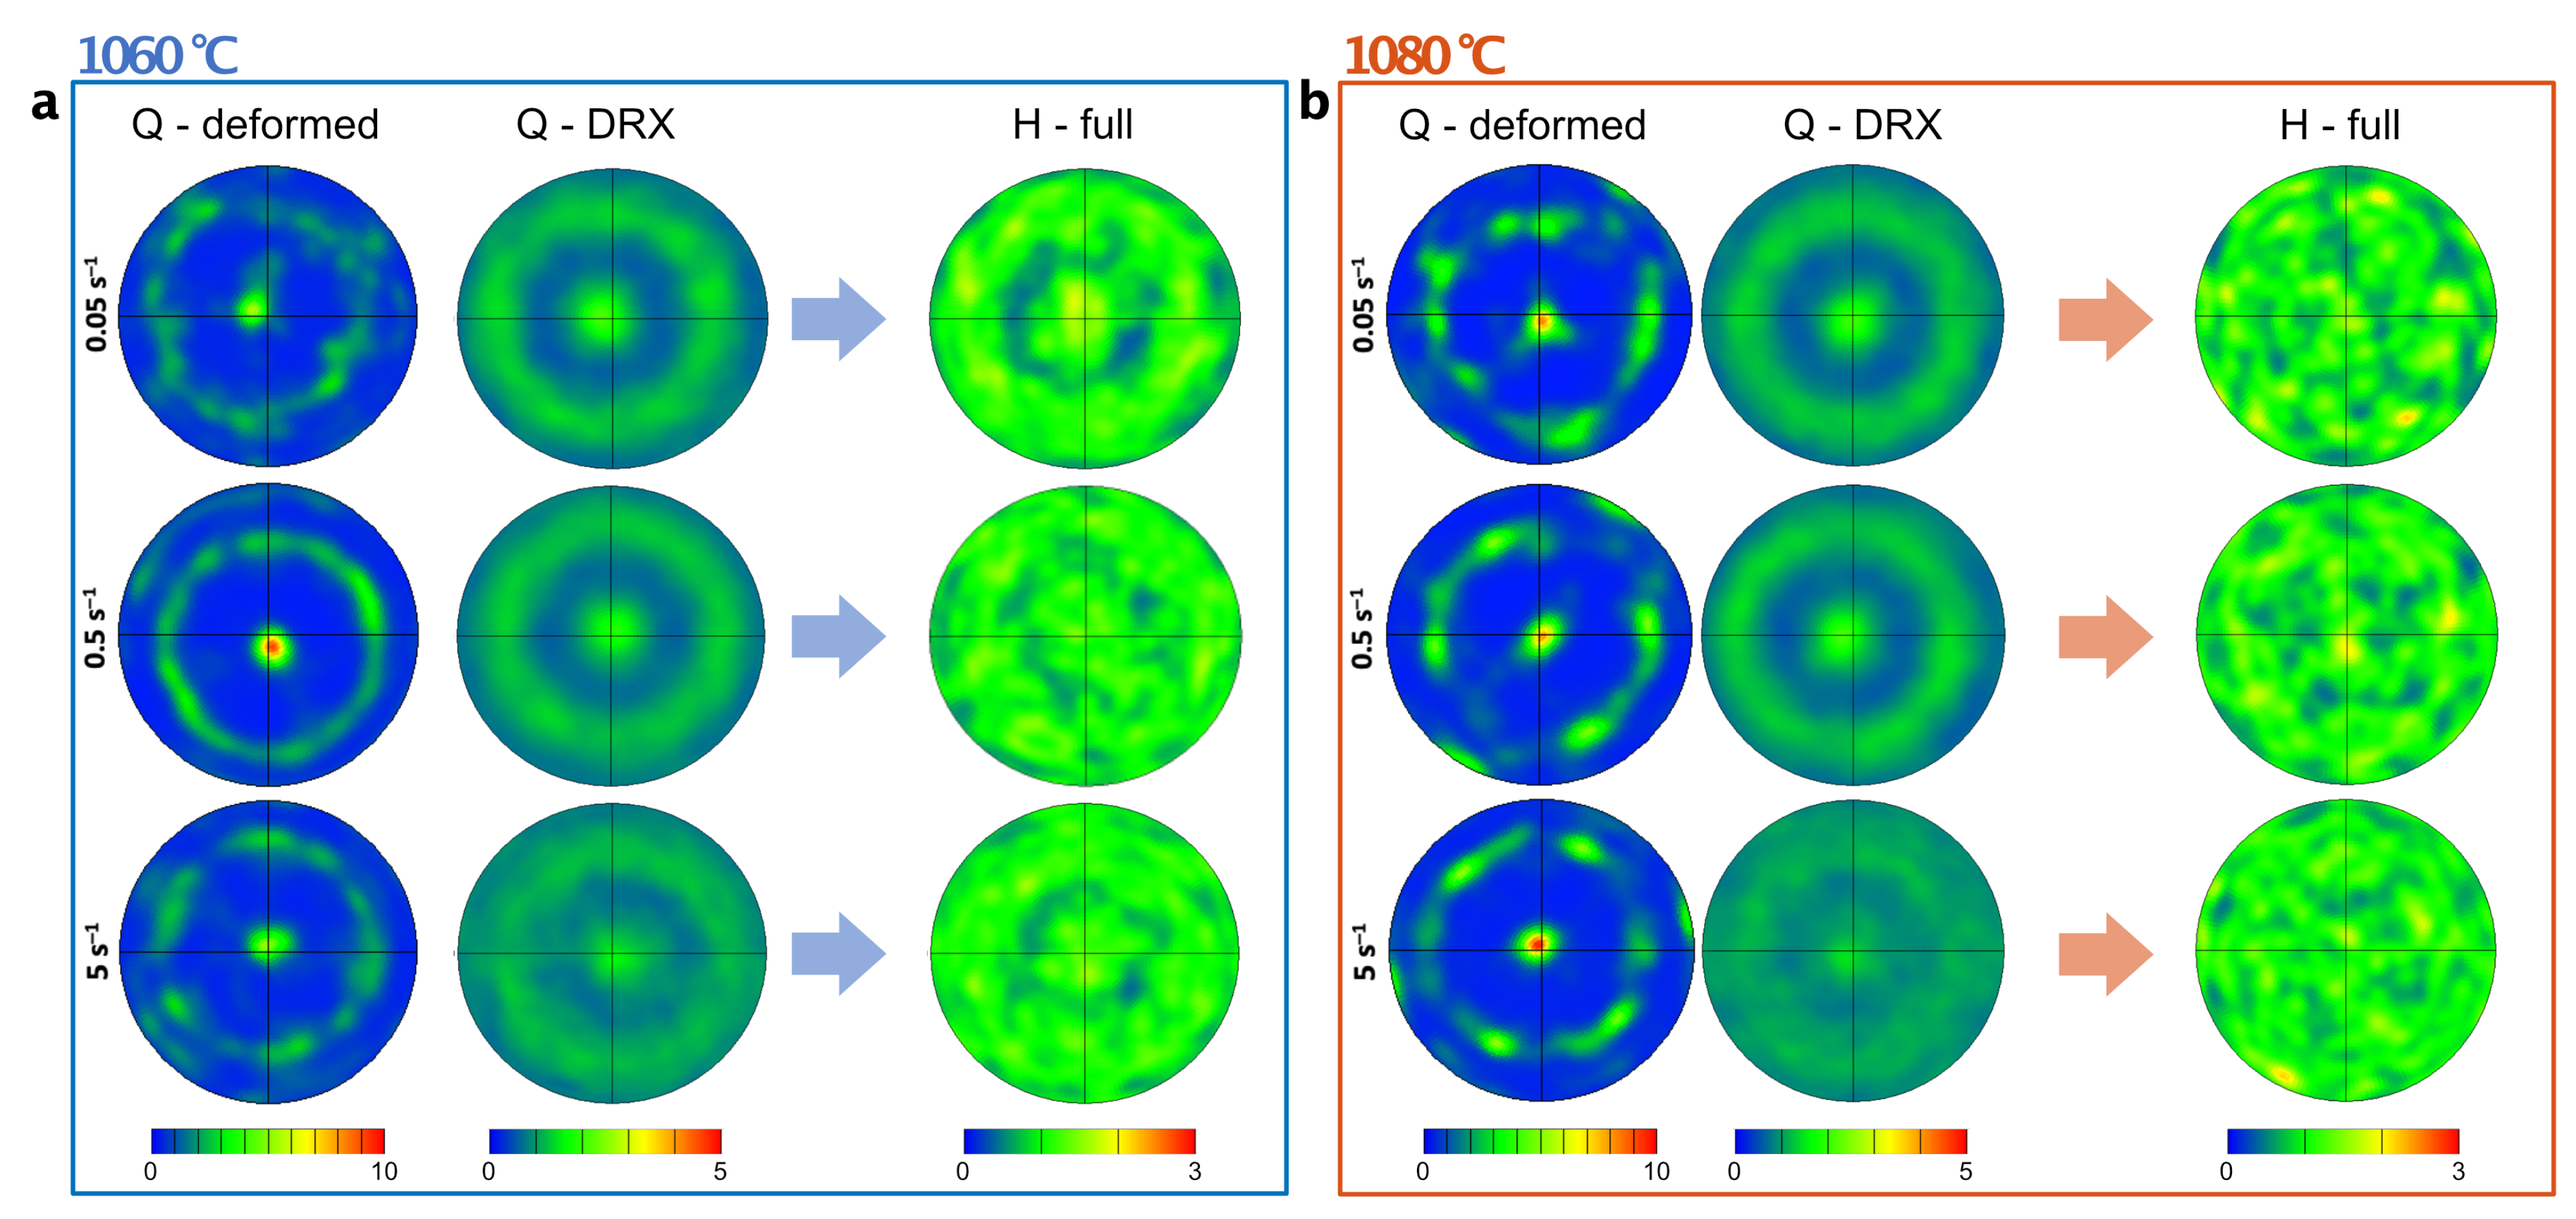
Figure 14 shows the texture after deformation and after post-deformation hold. The deformed grains in the Q samples (left-most columns in Figure 14a,b) show a strong compression ({110}‖ compression axis) fiber texture. This texture, although significantly weaker, is inherited by the DRX grains present in the Q samples (middle columns). This is consistent with typical DRX mechanisms, where the new grains nucleate either from bulging of subgrains (dDRX) or local subgrain rotation (cDRX), both of which would produce a strong relationship between parent and nuclei. The {110} texture is weaker at 5 s compared to the two lower strain rates at both 1060 and 1080 °C.
After the post-deformation hold, samples deformed at 1060 and 1080 °C exhibit significant differences. Traces of the fiber texture is still visible after hold at 1060 °C (rightmost columns in Figure 14a) although weaker and more diffuse compared to the Q condition. After hold at 1080 °C the texture was lost and appears close to random (rightmost columns in Figure 14b). Texture randomization is often connected to the evolution of annealing twins during growth of the recrystallized grains [38], which will be further explored in the discussion.
4. Discussion
4.1. Dynamic Recrystallization
4.1.1. DRX Mechanisms
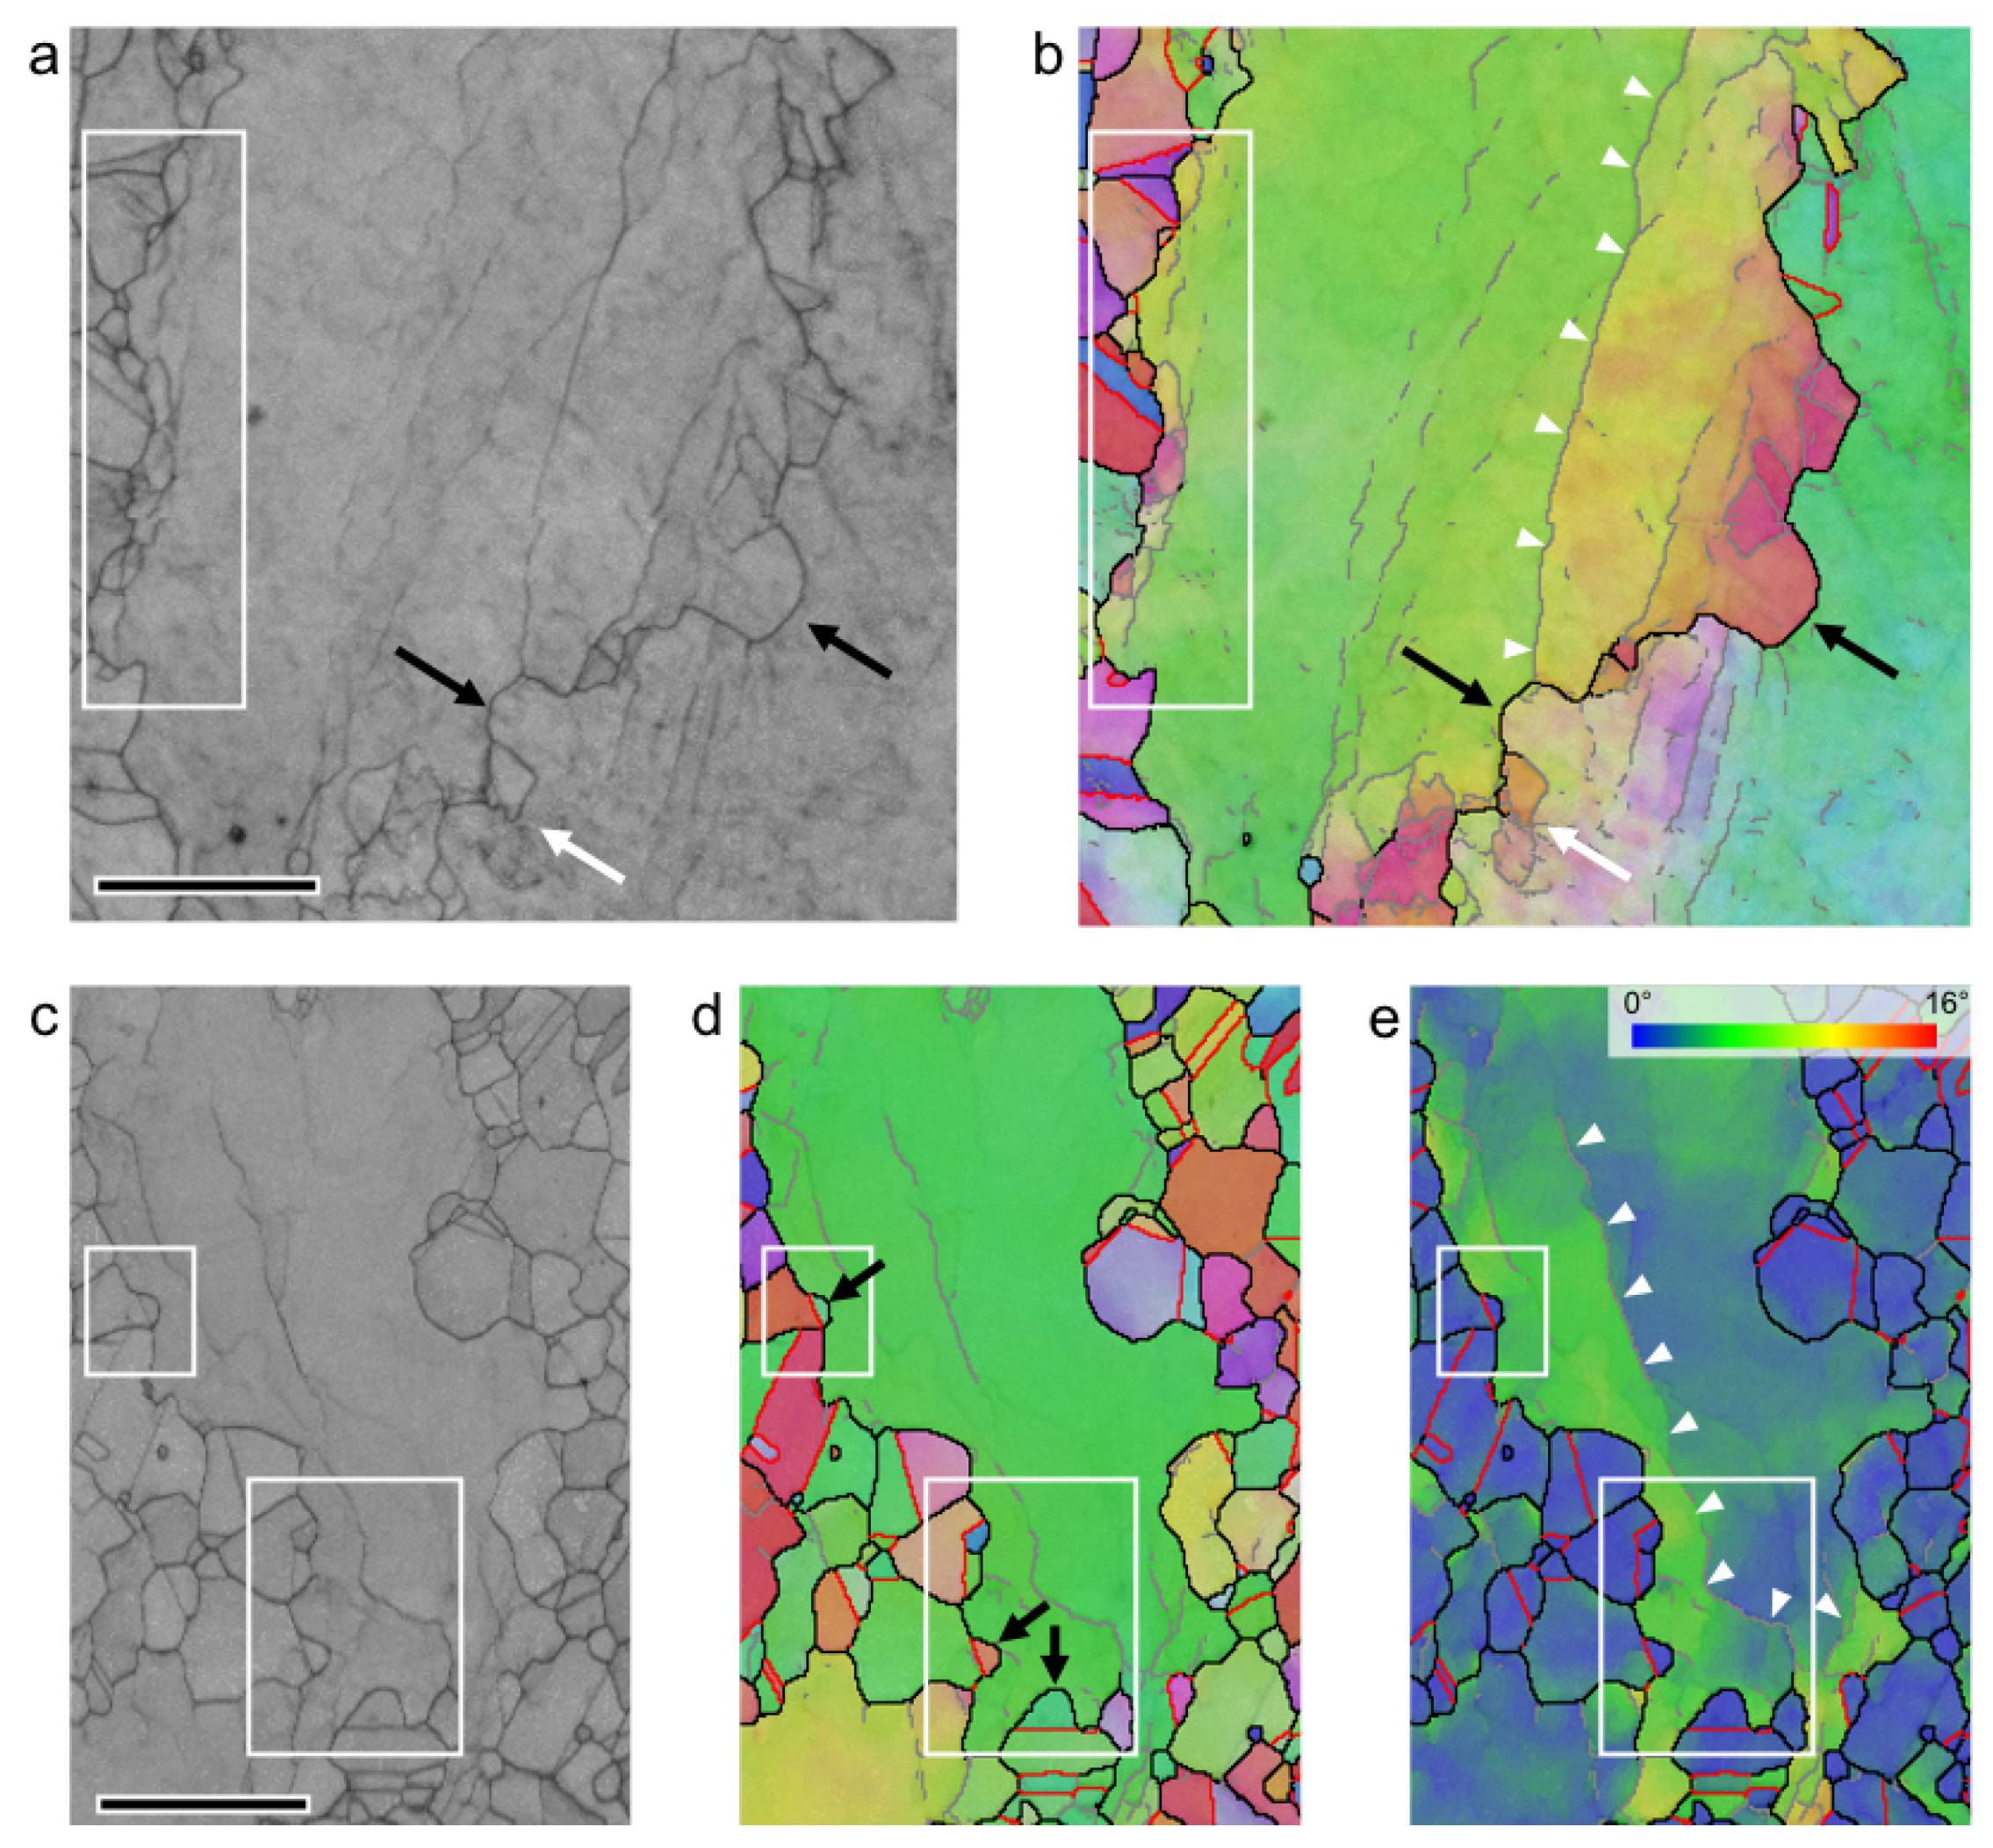
A necklace structure was observed after deformation and quenching for all test conditions, which is usually attributed to the prevalence of dDRX. The nucleation during dDRX occurs through formation and growth of grain boundary serrations and/or growth of subgrains located at grain boundaries [2,3,4,39]. Figure 15a,b show several clear examples of grain boundary serrations extending into neighboring grains (black arrows), typical of dDRX. Interestingly, the bulging occurs from both directions, suggesting that it is the local environment that controls the formation and growth of the serrations, rather than differences on average stored energy within the two grains. In the standard model for dDRX nucleation, the new grain will form due to shear induced boundary formation or twinning, to “cut” the bulging nuclei from the parent grain [2,3,4,39]. Examples of this can be clearly seen in the regions marked by white rectangles in Figure 15c–e, also indicated by black arrows in (d).
The white arrow in Figure 15a points to a subgrain in the process of transforming to a DRX grain by increasing misorientation, without the aid of grain boundary bulging. Multiple small nuclei apparently forming in the same way can be seen in the grain boundary region marked by the white rectangle. Nucleation by progressive subgrain rotation usually occurs during cDRX [2,3,4,39], which typically require much larger strains for activation compared to dDRX. However, it has been reported that the initial stages of cDRX can actually lead to similar microstructures as dDRX as the nucleation events will be confined to the grain boundary regions with higher dislocation density [40,41]. From Figure 15 we can note the concentration of deformation to regions close to the grain boundaries, marked by multiple white arrowheads in Figure 15b,e. The boundaries between the less deformed interiors and the strain concentrations at the grain boundaries is relatively sharp, the orientation changing by some 4–10°.
4.1.2. Particle-Stimulated Nucleation
Beside dDRX and cDRX nucleation at grain boundaries, particle-stimulated nucleation (PSN) at primary MC carbides could occasionally be observed, Figure 16. Although PSN during SRX is frequently reported for numerous alloying systems, and widely studied, it is less often encountered during DRX [39]. It has, however, been reported to occur in e.g., alloys based on Mg [42], Al [43] and Ti [44], as well as low carbon steel [45]. For Ni-base superalloys PSN was reported to occur at carbides during hot working of extremely coarse grained Waspaloy [46], presumably due to limited nucleation possibilities at sparsely distributed grain boundaries. Limited PSN at carbides was also observed in a Ni-30%Fe-Nb-C alloy deformed at 1075 °C [47].
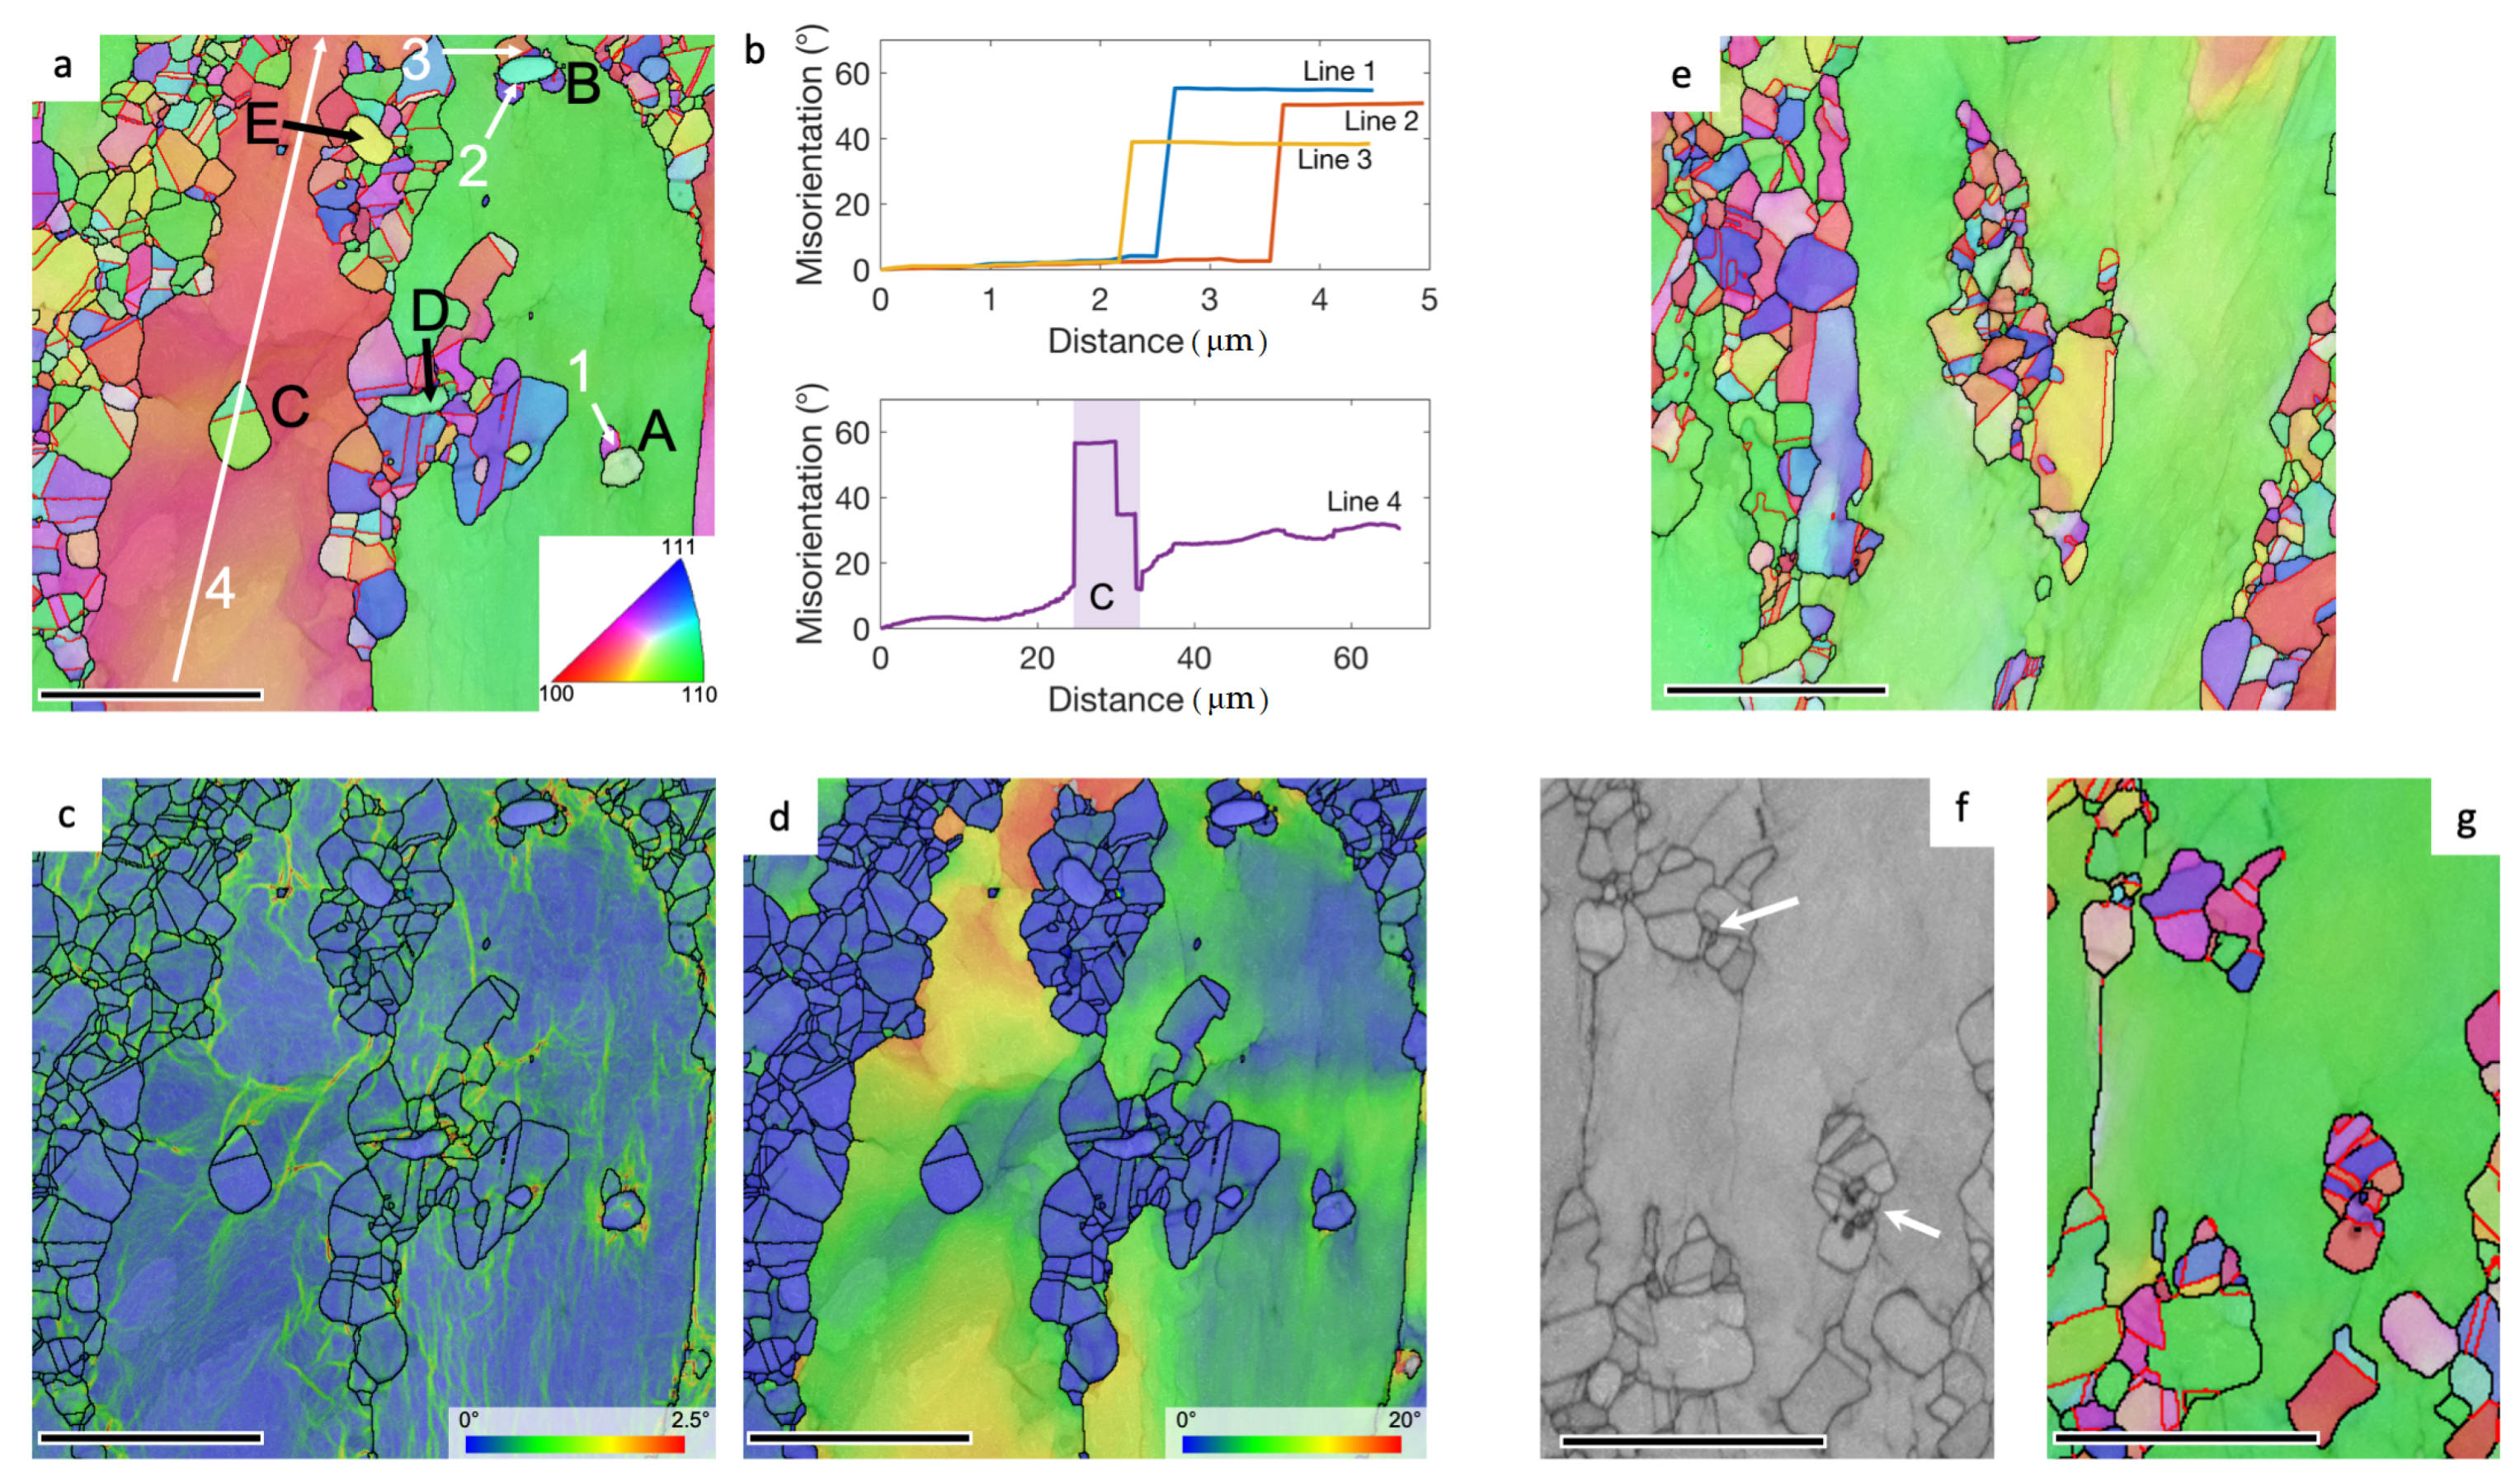
Nucleation of new grains during PSN is facilitated by the dislocation substructure associated with the sharp orientation gradients developed around large (≥2 μm) non-deformable particles [48,49]. In the present case, PSN was observed to occur at carbides both in the interior of deformed grains and at grain boundaries. Figure 16a–d show examples, where small DRX grains can be observed around intragranular carbides (labelled A and B). Interestingly, these new grains have high, sharp misorientation with the surrounding deformed matrix, as shown by the misorientation line profiles for lines 1–3 in Figure 16b (positions of the lines are indicated by white arrows in Figure 16a), which contradicts the proposed mechanisms of nucleation from deformation-induced subgrains formed in the strain gradients around the particles. The kernel average misorientation (KAM, defined as the misorientation between a pixel and its neighbors) map in Figure 16c clearly shows concentration of lattice rotation around carbides A and B. The intragranular DRX nuclei labelled C, on the other hand, does not appear to be connected to a carbide. However, it is possible that the grain is the result of PSN at a carbide located above or below the imaged cross-section. Another possibility is that the grain has nucleated from a band of more concentrated deformation, as indicated in the GROD map in Figure 16d, where the orientation gradients surrounding the new grain are seen to be significant. However, the misorientation measured at the boundary between the surrounding matrix and the recrystallized grain C is very large (line 4 in Figure 16b) indicating that it is likely a result of PSN. The GROD map in Figure 16d also highlights the very inhomogeneous strain distribution in the deformed grains. As shown by the line profile from line 4, Figure 16b, the misorientation changes progressively with a difference of over 30° over a distance of some 70 μm. Carbides D and E appear to have facilitated nucleation at the grain boundary, which is otherwise free of DRX grains. Another example of intragranular PSN is seen in Figure 16e, where a larger grain cluster has developed from carbides. Even small carbides, and clusters of small carbides, can lead to DRX nucleation (indicated by arrows in Figure 16f,g. A general observation is that there is a very high degree of twinning involved in the formation of PSN clusters surrounding carbides. In principle, all DRX grains in the second “layer” around the particle are twin-related to the PSN grains in the first layer.
One should also note that larger second phase particles may act to limit grain growth by grain boundary pinning [39], but due to the very sparse distribution of primary carbides in the present alloy this would only be effective much later, in the grain growth stage. At that point, however, it can have a large impact on the spatial grain size distribution, and if there are process related orientation of carbides (stringers) this may also affect the mechanical anisotropy of the final component [20,21].
4.1.3. Effect of Deformation Conditions
The maximum in the flow stress, , is usually connected to the onset of DRX. Consequently, the strain at which the peak occurs, , is considered to represent the critical strain for DRX. Although the maximum in observed in Figure 4d would suggest that the critical strain is largest for intermediate strain rates, interrupted hot compression test at strain rates above the maximum in Alloy 718 were used to prove that the DRX fraction was negligible even at strains around [37]. It was concluded that at the higher strain rates, where adiabatic heating is pronounced, temperature induced softening sets in before DRX takes place, and is responsible for the early occurrence of the peak stress. As was shown in this study, the temperature increase from adiabatic heating is sustained throughout the test at the highest strain rate, suggesting that also increased softening seen at 5 s−1 could be related to temperature rather than DRX.
Seret et al. [50] developed a LLASS (local linear adaptation of smoothing splines) which significantly improve the noise levels of a grains grain averaged kernel average misorientation (GAKAM) (average KAM value for a grain), which gives an indication of the amount of geometrically necessary dislocations (GND) present in a grain [37], making it possible to separate the older, slightly more strained DRX grains from the newer less strained pDRX grains.
Even in the case of a quench delay of only 2 s, the pDRX contribution to the total measured DRX fraction was considerable at strain rates above 0.1 s−1 at 980 °C. In fact, if the pDRX contribution was disregarded, the commonly observed “critical strain rate” where a minimum in the DRX fraction have been observed [37] vanished and the trend was monotonously decreasing DRX fraction with increasing strain rate, and it was therefore argued that the occurrence of a critical strain rate is solely a result of pDRX. It is difficult to directly compare the present results to those in [37], as the quench delay is considerably shorter in the present case (around 0.5 s), the temperature is higher, and the behavior of the second phase particles are likely different. In Alloy 718, the phase fraction was observed to increase at low strain rates (<0.01 s−1) and decrease within increasing strain rate to below the initial fraction at 0.1 s−1 and above, which would also likely significantly affect the pDRX kinetics. Nevertheless, the results of [37] strongly suggests that the effect of pDRX on the measured DRX volume fraction measured even after what is nominally considered to be directly quenched microstructures is strong.
Considering the above discussion, the strain rate dependence of the DRX behavior can be explained as follows: At low strain rates the longer time during which deformation occurs (14 s at 0.05 s−1) is sufficient for the thermally activated DRX process to occur. This leads to early onset of DRX, high DRX fractions and an average grain size in the recrystallized fraction around 4 μm. When the strain rate is increased, the test duration is shorter (1.4 s at 0.5 s−1) and less time is available for thermally activated processes. The adiabatic heating was more pronounced, and the faster heating process led to a temperature undershoot during the latter parts of the tests as the temperature control system attempted to correct. Consequently, DRX was delayed, DRX fraction was reduced and the average grain size was around 2–2.5 μm. At the highest strain rate, the time was of course even shorter (0.3–0.4 s at 5 s−1) but instead the adiabatic heating allows a rapid temperature increase which cannot be compensated for by the control system within the test duration. This allows mDRX to occur during the post-deformation quench delay to a greater extent than at lower temperatures. Although the temperature rise due to adiabatic heating is similar at both temperatures, the effect is more pronounced at 1080 °C compared to at 1060 °C as the absolute temperature is higher, Figure 3c, leading to faster kinetics of the thermally activated processes. Thus, the DRX, and importantly the mDRX during the quench delay is faster at 1080 °C, which explains the measured DRX fraction at 5 s−1 for the samples tested at 1080 °C, while the fraction continuously decreased with strain rate at 1060 °C. The average DRX grain size increased to around 4 μm again at both temperatures due to the temperature increase.
4.2. Post-Dynamic Recrystallization
4.2.1. pDRX Mechanisms
Post-dynamic recrystallization is a complex phenomenon, where several mechanisms can occur simultaneously. It typically involves mDRX, characterized as growth of grains nucleated during dDRX to consume remaining deformed grains. This differs from the case of SRX in that there is no incubation time, yielding very rapid kinetics. SRX can, however, occur simultaneously [37] with mDRX, although delayed by the nucleation step. In addition, SRV of work hardened DRX grains can take place during pDRX. In Ni-base superalloys, the pDRX kinetics will generally depend on strain, strain rate and temperature [51]. Tang et al. [52] showed that the evolution of the pDRX fraction with post-deformation holding time in a Ni-based superalloy deformed to a strain of 0.357 was strongly temperature dependent in the range 950–1100 °C, but only weakly dependent on the strain rate (0.01–1 s−1) at 1050 °C. Zouari et al. [53] used quasi-in situ EBSD (repeated heating of deformed Inconel 718 specimens inside an SEM with intermittent EBSD mapping of the same region) to show that a specimen with initial DRX fraction of 0.26 (strain of 0.55) was fully recrystallized after around 60 s at 1020 °C, whereas full recrystallization was achieved after less than 20 s in a specimen with initial DRX fraction of 0.65 (strain of 2.0). Importantly, the in situ experiments in [53] suggested that consumption of deformed grains by growing DRX grains during mDRX, rather than SRX, was the dominating mechanism behind the pDRX microstructure evolution. Also, Nicolay et al. reported a strong strain rate dependence of the pDRX kinetics of Inconel 718 samples deformed to a strain 0.7 at 980 °C, and concluded that for strain rates above 0.1 s−1 it is very unlikely that SRX plays a role [37]. In the present case, the similarity between the microstructures observed at all strain rates suggest that there are no major changes in the dominant pDRX mechanism, which in turn indicate that mDRX is the most important process under all conditions tested here.
4.2.2. Twinning and Texture Development
The texture weakening and randomization as a result of DRX is well known. Wusatowska et al. [54] reported weakening of the compression texture after DRX, and it has been suggested and proven by simulations that multiple twinning during grain growth can drastically randomize the texture even from a limited set of initial orientations [38]. The pole figures in Figure 14 clearly show that the texture of the DRX fraction is significantly weaker compared to the deformed fraction. The deformation texture is nevertheless still visible, but disappears almost completely after pDRX at 1060 °C, and completely at 1080 °C.
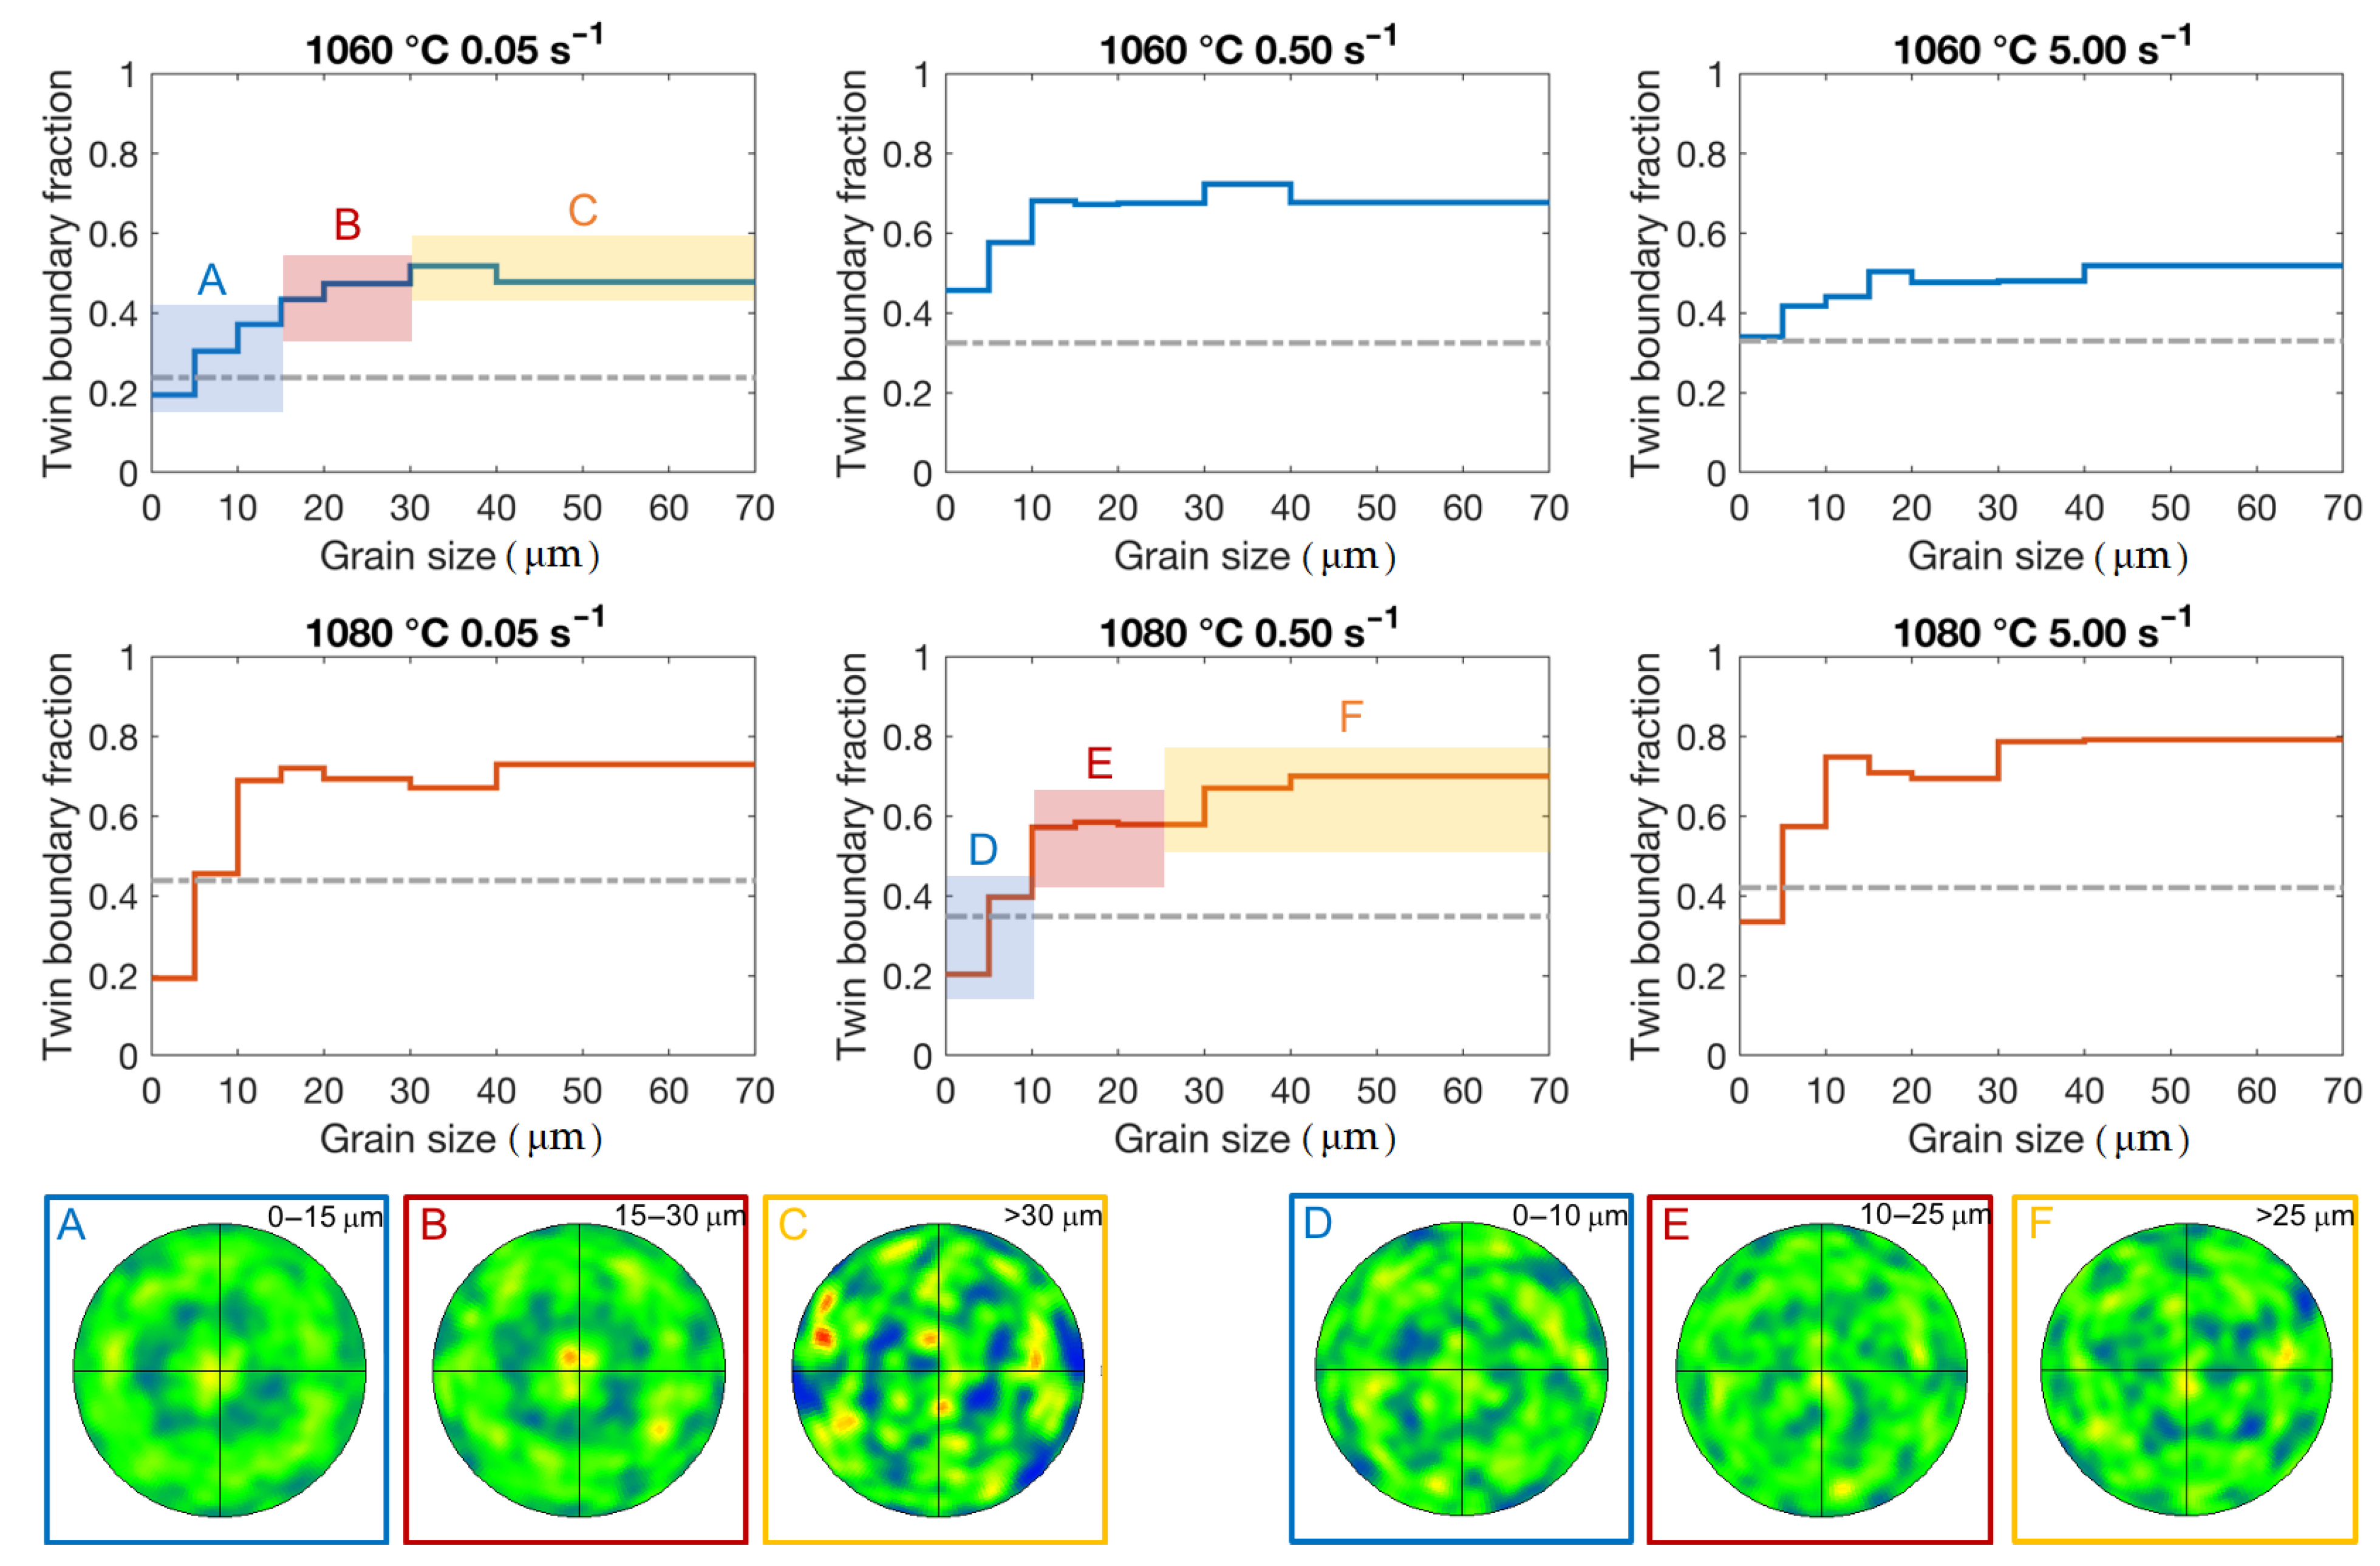
To further elucidate the origin of texture randomization in the present case, Figure 17 shows the fraction of twin boundaries after pDRX, measured in subsets with different grain size. Assuming that the randomization is a result of twin formation during mDRX, one would expect an increasing fraction of twin boundaries with increasing grain size and a corresponding weakening of texture in the subsets. The increasing twin boundary fraction with increasing grain size is directly confirmed in all cases, with (in general) fractions being slightly higher at 1080 °C. The twin boundary fractions in the DRX grains of the Q samples were in the order of 0.1–0.2, but the measure is unreliable. Measuring twin boundary fraction from high resolution images results in values in the higher end of the range, but with limited statistics, whereas lower resolution maps provide better statistics but will inevitably result in lower numbers as many boundaries in the smaller grains are not resolved. In any case, it is clear that the twin boundary fraction rapidly increases with grain size and becomes almost constant at a size of around 10–20 μm. Please note that the average twin boundary fraction is in some cases lower than the fraction in the individual subsets, Figure 17, which is explained by the fact that the software only considers boundaries between grains within the subset when calculating the twin boundary fraction, thereby ignoring boundaries separating grains within the subset from grains outside the subset.
Looking at the pole figures from three subsets extracted from samples deformed at 1060 °C/0.05 s−1 and 1080 °C/0.5 s−1 (A–C) and (D–F), respectively, in Figure 17, it can be seen that the {110} texture remains in the 1060 °C samples until the saturation twin boundary fraction have been reached, whereas texture is lost earlier in the 1080 °C sample. These two samples were chosen as they provided the best statistics for the different subsets used for pole figure calculations, but a direct comparison is difficult, as the saturation twin boundary fraction for the 1060 °C sample was around 0.5, which is exceeded already in the subset corresponding to E for the 1080 °C sample. Although more suitable microstructures should be generated by dedicated hot compression/pDRX tests to investigate this in detail, these results nevertheless suggest that the texture randomization is indeed a result of twinning during growth of DRX grains (mDRX) during the post-deformation hold. As the process is faster at 1080 °C, the randomization is more effective.
The fraction of twin boundaries in a Ni-base superalloy deformed to a strain of 0.357 at a strain rate of 0.1 s−1 and a temperature of 1050 °C, was reported to initially increase with holding time, but remained constant after 30 s [52]. An increased holding temperature significantly increased the twin boundary fraction at constant time. The twin boundary density in Inconel 718 increased during pDRX at 1020 °C until the structure was fully recrystallized and then decreased [53]. However, the use of twin boundary density (mm/mm2), rather than twin boundary fraction, means that as the average grain size continuously increased after full recrystallization the total grain boundary density also decreases. As both total grain boundary density and twin boundary density decreased (but only the latter was reported) the evolution of their ratio (the twin boundary fraction) is not clear. The difference can be seen in e.g., [55] and [7], where the two measures in many cases show different, or even opposite, behavior. Zhang et al. [7] reported continuously increasing twin boundary fraction with increasing temperature up to 1100 °C, and a saturation at strain rates above 0.01 s−1 at 1160 °C. At higher strain rates (above 1 s−1, which was the maximum strain rate in [7]) the same group reported that the twin boundary fraction reached a minimum at 1 s−1 and then increased again [56]. A direct connection between DRX grain size and twin boundary fraction was reported by [55], showing that the twin boundary fraction saturated when the DRX grain size reached approximately 5 μm. In the studied system, this DRX grain size corresponded to a fully, or almost fully, recrystallized structure. Notably, beyond this grain size the twin boundary density decreased with increasing grain size, presumably due to the reduced density of grain boundaries with grain growth.
In conclusion, these results show that care must be taken when comparing results between studies, as many factors (including the metric used for reporting) may impact the interpretation. However, we can conclude that an increased grain size typically leads to an increased twin boundary fraction during the mDRX part of pDRX, followed by saturation during subsequent grain growth. The twin boundary density typically decreases during the grain growth stage due to a decrease in the total grain boundary density. This agrees with the present observation that the texture randomization occurs through twin formation in the smaller mDRX grains. As the grain size during mDRX reach about 10–15 μm no further twins are generated (the twin boundary fraction remains constant) and the orientations of these larger mDRX grains is approximately random. It can then be speculated that as the larger (randomly textured) grains should grow at the expense of the smaller ones (with traces of the deformation texture remaining), the final texture should further randomize at longer times or subsequent annealing/heat treatments, even in the case where the pDRX structure contains deformation texture components. We do not observe any clear trend in the total twin boundary fraction development with strain rate, but the measured fractions were indeed higher at 1080 °C than at 1060 °C. At 1080 °C we do observe a minimum in the twin boundary fraction at the intermediate strain rate, similar to [56]. However, the situation is complicated by the previous discussion regarding adiabatic heating, as there might be an effect of the increased temperatures during the initial stage of pDRX for the 1080 °C samples deformed at 5 s−1.
4.3. Comment on Grain Boundary Carbides
In the present investigation the microstructure observed after hot deformation in the sub-solvus temperature range could be well understood by effectively considering the material as single-phase, and explicit effects of grain boundary carbides were not considered in detail. Nevertheless, there are several different mechanisms through which the carbides could exert an influence on the DRX process. It is, for example, possible that carbides could stimulate DRX nucleation at the grain boundaries by locally modifying the dislocation structure, or pin newly formed grain boundaries in the very early phases of DRX. A major impact on grain growth during mDRX is not expected, as the original grains are very large and the DRX volume fraction is high in all cases, which presumable leaves the prior grain boundaries in positions far from the DRX fronts in the old grains. Another possibility is that the combination of severe deformation and adiabatic heating could allow dissolution of the carbides, at least at the higher strain rates. Further dedicated tests aimed at separating thermal contributions from effects of grain boundary carbides, e.g., through development of test protocols allowing material with carbide-free grain boundaries to be tested at sub-solvus temperatures, would allow a deeper insight into this matter.
5. Conclusions
Samples of the Ni-base superalloy Haynes 282 were subjected to hot compression tests at two different temperatures (1060 °C and 1080 °C) below the grain boundary carbide solvus at three different strain rates (0.05 s, 0.5 s and 5 s), with and without a 90 post-deformation hold at the target temperature. The microstructure was characterized both after deformation and after hold. The following could be concluded:
- For the lower strain rates, 0.05 and 0.5 s the governing factor affecting the resulting microstructure during deformation was strain rate. At 5 s, the DRX fraction was strongly dependent on temperature, which was attributed to adiabatic heating effects.
- We found that the entire temperature history during deformation has to be considered, not just the temperature increase due to adiabatic heating. In the present case, the control system’s response to the rapid temperature increase led to an undershoot in temperature for the second half of the test duration at intermediate strain rates, which affected the material response.
- After 90 s post-deformation hold at the deformation temperature, the effect of strain rate on the microstructure observed directly after deformation was erased due to pDRX, and the grain size was controlled by the temperature.
- During DRX, three mechanisms were observed, dDRX along grain boundaries between deformed grains, cDRX close to grain boundaries and PSN with large, primary MC carbides acting as nucleation sites.
- During the subsequent hold, grain growth and twinning occurred which led to an increase in the twin boundary fraction and a loss of the {110} fiber texture developed during deformation and retained during DRX. This was more prominent with the samples deformed at 1080 °C suggesting this to be a temperature dependent process.
Author Contributions
E.E.: conceptualization, methodology, investigation, formal analysis, visualization, writing–original draft preparation; M.H.C.: conceptualization, methodology, formal analysis, visualization, writing–review and editing, supervision, project administration, funding acquisition. All authors have read and agreed to the published version of the manuscript.
Funding
The funding for the present work has been provided by the Swedish Agency for Innovation (VINNOVA), through the Swedish National Aeronautical Research Program (NFFP) grant no. 2017-04863, in collaboration with GKN Aerospace Engine Systems AB.
Data Availability Statement
The data from this study has not been made available.
Acknowledgments
This work was performed in part at the Chalmers Materials Analysis Laboratory, CMAL. Joel Andersson at University West (Trollhättan Sweden) is kindly acknowledged for providing access to the Gleeble. Kjell Hurtig and Fabian Hanning are acknowledged for assistance with the Gleeble testing. Adrianna Lozinko at Chalmers University of Technology (Göteborg, Sweden) is acknowledged for her help with the muffle furnace.
Conflicts of Interest
The authors declare no conflict of interest.
References
- Reed, R.C. Superalloys: Fundamentals and Applications; Cambridge University Press: Cambridge, UK, 2006. [Google Scholar]
- Doherty, R.; Hughes, D.; Humphreys, F.; Jonas, J.; Jensen, D.; Kassner, M.; King, W.; McNelley, T.; McQueen, H.; Rollett, A. Current issues in recrystallization: A review. Mater. Sci. Eng. A 1997, 238, 219–274. [Google Scholar] [CrossRef] [Green Version]
- Sakai, T.; Belyakov, A.; Kaibyshev, R.; Miura, H.; Jonas, J.J. Dynamic and post-dynamic recrystallization under hot, cold and severe plastic deformation conditions. Prog. Mater. Sci. 2014, 60, 130–207. [Google Scholar] [CrossRef] [Green Version]
- Huang, K.; Logé, R. A review of dynamic recrystallization phenomena in metallic materials. Mater. Des. 2016, 111, 548–574. [Google Scholar] [CrossRef]
- Cao, Y.; Di, H.; Zhang, J.; Zhang, J.; Ma, T.; Misra, R. An electron backscattered diffraction study on the dynamic recrystallization behavior of a nickel–chromium alloy (800H) during hot deformation. Mater. Sci. Eng. A 2013, 585, 71–85. [Google Scholar] [CrossRef]
- Lin, Y.; Wu, X.Y.; Chen, X.M.; Chen, J.; Wen, D.X.; Zhang, J.L.; Li, L.T. EBSD study of a hot deformed nickel-based superalloy. J. Alloy. Compd. 2015, 640, 101–113. [Google Scholar] [CrossRef]
- Zhang, H.; Zhou, H.; Qin, S.; Liu, J.; Xu, X. Effect of deformation parameters on twinning evolution during hot deformation in a typical nickel-based superalloy. Mater. Sci. Eng. A 2017, 696, 290–298. [Google Scholar] [CrossRef]
- Pike, L. Development of a Fabricable Gamma Prime Gamma Prime Strengthened Superalloy. Superalloys 2008, 191–200. [Google Scholar] [CrossRef]
- Osoba, L.O.; Khan, A.K.; Ojo, O.A. Identification of Mo-based Precipitates in Haynes 282 Superalloy. Metall. Mater. Trans. A 2017, 48, 1540–1543. [Google Scholar] [CrossRef]
- Joesph, C.; Persson, C.; Hörnqvist Colliander, M. Influence of heat treatment on the microstructure and tensile properties of Ni-base superalloy Haynes 282. Mater. Sci. Eng. A 2017, 679, 520–530. [Google Scholar] [CrossRef] [Green Version]
- Jaladurgam, N.R.; Li, H.; Kelleher, J.; Persson, C.; Steuwer, A.; Colliander, M.H. Microstructure-dependent deformation behaviour of a low γ′ volume fraction Ni-base superalloy studied by in-situ neutron diffraction. Acta Mater. 2020, 183, 182–195. [Google Scholar] [CrossRef]
- Mukherjee, S.; Barat, K.; Sivaprasad, S.; Tarafder, S.; Kar, S.K. Elevated temperature low cycle fatigue behaviour of Haynes 282 and its correlation with microstructure–Effect of ageing conditions. Mater. Sci. Eng. A 2019, 762, 138073. [Google Scholar] [CrossRef]
- Shin, K.Y.; Kim, J.H.; Terner, M.; Kong, B.O.; Hong, H.U. Effects of heat treatment on the microstructure evolution and the high-temperature tensile properties of Haynes 282 superalloy. Mater. Sci. Eng. A 2019, 751, 311–322. [Google Scholar] [CrossRef]
- Barat, K.; Ghosh, M.; Sivaprasad, S.; Kar, S.K.; Tarafder, S. High-Temperature Low-Cycle Fatigue Behavior in HAYNES 282: Influence of Initial Microstructure. Metall. Mater. Trans. A 2018, 49, 5211–5226. [Google Scholar] [CrossRef]
- Zhang, P.; Yuan, Y.; Yin, H.; Gu, Y.; Wang, J.; Yang, M.; Yang, G.; Song, X. Tensile Properties and Deformation Mechanisms of Haynes 282 at Various Temperatures. Metall. Mater. Trans. A 2018, 49, 1571–1578. [Google Scholar] [CrossRef]
- Hanning, F.; Khan, A.K.; Steffenburg-Nordenström, J.; Ojo, O.; Andersson, J. Investigation of the Effect of Short Exposure in the Temperature Range of 750–950 °C on the Ductility of Haynes® 282® by Advanced Microstructural Characterization. Metals 2019, 9, 1357. [Google Scholar] [CrossRef] [Green Version]
- Rozman, K.A.; Holcomb, G.R.; Carney, C.S.; Doğan, Ö.N.; Kruzic, J.J.; Hawk, J.A. Effect of 730 °C Supercritical Fluid Exposure on the Fatigue Threshold of Ni-Based Superalloy Haynes 282. J. Mater. Eng. Perform. 2019, 28, 4335–4347. [Google Scholar] [CrossRef]
- Polkowska, A.; Polkowski, W.; Warmuzek, M.; Cieśla, N.; Włoch, G.; Zasada, D.; Purgert, R.M. Microstructure and Hardness Evolution in Haynes 282 Nickel-Based Superalloy During Multi-variant Aging Heat Treatment. J. Mater. Eng. Perform. 2019, 28, 3844–3851. [Google Scholar] [CrossRef] [Green Version]
- Haas, S.; Andersson, J.; Fisk, M.; Park, J.S.; Lienert, U. Correlation of precipitate evolution with Vickers hardness in Haynes 282 superalloy: In-situ high-energy SAXS/WAXS investigation. Mater. Sci. Eng. A 2018, 711, 250–258. [Google Scholar] [CrossRef] [Green Version]
- Joseph, C.; Hörnqvist, M.; Persson, C. Anisotropy of room temperature ductility in Haynes 282 Forgings. In Proceedings of the 8th International Symposium on Superalloy 718 and Derivatives, Pittsburgh, PA, USA, 28 September–1 October 2014; pp. 601–609. [Google Scholar]
- Joseph, C.; Hörnqvist, M.; Brommesson, R.; Persson, C. Influence of carbide distribution on ductility of Haynes282 forgings. In Proceedings of the 13th International Symposium on Superalloys, Seven Springs, PA, USA, 11–15 September 2016; pp. 523–529. [Google Scholar]
- Gardner, S.; Li, W.; Coleman, M.; Johnston, R. The effects of thermomechanical history on the microstructure of a nickel-base superalloy during forging. Mater. Sci. Eng. A 2016, 668, 263–270. [Google Scholar] [CrossRef] [Green Version]
- Metzler, D.; Fahrmann, M.G. The Effect of Prior TMP on Annealed Grain Size in HAYNES 282 Alloy. In 8th International Symposium on Superalloy 718 and Derivatives; John Wiley and Sons, Ltd.: Hoboken, NJ, USA, 2014; pp. 379–389. [Google Scholar] [CrossRef]
- Shi, Z.; Yan, X.; Duan, C.; Tang, C.; Pu, E. Characterization of the Hot Deformation Behavior of a Newly Developed Nickel-Based Superalloy. J. Mater. Eng. Perform. 2018, 27, 1763–1776. [Google Scholar] [CrossRef]
- Joseph, C. Microstructure Evolution and Mechanical Properties of Haynes 282; Doktorsavhandlingar vid Chalmers Tekniska Högskola. Ny Serie: 4382; Chalmers University of Technology: Göteborg, Sweden, 2018. [Google Scholar]
- Chamanfar, A.; Jahazi, M.; Gholipour, J.; Wanjara, P.; Yue, S. Evolution of flow stress and microstructure during isothermal compression of Waspaloy. Mater. Sci. Eng. A 2014, 615, 497–510. [Google Scholar] [CrossRef]
- Buckingham, R.; Argyrakis, C.; Hardy, M.; Birosca, S. The effect of strain distribution on microstructural developments during forging in a newly developed nickel base superalloy. Mater. Sci. Eng. A 2016, 654, 317–328. [Google Scholar] [CrossRef] [Green Version]
- Amiri, A.; Sadeghi, M. Characterization of Hot Deformation Behavior of AMS 5708 Nickel-Based Superalloy Using Processing Map. J. Mater. Eng. Perform. 2013, 22, 3940. [Google Scholar] [CrossRef]
- Yu, D.; Xu, D.; Wang, H.; Zhao, Z.; Wei, G.; Yang, R. Refining constitutive relation by integration of finite element simulations and Gleeble experiments. J. Mater. Sci. Technol. 2019, 35, 1039–1043. [Google Scholar] [CrossRef]
- Gao, T.; Ma, L.; Peng, X.-G. Study on Temperature Distribution of Specimens Tested on the Gleeble 3800 at Hot Forming Conditions. J. Electron. Sci. Technol. 2014, 12, 419. [Google Scholar]
- Zhou, L.; Cui, C.; Wang, Q.; Li, C.; Xiao, B.; Ma, Z. Constitutive equation and model validation for a 31vol.% B4Cp 6061Al composite during hot compression. J. Mater. Sci. Technol. 2018, 34, 1730–1738. [Google Scholar] [CrossRef]
- D’Souza, N.; Li, W.; Argyrakis, C.; West, G.D.; Slater, C.D. On the Evolution of Primary Gamma Prime Precipitates During High Temperature and High Strain Rate Deformation and Subsequent Heat Treatment in the Ni-Based Superalloy, RR1000. Metall. Mater. Trans. A 2019, 50, 4205–4222. [Google Scholar] [CrossRef] [Green Version]
- Daniel, C.; Jedrasiak, P.; Peyton, C.; da Fonseca, J.; Shercliff, H.; Braley, L.; Honnibal, P. Quantifying processing map uncertainties by modelling the hot compression behavior of a Zr-2.5Nb alloy. In Proceedings of the 19th International Symposium on Zirconium in the Nuclear Industry, Manchester, UK, 20–23 May 2019. [Google Scholar]
- Jedrasiak, P.; Shercliff, H. CUED/C-MATS/TR264: FE Modelling of Small-Scale Hot Deformation Testing; Technical Report; Cambridge University: Cambridge, UK, 2019. [Google Scholar] [CrossRef]
- Bozzolo, N.; Souaï, N.; Logé, R. Evolution of microstructure and twin density during thermomechanical processing in a γ-γ’ nickel-based superalloy. Acta Mater. 2012, 60, 5056–5066. [Google Scholar] [CrossRef] [Green Version]
- Satheesh Kumar, S.S.; Raghu, T.; Bhattacharjee, P.P.; Appa Rao, G.; Borah, U. Constitutive modeling for predicting peak stress characteristics during hot deformation of hot isostatically processed nickel-base superalloy. J. Mater. Sci. 2015, 50, 6444–6456. [Google Scholar] [CrossRef]
- Nicolaÿ, A.; Fiorucci, G.; Franchet, J.; Cormier, J.; Bozzolo, N. Influence of strain rate on subsolvus dynamic and post-dynamic recrystallization kinetics of Inconel 718. Acta Mater. 2019, 174, 406–417. [Google Scholar] [CrossRef]
- Gottstein, G. Annealing texture development by multiple twinning in f.c.c. crystals. Acta Metall. 1984, 32, 1117–1138. [Google Scholar] [CrossRef]
- Hatherly, M.; Rollett, A.; Humphreys, F.J.; Rohrer, G.S. Recrystallization and Related Annealing Phenomena; Elsevier Science and Technology: London, UK, 2004. [Google Scholar]
- Musin, F.; Belyakov, A.; Kaibyshev, R.; Motohashi, Y.; Itoh, G.; Tsuzaki, K. Microstructure evolution in a cast 1421AI alloy during hot equal-channel angular extrusion. Rev. Adv. Mater. Sci. 2010, 25, 107–112. [Google Scholar]
- Xie, B.; Zhang, B.; Yu, H.; Yang, H.; Liu, Q.; Ning, Y. Microstructure evolution and underlying mechanisms during the hot deformation of 718Plus superalloy. Mater. Sci. Eng. A 2020, 784, 139334. [Google Scholar] [CrossRef]
- Robson, J.; Henry, D.; Davis, B. Particle effects on recrystallization in magnesium–manganese alloys: Particle-stimulated nucleation. Acta Mater. 2009, 57, 2739–2747. [Google Scholar] [CrossRef]
- Wu, Y.; Liao, H.; Yang, J.; Zhou, K. Effect of Si Content on Dynamic Recrystallization of Al–Si–Mg Alloys During Hot Extrusion. J. Mater. Sci. Technol. 2014, 30, 1271–1277. [Google Scholar] [CrossRef]
- Zhang, S.; Zeng, W.; Zhou, D.; Lai, Y.; Zhao, Q. The particle stimulated nucleation in Ti–35V–15Cr–0.3Si–0.1C alloy. Mater. Lett. 2016, 166, 317–320. [Google Scholar] [CrossRef]
- Li, L.; Yang, W.; Sun, Z. Dynamic Recrystallization of Ferrite with Particle-Stimulated Nucleation in a Low-Carbon Steel. Metall. Mater. Trans. A 2013, 44, 2060–2069. [Google Scholar] [CrossRef]
- Semiatin, S.L.; Weaver, D.S.; Kramb, R.C.; Fagin, P.N.; Glavicic, M.G.; Goetz, R.L.; Frey, N.D.; Antony, M.M. Deformation and recrystallization behavior during hot working of a coarse-grain, nickel-base superalloy ingot material. Metall. Mater. Trans. A 2004, 35, 679–693. [Google Scholar] [CrossRef]
- Pereloma, E.V.; Mannan, P.; Casillas, G.; Saleh, A.A. Particle stimulated nucleation during dynamic and metadynamic recrystallisation of Ni-30%Fe-Nb-C alloy. Mater. Charact. 2017, 125, 94–98. [Google Scholar] [CrossRef]
- Humphreys, F. The nucleation of recrystallization at second phase particles in deformed aluminium. Acta Metall. 1977, 25, 1323–1344. [Google Scholar] [CrossRef]
- Humphreys, F. Local lattice rotations at second phase particles in deformed metals. Acta Metall. 1979, 27, 1801–1814. [Google Scholar] [CrossRef]
- Seret, A.; Moussa, C.; Bernacki, M.; Signorelli, J.; Bozzolo, N. Estimation of geometrically necessary dislocation density from filtered EBSD data by a local linear adaptation of smoothing splines. J. Appl. Crystallogr. 2019, 52, 548–563. [Google Scholar] [CrossRef]
- He, D.G.; Lin, Y.; Wang, L.H. Microstructural variations and kinetic behaviors during metadynamic recrystallization in a nickel base superalloy with pre-precipitated δ phase. Mater. Des. 2019, 165, 107584. [Google Scholar] [CrossRef]
- Tang, X.; Wang, B.; Ji, H.; Fu, X.; Xiao, W. Behavior and modeling of microstructure evolution during metadynamic recrystallization of a Ni-based superalloy. Mater. Sci. Eng. A 2016, 675, 192–203. [Google Scholar] [CrossRef]
- Zouari, M.; Logé, R.E.; Bozzolo, N. In Situ Characterization of Inconel 718 Post-Dynamic Recrystallization within a Scanning Electron Microscope. Metals 2017, 7, 476. [Google Scholar] [CrossRef] [Green Version]
- Wusatowska-Sarnek, A.; Miura, H.; Sakai, T. Nucleation and microtexture development under dynamic recrystallization of copper. Mater. Sci. Eng. A 2002, 323, 177–186. [Google Scholar] [CrossRef]
- Pradhan, K.; Mandal, S.; Athreya, C.; Babu, K.A.; de Boer, B.; Sarma, V.S. Influence of processing parameters on dynamic recrystallization and the associated annealing twin boundary evolution in a nickel base superalloy. Mater. Sci. Eng. A 2017, 700, 49–58. [Google Scholar] [CrossRef]
- Zhang, H.; Zhang, K.; Zhou, H.; Lu, Z.; Zhao, C.; Yang, X. Effect of strain rate on microstructure evolution of a nickel-based superalloy during hot deformation. Mater. Des. 2015, 80, 51–62. [Google Scholar] [CrossRef]
Figure 1.
(a) Cylindrical sample before deformation (height 12 mm, diameter 8 mm). (b) Experimental procedure of the Gleeble testing. Blue lines represent the Q samples (quenched directly after deformation) and orange lines represent the H samples (held at temperature for 90 s after deformation prior to quenching). (c) Sample after deformation, showing barreling.

Figure 2.
Initial microstructures for the billet in as-received condition (a–e), soaked at 1060 °C (f–j) and at 1080 °C (k–o). (a,f,k) show IPF maps (black lines are HAGB > 10°), with corresponding {100}, {110} and {111} pole figures (orientation with respect to the compression direction during subsequent deformation, horizontal in the images). (b,g,l) shows the grain size distributions from the EBSD measurements. (c,h,m) shows backscattered electron images of grain boundaries, revealing the absence of grain boundary carbides in (c) and their presence in (h,m). (d,i,n) shows twin boundaries (red lines) superposed on band contrast maps. (e,j,o) show grain boundary misorientation distributions. Black scale bars are 1 mm and white are 50 μm.

Figure 3.
Measured temperature during deformation for samples deformed at 1060 °C (a) and 1080 °C (b). Solid and dashed lines for Q and H samples, respectively. Initiation of quench for 0.5 s−1 and 5 s−1 is marked with black circles in the graphs. (c) Maximum temperature measured for each sample with the target temperatures marked with black dashed lines.

Figure 4.
True stress-strain curves for samples deformed at 1060 °C (a) and 1080 °C (b). Solid lines are for samples that were quenched directly after deformation (Q) and dashed are for the held (H) samples. (c,d) Peak stress, and strain at peak stress, , as functions of strain rate, respectively.
Figure 4.
True stress-strain curves for samples deformed at 1060 °C (a) and 1080 °C (b). Solid lines are for samples that were quenched directly after deformation (Q) and dashed are for the held (H) samples. (c,d) Peak stress, and strain at peak stress, , as functions of strain rate, respectively.

Figure 5.
Comparison of current results with data from Shi et al. [24]. In all cases, gray solid points are data from Shi et al. and gray lines are linear fits as obtained in [24]. (a) Peak stress as a function of temperature, (b) as a function of strain rate. (c) as a function of inverse temperature. (d) as a function of Zener-Hollomon parameter Z (obtained using kJ mol−1).

Figure 6.
IPF maps for all samples deformed at 1060 °C, where black lines show HAGB > 10° and grey lines LAGB < 10°. (a–c) Q samples deformed at strain rates of (a) 0.05 s−1, (b) 0.5 s−1 and (c) 5 s−1, respectively. (d–f) H samples deformed at strain rates of (d) 0.05 s−1, (e) 0.5 s−1 and (f) 5 s−1. The scale bars are 200 μm. Deformation direction was horizontal with respect to the IPF maps.

Figure 7.
IPF maps for all samples deformed at 1080 °C, where black lines show HAGB > 10° and grey lines LAGB < 10°. (a–c) Q samples deformed at strain rates of (a) 0.05 s−1, (b) 0.5 s−1 and (c) 5 s−1, respectively. (d–f) H samples deformed at strain rates of (d) 0.05 s−1, (e) 0.5 s−1 and (f) 5 s−1. The scale bars are 200 μm. Deformation direction was horizontal with respect to the IPF maps.

Figure 8.
DRX fraction for each strain rate.

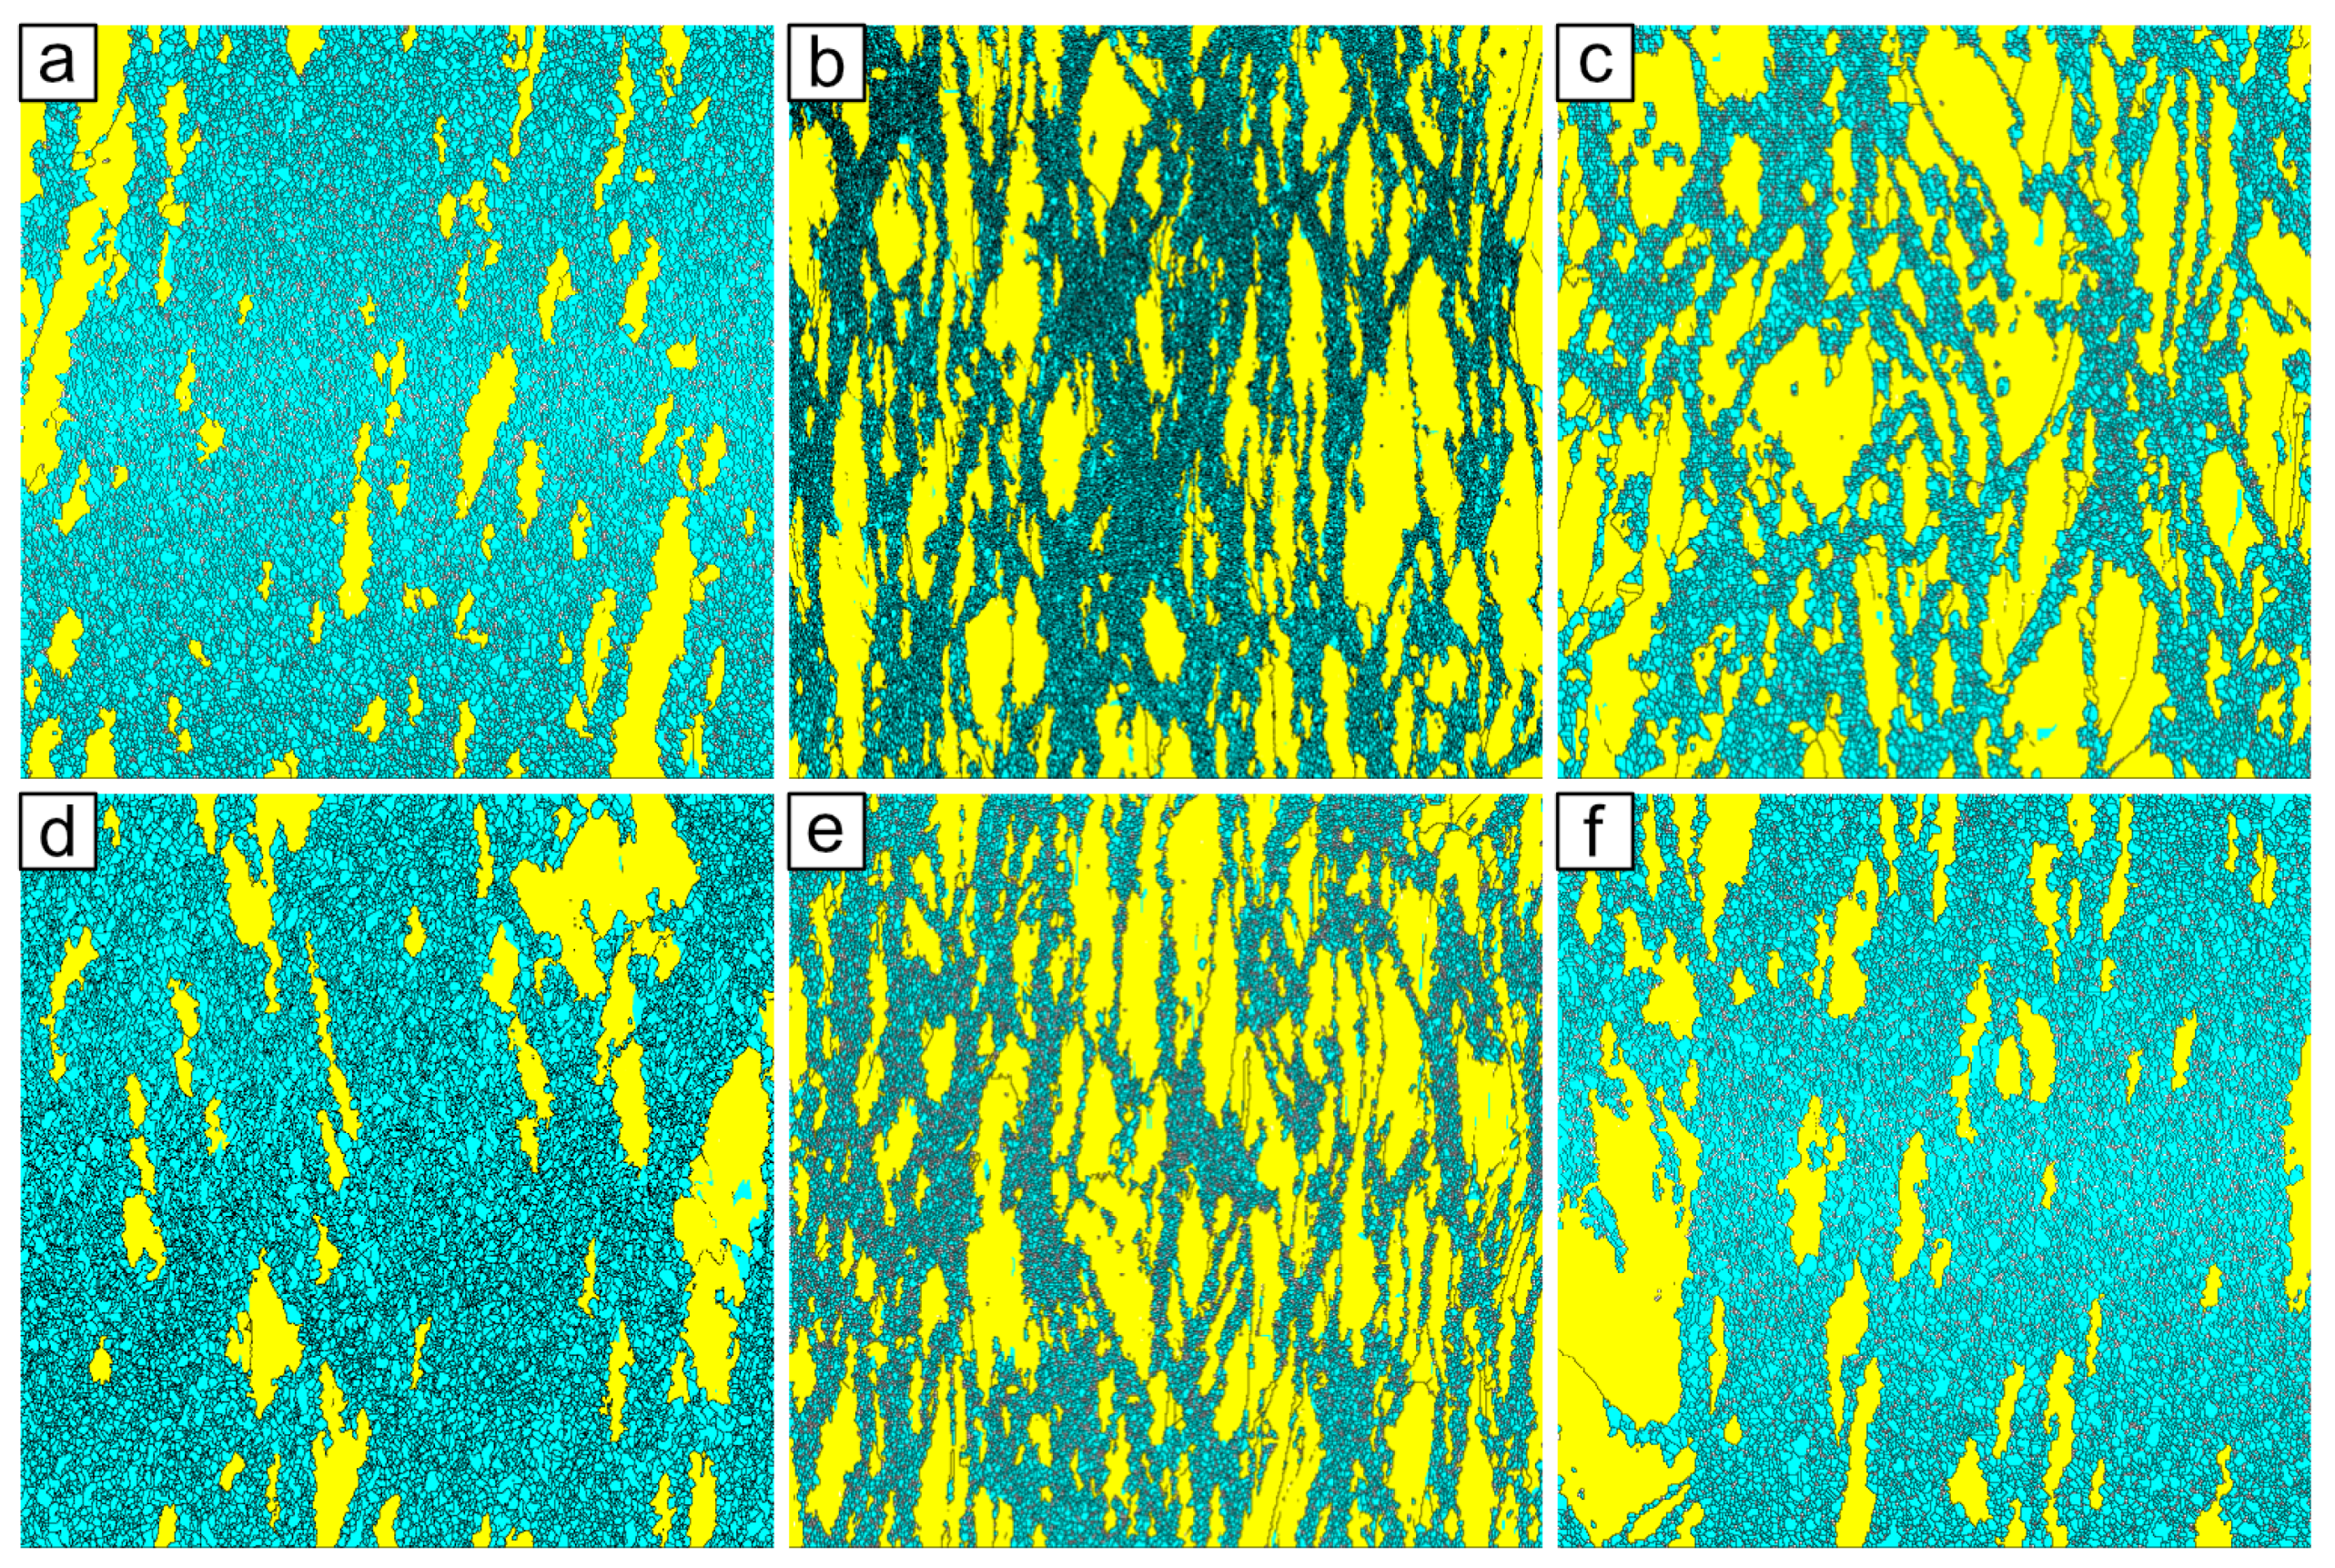
Figure 9.
Maps showing the recrystallized (blue) and deformed (yellow) grains separated by a grain size specific to each sample. Black lines show HAGB > 10. (a–c) are maps of Q samples deformed at 1060 °C and (a) 0.05 s−1 (cut-off grain size = 12 μm), (b) 0.5 s−1 ( = 7 μm) and (c) 5 s−1 ( = 10 μm). (d–f) show Q samples deformed at 1080 °C and (a) 0.05 s−1 ( = 15 μm), (b) 0.5 s−1 ( = 7 μm) and (c) 5 s−1 ( = 12 μm).

Figure 10.
Grain sizes for the investigated deformation parameters. (a) the average grain size and standard deviation of the recrystallized grains for the Q samples. (b) the average grain size and standard deviation of all grains for the H samples. (c) both the grain size of the single largest grain (dashed lines) and the average size and standard deviation of the 1% largest grains (solid lines) for the H samples.

Figure 11.
Grain size distribution for samples deformed at 1060 °C. (a–c) area fraction, (d–f) relative (number) frequency. Diameter here refers to the equivalent circle diameter from EBSD. Please note that there are large grains falling outside the x-axis scale, see text.
Figure 11.
Grain size distribution for samples deformed at 1060 °C. (a–c) area fraction, (d–f) relative (number) frequency. Diameter here refers to the equivalent circle diameter from EBSD. Please note that there are large grains falling outside the x-axis scale, see text.

Figure 12.
Grain size distribution for samples deformed at 1080 °C. (a–c) area fraction, (d–f) relative (number) frequency. Diameter here refers to the equivalent circle diameter from EBSD. Please note that there are large grains falling outside the x-axis scale, see text.
Figure 12.
Grain size distribution for samples deformed at 1080 °C. (a–c) area fraction, (d–f) relative (number) frequency. Diameter here refers to the equivalent circle diameter from EBSD. Please note that there are large grains falling outside the x-axis scale, see text.

Figure 13.
Histograms of the logarithm of the relative frequency of grain size in the DRX fraction in Q samples, and the full data set in H samples. (a–c) samples deformed at 1060 °C and 0.05, 0.5 and 5 s−1 respectively. (d–f) samples deformed at 1080 °C and 0.05, 0.5 and 5 s−1.
Figure 13.
Histograms of the logarithm of the relative frequency of grain size in the DRX fraction in Q samples, and the full data set in H samples. (a–c) samples deformed at 1060 °C and 0.05, 0.5 and 5 s−1 respectively. (d–f) samples deformed at 1080 °C and 0.05, 0.5 and 5 s−1.

Figure 14.
{110} pole figures (with compression axis out of the plane) showing the texture in the deformed and DRX fractions for the Q samples, as well as the resulting texture in the H sample. (a) samples deformed at 1060 °C and (b) samples deformed at 1080 °C. The color bars below each column indicates the scale in terms of a multiples of random distribution (MUD).

Figure 15.
Nucleation of DRX grains. (a) Band contrast and (b) IPF maps from a sample deformed at 1080 °C and 0.05 s−1, showing bulging grain boundaries (black arrows) and misoriented subgrains along grain boundaries (white arrow and white rectangle). A long low angle boundary with misorientation in the range 5–7° is indicated by multiple white arrowheads in (b). (c) Band contrast, (d) IPF and (e) grain reference orientation deviation (GROD) maps from same sample as in (a), showing “cutting off” of DRX grains by twinning (red lines in the white rectangles, also marked with black arrows in (d), and concentration of deformation along grain boundary (multiple white arrowheads in (e). Scale bar is 20 μm.

Figure 16.
Evidence of particle-stimulated nucleation in a sample deformed at 1060 °C, 5 s−1. (a) IPF map with multiple occurrences of PSN. A to E indicate different nucleation sites. The misorientation profiles along lines 1–4 (white arrows) are shown in (b). (c,d) show the KAM and GROD maps, respectively, corresponding to (a). (e) IPF map showing larger clusters of DRX grains surrounding an intragranular carbide. (f,g) Nucleation at clusters of smaller carbides. In all cases red grain boundaries at twins. The scale bar in all images is 20 μm. Black grains indicate carbides.

Figure 17.
Fraction of twin boundaries with increasing grain size for H samples, including {110} pole figures corresponding to marked subsets ((A–C) for grain sizes 0–15, 15–30 and >30 μm respectively, for the sample deformed at 1060 °C, 0.05 s−1 and (D–F) for grain sizes 0–10, 10–25 and >25 μm respectively for the sample deformed at 1080 °C, 0.5 s−1). The gray lines dash-dotted lines correspond to the average twin boundary fraction of the entire data set.


Table 1.
Chemical composition of Haynes 282 (in wt.%) according to material certificate.
| Ni | Cr | Co | Mo | Ti | Al | Fe | Mn | Si | C | B |
|---|---|---|---|---|---|---|---|---|---|---|
| bal | 19.3 | 10.2 | 8.7 | 2.2 | 1.5 | 0.9 | 0.05 | <0.05 | 0.06 | 0.004 |
Publisher’s Note: MDPI stays neutral with regard to jurisdictional claims in published maps and institutional affiliations. |
© 2021 by the authors. Licensee MDPI, Basel, Switzerland. This article is an open access article distributed under the terms and conditions of the Creative Commons Attribution (CC BY) license (http://creativecommons.org/licenses/by/4.0/).
Share and Cite
MDPI and ACS Style
Eriksson, E.; Hörnqvist Colliander, M. Dynamic and Post-Dynamic Recrystallization of Haynes 282 below the Secondary Carbide Solvus. Metals 2021, 11, 122. https://doi.org/10.3390/met11010122
AMA Style
Eriksson E, Hörnqvist Colliander M. Dynamic and Post-Dynamic Recrystallization of Haynes 282 below the Secondary Carbide Solvus. Metals. 2021; 11(1):122. https://doi.org/10.3390/met11010122
Chicago/Turabian StyleEriksson, Emil, and Magnus Hörnqvist Colliander. 2021. "Dynamic and Post-Dynamic Recrystallization of Haynes 282 below the Secondary Carbide Solvus" Metals 11, no. 1: 122. https://doi.org/10.3390/met11010122
Note that from the first issue of 2016, this journal uses article numbers instead of page numbers. See further details here.