Evaluation of Different Storm Parameters as the Proxies for Gridded Total Lightning Flash Rates: A Convection-Allowing Model Study

1
Precision Regional Earth Modeling and Information Center, Nanjing University of Information Science and Technology, Nanjing 210044, China
2
Heavy Rain and Drought-Flood Disasters in Plateau and Basin Key Laboratory of Sichuan Province, Institute of Plateau Meteorology of Chengdu, Chengdu 610072, China
*
Author to whom correspondence should be addressed.
Atmosphere 2021, 12(1), 95; https://doi.org/10.3390/atmos12010095
Submission received: 18 November 2020
/
Revised: 26 December 2020
/
Accepted: 7 January 2021
/
Published: 10 January 2021
(This article belongs to the Section Atmospheric Techniques, Instruments, and Modeling)
Abstract
:Lightning simulation is important for a variety of applications, including lightning forecast, atmospheric chemical simulation, and lightning data assimilation. In this study, the potential of five storm parameters (graupel volume, precipitation ice mass, radar echo volume, maximum updraft, and updraft volume) to be used as the proxy for the diagnosis of gridded total lightning flash rates has been investigated in a convection-allowing model. A mesoscale convective system occurred in the Guangdong province of China was selected as the test case. Radar data assimilation was used to improve the simulation accuracy of the convective clouds, hence providing strong instantaneous correlations between observed and simulated storm signatures. The areal coverage and magnitude of the simulated lightning flash rates were evaluated by comparing to those of the total lightning observations. Subjective and the Fractions Skill Score (FSS) evaluations suggest that all the five proxies tested in this study are useful to indicate general tendencies for the occurrence, region, and time of lightning at convection-allowing scale (FSS statistics for the threshold of 1 flash per 9 km2 per hour were around 0.7 for each scheme). The FSS values were decreasing as the lightning flash rate thresholds used for FSS computation increased for all the lightning diagnostic schemes with different proxies. For thresholds from 1 to 3 and 16 to 20 flashes per 9 km2 per hour, the graupel contents related schemes achieved higher FSS values compared to the other three schemes. For thresholds from 5 to 15 flashes per 9 km2 per hour, the updraft volume related scheme yielded the largest FSS. When the thresholds of lightning flash rates were greater than 13 flashes per 9 km2 per hour, the FSS values were below 0.5 for all the lightning diagnostic schemes with different proxies.
1. Introduction
Lightning can disrupt power service, threaten aviation safety, trigger forest fires. Lightning is also known to be a source of nitrogen oxides (NO + NO2 = NOx), which can in turn affect the net production of ozone [1]. Simulation of lightning activity is important not only in operational numerical weather prediction (NWP) models but also in atmospheric chemical models. On the other hand, lightning data have found to be a useful data source for assimilation in NWP models to improve the accuracy of convective weather [2,3,4,5,6]. Lightning diagnostic scheme can serve as observation operator for the direct assimilation of lightning data.
Explicit electrification and discharge schemes have been developed for convection-allowing scale NWP models [7]. Such lightning simulation schemes can provide the information of thunderstorm charge structures, and fine space and time scales quantitative lightning simulations including frequency, location. However, such full electrification, discharge schemes are remaining computationally expensive, and uncertainties are existed in such schemes due to the complexities of electrification and lightning discharge process.
Machine learning techniques have also been applied on the forecast and nowcasting of lightning activity [8,9]. These studies utilize multiple meteorological parameters related to the occurrence of thunderstorm as the training data to train machine learning algorithms for forecasting or nowcasting lightning activity, and the results are promising. Although the present studies using machine learning techniques focus more on the forecast of lightning probability or binary occurrence or non-occurrence of lightning, rather than on the forecast of specific gridded lightning flash rates, this method has great potential to be used in the simulation of gridded lightning flash rates at convective-allowing scale.
Previous studies have found that total lightning frequency is related to graupel contents, updraft characteristics [10,11,12,13,14]. Much evidence suggests that these correlations are due to the primary role of the noninductive electrification mechanism in thunderstorm electrification (i.e., rebound collisions between graupel and ice with the existence of supercooled liquid water [15,16,17,18]). Lightning diagnostic schemes, which employ such empirically–derived statistical relationships between lightning flash rates and kinematic, microphysical parameters of thunderstorms, are widely used in the convection-allowing scale models due to its high computational efficiency. For example, McCaul et al. [19] devised two formulations dependent on the contents of ice-phase hydrometeors to simulate total lightning flash rates of thunderstorms in convection-allowing models.
Multiple past studies have performed to derive quantitative relationships between lightning flash rates and thunderstorm parameters. Thunderstorm parameters which have shown a good correlation with lightning flash rates include precipitation ice mass [20], updraft volume [21], graupel volume [22], and radar reflectivity [23]. Those proxies have been found in global observational studies [24,25] to be strongly related to storm total flash rates. Barthe et al. [26] and Basarab et al. [27] have evaluated the ability of these proxies in simulating total lightning flash rates in cloud-resolving models. However, due to the difficulty in accurately modeling convective clouds in terms of location, structure and intensity, their studies did not aim at evaluating simulated lightning flash rates on each grid cell. Instead, they evaluated the lightning flash rates simulation results at the scale of the whole thunderstorm.
In this study, the ability of five storm parameters, including graupel volume, precipitation ice mass, radar echo volume, maximum updraft, updraft volume, on diagnosing gridded lightning flash rates was evaluated in a convection-allowing model. Radar data assimilation was used to improve the simulation accuracy of the convective clouds, hence providing strong instantaneous correlations between observed and simulated storm signatures. A mesoscale convective system (MCS) occurred in Guangdong province (a coastal province) of China was selected as the test case to perform the experiments. The evaluation results are expected to provide useful information for fine-scale lightning simulation and lightning forward operator used in lightning data assimilation.
2. Methodology and Model Description
2.1. Description of the Severe Convective Event
On 16 June 2017, several discrete convections formed over the Guangdong Province of China around 0300 UTC. For the next few hours, these discrete convective cells moved southeastward and intensified. Some of the convective cells gradually merged into a MCS by 1000 UTC. The leading convective line of the MCS moved southeastward into the South China Sea by 1700 UTC. The evolution of this MCS was complex with the frequent initiation, merging, and dissipation of convective cells. During this period, the 850-hPa relative humidity exceeded 90% and the maximum convective available potential energy exceeded 1700 J/kg over much of Guangdong Province, which favored the development of severe convection.
2.2. Model Setup and Radar Data Assimilation Scheme
The numerical model used in this study is the three-dimensional compressible nonhydrostatic Weather Research and Forecasting model version 4.1.2 (WRF 4.1.2). The mode includes three domains with horizontal grid spacing of 27, 9 and 3 km, respectively. Each domain features 43 vertical eta levels with a model top set at around 50 hPa. The 6-hourly 0.25° Global Forecast System data were used to provide the initial and lateral boundary conditions. The simulations were initialized at 0600 UTC, 16 June 2017 for the three domains and were ended at 1800 UTC, 16 June 2017.
The physical parameterization schemes employed in this study included the Noah land surface model [28,29] for the land surface processes, the Thompson scheme [30] for the microphysics, the Mellor–Yamada–Janjic turbulence kinetic energy scheme for the planetary boundary layer [31], and the Rapid Radiative Transfer Model GCMs for shortwave and longwave radiation transfer [32]. The Grell–Freitas cumulus parameterization scheme [33] was activated in domains 1 and 2, and no CPS was activated in domain 3.
Radar reflectivity data were assimilated into model using the cloud analysis and latent heat nudging method. Radar data were only assimilated in the innermost model domain. Two-way nesting between parent and inner nests were activated, so the impact of data assimilation can feedback from the inner-most cloud-allowing domain to its parent domains. Radar reflectivity data were assimilated during all the simulation time window with the assimilation cycle of 12 min.
2.3. Quantitative Evaluation Method
To evaluate the lightning parametrization schemes, a neighborhood spatial verification method called the Fractions Skill Score (FSS) is used in this study, which was initially developed for fine-scale precipitation forecast verification. The advantage of FSS is that it can avoid the “double-penalty” problem caused by the small displacement of model storms compared with observations in space and time which occurs frequently when simulating convective clouds at fine-scale grid spaces. Since the FSS is more tolerant to small displacement errors compared to the ETS, it is more appropriate for the evaluation of the simulation with fine resolution grids. The FSS is computed from Fraction Brier Score divided by the sum of the mean squared observed and forecast fractions as follow:
where is the number of grid points in the verification domain, and is the fractional coverage of the studied elementary area by precipitation or lightning flash rates that exceeds a given threshold value in forecast and observation, respectively. For more details of the FSS, the reader is invited to consult Roberts and Lean [34].
FSS has been widely used to quantify the performance of precipitation and lightning forecasts of the convection-allowing NWP models (e.g., Fierro et al. [3]; Wang et al. [5]). In this study, lightning simulation results, which are accumulated over 12 min, 30 min, 60 min intervals, are evaluated, respectively.
2.4. Data for Assimilation and Verification
The radar data assimilated in this study are the three-dimensional gridded mosaic dataset for the southern China region, merged from several individual radars. The radar datasets are updated every 6 min. Radar data are also used to evaluate the simulation accuracy of the MCS.
The lightning data used to evaluate the lightning parameterization are from the lightning detection network in the Guangdong Province of China, which is operated by Guangdong Meteorological Bureau and the Earth Networks Total Lightning Network (ENTLN). The lightning detection network includes 16 ground-based sensors deployed over the Guangdong Province. The lightning detection network can detect both cloud-to-ground and intracloud lightning with a detection efficiency of ~77% for total lightning and a location accuracy of ~600 m [35]. Individual strokes/pulses detected by sensors within fixed spatiotemporal thresholds are recorded as a lightning flash. When a lightning flash contains several strokes, the location of the strongest stroke is considered as the location of the lightning flash. In this study, the total lightning data were interpolated from the original longitude and latitude to the innermost fine scale 3 km model domain and accumulated over 12-min, 30 min and 60 min intervals, respectively.
2.5. Radar Reflectivity Data Assimilation
The radar data assimilation method used in this study is the hydrometeor and latent heat nudging on the basis of cloud analysis. The mosaic reflectivity is interpolated to the model grids in the innermost 3-km fine resolution domain. The mass mixing ratio of each type of hydrometeor is retrieved from radar reflectivity using the method similar to that in Hu and Xue [36]. Then the retrieved hydrometeors and the latent heat release from the condensation of increased cloud water and cloud ice are nudged into the model. This radar reflectivity data assimilation method has been shown to be useful to improve the simulation accuracy of MCS [37]. For details of the radar reflectivity data assimilation, the reader is invited to consult Huang et al. [37]. Radar reflectivity data were assimilated into the model during the whole simulation period.
3. Results
3.1. Evaluation of the Simulation Results of the MCS
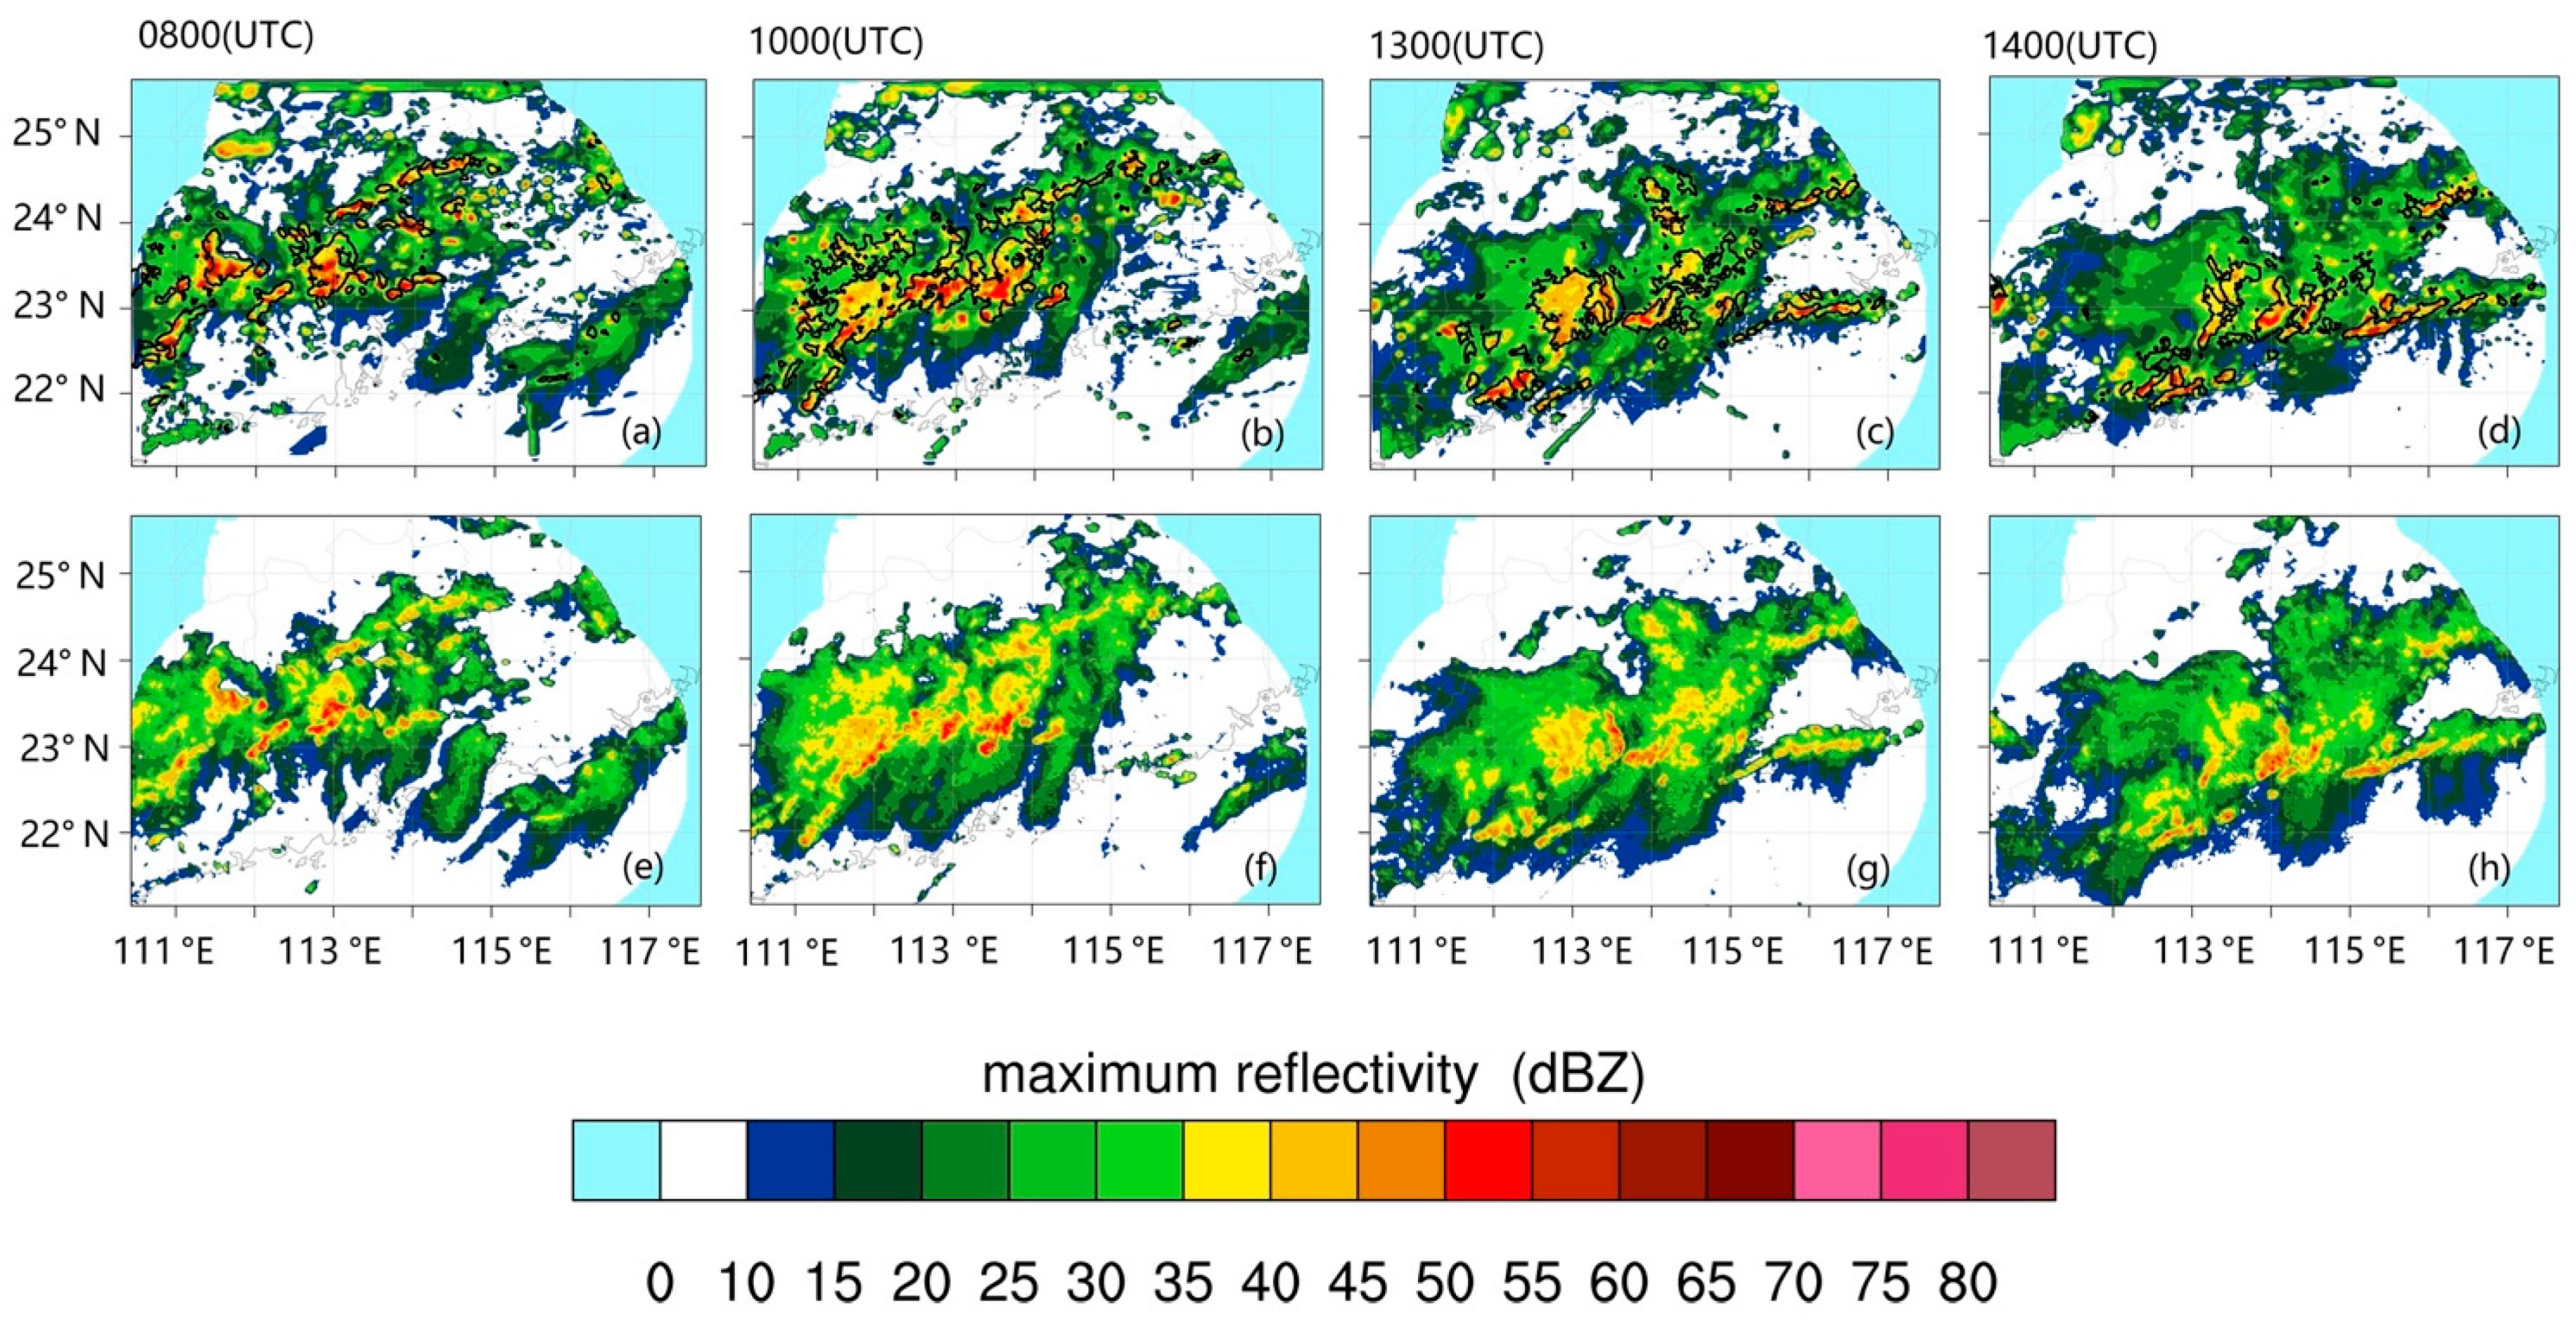
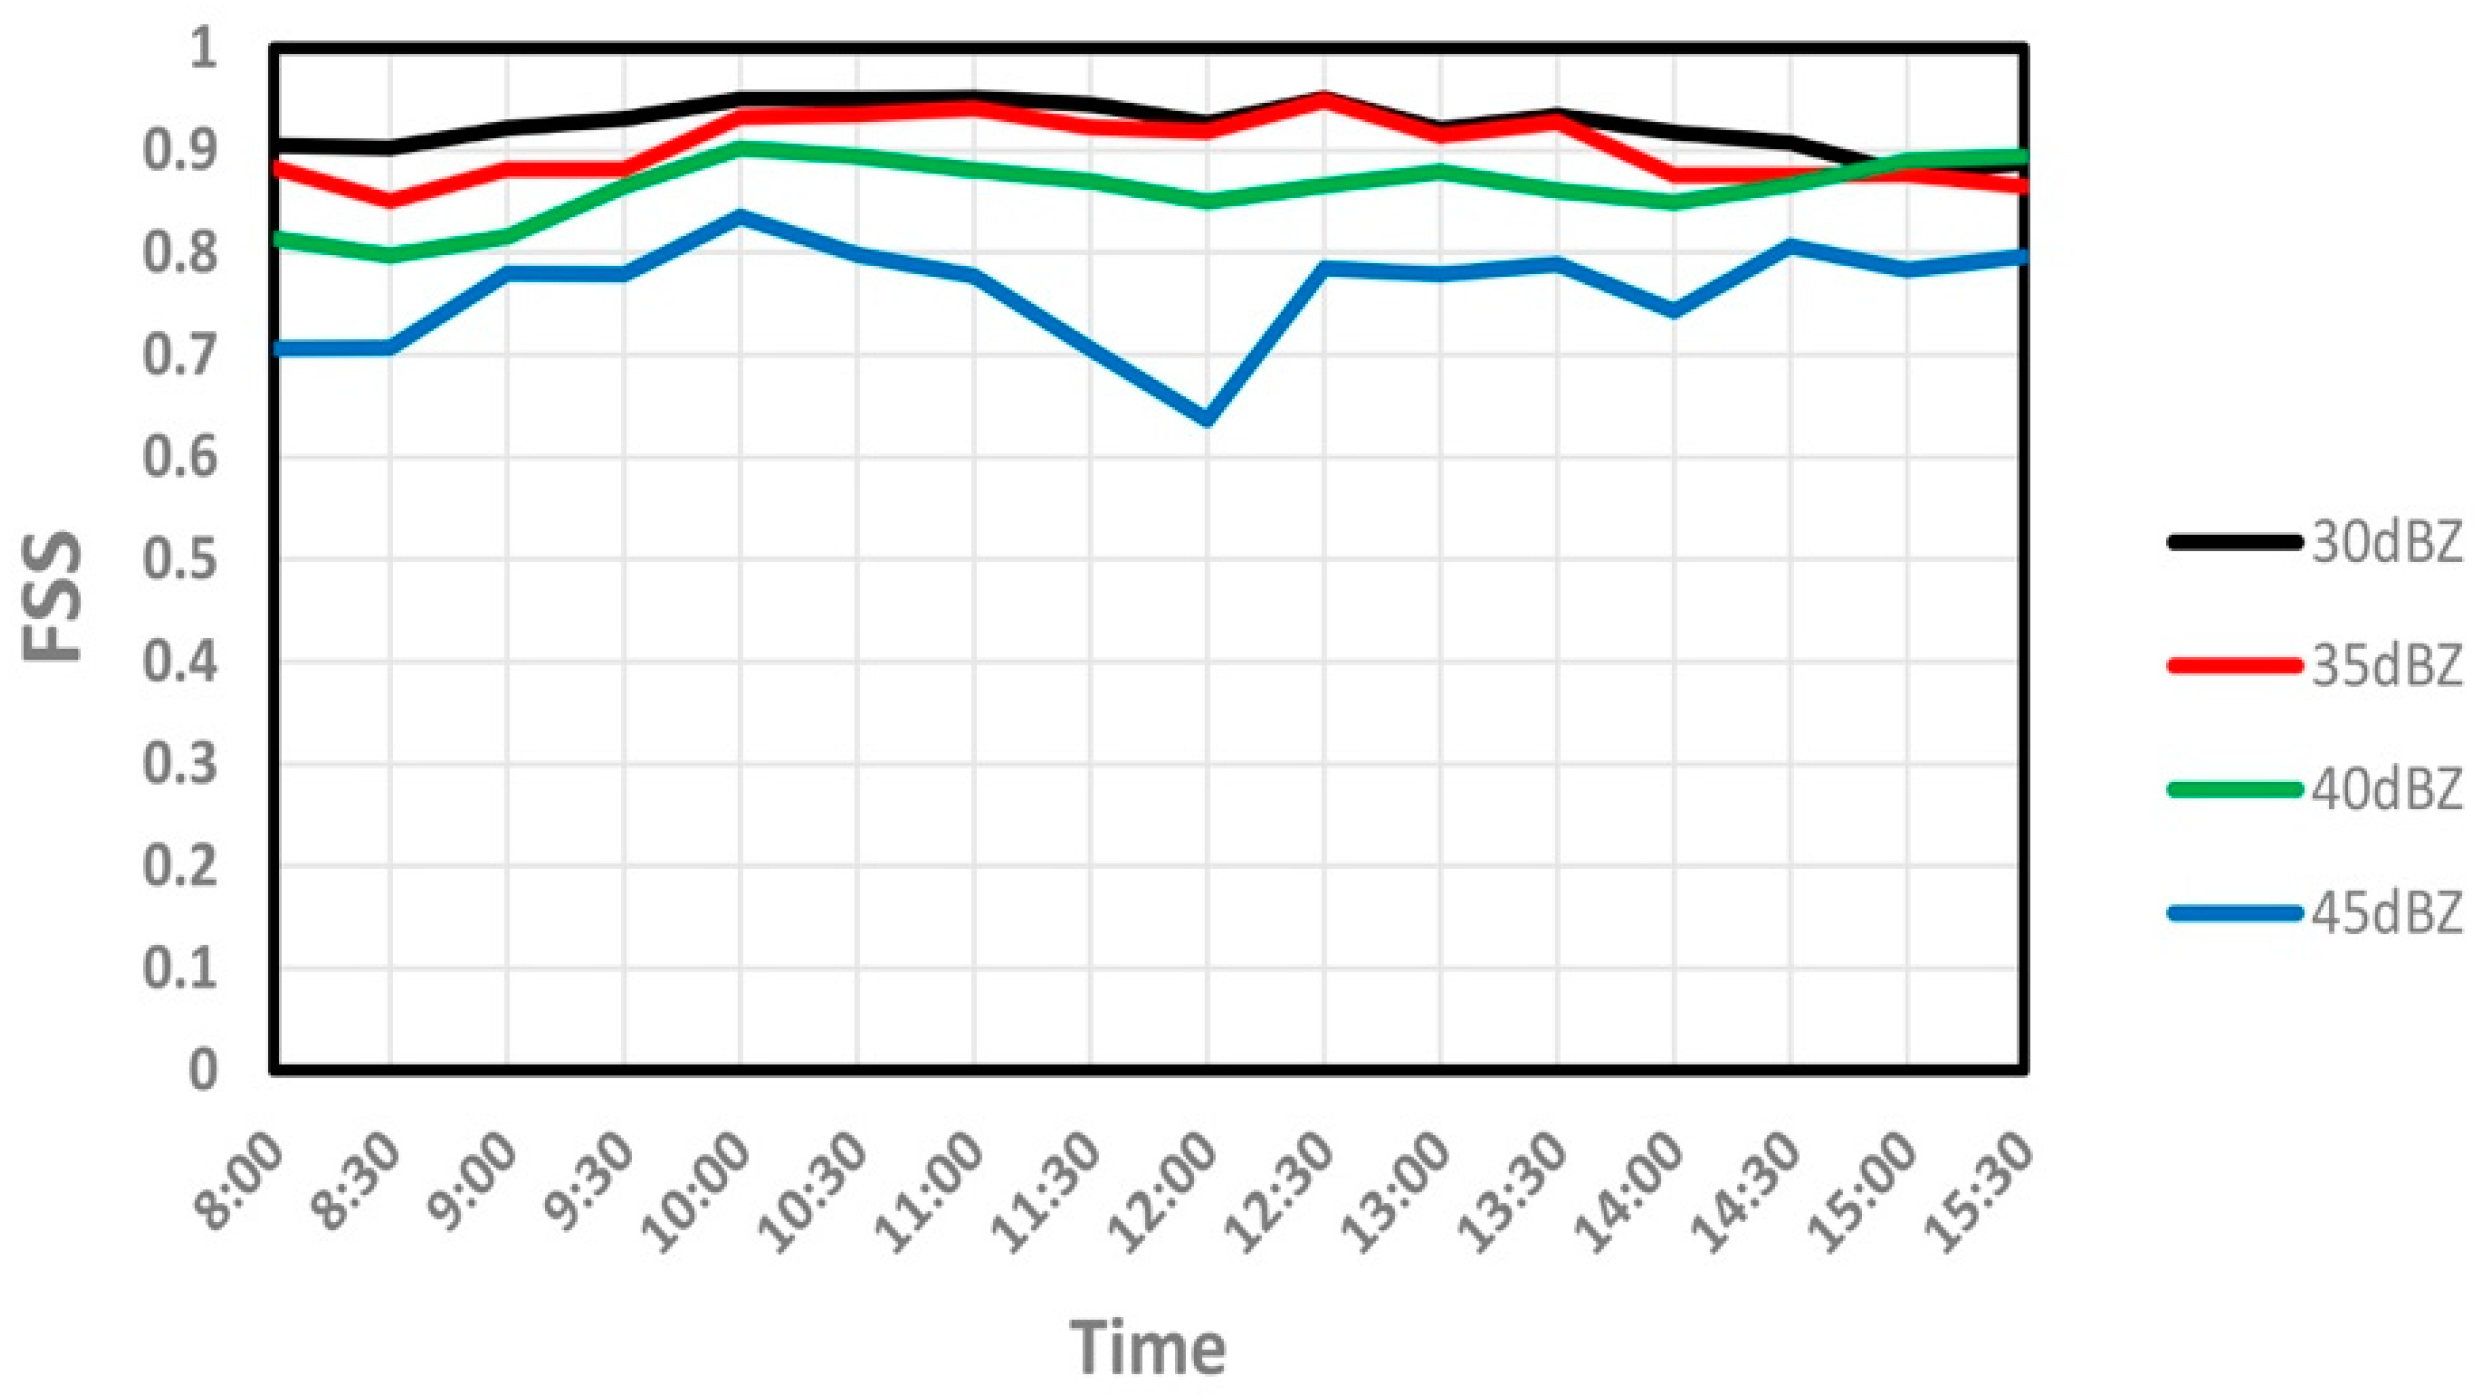
Since lightning is the by-product of convective clouds, accurate simulation of convective system is a prerequisite for accurate simulation of lightning. Before evaluating each potential proxy for the diagnosis of lightning flash rates at model-gird scale, the simulation results of the MCS were evaluated with the observed composite radar reflectivity. Simulated radar reflectivities were evaluated using the FSS method mentioned above. The neighborhood radius was set to 24 km. Four thresholds of composite radar reflectivity (30, 35, 40, 45 dBZ) were selected to perform the FSS calculation. Since most lightning flashes occur in the convective region of the MCS, the simulation accuracy of the convective region, which usually with the composite radar reflectivity greater than 35 dBZ, is quite important for the simulation of lightning.
It can be seen in Figure 1, the convective regions show great consistency between the simulations and the observations in terms of both coverage and placement. The simulation accuracy of the stratiform regions is slightly worse than that of the convective regions. The quantitative evaluation results indicate the same results, which the FSSs are greater than 0.75 for convective regions during the simulation period (Figure 2, an FSS value of >0.5 serves as a good indicator of a useful forecast [34,38]).
3.2. Proxies for Diagnosis of Gridded Total Lightning Flash Rates
Previous studies have found that total lightning frequency is related to graupel content (associated increase in radar reflectivity), updraft characteristics. Such correlations are due to the primary role of the noninductive electrification mechanism in thunderstorm charging (i.e., rebound collisions between graupel and ice with the existence of supercooled liquid water), which has been indicated in many previous studies. The potential proxies for the diagnosis of gridded total lightning flash rates, which were evaluated in this study, include graupel volume (GV), precipitation ice mass (PIM), radar echo volume (REV), maximum updraft (Wmax), updraft volume (UV). All the five lightning diagnostic schemes with different proxies employed the linear relationship between the thunderstorm proxies and lightning flash rates (Table 1).
3.3. Optimal Coefficients for Each Lightning Diagnostic Scheme with Different Proxies
In this study, optimal coefficients for each lightning diagnostic scheme were calibrated in term of lightning areal extents and grid cell lightning flash rates on the basis of the lightning observations. The linear coefficient (k) was determined by the averaged grid lightning flash rates in the simulations and observations. The averaged grid lightning flash rates were computed by dividing the total number of lightning flashes of the whole domain by the total number of grid points where lightning occurred. The linear coefficient was then scaled by dividing the averaged grid lightning flash rates in the observations by those in simulations.
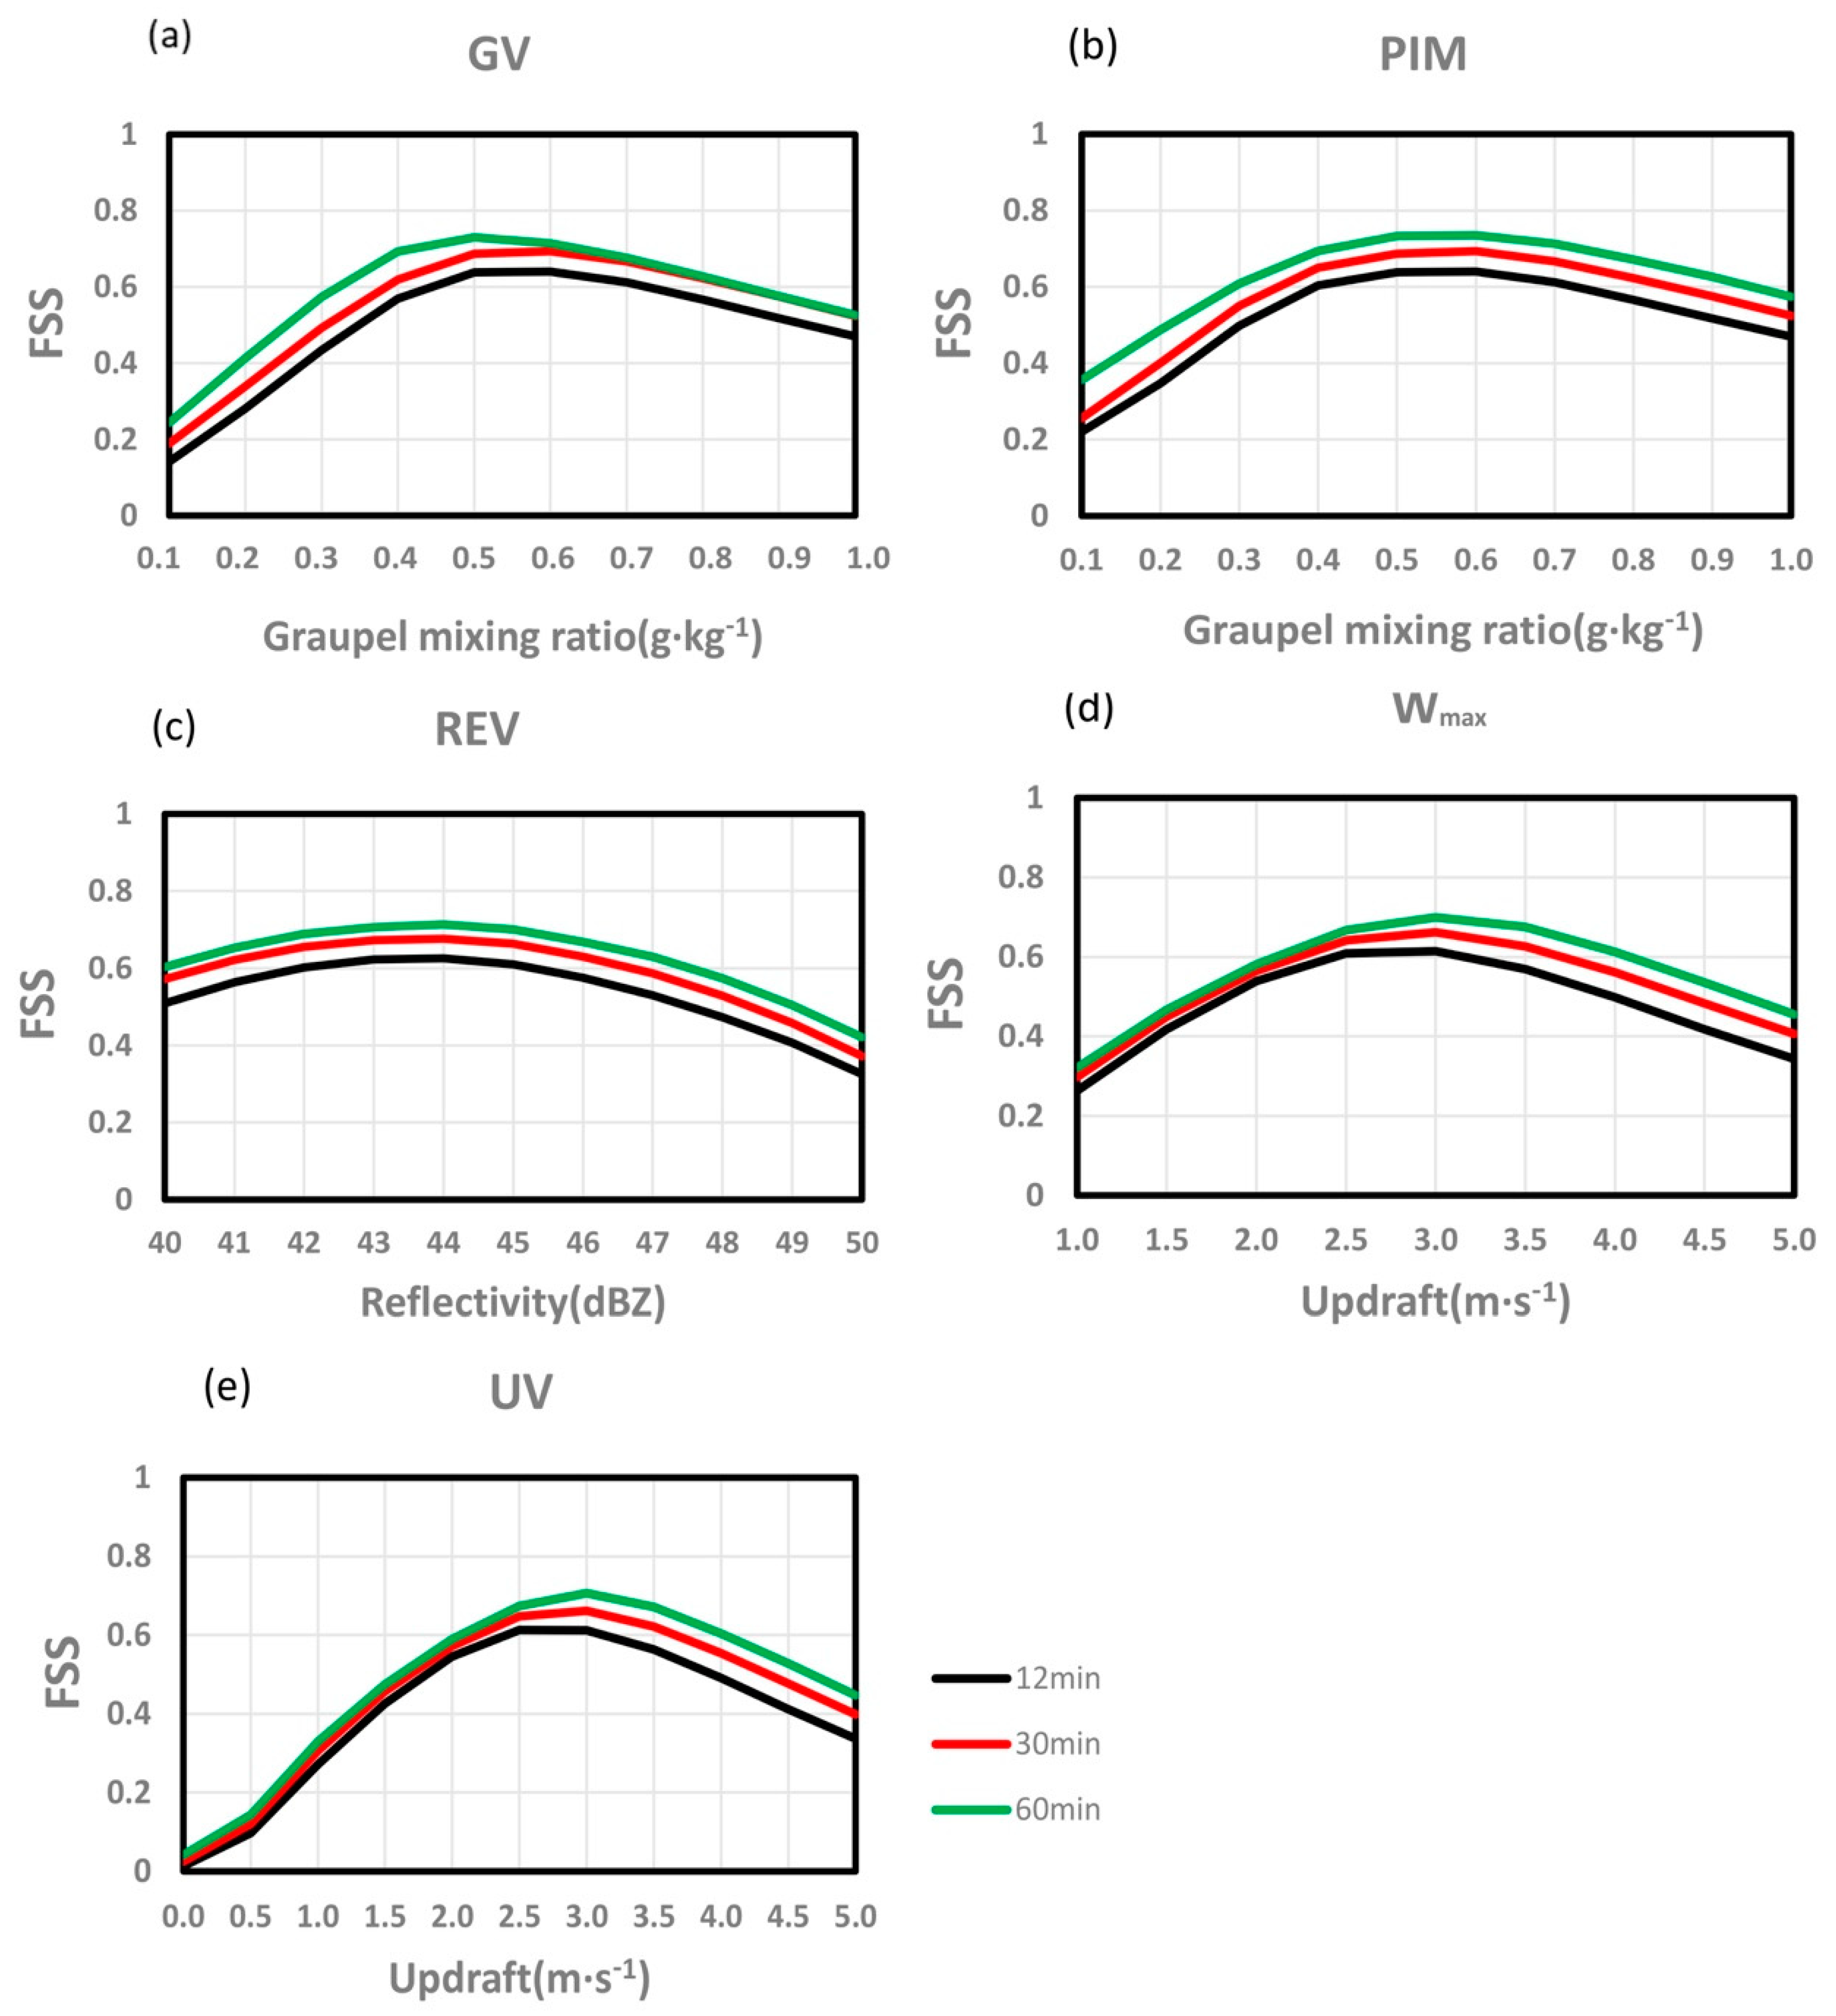
For GV, REV and UV, the optimal thresholds used to compute the corresponding volume (e.g., a grid point with a graupel mixing ratio greater than a certain threshold will be counted to compute GV) were obtained with an iterative process, which used the FSS of lightning simulation as the judgement condition, and the lightning flash rate threshold for FSS computation was set to 1 flash 9 km−2 herein. When the lighting flash rate threshold for FSS computation was set to 1 flash 9 km−2 (the lightning flash rates in the simulations and observations will be converted to a binary grid of lightning occurrence using the threshold 1 flash 9 km−2), the results indicate the simulation accuracy of lightning areal extents. The threshold used to compute the corresponding volume was gradually increased during the iteration process, and the threshold with the highest FSS will be selected as the final threshold (Figure 3a,c,e). For each proxy, the optimal thresholds used to compute the corresponding volume were almost the same for different lightning accumulated time intervals, and the optimal thresholds for 60 min accumulated time interval was selected as the final thresholds. The linear coefficient of each lightning diagnostic scheme was then recalibrated to account for the variation of the thresholds.
For PIM and Wmax, a filter parameter was added to the lightning diagnostic schemes to control the areal extents of the simulated lightning. The optimal threshold of filter parameter was obtained with an iterative process same as the method mentioned above. Column-maximum graupel mixing ratio (qg) and maximum updraft were used as the filter parameters for PIM and Wmax, respectively. The lightning flash rates of the grid with a column-maximum qg or maximum updraft less than the corresponding threshold will be set to 0 for PIM and Wmax, respectively, and the FSSs for different thresholds are shown in Figure 3b,d. The parameters used for each lightning diagnostic scheme with different proxies can be found in Table 1.
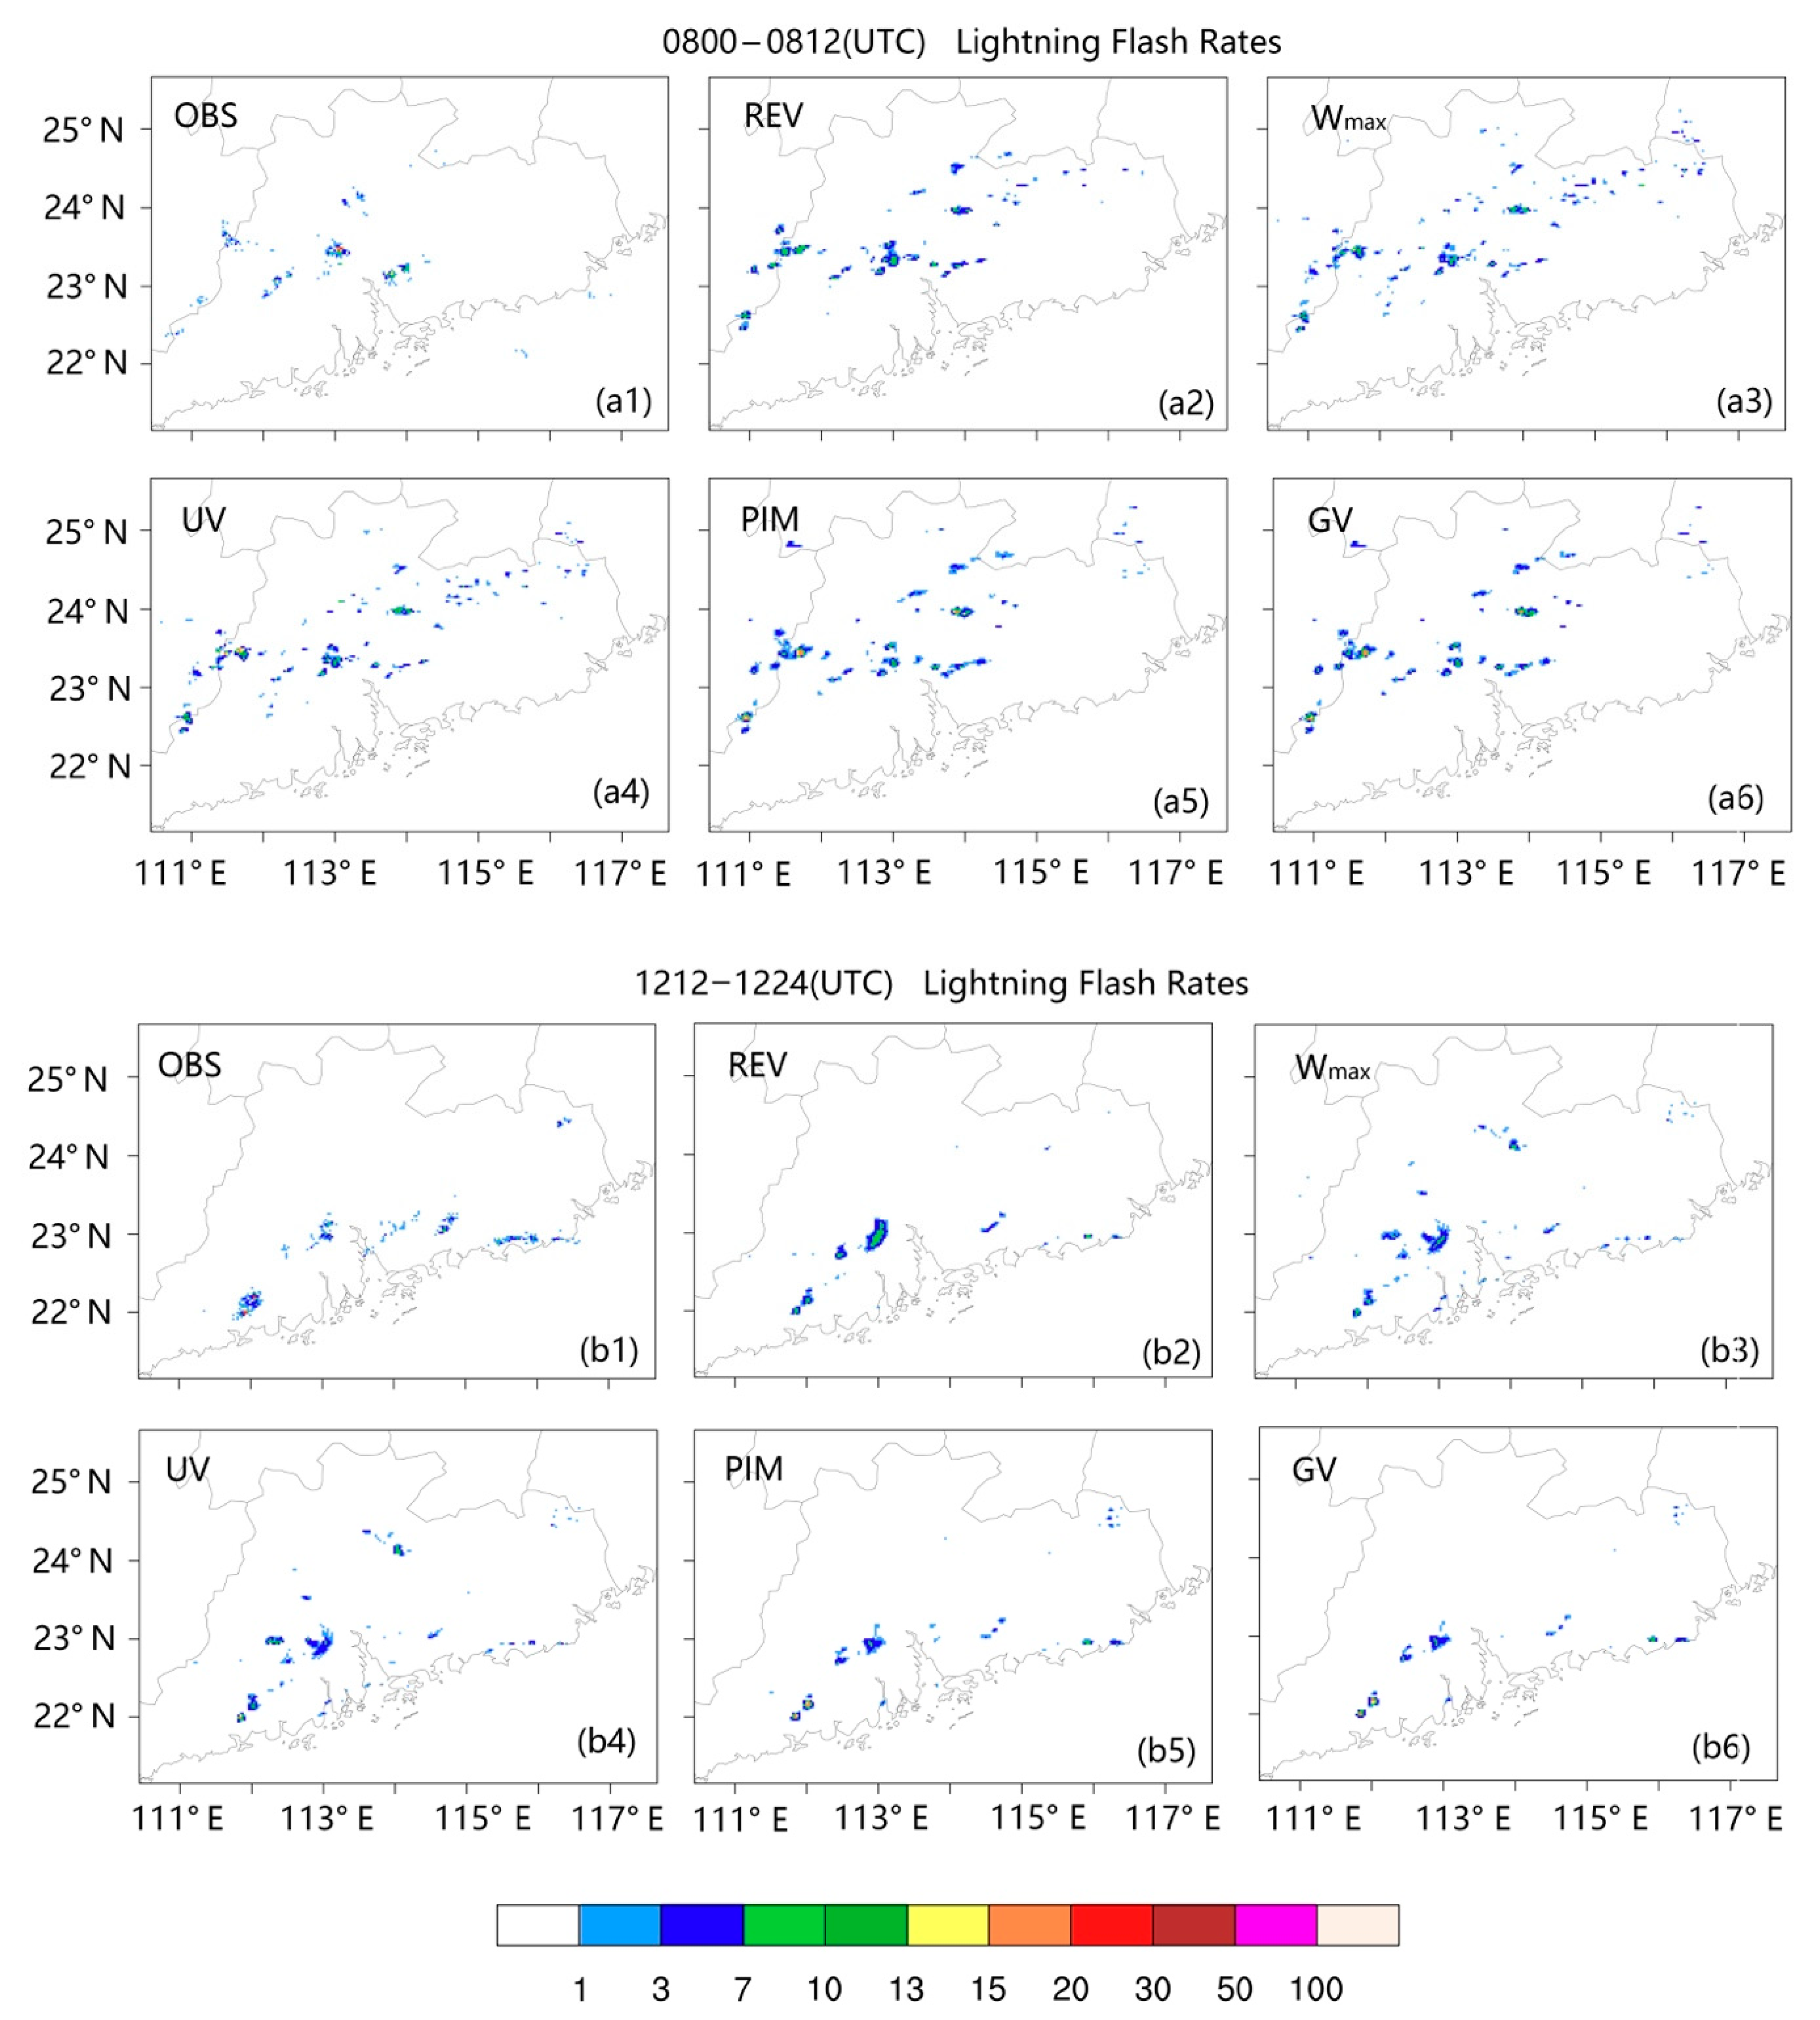
Figure 4 and Figure 5 show the simulated and observed lightning flash rates accumulated over two 12 min and 60 min periods, respectively. All the five lightning diagnostic schemes reproduced the general structure of the observed lightning spatial coverage. The updrafts related schemes (Wmax and UV) tended to simulate wider areal extents of lightning compared to the graupel related schemes (GV and PIM). FSS statistics (Figure 3) indicate that the lightning simulations with longer time interval (e.g., 60 min) achieved higher FSS values compared to the lightning simulations with shorter time interval (e.g., 12 min).
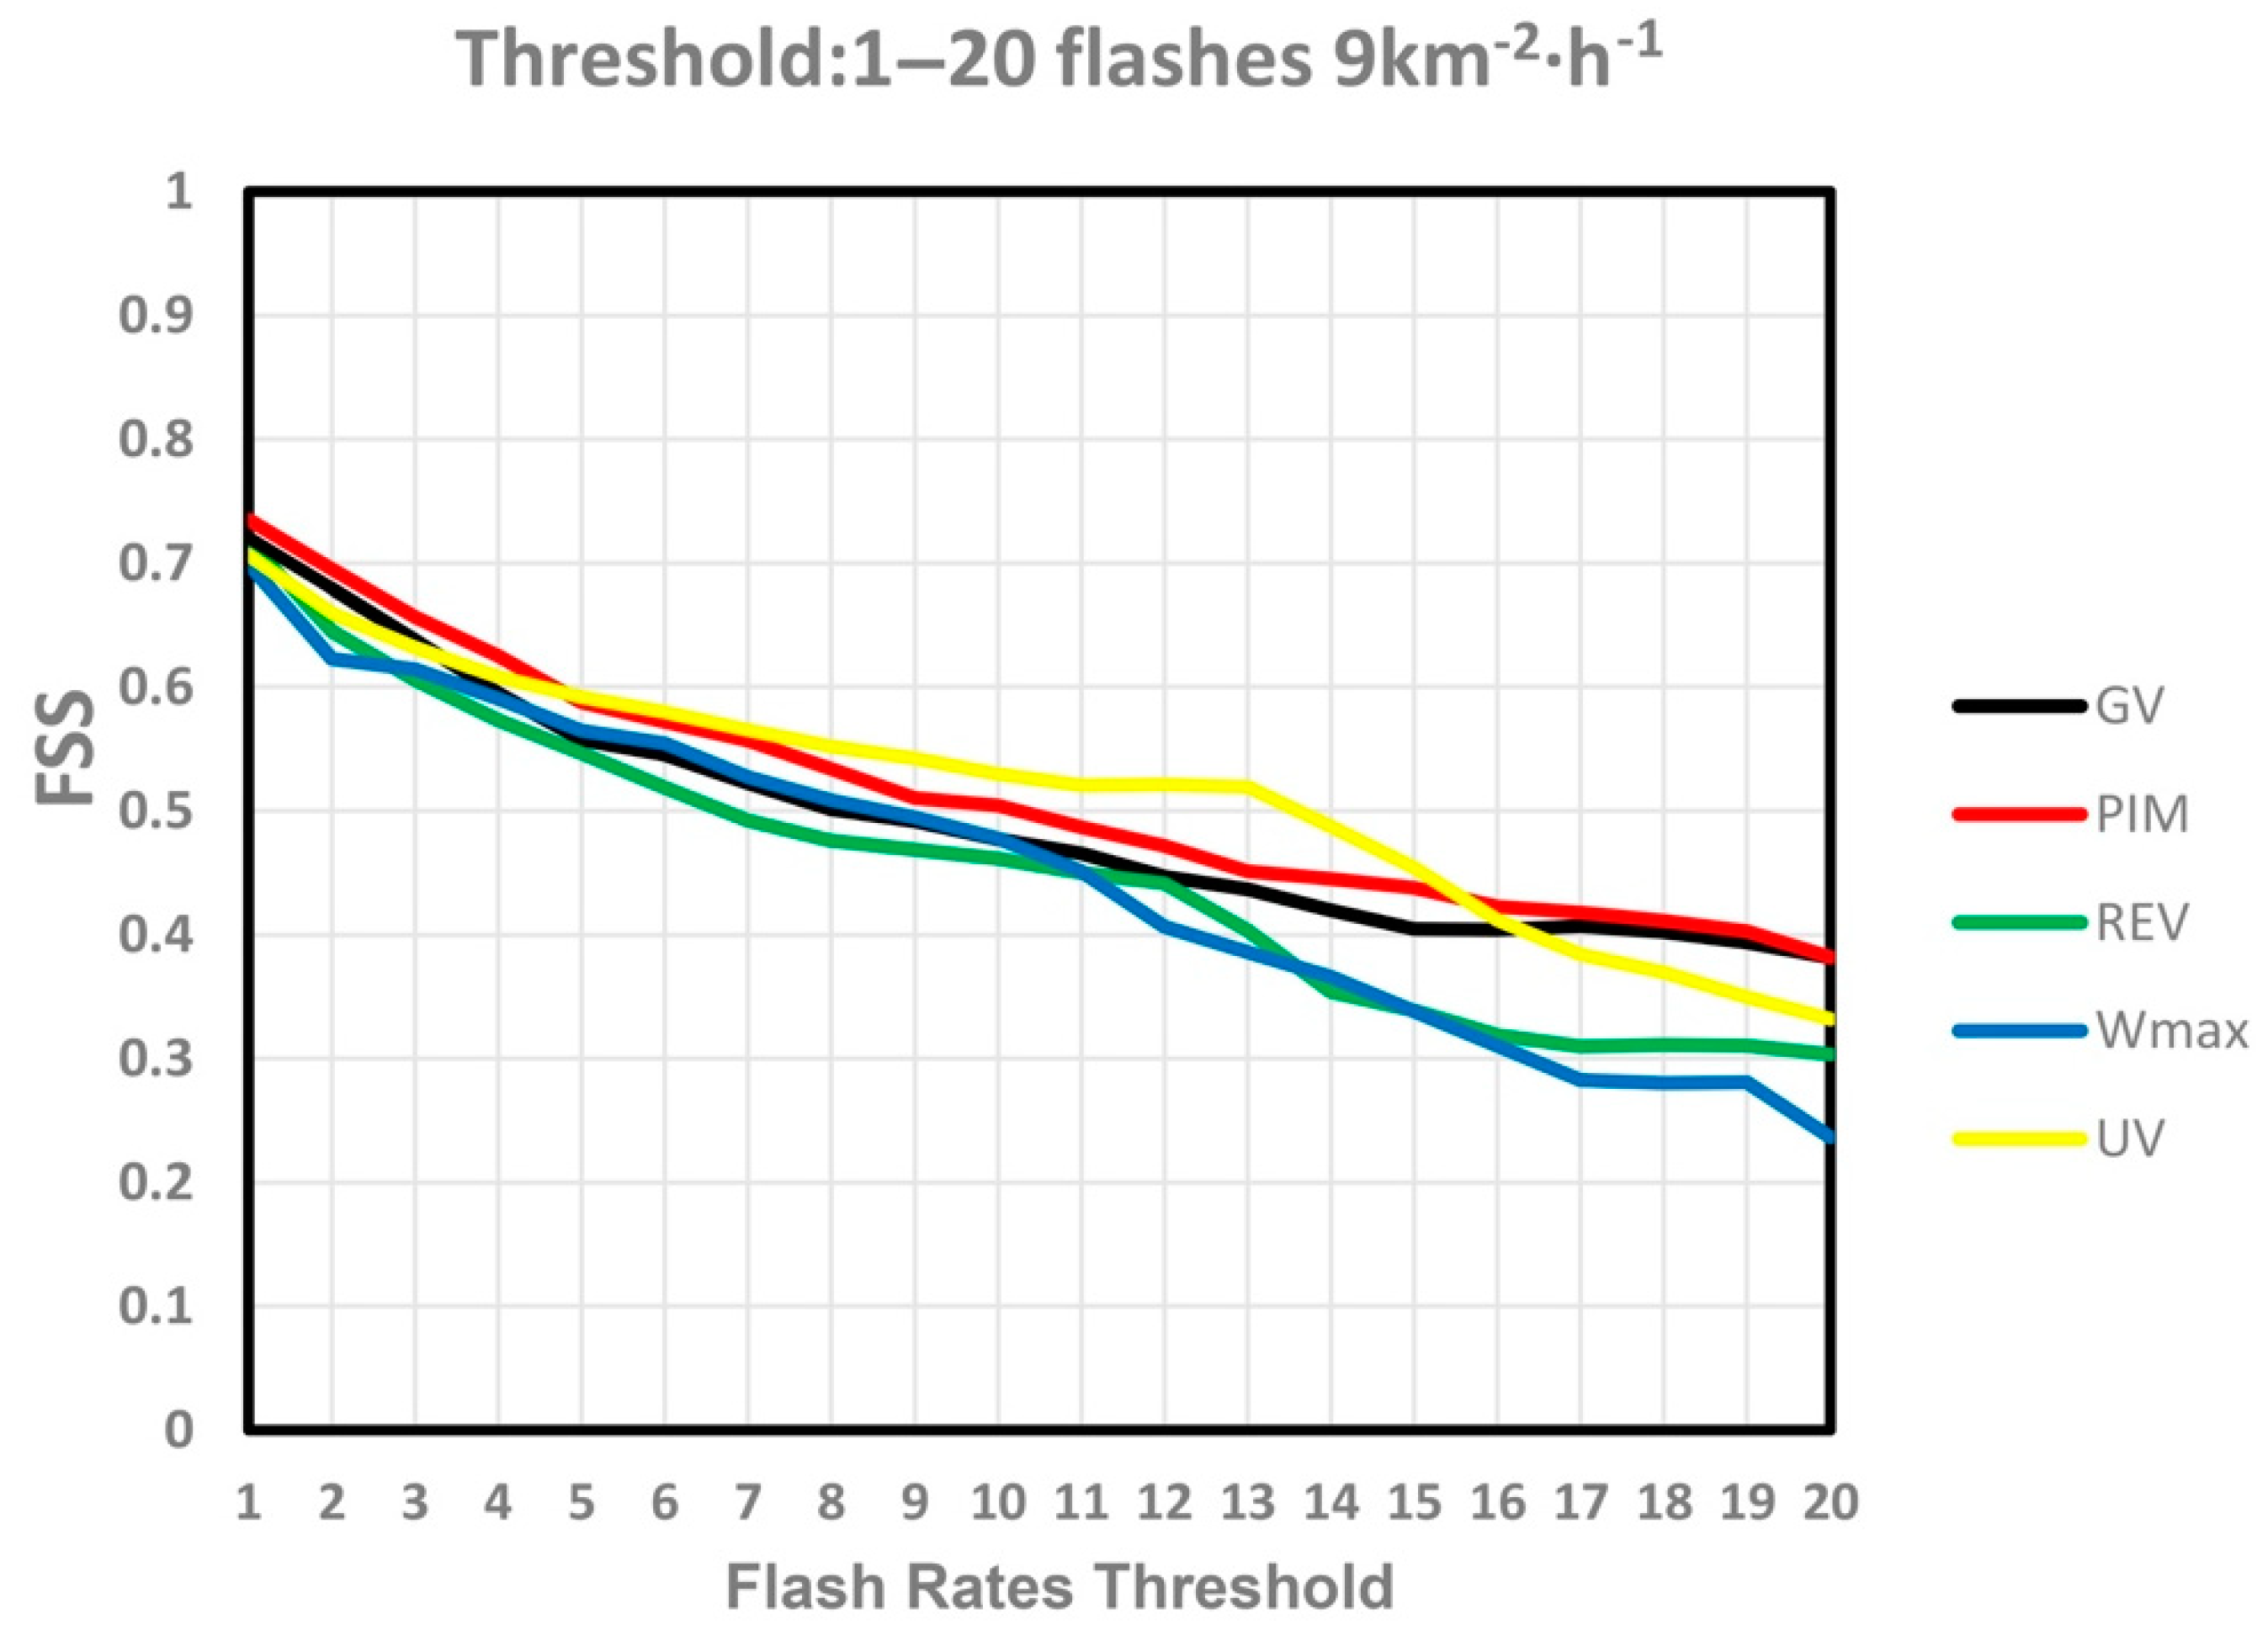
Since these five storm parameters are physically related (e.g., graupel volume are related to maximum updrafts), it is not surprised that there will not be much difference between the FSSs of these proxies. However, there was still a difference between the FSSs of these proxies. It can be seen in Figure 6, the FSS for different proxies ranged from 0.70 to 0.73 for the thresholds of 1 flash 9 km−2 h−1, ranged from 0.54 to 0.59 for the thresholds of 5 flash 9 km−2 h−1, ranged from 0.46 to 0.52 for the thresholds of 10 flash 9 km−2 h−1, ranged from 0.33 to 0.45 for the thresholds of 15 flash 9 km−2 h−1 and ranged from 0.23 to 0.39 for the thresholds of 20 flash 9 km−2 h−1, respectively.
By comparing the FSS statistics for different lightning flash rate thresholds (Figure 6), it can be found that the FSS values were decreasing as lightning flash rate thresholds increased for all the lightning diagnostic schemes with different proxies. FSS statistics with a threshold of 1 flash 9 km−2 h−1 suggest lightning diagnostic schemes are useful to indicate general tendencies for the occurrence, region, and time of lightning flash (FSS statistics for the threshold of 1 flash 9 km−2 h−1 were around 0.7 for each scheme). As mentioned in [34,38,39], a FSS value of >0.5 serves as a good indicator of a useful forecast when the probability that a particular grid point has an event (e.g., precipitation or lightning) is small (the probabilities are less than 0.0336, 0.0213, 0.0136 for 60-min, 30-min, and 12-min accumulated lightning flash rates, respectively, in the observations and simulations of this study). For thresholds from 1 to 3 and 16 to 20 flashes per 9 km2 per hour, the graupel contents related schemes (GV and PIM) achieved slightly higher FSS values compared with the other three schemes. For thresholds from 5 to 15 flashes per 9 km per hour the updraft volume related scheme (UV) yielded the largest FSS. For the threshold greater than 13 flashes per 9 km2 per hour, the FSS values were below 0.5 for all the lightning diagnostic schemes.
4. Conclusions
The potential of five storm parameters to be used as the proxy for the diagnosis of gridded total lightning flash rates has been investigated in a convection-allowing model. A complicated MCS occurred in Guangdong province of China was selected as the test case. Since the occurrence and location of lightning is sensitive to the characteristics of convective clouds, accurate simulation of convective clouds is a prerequisite for accurate simulation of lightning. In this study, radar data assimilation was used to improve the simulation accuracy of the convective clouds, hence providing strong instantaneous correlations between observed and simulated storm signatures. It has been shown that, by assimilating radar data, the WRF model reproduces the main features of the selected convective system well.
Five different microphysical and dynamical model parameters have been tested as the proxies for diagnosing gridded lightning flash rates. The optimal coefficients for each potential proxy were calibrated in term of lighting spatial coverages and grid cell lightning flash rates on the basis of the observed lightning flash rates and the simulated lightning flash rates. Subjective and quantitative evaluations suggest that all the five proxies (GV, PIC, REV, Wmax, UV) tested in this study are useful to indicate general tendencies for the occurrence, region, and time of lightning flash at convection-allowing scale (FSS statistics for the threshold of 1 flash 9 km−2 h−1 were around 0.7 for each scheme).
The FSS values were decreasing as the lightning flash rate thresholds used for FSS computation increased for all the lightning diagnostic schemes with different proxies. For thresholds from 1 to 3 and 16 to 20 flashes per 9 km2 per hour, the graupel contents related schemes (GV and PIM) achieved higher FSS values compared with the other three schemes. For thresholds from 5 to 15 flashes per 9 km2 per hour the updraft volume related scheme (UV) yielded the largest FSS. When the thresholds of lightning flash rates were greater than 13 flashes per 9 km2 per hour, the FSS values were below 0.5 for all the lightning diagnostic schemes with different proxies.
Author Contributions
Conceptualization, H.W.; methodology, X.Q.; H.W.; software, X.Q.; validation, H.W.; formal analysis, X.Q.; investigation, H.W.; resources, H.W.; data curation, H.W.; writing—original draft preparation, X.Q.; writing—review and editing, H.W.; visualization, X.Q.; supervision, H.W.; project administration, H.W. Both authors have read and agreed to the published version of the manuscript.
Funding
This work was supported by the National Natural Science Foundation of China: 41905097; the Foundation of Heavy Rain and Drought-Flood Disasters in Plateau and Basin Key Laboratory of Sichuan Province: SZKT201801; the Natural Science Foundation of the Jiangsu Higher Education Institution of China: 19KJB17000; Start-up Funds for Scientific Research of Nanjing University of Information Science and Technology: 2018r090.
Informed Consent Statement
Not applicable.
Data Availability Statement
The lightning data and radar reflectivity data used in this study are from Guangdong Meteorological Bureau and Meteorological Bureau of Shenzhen Municipality (https://data.szmb.gov.cn/). The NCEP GFS analysis data are available from the NCAR Research Data Archive (RDA, DOI: 10.5065/D65D8PWK; https://rda.ucar.edu/datasets/ds084.1/).
Acknowledgments
The authors would like to thank Guangdong Meteorological Bureau and Meteorological Bureau of Shenzhen Municipality for providing lightning data and radar reflectivity data used in this study. The model simulation is conducted in the High-Performance Computing Center of Nanjing University of Information Science & Technology, we acknowledge the High-Performance Computing Center of Nanjing University of Information Science & Technology for their support of this work.
Conflicts of Interest
The authors declare no conflict of interest.
References
- Schumann, U.; Huntrieser, H. The global lightning-induced nitrogen oxides source. Atmos. Chem. Phys. 2007, 7, 3823–3907. [Google Scholar] [CrossRef] [Green Version]
- Fierro, A.O.; Mansell, E.R.; Ziegler, C.L.; MacGorman, D.R. Application of a lightning data assimilation technique in the WRF-ARW model at cloud-resolving scales for the tornado outbreak of 24 May 2011. Mon. Weather Rev. 2012, 140, 2609–2627. [Google Scholar] [CrossRef]
- Fierro, A.O.; Clark, A.J.; Mansell, E.R.; MacGorman, D.R.; Dembek, S.R.; Ziegler, C.L. Impact of Storm-Scale Lightning Data Assimilation on WRF-ARW Precipitation Forecasts during the 2013 Warm Season over the Contiguous United States. Mon. Weather. Rev. 2015, 143, 757–777. [Google Scholar] [CrossRef]
- Mansell, E.R. Storm-scale ensemble Kalman filter assimilation of total lightning flash-extent data. Mon. Weather Rev. 2014, 142, 3683–3695. [Google Scholar] [CrossRef]
- Wang, H.; Liu, Y.; Cheng, W.Y.; Zhao, T.; Xu, M.; Liu, Y.; Shen, S.; Calhoun, K.M.; Fierro, A.O. Improving Lightning and Precipitation Prediction of Severe Convection using Lightning Data Assimilation with NCAR WRF-RTFDDA: A lightning data assimilation method. J. Geophys. Res. Atmos. 2017, 122, 12296–12316. [Google Scholar] [CrossRef]
- Wang, H.; Liu, Y.; Zhao, T.; Liu, Y.; Xu, M.; Shen, S.; Jiang, Y.; Yang, H.; Feng, S. Continuous assimilation of lightning data using time-lagged ensembles for a convection-allowing numerical weather prediction model. J. Geophys. Res. Atmos. 2018, 123, 9652–9673. [Google Scholar] [CrossRef]
- Fierro, A.O.; Mansell, E.R.; MacGorman, D.R.; Ziegler, C.L. The Implementation of an Explicit Charging and Discharge Lightning Scheme within the WRF-ARW Model: Benchmark Simulations of a Continental Squall Line, a Tropical Cyclone, and a Winter Storm. Mon. Weather Rev. 2013, 141, 2390–2415. [Google Scholar] [CrossRef]
- Mostajabi, A.; Finney, D.L.; Rubinstein, M.; Rachidi, F. Nowcasting lightning occurrence from commonly available meteorological parameters using machine learning techniques. NPJ Clim. Atmos. Sci. 2019, 2, 1–15. [Google Scholar] [CrossRef]
- Moon, S.H.; Kim, Y.H. Forecasting lightning around the Korean Peninsula by postprocessing ECMWF data using SVMs and undersampling. Atmos. Res. 2020, 5, 105026. [Google Scholar] [CrossRef]
- Carey, L.D.; Rutledge, S.A. A multiparameter radar case study of the microphysical and kinematic evolution of a lightning producing storm. Meteorol. Atmos. Phys. 1996, 59, 33–64. [Google Scholar] [CrossRef]
- Prigent, C.; Defer, E.; Pardo, J.R.; Pearl, C.; Rossow, W.B.; Pinty, J. Relations of polarized scattering signatures observed by the TRMM Microwave instrument with electrical processes in cloud systems. Geophys. Res. Lett. 2005, 32, L04810. [Google Scholar] [CrossRef] [Green Version]
- Wiens, K.C.; Rutledge, S.A.; Tessendorf, S.A. The 29 June 2000 Supercell Observed during STEPS. Part II: Lightning and Charge Structure. J. Atmospheric Sci. 2005, 62, 4151–4177. [Google Scholar] [CrossRef]
- Lang, T.J.; Rutledge, S.A. Relationships between con- vective storm kinematics, precipitation, and lightning. Mon. Weather Rev. 2002, 130, 2492–2506. [Google Scholar] [CrossRef]
- Deierling, W.; Petersen, W.A.; Latham, J.; Ellis, S.; Christian, H.J. The relationship between lightning activity and ice fluxes in thunderstorms. J. Geophys. Res. Atmos. 2008, 113. [Google Scholar] [CrossRef] [Green Version]
- Reynolds, S.E.; Brook, M.; Gourley, M.F. Thunderstorm Charge Separation. J. Atmos. Sci. 1957, 14, 426–436. [Google Scholar] [CrossRef] [Green Version]
- Williams, E.R.; Lhermitte, R.M. Radar Tests of the Precipitation Hypothesis for Thunderstorm Electrification. J. Geophys. Res. Ocean. 1983, 88, 10984–10992. [Google Scholar] [CrossRef]
- Saunders, C.P.R. A Review of Thunderstorm Electrification Processes. J. Appl. Meteorol. 1993, 32, 642–655. [Google Scholar] [CrossRef]
- Takahashi, T. Riming Electrification as a Charge Generation Mechanism in Thunderstorms. J. Atmos. Sci. 1978, 35, 1536–1548. [Google Scholar] [CrossRef]
- McCaul, E.W., Jr.; Goodman, S.J.; LaCasse, K.M.; Cecil, D.J. Forecasting Lightning Threat Using Cloud-Resolving Model Simulations. Weather Forecast. 2009, 24, 709–729. [Google Scholar] [CrossRef]
- Blyth, A.M.; Christian, H.J., Jr.; Driscoll, K.; Gadian, A.M.; Latham, J. Determination of ice precipitation rates and thunderstorm anvil ice contents from satellite observations of lightning. Atmos. Res. 2001, 59, 217–229. [Google Scholar] [CrossRef]
- Deierling, W.; Petersen, W.A. Total lightning activity as an indicator of updraft characteristics. J. Geophys. Res. Atmos. 2008, 113. [Google Scholar] [CrossRef] [Green Version]
- Lund, N.R.; MacGorman, D.R.; Schuur, T.J.; Biggerstaff, M.I.; Rust, W.D. Relationships between Lightning Location and Polarimetric Radar Signatures in a Small Mesoscale Convective System. Mon. Weather Rev. 2009, 137, 4151–4170. [Google Scholar] [CrossRef] [Green Version]
- Liu, C.; Cecil, D.J.; Zipser, E.J.; Kronfeld, K.; Robertson, R. Relationships between lightning flash rates and radar reflectivity vertical structures in thunderstorms over the tropics and subtropics. J. Geophys. Res. 2012, 117. [Google Scholar] [CrossRef] [Green Version]
- Petersen, W.A.; Christian, H.J.; Rutledge, S.A. TRMM observations of the global relationship between ice water content and lightning. Geophys. Res. Lett. 2005, 32, 2471–2494. [Google Scholar] [CrossRef] [Green Version]
- Cecil, D.J.; Goodman, S.J.; Boccippio, D.J.; Zipser, E.J.; Nesbitt, S.W. Three Years of TRMM Precipitation Features. Part I: Radar, Radiometric, and Lightning Characteristics. Mon. Wea. Rev. 2005, 133, 543–566. [Google Scholar] [CrossRef] [Green Version]
- Barthe, C.; Deierling, W.; Barth, M.C. Estimation of total lightning from various storm parameters: A cloud-resolving model study. J. Geophys. Res. 2010, 115, D24202. [Google Scholar] [CrossRef]
- Basarab, B.M.; Rutledge, S.A.; Fuchs, B.R. An improved lightning flash rate parameterization developed from Colorado DC3 thunderstorm data for use in cloud-resolving chemical transport models. J. Geophys. Res. Atmos. 2015, 120. [Google Scholar] [CrossRef]
- Chen, F.; Dudhia, J. Coupling an Advanced Land Surface–Hydrology Model with the Penn State–NCAR MM5 Modeling System. Part I: Model Implementation and Sensitivity. Mon. Weather Rev. 2001, 129, 569–585. [Google Scholar] [CrossRef] [Green Version]
- Ek, M.B. Implementation of Noah land surface model advances in the National Centers for Environmental Prediction operational mesoscale Eta model. J. Geophys. Res. Atmos. 2003, 108, 8851. [Google Scholar] [CrossRef]
- Thompson, G.; Field, P.R.; Rasmussen, R.M.; Hall, W.D. Explicit Forecasts of Winter Precipitation Using an Improved Bulk Microphysics Scheme. Part II: Implementation of a New Snow Parameterization. Mon. Weather Rev. 2008, 136, 5095–5115. [Google Scholar] [CrossRef]
- Janjic, Z.I. The step-mountain eta coordinate model: Further developments of the convection, viscous sublayer, and turbulence closure schemes. Mon. Weather Rev. 1994, 122, 927–945. [Google Scholar] [CrossRef] [Green Version]
- Iacono, M.J.; Delamere, J.S.; Mlawer, E.J.; Shephard, M.W.; Clough, S.A.; Collins, W.D. Radiative forcing by long-lived greenhouse gases: Calculations with the AER radiative transfer models. J. Geophys. Res. 2008, 113, D13103. [Google Scholar] [CrossRef]
- Grell, G.A.; Freitas, S.R. A scale and aerosol aware stochastic convective parameterization for weather and air quality modeling. Atmos. Chem. Phys. 2013, 13, 5233–5250. [Google Scholar] [CrossRef]
- Roberts, N.M.; Lean, H.W. Scale-Selective Verification of Rainfall Accumulations from High-Resolution Forecasts of Convective Events. Mon. Weather Rev. 2008, 136, 78. [Google Scholar] [CrossRef]
- Zhang, Y.; Lü, W.; Chen, S.; Zheng, D.; Zhang, Y.; Yan, X.; Pan, H. Areview of advances in lightning observations during the past decade in Guangdong, China. J. Meteorol. Res. 2016, 30, 800–819. [Google Scholar] [CrossRef]
- Hu, M.; Xue, M. Implementation and evaluation of cloud analysis with WSR-88D reflectivity data for GSI and WRF-ARW. Geophys. Res. Lett. 2007, 34. [Google Scholar] [CrossRef] [Green Version]
- Huang, Y.; Liu, Y.; Xu, M.; Liu, Y.; Pan, L.; Wang, H.; Cheng, W.Y.; Jiang, Y.; Lan, H.; Yang, H.; et al. Forecasting severe convective storms with WRF-based RTFDDA radar data assimilation in Guangdong, China. Atmos. Res. 2018, 209, 131–143. [Google Scholar] [CrossRef]
- Skok, G.; Nigel, R. Analysis of Fractions Skill Score properties for random precipitation fields and ECMWF forecasts. Q. J. R. Meteorol. Soc. 2016, 142, 2599–2610. [Google Scholar] [CrossRef]
- Skok, G. Analysis of Fraction Skill Score properties for a displaced rainband in a rectangular domain. Meteorol. Appl. 2015, 22, 477–484. [Google Scholar] [CrossRef]
Figure 1.
Composite radar reflectivity (dBZ) at (a,e) 0800 UTC; (b,f) 1000 UTC; (c,g) 1300 UTC; (d,h) 1400 UTC. (a–d) are from the simulations, and (e–h) are from the observations. The 35 dBZ reflectivity contours from the observations are shown in the panels of the correspondent simulations (in thick black). The areas out of the radar detection ranges are shown as light blue shades.

Figure 2.
FSS of the simulated composite radar reflectivity for different thresholds.

Figure 3.
FSS of the simulated lightning flash rates for the different thresholds used to compute the corresponding volume for lightning diagnostic scheme using the proxy of (a) GV, (c) REV and (e) UV. FSS of the simulated lightning flash rates for the different filter thresholds for lightning diagnostic scheme using the proxy of (b) PIM and (d) Wmax. The abbreviations of each proxy are defined in Section 3.2.

Figure 4.
The total lightning flash rates (at 9 km2) accumulated over two 12 min periods. (a1,b1) are from the observations, and (a2–a6), (b2–b6) are from the different lightning diagnostic schemes with different proxies. The abbreviations of each lightning diagnostic scheme are labeled in each panel.

Figure 5.
As in Figure 4, but accumulated over two 60 min periods. (a1,b1) are from the observations, and (a2–a6), (b2–b6) are from the different lightning diagnostic schemes with different proxies. The abbreviations of each lightning diagnostic scheme are labeled in each panel.
Figure 5.
As in Figure 4, but accumulated over two 60 min periods. (a1,b1) are from the observations, and (a2–a6), (b2–b6) are from the different lightning diagnostic schemes with different proxies. The abbreviations of each lightning diagnostic scheme are labeled in each panel.

Figure 6.
FSS statistics of hourly lightning flash rates simulated by different lightning diagnostic schemes with different proxies for the thresholds from 1 flash 9 km−2 h−1 to 20 flashes 9 km−2 h−1.
Figure 6.
FSS statistics of hourly lightning flash rates simulated by different lightning diagnostic schemes with different proxies for the thresholds from 1 flash 9 km−2 h−1 to 20 flashes 9 km−2 h−1.


Table 1.
Summary of lightning diagnostic schemes with different proxies.
| Parameter (Units) | Equation | Parameter and Threshold Used to Compute the Corresponding Volume | Filter Parameter and Threshold | Linear Coefficient (k) |
|---|---|---|---|---|
| Graupel volume (km3) | qg (0.5 g∙kg−1) | / | 0.447934 | |
| Precipitation ice mass (kg) | / | Column-maximum qg (0.6 g∙kg−1) | 0.256011 | |
| Radar echo volume (km3) | Reflectivity (44 dBZ) | / | 0.213345 | |
| Maximum updraft (m∙s−1) | / | Maximum updraft (3 m∙s−1) | 0.055901 | |
| Updraft volume (km3) | Updraft (3 m∙s−1) | / | 0.175862 |
Publisher’s Note: MDPI stays neutral with regard to jurisdictional claims in published maps and institutional affiliations. |
© 2021 by the authors. Licensee MDPI, Basel, Switzerland. This article is an open access article distributed under the terms and conditions of the Creative Commons Attribution (CC BY) license (http://creativecommons.org/licenses/by/4.0/).
Share and Cite
MDPI and ACS Style
Qian, X.; Wang, H. Evaluation of Different Storm Parameters as the Proxies for Gridded Total Lightning Flash Rates: A Convection-Allowing Model Study. Atmosphere 2021, 12, 95. https://doi.org/10.3390/atmos12010095
AMA Style
Qian X, Wang H. Evaluation of Different Storm Parameters as the Proxies for Gridded Total Lightning Flash Rates: A Convection-Allowing Model Study. Atmosphere. 2021; 12(1):95. https://doi.org/10.3390/atmos12010095
Chicago/Turabian StyleQian, Xinyao, and Haoliang Wang. 2021. "Evaluation of Different Storm Parameters as the Proxies for Gridded Total Lightning Flash Rates: A Convection-Allowing Model Study" Atmosphere 12, no. 1: 95. https://doi.org/10.3390/atmos12010095
Note that from the first issue of 2016, this journal uses article numbers instead of page numbers. See further details here.