Coastal Upwelling Limitation by Onshore Geostrophic Flow in the Gulf of Guinea Around the Niger River Plume
 Gaël Alory1*
  Casimir Yélognissè Da-Allada2,3,4
  Sandrine Djakouré5
  Isabelle Dadou1 Julien Jouanno1
  Dorelle Prudence Loemba2,6
- 1LEGOS, CNES/CNRS/IRD/UPS, Toulouse, France
- 2ICMPA-UNESCO Chair, Univ. Abomey-Calavi, Cotonou, Benin
- 3LaGEA/ENSTP/UNSTIM, Abomey, Benin
- 4LHMC/IRHOB, Cotonou, Benin
- 5LASMES (ex LAPA-MF) Univ. Félix Houphouët-Boigny, Abidjan, Côte d’Ivoire
- 6IRSEN, Pointe Noire, Congo
Wind-driven coastal upwelling can be compensated by onshore geostrophic flow, and river plumes are associated with such flow. We investigate possible limitation of the northeast Gulf of Guinea upwelling by the Niger River plume, using regional ocean model simulations with or without river and dynamical upwelling indices. Here, the upwelling is weakened by 50% due to an onshore geostrophic flow equally controlled by alongshore thermosteric and halosteric sea-level changes. The river contributes to only 20% of this flow, as its plume is shallow while upwelling affects coastal temperature and salinity over a larger depth. Moreover, the river-induced mixed-layer thinning compensates the current increase, with no net effect on upwelling. The geostrophic compensation is due to an abrupt change in coastline orientation that creates the upwelling cross-shore front. The river nonetheless warms the upwelling tongue by 1°C, probably due to induced changes in horizontal advection and/or stratification.
Introduction
Coastal upwelling is influenced by numerous processes, beyond the off-shore Ekman transport due to alongshore wind that drives the Eastern Boundary Upwelling Systems (EBUS). Coastal upwelling can be controlled or modulated by Ekman pumping due to wind curl (Capet et al., 2004; Gutknecht et al., 2013; Junker et al., 2015; Desbiolles et al., 2016; Renault et al., 2016), interactions of coastal currents with topography of the coast and shelf (Preller and O’Brien, 1980; Oke and Middleton, 2000; Rodrigues and Lorenzzetti, 2001; Gan et al., 2009a), sometimes through coastal cyclonic eddies (Tranter et al., 1986; Calado et al., 2010; Djakouré et al., 2014), eddy-induced shoreward flux through the upwelling density front (Gruber et al., 2011; Colas et al., 2013; Gutknecht et al., 2013), coastal Kelvin waves (Hormazabal et al., 2001; Pietri et al., 2014; Bachèlery et al., 2016), and cross-shore geostrophic flow (Marchesiello and Estrade, 2010; Ndoye et al., 2017). In particular, the latter compensates offshore Ekman transport and prevents the existence of a large EBUS along the western coast of Australia, due to the strong alongshore pressure gradient created by the Indonesian Throughflow and associated poleward Leeuwin Current (Weaver and Middleton, 1989; Rossi et al., 2013).
Dynamical interactions between coastal upwelling and river plume have also been reported. The plume can cap the upwelling if wind is too weak to break the haline stratification (Hickey et al., 2005). The stratification can also alter the wind-driven upwelling circulation by thinning and strengthening both the offshore transport in the plume and the onshore transport beneath it, though this superficial effect does not change the intensity of the upwelling (Gan et al., 2009b). Low-salinity river plumes create lateral pressure gradients inducing surface geostrophic currents that projects onshore at the coast, to the right of the estuary in the northern hemisphere (Fong and Geyer, 2002). Therefore, the geostrophic limitation of coastal upwelling seems possible in regions where the phenomenon occurs next to a large river plume, though it has not been evidenced yet. We intend here to investigate the relevance of this process, by examining the case of coastal upwelling around the Niger River in the Gulf of Guinea.
Coastal upwelling occurs in summer (July–August–September) along the northern coast of the Gulf of Guinea (Figure 1A). Though it has been successively attributed to several of the above processes (Ingham, 1970; Picaut, 1983; Philander and Pacanowski, 1986; Binet, 1997), most recent studies show it is primarily controlled by detachment of a coastal current behind a cape and Ekman transport in its western and eastern parts, respectively (Djakouré et al., 2014, 2017). It extends over 1,000 km along the coast of West Africa, from Côte d’Ivoire to Nigeria where the Niger River, the largest in the region with 5,600 m3.s−1, creates a large low-salinity plume. This configuration is excellent to investigate possible coastal upwelling limitation by salinity-driven onshore geostrophic flow, using a realistic high-resolution regional ocean model simulation.
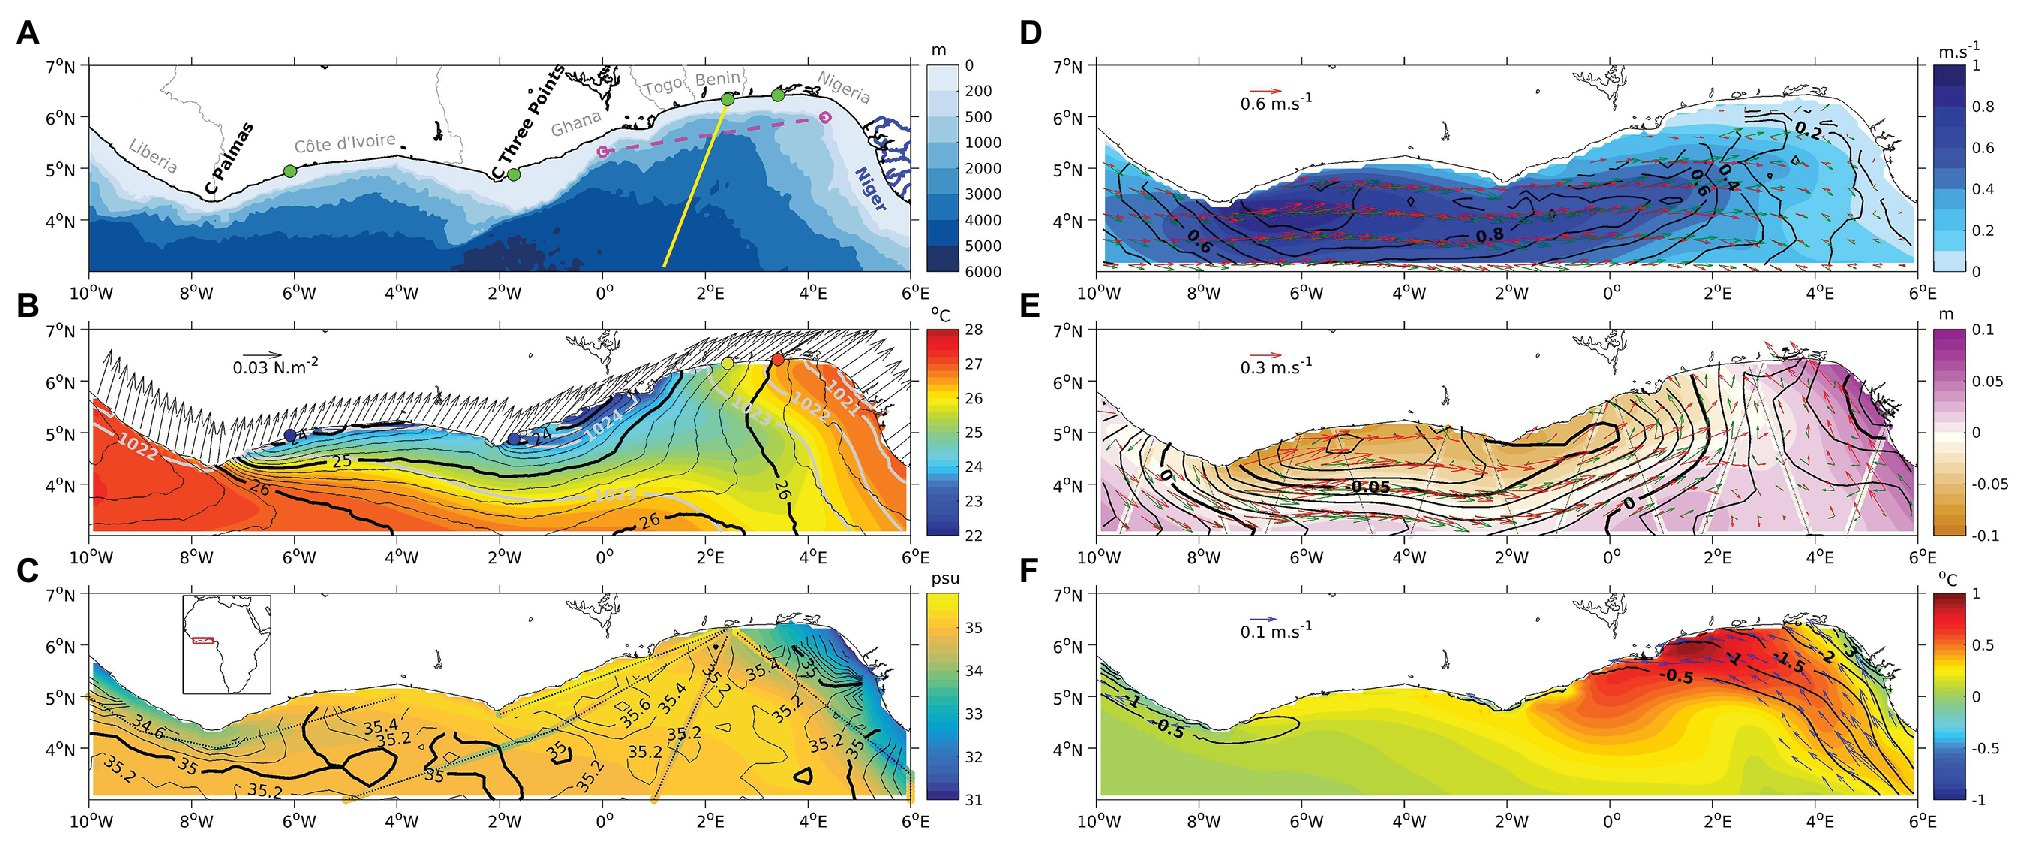
Figure 1. Mean summer conditions on the 2010–2017 period (unless specified otherwise): (A) Area of study with geographic features, bathymetry (colors), location of coastal stations (green dots), cross-shore section used in Figure 2 (yellow line), and alongshore section used in Figure 3C (pink dashed line); (B) SST (colors) and surface density (gray contours, in kg.m−3) from REF simulation, compared with the MUR SST satellite product (black contours), PROPAO in situ SST at 4 coastal stations (2008–2012 summer period, colored dots), and DFS coastal wind stress (vectors) used for model forcing; (C) SSS (colors) from REF simulation, compared with the SMOS SSS satellite product (black contours) and repeated 2000–2018 TSG transects (colored tracks); (D) surface currents from REF simulation (red vectors, amplitude in colors), compared with currents from surface drifters (1979–2019, green vectors, amplitude in contours); (E) SSH (colors) and surface geostrophic currents (red vectors) from REF simulation, compared with X-TRACK SSH (colored tracks), CMEMS SSH satellite product (black contours), and surface geostrophic currents (green vectors); (F) differences between the REF and noRIV simulations, in SST (colors), SSS (contours), and surface geostrophic currents (arrows, only differences larger than 0.05 m.s−1 shown). Note that the scale of vectors is different for (D–F).
Model and Data
Model
The numerical setup is based on the Nucleus for European Modeling of the Ocean (NEMO; Madec, 2016) code and consists of an eddy-resolving configuration of the equatorial and Southern Tropical Atlantic at 1/12° horizontal resolution (32°S–15°N and 60°W–20°E) with 75 vertical levels, embedded in a coarser eddy-permitting Tropical Atlantic configuration at 1/4° horizontal resolution (35°S–35°N and 100°W–20°E). This configuration is already used and detailed in Assene et al. (2020). At the surface, atmospheric fluxes are provided by bulk formulae (Large and Yeager, 2009) and forced with the DFS 5.2 (Drakkar Forcing Set version 5.2) product (Dussin et al., 2016). A monthly climatological runoff based on the Dai and Trenberth (2002) dataset is prescribed near river mouths as a surface freshwater flux with increased vertical mixing in the upper 10 m. A reference simulation (“REF”) was run over the period 2000–2017, as well as a twin simulation (“noRIV”) where runoff from rivers is removed. The increased vertical mixing near river mouths is maintained in the latter to ensure that differences between simulations are only due to changes in the freshwater flux. The regional coarse-grid configuration could resolve the variability of the upwelling north of the Gulf of Guinea (Jouanno et al., 2011), the Gulf of Guinea salinity distribution and variability (e.g., Da-Allada et al., 2017; Awo et al., 2018).
Ancillary Data
Different in situ and satellite datasets were used for model validation. Unless specified otherwise, a common 2010–2017 reference period was used to compute a climatological summer average. On this period, the climatology is probably representative as the seasonal cycle is dominant in the tropical Atlantic (Xie and Carton, 2004) and the interannual climatic modes show a balanced activity (Awo et al., 2018; Lübbecke et al., 2018).
Sea surface temperature (SST) measurements were collected in situ over 2008–2012 through the Research Program in Physical Oceanography in West Africa (PROPAO), which relies on a network of 4 coastal stations with ONSET sensors (Sohou et al., 2020). The monthly version of the Multi-scale Ultra-high Resolution (MUR) global satellite SST analysis is a blended product combining infrared and microwave satellite observations, with a 0.01° resolution (Chin et al., 2017).
Sea surface salinity (SSS) measurements were collected in situ from underway thermosalinographs (TSG) during eight cruises or crossings of French research and commercial ships in the Gulf of Guinea during the summer season between 2000 and 2018 (Alory et al., 2015; Gaillard et al., 2015; Bourlès et al., 2019). We also use satellite SSS from the Soil Moisture Ocean Salinity (SMOS) debiased L3 v4 product, with a 0.25° resolution, which benefits from a correction of systematic biases near the coasts and adjustment of the long term mean in dynamical areas like river plumes (Boutin et al., 2018).
A monthly 0.25° climatology of near-surface velocity from satellite-tracked drifting buoy observations, covering the 1979–2019 period, was used (Laurindo et al., 2017). This product is based on trajectories from both drifters with drogue (centered around 15 m depth) and drifters having lost their drogue, which are corrected from wind drift bias.
The altimetric sea surface height (SSH) and surface geostrophic currents used in this study are from the Salto/Duacs gridded product distributed by the Copernicus Marine Environment Monitoring Service (CMEMS), combining data from multiple satellite missions interpolated on a daily 0.25° grid (Le Traon et al., 1998; Ducet et al., 2000). The along-track coastal altimetry X-TRACK product with a 7-km and 10-day resolution (Birol et al., 2017) is also used and already validated using tide gauge data in the studied area (Dieng et al., 2019). For comparison, the respective model and altimetric SSH regionally averaged means are removed. We also decomposed the time-averaged alongshore gradient of SSH into a mass and steric contribution, and the latter into a thermosteric and halosteric contribution using the modeled fields as in Llovel et al. (2019), which is not possible from satellite data.
Subsurface temperature and salinity were extracted from the World Ocean Atlas (WOA; Locarnini et al., 2018; Zweng et al., 2018). We used the seasonally averaged climatological product, with a 0.25° horizontal and a 5-m vertical resolution in the upper 100 m, based on optimal interpolation of all available hydrological profiles. From this product, we derived density and specific volume and then geostrophic velocity by downward integration of horizontal gradients of specific volume anomalies, using the altimetric geostrophic velocity as a boundary condition at the surface.
We also used direct measurements of subsurface currents from a ship-mounted Acoustic Doppler Current Profiler (ADCP) collected during the Prediction and Research Moored Array in the Tropical Atlantic (PIRATA) cruises (Herbert et al., 2015). They provide both velocity components below 20 m depth with an 8-m vertical and 0.5-km along-ship-track resolution. We selected data from a transect that was repeated three times in summer 2017 and 2018. We interpolated these data on the model grid and averaged them to compare with the model summer mean current.
Results and Discussion
Upwelling Surface Signature
In summer, upwelling signature appears in the model as a coastal cooling reaching about 5°C lower than offshore SST, with a primary minimum around 0°E off Ghana east of Cape Three-Points, and a secondary minimum around 5°W off Côte d’Ivoire, east of Cape Palmas (Figure 1B). According to recent modeling studies, Ekman transport is the main driver of the eastern cell (Djakouré et al., 2017). It is indeed obvious that the largest eastern cooling matches the most alongshore-oriented winds, while winds have a much weaker alongshore projection in the western cell. Both upwelling cells merge offshore in a cold tongue extending south-eastward, up to 3°N, again probably due to Ekman circulation to the right of the winds, which shift clockwise from southerlies to west-southerlies, from west to east in the northern Gulf of Guinea. The SST pattern is largely consistent between the model and satellite observations, although simulated SST gradients are stronger near the coasts and compare better alongshore with the in situ stations (Figure 1B).
Upwelling also has a signature in SSS, with waters in the cold upwelling tongue up to 0.4 psu saltier than surrounding waters in the model (Figure 1C). This indicates that upwelled waters are saltier than surface waters, as expected in this highly stratified region with strong freshwater inputs due to the rains associated with the intertropical convergence zone and river runoffs (Da-Allada et al., 2013). The Niger River creates a low-salinity plume with waters below 30 psu near the coast, which extends westward until it meets the eastern edge of the salty upwelling tongue. A secondary coastal freshening appears west of 6°W, due to a rain maximum associated with Guinea highlands, and many rivers that flow from here to the coast of Liberia. Although the SMOS satellite has limitations near the coast due to land shadowing, it captures all these SSS patterns, though they are patchier than in the higher-resolution model. TSG transects confirm the coastal river-induced freshening and salty upwelling tongue, with differences that may be due to interannual variability inherent to the sparse sampling.
Both SST and SSS contribute to surface density variations (Figures 1B,C): cold and salty waters upwelled at the coast create a density maximum extending offshore, while the low-salinity Niger plume creates a density minimum. The 1,023-kg.m−3 isopycnal level, which delimits cold/salty waters to the west and warm/fresh waters to the east, meets the coast around 2°E where this temperature and salinity “Togo-Benin front” was formerly noted (Picaut, 1983).
Surface Circulation
Regional surface circulation is dominated by the eastward Guinea Current (Figure 1D), strongest in summer (Djakouré et al., 2014). Its detachment downstream of Cape Palmas is the main driver of the western upwelling cell (Djakouré et al., 2017). The model is largely consistent with drifter observations, although the simulated Guinea Current is slightly stronger, with a maximum close to 1 m.s−1, and more zonal with smaller meridional meanders than observed. East of around 2°E, the Guinea Current slows down, modeled and observed currents are small but not consistent near the coast.
Spatial SSH variations (Figure 1E) largely reflect the surface density pattern (Figure 1B) in the model, in reverse. This suggests that steric height changes are dominated by near-surface hydrologic variations in this region. The lowest SSH is found in the coastal upwelling centers while the highest SSH is found in the Niger plume. This creates a 10-cm eastward increase of SSH along the coast between 0° and 5°E. Offshore, the Guinea Current is largely geostrophic, related to the equatorward SSH gradient. However, its total velocity (Figure 1D) is increased by an eastward Ekman component due to the north-northeastward orientation of winds (Figure 1B). East of 2°E, the eastward flow is replaced by a northwestward geostrophic flow, right along the flank of the Niger plume salinity gradient. The model compares well with SSH (gridded and along-track) and geostrophic currents derived from altimetry in the Guinea Current region. East of 1°E, the model simulates stronger currents with shifts in direction compared to altimetry, but both show a similar onshore component near the coast. Differences may be due to the lower spatial resolution (1/4°) of altimetry compared to the model (1/12°). Moreover, the CMEMS geostrophic current product is smoothed in the latitude band 5°N–5°S due to the change in the geostrophic calculation from the f-plane to the beta-plane approximation (Pujol et al., 2016).
Subsurface Conditions
The vertical section around 2°E cuts through the coastal upwelling tongue around 5°N, which shows clearly in the rise of isotherms and isohalines at this latitude near the surface, shifting north with depth, in the model (Figures 2A,B). The observations, relatively spare in this region, are smoother and show a more linear slope of these isolines that however fits that of the model around 30-m depth.
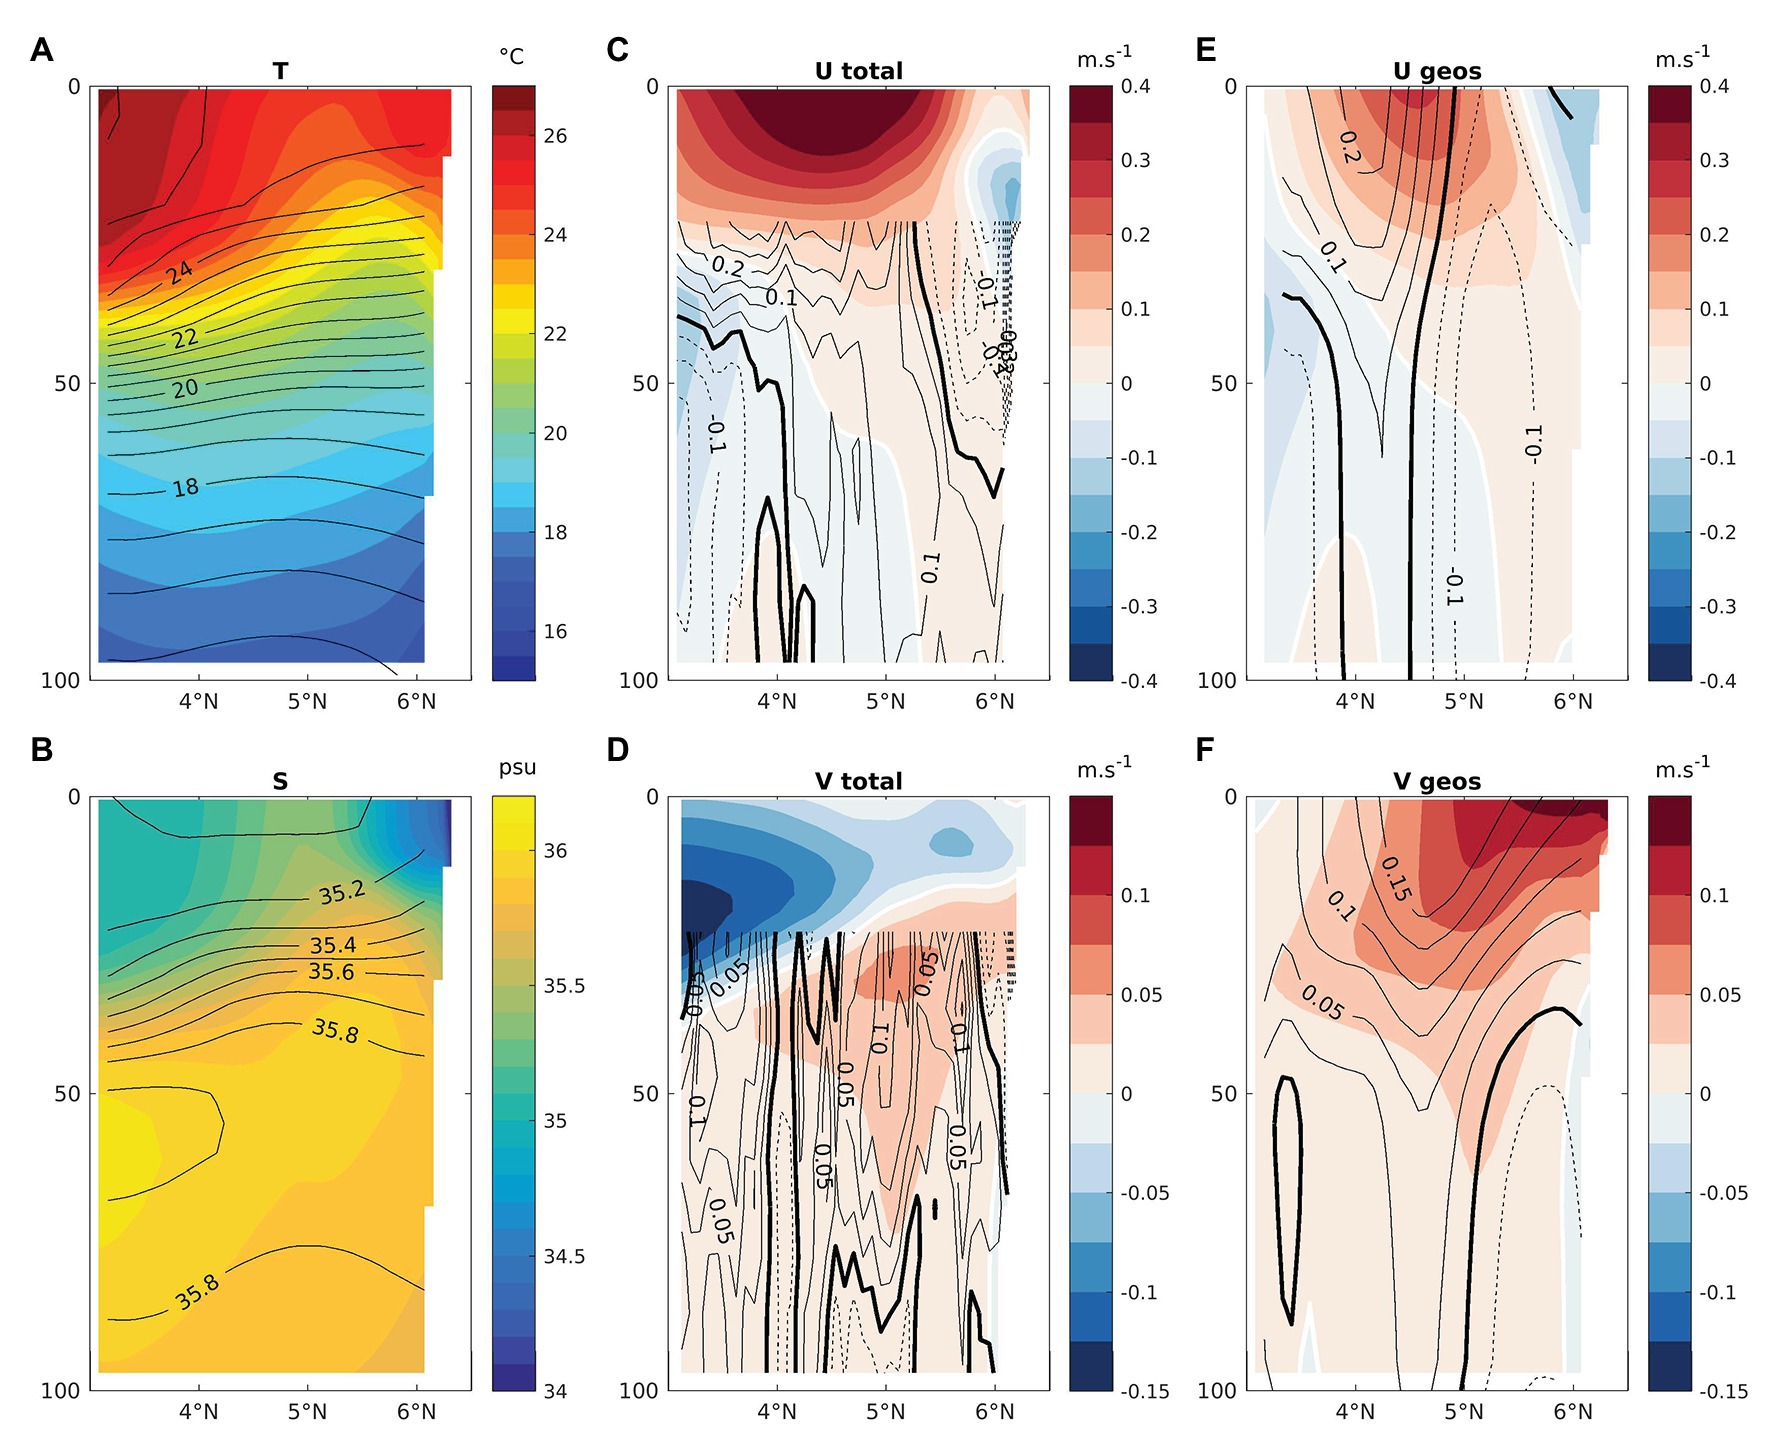
Figure 2. Mean summer cross-shore 0–100-m vertical sections (yellow line in Figure 1A). (A) Temperature and (B) salinity from REF simulation (colors) and WOA (contours). (C) Zonal and (D) meridional components of the total current from REF simulation (colors) and ADCP (contours, dashed when negative). (E) Zonal and (F) meridional components of the geostrophic current computed from REF simulation (colors) and CMEMS SSH + WOA profiles (contours, dashed when negative).
The zonal current section (Figure 2C) shows the Guinea Current in the upper 50 m, the westward Guinea Counter Current closer to the coast, above the Guinea Under Current, and the northern branch of the South Equatorial Current closer to the equator (Herbert et al., 2016). Compared to the model, the observed structures are shifted south and deeper, maybe because a few snapshots do not reflect the seasonal climatology. The meridional current section (Figure 2D) clearly shows an upwelling cell with coastal offshore flow in the upper 20 m and onshore flow below in the model. Observed currents are also mostly northward below 20 m but with a more complex structure.
The same zonal structures described above are found in the geostrophic current section (Figure 2E), with smaller amplitude but with a similar shift between model and observations. Meridional geostrophic currents (Figure 2F) are onshore above 40 m and slightly offshore below in both model and observations.
Influence of the Niger River Plume
To isolate the contribution of the Niger plume on upwelling dynamics, the noRIV simulation is compared to the REF simulation discussed previously (Figure 1F). Their differences clearly show the low-salinity plume created by the Niger River and the northwestward geostrophic flow associated with it. Smaller rivers affect coastal dynamics west of 8°W too. The Niger River creates warm SST anomalies largest at the coast (1°C between 1° and 2°E, off Togo and Benin), which extend southeastward offshore like the upwelling cold tongue, though farther east. This warming seems at first very consistent with a river-induced geostrophic compensation of coastal upwelling. However, on closer inspection, the currents due to the Niger plume are roughly 3 times smaller than the total geostrophic currents (Figures 1E,F). Moreover, they veer westward near the coast, as rivers evacuate their freshwaters alongshore to their right in the northern hemisphere due to Coriolis effect (Fong and Geyer, 2002). A subsurface analysis is required to better understand the effect of the river.
Vertical Dynamics
The coastal upwelling can be clearly seen with predominantly upward velocities, generally larger near the mixed layer depth (MLD) and in the 8°W-6°W, 2°30’W–2°E longitude bands, where the vertical velocities reach 1 m.day−1, exceeding 3 m.day−1 around Cape Palmas (Figure 3A). It rises isotherms and isohalines by around 20 m there, in both model and observations. While upward velocities generally extend down to 50 m, they are replaced with downward velocities below 30 m east of 2°E, consistently with a geostrophic compensation where the cross-shore upwelling cell is weakened by a deeper counter-cell (Marchesiello and Estrade, 2010).
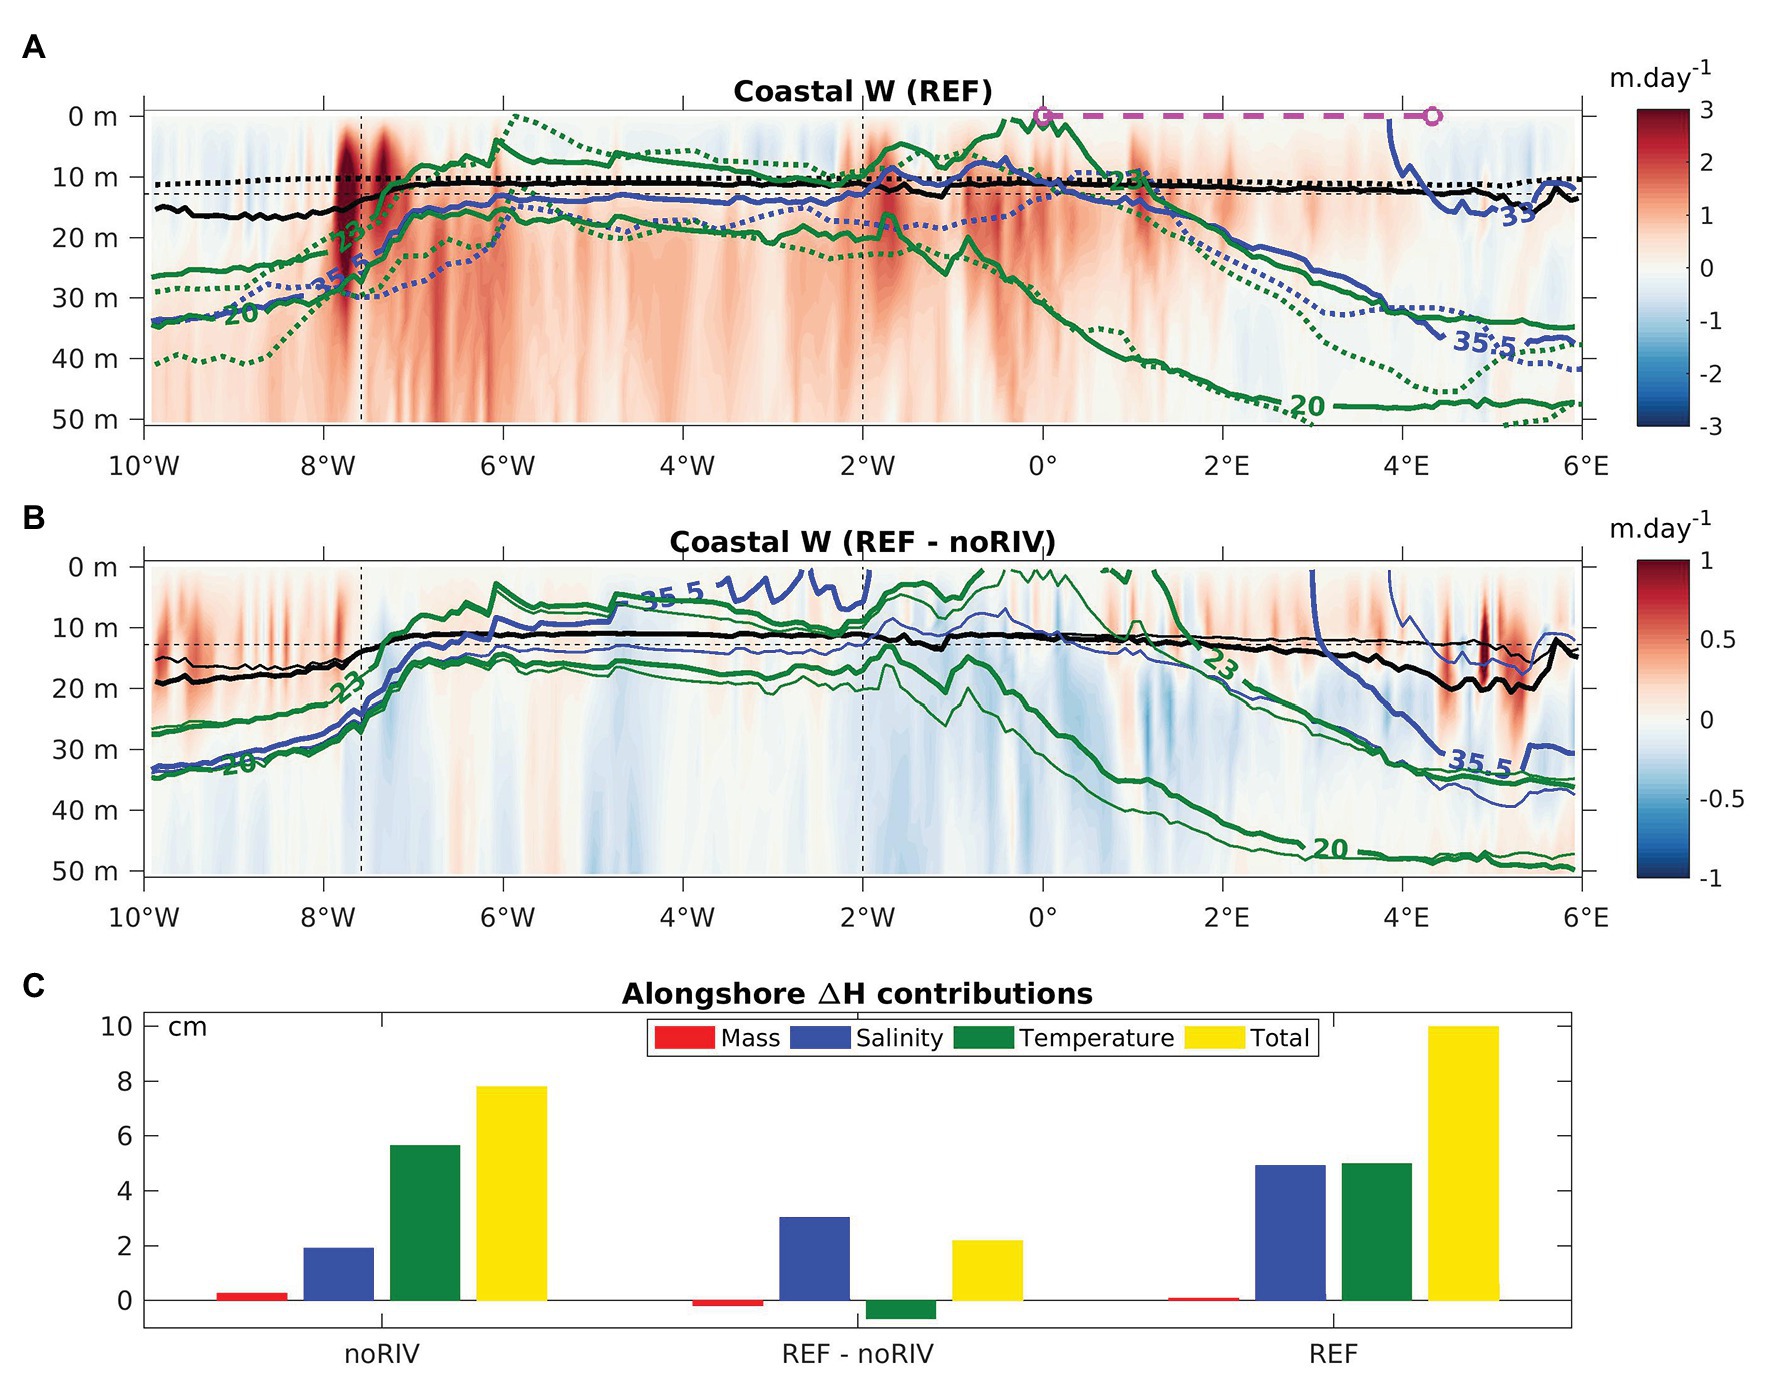
Figure 3. Mean summer coastal vertical velocity (colors) in the REF simulation (A) and differences between the REF and noRIV simulations (B). Black, green, and blue lines represent respectively MLD, isotherms (20 and 23°C), and isohalines (33 and 35.5 psu) along the coast in the REF [thick lines in (A), thin lines in (B)], noRIV [thick lines in (B)] simulations, and in WOA [dotted lines in (A)]. All coastal variables are averaged in a 0.5° coastal band. Black horizontal and vertical dashed lines represent the 13-m-depth level and the location of Cape Palmas and Cape Three Points, respectively. (C) Contributions of 0–200-m vertically integrated mass (red), halosteric (blue), and thermosteric (green) changes to the eastward alongshore sea level slope (yellow) between 0° and 4°20'E (pink dashed line in (A) and Figure 1A) in the noRIV and REF simulations as well as their differences.
The river-induced effect on vertical velocities is relatively weak (Figure 3B). It is dominated by small downward anomalies that may contribute to a deepening of isotherms from 2°W to 2°E, although the later is maximum for the 23°C isotherm near 1°E where it co-occurs with upward anomalies. Upward anomalies are also found above the MLD between 2°E and 4°E, and with a larger amplitude and vertical extension west of 8°W and east of 4°E, just in front of Niger outflows. A clear river-induced effect is the deepening of isohalines all along the coast east of 6°W, and a strong thinning (up to 50%) of the MLD east of 3°E by salinity-induced stratification (Dossa et al., 2019).
Subsurface conditions can explain the alongshore sea-level slope at the shelf break between 0° and 4°20′E, which drives the onshore surface geostrophic flow likely to compensate the upwelling (Figure 3C). It appears that the thermosteric and halosteric components contribute equally in the REF simulation. However, although the river explains 60% of the halosteric effect, it only explains 20% of the slope, consistently with the river-induced increase in onshore geostrophic discussed above. In fact, the remaining 40% of halosteric effect and most of the thermosteric effect are due to a saltier and colder western water column and explain 80% of the slope. Therefore, the onshore geostrophic flow is probably driven by the upwelling itself.
Upwelling indices
To quantify and compare the competing effects of offshore Ekman transport and onshore geostrophic flow on the coastal upwelling, we use dynamical upwelling indices previously defined in the literature (Marchesiello and Estrade, 2010). The Ekman Coastal Upwelling Index (ECUI) derived from Bakun (1973) estimates the vertical velocities due to divergence of the Ekman transport at the coast:
The ECUI and GCUI are calculated as a function of longitude, taking into account changes in coastal wind stress, surface geostrophic current, coastline orientation, and MLD in the model (Figure 4). Compared to the western upwelling cell, the ECUI is twice as large in the eastern upwelling cell, not surprisingly as Ekman transport drives upwelling east of Cape Three Points (Djakouré et al., 2017), but decreases abruptly at 4°30′ with the change in coastline (rather than wind) orientation (Figure 1B). Except for some strong peaks, the GCUI has a weaker amplitude than the ECUI in the western cell and mostly oscillates around zero. On the contrary, in the eastern cell, the GCUI is mostly negative, which indicates a partial compensation of the upwelling by the onshore geostrophic flow. The GCUI compensates the ECUI by about half (45%) on average between 1°E and 4°30′E, and overwhelms the ECUI west of 8°W and east of 5°E.
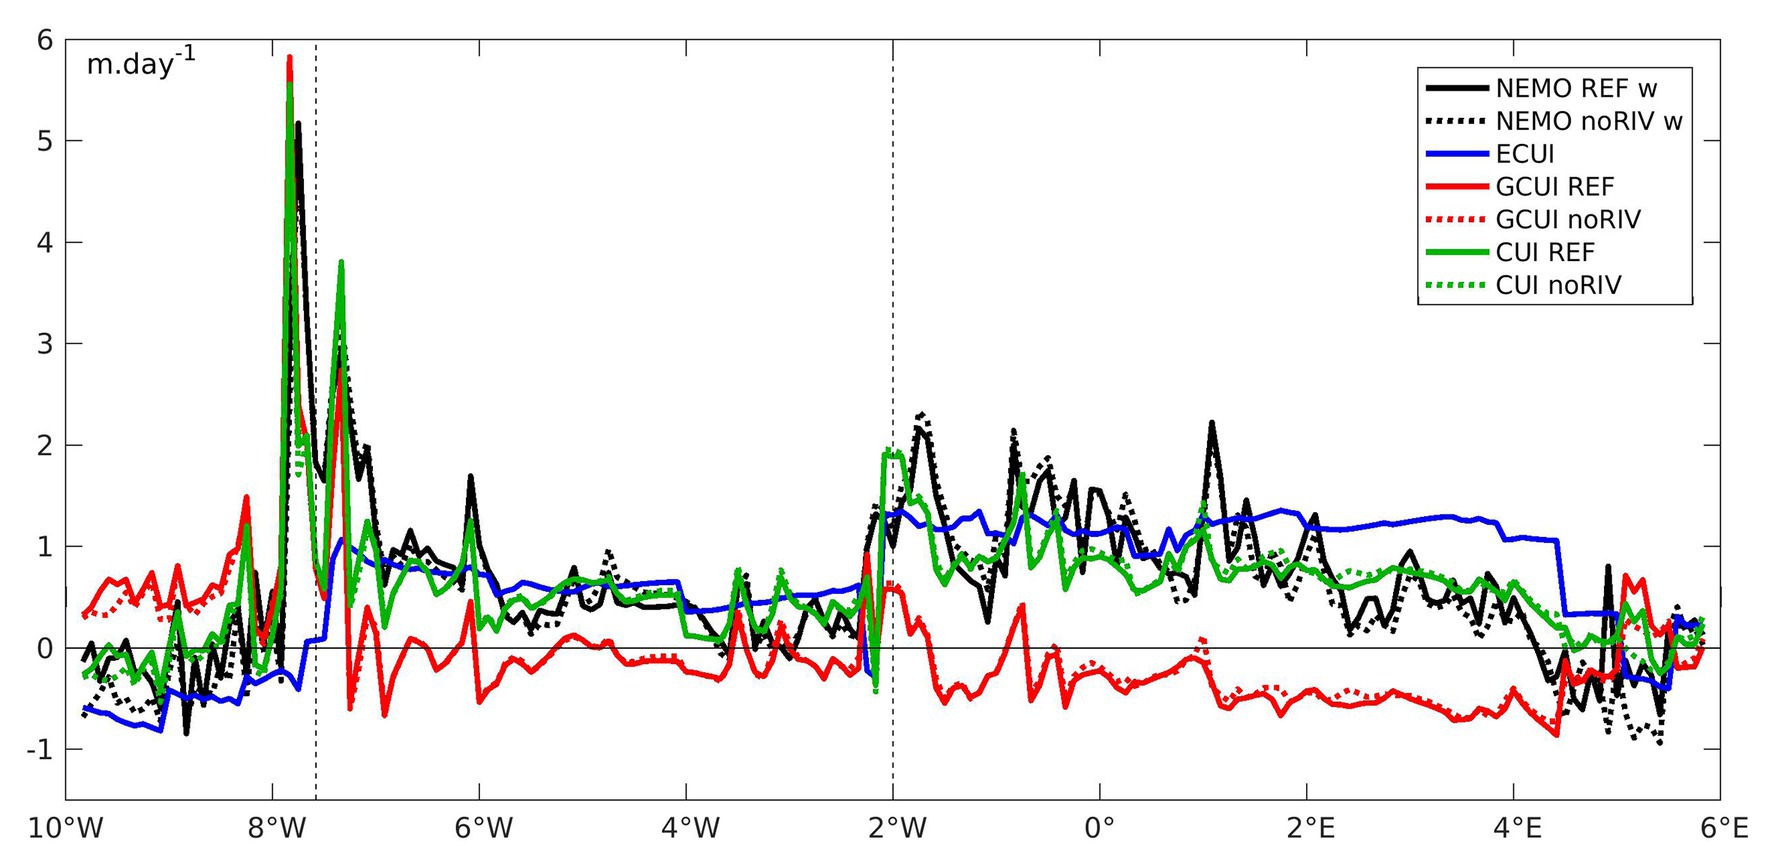
Figure 4. Mean summer Coastal Upwelling Index (CUI, green lines), defined as the sum of Ekman (ECUI, blue line) and Geostrophic (GCUI, red lines) Coastal Upwelling Indices, compared with coastal vertical velocity at the MLD (black lines) in the REF (full lines) and noRIV (dotted lines) simulations. Correlation between the CUI and NEMO vertical velocities is 0.72 (0.72/0.73 west/east of 2°W respectively) in the REF simulation and 0.72 (0.70/0.79 west/east of 2°W respectively) in the noRIV simulation. Vertical dashed lines indicate the location of Cape Palmas and Cape Three Points.
As the ECUI and GCUI are calculated with the wind stress forcing the model and the simulated geostrophic currents, it is physically consistent to directly compare the CUI with the model coastal vertical velocity. Sensitivity tests show that the best comparison is obtained when the vertical velocity is averaged in a 0.5° coastal band at the depth of 13 m, the first depth level in the model below the mean alongshore MLD (11 m +/− 1.75 m). To scale the two time-series, their root-mean-square deviation is minimized by selecting a value of 150 km for Lu . This fits well with the typical cross-shore width of the coastal cooling, as delimited by the 25°C isotherm (Figure 1B), and is close to the Rossby radius of deformation in this region (Chelton et al., 1998) that is often took as an order of magnitude (Csanady, 1981). More recent studies recommend to use a value dependent on the local shelf slope (Estrade et al., 2008; Marchesiello and Estrade, 2010), but it worsens comparison between CUI and vertical velocity in our case.
With the parameterization defined above, the CUI and model vertical velocity show a rather good agreement in the REF simulation (r = 0.72, 99% significant). Combined offshore Ekman transport and onshore geostrophic flow are therefore able to explain a large part of coastal upwelling alongshore variations, even in the western cell. In particular, the GCUI clearly explains the decrease in upwelling intensity east of 1°E, but also a large part of small-scale alongshore variations, while the ECUI is much smoother. The GCUI also shows that geostrophic divergence drives a locally strong enhancement of upwelling on each side of Cape Palmas.
Indices are also calculated for the noRIV simulation where, east of 0°, uG decreases but D increases compared to the REF simulation (Figures 1 F, 3B). These changes almost compensate each other in the GCUI, which makes very little river-induced changes in upwelling (Figure 4). The eastern correlation between the ECUI and vertical velocity is however improved (r = 0.79) in the noRIV case. It can also be seen that the river can locally enhance upwelling around 5°E, probably due to a secondary circulation associated with the horizontal density gradient close to the Niger outflow (Lü et al., 2006).
Conclusion
This study demonstrates that coastal upwelling in the northern Gulf of Guinea is reduced by half due to onshore geostrophic flow in its eastern part. Although large-scale circulation could play a role too, the onshore geostrophic flow seems primarily due to the cross-shore front at the eastern end of the upwelling and can be seen as a negative retroaction, occurring in other upwelling systems too (Ndoye et al., 2017). The location of this front is here initially controlled by a change in the coastline orientation but must adjust to competing Ekman and geostrophic processes. The alongshore sea-level slope across this front, which drives the geostrophic flow, is in equal parts due to thermosteric and halosteric effects, and controlled at 80% by the upwelling that decreases temperature and increases salinity in the coastal water column. The role of geostrophic compensation on the seasonal and interannual variability of upwelling remains to be explored. Interestingly, the combined Ekman and geostrophic indices can explain a large part of alongshore upwelling variations even in the western upwelling cell, thought to be driven by detachment of the Guinea Current downstream of Cape Palmas (Djakouré et al., 2017). Local strengthening of the upwelling each side of this cape by offshore geostrophic flow is probably linked to this detachment.
While the Niger River explains most of the alongshore SSS gradient, it only explains 60% of the alongshore halosteric sea-level gradient, as it has a shallower effect than upwelling. The resulting 20% increase in onshore surface geostrophic currents is compensated by the reduced MLD in the plume, with no net effect on near-surface geostrophic transport and upwelling. The river influence is not negligible though, as it warms the upwelling tongue by up to 1°C. The river-induced onshore and westward alongshore surface geostrophic currents flow against the coastal SST gradient. The resulting advection, acting like a delayed horizontal geostrophic compensation, could explain the warming. The stratification strengthening, associated with a barrier layer often present in river plumes and in particular here, could also contribute by trapping solar heat and inhibiting vertical mixing near the surface (Mignot et al., 2007; Foltz and McPhaden, 2009; Dossa et al., 2019). A heat budget is necessary to quantify both processes and their relative spatiotemporal contribution. Whatever the process, it can be modulated by variability in the Niger runoff, and the impact on upwelling productivity is not obvious. Also, in other regions where upwelling and river plume meet, with a different balance between processes, the initially sought direct river-induced geostrophic compensation of upwelling could be at work.
Due to the fundamental role of coastal upwellings on global fisheries and associated socioeconomic impacts, their future under climate change is an important question. Wind intensification in past decades has been observed in some EBUS, particularly at higher latitudes (Sydeman et al., 2014). Sensitivity analyses based on future projections have shown their potential impact on productivity and fisheries at the end of this century (Chust et al., 2014; Echevin et al., 2020). While large parts of EBUS are located along coastal deserts, larger rivers are found in their rainier poleward extension (Hickey et al., 2005; Sobarzo et al., 2007). As the discharge of these rivers is likely to change due to the intensifying hydrological cycle (Yu et al., 2020) and other anthropogenic stresses (Best, 2019), the river-induced processes presented here should be locally considered in the present and future evolution of upwelling and their associated productivity and fisheries under climate change.
Data Availability Statement
The raw data supporting the conclusions of this article will be made available by the authors, without undue reservation.
Author Contributions
GA conceptualized the study, produced the figures, and wrote the manuscript with contribution from CD-A, SD, ID, and JJ. DL did some preliminary analysis under supervision of GA, CD-A, and SD. JJ performed the model experiments. GA, CD-A, SD, ID, and JJ analyzed the data. All authors contributed to the article and approved the submitted version.
Funding
This work was supported by the Alti-ETAO Ocean Surface Topography Science Team (OSTST) and TOSCA-SMOS projects founded by the French National Center for Space Studies (CNES). It also contributes to the SWOT-GG project, the junior teams JEAI SAFUME and IVOARE-UP associated with the French National Research Institute for Development (IRD), and the EU H2020 TRIATLAS project under Grant Agreement 817578.
Conflict of Interest
The authors declare that the research was conducted in the absence of any commercial or financial relationships that could be construed as a potential conflict of interest.
Acknowledgments
We thank William Llovel for useful discussions and the reviewers for constructive comments. The MUR SST data were downloaded from the NOAA/GEO-IDE/UAF/ERDDAP website (https://upwell.pfeg.noaa.gov/erddap/). TSG SSS data were downloaded from the ODATIS/SEANOE website (https://www.seanoe.org/), SNO-SSS/SEDOO website (http://sss.sedoo.fr/), and PIRATA ftp site (ftp://ftp.ifremer.fr/ifremer/ird/pirata/pirata-data/surface/). The L3_DEBIAS_LOCEAN_v4 SSS data are produced by LOCEAN/IPSL (UMR CNRS/UPMC/IRD/MNHN) laboratory and ACRI-st company and distributed by the Ocean Salinity Expertise Center (CECOS) of the CNES-IFREMER Centre Aval de Traitement des Donnees SMOS (CATDS). The gridded altimetry data produced by SSALTO/DUACS and along-track coastal X-TRACK data produced by CTOH (LEGOS) are distributed by CMEMS (http://marine.copernicus.eu/). The drifter-derived climatology of near-surface currents was downloaded from the NOAA/AOML website (https://www.aoml.noaa.gov/phod/gdp/mean_velocity.php). The WOA data were downloaded from the NOAA/NCEI website (https://www.nodc.noaa.gov/OC5/woa18/). The ADCP data were downloaded from the PIRATA ftp site (ftp://ftp.ifremer.fr/ifremer/ird/pirata/pirata-data/adcp/).
References
Alory, G., Delcroix, T., Téchiné, P., Diverrès, D., Varillon, D., Cravatte, S., et al. (2015). The French contribution to the voluntary observing ships network of sea surface salinity. Deep-Sea Res. I Oceanogr. Res. Pap. 105, 1–18. doi: 10.1016/J.DSR.2015.08.005
Assene, F., Morel, Y., Delpech, A., Aguedjou, M., Jouanno, J., Cravatte, S., et al. (2020). From mixing to the large scale circulation: how the inverse cascade is involved in the formation of the subsurface currents in the Gulf of Guinea. Fluids 5:147. doi: 10.3390/fluids5030147
Awo, F. M., Alory, G., Da-Allada, C. Y., Delcroix, T., Jouanno, J., Kestenare, E., et al. (2018). Sea surface salinity signature of the tropical Atlantic interannual climatic modes. J. Geophys. Res. Oceans 123, 7420–7437. doi: 10.1029/2018JC013837
Bachèlery, M. L., Illig, S., and Dadou, I. (2016). Interannual variability in the South-East Atlantic Ocean, focusing on the Benguela upwelling system: remote versus local forcing. J. Geophys. Res. Oceans 121, 284–310. doi: 10.1002/2015JC011168
Bakun, A. (1973). Coastal upwelling indices, west coast of North America, 1946–71. U.S. Dept. Commerce, NOAA Tech. Rep., NMFS SSRF-671, 103.
Best, J. (2019). Anthropogenic stresses on the world’s big rivers. Nat. Geosci. 12, 7–21. doi: 10.1038/s41561-018-0262-x
Binet, D. (1997). Climate and pelagic fisheries in the Canary and Guinea Currents 1964-1993: the role of trade winds and the Southern Oscillation. Oceanol. Acta 20, 177–190.
Birol, F., Fuller, N., Lyard, F., Cancet, M., Niño, F., Delebecque, C., et al. (2017). Coastal applications from nadir altimetry: example of the X-TRACK regional products. Adv. Space Res. 59, 936–953. doi: 10.1016/J.ASR.2016.11.005
Bourlès, B., Araujo, M., McPhaden, M. J., Brandt, P., Foltz, G. R., Lumpkin, R., et al. (2019). PIRATA: a sustained observing system for tropical Atlantic climate research and forecasting. Earth Space Sci. 6, 577–616. doi: 10.1029/2018EA000428
Boutin, J., Vergely, J. L., Marchand, S., D’Amico, F., Hasson, A., Kolodziejczyk, N., et al. (2018). New SMOS sea surface salinity with reduced systematic errors and improved variability. Remote Sens. Environ. 214, 115–134. doi: 10.1016/j.rse.2018.05.022
Calado, L., Da Silveira, I. C. A., Gangopadhyay, A., and De Castro, B. M. (2010). Eddy-induced upwelling off Cape São Tomé (22 S, Brazil). Cont. Shelf Res. 30, 1181–1188. doi: 10.1016/j.csr.2010.03.007
Capet, X. J., Marchesiello, P., and McWilliams, J. C. (2004). Upwelling response to coastal wind profiles. Geophys. Res. Lett. 31:L13311. doi: 10.1029/2004GL020123
Chelton, D. B., DeSzoeke, R. A., Schlax, M. G., El Naggar, K., and Siwertz, N. (1998). Geographical variability of the first baroclinic Rossby radius of deformation. J. Phys. Oceanogr. 28, 433–460.
Chin, T. M., Vazquez-Cuervo, J., and Armstrong, E. M. (2017). A multi-scale high-resolution analysis of global sea surface temperature. Remote Sens. Environ. 200, 154–169. doi: 10.1016/j.rse.2017.07.029
Chust, G., Allen, J. I., Bopp, L., Schrum, C., Holt, J., Tsiaras, K., et al. (2014). Biomass changes and trophic amplification of plankton in a warmer ocean. Glob. Chang. Biol. 20, 2124–2139. doi: 10.1111/gcb.12562
Colas, F., Capet, X., McWilliams, J. C., and Li, Z. (2013). Mesoscale eddy buoyancy flux and eddy-induced circulation in Eastern Boundary Currents. J. Phys. Oceanogr. 43, 1073–1095. doi: 10.1175/JPO-D-11-0241.1
Csanady, G. T. (1981). “Circulation in the coastal ocean ” in Advances in Geophysics. Vol. 23. Elsevier, 23, 101–183.
Da-Allada, C. Y., Alory, G., Du Penhoat, Y., Kestenare, E., Durand, F., and Hounkonnou, N. M. (2013). Seasonal mixed-layer salinity balance in the tropical Atlantic Ocean: mean state and seasonal cycle. J. Geophys. Res. Oceans 118, 332–345. doi: 10.1029/2012JC008357
Da-Allada, C. Y., Jouanno, J., Gaillard, F., Kolodziejczyk, N., Maes, C., Reul, N., et al. (2017). Importance of the equatorial undercurrent on the sea surface salinity in the Eastern Equatorial Atlantic in boreal spring. J. Geophys. Res. Oceans 122, 521-538. doi: 10.1002/2016JC012342
Dai, A., and Trenberth, K. (2002). Estimates of freshwater discharge from continents: latitudinal and seasonal variations. J. Hydrometeorol. 3, 660–687. doi: 10.1175/1525-7541(2002)003,0660:EOFDFC.2.0.CO;2
Desbiolles, F., Blanke, B., Bentamy, A., and Roy, C. (2016). Response of the Southern Benguela upwelling system to fine-scale modifications of the coastal wind. J. Mar. Syst. 156, 46–55. doi: 10.1016/j.jmarsys.2015.12.002
Dieng, H. B., Dadou, I., Léger, F., Morel, Y., Jouanno, J., Lyard, F., et al. (2019). Sea level anomalies using altimetry, model and tide gauges along the African coasts in the Eastern Tropical Atlantic Ocean: Inter-comparison and temporal variability. Adv. Space Res. doi: 10.1016/j.asr.2019.10.019 (in press)
Djakouré, S., Penven, P., Bourlès, B., Koné, V., and Veitch, J. (2017). Respective roles of the Guinea current and local winds on the coastal upwelling in the Northern Gulf of Guinea. J. Phys. Oceanogr. 47, 1367–1387. doi: 10.1175/JPO-D-16-0126.1
Djakouré, S., Penven, P., Bourlès, B., Veitch, J., and Koné, V. (2014). Coastally trapped eddies in the north of the Gulf of Guinea. J. Geophys. Res. Oceans 119, 6805–6819. doi: 10.1002/2014JC010243
Dossa, A. N., Da-Allada, C. Y., Herbert, G., and Bourlès, B. (2019). Seasonal cycle of the salinity barrier layer revealed in the northeastern Gulf of Guinea. Afr. J. Mar. Sci. 41, 163–175. doi: 10.2989/1814232X.2019.1616612
Ducet, N., Le Traon, P. -Y., and Reverdin, G. (2000). Global high-resolution mapping of ocean circulation from TOPEX/Poseidon and ERS-1 and -2. J. Geophys. Res. 105, 19,477–19,498. doi: 10.1029/2000JC900063
Dussin, R., Barnier, B., Brodeau, L., and Molines, J.M. (2016). The making of the Drakkar forcing set DFS5. DRAKKAR/MyOcean Report.
Echevin, V., Gévaudan, M., Espinoza-Morriberón, D., Tam, J., Aumont, O., Gutierrez, D., et al. (2020). Physical and biogeochemical impacts of RCP8.5 scenario in the Peru upwelling system. Biogeosciences 17, 3317–3341. doi: 10.5194/bg-17-3317-2020
Estrade, P., Marchesiello, P., De Verdière, A. C., and Roy, C. (2008). Cross-shelf structure of coastal upwelling: a two—dimensional extension of Ekman's theory and a mechanism for inner shelf upwelling shut down. J. Mar. Res. 66, 589–616. doi: 10.1357/002224008787536790
Foltz, G. R., and McPhaden, M. J. (2009). Impact of barrier layer thickness on SST in the central tropical North Atlantic. J. Clim. 22, 285–299. doi: 10.1175/2008JCLI2308.1
Fong, D. A., and Geyer, W. R. (2002). The alongshore transport of freshwater in a surface-trapped river plume. J. Phys. Oceanogr. 32, 957–972. doi: 10.1175/1520-0485(2002)032<0957:TATOFI>2.0.CO;2
Gaillard, F., Diverres, D., Jacquin, S., Gouriou, Y., Grelet, J., Le Menn, M., et al. (2015). Sea surface temperature and salinity from French research vessels, 2001–2013. Sci. Data 2, 1–9. doi: 10.1038/sdata.2015.54
Gan, J., Cheung, A., Guo, X., and Li, L. (2009a). Intensified upwelling over a widened shelf in the northeastern South China Sea. J. Geophys. Res. Oceans 114, 1–15. doi: 10.1029/2007JC004660
Gan, J., Li, L., Wang, D., and Guo, X. (2009b). Interaction of a river plume with coastal upwelling in the northeastern South China Sea. Cont. Shelf Res. 29, 728–740. doi: 10.1016/j.csr.2008.12.002
Gruber, N., Lachkar, Z., Frenzel, H., Marchesiello, P., Münnich, M., McWilliams, J. C., et al. (2011). Eddy-induced reduction of biological production in eastern boundary upwelling systems. Nat. Geosci. 4, 787–792. doi: 10.1038/ngeo1273
Gutknecht, E., Dadou, I., Marchesiello, P., Cambon, G., Le Vu, B., Sudre, J., et al. (2013). Nitrogen transfers off Walvis Bay: a 3-D coupled physical/biogeochemical modeling approach in the Namibian upwelling system. Biogeosciences 10, 4117–4135. doi: 10.5194/bg-10-4117-2013
Herbert, G., Bourlès, B., Penven, P., and Grelet, J. (2016). New insights on the upper layer circulation north of the Gulf of Guinea. J. Geophys. Res. Oceans 121, 6793–6815. doi: 10.1002/2016JC011959
Herbert, G., Kermabon, C., Grelet, J., and Bourles, B. (2015). French PIRATA cruises S-ADCP data processing. Mercator Ocean Q. Newsl. 22–26.
Hickey, B. M. S. L., Geier, S., Kachel, N., and MacFadyen, A. (2005). A bi-directional river plume: The Columbia in summer. Cont. Shelf Res. 25, 1631–1656. doi: 10.1016/j.csr.2005.04.010
Hormazabal, S., Shaffer, G., Letelier, J., and Ulloa, O. (2001). Local and remote forcing of sea surface temperature in the coastal upwelling system off Chile. J. Geophys. Res. Oceans 106, 16657–16671. doi: 10.1029/2001JC900008
Jouanno, J., Marin, F., Du Penhoat, Y., Molines, J. M., and Sheinbaum, J. (2011). Seasonal modes of surface cooling in the Gulf of Guinea. J. Phys. Oceanogr. 41, 1408–1416. doi: 10.1175/JPO-D-11-031.1
Junker, T., Schmidt, M., and Mohrholz, V. (2015). The relation of wind stress curl and meridional transport in the Benguela upwelling system. J. Mar. Syst. 143, 1–6. doi: 10.1016/j.jmarsys.2014.10.006
Large, W. G., and Yeager, S. (2009). The global climatology of an interannually varying air–sea flux data set. Clim. Dyn. 33, 341–364. doi: 10.1007/s00382-008-0441-3
Laurindo, L. C., Mariano, A. J., and Lumpkin, R. (2017). An improved near-surface velocity climatology for the global ocean from drifter observations. Deep-Sea Res. I Oceanogr. Res. Pap. 124, 73–92. doi: 10.1016/j.dsr.2017.04.009
Le Traon, P. -Y., Nadal, F., and Ducet, N. (1998). An improved mapping method of multisatellite altimeter data. J. Atmos. Ocean. Technol. 15, 522–534. doi: 10.1175/1520-0426(1998)015<0522:AIMMOM>2.0.CO;2
Llovel, W., Purkey, S., Meyssignac, B., Blazquez, A., Kolodziejczyk, N., and Bamber, J. (2019). Global ocean freshening, ocean mass increase and global mean sea level rise over 2005–2015. Sci. Rep. 9, 1–10. doi: 10.1038/s41598-019-54239-2
Locarnini, M., Mishonov, A. V., Baranova, O. K., Boyer, T. P., Zweng, M. M., Garcia, H. E., et al. (2018). World ocean atlas 2018, volume 1: Temperature. A. Mishonov Technical Editor, NOAA Atlas NESDIS 81, 52.
Lü, X., Qiao, F., Xia, C., Zhu, J., and Yuan, Y. (2006). Upwelling off Yangtze River estuary in summer. J. Geophys. Res. Oceans 111, 11–18. doi: 10.1029/2005JC003250
Lübbecke, J. F., Rodríguez-Fonseca, B., Richter, I., Martín-Rey, M., Losada, T., Polo, I., et al. (2018). Equatorial Atlantic variability—modes, mechanisms, and global teleconnections. Wiley Interdiscip. Rev. Clim. Chang. 9:e527. doi: 10.1002/wcc.527
Madec, G. (2016). NEMO Ocean Engine. Available at: https://www.nemo-ocean.eu/wp-content/uploads/NEMO_book.pdf
Marchesiello, P., and Estrade, P. (2010). Upwelling limitation by onshore geostrophic flow. J. Mar. Res. 68, 37–62. doi: 10.1357/002224010793079004
Mignot, J., de Boyer Montégut, C., Lazar, A., and Cravatte, S. (2007). Control of salinity on the mixed layer depth in the world ocean: 2. Tropical areas. J. Geophys. Res. Oceans 112, 1–12. doi: 10.1029/2006JC003954
Ndoye, S., Capet, X., Estrade, P., Sow, B., Machu, E., Brochier, T., et al. (2017). Dynamics of a “low-enrichment high-retention” upwelling center over the southern Senegal shelf. Geophys. Res. Lett. 44, 5034–5043. doi: 10.1002/2017GL072789
Oke, P. R., and Middleton, J. H. (2000). Topographically induced upwelling off eastern Australia. J. Phys. Oceanogr. 30, 512–531. doi: 10.1175/1520-0485(2000)030<0512:TIUOEA>2.0.CO;2
Philander, S. G. H., and Pacanowski, R. C. (1986). A model of the seasonal cycle in the tropical Atlantic Ocean. J. Geophys. Res. 91, 14192–14206. doi: 10.1029/JC091iC12p14192
Picaut, J. (1983). Propagation of the seasonal upwelling in the eastern equatorial Atlantic. J. Phys. Oceanogr. 13, 18–37.
Pietri, A., Echevin, V., Testor, P., Chaigneau, A., Mortier, L., Grados, C., et al. (2014). Impact of a coastal-trapped wave on the near-coastal circulation of the Peru upwelling system from glider data. J. Geophys. Res. Oceans 119, 2109–2120. doi: 10.1002/2013JC009270
Preller, R., and O’Brien, J. J. (1980). The influence of bottom topography on upwelling off Peru. J. Phys. Oceanogr. 10, 1377–1398. doi: 10.1175/1520-0485(1980)010<1377:TIOBTO>2.0.CO;2
Pujol, M. I., Faugère, Y., Taburet, G., Dupuy, S., Pelloquin, C., Ablain, M., et al. (2016). DUACS DT2014: the new multi-mission altimeter data set reprocessed over 20 years. Ocean Sci. 12, 1067–1090. doi: 10.5194/os-2015-110
Renault, L., Hall, A., and McWilliams, J. C. (2016). Orographic shaping of US West Coast wind profiles during the upwelling season. Clim. Dyn. 46, 273–289. doi: 10.1007/s00382-015-2583-4
Rodrigues, R. R., and Lorenzzetti, J. A. (2001). A numerical study of the effects of bottom topography and coastline geometry on the Southeast Brazilian coastal upwelling. Cont. Shelf Res. 21, 371–394. doi: 10.1016/S0278-4343(00)00094-7
Rossi, V., Feng, M., Pattiaratchi, C., Roughan, M., and Waite, A. M. (2013). On the factors influencing the development of sporadic upwelling in the Leeuwin Current system. J. Geophys. Res. Oceans 118, 3608–3621. doi: 10.1002/jgrc.20242
Sobarzo, M., Bravo, L., Donoso, D., Garcés-Vargas, J., and Schneider, W. (2007). Coastal upwelling and seasonal cycles that influence the water column over the continental shelf off central Chile. Prog. Oceanogr. 75, 363–382. doi: 10.1016/j.pocean.2007.08.022
Sohou, Z., Koné, V., Da-Allada, Y. C., Djakouré, S., Bourlès, B., Racape, V., et al. (2020). Seasonal and inter-annual ONSET sea surface temperature variability along the northern coast of the Gulf of Guinea. Reg. Stud. Mar. Sci. 35:101129. doi: 10.1016/j.rsma.2020.101129
Sydeman, W. J., García-Reyes, M., Schoeman, D. S., Rykaczewski, R. R., Thompson, S. A., Black, B. A., et al. (2014). Climate change and wind intensification in coastal upwelling ecosystems. Science 345, 77–80. doi: 10.1126/science.1251635
Tranter, D. J., Carpenter, D. J., and Leech, G. S. (1986). The coastal enrichment effects of the East Australian Current eddy field. Deep-Sea Res. 33, 1705–1728. doi: 10.1016/0198-0149(86)90075-0
Weaver, A. J., and Middleton, J. H. (1989). On the dynamics of the Leeuwin current. J. Phys. Oceanogr. 19, 626–648.
Xie, S. P., and Carton, J. A. (2004). Tropical Atlantic variability: patterns, mechanisms, and impacts. Earth’s Climate: the Ocean-Atmosphere interaction. Geophys. Monogr. 147, 121–142. doi: 10.1029/147GM07
Yu, L., Josey, S. A., Bingham, F. M., and Lee, T. (2020). Intensification of the global water cycle and evidence from ocean salinity: a synthesis review. Ann. N. Y. Acad. Sci. 1472, 1–19. doi: 10.1111/nyas.14354
Keywords: coastal upwelling, river plume, Gulf of Guinea, salinity, tropical Atlantic
Citation: Alory G, Da-Allada CY, Djakouré S, Dadou I, Jouanno J and Loemba DP (2021) Coastal Upwelling Limitation by Onshore Geostrophic Flow in the Gulf of Guinea Around the Niger River Plume. Front. Mar. Sci. 7:607216. doi: 10.3389/fmars.2020.607216
Edited by:
Alejandro Jose Souza, Center for Research and Advanced Studies - Mérida Unit, MexicoReviewed by:
Nuno Vaz, University of Aveiro, PortugalLaura Carrillo, The South Border College (ECOSUR), Mexico
Copyright © 2021 Alory, Da-Allada, Djakouré, Dadou, Jouanno and Loemba. This is an open-access article distributed under the terms of the Creative Commons Attribution License (CC BY). The use, distribution or reproduction in other forums is permitted, provided the original author(s) and the copyright owner(s) are credited and that the original publication in this journal is cited, in accordance with accepted academic practice. No use, distribution or reproduction is permitted which does not comply with these terms.
*Correspondence: Gaël Alory, gael.alory@legos.obs-mip.fr