Ecological Effects of Wolves in Anthropogenic Landscapes: The Potential for Trophic Cascades Is Context-Dependent
 Giorgia Ausilio
 Håkan Sand2
 - 1Department of Forestry and Wildlife Management, Inland Norway University of Applied Sciences, Evenstad Campus, Evenstad, Norway
- 2Department of Ecology, Swedish University of Agricultural Sciences, Grimsö, Sweden
In recent years, large predators have made a comeback across large parts of Europe. However, little is known about the impact that recolonizing predators may have on ecosystems with high degrees of anthropogenic influence. In Scandinavia, wolves (Canis lupus) now inhabit areas affected by intense forestry practices and their main prey, moose (Alces alces), are exposed to significant human hunting pressure. We used long-term datasets to investigate whether the return of wolves has affected moose distribution (i.e., presence and abundance) as well as browsing damage (i.e., presence and intensity) by moose on Scots pine (Pinus sylvestris). We found that the probability of moose presence and abundance increased with time since wolf territory establishment and was higher inside wolf territories than outside. Additionally, the probability of browsing damage was also higher inside wolf territories compared to outside, but wolf occurrence had no effect on browsing damage intensity. We suggest two possible underlying mechanisms behind these results: (1) wolves might select to establish territories in areas with higher moose abundance, increasing their probability of encounters, and/or (2) hunters within wolf territories reduce the number of harvested moose to compensate for wolf predation. This study highlights that the return of large predators to landscapes with strong anthropogenic influence may result in alternative effects than those described in studies on trophic cascades located in protected areas.
Introduction
Predators often play a large role in shaping the ecological communities they inhabit (Estes et al., 2011; Ripple et al., 2014). They moderate prey populations by killing (lethal effects) or inducing behavioral and/or physiological changes in prey (non-lethal effects) (Fortin et al., 2005; Stoks et al., 2005; Trussell et al., 2006; Creel and Christianson, 2008). Predator-induced changes in the density and behavior of herbivore prey can results in altered plant community structure (McLaren and Peterson, 1994; Schmitz et al., 1997; Smith et al., 2003; Ripple and Beschta, 2004; Beyer et al., 2007), through density or behaviorally mediated trophic cascade, respectively (Estes and Duggins, 1995; Halofsky and Ripple, 2008; Ripple and Beschta, 2012). For example, the reintroduction of wolves to Yellowstone National Park is believed to have reduced both the density of elk (Cervus elaphus canadensis) as well as the browsing intensity on riparian plant communities, which resulted in the recovery of plant species such as quaking aspen (Populus tremuloides) (Beschta et al., 2018) and willow (Salix geyeriana) (Beschta and Ripple, 2018). Importantly, an increasing number of studies has refuted this idea and provided alternative hypotheses for the observed changes in elk density and plant communities in Yellowstone National Park, such as human harvest and climate, respectively (Vucetich et al., 2005; Creel and Christianson, 2008; Kauffman et al., 2010), as well as sampling bias (Brice et al., 2020). So far, the majority of studies focusing on trophic cascades have been conducted in protected areas with no or little anthropogenic influence, like national parks (Kuijper et al., 2013), however, such dynamics remain to be explored outside of protected areas. Where predators and humans share landscapes, the predators’ effect on the prey and other trophic levels may be modified by human activities such as land use and hunting (Kuijper et al., 2016). Because land-use practices such as agriculture and forestry are among the main drivers influencing landscape features, the distribution of predation risk within a landscape will vary and could result in behavioral changes in ungulate prey (Kuijper et al., 2016). Land-use can also alter the productivity and plant species composition, thus influencing the distribution and availability of resources used by prey and predators in a landscape (Bjørneraas et al., 2011; Kuijper et al., 2016). Human hunting of the same prey populations as large predators is also likely to modify the dynamics and extent of predator-prey interactions in anthropogenic landscapes (Kuijper et al., 2016). For instance, human harvest may outweigh the impact of large predators on prey demography (see Gervasi et al., 2012), which could reduce or hinder the potential for large predators to affect prey abundance as they would in the absence of human hunting (e.g., in national parks). It is therefore, likely that returning large predators will have a less pronounced role in anthropogenic ecosystems compared to protected ones (Sergio et al., 2008; Kuijper et al., 2016).
In Scandinavia, recolonizing wolves (Canis lupus) (Wabakken et al., 2001) now inhabit landscapes that are affected through intense forestry practices and where their main prey, moose (Alces alces) (Sand et al., 2005, 2008), are exposed to some of the highest harvest levels in the world due to a high moose density and productivity (Lavsund et al., 2003). In winter, moose mainly browse on Scots pine (Pinus sylvestris) (Cederlund, 1980; Hörnberg, 2001)—a commercially important tree species—and consequently cause browsing damage, which reduces the quality of timber and results in economic losses (Lavsund, 1987; Bergqvist et al., 2001). Wolves have therefore, not only the potential to affect both population density and behavior of moose, but may also have an indirect impact on the presence and intensity of browsing damage. However, most of the previous findings in Scandinavia have not confirmed either a density (Wikenros et al., 2015) or behavioral effect of wolves on moose (see e.g., Nicholson et al., 2014; Wikenros et al., 2016; Månsson et al., 2017). A recent study found that moose browsing damage on Scots pine in south-central Sweden was higher inside wolf territories than outside (Gicquel et al., 2020). These results contrast with several studies of wolf-moose-plants systems in North America (Fortin et al., 2005; Ripple and Beschta, 2012; Painter et al., 2015; Ditmer et al., 2018). Such a difference may be explained by different degrees of anthropogenic impact in these systems (Kuijper et al., 2016), which may change or reduce the ecological effects of wolves on other trophic levels. Understanding the strength and the relative role of predation within human-influenced landscapes can have considerable implications for wildlife management and conservation. For instance, ungulate populations under the pressure of both predation and human harvest may decline (Vucetich et al., 2005). The possible context-dependence of top-down processes in ecosystems is becoming an increasingly important topic, as apex predator populations are recovering in large areas of Europe (Chapron et al., 2014) and North America (Ripple et al., 2014) with high degrees of anthropogenic landscapes.
In this study, we tested the hypotheses that wolf presence and time since wolf territory establishment result in: (1) a negative effect on moose presence and abundance, and (2) a change in habitat use of moose to avoid wolf encounters. We further hypothesized that if wolf presence and time since wolf territory establishment are negatively correlated to moose presence and abundance, this could potentially reduce browsing damage on Scots pine trees. Hence, we also tested the hypothesis that (3) wolf presence and time since wolf territory establishment are negatively associated with presence and intensity of browsing damage on Scots pine trees. Finally, we investigated the influence of human activities on moose and browsing damage by including variables mirroring either anthropogenic attributes or human-controlled features in the landscape, such as roads and silviculture (i.e., forest age stages).
Materials and Methods
Study Area
The study was conducted between 2003 and 2016 across the breeding range of wolves in south-central Sweden (56°50′–63°N, 11°50′–17°E, approximately 102,916 km2). The landscape is dominated by intensively managed boreal forest (Jansson and Antonson, 2011) and the predominant tree species are Scots pine, Norway spruce (Picea abies) and birch (Betula spp.) (Christiansen, 2014). During the study period, the wolf population increased from 22 to 54 family groups and territorial pairs (Wabakken et al., 2004, 2016). The dominant prey species of wolves within the study area is moose followed by roe deer (Capreolus capreolus) (Sand et al., 2005, 2008). Moose winter density within the study area averages approximately 1.3 per km2 (Zimmermann et al., 2014). Scots pine represents quantitatively the most important food source for moose during winter in Sweden, despite being less selected than several less common deciduous species (Cederlund, 1980). Moose select for rowan (Sorbus aucuparia), aspen (Populus tremula) and willows (Salix spp.), but also browse on other species such as silver birch (Betula pendula), downy birch (Betula pubescens), and Scots pine (Månsson et al., 2007).
Moose Pellet Counts
Pellet group counting can serve as an indirect method to index ungulate abundance in order to estimate densities and manage populations (Bennett et al., 1940; Neff, 1968; Mayle et al., 1999; Marques et al., 2001; Smart et al., 2004). We used pellet group counts to gather presence and absence data on moose and to calculate a relative index for moose abundance. The Swedish National Forestry Inventory carries out yearly surveys of moose pellet counts throughout south-central Sweden (Tokola, 2006; Fridman et al., 2014). Moose pellet counts surveys are conducted between May and September in forest habitats belonging to either one of four different forest age stages in accordance with silvicultural practices: (1) clear-cut, when there are no or very few, sparse trees; (2) young, when the average height in the stand is between 1 and 4 m; (3) thinned, when the majority of trees in a stand are larger than 10 cm in diameter at chest height; and (4) mature, when the forest stand has reached the lowest recommendable final felling age (between 65 and 100 years for Scots pine; Fries et al., 2015). We considered forest of different age stages as proxies for human-controlled features in the landscape, since they are strictly regulated through specific silvicultural practices aimed at maximizing production of commercially important tree species. During our study period, a total of 10,358 circular sample plots (area = 38 m2) were surveyed (range of plots sampled per year: 578–802).
Moose Browsing Damage
Moose browsing damage is recorded by the Swedish National Forestry Inventory during spring, within the same sample plots used for the pellet count survey, using a nationwide moose browsing damage monitoring scheme (Äbin; Kjellander, 2007; Kalén et al., 2018). The method generates an index of browsing intensity by estimating the proportion of damaged trees, i.e., bark stripping, stem breakage and browsing on top shoots (Bergman and Åkerberg, 2006). The survey is restricted to young Scots pine stands with more than 10% pine trees within a plot and a height between 1 and 4 m (725 sample plots between 2003 and 2016). Browsing damage caused during the preceding winter is categorized as fresh, whereas older damage is classified as non-fresh damage, including dead trees and other malformations known to be caused by moose browsing damage (e.g., multiple stems). Browsing damage was aged by the color of the bite surface and resins, as well as by the amount of dead bark tissue beneath the bites. We classified the presence or absence of fresh browsing damage within a plot as the presence or absence of freshly damaged trees (hereafter browsing damage). The number of trees with fresh damage was used as a proxy for browsing damage intensity.
Tree Cover
The cover of aspen, rowan, willow, pedunculate oak (Quercus robur), Scots pine, and lodgepole pine (Pinus contorta) was recorded in larger sample plots of 7 m radius (153 m2), with the same plot-centroid as for moose pellet counts and browsing damage surveys. These plots are surveyed to record the cover of living parts of tree species within the browsing height of moose (0.3–2.5 m). We summed the cover (m2) of lodgepole pine and Scots pine (hereafter pine) and converted it to a proportion to generate an index of food availability for tree species that are quantitatively important for moose during winter. We also generated an index of food availability for tree species that are highly selected by moose by summing the cover (m2) of aspen, rowan, willow and oak (hereafter RAWO). However, due to a high amount of sample plots without the occurrence of RAWO species, we converted the food availability index for RAWO to a two-categorical variable (presence or absence of RAWO species).
Roads
The Swedish national road database was obtained from the Swedish Transport Administration. In this database, roads are divided into functional classes (0–9) according to their importance to the connectivity of the total Swedish road network (Trafikverket, 2017). Roads belonging to classes 0–6 include national, regional and local roads, whereas forest roads belong to classes 7–9. Road data were divided into two groups according to the same classification as the Swedish national road database: (I) forest roads (7–9), and (II) main roads (0–6). Distance (km) between each plot and the nearest main and forest road was calculated in ArcGIS (Version 10.7.1; Environmental Systems Research Institute). Distance to forest and main roads were considered as proxies representing anthropogenic features of the landscapes.
Wolf Presence and Time Since Wolf Territory Establishment
We used two variables to test the effect of wolves on moose presence and browsing damage: (a) wolf presence (2-level categorical: presence or absence of a wolf territory), and (b) time since wolf territory establishment (continuous, range 1–27 years, where 1 equals the year of wolf territory establishment), both obtained from the national wolf-monitoring system conducted annually by the County Administrative Boards (Liberg et al., 2012). The range of wolf territories was calculated using the 100% minimum convex polygon method (MCP; Mohr, 1947) based on available locations during the monitoring season (October to February/March; Wabakken et al., 2004, 2016). Locations were obtained by snow tracking, DNA-samples and GPS locations of collared individuals. Since we do not have full knowledge about the true borders of the wolf territories, we created a buffer around each polygon centroid based on the average wolf territory size in Scandinavia (radius 18.0 km, average size = 1,017 km2; Mattisson et al., 2013). Each sample plot was then classified as: (a) inside an average wolf territory, when the plot was located either within the observed borders of a wolf territory (monitoring scheme) or within a distance corresponding to the average wolf territory radius from the nearest polygon centroid; or (b) outside a wolf territory if the distance from the nearest polygon centroid was longer than the radius used to classify an average territory (Supplementary Appendix S1: Supplementary Figure S1; Wikenros et al., 2017).
We noticed that many of the plots classified as outside during the year of the inventory had been inside a wolf territory for several years just before the inventory year. This meant that potential spatial and temporal effects of wolf presence could be missed if sample plots were categorized as outside just based on their location during the year of the inventory. Therefore, we extended the definition of a plot classified as inside to include a plot that was outside a wolf territory the year of the inventory, but had been inside for ≥3 consecutive years without gaps of ≥3 years since the first year of wolf territory establishment for that sample plot. We set our year gap threshold to ≥3 years because prey species can re-adapt to the presence of predators in an as short time as one generation, which for moose may correspond to 4 or 5 years (Berger et al., 2001b; Laundré et al., 2001; Sand et al., 2006). Time since territory establishment was calculated as the total sum of years a plot had been inside, or was classified as inside, a wolf territory. Time of territory establishment for plots classified as inside the year of the inventory but with gaps of ≥3 years since the first year of wolf establishment was calculated as the sum of years inside a territory after the gap.
Statistical Analysis
To investigate the relative influence of wolf presence on moose and browsing damage, we divided the analyses in two parts based on the response variables and then used two approaches to analyze them: (i) binomial (i.e., presence and absence of moose or browsing damage) and (ii) continuous (i.e., moose abundance and browsing damage intensity). We modeled the probability of moose presence and browsing damage using logistic regressions (0 = absent, 1 = present). Because moose abundance and browsing damage intensity were both zero-inflated and over-dispersed (Harrison, 2014; Fox et al., 2015), we used zero-inflated negative binomial models. For moose presence and abundance, we added six explanatory variables in addition to wolf presence or time since wolf territory establishment: pine proportion, RAWO presence, distance to the nearest forest road (km), distance to the nearest main road (km), and forest age stage (4-level categories). We included an interaction term between forest age stage and wolf presence/time since territory establishment to test the hypothesis of a change in habitat use by moose in response to the return of wolves. For browsing damage (presence and intensity), we also included six explanatory variables in addition to wolf presence or time since wolf territory establishment: moose abundance, previous browsing damage (number of trees), pine proportion, RAWO presence, distance to forest roads (km) and main roads (km). We included year of inventory as a random factor in all analyses to account for year effects.
We standardized all continuous predictors by subtracting the mean from our predictor variables and then dividing it by its standard deviation, and used sum-to-zero contrasts on the categorical variables. Sum-to-zero contrasts code categorical variables as deviations from a grand mean, which is conceptually similar to centering continuous variables and then dividing them by two standard deviations. Standardizing continuous variables can eliminate collinearity between interactions and the individual covariates, as well as improve the interpretability of both interactive and individual coefficients in a regression, without affecting inference about the different covariates (Engqvist, 2005; Schielzeth, 2010). We tested for potential multicollinearity between our explanatory variables using Variance Inflation Factors (VIF) and tolerance values obtained using the check_correlation function in the “performance” package (Lüdecke et al., 2020). The analysis showed that there was low to no correlation in all of our models (see Supplementary Appendix S1: Supplementary Figure S2 and Supplementary Appendix S2: Supplementary Table S1).
We compared models using the Akaike information criterion (AIC), ΔAIC and AIC weights (wi) from the dredge function in the “MuMIn” package (Barton and Barton, 2019) to identify the most parsimonious models. Model averaging was then used to retain all models with ΔAIC <2 and to generate model-averaged parameter estimates (Burnham and Anderson, 2002) which were then back-transformed. For all the logistic regression models, we also assessed the contribution of random effects and predictors by using pseudo-R2, which are equivalent of R2 in ordinary logistic regression, but specifically for logistic regression analysis. For mixed-effects models, pseudo-R2 was defined in two ways, called marginal and conditional. The former provides a measure of the variance explained by the fixed effects, whereas the latter shows the variance explained by the whole model (random and fixed effects) (Barton and Barton, 2019).
Supplementary analyses using an additional classification of wolf presence based on territory size according to Mattisson et al. (2013) are available in Supplementary Appendix S3. These were carried out as a way to account for potential bias in the classification of sample plots as inside or outside a wolf territory, since the true borders of a territory are unknown. Using this alternative classification of wolf presence did not alter the results obtained with the original 2-category classification. All statistical analyses were conducted in R [version 3.6.1. (R Core Team, 2018)] using standardization and multicollinearity analyses in the performance package (Lüdecke et al., 2020), general linear mixed models in the lme4 package (GLMM; Bates et al., 2015), zero-inflated mixed models in the glmmTMB package (Brooks et al., 2017), R2 analysis in the MuMIn package (Barton and Barton, 2019) and plot modeling in the SjPlot package (Lüdecke and Lüdecke, 2017).
Results
Moose Presence and Abundance
The top-ranked model predicted the probability of moose presence to increase with wolf presence (β = 0.12, SE = 0.031, Figure 1A) and time since wolf territory establishment (β = 0.06, SE = 0.03, Figure 1B; see Supplementary Appendix S1: Supplementary Figure S3A for forest plots and Supplementary Appendix S2: Supplementary Table S2 for models). None of the top-ranked models included the interaction between wolf presence and forest age stage. The top-ranked model for moose abundance also indicated that moose abundance was higher where wolves were present (β = 0.1, SE = 0.03, Figure 2A) and increased with time since wolf territory establishment (β = 0.1, SE = 0.04, Figure 2B; see Supplementary Appendix S2: Supplementary Table S3 for models).
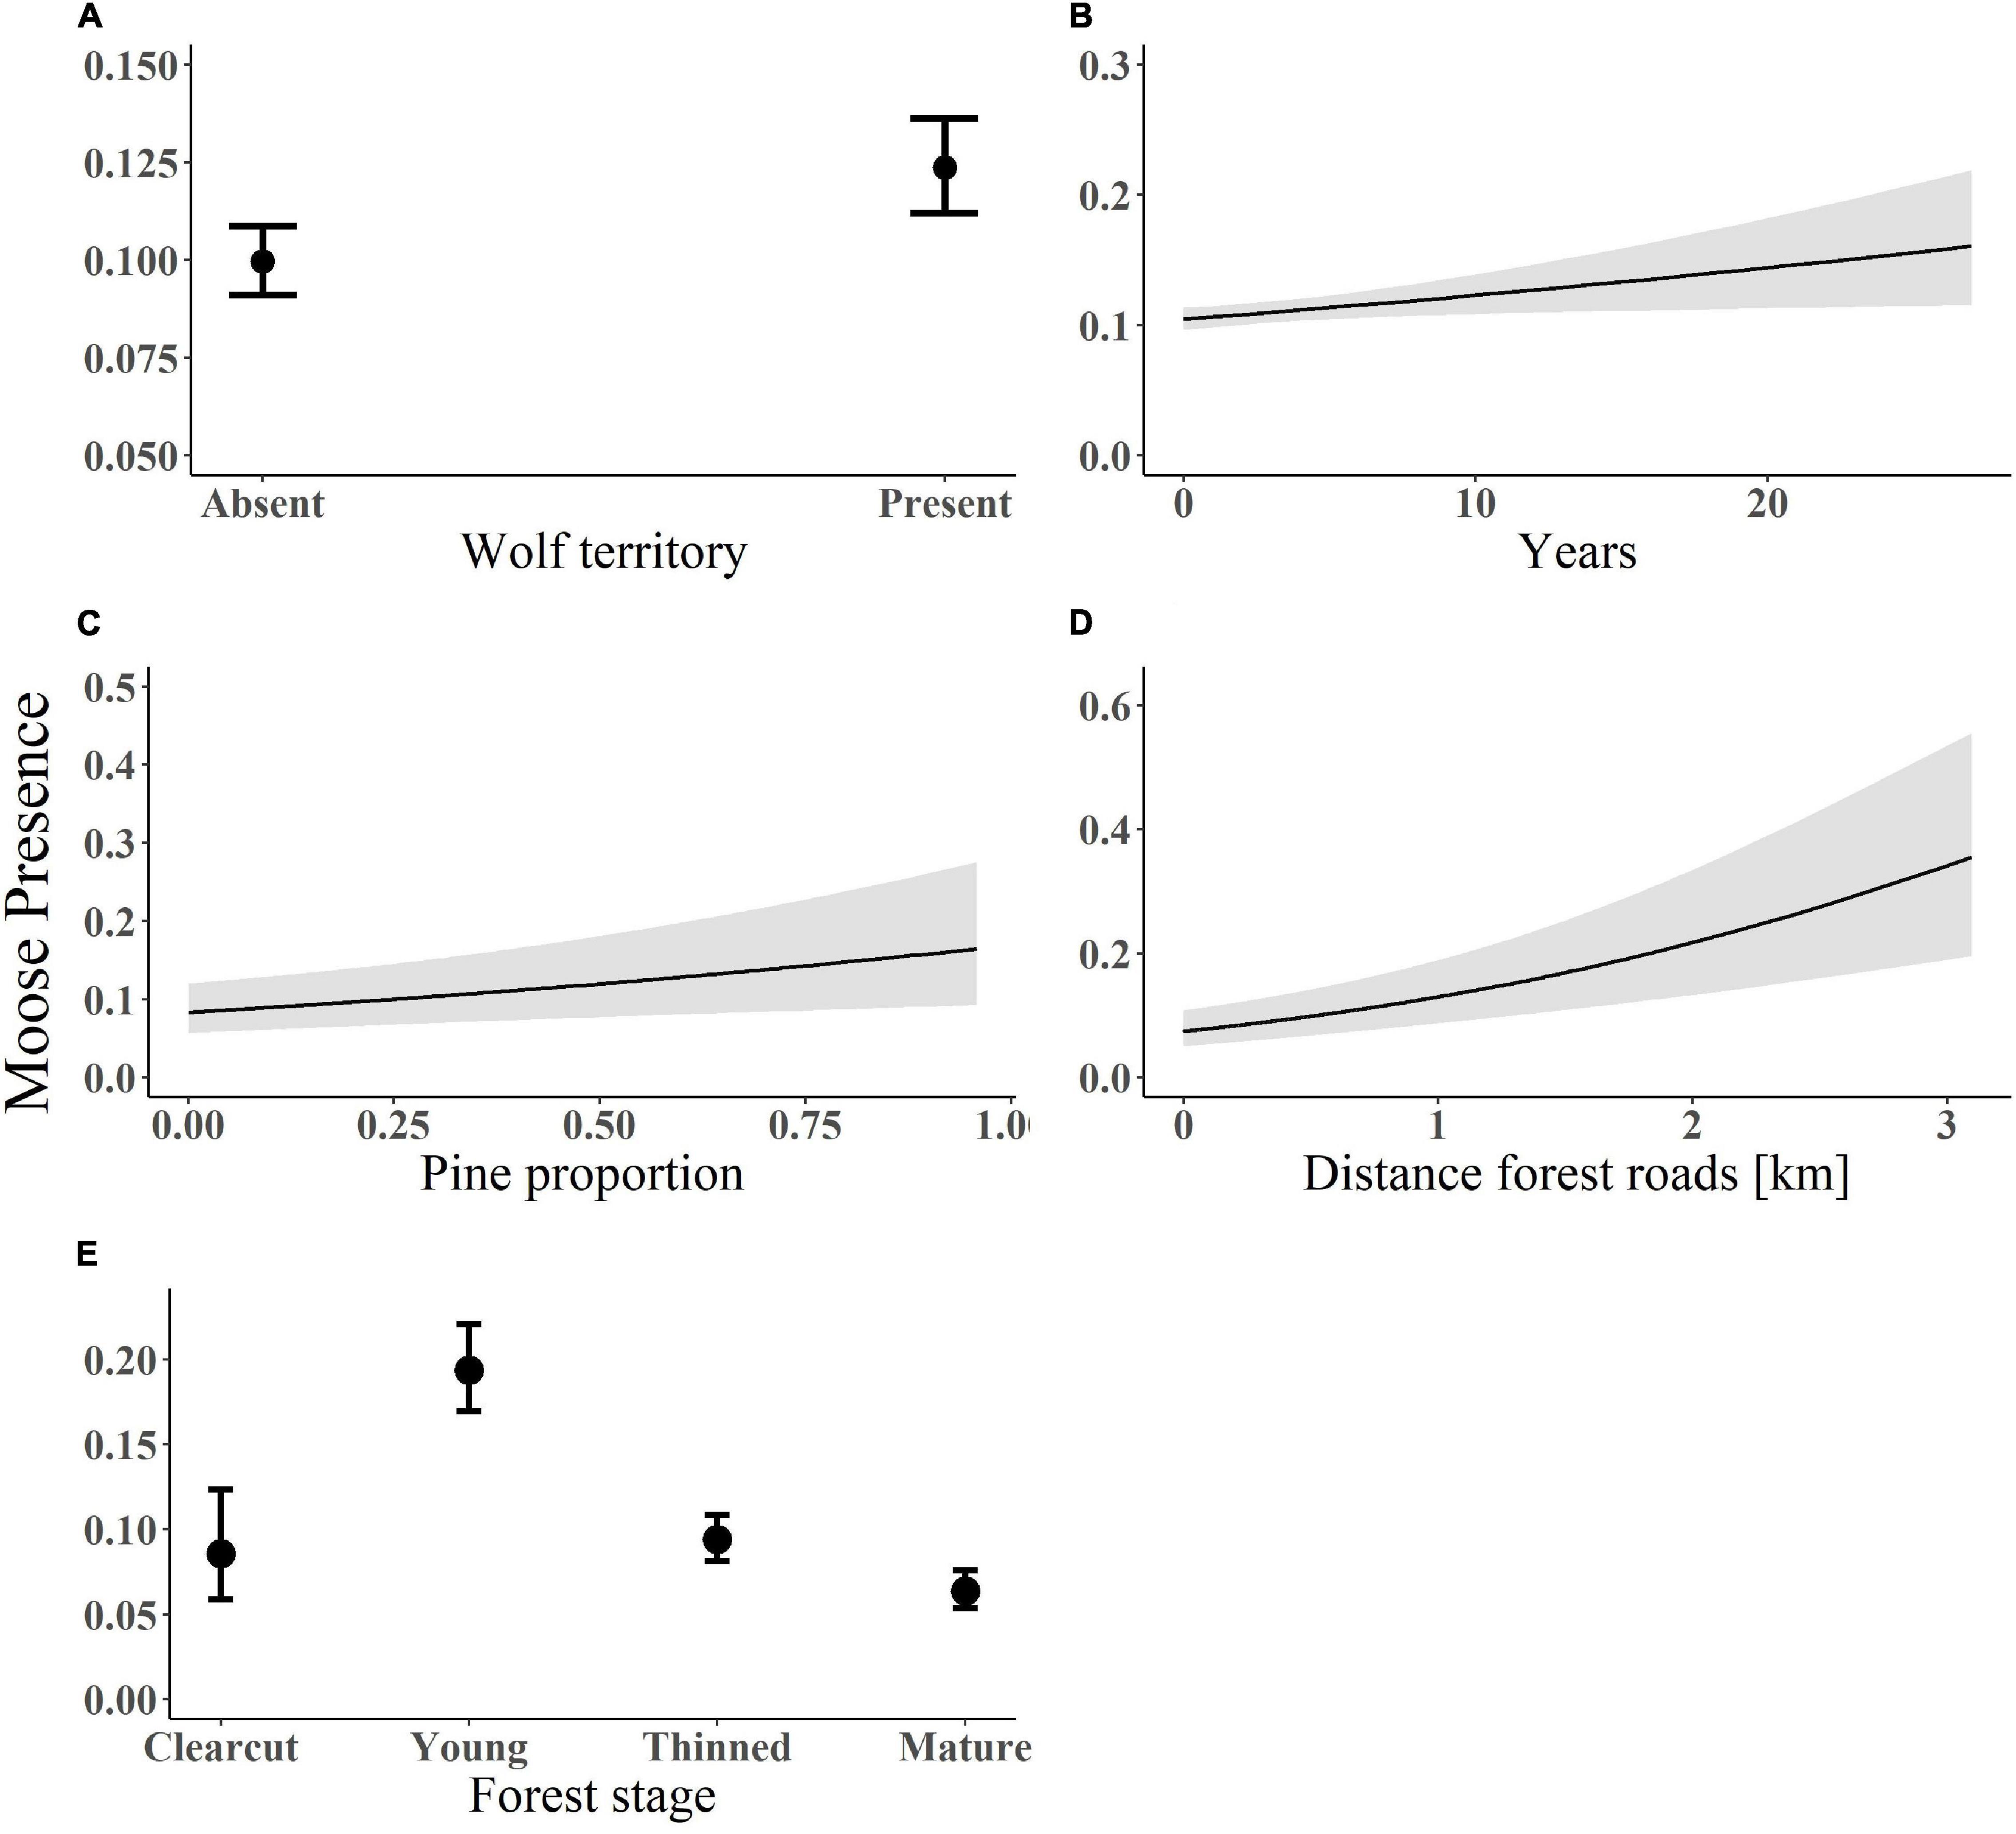
Figure 1. Predicted probability of moose presence in relation to (A) wolf presence; (B) years since wolf territory establishment; (C) pine proportion; (D) distance from forest roads; and (E) forest age stage. Data on moose presence was recorded in south-central Sweden between 2003 and 2016. The lines (in plot B–D) represent the fitted values and associated standard errors from the model-averaged estimates. Plot a and e show the coefficients and confidence intervals of the predicted probability of moose presence in relation to the presence/absence of a wolf territory (A) and across four forest age stages (E).
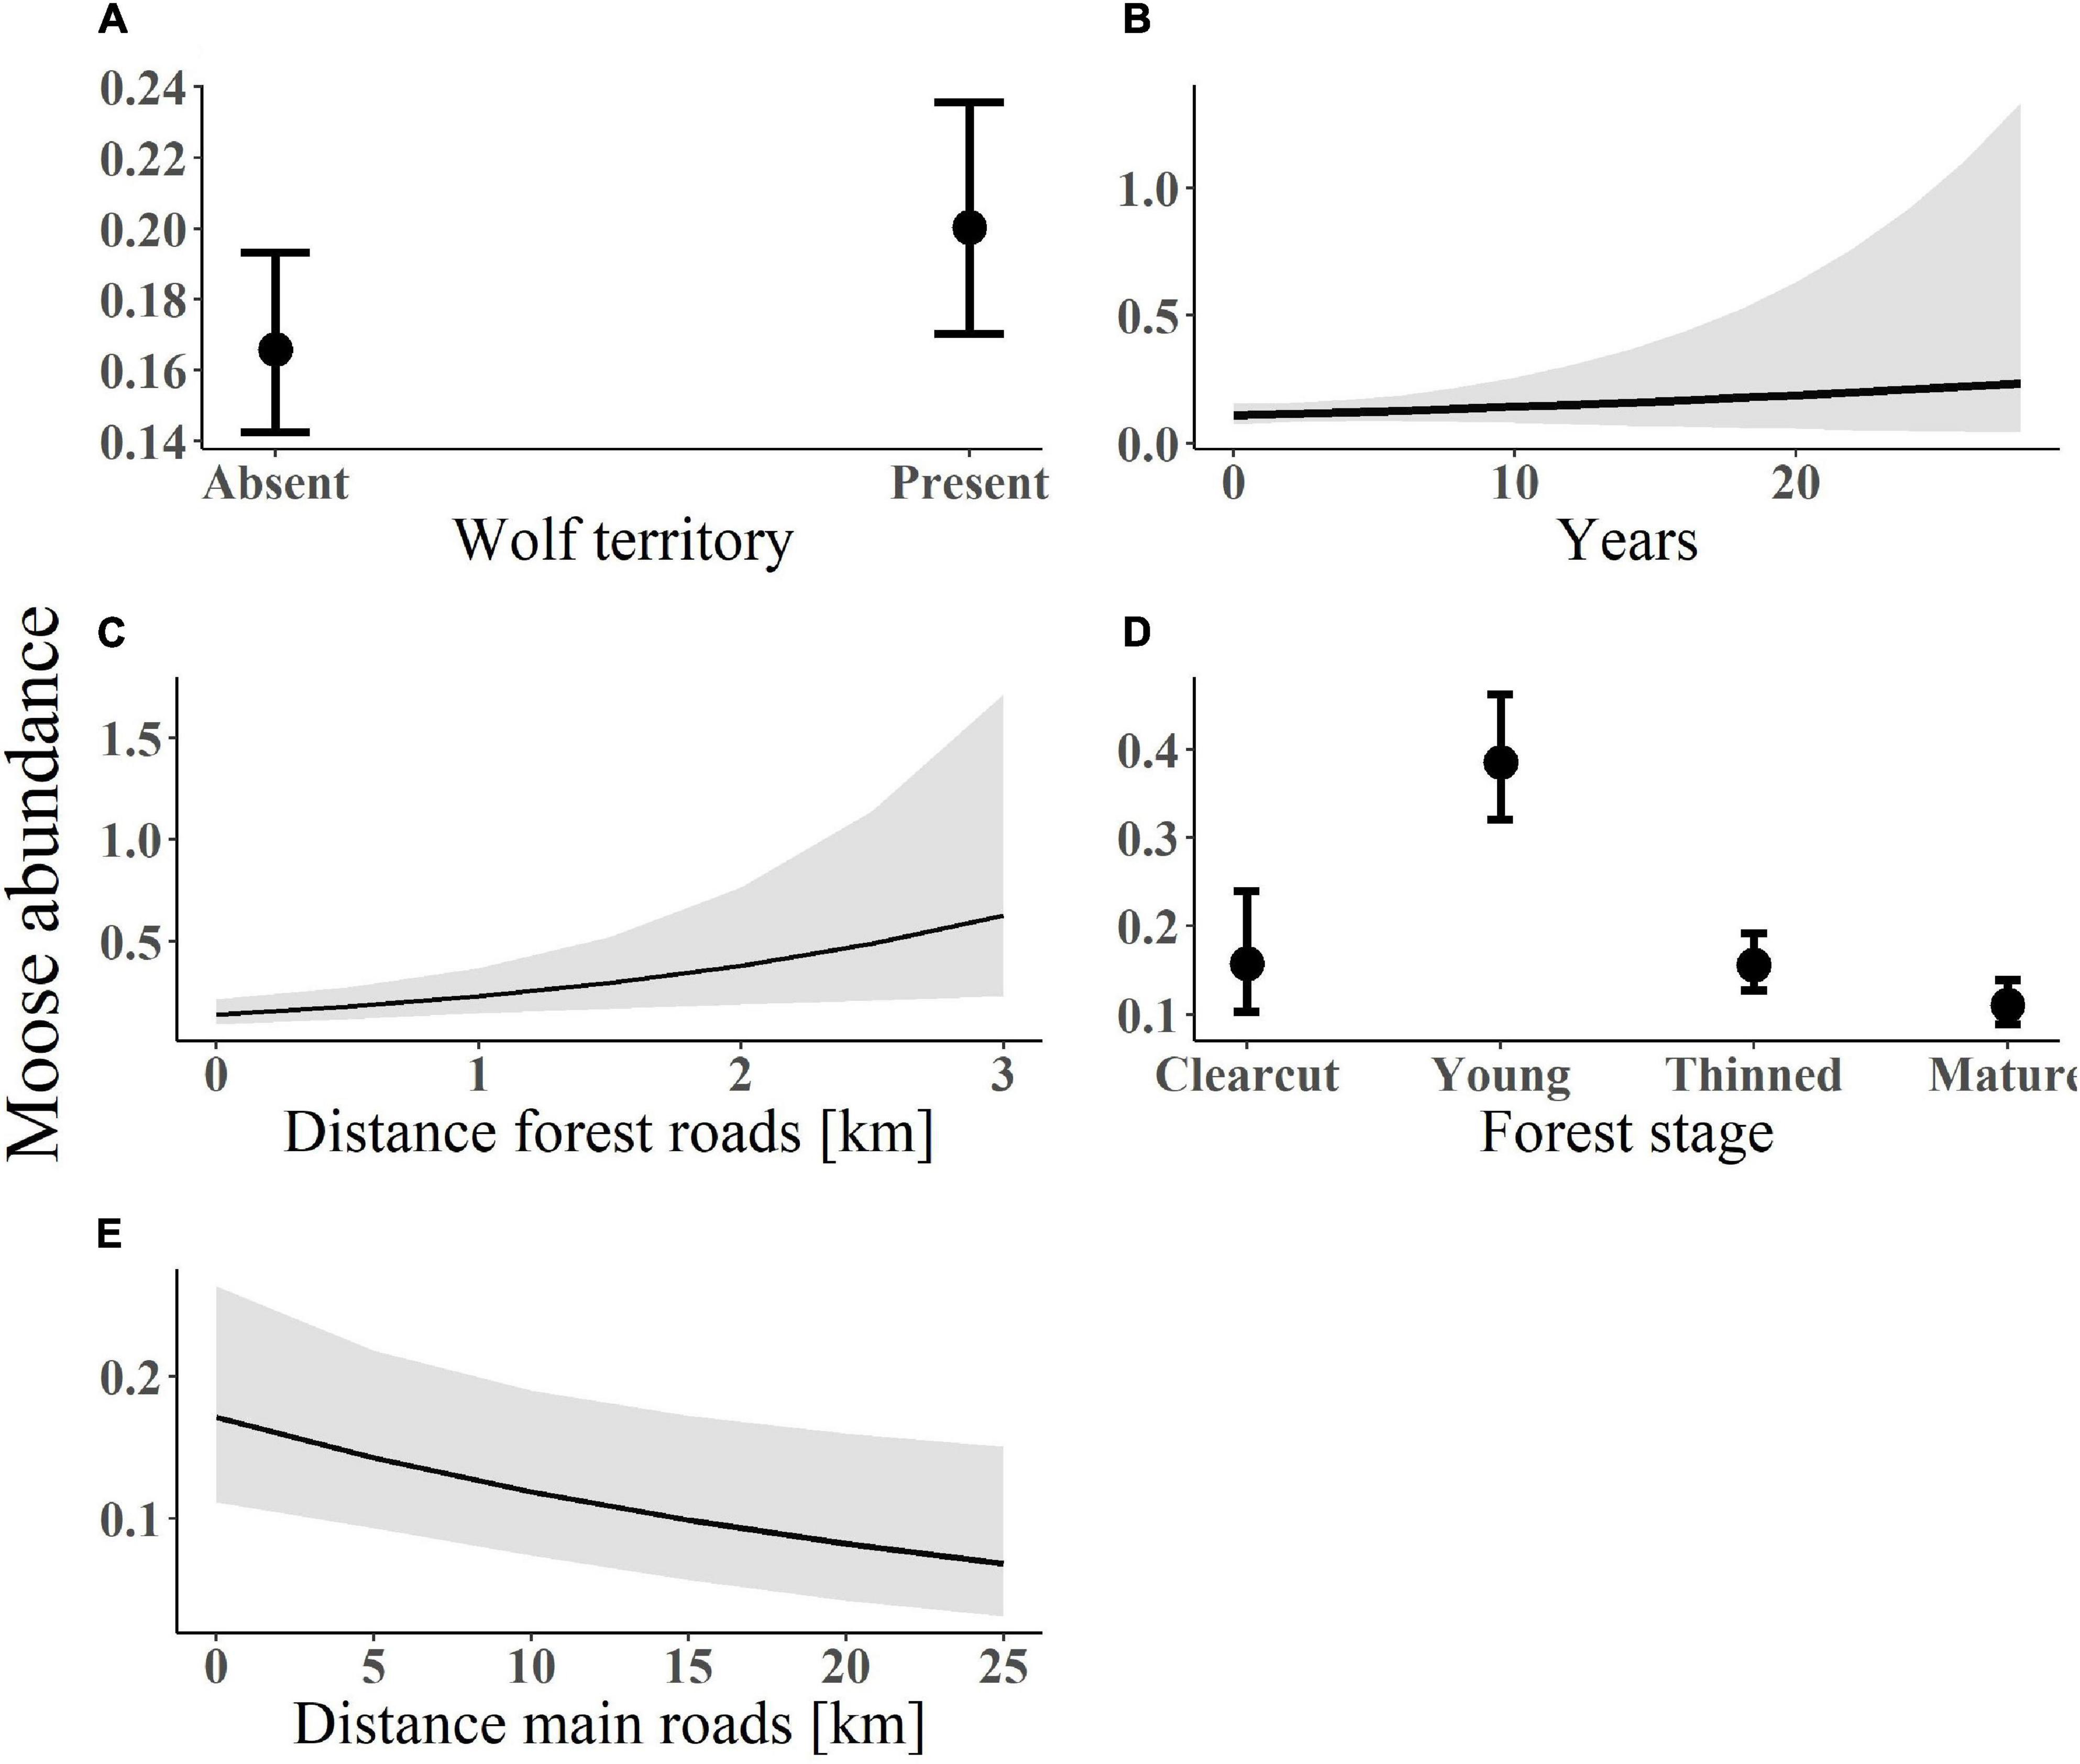
Figure 2. Predicted values of moose abundance (measured as the number of pellet counts) in relation to (A) wolf presence; (B) years since wolf territory establishment; (C) distance from forest roads; (D) forest age stage; and (E) distance from main roads. Data on moose pellet counts were recorded within south-central Sweden between 2003 and 2016. The lines (in plot B–E) represent the fitted values with associated standard errors from the model-averaged estimates. Plot a and d show the coefficients and confidence intervals of the predicted values of moose abundance in relation to presence/absence of a wolf territory (A) and across four forest age stages (D).
Probability of moose presence increased with pine proportion (β = 0.76, SE = 0.27, Figure 1C), distance from forest roads (β = 0.14, SE = 0.03, Figure 1D) and was higher in young forests (β = 0.9, SE = 0.2, Figure 1E; see Supplementary Appendix S1: Supplementary Figure S3B for forest plots and Supplementary Appendix S2: Supplementary Table S2 for models). The fixed factors explained 8% of the variation in moose presence. Moose abundance increased with distance from forest roads (β = 0.11, SE = 0.04, Figure 2C), was higher in young forests (β = 0.9, SE = 0.17, Figure 2D), but decreased with distance from main roads (β = -0.08, SE = 0.04, Figure 2E; see Supplementary Appendix S2: Supplementary Table S3 for models). In the zero-inflated part of the model for moose abundance, pine proportion, and distance from main roads had a negative effect on the probability of an extra zero, i.e., there was a lower probability of moose absence with increasing pine proportion and distance from main roads. The standardized regression coefficients showed that young forests and proportion of pine were the two most important variables explaining both moose presence and abundance, followed by distance to forest roads and wolf presence.
Browsing Damage
Wolf presence was included in the top-ranked models, which predicted the probability of browsing damage to be higher inside wolf territories than outside (β = 0.14, SE = 0.13; Figure 3A; see Supplementary Appendix S1: Supplementary Figure S2 for forest plots and Supplementary Appendix S2: Supplementary Table S3 for models). The top-ranked models for browsing damage intensity did not include wolf presence or time since wolf territory establishment.
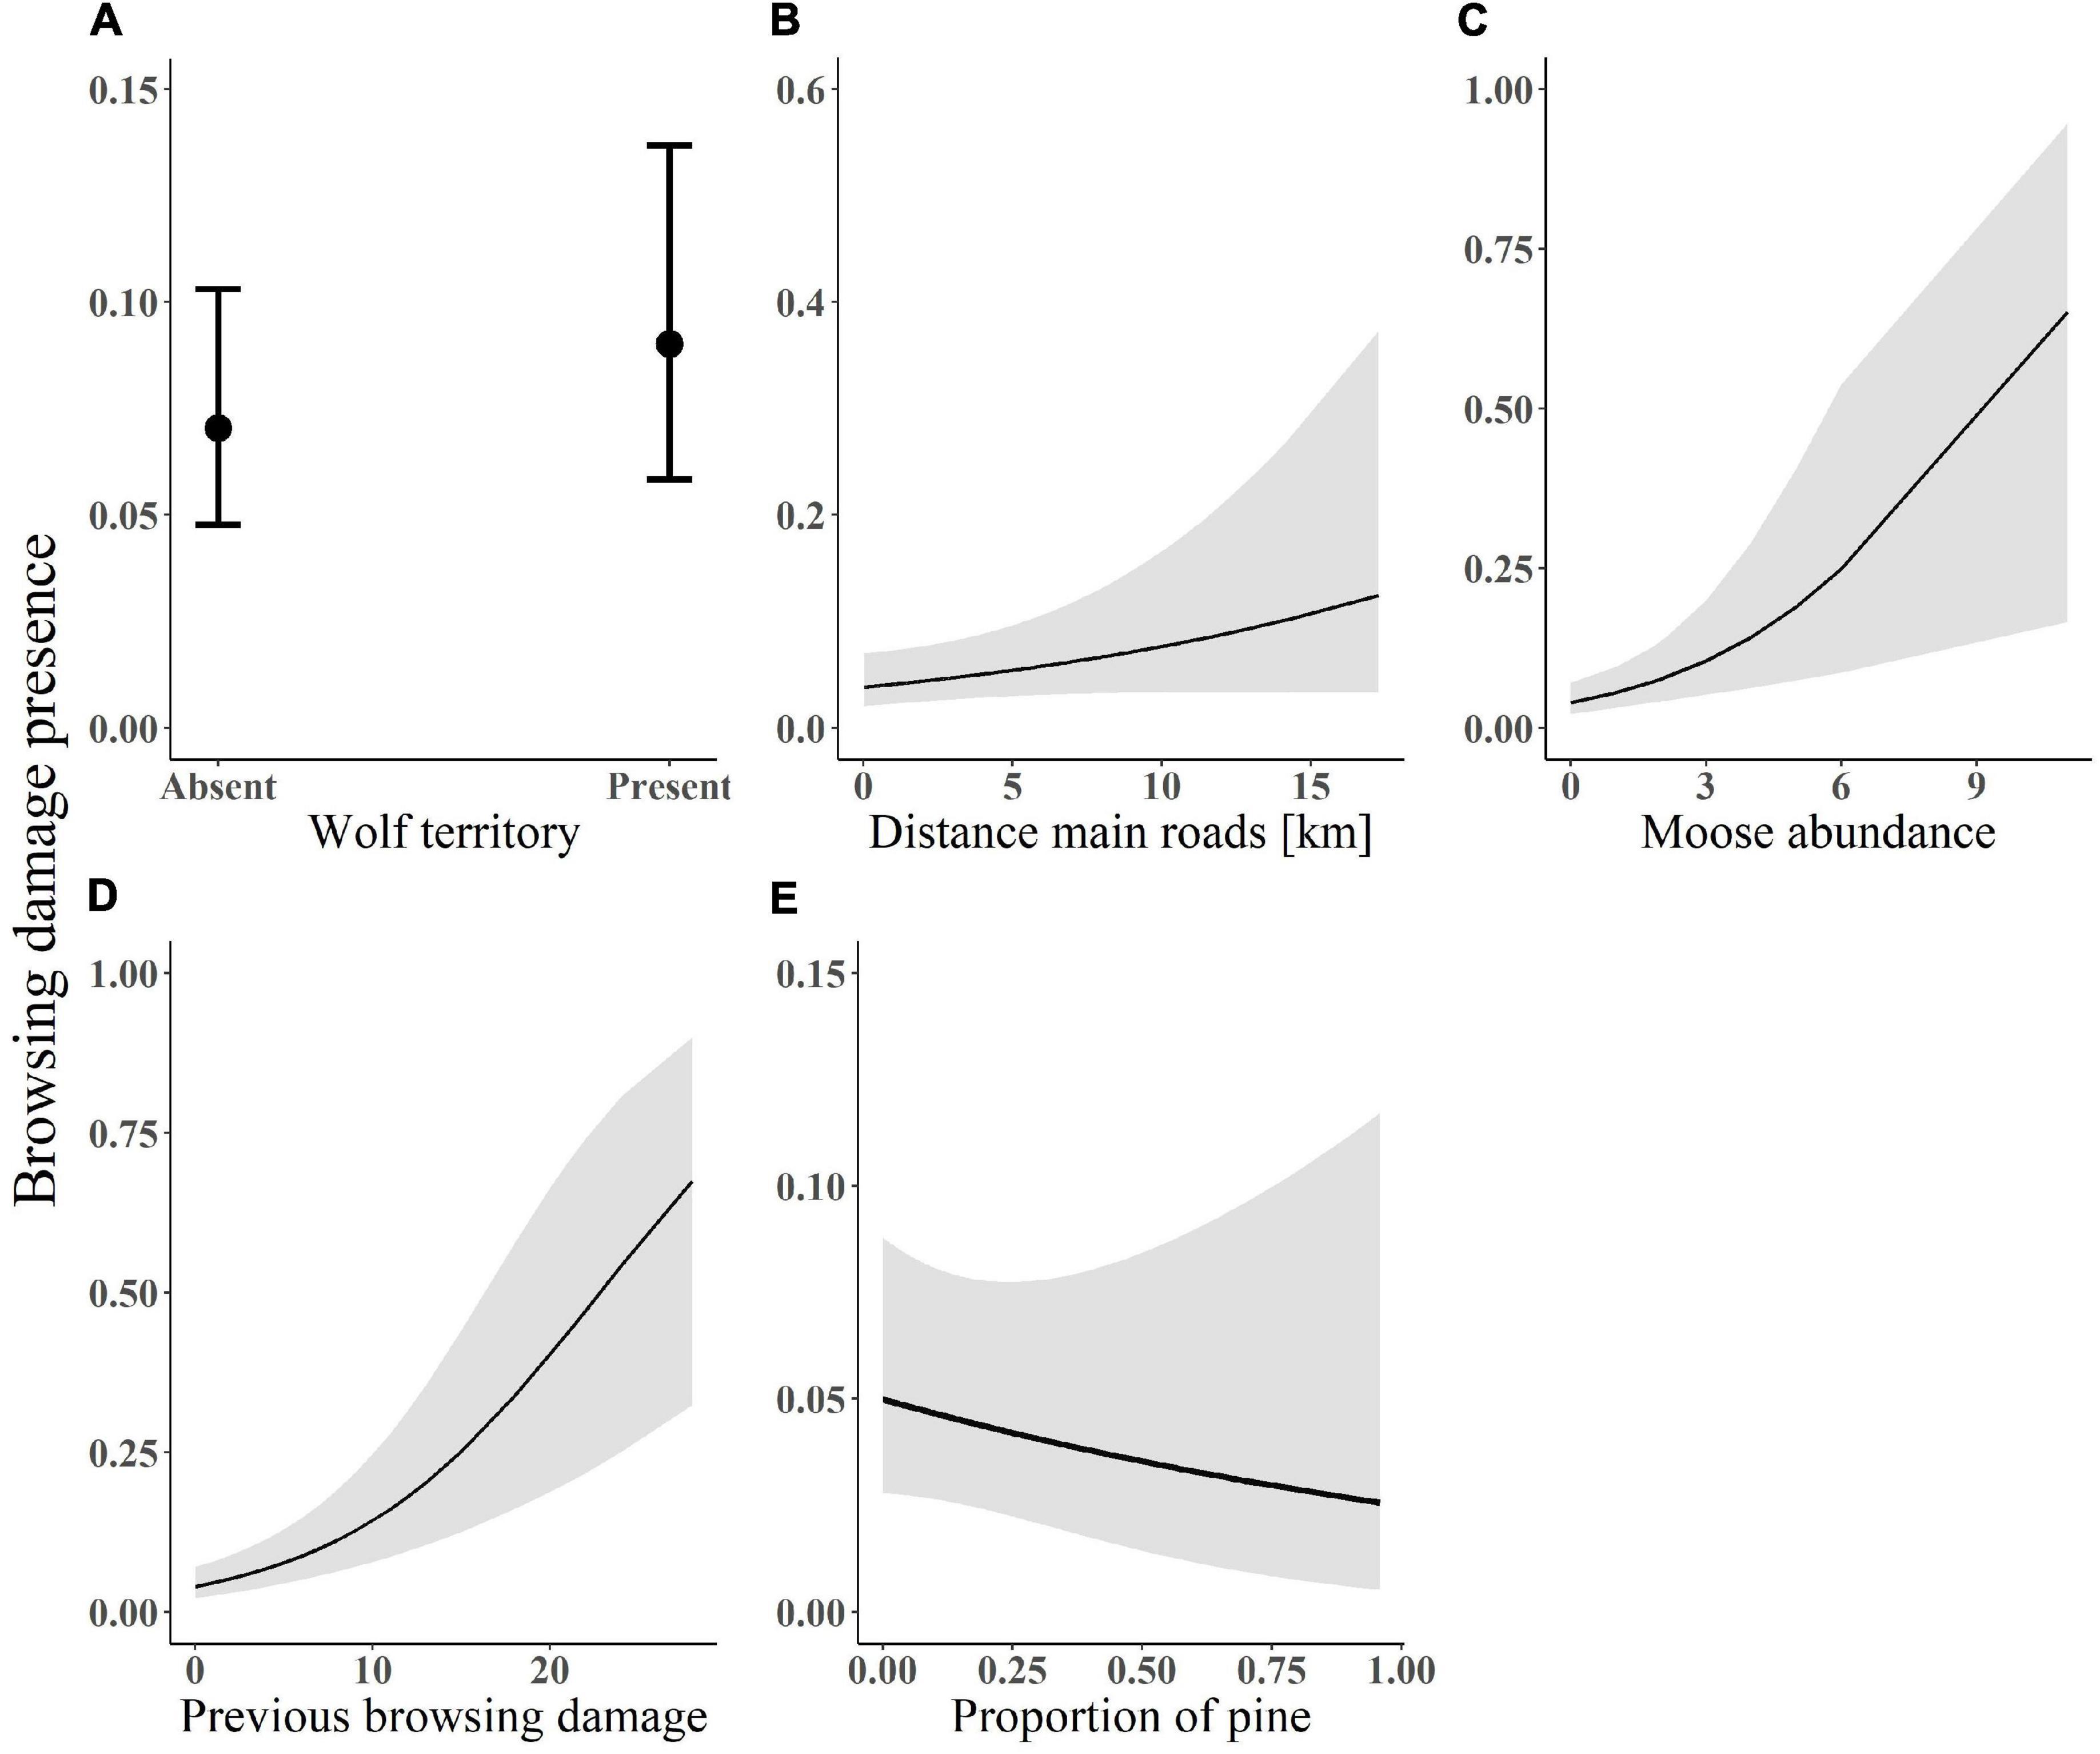
Figure 3. Predicted probability of browsing damage presence on pine in relation to (A) wolf presence; (B) distance from main roads; (C) moose abundance; (D) previous browsing damage; and (E) pine proportion. Data on browsing was collected within south-central Sweden between 2003 and 2016. The lines (in plot B–D) indicates the fitted values with associated standard errors from the model-averaged estimates. Plot a shows the coefficients and confidence intervals of the predicted probability of browsing damage presence in relation to presence/absence of a wolf territory.
Additionally, the probability of browsing damage increased with distance from main roads (β = 0.21, SE = 0.11; Figure 3B), with moose abundance (β = 0.33, SE = 0.10, Figure 3C) and with previous browsing damage (β = 0.50, SE = 0.09; Figure 3D), but decreased with proportion of pine (β = −0.11, SE = 0.15, Figure 3E; see Supplementary Appendix S1: Supplementary Figure S3B for forest plots and Supplementary Appendix S2: Supplementary Table S4 for models). The whole model explained 17% of the variation in browsing damage (15% by fixed factors). In the conditional part of the top-ranked browsing damage intensity model, intensity increased with moose abundance (β = 0.2, SE = 0.07, Figure 4A), distance from forest roads (β = 0.2, SE = 0.09, Figure 4B) and distance from main roads (β = 0.14, SE = 0.09, Figure 4C), previous browsing damage (β = 0.57, SE = 0.09, Figure 4D) and was higher in plots with presence of RAWO (β = 0.5, SE = 0.2, Figure 4E; see Supplementary Appendix S2: Supplementary Table S5 for models). In the zero-inflated part of the model, moose abundance and previous browsing had a negative effect on the probability of an extra zero, i.e., there was a smaller probability of browsing absence with increasing moose abundance and previous browsing. Previous browsing damage and moose abundance were the two most important variables explaining the presence of fresh moose browsing damage, followed by distance from main roads and wolf presence. Variation in browsing damage intensity, however, was best explained by previous browsing damage and RAWO presence, followed by moose abundance and distance from forest roads (see standardized coefficients above).
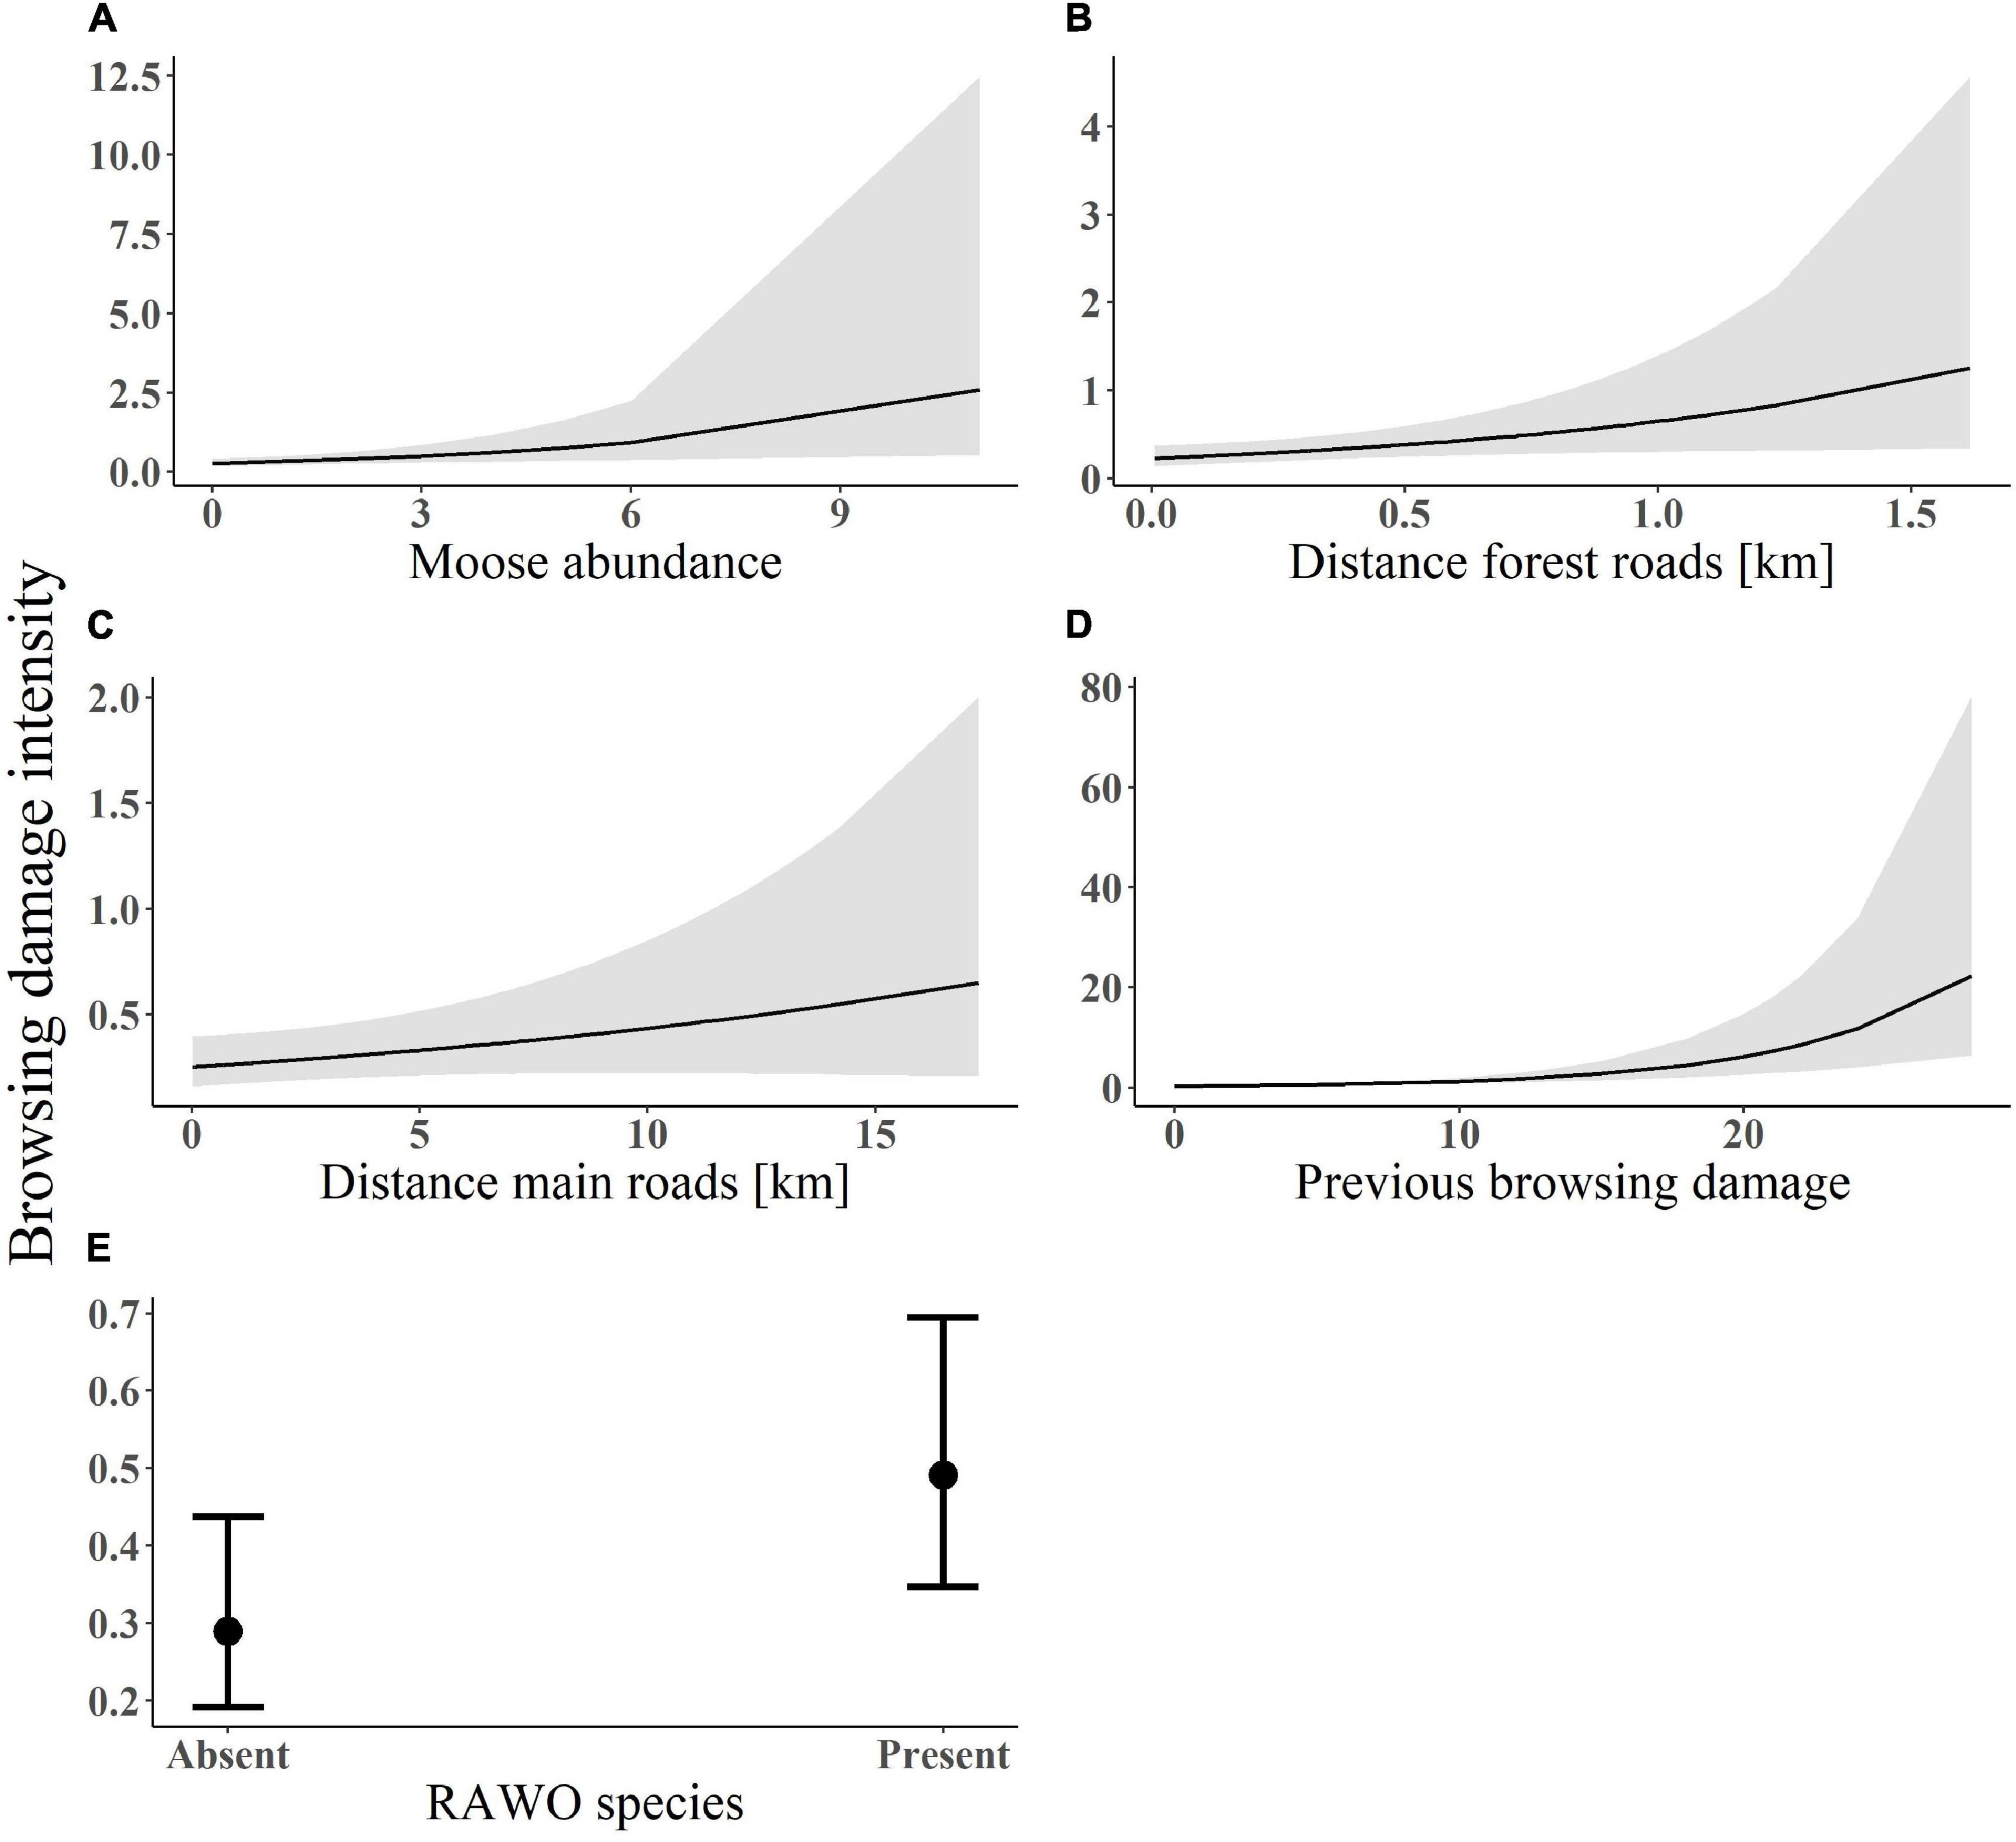
Figure 4. Predicted values of browsing damage intensity (number of damaged stems per plot) in relation to (A) moose abundance; (B) distance from forest roads; (C) distance from main roads; (D) previous browsing damage; and (E) RAWO presence. Data on browsing damage was collected within south-central Sweden between 2003 and 2016. The lines in figure A–D indicate the fitted values with associated standard errors from the model-averaged estimates. Plot (E) shows the coefficients and confidence intervals of the predicted values of browsing damage intensity in relation to presence/absence of RAWO (rowan, aspen, willow and oak) species.
Discussion
Moose Presence and Abundance
Contrary to our predictions, the probability of moose presence and moose abundance increased with time since wolf territory establishment and was higher inside wolf territories. Further, we found no support for our second hypothesis that moose have responded to the presence of wolves by changing habitat (in this case, forest age stages). A possible explanation may be that wolves establish their territories in areas with higher moose density to increase encounter rates. Selecting areas with high prey density allows predators to maximize prey encounter rate, which in turn increases the chances of successful predation (Bergman et al., 2006; Hopcraft et al., 2010). Previous research from North America shows that wolves disproportionately use areas of high moose abundance, and hunt in areas with a higher likelihood of encountering prey (Kittle et al., 2017; Woodruff et al., 2018). In Scandinavia, wolves maximize their hunting success by actively searching in areas of higher moose density, where the detection of prey, and hence an attack, are more likely to be successful (Gervasi et al., 2013). Additionally, during the early phases of recolonization in Scandinavia, wolves established in areas with high relative moose density (Wikenros et al., 2015). A decade after wolf establishment, moose densities in those areas were still high enough to sustain a larger moose harvest than in areas with no wolves (Wikenros et al., 2015), providing a potential explanation for the positive relationship found between moose presence/abundance and time since wolf territory establishment.
We suggest an additional, but not mutually exclusive, explanation for why moose presence and abundance was higher inside wolf territories compared to outside. When wolves re-established in Sweden, human hunters responded by reducing both the total number of individuals and the proportion of females harvested (Wikenros et al., 2015). The most severe reductions were observed the first year after wolf territory establishment (Wikenros et al., 2015). Thus, the higher abundance of moose in wolf territories could be from lowered human harvest (i.e., an indirect effect of wolf re-establishment) rather than a direct result of wolves. As well, moose hunters preferentially harvest calves and adult males (Nilsen et al., 2005; Nilsen and Solberg, 2006), whereas wolves favor calves and old females (Sand et al., 2008, 2012). This results in a stronger effect of hunter harvest on moose population growth per unit kill compared to wolves (Wikenros et al., 2015). Hence, the positive relationship between moose presence/abundance and wolf presence could also be explained by the fact that once wolves have established a territory, hunters within that area reduce and/or change the composition of the harvest of moose to compensate for moose mortality caused by wolves (Sand et al., 2012). This could lead to an overall higher probability of moose presence and abundance within wolf territories.
While we found a weak, positive effect of wolves, other variables were more important in affecting both moose presence and abundance, such as forest age stage and forage availability (in this case, the proportion of pine). Moose were likely to be present and more abundant in young forests, which is in accordance with previous research (Gundersen et al., 2004). Forage availability has repeatedly been shown to be an important factor for explaining spatial distribution of moose and other ungulates (Senft et al., 1987; Edenius et al., 2002; Månsson et al., 2012), and in this study moose were more abundant where there was a higher proportion of pine trees. Moreover, moose presence and abundance increased with increasing distance from forest roads, supporting previous findings that moose avoided forest roads (Laurian et al., 2012). The avoidance of forest roads may be caused by the presence of heavy equipment and logging trucks that act as disturbance (Van Langevelde et al., 2009), but also because hunters and wolves use forest roads (James and Stuart-Smith, 2000; Whittington et al., 2005; Houle et al., 2010; Zimmermann et al., 2014). Our results indicate that environmental and human factors were more important than the presence of a predator in explaining moose presence and abundance. In our study, we included distance to forest and main roads and forest age stage as proxies for human influence in the landscape, but our models could only explain a small portion of the variation in moose presence and abundance. This indicates that other factors, such as human hunting, may be important players in shaping moose populations. Unfortunately, hunting statistics for our study area and period were unavailable and could therefore not be included.
Browsing Damage
We did not find support for our hypotheses that wolf presence and time since territory establishment would be negatively correlated with the presence and intensity of browsing damage. In fact, our results showed that the probability of browsing damage was higher inside wolf territories, which is in contrast with previous studies [see e.g., Ripple et al., 2001; Ripple and Beschta, 2006, 2007; Beyer et al., 2007 for effects of wolves on browsing by elk (Cervus elaphus)]. The higher probability of browsing damage inside wolf territories is likely a result of the higher probability of moose presence and abundance also found within wolf territories. Our findings on browsing damage are similar to those of Gicquel et al. (2020), who also found higher browsing damage inside wolf territories than outside. Compared to Gicquel et al. (2020) our study occurred over a longer time-period and included moose abundance derived from pellet counts instead of bag size, which are higher spatial resolution data. Nevertheless, although the time periods, spatial scale studied and some of the explanatory variables differed, both our studies showed that moose browsing damage is higher inside wolf territories compared to outside. However, we found that the most important factors affecting the presence and intensity of browsing damage were previous browsing damage, moose abundance and RAWO presence. The positive correlations between browsing damage and moose abundance are in accordance with other studies (Månsson et al., 2007). Previous browsing has also been identified as an important predictor of fresh browsing intensity by moose (Bergqvist et al., 2003; Mathisen et al., 2017), here supported by a positive correlation between previous and fresh browsing damage. In addition, we found significantly lower levels of fresh browsing near forest roads, which is likely a consequence of moose avoiding forest roads.
Our findings are supported by recent studies showing that human-modified attributes and environmental factors are more important for moose abundance and browsing damage than wolf presence and time since wolf territory establishment (Gicquel et al., 2020). These results contrast with studies from protected areas where wolves have both density and behaviorally mediated effects on lower trophic levels (Fortin et al., 2005; Ripple and Beschta, 2012; Ripple et al., 2015; Ditmer et al., 2018). In protected areas such as Yellowstone National Park, there is often little to no anthropogenic activity and therefore, the relative importance of wolves to shape the dynamics and functions of an ecosystem is potentially higher (Mech, 1966, 2013; McLaren and Peterson, 1994; Berger et al., 2001a; Terborgh and Estes, 2010; Kuijper et al., 2016). However, the existence and extent of such effects is still being investigated and questioned (Kauffman et al., 2010; Winnie, 2012; Brice et al., 2020). Outside of protected areas, however, the effects of predators on the density and behavior of the prey populations may be reduced and/or altered due to anthropogenic activities that have a much stronger impact on most trophic levels, from vegetation to herbivores and large predators (Eriksen et al., 2011; Mech, 2012; Kuijper et al., 2016; Gicquel et al., 2020). Dorresteijn et al. (2015) found that both direct and indirect effects of humans influenced the ecosystem, and all trophic levels within it, more strongly than other apex predators did. Because humans can influence both predators and their prey, they also strongly shape the potential for trophic cascades, either by directly affecting their densities or/and their behaviors or indirectly by modifying the resource landscapes exploited by both predators and prey (Kuijper et al., 2016).
In Scandinavia, human harvest has functionally replaced natural predation on moose by wolves throughout the last century (Sand et al., 2006). Hunter harvest accounts for most of the moose mortality both on a national scale (Laundré et al., 2001) and within most wolf territories (Wikenros et al., 2015). Where moose mortality from natural predators is absent or lower (wolf territories) compared to hunting-related mortality, anti-predator behaviors may take a longer time to be selected for, as the hunting pressure from humans may lead to selection against such traits (Sand et al., 2006; Kuijper et al., 2016). Standing ground and being aggressive toward wolves has been documented as the most successful anti-predator behavior for moose in e.g., Isle Royale (Mech, 1966, 1970; Peterson, 1977). However, moose in Scandinavia were less likely to make a stand when attacked by wolves and instead chose to flee (Wikenros et al., 2009). Such differences in behavior may be a result of the hunting mode and the constant hunting pressure Scandinavian moose have been exposed to for more than 100 years. Moose in Scandinavia are often hunted using baying dogs to keep the moose at bay while the hunter stalks the moose. Hence, taking a stand and being aggressive toward baying dogs and hunters would likely increase the chances of being shot compared to fleeing, and will therefore be selected against. Additionally, the response of hunters to the return of wolves may also influence moose densities (Wikenros et al., 2015). Hunters may decide not to change moose harvest to compensate for wolf mortality (Wikenros et al., 2015) and in that case the additive mortality of wolves and hunters may lead to reduced moose densities (Jȩdrzejewski et al., 2000). In anthropogenic landscapes, humans can also affect predators and prey by modifying the availability and quality of resources (Kuijper et al., 2016). For instance, forestry practices create clear-cuts, which results in the recruitment of attractive forage species for ungulates such as rowan, aspen, and willow (Kuijper et al., 2009). Consequently, the behavior of humans in response to the recolonization of large predators such as wolves will ultimately govern the impact of predators in these types of ecosystems. Future research about the ecological effects of large predators in anthropogenic landscapes should include humans because of the great impact humans have on ecosystems all across the globe (Steffen et al., 2007).
Conclusion
Our findings add to the growing body of literature investigating the ecological effects of large carnivores in human-dominated landscapes. In our study, the predator’s presence was positively correlated with prey abundance and browsing damage. This is in contrast to research from North America. However, we found that other human and environmental variables were more important for moose abundance and browsing damage. There is increasing evidence that human influence may be more prominent than carnivores in affecting species at different trophic levels within anthropogenic landscapes compared to more pristine ecosystems (Dorresteijn et al., 2015). This suggests that the potential for large predators to initiate trophic cascades is context-dependent, but also that previous studies of predator-prey interactions carried out in protected areas may not be representative of the ecological effects of large predators on prey over vast areas of the world. A key question is therefore, to understand how natural and human predators interact with each other to influence ungulate populations across different gradients of anthropogenic pressure, and how bottom-up processes, which humans also modify, can influence such interactions. Studies increasing the understanding about how and to what extent human activities influence the functional role of large carnivores in anthropogenic landscapes have important conservation and management implications.
Data Availability Statement
The datasets generated for this study can be found in the online repositories. The names of the repository/repositories and accession number(s) can be found below: https://datadryad.org/stash/share/svRCeH_hvPZVH2UjmzWQOvErl-B6deccaKMXgGEeHtM, Dryad Repository.
Ethics Statement
Ethical review and approval was not required for the animal study because no invasive techniques were used in the study.
Author Contributions
GA conceived and designed the study, compiled data, carried out the statistical analyses, and drafted the manuscript. HS secured funding, conceived and designed the study, and revised the manuscript. JM secured funding, conceived and designed the study, and revised the manuscript. KM revised the manuscript. CW secured funding, conceived and designed the study, and revised the manuscript. This work derives in part from a master thesis conducted by GA and supervised by CW, HS, and JM. All authors gave final approval for publication and agreed to be held accountable for the work performed therein.
Funding
This work was supported by the FORMAS, the Swedish Environmental Protection Agency, the Norwegian Environment Agency, and the Interreg Sweden-Norway.
Conflict of Interest
The authors declare that the research was conducted in the absence of any commercial or financial relationships that could be construed as a potential conflict of interest.
Acknowledgments
We thank Göran Kempe, for providing data from the Swedish National Forestry Inventory. We thank the numerous people involved in wolf capture and monitoring over the last two decades, and Linn Svensson at SLU Wildlife Damage Center for providing the wolf monitoring data. We also thank Henrik Andrén for statistical support.
Supplementary Material
The Supplementary Material for this article can be found online at: https://www.frontiersin.org/articles/10.3389/fevo.2020.577963/full#supplementary-material
References
Bates, D., Maechler, M., Bolker, B., Walker, S., Christensen, R. H. B., Singmann, H., Dai, B., Grothendieck, G., Green, P., and Bolker, M. B. (2015). Package ‘lme4’. Convergence 12:2.
Bennett, L. J., English, P., and Mccain, R. (1940). A study of deer populations by use of pellet-group counts. J. Wildlife Manag. 4, 398–403. doi: 10.2307/3796010
Berger, J., Stacey, P. B., Bellis, L., and Johnson, M. P. (2001a). A mammalian predator–prey imbalance: grizzly bear and wolf extinction affect avian neotropical migrants. Ecol. Appl. 11, 947–960. doi: 10.1890/1051-0761(2001)011[0947:amppig]2.0.co;2
Berger, J., Swenson, J. E., and Persson, I. -L. (2001b). Recolonizing carnivores and naive prey: conservation lessons from Pleistocene extinctions. Science 291, 1036–1039. doi: 10.1126/science.1056466
Bergman, E. J., Garrott, R. A., Creel, S., Borkowski, J. J., Jaffe, R., and Watson, F. (2006). Assessment of prey vulnerability through analysis of wolf movements and kill sites. Ecol. Appl. 16, 273–284. doi: 10.1890/04-1532
Bergman, M., and Åkerberg, S. (2006). Moose hunting, forestry, and wolves in Sweden. Alces 42, 13–23.
Bergqvist, G., Bergström, R., and Edenius, L. (2001). Patterns of stem damage by moose (Alces alces) in young Pinus sylvestris stands in Sweden. Scand. J. Forest Res. 16, 363–370. doi: 10.1080/02827580152496759
Bergqvist, G., Bergström, R., and Edenius, L. (2003). Effects of moose (Alces alces) rebrowsing on damage development in young stands of Scots pine (Pinus sylvestris). Forest Ecol. Manag. 176, 397–403. doi: 10.1016/s0378-1127(02)00288-8
Beschta, R. L., and Ripple, W. J. (2018). Can large carnivores change streams via a trophic cascade? Ecohydrology 12:e2048 doi: 10.1002/eco.2048
Beschta, R. L., Painter, L. E., and Ripple, W. J. (2018). Trophic cascades at multiple spatial scales shape recovery of young aspen in Yellowstone. Forest Ecol. Manag. 413, 62–69. doi: 10.1016/j.foreco.2018.01.055
Beyer, H. L., Merrill, E. H., Varley, N., and Boyce, M. S. (2007). Willow on Yellowstone’s northern range: evidence for a trophic cascade? Ecol. Appl. 17, 1563–1571. doi: 10.1890/06-1254.1
Bjørneraas, K., Solberg, E. J., Herfindal, I., Van Moorter, B., Rolandsen, C. M., Tremblay, J. -P., Skarpe, C., Sæther, B. -E., Eriksen, R., and Astrup, R. (2011). Moose Alces alces habitat use at multiple temporal scales in a human-altered landscape. Wildlife Biol. 17, 44–54. doi: 10.2981/10-073
Brice, E., Larsen, E., and Macnulty, D. (2020). Sampling bias exaggerates a textbook example of a trophic cascade. bioRxiv.
Brooks, M. E., Kristensen, K., Van Benthem, K. J., Magnusson, A., Berg, C. W., Nielsen, A., Skaug, H. J., Machler, M., and Bolker, B. M. (2017). glmmTMB balances speed and flexibility among packages for zero-inflated generalized linear mixed modelling. R J. 9, 378–400. doi: 10.32614/rj-2017-066
Burnham, K. P., and Anderson, D. R. (2002). Model Selection and Multimodel Inference. New York: Springer.
Cederlund, G. (1980). Foods of moose and roe-deer at Grimsö in central Sweden-results of rumen content analyses. Nyköping: Svenska Jägareförbundet.
Chapron, G., Kaczensky, P., Linnell, J. D., Von Arx, M., Huber, D., Andrén, H., López-Bao, J. V., Adamec, M., Álvares, F., and Anders, O. (2014). Recovery of large carnivores in Europe’s modern human-dominated landscapes. Science 346, 1517–1519.
Christiansen, L. (2014). Skogsstatistisk årsbok 2014: Swedish Statistical Yearbook of Forestry. Skogsstatistisk: Swedish Forestry Agency.
Creel, S., and Christianson, D. (2008). Relationships between direct predation and risk effects. Trends Ecol. Evol. 23, 194–201. doi: 10.1016/j.tree.2007.12.004
Ditmer, M. A., Fieberg, J. R., Moen, R. A., Windels, S. K., Stapleton, S. P., and Harris, T. R. (2018). Moose movement rates are altered by wolf presence in two ecosystems. Ecol. Evol. 8, 9017–9033. doi: 10.1002/ece3.4402
Dorresteijn, I., Schultner, J., Nimmo, D. G., Fischer, J., Hanspach, J., Kuemmerle, T., Kehoe, L., and Ritchie, E. G. (2015). Incorporating anthropogenic effects into trophic ecology: predator-prey interactions in a human-dominated landscape. Proc. Biol. Sci. 282:20151602. doi: 10.1098/rspb.2015.1602
Edenius, L., Bergman, M., Ericsson, G., and Danell, K. (2002). The role of moose as a disturbance factor in managed boreal forests. Silva Fennica 36, 57–67.
Engqvist, L. (2005). The mistreatment of covariate interaction terms in linear model analyses of behavioural and evolutionary ecology studies. Anim. Behav. 70, 967–971. doi: 10.1016/j.anbehav.2005.01.016
Eriksen, A., Wabakken, P., Zimmermann, B., Andreassen, H. P., Arnemo, J. M., Gundersen, H., Liberg, O., Linnell, J., Milner, J. M., and Pedersen, H. C. (2011). Activity patterns of predator and prey: a simultaneous study of GPS-collared wolves and moose. Anim. Behav. 81, 423–431. doi: 10.1016/j.anbehav.2010.11.011
Estes, J. A., and Duggins, D. O. (1995). Sea otters and kelp forests in Alaska: generality and variation in a community ecological paradigm. Ecol. Monogr. 65, 75–100. doi: 10.2307/2937159
Estes, J. A., Terborgh, J., Brashares, J. S., Power, M. E., Berger, J., Bond, W. J., Carpenter, S. R., Essington, T. E., Holt, R. D., and Jackson, J. B. (2011). Trophic downgrading of planet Earth. Science 333, 301–306.
Fortin, D., Beyer, H. L., Boyce, M. S., Smith, D. W., Duchesne, T., and Mao, J. S. (2005). Wolves influence elk movements: behavior shapes a trophic cascade in Yellowstone National Park. Ecology 86, 1320–1330. doi: 10.1890/04-0953
Fox, G. A., Negrete-Yankelevich, S., and Sosa, V. J. (2015). Ecological statistics: contemporary theory and application. Oxford: Oxford University Press, USA.
Fridman, J., Holm, S., Nilsson, M., Nilsson, P., Ringvall, A. H., and Ståhl, G. (2014). Adapting National Forest Inventories to changing requirements–the case of the Swedish National Forest Inventory at the turn of the 20th century. Silva Fennica 48, 1–29.
Fries, C., Bergquist, J., and Wikström, P. (2015). Lägsta ålder förföryngringsavverkning (LÅF)—en analys av följder av att sänka åldrarna i norra Sverige till samma nivå som i södra Sverige. Swedish Forest Agen. Rep. 6:2015.
Gervasi, V., Nilsen, E. B., Sand, H., Panzacchi, M., Rauset, G. R., Pedersen, H. C., et al. (2012). Predicting the potential demographic impact of predators on their prey: a comparative analysis of two carnivore –ungulate systems in Scandinavia. J. Anim. Ecol. 81, 443–454. doi: 10.1111/j.1365-2656.2011.01928.x
Gervasi, V., Sand, H., Zimmermann, B., Mattisson, J., Wabakken, P., and Linnell, J. D. (2013). Decomposing risk: landscape structure and wolf behavior generate different predation patterns in two sympatric ungulates. Ecol. Applicat. 23, 1722–1734. doi: 10.1890/12-1615.1
Gicquel, M., Sand, H., Månsson, J., Wallgren, M., and Wikenros, C. (2020). Does recolonization of wolves affect moose browsing damage on young Scots pine? Forest Ecol. Manag. 473:118298. doi: 10.1016/j.foreco.2020.118298
Gundersen, H., Andreassen, H. P., and Stein Storaas, T. (2004). Supplemental feeding of migratory moose Alces alces: forest damage at two spatial scales. Wildlife Biol. 10, 213–223. doi: 10.2981/wlb.2004.027
Halofsky, J. S., and Ripple, W. J. (2008). Fine-scale predation risk on elk after wolf reintroduction in Yellowstone National Park, USA. Oecologia 155, 869–877. doi: 10.1007/s00442-007-0956-z
Harrison, X. A. (2014). Using observation-level random effects to model overdispersion in count data in ecology and evolution. PeerJ 2:e616.
Hopcraft, J. G. C., Olff, H., and Sinclair, A. (2010). Herbivores, resources and risks: alternating regulation along primary environmental gradients in savannas. Trends Ecol. Evol. 25, 119–128. doi: 10.1016/j.tree.2009.08.001
Hörnberg, S. (2001). Changes in population density of moose (Alces alces) and damage to forests in Sweden. Forest Ecol. Manag. 149, 141–151. doi: 10.1016/s0378-1127(00)00551-x
Houle, M., Fortin, D., Dussault, C., Courtois, R., and Ouellet, J. -P. (2010). Cumulative effects of forestry on habitat use by gray wolf (Canis lupus) in the boreal forest. Landsc. Ecol 25, 419–433. doi: 10.1007/s10980-009-9420-2
James, A. R., and Stuart-Smith, A. K. (2000). Distribution of caribou and wolves in relation to linear corridors. J. Wildlife Manag. 64, 154–159. doi: 10.2307/3802985
Jansson, U., and Antonson, H. (2011). Agriculture and forestry in Sweden since 1900 Geographical and historical studies: Geographical and historical studies. Kungl: Skogs-och Lantbruksakademien.
Jȩdrzejewski, W., Jȩdrzejewska, B., Okarma, H., Schmidt, K., Zub, K., and Musiani, M. (2000). Prey selection and predation by wolves in Białowieża Primeval Forest, Poland. J. Mammal. 81, 197–212. doi: 10.1644/1545-1542(2000)081<0197:psapbw>2.0.co;2
Kalén, C., Bergquist, J., and Carlstedt, F. (2018). Äbin Fältinstruktion. Skogsstatistisk: Swedish Forestry Agency.
Kauffman, M. J., Brodie, J. F., and Jules, E. S. (2010). Are wolves saving Yellowstone’s aspen? A landscape−level test of a behaviorally mediated trophic cascade. Ecology 91, 2742–2755. doi: 10.1890/09-1949.1
Kittle, A. M., Anderson, M., Avgar, T., Baker, J. A., Brown, G. S., Hagens, J., Iwachewski, E., Moffatt, S., Mosser, A., and Patterson, B. R. (2017). Landscape−level wolf space use is correlated with prey abundance, ease of mobility, and the distribution of prey habitat. Ecosphere 8:e01783.
Kuijper, D. P., Cromsigt, J., Churski, M., Adam, B., Jêdrzejewska, B., and Jêdrzejewski, W. (2009). Do ungulates preferentially feed in forest gaps in European temperate forest? Forest Ecol. Manag. 258, 1528–1535. doi: 10.1016/j.foreco.2009.07.010
Kuijper, D., De Kleine, C., Churski, M. V., Van Hooft, P., Bubnicki, J., and Jêdrzejewska, B. (2013). Landscape of fear in Europe: wolves affect spatial patterns of ungulate browsing in Białowieża Primeval Forest, Poland. Ecography 36, 1263–1275. doi: 10.1111/j.1600-0587.2013.00266.x
Kuijper, D., Sahlén, E., Elmhagen, B., Chamaillé-Jammes, S., Sand, H., Lone, K., and Cromsigt, J. (2016). Paws without claws? Ecological effects of large carnivores in anthropogenic landscapes. Proc. Royal Soc. B 283:20161625. doi: 10.1098/rspb.2016.1625
Laundré, J. W., Hernández, L., and Altendorf, K. B. (2001). Wolves, elk, and bison: reestablishing the” landscape of fear” in Yellowstone National Park, USA. Can. J. Zool. 79, 1401–1409. doi: 10.1139/z01-094
Laurian, C., Dussault, C., Ouellet, J. -P., Courtois, R., and Poulin, M. (2012). Interactions between a large herbivore and a road network. Ecoscience 19, 69–79. doi: 10.2980/19-1-3461
Lavsund, S. (1987). Moose relationships to forestry in Finland, Norway and Sweden. Swedish Wildlife Res. 1987, 229–244.
Lavsund, S., Nygrén, T., and Solberg, E. J. (2003). Status of moose populations and challenges to moose management in Fennoscandia. Alces 39, 109–130.
Liberg, O., Aronson, Å., Sand, H., Wabakken, P., Maartmann, E., Svensson, L., and Åkesson, M. (2012). Monitoring of wolves in Scandinavia. Hystrix 23, 29–34.
Lüdecke, D., Makowski, D., Waggoner, P., and Patil, I. (2020). Assessment of regression models performance. CRAN. R package version 0.4 8.
Månsson, J., Andrén, H., Pehrson, Å., and Bergström, R. (2007). Moose browsing and forage availability: a scale-dependent relationship? Can. J. Zool. 85, 372–380. doi: 10.1139/z07-015
Månsson, J., Bunnefeld, N., Andrén, H., and Ericsson, G. (2012). Spatial and temporal predictions of moose winter distribution. Oecologia 170, 411–419. doi: 10.1007/s00442-012-2305-0
Månsson, J., Prima, M.-C., Nicholson, K. L., Wikenros, C., and Sand, H. (2017). Group or ungroup–moose behavioural response to recolonization of wolves. Front. Zool. 14:10.
Marques, F. F., Buckland, S. T., Goffin, D., Dixon, C. E., Borchers, D. L., Mayle, B. A., and Peace, A. J. (2001). Estimating deer abundance from line transect surveys of dung: sika deer in southern Scotland. J. Appl. Ecol. 38, 349–363. doi: 10.1046/j.1365-2664.2001.00584.x
Mathisen, K. M., Milner, J. M., and Skarpe, C. (2017). Moose–tree interactions: rebrowsing is common across tree species. BMC Ecol. 17:12.
Mattisson, J., Sand, H., Wabakken, P., Gervasi, V., Liberg, O., Linnell, J. D., Rauset, G. R., and Pedersen, H. C. (2013). Home range size variation in a recovering wolf population: evaluating the effect of environmental, demographic, and social factors. Oecologia 173, 813–825. doi: 10.1007/s00442-013-2668-x
McLaren, B. E., and Peterson, R. O. (1994). Wolves, moose, and tree rings on Isle Royale. Science 266, 1555–1558. doi: 10.1126/science.266.5190.1555
Mech, L. D. (1970). The wolf: the ecology and behaviour of an endangered species. New York: Natural History Press.
Mech, L. D. (2012). Is science in danger of sanctifying the wolf? Biol. Conserv. 150, 143–149. doi: 10.1016/j.biocon.2012.03.003
Mech, L. D. (2013). The case for watchful waiting with Isle Royale’s wolf population. Wright Forum: JSTOR, 326–332.
Mohr, C. O. (1947). Table of equivalent populations of North American small mammals. Am. Midland Natur. 37, 223–249. doi: 10.2307/2421652
Neff, D. J. (1968). The pellet-group count technique for big game trend, census, and distribution: a review. J. Wildlife Manag. 1968, 597–614. doi: 10.2307/3798941
Nicholson, K. L., Milleret, C., Månsson, J., and Sand, H. (2014). Testing the risk of predation hypothesis: the influence of recolonizing wolves on habitat use by moose. Oecologia 176, 69–80. doi: 10.1007/s00442-014-3004-9
Nilsen, E. B., and Solberg, E. J. (2006). Patterns of hunting mortality in Norwegian moose (Alces alces) populations. Eur. J. Wildlife Res. 52, 153–163. doi: 10.1007/s10344-005-0023-1
Nilsen, E. B., Pettersen, T., Gundersen, H., Milner, J. M., Mysterud, A., Solberg, E. J., Andreassen, H. P., and Stenseth, N. C. (2005). Moose harvesting strategies in the presence of wolves. J. Appl. Ecol. 42, 389–399. doi: 10.1111/j.1365-2664.2005.01018.x
Painter, L. E., Beschta, R. L., Larsen, E. J., and Ripple, W. J. (2015). Recovering aspen follow changing elk dynamics in Yellowstone: evidence of a trophic cascade? Ecology 96, 252–263. doi: 10.1890/14-0712.1
Peterson, R. O. (1977). Wolf ecology and prey relationships on Isle Royale. United States: US National Park.
R Core Team (2018). “R: A language and environment for statistical computing. Vienna: R Foundation for Statistical Computing.
Ripple, W. J., and Beschta, R. L. (2004). Wolves and the ecology of fear: can predation risk structure ecosystems? BioScience 54, 755–766. doi: 10.1641/0006-3568(2004)054[0755:wateof]2.0.co;2
Ripple, W. J., and Beschta, R. L. (2006). Linking wolves to willows via risk-sensitive foraging by ungulates in the northern Yellowstone ecosystem. Forest Ecol. Manag. 230, 96–106. doi: 10.1016/j.foreco.2006.04.023
Ripple, W. J., and Beschta, R. L. (2007). Restoring Yellowstone’s aspen with wolves. Biol. Conserv. 138, 514–519. doi: 10.1016/j.biocon.2007.05.006
Ripple, W. J., and Beschta, R. L. (2012). Trophic cascades in Yellowstone: the first 15 years after wolf reintroduction. Biol. Conserv. 145, 205–213. doi: 10.1016/j.biocon.2011.11.005
Ripple, W. J., Estes, J. A., Beschta, R. L., Wilmers, C. C., Ritchie, E. G., Hebblewhite, M., et al. (2014). Status and ecological effects of the world’s largest carnivore. Science 343:1241484
Ripple, W. J., Larsen, E. J., Renkin, R. A., and Smith, D. W. (2001). Trophic cascades among wolves, elk and aspen on Yellowstone National Park’s northern range. Biol. Conserv 102, 227–234. doi: 10.1016/s0006-3207(01)00107-0
Ripple, W.J., Beschta, R.L., and Painter, L.E. (2015). Trophic cascades from wolves to alders in Yellowstone. Forest Ecol. Manag. 354, 254–260. doi: 10.1016/j.foreco.2015.06.007
Sand, H., Wabakken, P., Zimmermann, B., Johansson, Ö., Pedersen, H. C., and Liberg, O. (2008). Summer kill rates and predation pattern in a wolf–moose system: can we rely on winter estimates? Oecologia 156, 53–64. doi: 10.1007/s00442-008-0969-2
Sand, H., Wikenros, C., Ahlqvist, P., Strømseth, T., and Wabakken, P. (2012). Comparing body condition of moose (Alces alces) selected by wolves (Canis lupus) and human hunters: consequences for the extent of compensatory mortality. Can. J. Zool. 90, 403–412. doi: 10.1139/z2012-007
Sand, H., Wikenros, C., Wabakken, P., and Liberg, O. (2006). Cross-continental differences in patterns of predation: will naive moose in Scandinavia ever learn? Proc. Royal Soc. B. 273, 1421–1427. doi: 10.1098/rspb.2005.3447
Sand, H., Zimmermann, B., Wabakken, P., Andrèn, H., and Pedersen, H. C. (2005). Using GPS technology and GIS cluster analyses to estimate kill rates in wolf−ungulate ecosystems. Wildlife Soc. Bull. 33, 914–925. doi: 10.2193/0091-7648(2005)33[914:ugtagc]2.0.co;2
Schielzeth, H. (2010). Simple means to improve the interpretability of regression coefficients. Methods Ecol. Evol. 1, 103–113. doi: 10.1111/j.2041-210x.2010.00012.x
Schmitz, O. J., Beckerman, A. P., and O’Brien, K. (1997). Behaviorally mediated trophic cascades: effects of predation risk on food web interactions. Ecology 78. doi: 10.2307/2266134
Senft, R., Coughenour, M., Bailey, D., Rittenhouse, L., Sala, O., and Swift, D. (1987). Large herbivore foraging and ecological hierarchies. BioScience 37, 789–799. doi: 10.2307/1310545
Sergio, F., Caro, T., Brown, D., Clucas, B., Hunter, J., Ketchum, J., Mchugh, K., and Hiraldo, F. (2008). Top predators as conservation tools: ecological rationale, assumptions, and efficacy. Annu. Rev. Ecol. Evol. Syst. 39, 1–19. doi: 10.1146/annurev.ecolsys.39.110707.173545
Smart, J. C., Ward, A. I., and White, P. C. (2004). Monitoring woodland deer populations in the UK: an imprecise science. Mammal Rev. 34, 99–114. doi: 10.1046/j.0305-1838.2003.00026.x
Smith, D. W., Peterson, R. O., and Houston, D. B. (2003). Yellowstone after wolves. Bioscience 53, 330–340. doi: 10.1641/0006-3568(2003)053[0330:YAW]2.0.CO;2
Steffen, W., Crutzen, P. J., and Mcneill, J. R. (2007). The Anthropocene: are humans now overwhelming the great forces of nature. AMBIO 36, 614–621. doi: 10.1579/0044-7447(2007)36[614:taahno]2.0.co;2
Stoks, R., Block, M. D., Van De Meutter, F., and Johansson, F. (2005). Predation cost of rapid growth: behavioural coupling and physiological decoupling. J. Anim. Ecol. 74, 708–715. doi: 10.1111/j.1365-2656.2005.00969.x
Tokola, T. (2006). Trophic Cascades: Predators, Prey and the Changing Dynamics of Nature.. J. Terborgh and J. A. Estes, editors. New York: Springer, 295–308.
Trafikverket (2017). Funktionell vägklass. URL: https://www.trafikverket.se/TrvSeFiler/Dataproduktspecifikationer/V%C3%A4gdataprodukter/DPS_E-G/1010funktionell_vagklass.pdf.
Trussell, G. C., Ewanchuk, P. J., and Matassa, C. M. (2006). The fear of being eaten reduces energy transfer in a simple food chain. Ecology 87, 2979–2984. doi: 10.1890/0012-9658(2006)87[2979:tfober]2.0.co;2
Van Langevelde, F., Van Dooremalen, C., and Jaarsma, C. F. (2009). Traffic mortality and the role of minor roads. J. Environ. Manag. 90, 660–667. doi: 10.1016/j.jenvman.2007.09.003
Vucetich, J. A., Smith, D. W., and Stahler, D. R. (2005). Influence of harvest, climate and wolf predation on Yellowstone elk, 1961–2004. Oikos 111, 259–270. doi: 10.1111/j.0030-1299.2005.14180.x
Wabakken, P., Aronson, A., Sand, H., Strømseth, T., and Kojola, I. (2004). The wolf in Scandinavia: status report of the 2003–2004 winter. Elverum: Högskolen i Hedmark.
Wabakken, P., Sand, H., Liberg, O., and Bjärvall, A. (2001). The recovery, distribution, and population dynamics of wolves on the Scandinavian peninsula, 1978-1998. Can. J. Zool. 79, 710–725. doi: 10.1139/z01-029
Wabakken, P., Svensson, L., Maartmann, E., Åkesson, M., and Flagstad, Ø. (2016). Bestandsovervåking av ulv vinteren 2015-2016. Elverum: Högskolen i Hedmark.
Whittington, J., St Clair, C. C., and Mercer, G. (2005). Spatial responses of wolves to roads and trails in mountain valleys. Ecol. Appl. 15, 543–553. doi: 10.1890/03-5317
Wikenros, C., Aronsson, M., Liberg, O., Jarnemo, A., Hansson, J., Wallgren, M., Sand, H., and Bergström, R. (2017). Fear or food–abundance of red fox in relation to occurrence of lynx and wolf. Scient. Rep. 7, 1–10.
Wikenros, C., Balogh, G., Sand, H., Nicholson, K.L., and Mansson, J. (2016). Mobility of moose-comparing the effects of wolf predation risk, reproductive status, and seasonality. Ecol. Evol. 6, 8870–8880. doi: 10.1002/ece3.2598
Wikenros, C., Sand, H., Bergstrom, R., Liberg, O., and Chapron, G. (2015). Response of moose hunters to predation following wolf return in Sweden. PLoS One 10:e0119957. doi: 10.1371/journal.pone.0119957
Wikenros, C., Sand, H., Wabakken, P., Liberg, O., and Pedersen, H. C. (2009). Wolf predation on moose and roe deer: chase distances and outcome of encounters. Acta Theriol. 54, 207–218. doi: 10.4098/j.at.0001-7051.082.2008
Winnie, J. A. Jr (2012). Predation risk, elk, and aspen: tests of a behaviorally mediated trophic cascade in the Greater Yellowstone Ecosystem. Ecology 93, 2600–2614. doi: 10.1890/11-1990.1
Woodruff, S. P., Jimenez, M. D., and Johnson, T. R. (2018). Characteristics of winter wolf kill sites in the southern Yellowstone ecosystem. J. Fish Wildlife Manag. 9, 155–167. doi: 10.3996/032016-jfwm-024
Keywords: Canis lupus, Alces alces, Pinus sylvestris, pellet counts, browsing, predation, anthropogenic landscape, trophic cascade
Citation: Ausilio G, Sand H, Månsson J, Mathisen KM and Wikenros C (2021) Ecological Effects of Wolves in Anthropogenic Landscapes: The Potential for Trophic Cascades Is Context-Dependent. Front. Ecol. Evol. 8:577963. doi: 10.3389/fevo.2020.577963
Received: 30 June 2020; Accepted: 07 December 2020;
Published: 08 January 2021.
Edited by:
Miguel Lurgi, Swansea University, United KingdomReviewed by:
Euan G. Ritchie, Deakin University, AustraliaJos M. Milner, University of Aberdeen, United Kingdom
Copyright © 2021 Ausilio, Sand, Månsson, Mathisen and Wikenros. This is an open-access article distributed under the terms of the Creative Commons Attribution License (CC BY). The use, distribution or reproduction in other forums is permitted, provided the original author(s) and the copyright owner(s) are credited and that the original publication in this journal is cited, in accordance with accepted academic practice. No use, distribution or reproduction is permitted which does not comply with these terms.
*Correspondence: Giorgia Ausilio, giorgia.ausilio@inn.no