Contact Geometry Modification of Friction-Welded Semi-Finished Products to Improve the Bonding of Hybrid Components


 , ,
, , 
Abstract
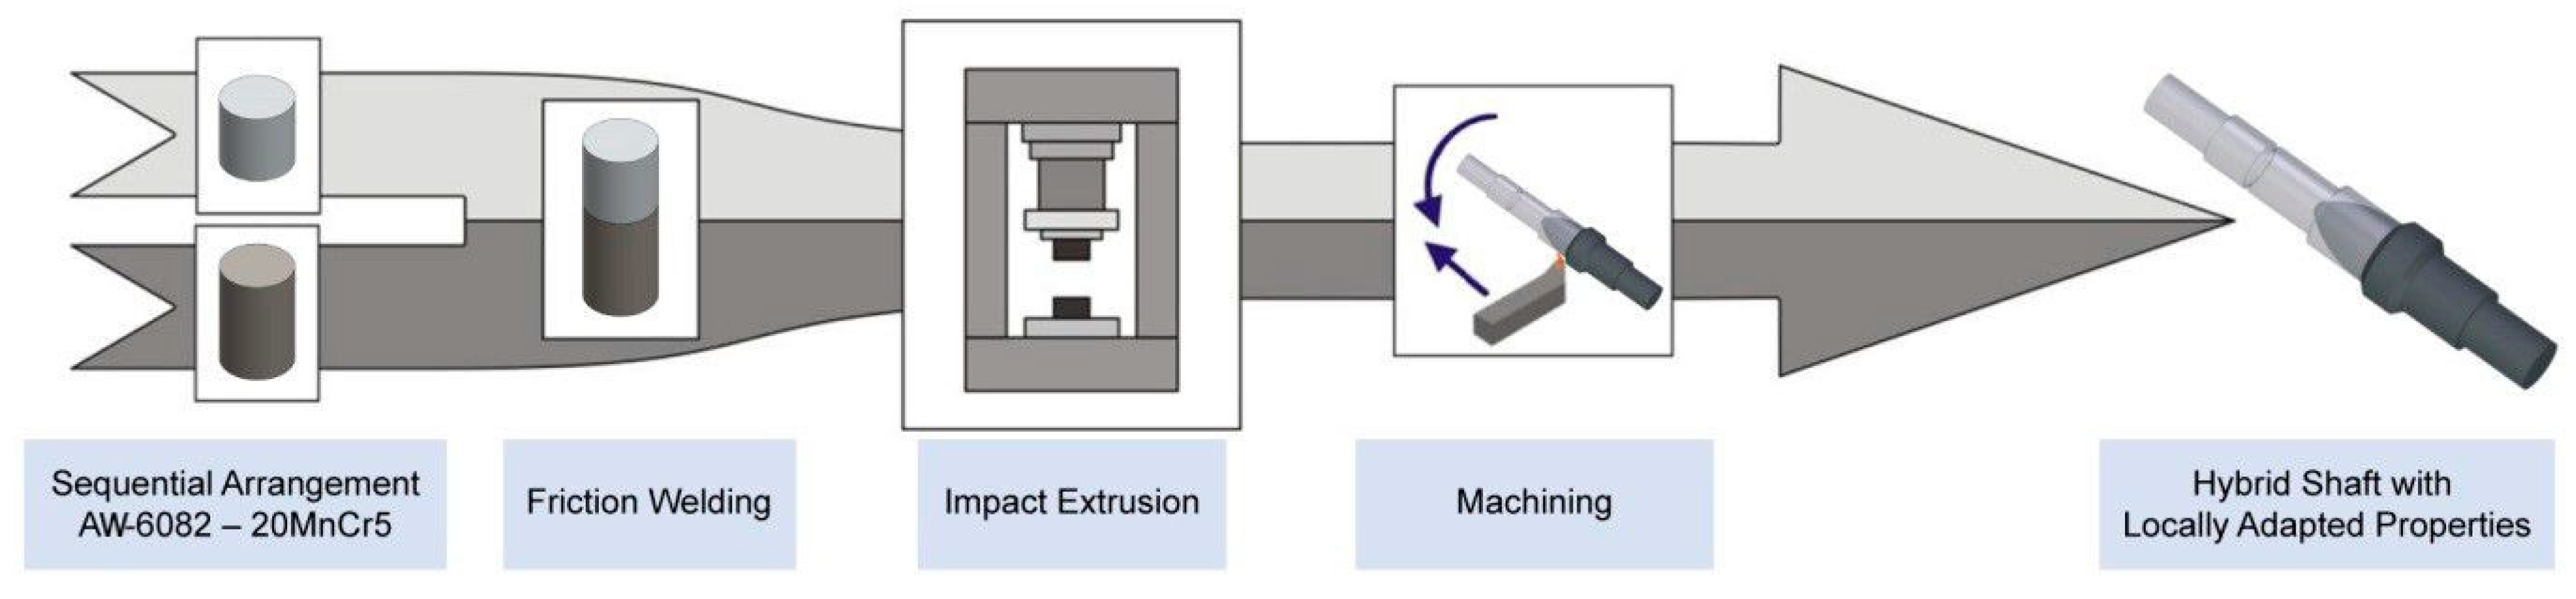
:1. Introduction
2. Materials and Methods
2.1. Materials
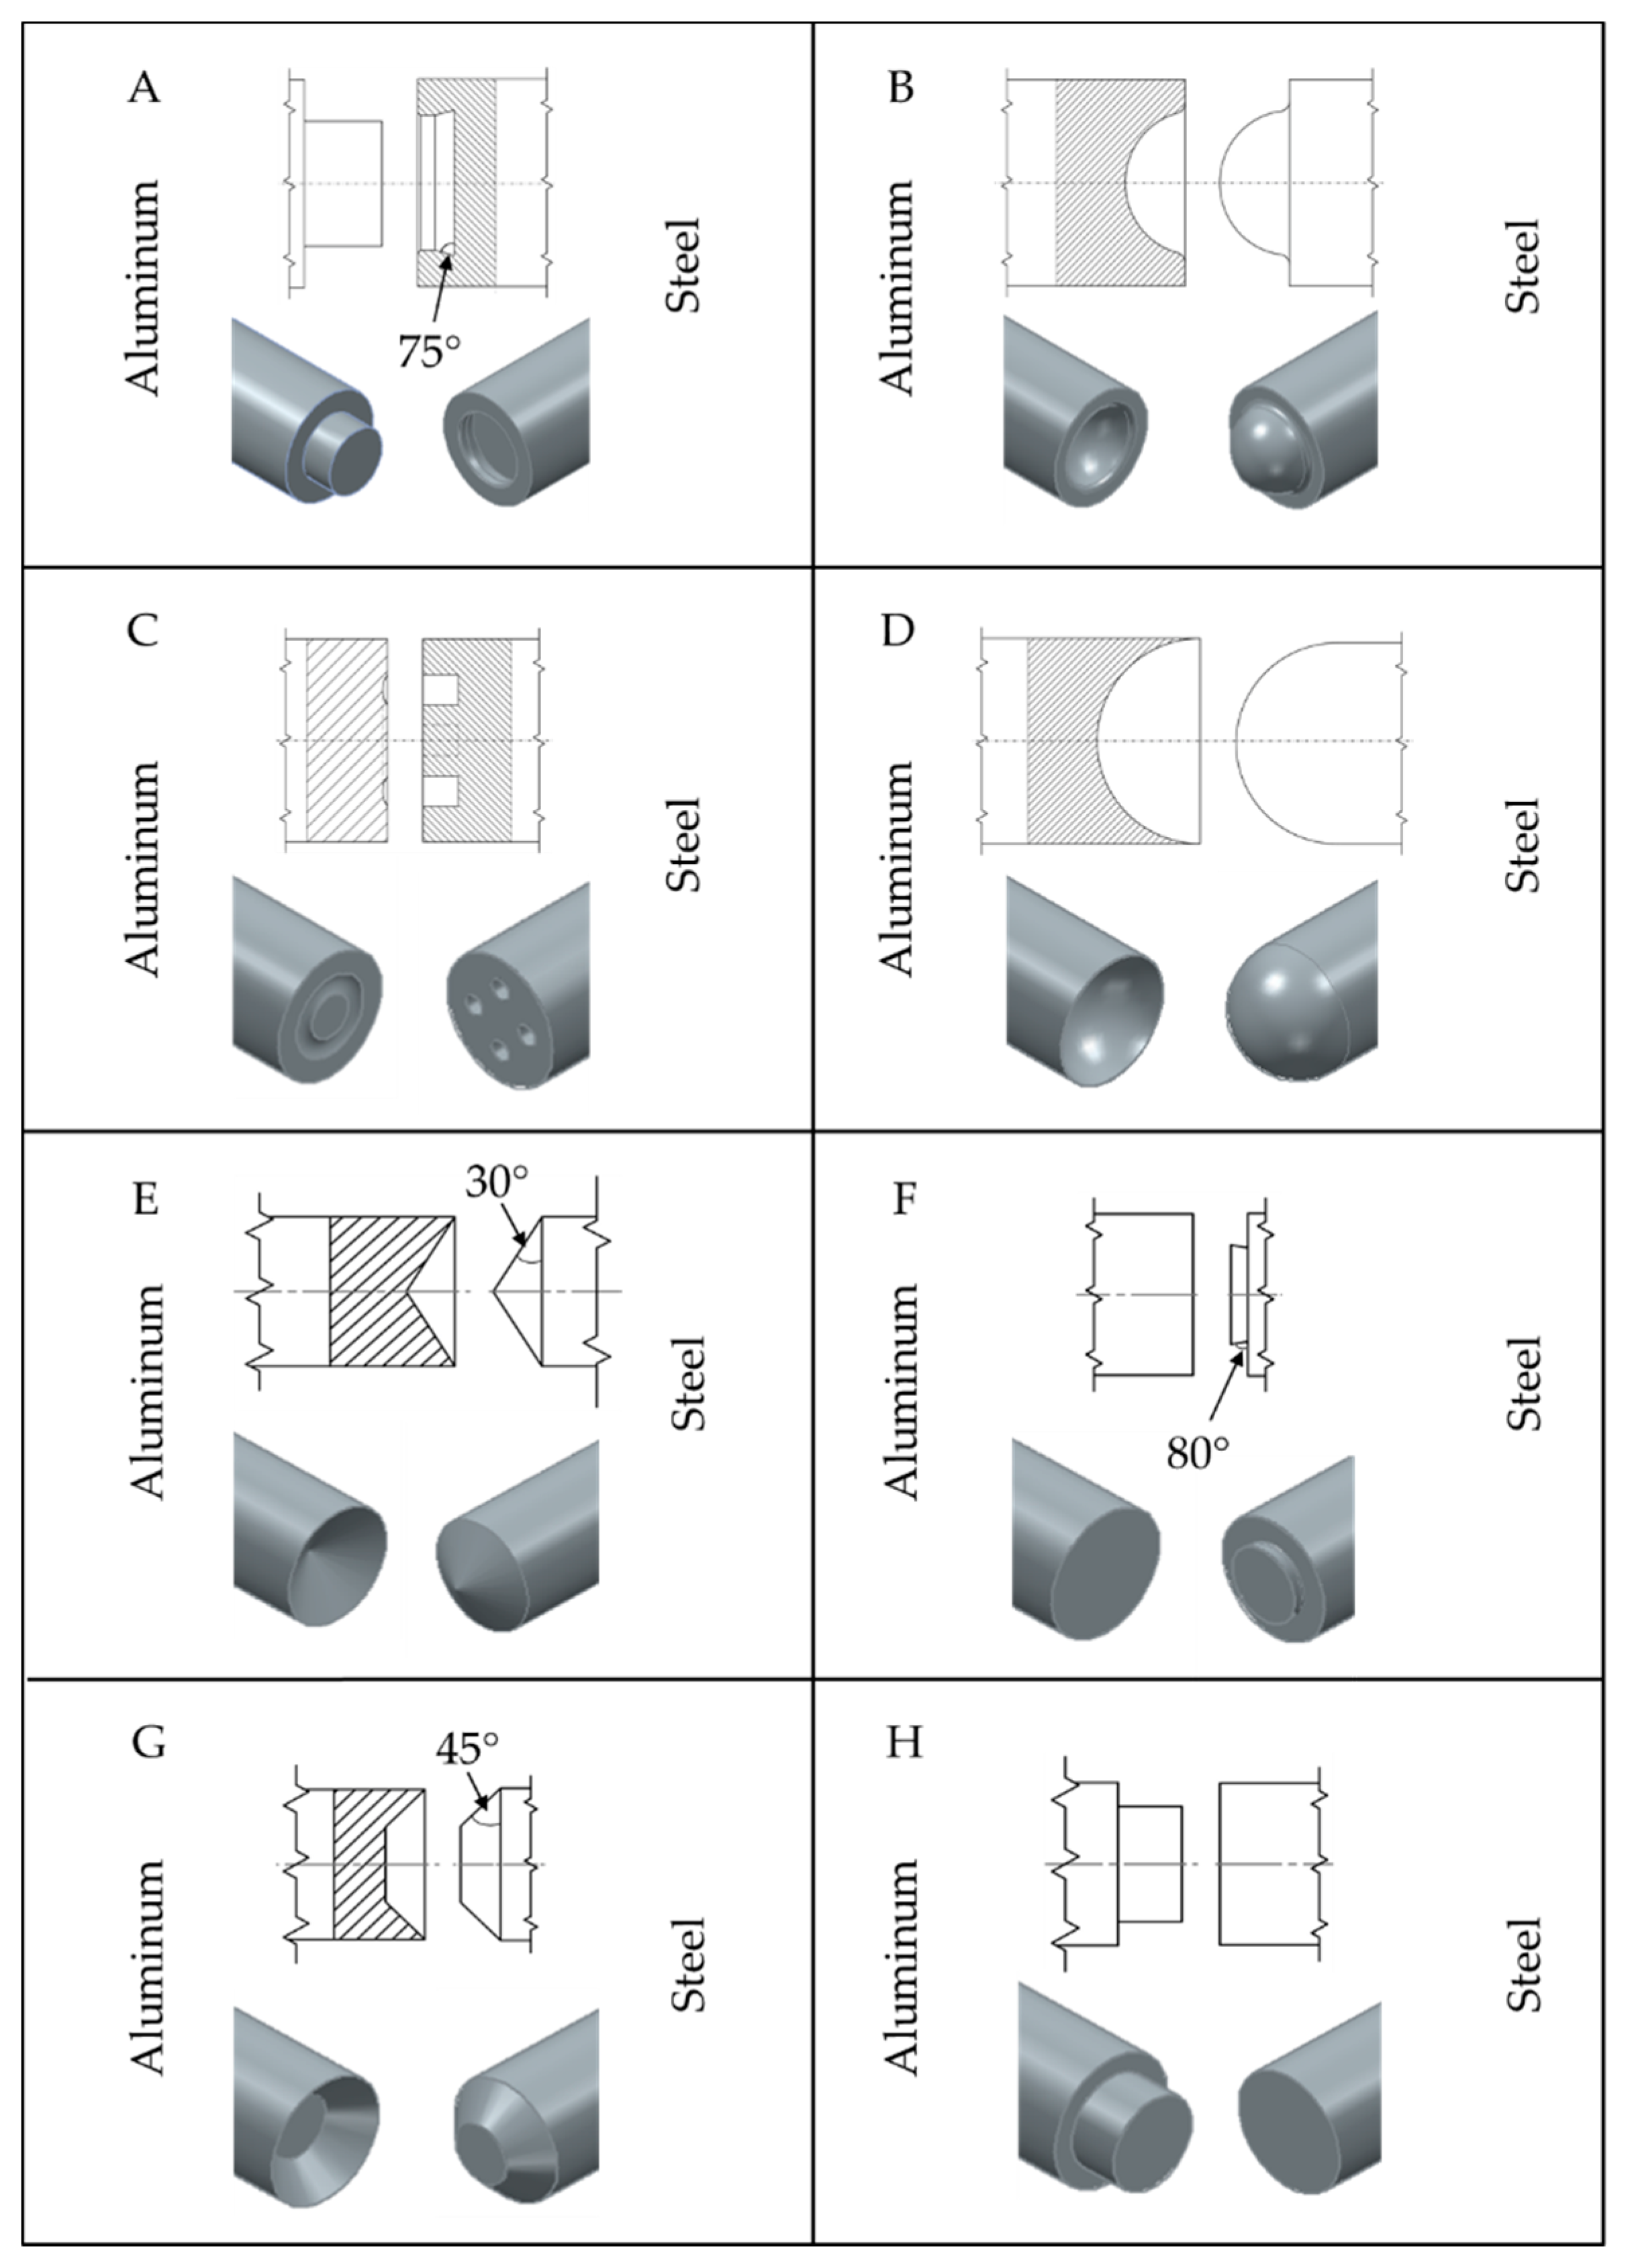
2.2. Friction Surface Geometries
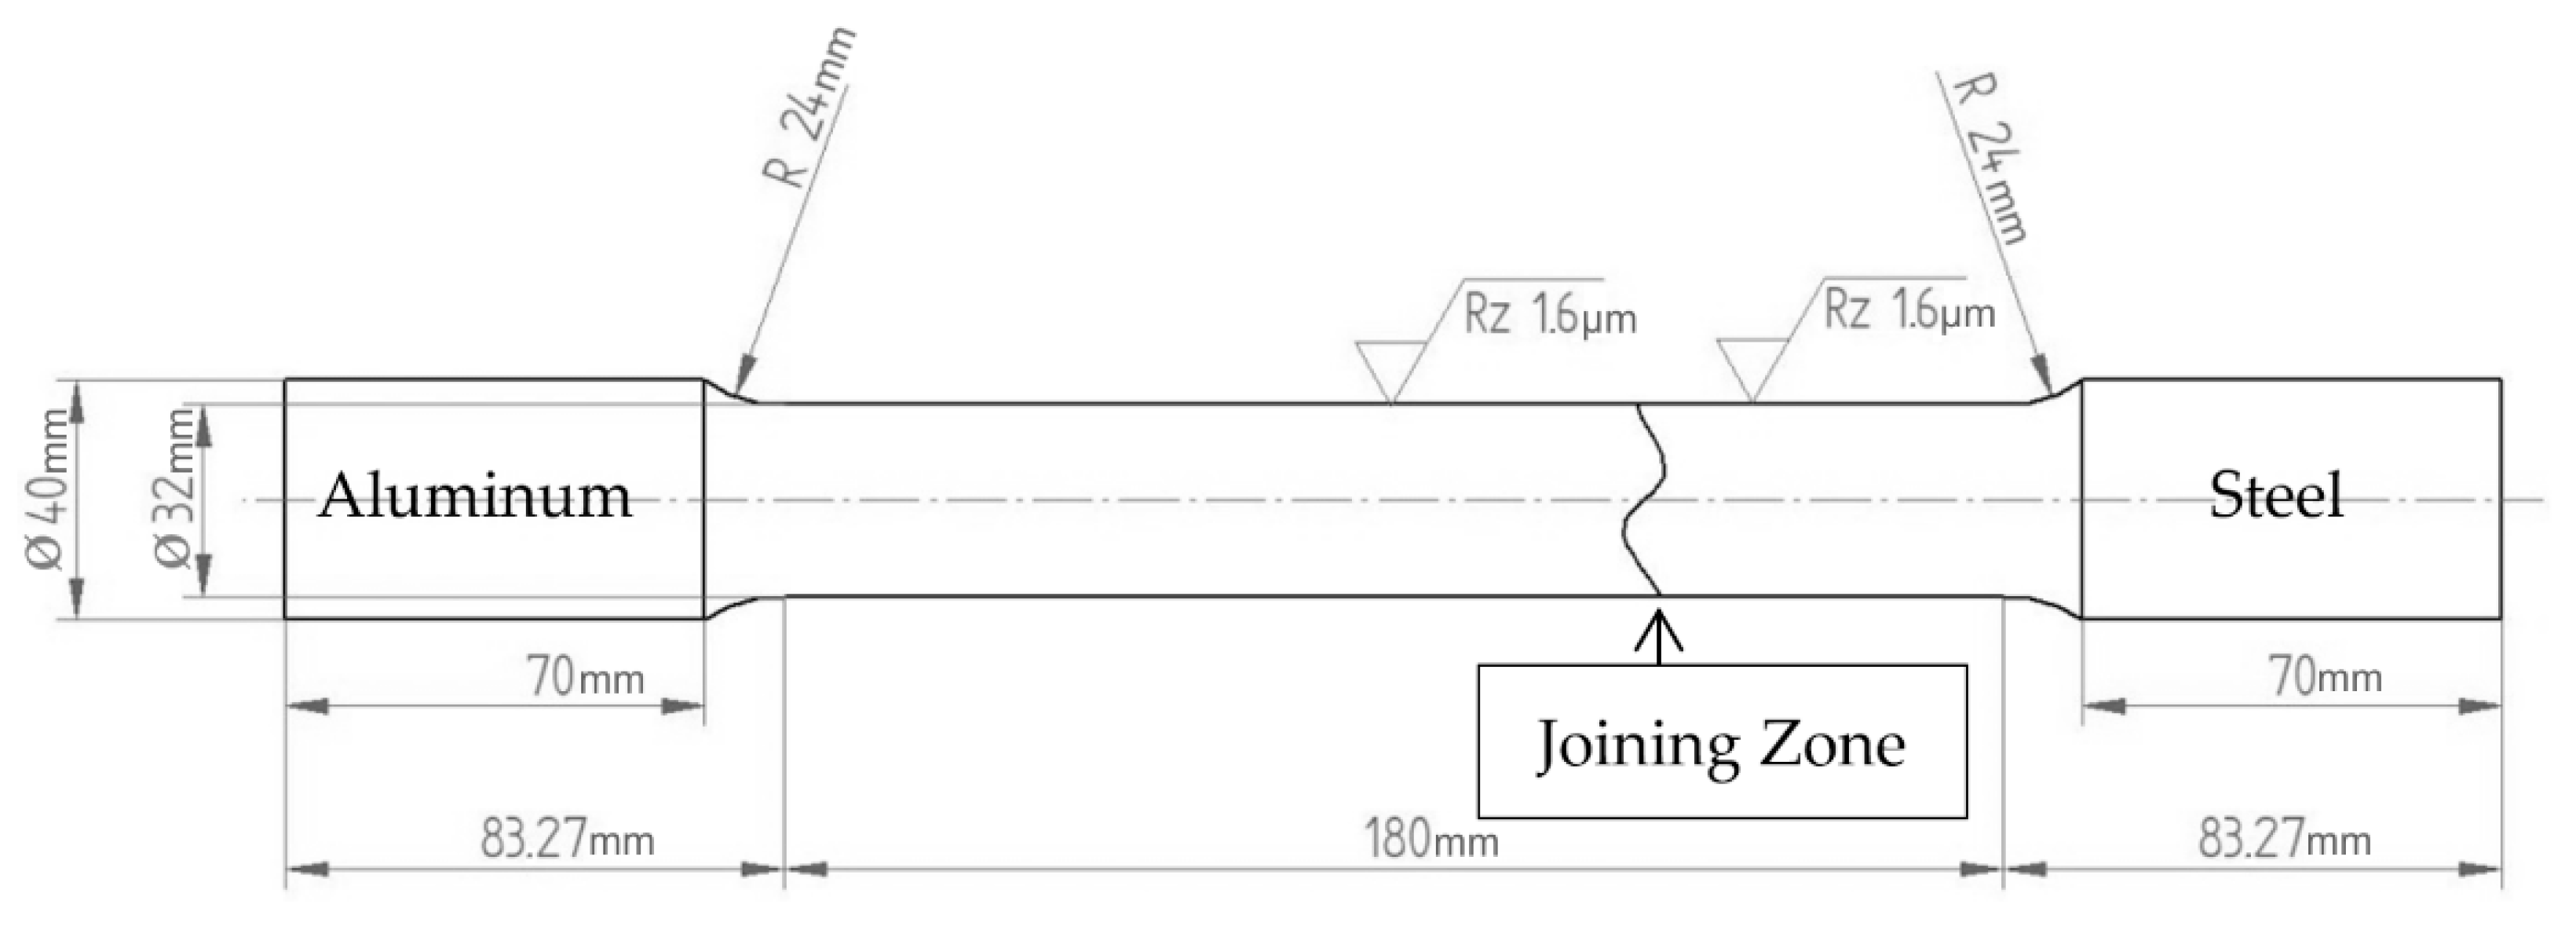
2.3. Friction Welding
2.4. Metallographic Analysis
2.5. Mechanical Testing
3. Results
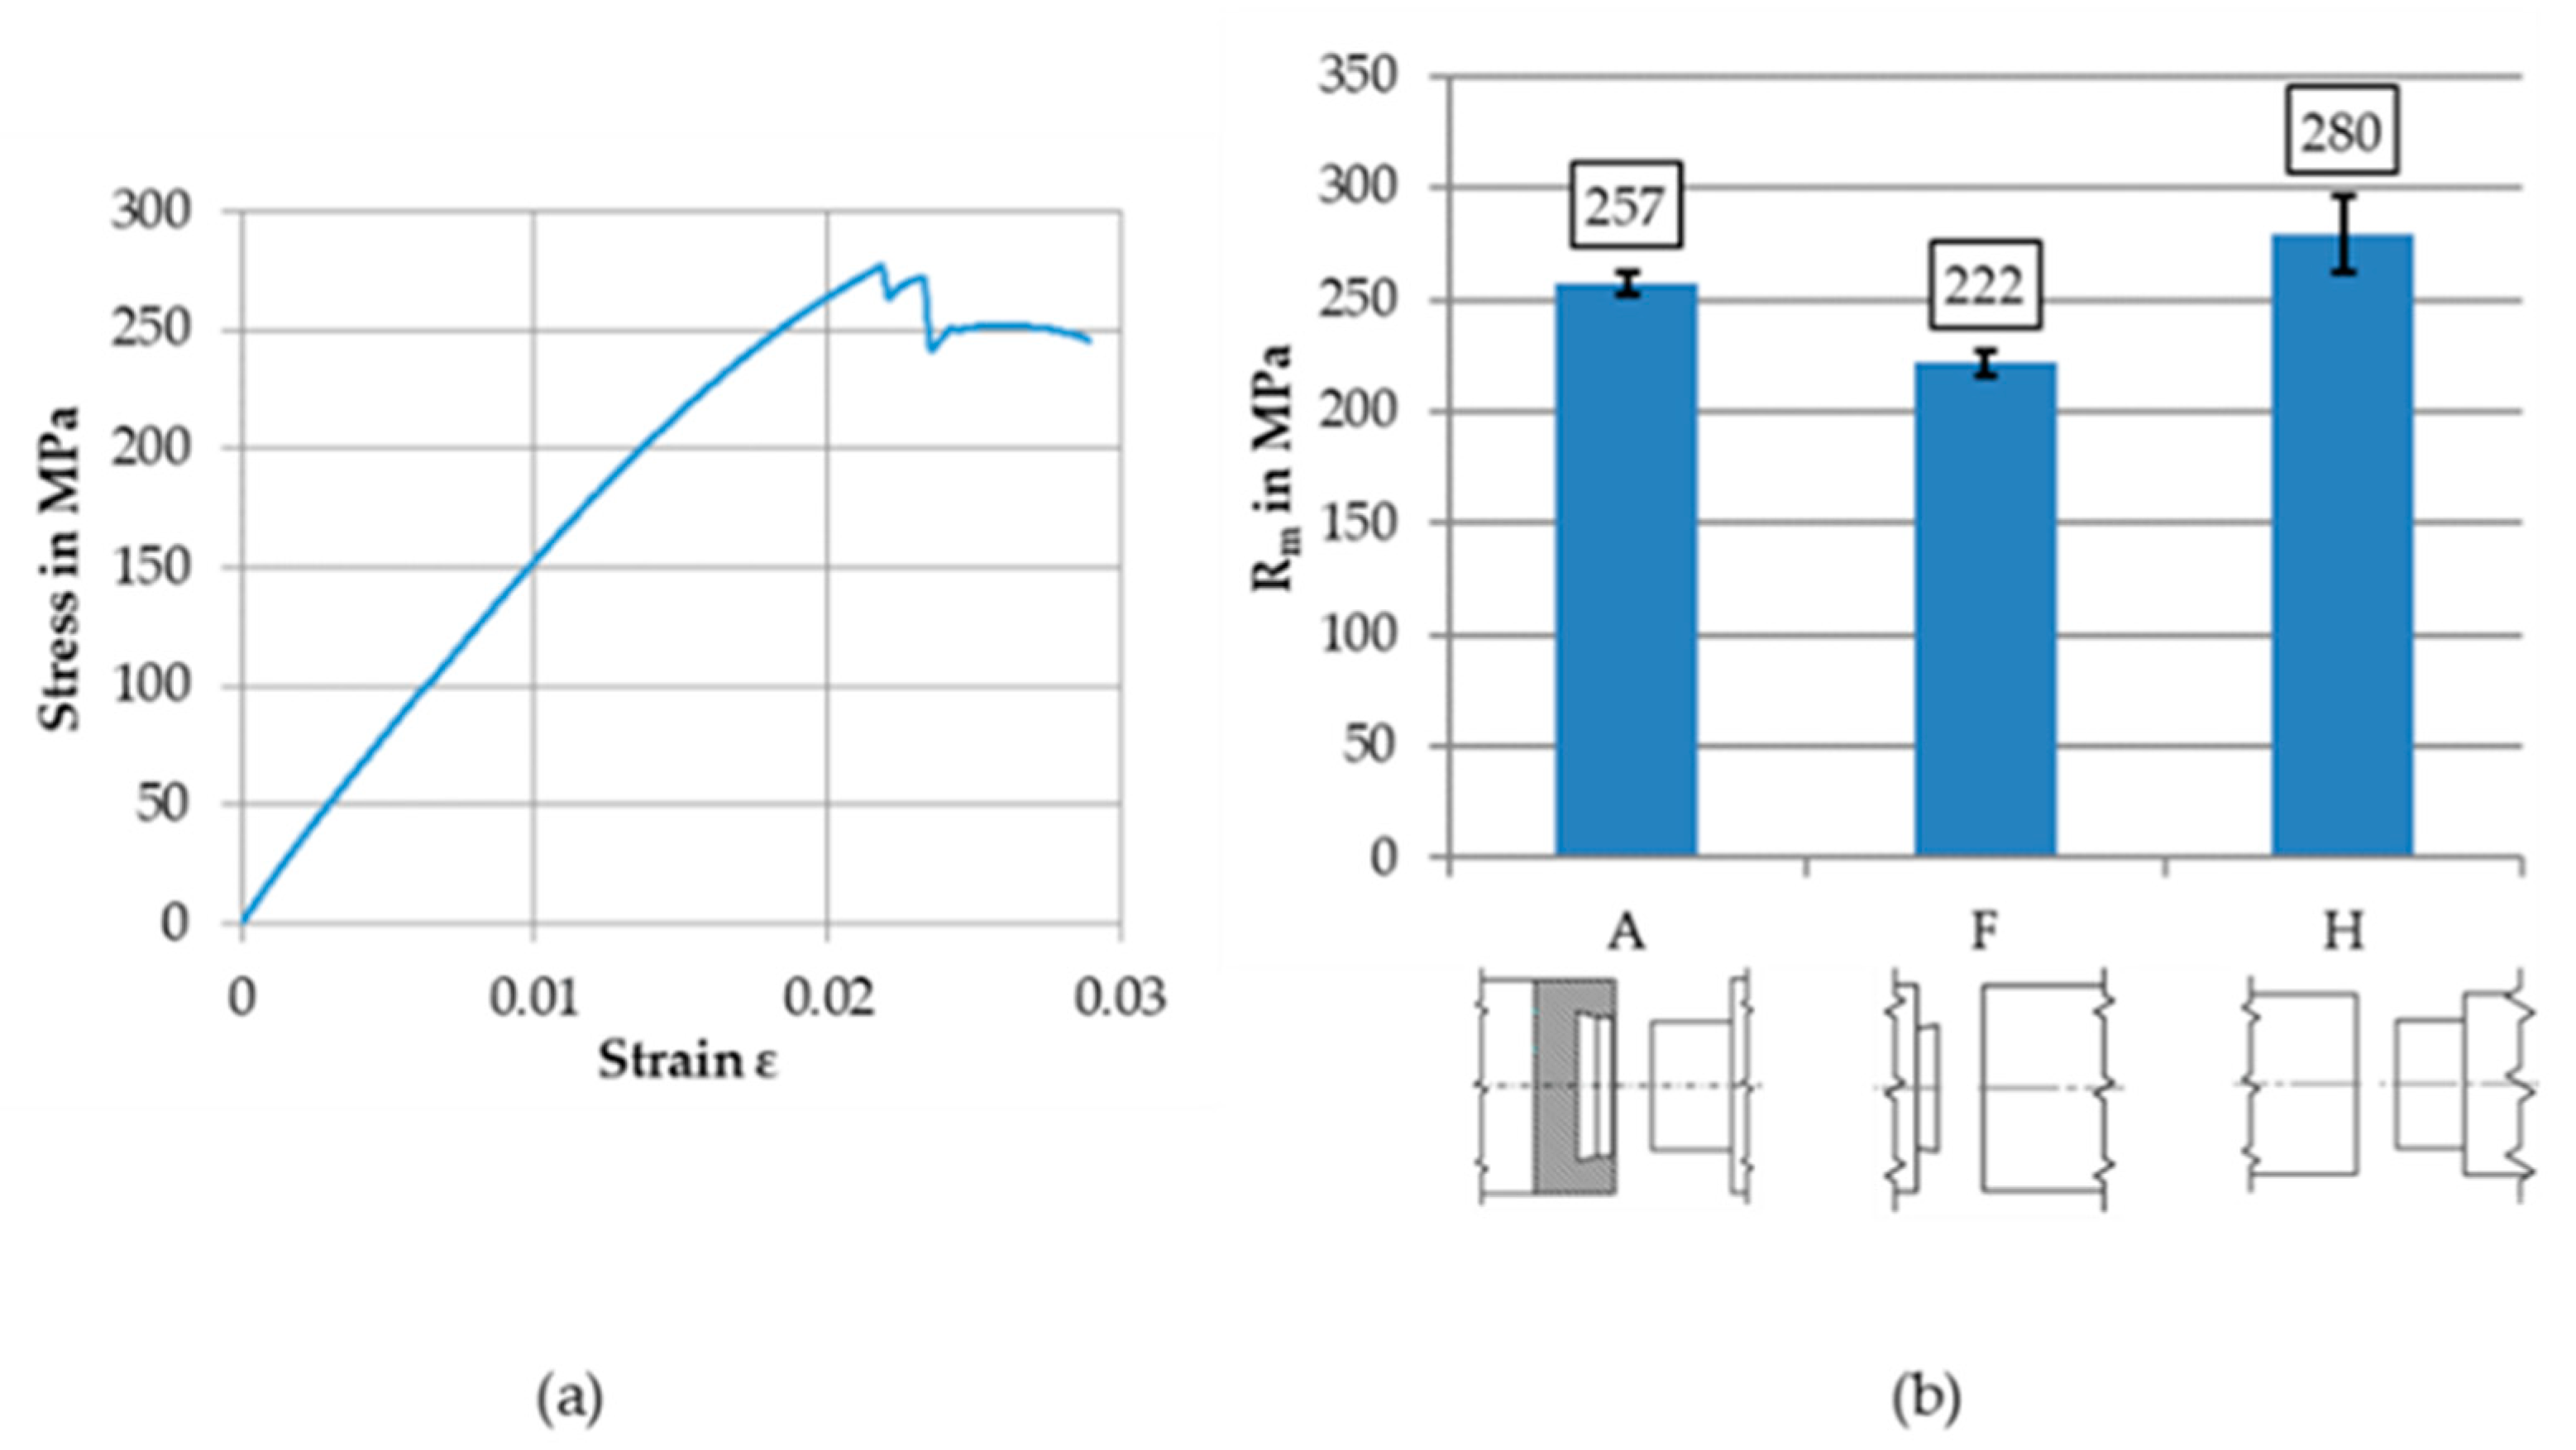
3.1. Tensile Test
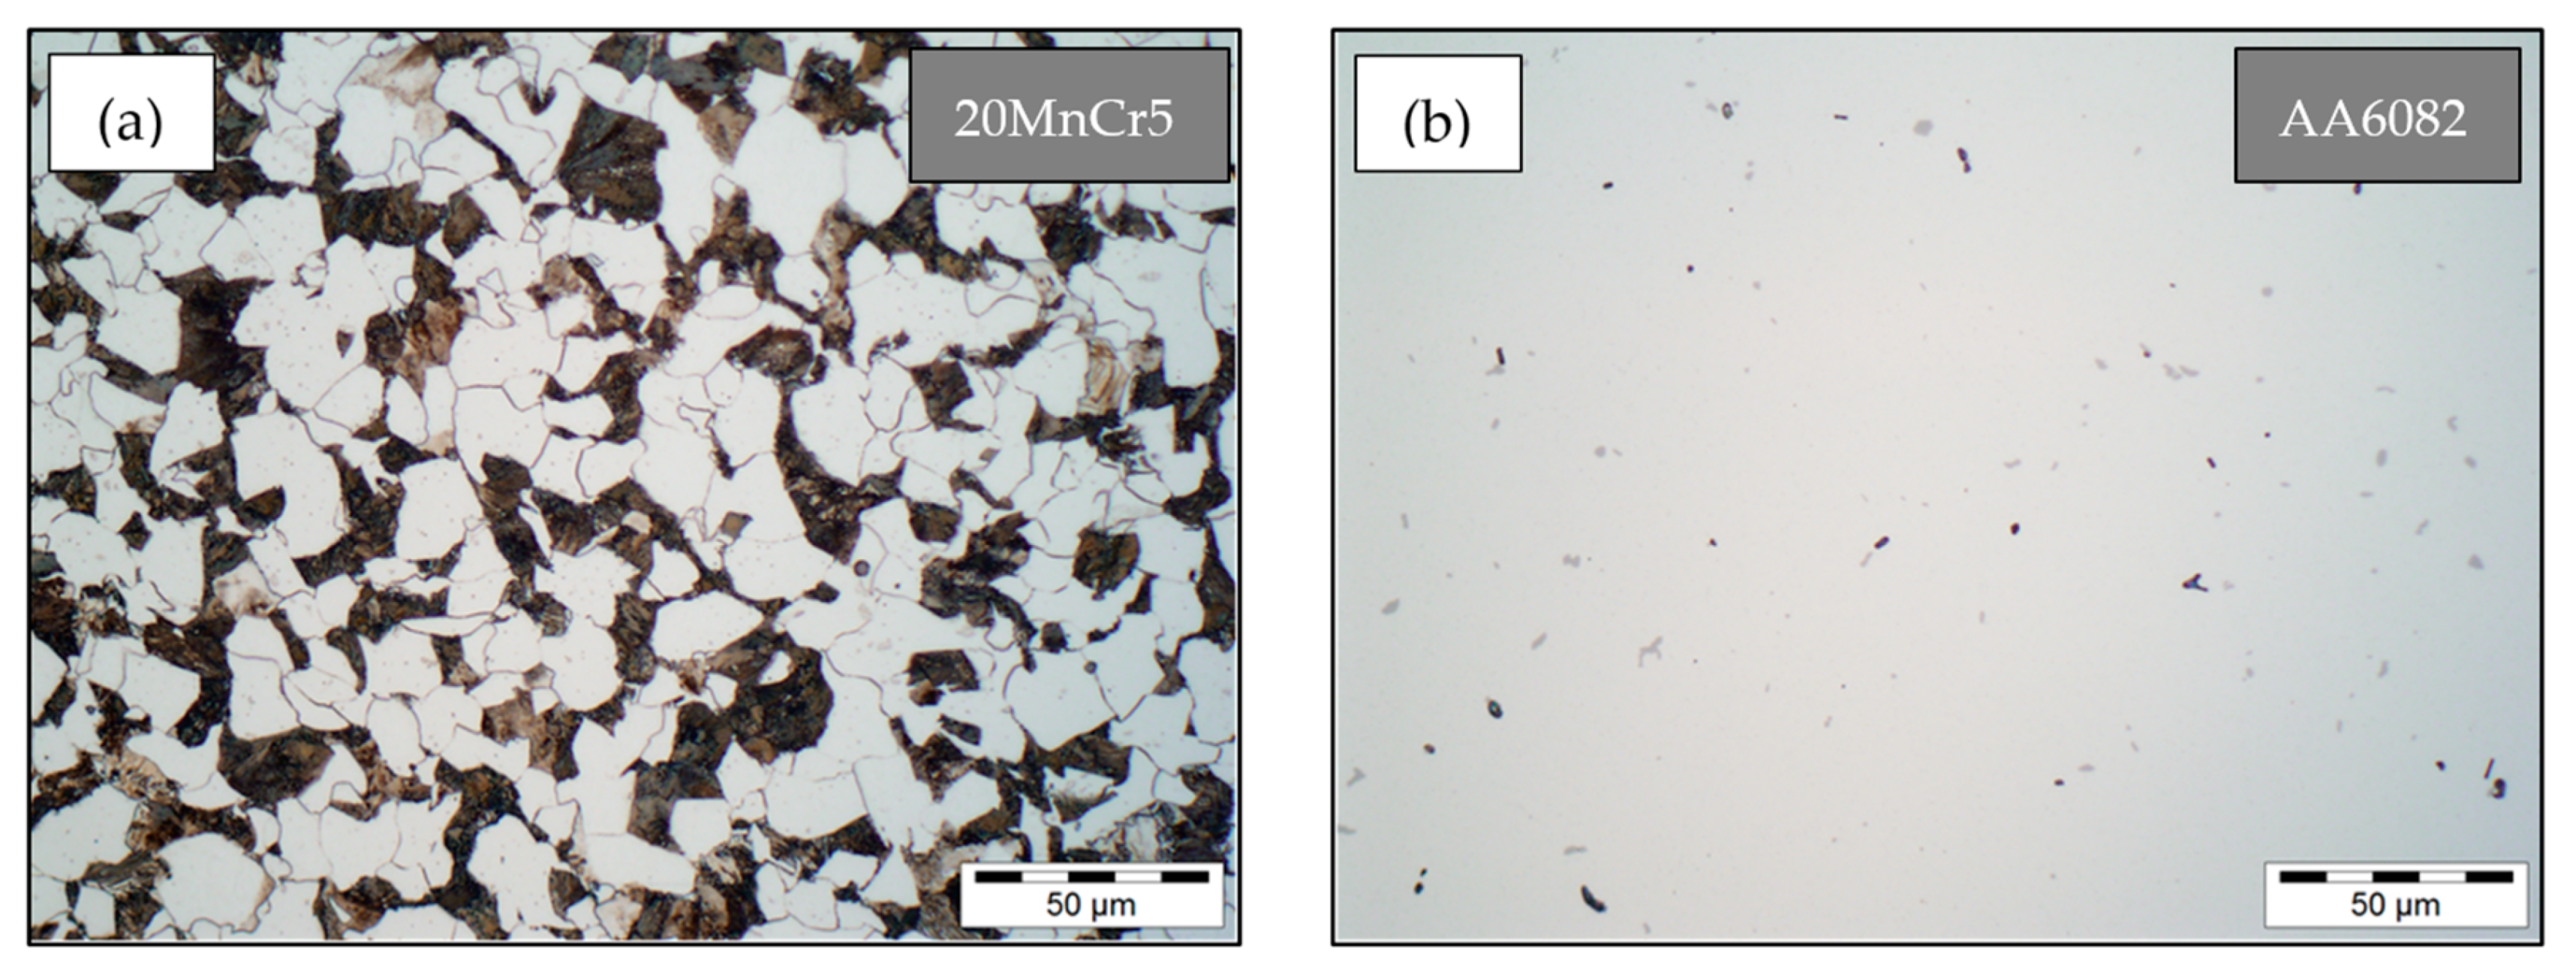
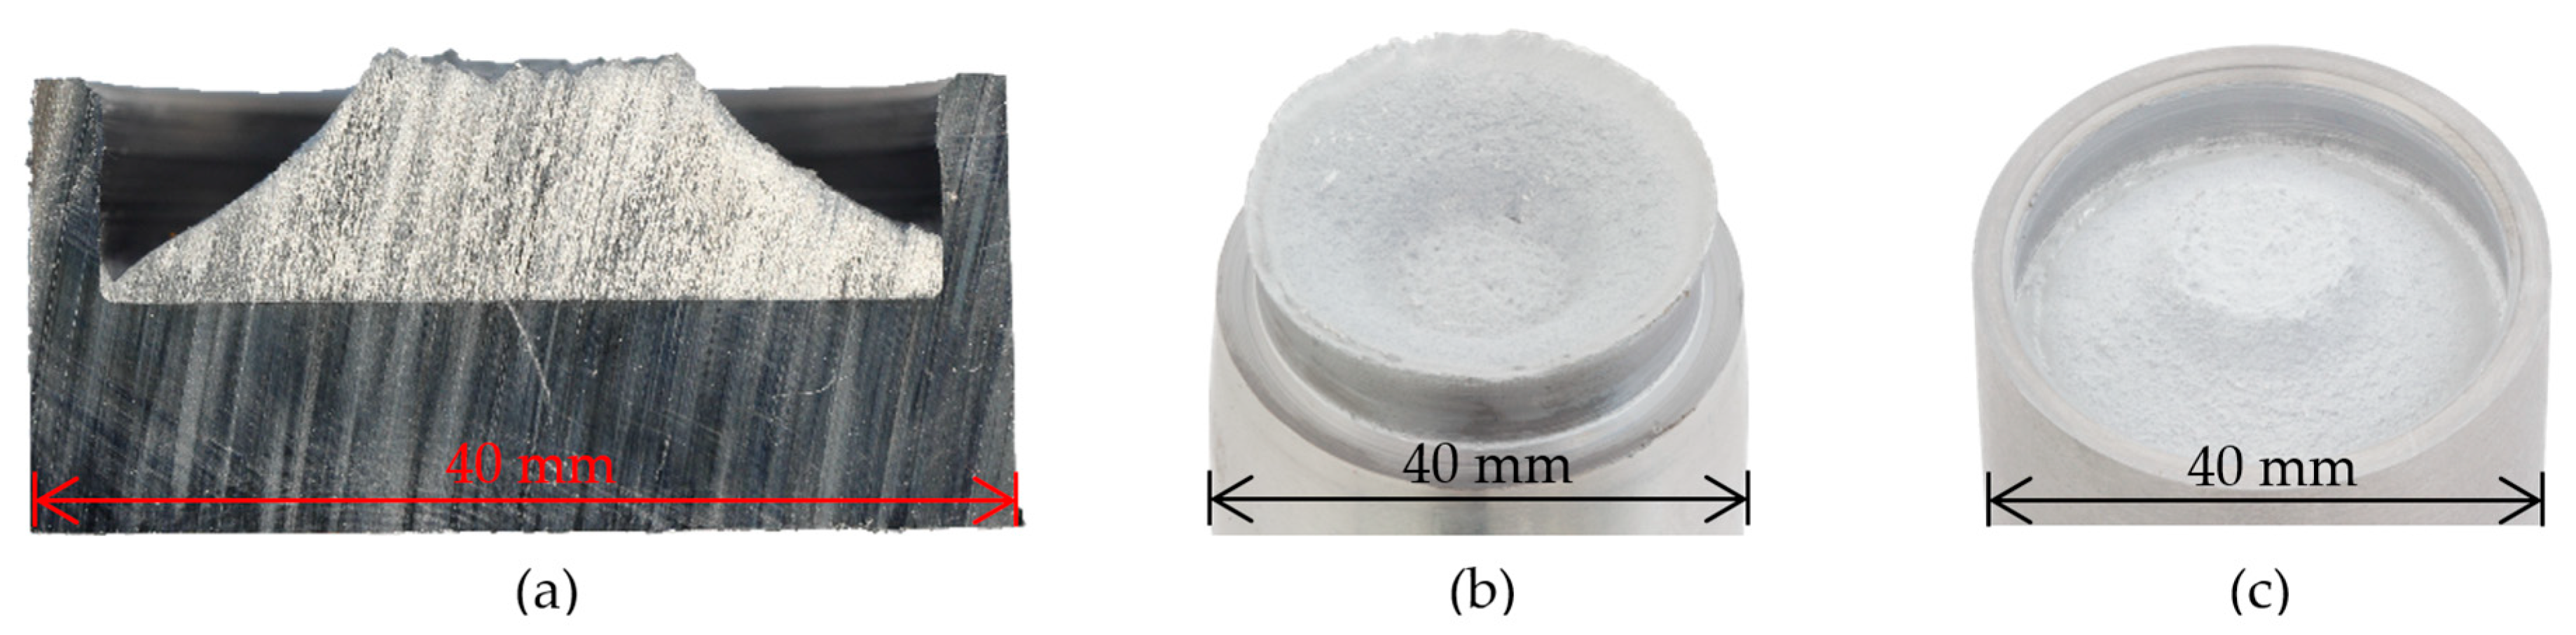
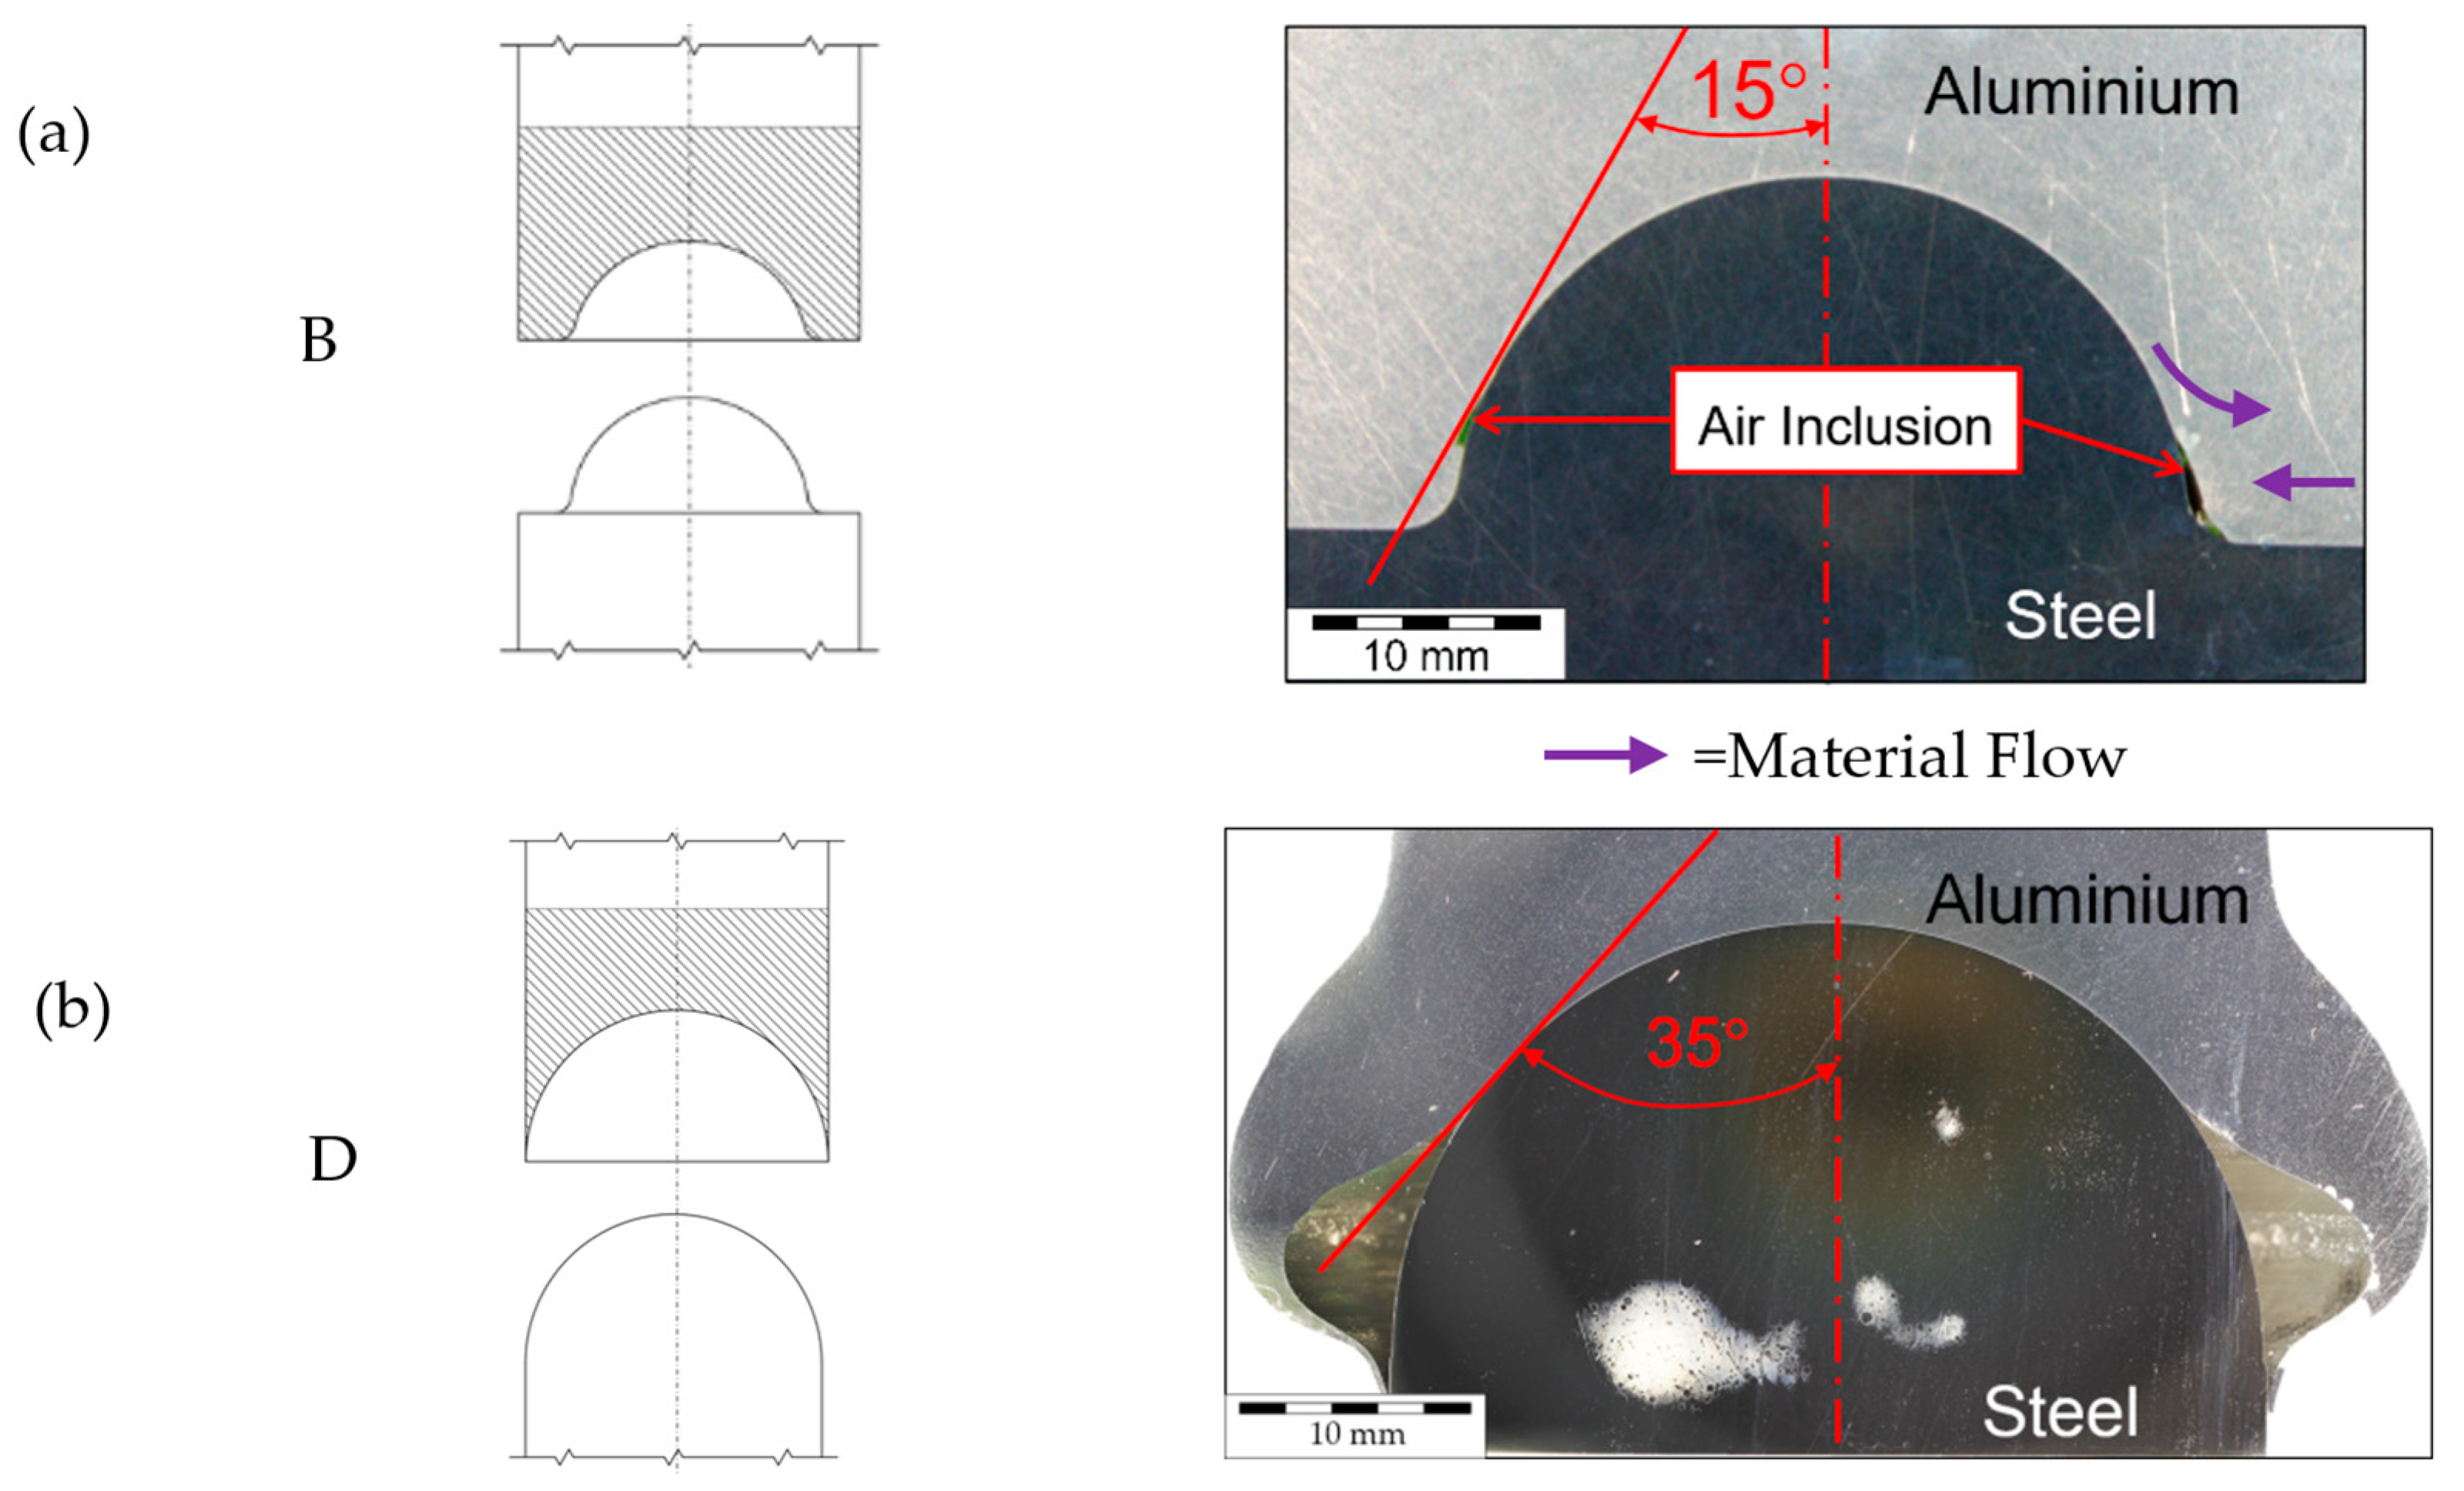
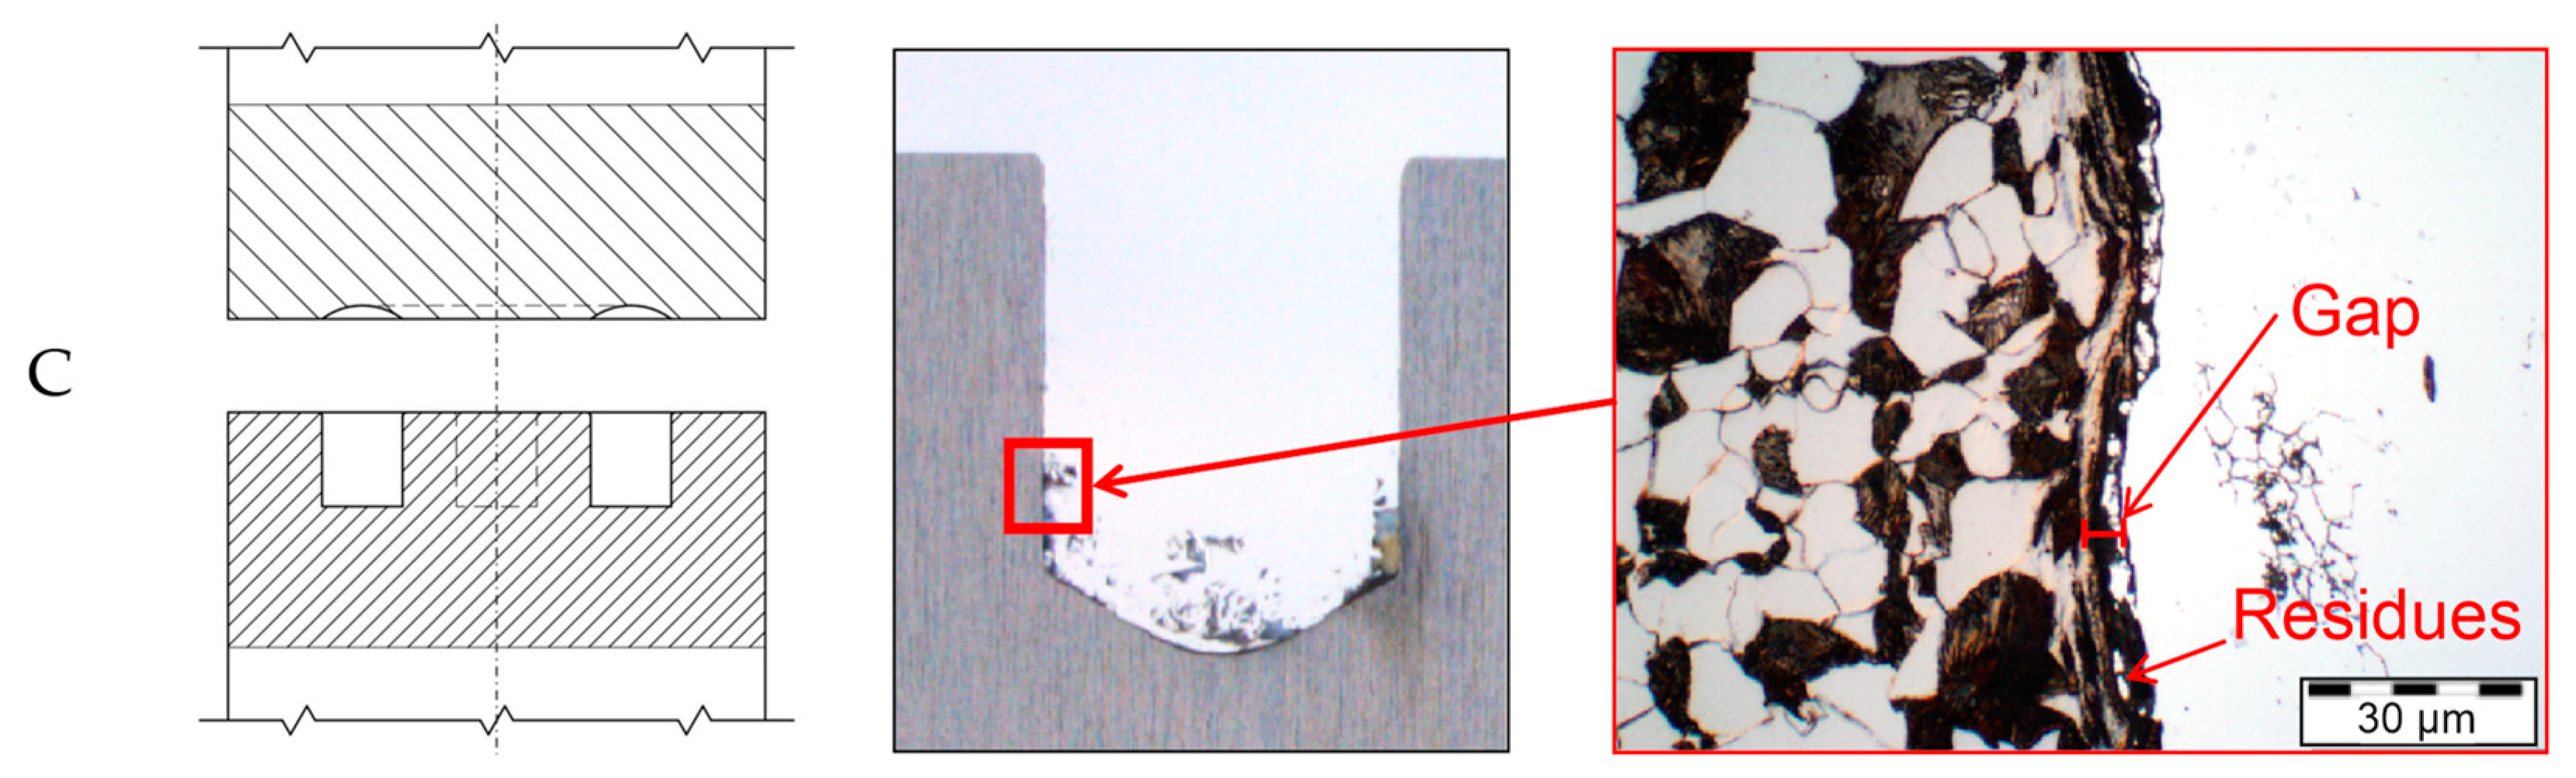
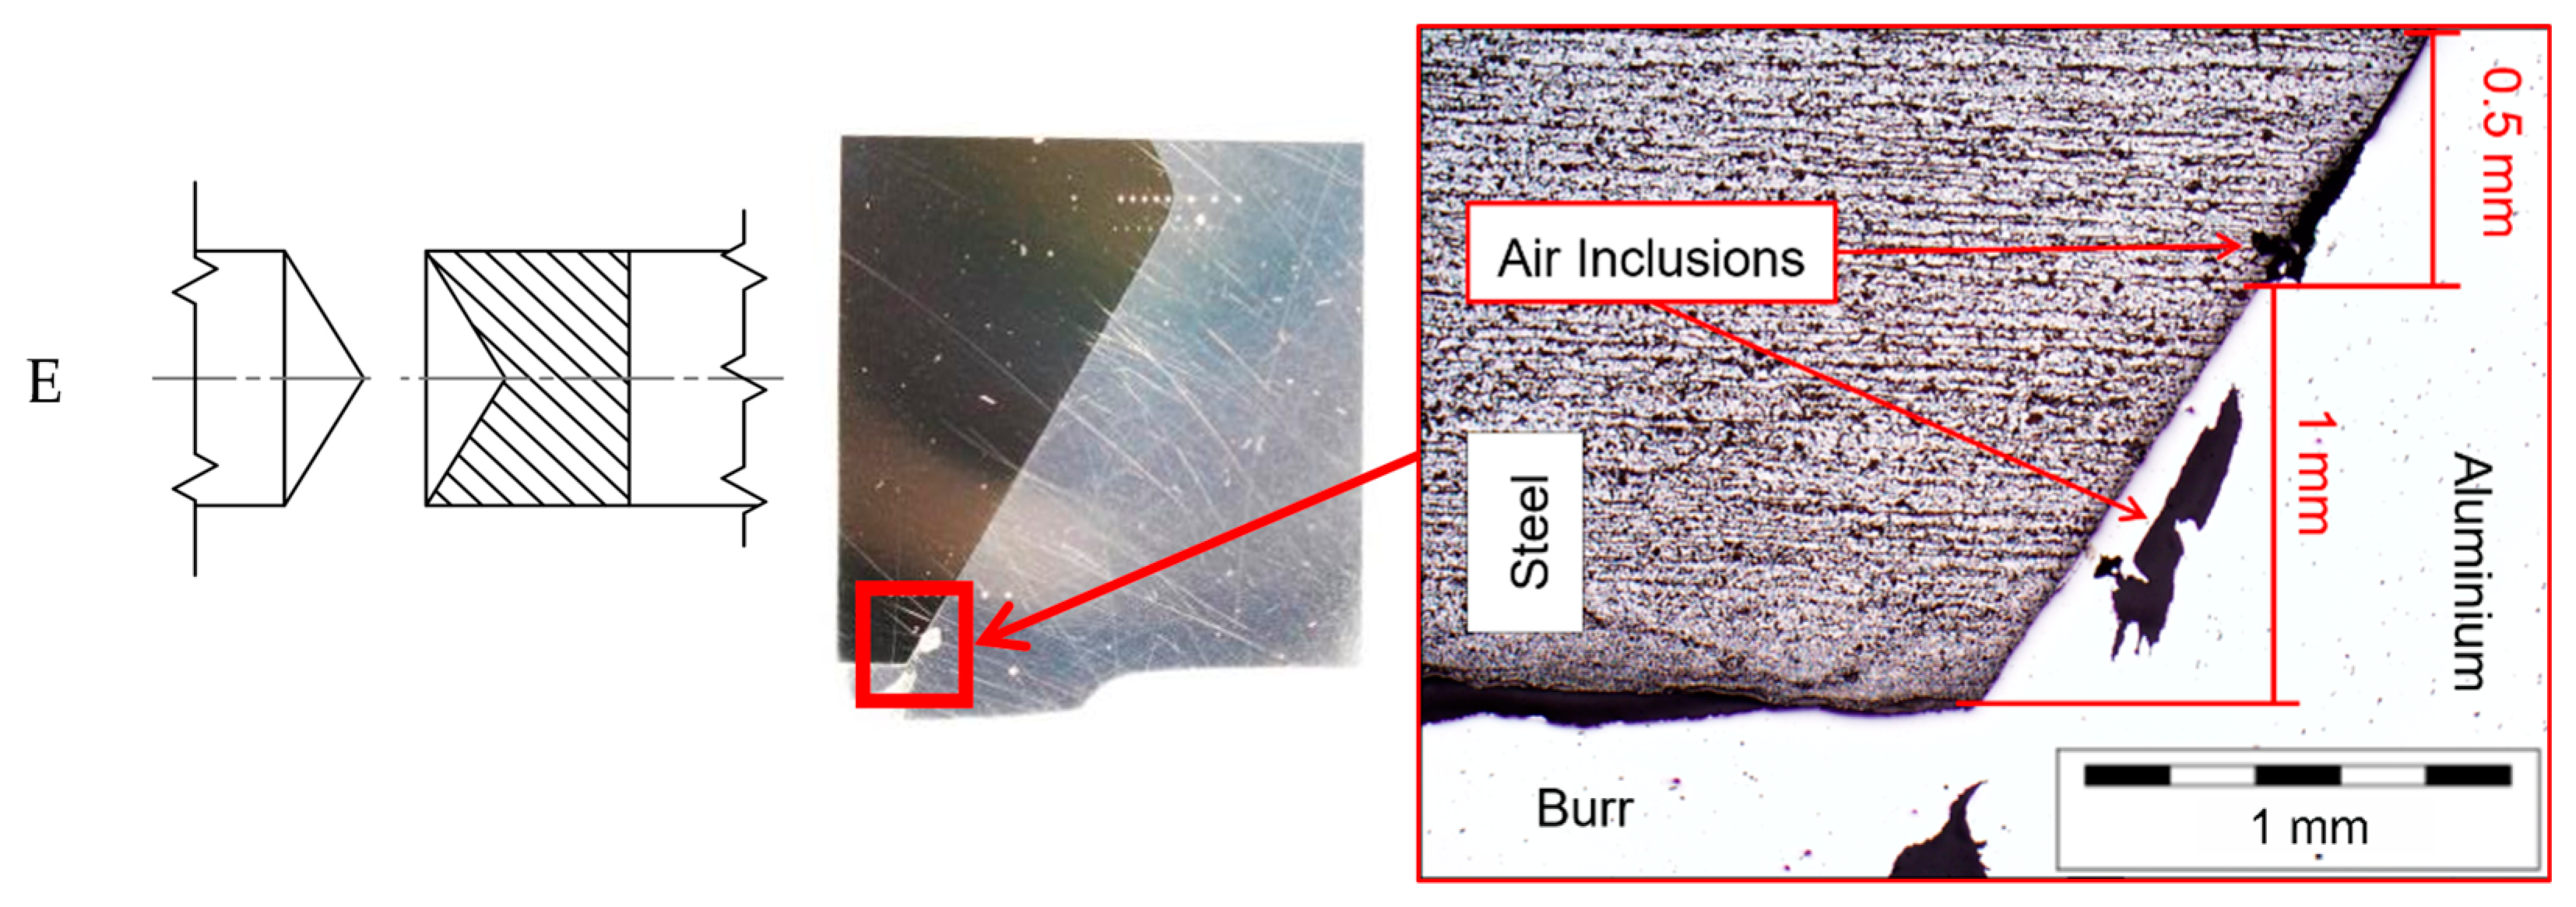
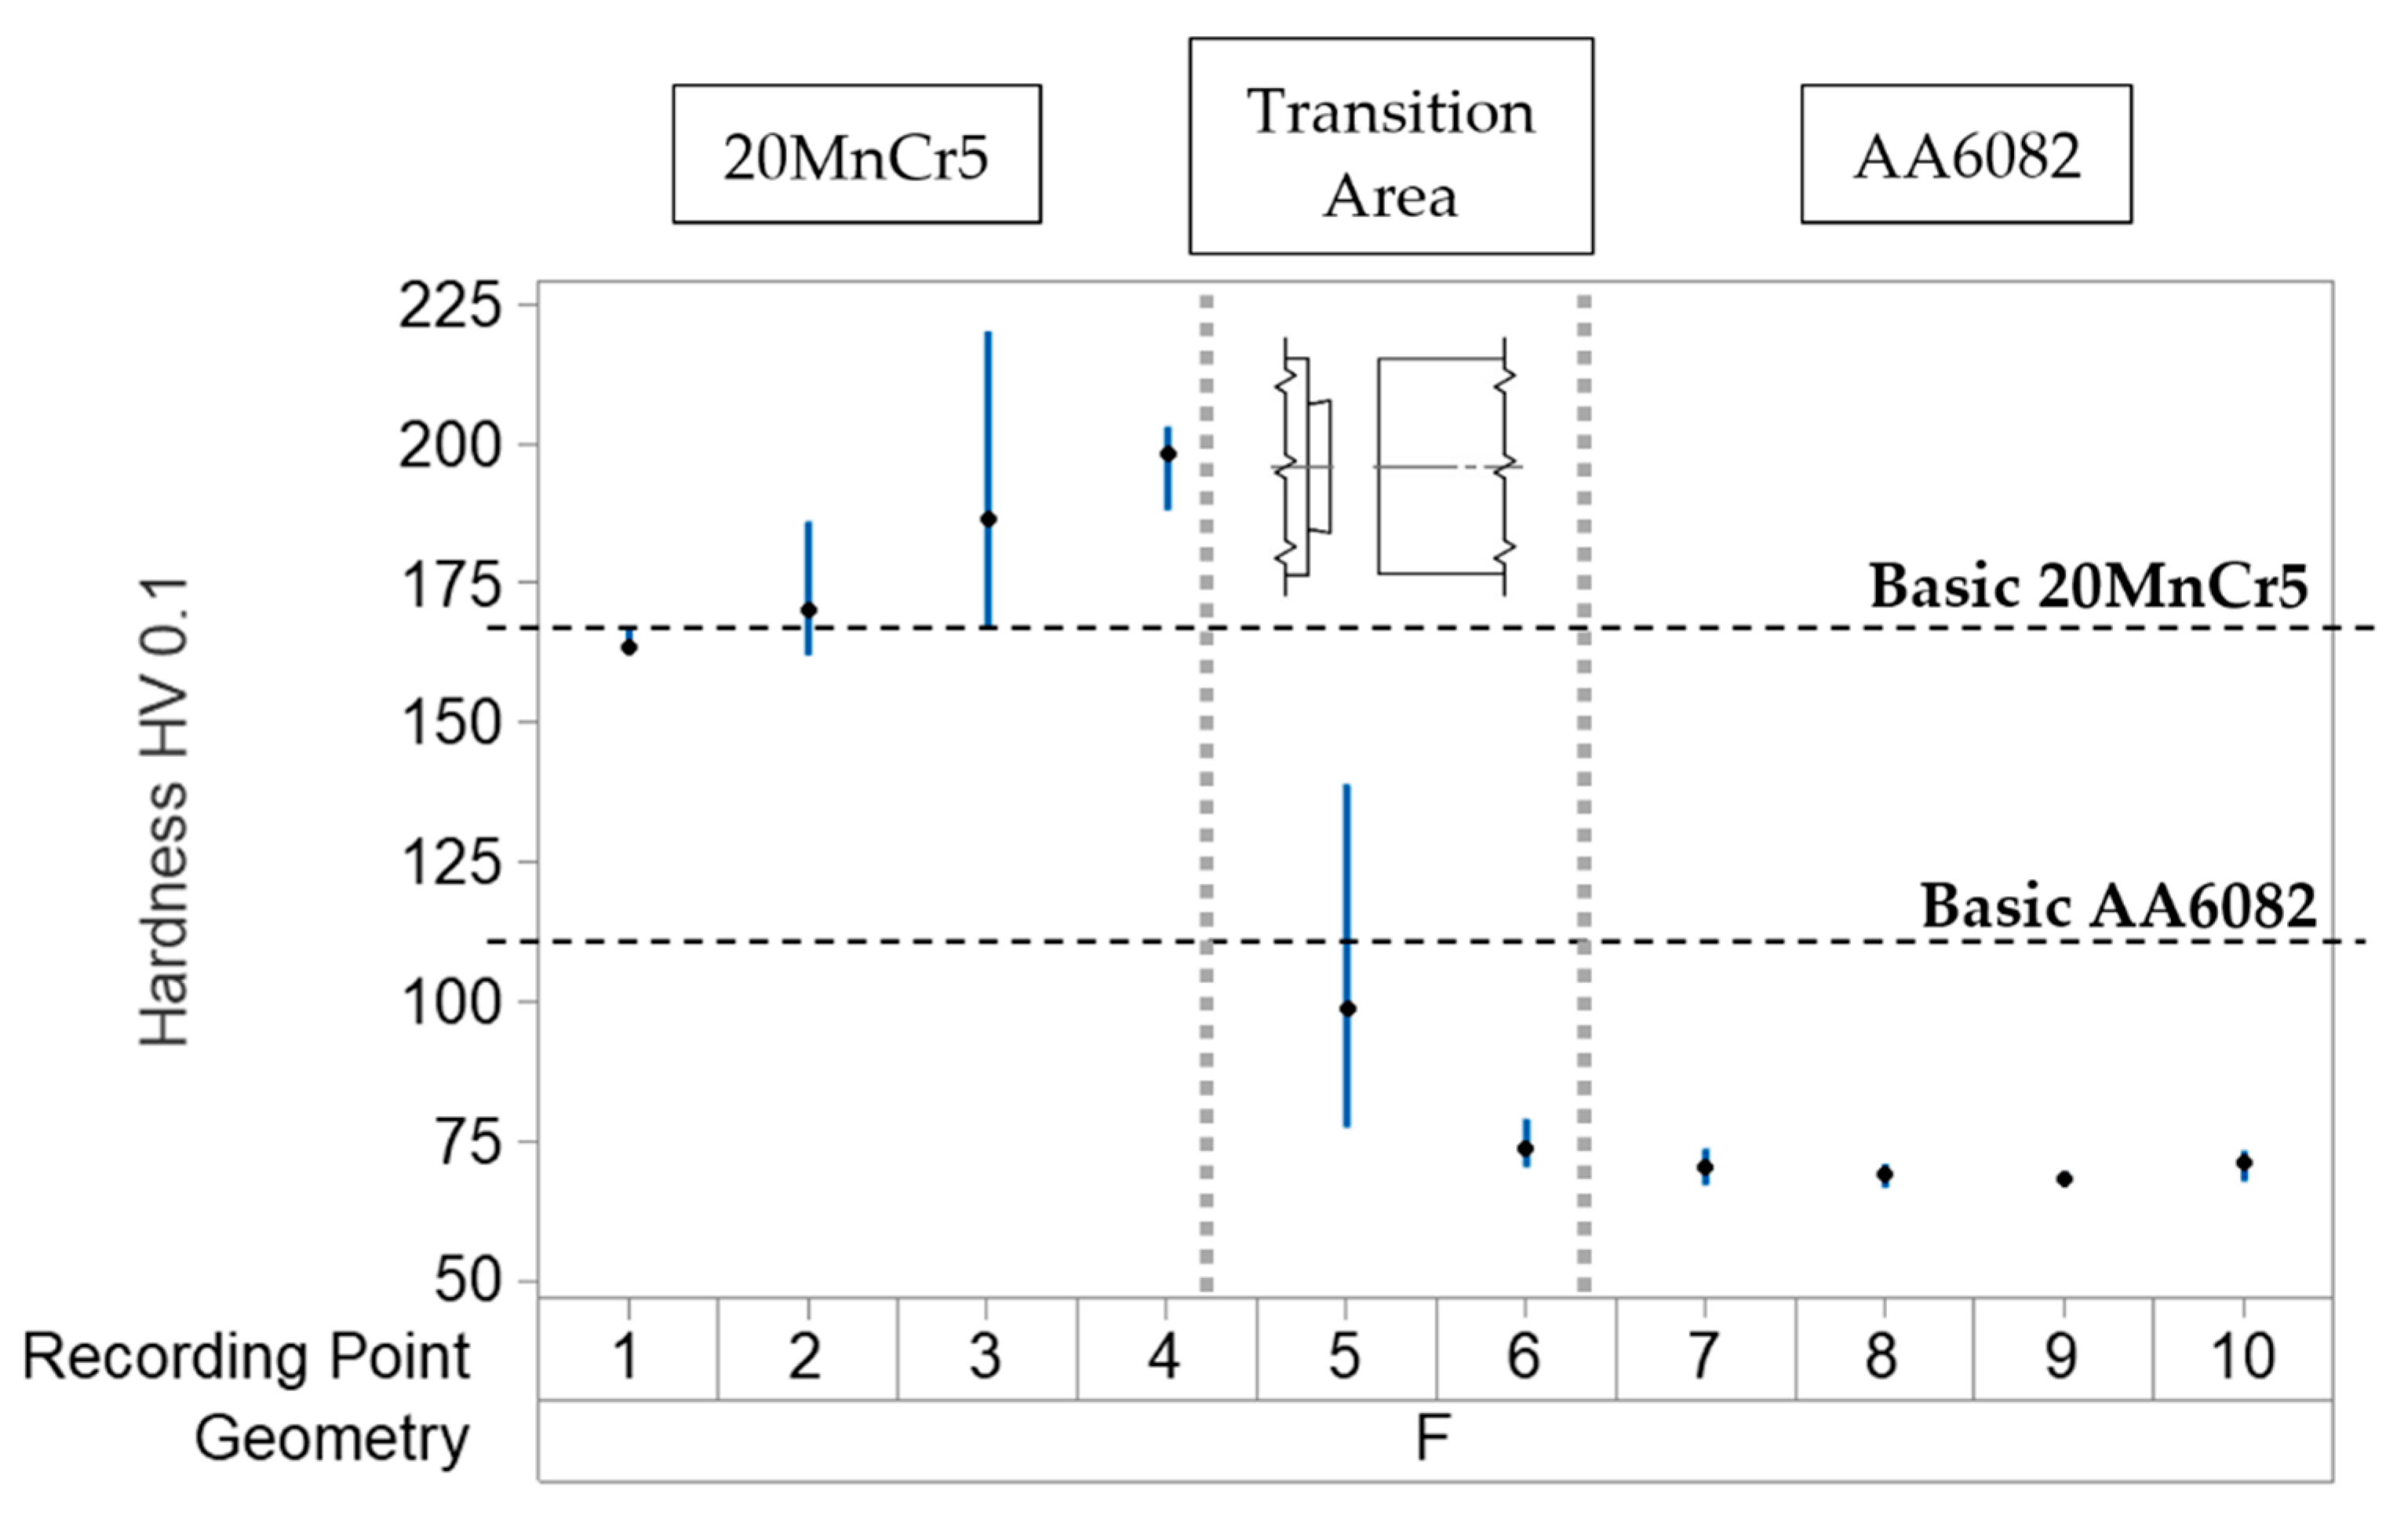
3.2. Metallography
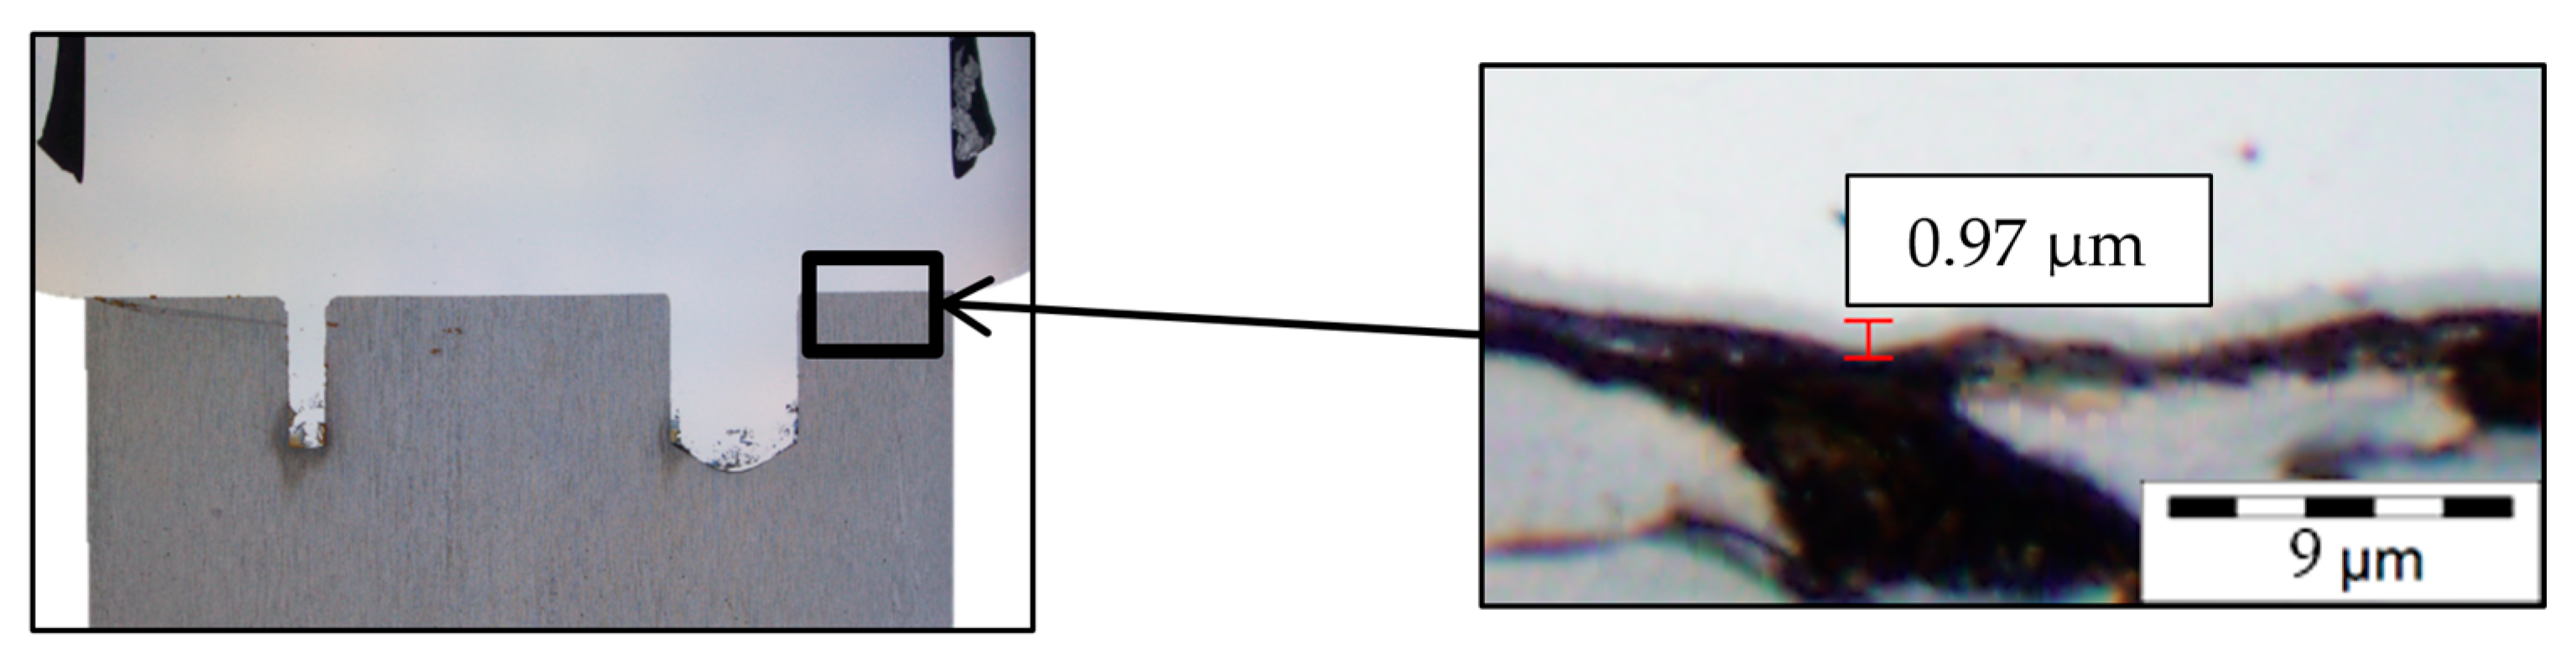
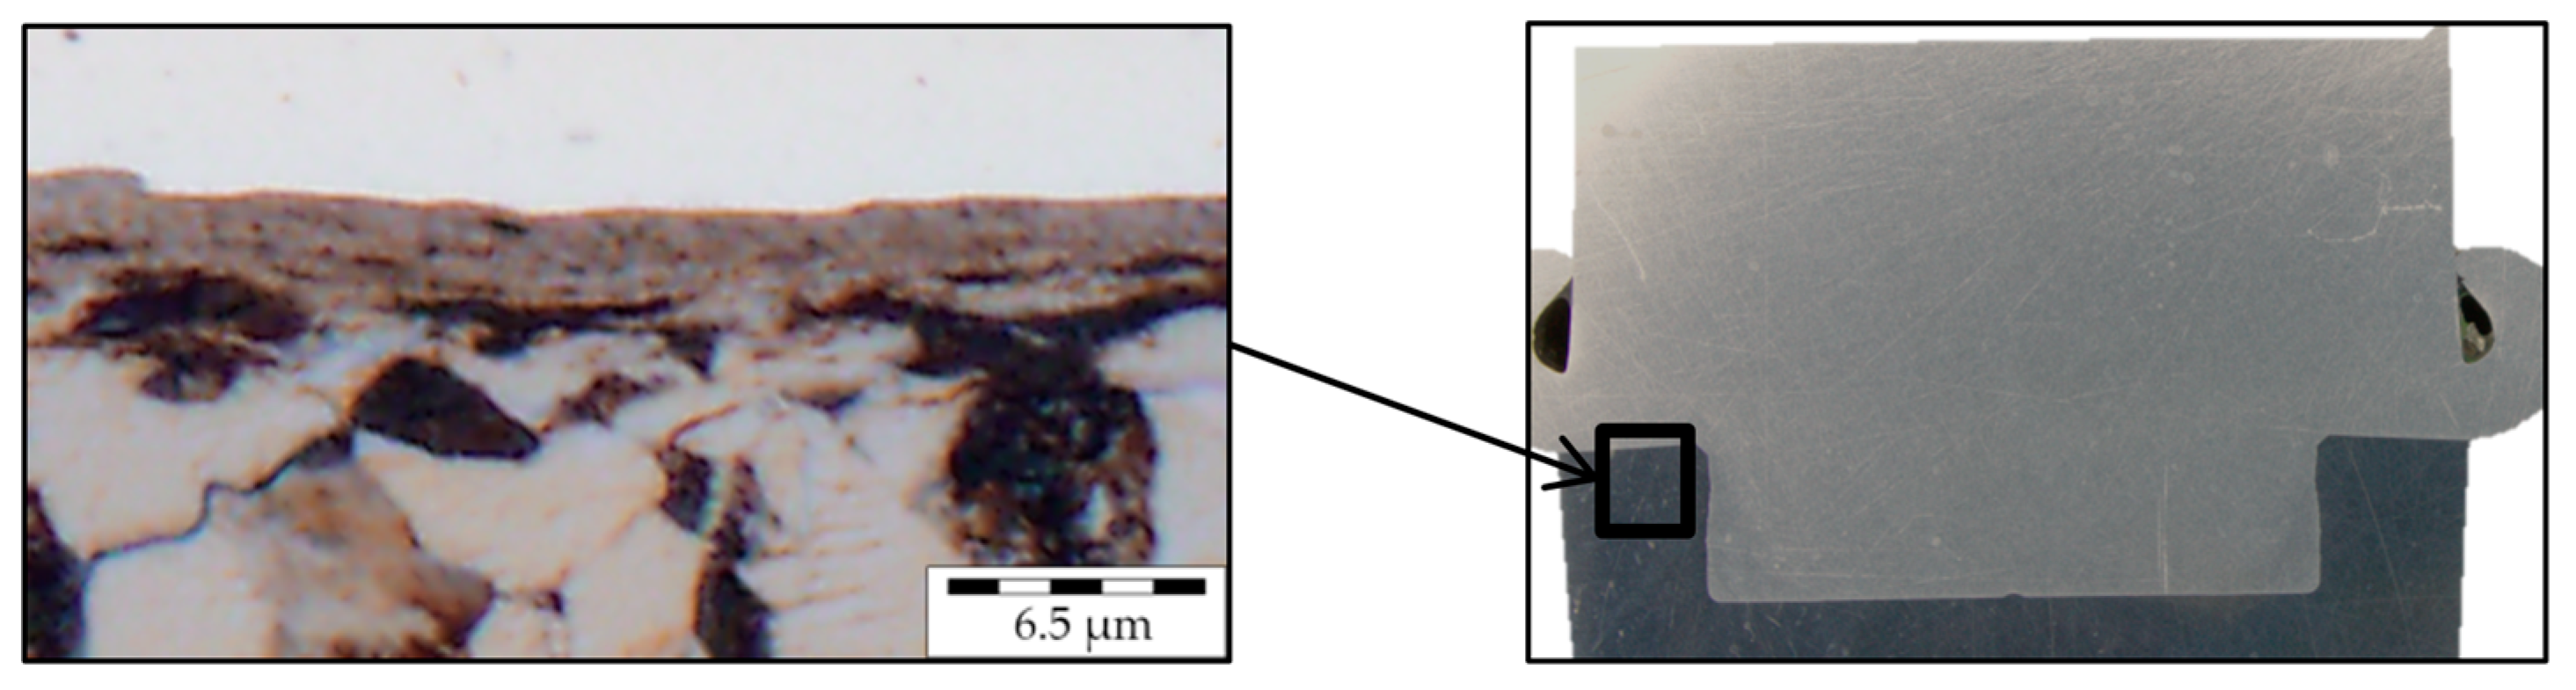
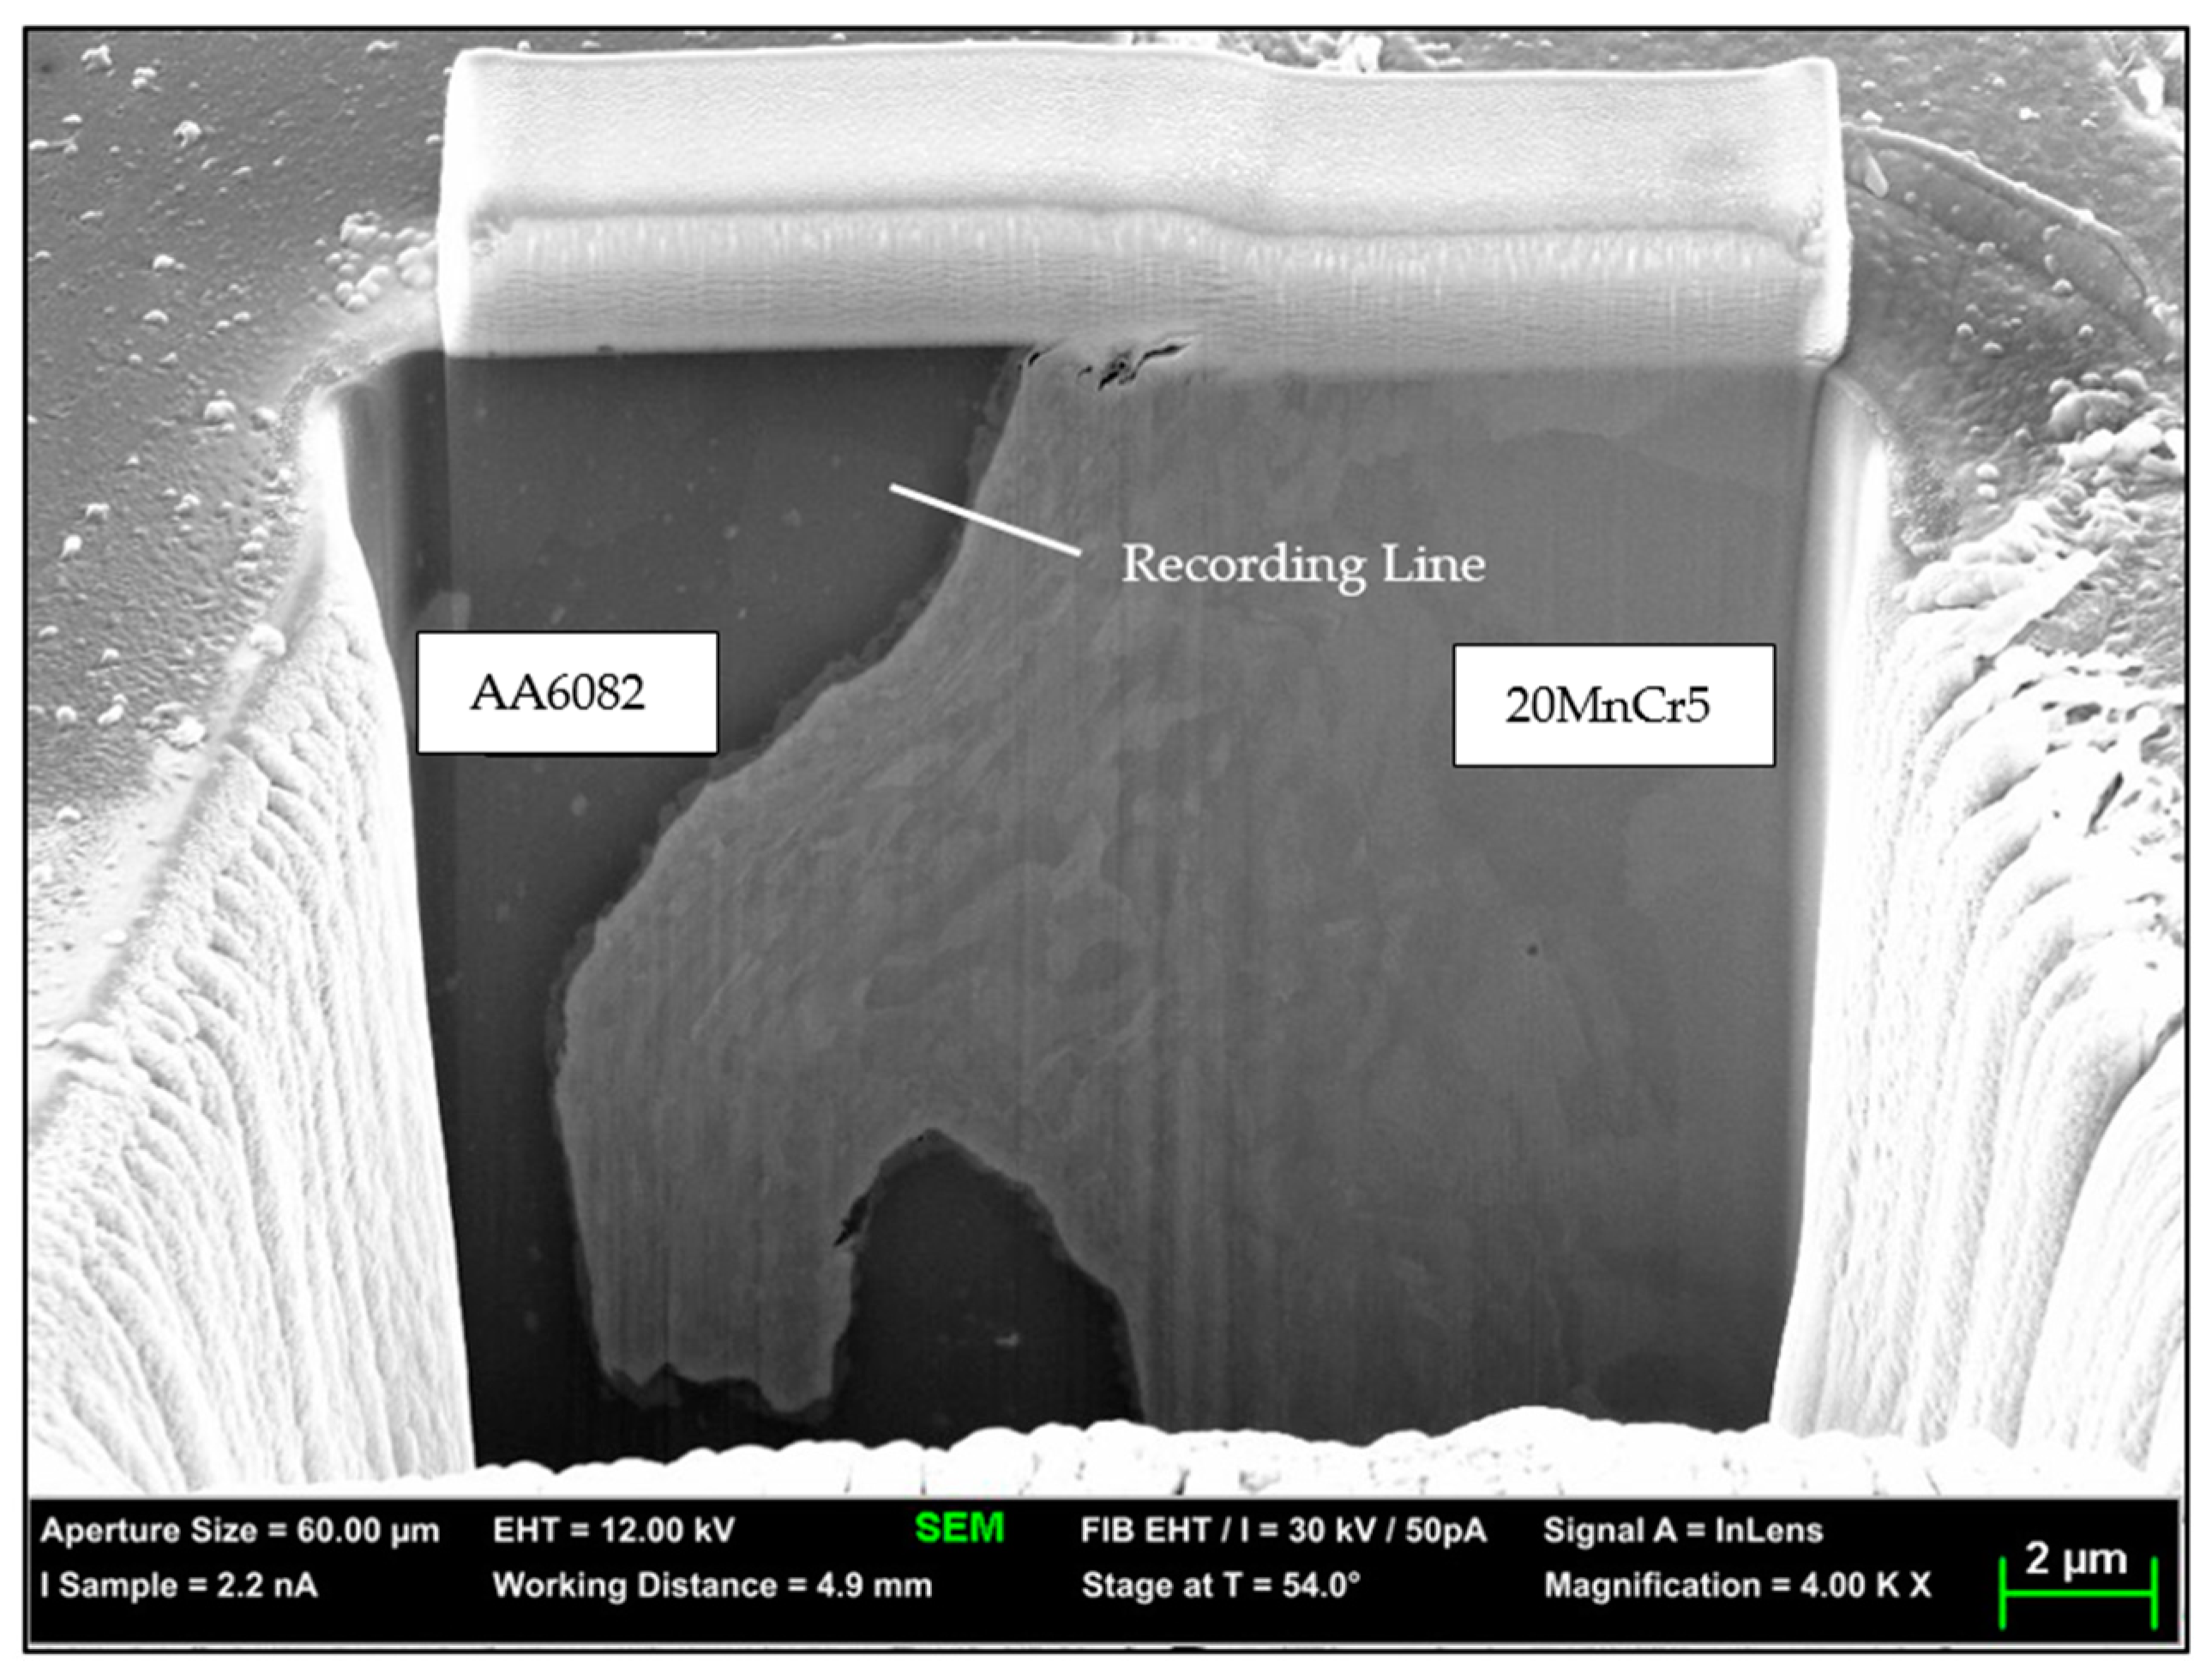
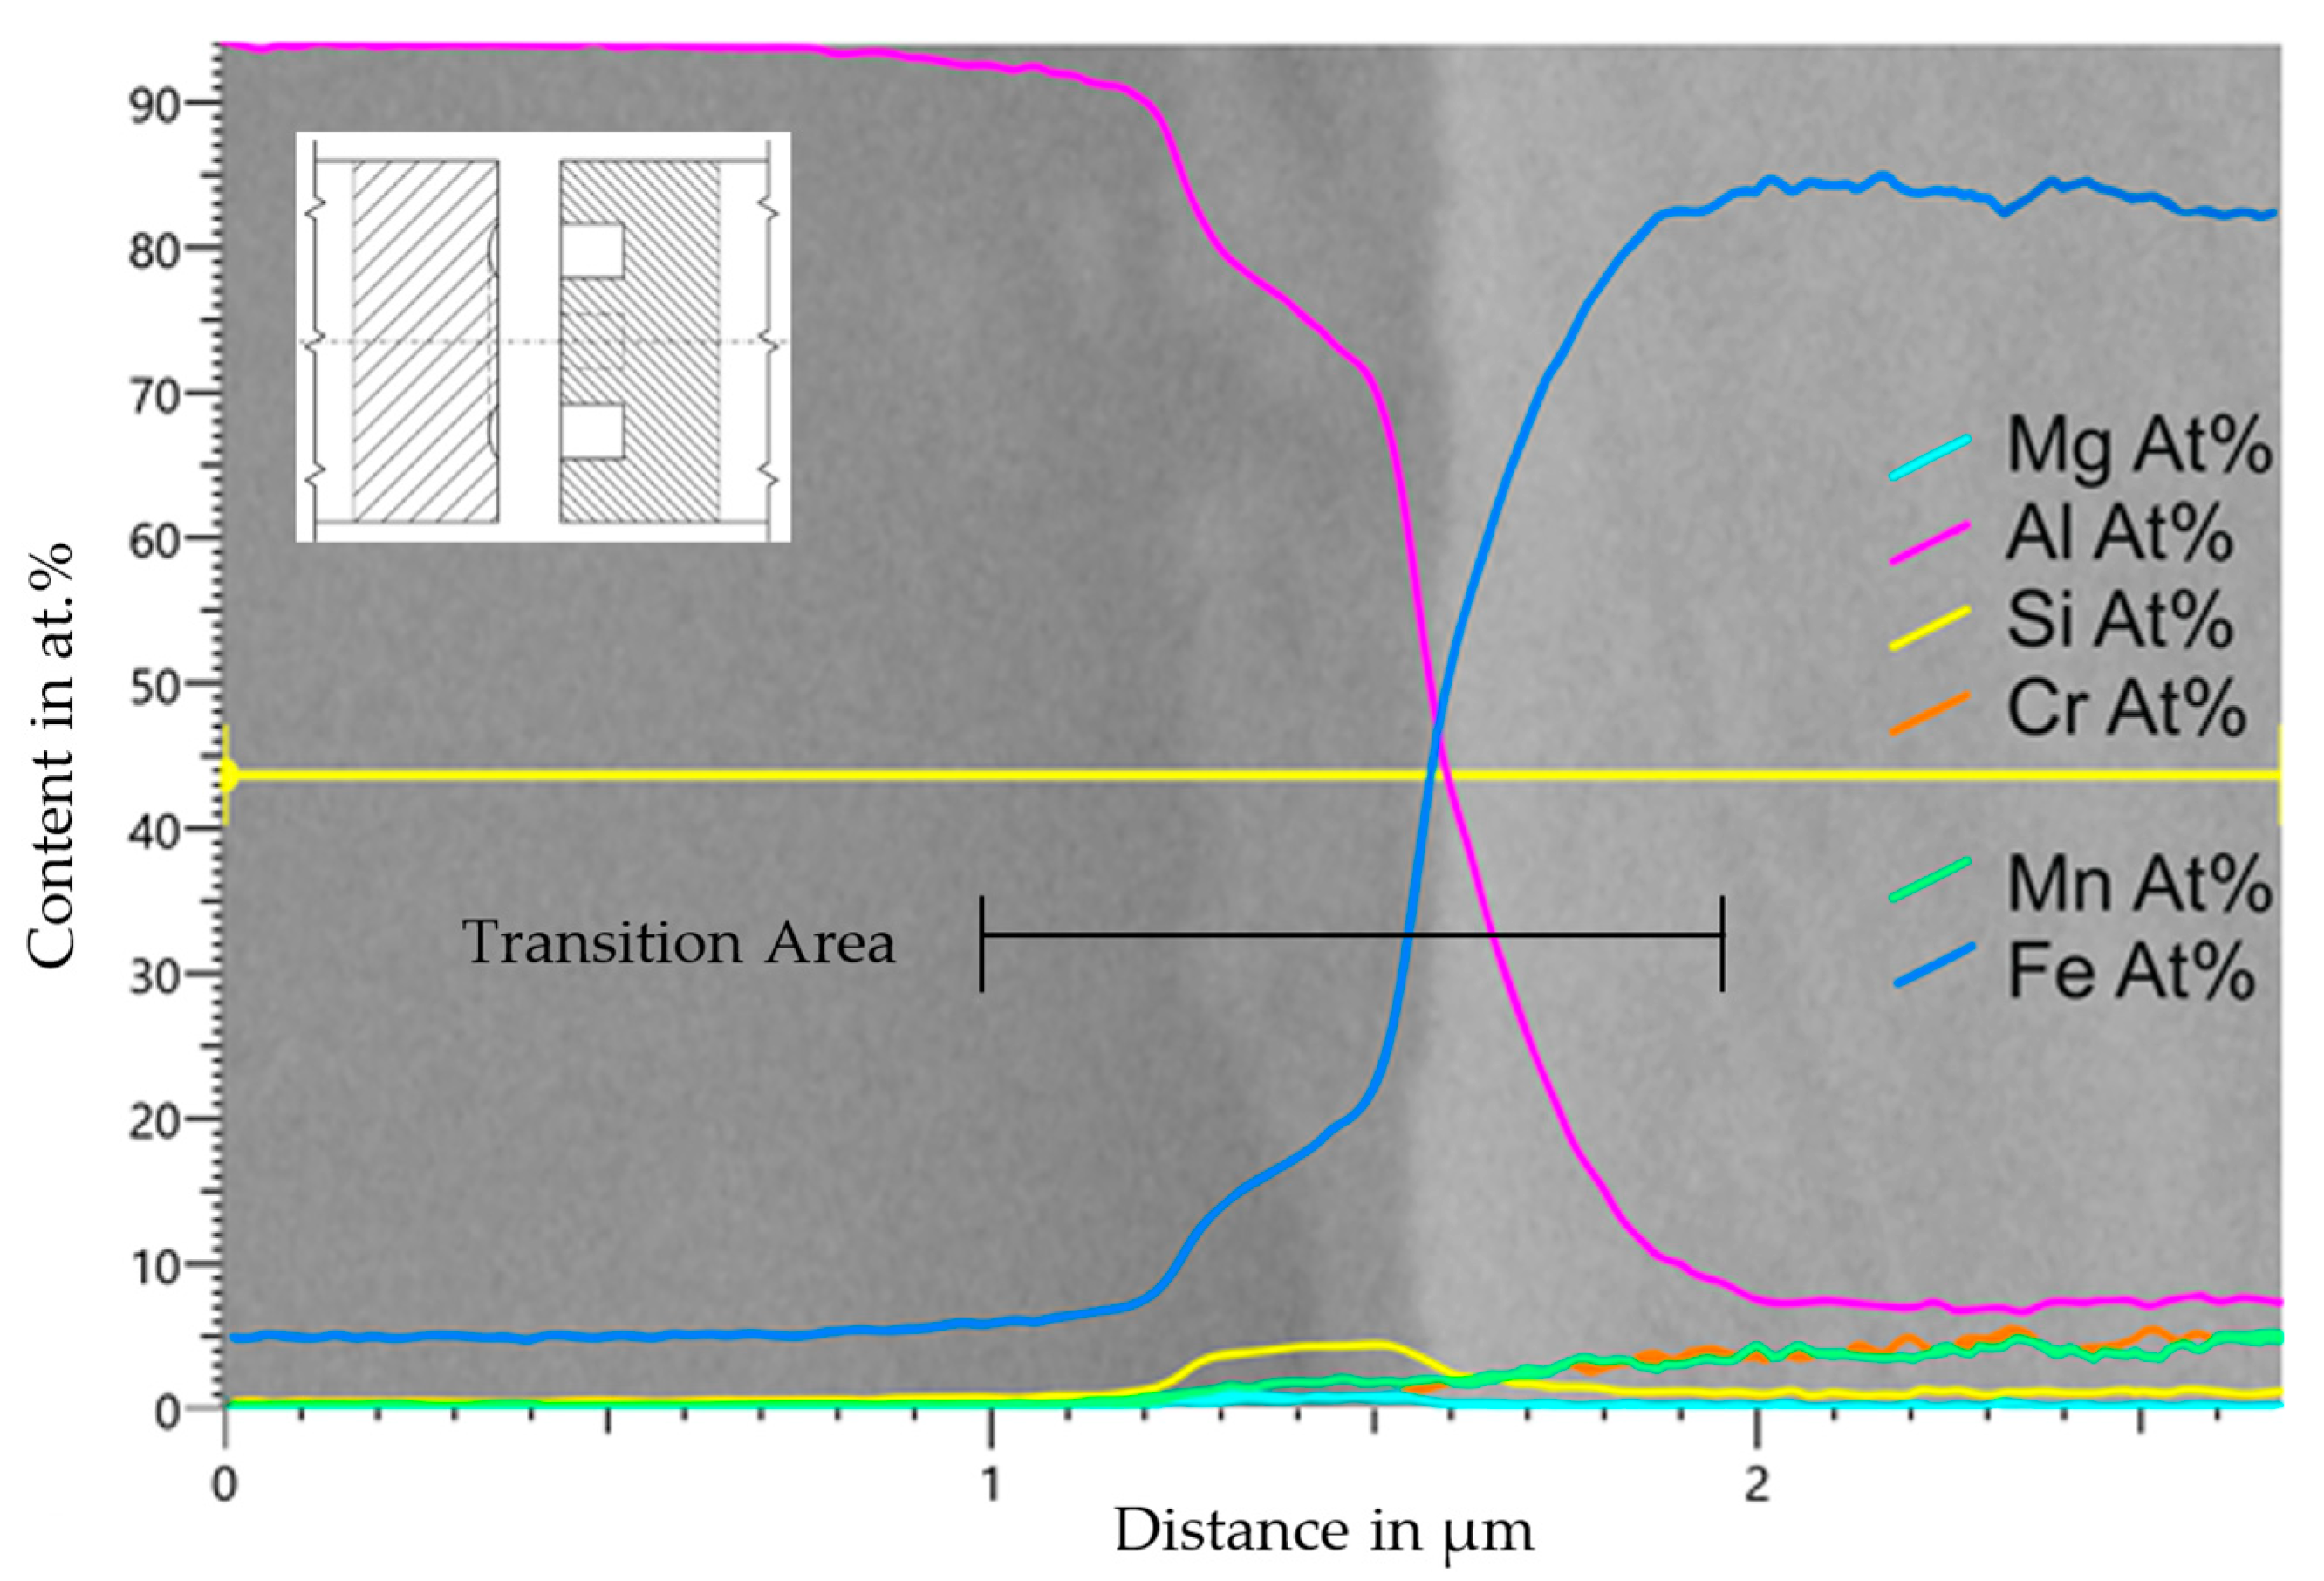
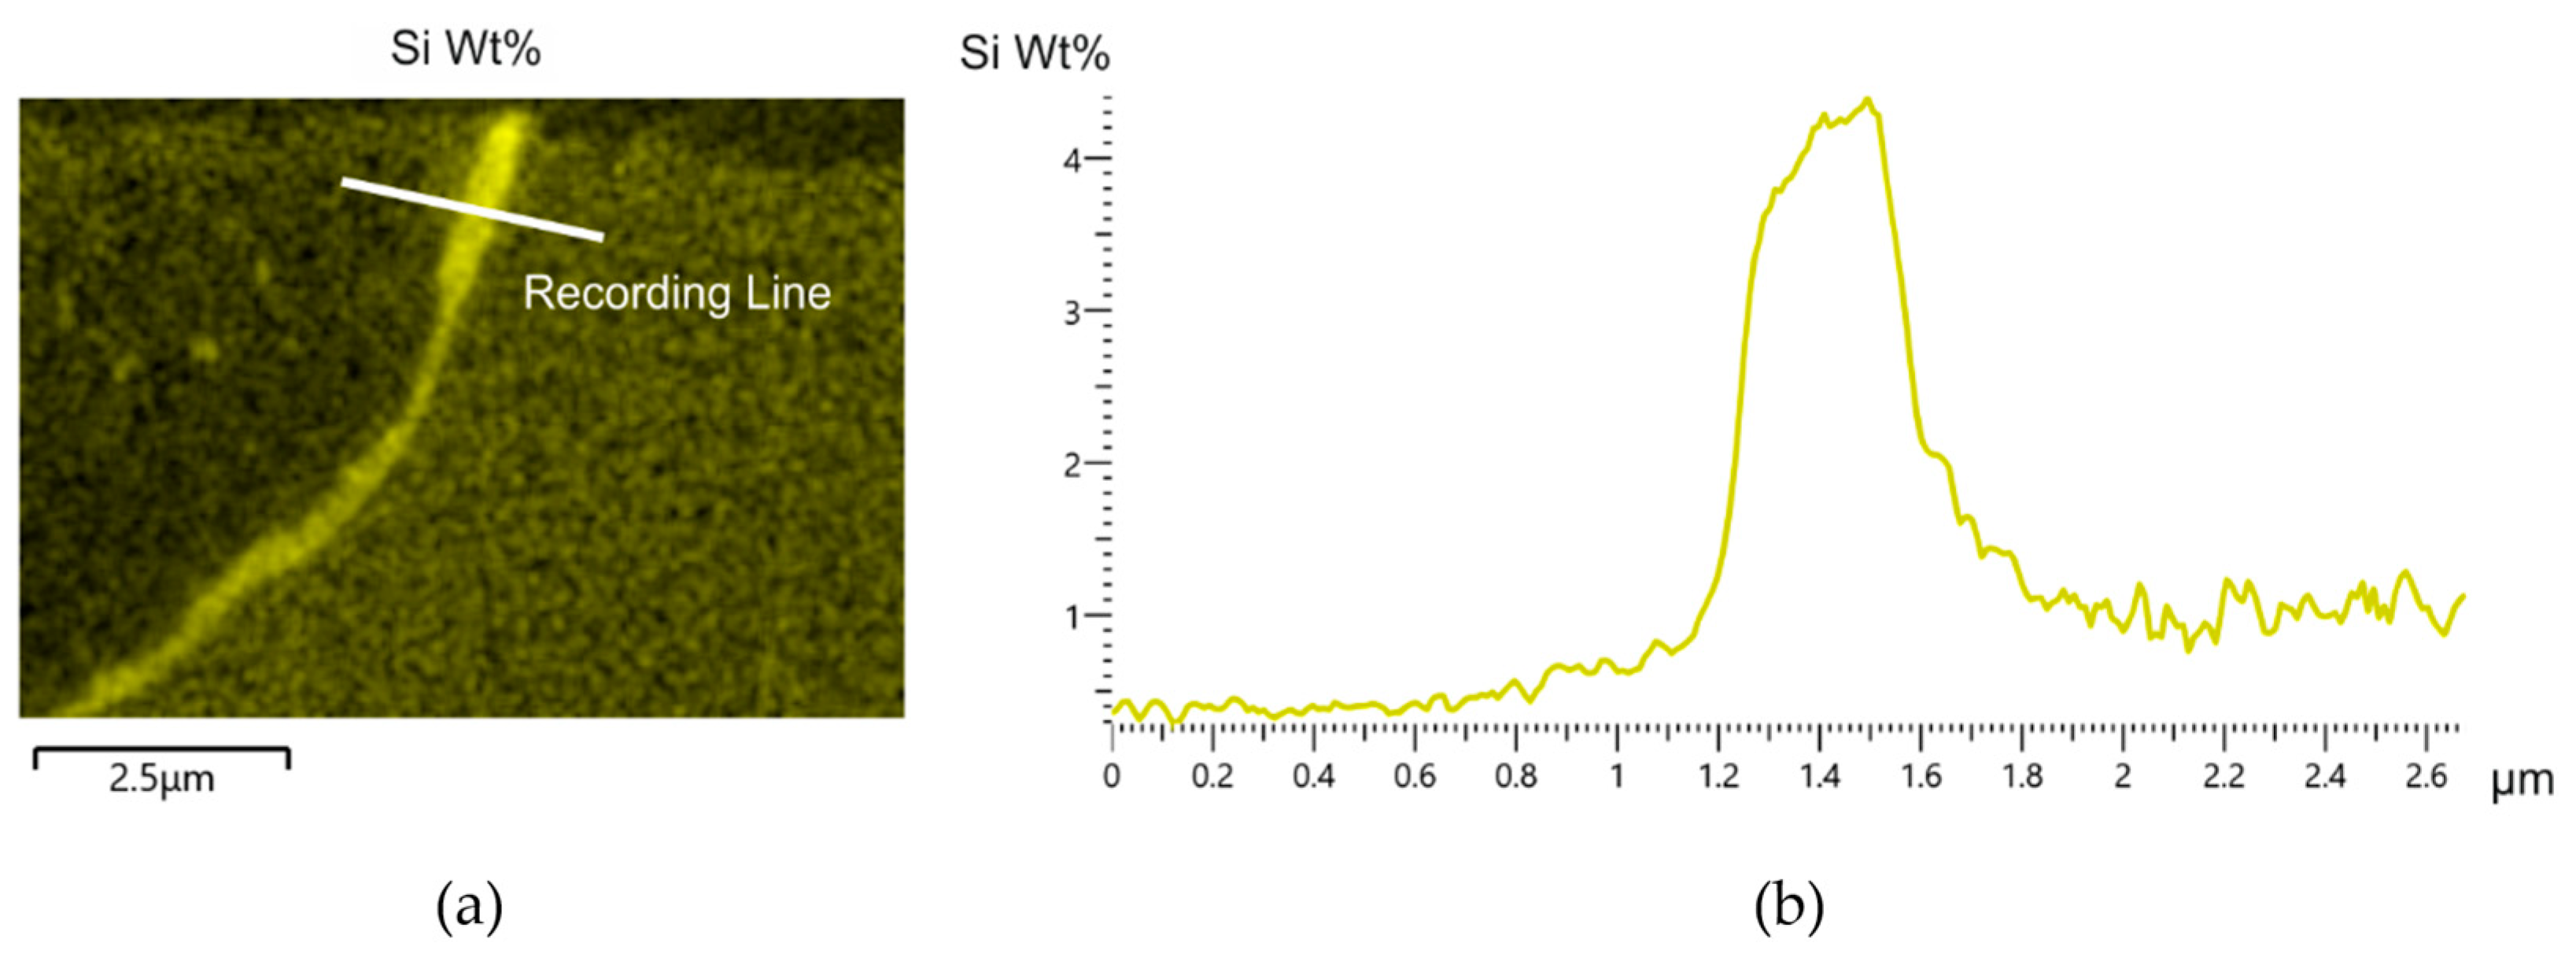
3.3. Scanning Electron Microscopy
4. Discussion
5. Summary and Conclusions
- The highest tensile strengths values have been achieved using Geometries A (257 MPa), F (222 MPa) and H (280 MPa) (flat surface: 252 MPa in [14]);
- The completeness of the joint differs depending on the geometry and the correlation to the parameters of the friction welding process;
- The hardness close to the transition area was influenced by thermal effects of the friction welding process, resulting in a softening of the aluminum and an increased hardness in the steel;
- The EDS analysis showed what is most likely an intermetallic phase at the joining zone with a high content of silicon.
Author Contributions
Funding
Institutional Review Board Statement
Informed Consent Statement
Data Availability Statement
Acknowledgments
Conflicts of Interest
References
- Erman Tekkaya, A. Energy saving by manufacturing technology. Procedia Manuf. 2018, 21, 392–396. [Google Scholar] [CrossRef]
- Lancaster, J.F. Metallurgy of Welding; Springer: Dordrecht, The Netherlands, 1980; ISBN 978-94-010-9508-2. [Google Scholar]
- Friedrich, H.E. Leichtbau in der Fahrzeugtechnik; Springer Fachmedien Wiesbaden: Wiesbaden, Germany, 2013; ISBN 978-3-8348-1467-8. [Google Scholar]
- Hootak, M.; Kuwert, P.; Behrens, B.-A. (Eds.) Numerical Process Design for Compound Forging of Powder—Metallurgical and Solid Dissimilar Workpieces. In Proceedings of the 8th Congress of the German Academic Association for Production Technology (WGP), Aachen, Germany, 19–20 November 2018. [Google Scholar]
- Thomä, M.; Gester, A.; Wagner, G.; Straß, B.; Wolter, B.; Benfer, S.; Gowda, D.K.; Fürbeth, W. Application of the hybrid process ultrasound enhanced friction stir welding on dissimilar aluminum/dual-phase steel and aluminum/magnesium joints. Mater. Werkst. 2019, 50, 893–912. [Google Scholar] [CrossRef] [Green Version]
- Behrens, B.-A.; Huskic, A.; Bouguecha, A.; Frischkorn, C.; Chugreeva, A.; Duran, D. Tailored Forming Technology for Three Dimensional Components: Approaches to Heating and Forming. In Proceedings of the 5th International Conference on Thermomechanical Processing, Milan, Italy, 26–28 October 2016. [Google Scholar]
- Behrens, B.-A.; Bonhage, M.; Bohr, D.; Duran, D. Simulation Assisted Process Development for Tailored Forming. Mater. Sci. Forum 2019, 949, 101–111. [Google Scholar] [CrossRef] [Green Version]
- Behrens, B.-A.; Goldstein, R.; Duran, D. Role of Thermal Processing in Tailored Forming Technology for Manufacturing Multi-Material Components. In Proceedings of the Heat Treat 2017: Proceedings of the 29th ASM Treating Society Conference, Columbus, OH, USA, 24–26 October 2017. [Google Scholar]
- Ashfaq, M.; Sajja, N.; Khalid Rafi, H.; Prasad Rao, K. Improving Strength of Stainless Steel/Aluminum Alloy Friction Welds by Modifying Faying Surface Design. J. Mater. Eng. Perform. 2013, 22, 376–383. [Google Scholar] [CrossRef]
- Fukumoto, S.; Tsubakino, H.; Okita, K.; Aritoshi, M.; Tomita, T. Friction welding process of 5052 aluminium alloy to 304 stainless steel. Mater. Sci. Technol. 1999, 15, 1080–1086. [Google Scholar] [CrossRef]
- Lee, W.B.; Yeon, Y.M.; Kim, D.U.; Jung, S.B. Effect of friction welding parameters on mechanical and metallurgical properties of aluminium alloy 5052–A36 steel joint. Mater. Sci. Technol. 2003, 19, 773–778. [Google Scholar] [CrossRef]
- Fukumoto, S.; Inuki, T.; Tsubakino, H.; Okita, K.; Aritoshi, M.; Tomita, T. Evaluation of friction weld interface of aluminium to austenitic stainless steel joint. Mater. Sci. Technol. 1997, 13, 679–686. [Google Scholar] [CrossRef]
- Sahin, M. Joining of stainless-steel and aluminium materials by friction welding. Int. J. Adv. Manuf. Technol. 2009, 41, 487–497. [Google Scholar] [CrossRef]
- Behrens, B.-A.; Chugreev, A.; Selinski, M.; Matthias, T. Joining zone shape optimisation for hybrid components made of aluminium-steel by geometrically adapted joining surfaces in the friction welding process. In Proceedings of the 22nd International ESAFORM Conference on Material Forming: ESAFORM 2019, Vitoria-Gasteiz, Spain, 8–10 May 2019; AIP Publishing: College Park, MD, USA, 2019; p. 40027. [Google Scholar]
- Ambroziak, A.; Korzeniowski, M.; Kustroń, P.; Winnicki, M.; Sokołowski, P.; Harapińska, E. Friction Welding of Aluminium and Aluminium Alloys with Steel. Adv. Mater. Sci. Eng. 2014, 2014, 981653. [Google Scholar] [CrossRef] [Green Version]
- Schuler, V.; Twrdek, J. Praxiswissen Schweißtechnik; Springer: Wiesbaden, Germany, 2019; ISBN 978-3-658-24265-7. [Google Scholar]
- DIN Deutsches Institut für Normung E.V. DIN EN ISO 6507-1: Metallische Werkstoffe—Härteprüfung nach Vickers—Teil 1: Prüfverfahren (ISO 6507-1:2018); Deutsche Fassung EN ISO 6507-1:2018; Beuth Verlag GmbH: Berlin, Germany, 2018. [Google Scholar]
- DIN Deutsches Institut für Normung E.V. DIN EN ISO 6892-1: Metallische Werkstoffe—Zugversuch—Teil 1: Prüfverfahren bei Raumtemperatur (ISO 6892-1:2016); Deutsche Fassung EN ISO 6892-1:2016; Beuth Verlag GmbH: Berlin, Germany, 2017. [Google Scholar]
- Barienti, K.; Kahra, C.; Herbst, S.; Nürnberger, F.; Maier, H.J. Ion Beam Processing for Sample Preparation of Hybrid Materials with Strongly Differing Mechanical Properties. Metallogr. Microstruct. Anal. 2020, 9, 54–60. [Google Scholar] [CrossRef] [Green Version]
- Liu, Y.; Zhao, H.; Peng, Y.; Ma, X. Microstructure and tensile strength of aluminum/stainless steel joint welded by inertia friction and continuous drive friction. Weld World 2020, 64, 1799–1809. [Google Scholar] [CrossRef]
- Wang, T.; Sidhar, H.; Mishra, R.S.; Hovanski, Y.; Upadhyay, P.; Carlson, B. Evaluation of intermetallic compound layer at aluminum/steel interface joined by friction stir scribe technology. Mater. Des. 2019, 174, 107795. [Google Scholar] [CrossRef]
- Eggeler, G.; Auer, W.; Kaesche, H. On the influence of silicon on the growth of the alloy layer during hot dip aluminizing. J. Mater. Sci. 1986, 21, 3348–3350. [Google Scholar] [CrossRef]
- Cheng, W.-J.; Wang, C.-J. Effect of silicon on the formation of intermetallic phases in aluminide coating on mild steel. Intermetallics 2011, 19, 1455–1460. [Google Scholar] [CrossRef]


| Material | Tensile Strength Rm in MPa | Uniform Elongation Ag in % | Elongation at Fracture A in % | Hardness in HV0.1 |
|---|---|---|---|---|
| 20MnCr5 | 554 ± 5 | 111 ± 1 | 276 ± 6 | 170 ± 13 |
| AA6082 | 364 ± 0 | 45 ± 1 | 104 ± 6 | 113 ± 1 |
| Element | C | Si | Mn | P | Cr | S | Al | Fe | Cu | Mg | Zn | Ti |
|---|---|---|---|---|---|---|---|---|---|---|---|---|
| 20MnCr5 | 0.195 | 0.275 | 1.190 | 0.013 | 1.050 | 0.010 | 0.030 | 96.85 | 0.164 | - | 0.023 | - |
| AA6082 | - | 1.040 | 0.451 | 0.001 | 0.035 | - | 97.60 | 0.152 | 0.031 | 0.620 | 0.011 | 0.018 |
| Geometry | A | B | C | D | E | F | G | H |
|---|---|---|---|---|---|---|---|---|
| Friction speed in 1/min | 1500 | 1500 | 1500 | 1500 | 2000 | 2000 | 2000 | 2000 |
| Frictional force in kN | 150 | 100 | 80 | 80 | 70 | 75 | 70 | 75 |
| Friction time in s | - | 2 | 2 | 0.05 | 0.1 | - | 0.1 | - |
| Relative friction path in mm | 4 | - | - | - | - | 4 | - | 10 |
| Press force in kN | 240 | 120 | 150 | 120 | 120 | 150 | 120 | 120 |
| Press time in s | 2 | 1 | 2 | 1 | 2 | 2 | 2 | 2 |
| Geometry | Bond Strength (Average) | Comments | |
|---|---|---|---|
| A |  | 257 ± 5 |
|
| B |  | 180 ± 14 |
|
| C |  | 120 ± 8 |
|
| D |  | 190 ± 15 |
|
| E |  | 180 ± 21 |
|
| F |  | 222 ± 5 |
|
| G |  | 215 ± 4 |
|
| H |  | 280 ± 17 |
|
Publisher’s Note: MDPI stays neutral with regard to jurisdictional claims in published maps and institutional affiliations. |
© 2021 by the authors. Licensee MDPI, Basel, Switzerland. This article is an open access article distributed under the terms and conditions of the Creative Commons Attribution (CC BY) license (http://creativecommons.org/licenses/by/4.0/).
Share and Cite
Behrens, B.-A.; Uhe, J.; Petersen, T.; Nürnberger, F.; Kahra, C.; Ross, I.; Laeger, R. Contact Geometry Modification of Friction-Welded Semi-Finished Products to Improve the Bonding of Hybrid Components. Metals 2021, 11, 115. https://doi.org/10.3390/met11010115
Behrens B-A, Uhe J, Petersen T, Nürnberger F, Kahra C, Ross I, Laeger R. Contact Geometry Modification of Friction-Welded Semi-Finished Products to Improve the Bonding of Hybrid Components. Metals. 2021; 11(1):115. https://doi.org/10.3390/met11010115
Chicago/Turabian StyleBehrens, Bernd-Arno, Johanna Uhe, Tom Petersen, Florian Nürnberger, Christoph Kahra, Ingo Ross, and René Laeger. 2021. "Contact Geometry Modification of Friction-Welded Semi-Finished Products to Improve the Bonding of Hybrid Components" Metals 11, no. 1: 115. https://doi.org/10.3390/met11010115