Sleep-Related Declarative Memory Consolidation in Children and Adolescents with Developmental Dyslexia

 , , , ,

Abstract
:1. Introduction
2. Materials and Methods
2.1. Participants
2.2. Procedure
2.3. Measures
2.3.1. Declarative Memory Word-Pair Task
- number of trials (repetition of the list) needed to achieve the cutoff (50% of pairs recalled);
- number of correctly retrieved word-pairs in the last trial in the evening (immediate recall);
- number of correctly retrieved word-pairs in the morning (delayed recall).
2.3.2. Polysomnographic Recordings
2.4. Data Analyses
2.4.1. Demographic and Clinical Characteristics
2.4.2. Declarative Memory Performance
2.4.3. Sleep Measures
2.4.4. Slow-Wave Activity (SWA)
2.4.5. Spindle Detection and Analysis
2.4.6. Correlation between Sleep Measures and Memory Performance
3. Results
3.1. Demographic and Clinical Characteristics
3.2. Word Pair Task
3.3. Sleep Macrostructure
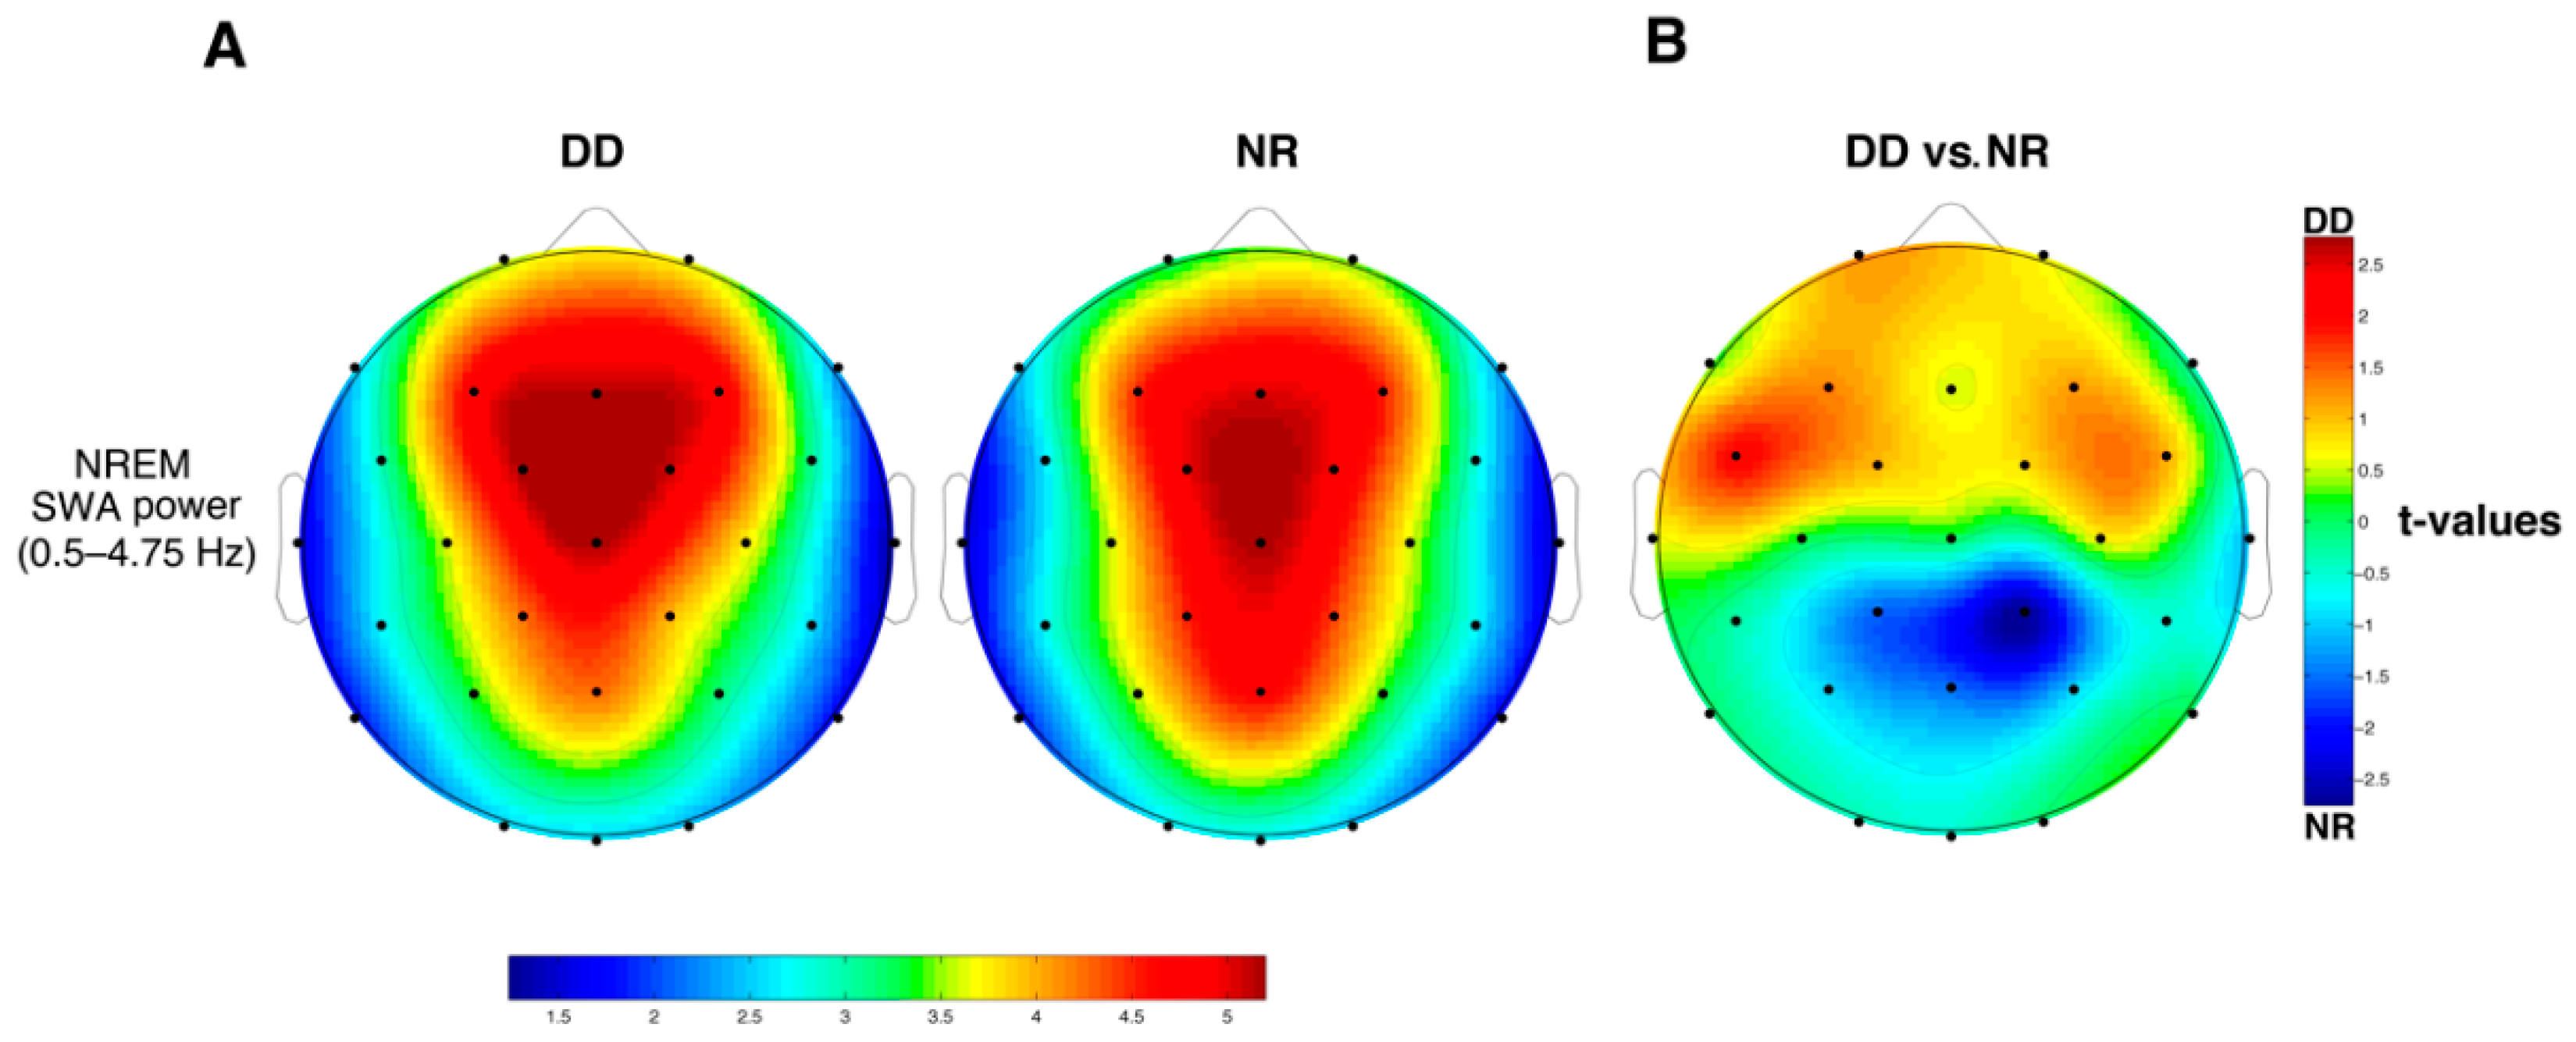
3.4. SWA
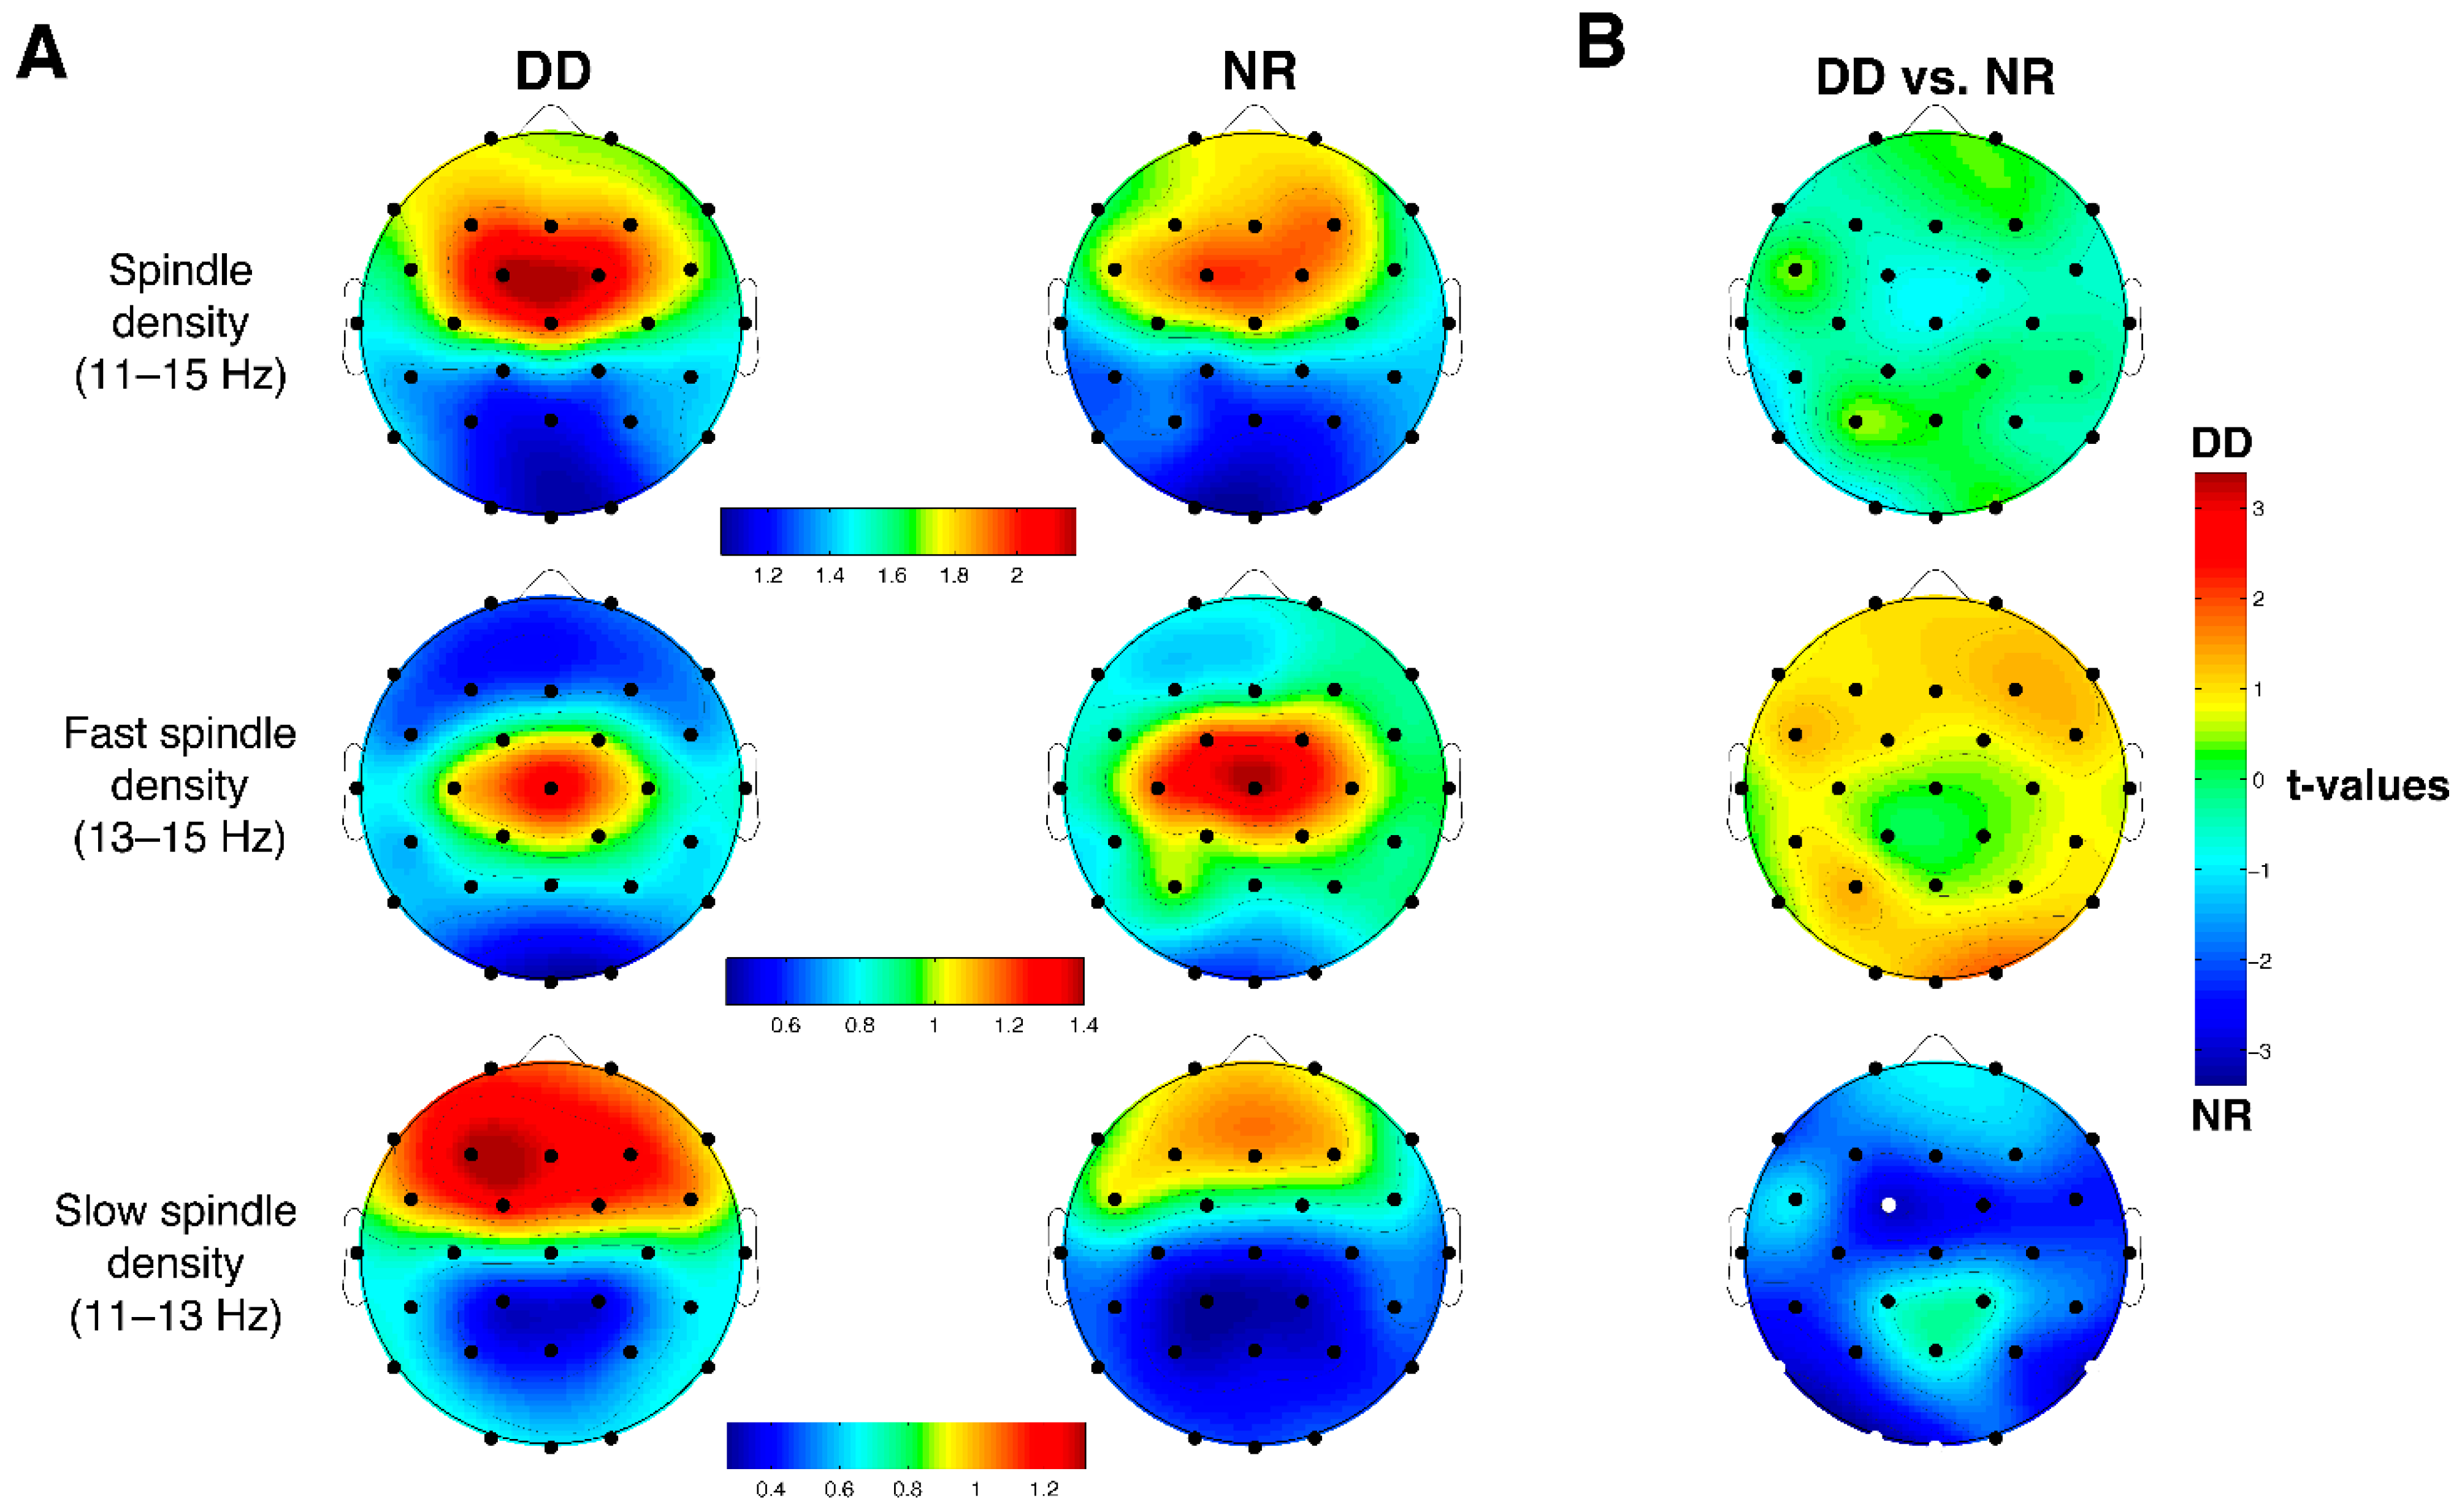
3.5. Sleep Spindles
3.6. Correlations between Memory Performance and Sleep Measures
3.6.1. Macrostructural Parameters x Memory Performance
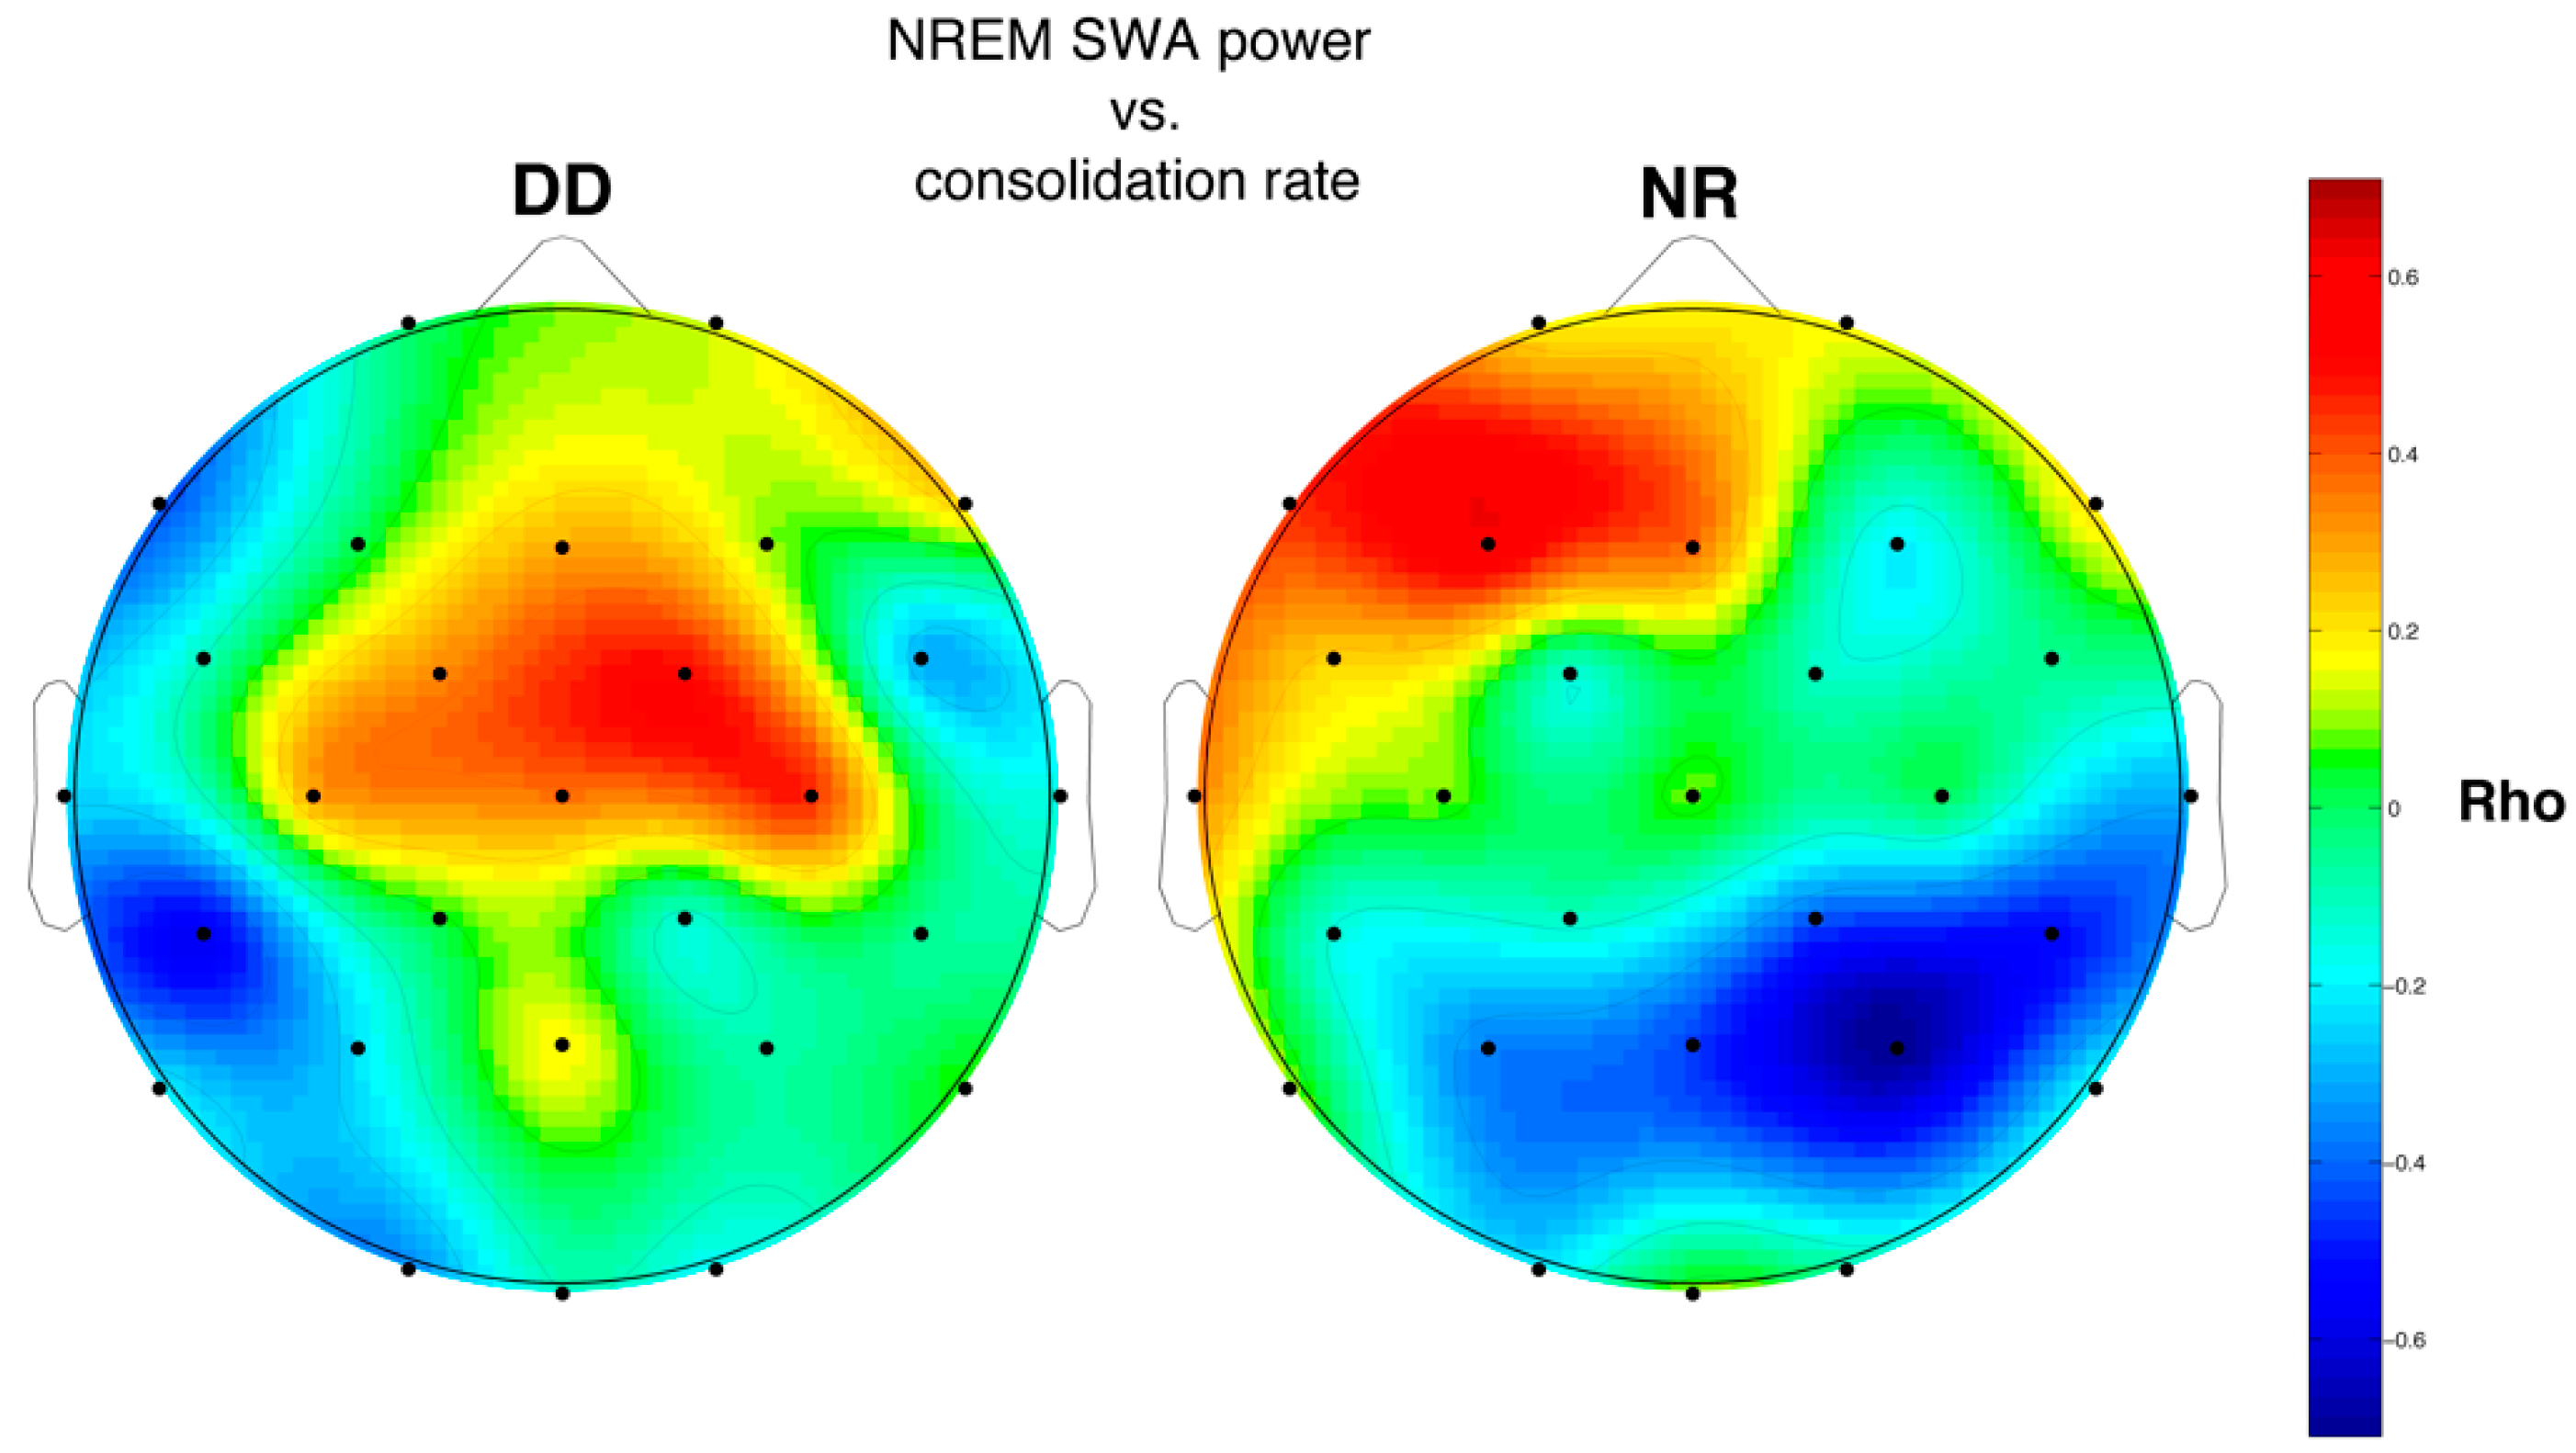
3.6.2. SWA and Memory Performance
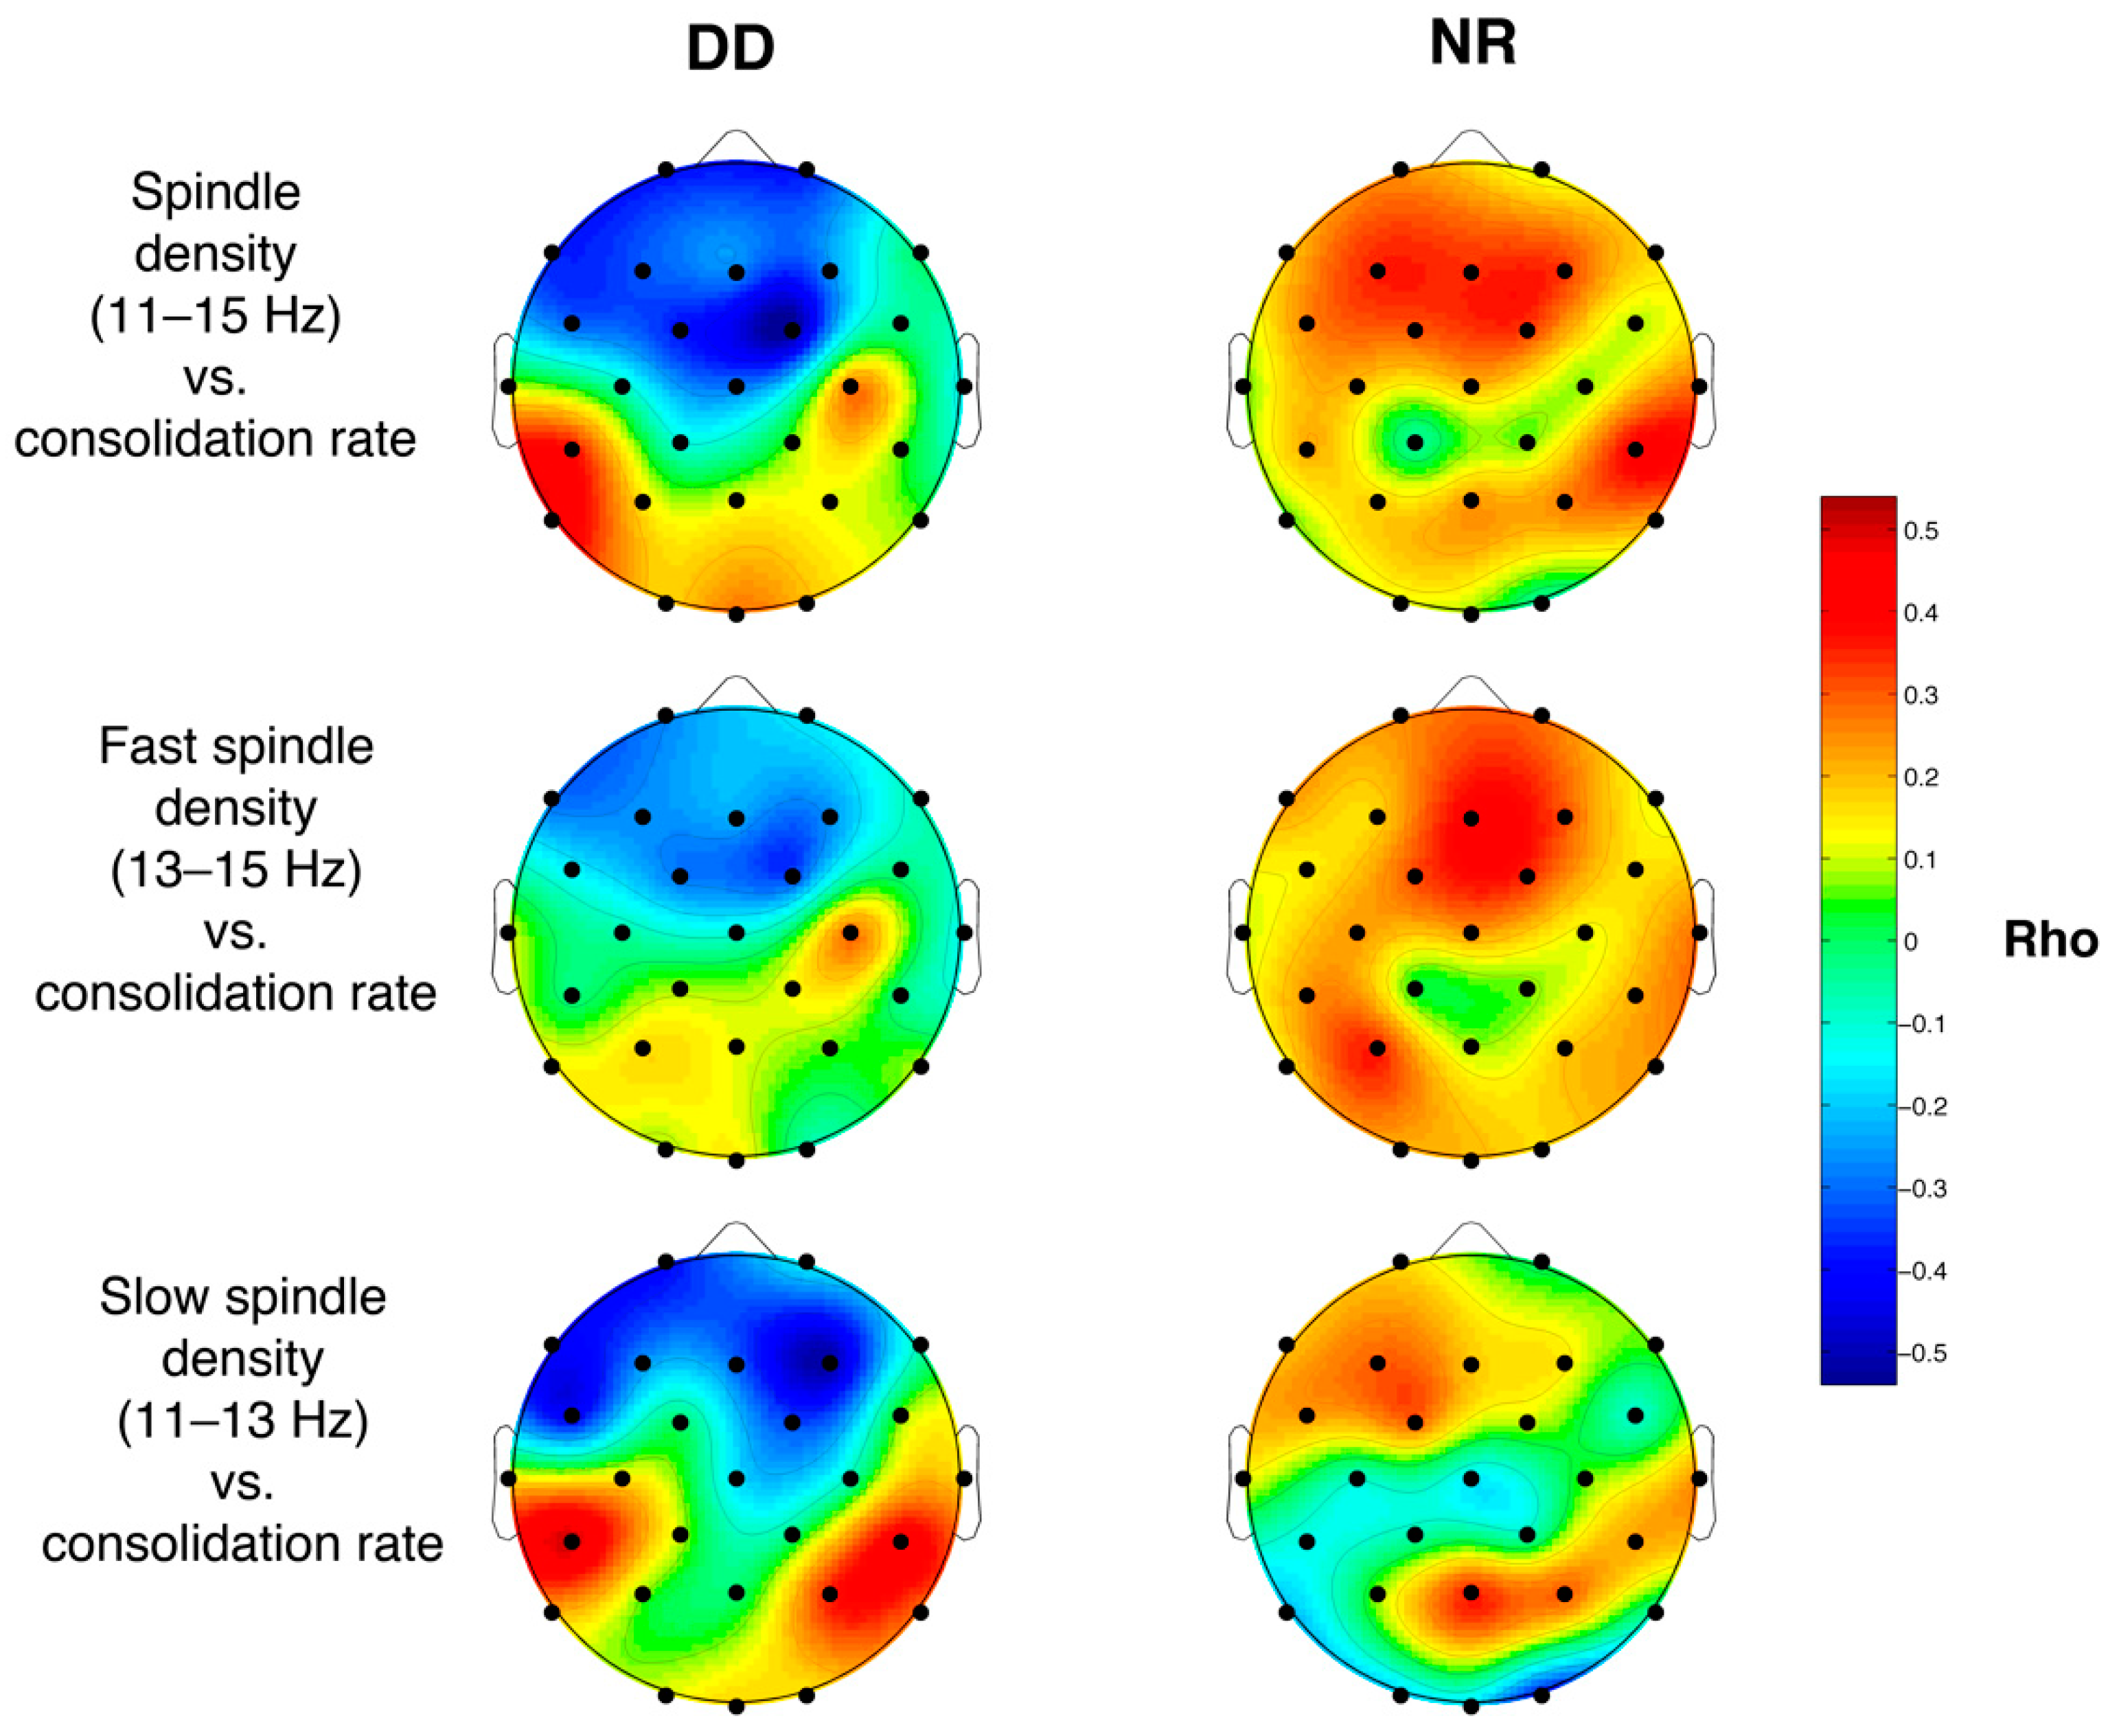
3.6.3. Sleep Spindle Density and Memory Performance
4. Discussion
4.1. Sleep-Dependent Memory Performance
4.2. Sleep Problems and Macrostructure
4.3. Cortical Sleep Topography
4.4. Relations between Sleep Features and Memory Performance
5. Conclusions
Author Contributions
Funding
Institutional Review Board Statement
Informed Consent Statement
Data Availability Statement
Acknowledgments
Conflicts of Interest
References
- Tononi, G.; Cirelli, C. Sleep and the price of plasticity: From synaptic and cellular homeostasis to memory consolidation and integration. Neuron 2014, 81, 12–34. [Google Scholar] [CrossRef] [PubMed] [Green Version]
- Gorgoni, M.; D’Atri, A.; Lauri, G.; Rossini, P.M.; Ferlazzo, F.; De Gennaro, L. Is sleep essential for neural plasticity in humans, and how does it affect motor and cognitive recovery? Neural Plast. 2013, 103949. [Google Scholar] [CrossRef] [PubMed]
- Rasch, B.; Born, J. About Sleep’s Role in Memory. Physiol. Rev. 2013, 93, 681–766. [Google Scholar] [CrossRef]
- Walker, M.P.; Stickgold, R. Sleep-dependent learning and memory consolidation. Neuron 2004, 44, 121–133. [Google Scholar] [CrossRef] [PubMed] [Green Version]
- Stickgold, R. Sleep-dependent memory consolidation. Nature 2005, 437, 1272–1278. [Google Scholar] [CrossRef] [PubMed]
- Gais, S.; Albouy, G.; Boly, M.; Dang-Vu, T.T.; Darsaud, A.; Desseilles, M.; Rauchs, G.; Schanus, M.; Sterpenich, V.; Vandewalle, G.; et al. Sleep transforms the cerebral trace of declarative memories. Proc. Natl. Acad. Sci. USA 2007, 104, 18778–18783. [Google Scholar] [CrossRef] [Green Version]
- Diekelmann, S.; Born, J. The memory function of sleep. Nat. Rev. Neurosci. 2010, 11, 114–126. [Google Scholar] [CrossRef]
- Tononi, G.; Cirelli, C. Sleep and synaptic down-selection. Eur. J. Neurosci. 2020, 51, 413–421. [Google Scholar] [CrossRef] [Green Version]
- Gorgoni, M.; D’Atri, A.; Scarpelli, S.; Reda, F.; De Gennaro, L. Sleep electroencephalography and brain maturation: Developmental trajectories and the relation with cognitive functioning. Sleep Med. 2020, 66, 33–50. [Google Scholar] [CrossRef]
- Angrimann, M.; Caravale, B.; Novelli, L.; Ferri, R.; Bruni, O. Sleep in children with neurodevelopmental disabilities. Neuropediatrics 2015, 46, 199–210. [Google Scholar] [CrossRef] [Green Version]
- Doran, S.M.; Harvey, M.T.; Horner, R.H. Sleep and developmental disabilities: Assessment, treatment and outcome measures. Ment. Retard. 2006, 44, 13–27. [Google Scholar] [CrossRef]
- Scarpelli, S.; Bartolacci, C.; D’Atri, A.; Gorgoni, M.; De Gennaro, L. The functional role of dreaming in emotional processes. Front. Psychol. 2019, 10, 459. [Google Scholar] [CrossRef] [PubMed] [Green Version]
- Gorgoni, M.; Scarpelli, S.; Reda, F.; De Gennaro, L. Sleep EEG oscillations in neurodevelopmental disorders without intellectual disabilities. Sleep Med. Rev. 2020, 49, 101224. [Google Scholar] [CrossRef] [PubMed]
- Ashworth, A.; Hill, C.M.; Karmiloff-Smith, A.; Dimitriou, D. Sleep enhances memory consolidation in children. J. Sleep Res. 2014, 23, 302–308. [Google Scholar] [CrossRef] [PubMed] [Green Version]
- Urbain, C.; Galer, S.; Van Bogaert, P.; Peigneux, P. Pathophysiology of sleep-dependent memory consolidation processes in children. Int. J. Psychophysiol. 2013, 89, 273–283. [Google Scholar] [CrossRef]
- Novelli, L.; Ferri, R.; Bruni, O. Sleep cyclic alternating pattern and cognition in children: A review. Int. J. Psychophysiol. 2013, 89, 246–251. [Google Scholar] [CrossRef]
- Gruber, R.; Wise, M.S. Sleep spindle characteristics in children with neurodevelopmental disorders and their relation to cognition. Neural Plast. 2016, 2016, 4724792. [Google Scholar] [CrossRef] [Green Version]
- Maski, K.; Holbrook, H.; Manoach, D.; Hanson, E.; Kapur, K.; Stickgold, R. Sleep dependent memory consolidation in children with autism spectrum disorder. Sleep 2015, 38, 1955–1963. [Google Scholar] [CrossRef] [Green Version]
- Prehn-Kristensen, A.; Munz, M.; Molzow, I.; Wilhelm, I.; Wiesner, C.D.; Baving, L. Sleep promotes consolidation of emotional memory in healthy children but not in children with attention-deficit hyperactivity disorder. PLoS ONE 2013, 8, e65098. [Google Scholar] [CrossRef] [Green Version]
- Smith, F.R.H.; Gaskell, M.G.; Weighall, A.R.; Warmington, M.; Reid, A.M.; Henderson, L.M. Consolidation of vocabulary is associated with sleep in typically developing children, but not in children with dyslexia. Dev. Sci. 2017, 21, e12639. [Google Scholar] [CrossRef]
- American Psychiatric Association. Diagnostic and Statistical Manual of Mental Disorders, 5th ed.; American Psychiatric Publishing: Arlington, VA, USA, 2013. [Google Scholar]
- Peterson, R.L.; Pennington, B.F. Developmental dyslexia. Lancet 2012, 379, 1997–2007. [Google Scholar] [CrossRef] [Green Version]
- Peterson, R.L.; Pennington, B.F. Developmental dyslexia. Ann. Rev. Clin. Psychol. 2015, 11, 283–307. [Google Scholar] [CrossRef]
- Menghini, D.; Finzi, A.; Benassi, M.; Bolzani, R.; Facoetti, A.; Giovagnoli, S.; Ruffino, M.; Vicari, S. Different underlying neurocognitive deficits in developmental dyslexia: A comparative study. Neuropsychologia 2010, 48, 863–872. [Google Scholar] [CrossRef] [PubMed]
- Fletcher, J.M.; Grigorenko, E.L. Neurpsychology of learning disabilities: The past and the future. J. Int. Neuropsychol. Soc. 2017, 23, 930–940. [Google Scholar] [CrossRef]
- West, G.; Clayton, F.J.; Shankes, D.R.; Hume, C. Procedural and declarative learning in dyslexia. Dyslexia 2019, 25, 246–255. [Google Scholar] [CrossRef] [Green Version]
- Conway, C.M.; Arciuli, J.; Lum, J.A.G.; Ullman, M.T. Seeing problems that may not exist: A reply to West et al.’s (2018) questioning of the procedural deficit hypothesis. Dev. Sci. 2019, 22, e12814. [Google Scholar] [CrossRef]
- Watson, C.; Willows, D.M. Information-processing patterns in specific reading disability. J. Lear. Disabil. 1995, 28, 216–231. [Google Scholar] [CrossRef]
- Menghini, D.; Carlesimo, G.A.; Marotta, L.; Finzi, A.; Vicari, S. Developmental dyslexia and explicit long-term memory. Dyslexia 2010, 16, 213–225. [Google Scholar] [CrossRef]
- Bell, T.K. Rapid sequential processing in dyslexic and ordinary readers. Percept. Mot. Skills 1990, 71, 1155–1159. [Google Scholar] [CrossRef]
- Kibby, M.; Cohen, M. Memory functioning in children with reading disabilities and/or attention deficit/hyperactivity disorder: A clinical investigation of their working memory and long-term memory functioning. Child. Neuropsychol. 2008, 14, 525–546. [Google Scholar] [CrossRef] [Green Version]
- Jones, M.W.; Ashby, J.; Branigan, H.P. Dyslexia and fluency: Parafoveal and foveal influences on rapid automatized naming. J. Exp. Psychol. 2013, 39, 554–567. [Google Scholar] [CrossRef] [PubMed]
- Smith-Spark, J.H.; Moore, V. The representation and processing of familiar faces in dyslexia: Differences in age of acquisition effects. Dyslexia 2009, 15, 129–146. [Google Scholar] [CrossRef] [PubMed]
- Mortimore, T.; Crozier, W.R. Dyslexia and difficulties with study skills in higher education. Stud. High. Edu. 2006, 31, 235–251. [Google Scholar] [CrossRef]
- Smith-Spark, J.H.; Zięcik, A.P.; Sterling, C. Self-reports of increased prospective and retrospective memory problems in adults with developmental dyslexia. Dyslexia 2016, 22, 245–262. [Google Scholar] [CrossRef]
- Carotenuto, M.; Esposito, M.; Cortese, S.; Laino, D.; Verrotti, A. Children with developmental dyslexia showed greater sleep disturbances than controls, including problems initiating and maintaining sleep. Acta Pediatr. 2016, 105, 1079–1082. [Google Scholar] [CrossRef] [Green Version]
- Bruni, O.; Ferri, R.; Novelli, L.; Terribili, M.; Troianello, M.; Finotti, E.; Leuzzi, V.; Curatolo, P. Sleep spindle activity is correlated with reading abilities in developmental dyslexia. Sleep 2009, 32, 1333–1340. [Google Scholar] [CrossRef] [Green Version]
- Bruni, O.; Ferri, R.; Novelli, L.; Finotti, E.; Terribili, M.; Troianello, M.; Valente, D.; Sabatello, U.; Curatolo, P. Slow EEG amplitude oscillations during NREM sleep and reading disabilities in children with dyslexia. Dev. Neuropsychol. 2009, 34, 539–551. [Google Scholar] [CrossRef]
- Mercier, L.; Pivik, R.T.; Busby, K. Sleep patterns in reading disabled children. Sleep 1993, 16, 207–215. [Google Scholar] [CrossRef] [Green Version]
- Siclari, F.; Tononi, G. Local aspects of sleep and wakefulness. Curr. Opin. Neurobiol. 2017, 44, 222–227. [Google Scholar] [CrossRef]
- Ferrara, M.; De Gennaro, L. Going Local: Insights from EEG and Stereo-EEG Studies of the Human Sleep-Wake Cycle. Curr. Top. Med. Chem. 2011, 11, 2423–2437. [Google Scholar] [CrossRef]
- Raven, J.; Raven, J.C.; Court, J.H. Manual for Raven’s Progressive Matrices and Vocabulary Scales; Oxford Psychologists Press: Oxford, UK, 1998. [Google Scholar]
- Wechsler, D. WISC-IV Wechsler Intelligence Scale for Children, Quarta Edizione. Manuale di Somministrazione e Scoring; Giunti OS: Firenze, Italy, 2012. [Google Scholar]
- Cornoldi, C.; Colpo, G. Prove di Lettura MT per la Scuola Elementare-2; Edizioni OS: Firenze, Italy, 1998. [Google Scholar]
- Sartori, G.; Job, R.; Tressoldi, P.E. DDE-2. Batteria per la Valutazione Della Dislessia e Della Disortografia Evolutiva; Edizioni OS: Firenze, Italy, 2007. [Google Scholar]
- Achenbach, T.M.; Rescorla, L.A. Manual for the ASEBA School-Age Forms & Profiles; University of Vermont, Research Center for Children, Youth, & Families: Burlington, VT, USA, 2001. [Google Scholar]
- Bruni, O.; Ottaviano, S.; Guidetti, V.; Romoli, M.; Innocenzi, M.; Cortesi, F.; Giannotti, F. The Sleep Disturbance Scale for Children (SDSC) Construct ion and validation of an instrument to evaluate sleep disturbances in childhood and adolescence. J. Sleep Res. 1996, 5, 251–261. [Google Scholar] [CrossRef]
- Wilhelm, I.; Diekelmann, S.; Born, J. Sleep in children improves memory performance on declarative but not procedural tasks. Learn. Mem. 2008, 15, 373–377. [Google Scholar] [CrossRef] [Green Version]
- Potkin, P.T.; Bunney, W.E., Jr. Sleep improves memory: The effect of sleep on long term memory in early adolescence. PLoS ONE 2012, 7, e42191. [Google Scholar] [CrossRef] [PubMed] [Green Version]
- Barca, L.; Burani, C.; Arduino, L.S. Word naming times and psycholinguistic norms for Italian nouns. Behav. Res. Methods 2002, 34, 424–434. [Google Scholar] [CrossRef] [PubMed] [Green Version]
- Hoedlmoser, K.; Heib, D.P.J.; Roell, J.; Peigneux, P.; Sadeh, A.; Gruber, G.; Schabus, M. Slow sleep spindle activity, declarative memory, and general cognitive abilities in children. Sleep 2014, 37, 1501–1513. [Google Scholar] [CrossRef] [Green Version]
- Holz, J.; Piosczyk, H.; Landmann, N.; Feige, B.; Spiegelhalder, K.; Riemann, D.; Nissen, C.; Voderhlzer, U. The timing of learning before night-time sleep differentially affects declarative and procedural long-term memory consolidation in adolescents. PLoS ONE 2012, 7, e40963. [Google Scholar] [CrossRef] [PubMed]
- Rechtschaffen, A.; Kales, A. A Manual of Standardized Terminology, Techniques and Scoring System for Sleep Stages of Human Subjects; UCLA Brain Information Service: Los Angeles, CA, USA, 1968. [Google Scholar]
- Storey, J.D.; Taylor, J.E.; Siegmund, D. Strong control, conservative point estimation, and simultaneous conservative consistency of false discovery rates: A unified approach. J. R. Stat. Soc. Ser. B Stat. Methodol. 2004, 66, 187–205. [Google Scholar] [CrossRef]
- Ferrarelli, F.; Peterson, M.J.; Sarasso, S.; Riedner, B.A.; Murphy, M.J.; Benca, R.M.; Bria, P.; Kalin, N.H.; Tononi, G. Thalamic dysfunction in schizophrenia suggested by whole-night deficits in slow and fast spindles. Am. J. Psychiatry 2010, 167, 1339–1348. [Google Scholar] [CrossRef] [Green Version]
- Sarasso, S.; Proserpio, P.; Pigorini, A.; Moroni, F.; Ferrara, M.; De Gennaro, L.; De Carli, F.; Lo Russo, G.; Massimini, M.; Nobili, L. Hippocampal sleep spindles preceding neocortical sleep onset in humans. NeuroImage 2014, 86, 425–432. [Google Scholar] [CrossRef]
- Gorgoni, M.; Lauri, G.; Truglia, I.; Cordone, S.; Sarasso, S.; Scarpelli, S.; Mangiaruga, A.; D’Atri, A.; Tempesta, D.; Ferrara, M.; et al. Parietal fast sleep spindle density decrease in Alzheimer’s disease and amnesic mild cognitive impairment. Neural Plast. 2016, 2016, 8376108. [Google Scholar] [CrossRef] [Green Version]
- D’Atri, A.; Novelli, L.; Ferrara, M.; Bruni, O.; De Gennaro, L. Different maturational changes of fast and slow sleep spindles in the first four years of life. Sleep Med. 2018, 42, 73–82. [Google Scholar] [CrossRef] [PubMed]
- Alfonsi., V.; D’Atri, A.; Gorgoni, M.; Scarpelli, S.; Mangiaruga, A.; Ferrara, M.; De Gennaro, L. Spatiotemporal dynamics of sleep spindle sources across NREM sleep cycles. Front. Neurosci. 2019, 13, 727. [Google Scholar] [CrossRef]
- De Gennaro, L.; Ferrara, M. Sleep spindles: An overview. Sleep Med. Rev. 2003, 7, 423–440. [Google Scholar] [CrossRef] [PubMed]
- Schabus, M.; Dang-Vu, T.T.; Albouy, G.; Balteau, E.; Boly, M.; Carrier, J.; Darsaud, A.; Degueldre, C.; Dessilles, M.; Gais, S.; et al. Hemodynamic cerebral correlates of sleep spindles during human non-rapid eye movement sleep. Proc. Natl. Acad. Sci. USA 2007, 104, 13164–13169. [Google Scholar] [CrossRef] [PubMed] [Green Version]
- Hahn, M.; Joechner, A.K.; Roell, J.; Schabus, M.; Heib, D.P.; Gruber, G.; Peigneux, P.; Hoedlmoser, K. Developmental changes of sleep spindles and their impact on sleep-dependent memory consolidation and general cognitive abilities: A longitudinal approach. Dev. Sci. 2019, 22, e12706. [Google Scholar] [CrossRef] [PubMed]
- Willcutt, E.G.; Pennington, B.F. Comorbidity of reading disability and attention-deficit/hyperactivity disorder: Differences by gender and subtype. J. Learn. Disabil. 2000, 33, 179–191. [Google Scholar] [CrossRef] [PubMed]
- Baglioni, C.; Nanovska, S.; Regen, W.; Spielgelhalder, K.; Feige, B.; Nissen, C.; Reynolds, C.F., III; Riemann, D. Sleep and mental disorders: A meta-analysis of polysomnographic research. Pyschol. Bull. 2016, 142, 969–990. [Google Scholar] [CrossRef]
- Fogel, S.M.; Smith, C.T. The function of the sleep spindle: A physiological index of intelligence and a mechanism for sleep-dependent memory consolidation. Neurosci. Biobehav. Rev. 2011, 35, 1154–1165. [Google Scholar] [CrossRef]
- Doran, S. The dynamic topography of individual sleep spindles. Sleep Res. Online 2003, 5, 133–139. [Google Scholar]
- Horwitz, B.; Rumsey, J.M.; Donohue, B.C. Functional connectivity of the angular gyrus in normal reading and dyslexia. Proc. Natl. Acad. Sci. USA 1998, 95, 8939–8944. [Google Scholar] [CrossRef] [Green Version]
- Paulesu, E.; Frith, U.; Snowling, M.; Gallagher, A.; Morton, J.; Frackowiak, R.S.; Frith, C.D. Is developmental dyslexia a disconnection syndrome? Evidence from PET scanning. Brain 1996, 119(pt 1), 143–157. [Google Scholar] [CrossRef]
- Klingberg, T.; Hedehus, M.; Temple, E.; Salz, T.; Gabrieli, J.D.; Moseley, M.E.; Poldrack, R.A. Microstructure of temporoparietal white matter as a basis for reading ability: Evidence from diffusion tensor magnetic resonance imaging. Neuron 2000, 25, 493–500. [Google Scholar] [CrossRef] [Green Version]
- Ben-Shachar, M.; Dougherty, R.F.; Wandell, B.A. White matter pathways in reading. Curr. Opin. Neurobiol. 2007, 17, 258–270. [Google Scholar] [CrossRef] [PubMed]
- Piantoni, G.; Poil, S.-S.; Lonkenkaer-Hansen, K.; Verweij, I.M.; Ramautar, J.R.; Van Someren, E.J.W.; Van Der Werf, Y.D. Individual differences in white matter diffusion affect sleep oscillations. J. Neurosci. 2013, 33, 227–233. [Google Scholar] [CrossRef] [PubMed]
- Shaywitz, S.E.; Shaywitz, B.A. Dyslexia (Specific Reading Disability). Biol. Psychiatry 2005, 57, 1301–1309. [Google Scholar] [CrossRef]
- Dehaene, S. Reading in the Brain: The New Science of How We Read; Penguin: London, UK, 2009. [Google Scholar]
- Astill, R.G.; Van der Heijden, K.B.; Van Ijzendoorn, M.H. Sleep, cognition, and behavioral problems in school-age children: A century of research meta-analyzed. Psychol. Bull. 2012, 138, 1109–1138. [Google Scholar] [CrossRef] [PubMed]
- Safont, G.; Salazar, A.; Vergara, L.; Gòmez, E.; Villanueva, V. Multichannel dynamic modeling of non-Gaussian mixtures. Pattern Recognit. 2019, 93, 312–323. [Google Scholar] [CrossRef]
- Costanzo, F.; Menghini, D.; Caltagirone, C.; Olivieri, M.; Vicari, S. How to improve reading skills in dyslexics: The effect of high frequency rTMS. Neuropsychologia 2013, 51, 2953–2959. [Google Scholar] [CrossRef]
- Costanzo, F.; Varuzza, C.; Rossi, S.; Sdoia, S.; Varvara, P.; Olivieri, M.; Koch, G.; Vicari, S.; Menghini, D. Reading changes in children and adolescents with dyslexia after transcranial direct current stimulation. Neuroreport 2016, 27, 295–300. [Google Scholar] [CrossRef] [PubMed]
- Costanzo, F.; Varuzza, C.; Rossi, S.; Sdoia, S.; Varvara, P.; Olivieri, M.; Koch, G.; Vicari, S.; Menghini, D. Evidence for reading improvement following tDCS treatment in children and adolescents with dyslexia. Restor. Neurol. Neurosci. 2016, 34, 215–226. [Google Scholar] [CrossRef] [Green Version]
- Costanzo, F.; Rossi, S.; Varuzza, C.; Varvara, P.; Vicari, S.; Menghini, D. Long-lasting improvement following tDCS treatment combined with a training for reading in children and adolescents with dyslexia. Neuropsychologia 2019, 130, 38–43. [Google Scholar] [CrossRef] [PubMed]


| DD Mean (SD) (n = 11) | NR Mean (SD) (n = 18) | t(1,27) | p | |
|---|---|---|---|---|
| Age (years, months) | 11.04 (1.67) | 11.72 (1.56) | −1.13 | 0.269 |
| IQ | 111.3 (6.21) | 110.72 (12.37) | 0.14 | 0.9 |
| DDE-2 Word reading | ||||
| Speed1 | 181.46 (69.87) | 76.74 (23.35) | 5.90 | <0.001 |
| Errors | 8.45 (6.36) | 1.72 (2.7) | 3.97 | <0.001 |
| DDE-2 Non-word reading | ||||
| Speed1 | 119.96 (39.4) | 57.7 (19.4) | 5.7 | <0.001 |
| Errors | 14.54 (5.34) | 4.44 (4.13) | 5.72 | <0.001 |
| MT-2 Text reading | ||||
| Speed2 | 1.90 (0.92) | 4.66 (1.2) | −5.9 | <0.001 |
| Errors | 15.10 (5.28) | 3.5 (3) | 5.7 | <0.001 |
| CBCL | ||||
| Internalizing probl. | 50.6 (10.6) | 52.2 (12.4) | −0.25 | 0.81 |
| Externalizing probl. | 48.4 (10) | 48.8 (10.64) | −0.07 | 0.95 |
| Total probl. | 50.6 (9.58) | 50.3 (11.5) | 0.05 | 0.96 |
| SDSC | DD Mean (SD) (n = 11) | NR Mean (SD) (n = 18) | t(1,27) | p |
|---|---|---|---|---|
| DIMS | 11.91 (3.48) | 10.67 (2.70) | 1.08 | 0.291 |
| SBD | 3.73 (0.79) | 4.22 (1.00) | −1.39 | 0.175 |
| DA | 3.36 (0.50) | 3.33 (0.49) | 0.16 | 0.873 |
| SWTD | 8.73 (2.10) | 8.22 (2.21) | 0.61 | 0.548 |
| DOES | 8.00 (2.05) | 7.44 (3.18) | 0.52 | 0.611 |
| SHY | 2.55 (0.93) | 2.89 (1.49) | −0.68 | 0.500 |
| Total Score | 38.27 (6.17) | 36.78 (7.36) | 0.56 | 0.578 |
| WPT Variables | DD Mean (SD) | NR Mean (SD) | t(1,27) | p |
|---|---|---|---|---|
| # of trials to criterion | 3 (0.89) | 2.5 (0.8) | 1.578 | 0.126 |
| # of recalled word pairs in the evening | 16.55 (5.88) | 19.11 (3.95) | −1.408 | 0.171 |
| # of recalled word pairs in the morning | 14 (6.03) | 18.11(4.38) | −2.125 | 0.043 |
| Sleep−dependent consolidation rate | 0.84(0.14) | 0.94 (0.09) | −2.501 | 0.019 |
| Macrostructural Variables | DD Mean (SD) | NR Mean (SD) | t(1,23) | p |
|---|---|---|---|---|
| Latency S1 | 7.91 (136.80) | 13.71 (10.02) | 1.66 | 0.11 |
| Latency S2 | 11.82 (8.80) | 16.63 (11.23) | −1.14 | 0.27 |
| Latency SWS | 25.39 (8.99) | 29.34 (14.34) | −0.77 | 0.45 |
| Latency REM | 173.02 (32.21) | 193.64 (82.47) | −0.75 | 0.46 |
| Duration S1 | 8.00 (5.95) | 11.24 (8.64) | −1.03 | 0.31 |
| Duration S2 | 280.53 (67.83) | 289.78 (58.27) | −036 | 0.72 |
| Duration SWS | 91.43 (25.16) | 91.24 (22.97) | 0.02 | 0.98 |
| Duration REM | 106.49 (34.33) | 104.03 (31.27) | 0.19 | 0.85 |
| Duration NREM | 379.96 (56.64) | 391.93 (57.08) | −0.52 | 0.61 |
| % S1 | 1.70 (1.24) | 2.42 (1.93) | −1.04 | 0.31 |
| % S2 | 51.17 (8.23) | 58.13 (5.73) | −0.34 | 0.73 |
| % REM | 21.56 (4.83) | 20.70 (4.69) | 0.45 | 0.66 |
| % NREM | 78.44 (4.83) | 79.24 (4.78) | −0.41 | 0.69 |
| % SWS | 19.56 (8.08) | 18.74 (5.46) | 0.30 | 0.76 |
| WASO | 38.80 (31.12) | 55.71 (46.31) | −1.01 | 0.32 |
| TST | 486.46 (77.95) | 496.24 (75.56) | −0.31 | 0.76 |
| TBT | 534.50 (57.06) | 566.35 (46.63) | −1.53 | 0.14 |
| # MA | 53.80 (19.00) | 69.93 (27.55) | −1.61 | 0.12 |
| SEI (%) | 90.63 (7.80) | 86.58 (8.98) | 1.16 | 0.26 |
| SOL (min) | 11.98 (8.86) | 16.35 (11.38) | −1.05 | 0.31 |
| Macrostructural Variables | DD Rho (p) | NR Rho (p) |
|---|---|---|
| Latency S1 | 0.26 (0.47) | −0.02 (0.95) |
| Latency S2 | 0.05 (0.88) | 0.03 (0.91) |
| Latency SWS | −0.05 (0.89) | −0.01 (0.97) |
| Latency REM | 0.03 (0.93) | 0.04 (0.89) |
| Duration S1 | −0.33 (0.35) | 0.09 (0.74) |
| Duration S2 | −0.36 (0.31) | 0.01 (0.98) |
| Duration SWS | 0.24 (0.51) | −0.23 (0.41) |
| Duration REM | −0.60 (0.07) | −0.18 (0.53) |
| Duration NREM | −0.26 (0.47) | −0.03 (0.90) |
| % S1 | −0.02 (0.96) | 0.11 (0.69) |
| % S2 | −0.08 (0.83) | 0.07 (0.81) |
| % REM | −0.60 (0.07) | −0.19 (0.49) |
| % NREM | 0.60 (0.07) | 0.18 (0.51) |
| % SWS | 0.55 (0.10) | −0.07 (0.81) |
| WASO | 0.24 (0.51) | 0.16 (0.56) |
| TST | −0.45 (0.19) | 0.07 (0.79) |
| TBT | −0.50 (0.19) | −0.08 (0.79) |
| # MA | − 0.33(0.35) | −0.15 (0.58) |
| SEI (%) | −0.28 (0.43) | −0.14 (0.62) |
| SOL (min) | 0.05 (0.88) | 0.05 (0.86) |
Publisher’s Note: MDPI stays neutral with regard to jurisdictional claims in published maps and institutional affiliations. |
© 2021 by the authors. Licensee MDPI, Basel, Switzerland. This article is an open access article distributed under the terms and conditions of the Creative Commons Attribution (CC BY) license (http://creativecommons.org/licenses/by/4.0/).
Share and Cite
Reda, F.; Gorgoni, M.; D'Atri, A.; Scarpelli, S.; Carpi, M.; Di Cola, E.; Menghini, D.; Vicari, S.; Stella, G.; De Gennaro, L. Sleep-Related Declarative Memory Consolidation in Children and Adolescents with Developmental Dyslexia. Brain Sci. 2021, 11, 73. https://doi.org/10.3390/brainsci11010073
Reda F, Gorgoni M, D'Atri A, Scarpelli S, Carpi M, Di Cola E, Menghini D, Vicari S, Stella G, De Gennaro L. Sleep-Related Declarative Memory Consolidation in Children and Adolescents with Developmental Dyslexia. Brain Sciences. 2021; 11(1):73. https://doi.org/10.3390/brainsci11010073
Chicago/Turabian StyleReda, Flaminia, Maurizio Gorgoni, Aurora D'Atri, Serena Scarpelli, Matteo Carpi, Erica Di Cola, Deny Menghini, Stefano Vicari, Giacomo Stella, and Luigi De Gennaro. 2021. "Sleep-Related Declarative Memory Consolidation in Children and Adolescents with Developmental Dyslexia" Brain Sciences 11, no. 1: 73. https://doi.org/10.3390/brainsci11010073