Predicting the Effects of Climate Change on the Occurrence of the Toxic Dinoflagellate Alexandrium catenella Along Canada’s East Coast
 Aude Boivin-Rioux
 Michel Starr
 Joël Chassé
 Michael Scarratt1
  Zhenxia Long
- 1Maurice Lamontagne Institute, Department of Fisheries and Oceans Canada, Mont-Joli, QC, Canada
- 2Gulf Fisheries Centre, Department of Fisheries and Oceans Canada, Moncton, NB, Canada
- 3Bedford Institute of Oceanography, Department of Fisheries and Oceans Canada, Dartmouth, NS, Canada
Alexandrium catenella produces paralytic shellfish toxins that affect marine fisheries and aquaculture as well as ecosystem and human health worldwide. This harmful algal species is extremely sensitive to environmental conditions and potentially to future climate change. Using a generalized additive mixed model (GAMM) we studied the potential effects of changing salinity and temperatures on A. catenella bloom (≥1000 cells L–1) occurrence along Canada’s East Coast throughout the 21st century. Our GAMM was applied to two high greenhouse gas emissions scenarios (RCP 8.5) and one mitigation scenario (RCP 4.5). Under present-day conditions, our model successfully predicted A. catenella’s spatio-temporal distribution in Eastern Canada. Under future conditions, all scenarios predict increases in bloom frequency and spatial extent as well as changes in bloom seasonality. Under one RCP 8.5 scenario, A. catenella bloom occurrences increased at up to 3.5 days per decade throughout the 21st century, with amplified year-to-year variability. Blooms expanded into the Gulf of St. Lawrence and onto the Scotian Shelf. These conditions could trigger unprecedented bloom events in the future throughout our study region. In all climate scenarios, the bloom season intensified earlier (May–June) and ended later (October). In some areas of the Gulf of St. Lawrence, the thermal habitat of A. catenella was exceeded, thereby locally reducing bloom risk during the summer months. We conclude that an increase in A. catenella’s environmental bloom window could further threaten marine fauna including endangered species as well as fisheries and aquaculture industries on Canada’s East Coast. Similar impacts could be felt in other coastal regions of the globe where warming and freshening of waters are intensifying.
Introduction
Harmful algal blooms (HABs), as defined by the UNESCO, designate proliferations of microalgae that are detrimental to public health, local marine fauna, fisheries and the aquaculture industry. The worldwide socio-economic threat posed by HABs is often linked to marine dinoflagellates, such as Alexandrium spp. (Anderson et al., 2012). Formation of long-lasting cysts at the end of the blooming season allows for recurrent Alexandrium spp. blooms. In this study we focus on Alexandrium catenella (previously known as Alexandrium tamarense), a widespread alga that produces paralytic shellfish toxins (PSTs). PSTs bioaccumulate in tissues of shellfish and zooplankton, making filter-feeding invertebrates highly neurotoxic to marine fish, mammals and birds when ingested (Shumway, 1990; Bricelj and Shumway, 1998; Cembella et al., 2002; Landsberg, 2009; Starr et al., 2017). Bioaccumulation of PSTs also prevents human consumption of contaminated shellfish, such as the economically valuable blue mussel Mytilus edulis (Etheridge, 2010). Bloom events often lead to mussel farm and aquaculture closures in affected areas (Blasco et al., 2003; Díaz et al., 2019). Aquaculture sites along Canada’s East Coast are affected by A. catenella when favorable environmental conditions occur (Bates et al., 2020; McKenzie et al., 2020).
It has been reported that A. catenella excystment, growth and bloom occurrence are largely controlled by oceanographic conditions (McGillicuddy et al., 2011; Condie et al., 2019). High sea surface temperature and low sea surface salinity have been identified as favorable to A. catenella (Weise et al., 2002; Fauchot et al., 2005; Ní Rathaille and Raine, 2011; Starr et al., 2017). Sea surface salinity decreases associated with high runoff were also linked to higher stratification and the presence of humic substances, which were found to stimulate A. catenella growth (Gagnon et al., 2005). High wind speeds > 20 km h–1 associated with mixing of the water column inhibit A. catenella bloom events (Weise et al., 2002; Fauchot et al., 2005). Other variables that influence A. catenella life history are nutrients (Fauchot et al., 2005; Collos et al., 2007; McGillicuddy et al., 2011), pH and CO2 (Raven et al., 2020). Changes in these environmental factors are expected under a warming climate (Long et al., 2016; Lavoie et al., 2017; IPCC, 2019).
Alexandrium catenella hotspots are widespread along the Canadian East Coast. Known hot spots include the Estuary and Gulf of St. Lawrence (EGSL), the Bay of Fundy (BoF) and the Gulf of Maine (GoM), where fisheries and aquaculture closures are often linked to A. catenella toxins (McGillicuddy et al., 2011; Bates et al., 2020; McKenzie et al., 2020). Furthermore, toxic bloom initiation is frequently associated with increased freshwater input in these regions (Weise et al., 2002; Keafer et al., 2005; Starr et al., 2017). On the Canadian East Coast, climate change is expected to alter sea surface temperature as well as the hydrological cycle, including an earlier spring freshet, and a more intense runoff overall (Long et al., 2016; IPCC, 2013). This new input of fresher, warmer water could have important repercussions on A. catenella occurrence along the coast. Effects of climate change on oceanographic conditions are expected to alter A. catenella bloom frequency, duration and amplitude (Hallegraeff, 2010; Townhill et al., 2018; Trainer et al., 2020) and are already causing range shifts in some phytoplankton species (Barton et al., 2016; Gobler et al., 2017). Furthermore, higher CO2 concentrations as well as higher temperatures in temperate regions might increase harmful algae growth rates and toxicity (Brandenburg et al., 2019; Roggatz et al., 2019). In this perspective, predicting bloom events is becoming increasingly important in order to better understand climate change effects on A. catenella bloom frequency, spatial extent and temporal variability.
To date, various simple modeling approaches, such as regression-based models, have been used to predict HABs worldwide (Lane et al., 2009; Anderson et al., 2010; Raine et al., 2010; Cusack et al., 2016; Dabrowski et al., 2016). While valuable, simple models are not flexible enough to account for multiple non-linear predictors or for underlying random effects (Wood, 2017). Furthermore, very complex models, such as machine learning approaches (Valbi et al., 2019) and hydrodynamic/oceanographic models (Fauchot et al., 2008; Aleynik et al., 2016; Gillibrand et al., 2016) can require time-intensive and costly computer calculations that are less suitable for daily to weekly predictions on a large spatio-temporal scale. In the present study, we investigate a new approach to HAB modeling and prediction that combines flexibility, simplicity and computing cost-effectiveness. In order to understand how climate change could affect HABs along Canada’s East Coast, we developed a generalized additive mixed model (GAMM) that can predict A. catenella occurrence using an ecological (realized) niche approach (Yee and Mitchell, 1991; Guisan et al., 2002). We ran the GAMM with downscaled simulations from two Earth system models (CanESM2 and MPI-ESM-LR) under two climate scenarios (RCP 4.5 and 8.5) projected throughout the 21st century.
Materials and Methods
A. catenella Database and Environmental Conditions
Data of A. catenella abundances for biological model fitting were obtained from the DFO/IML harmful algae monitoring program (DFO-HAB) spanning the period, 1994–2017, at 12 recurrent coastal monitoring stations located across the EGSL on the Canadian East Coast (Figure 1). The stations were regularly sampled (usually on a weekly basis – notably for the 1999–2008 period) from May to October. Sampling included A. catenella abundance as well as sea surface temperature (SST), sea surface salinity (SSS), sea surface concentrations of nitrite (NO2–), nitrate (NO3–), silicate (SiO4–), phosphate (PO32–), and Secchi disk depth. A total of 5373 samples were retrieved throughout the 23 y monitoring period. Environmental and phytoplankton data were collected as described in Starr et al. (2017).
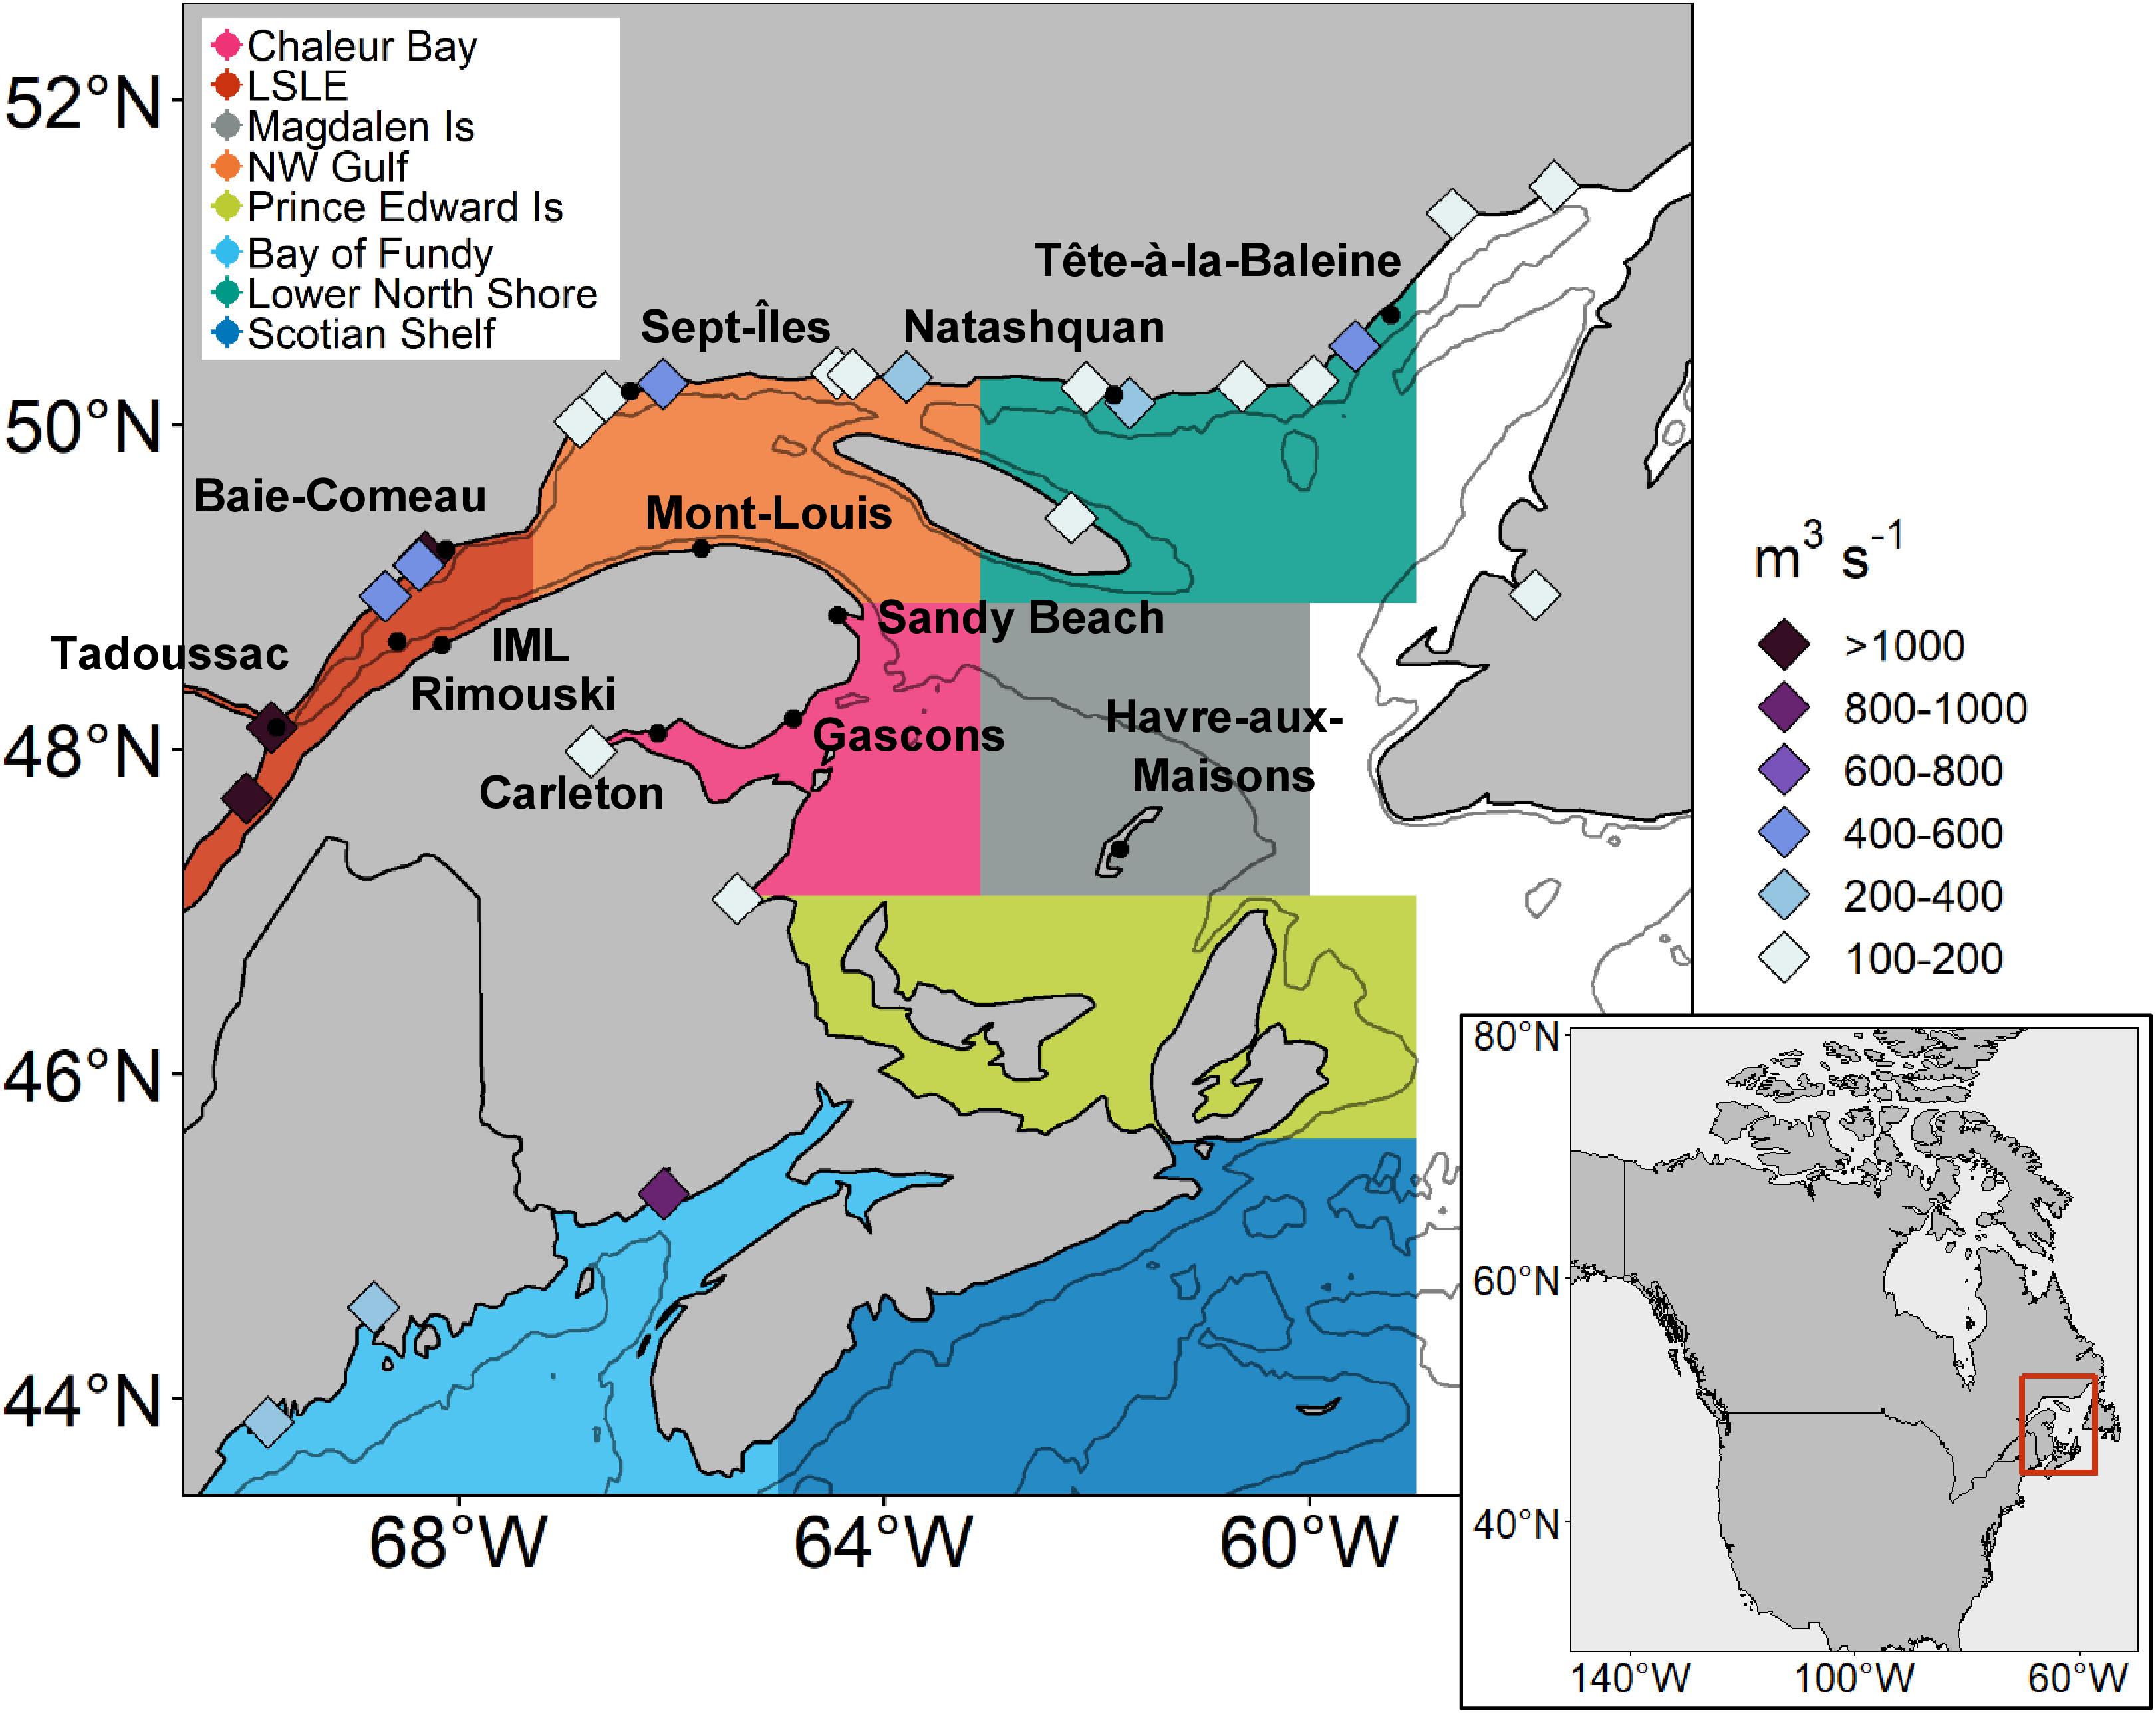
Figure 1. Map of the Atlantic coast of Canada. Names of harmful algae sampling stations are in bold and their locations are indicated by black dots. Extent of the regional boxes are defined by colored polygons. Hundred meter bathymetry is indicated by gray contour lines. Main rivers (with average discharge > 100 m3 s− 1) and their average discharge between 1999 and 2008 are indicated by diamonds.
To complete this dataset, we also extracted continuous atmospheric measurements from Environment and Climate Change Canada’s historical climate data archives1. Extracted variables were precipitation summed over 1, 3, and 7 days (PΣ1,3,7), wind speed averaged over 1, 3, and 7 days (1,3,7) and wind direction averaged over 1, 3 and 7 days (1,3,7). We chose meteorological stations that best represented conditions at the DFO-HAB monitoring sites. The criteria for their selection included station height above sea level (<100 m), distance from sampling site (<50 km) and general near-coast location. When data had not been collected at the same meteorological station for all 23 y covered by the HAB monitoring program, then to complete the data set, we used data from new meteorological stations located near the previous stations.
GAMM Fitting for A. catenella Bloom Occurrences
All GAMMs and associated statistics were computed using R (R Core Team, 2018), with a 95% confidence interval (α = 0.05). The algae count data were zero-inflated (>80% of our count data were zeros) and abundance modeling with a Poisson distribution was deemed inappropriate (Zuur, 2012). Instead, we fitted an occurrence model using a binomial distribution to illustrate A. catenella presence (1) or absence (0). In the present paper, samples containing ≥ 1000 A. catenella cells L–1 were considered as presence days at bloom level, and were expressed in “risk-days.” We selected this occurrence threshold by taking into account A. catenella associated risks, such as the toxin bioaccumulation in mussels at the level at which they become unsafe for human consumption and cause the closure of shellfish harvesting activities (Blasco et al., 2003). We performed our modeling using a logit link function implemented in package mgcv (Wood, 2017). Smoothing functions for the predictors were based on thin plate regression splines (s) as described by Wood (2003).
Week, month, and year of sampling, SST, SSS, NO2–, NO3–, SiO4–, PO32–, Secchi disk depth, PΣ1,3,7, 1,3,7, and 1,3,7 were used as initial predictor variables for the model. These variables were chosen by considering their potential effects on A. catenella excystment, growth and bloom occurrence (Parkhill and Cembella, 1999; Weise et al., 2002; Fauchot et al., 2005; McGillicuddy et al., 2011; Starr et al., 2017). To assess model collinearity, we used Pearson’s correlations.
Multiple variable combinations were considered through the process of model selection. Only combinations of the statistically significant variables were tested for GAMM fitting. In our full model, time markers (week, month, and year), SSS, SST, NO3–, and PΣ3 were significant. PΣ3 and NO3– were excluded from our model since they were less significant compared to SSS. We used combinations of remaining variables to fit an ensemble of GAMMs that we evaluated through cross-validation as described in Albouy-Boyer et al. (2016). Random selection was used to generate a training set comprised of 70% of our full data set. The remainder (30%) was used for validation. The Akaike Information Criterion (AIC) was used as a first marker of model quality. We chose the final model in regards to its predictive power using the True Skill Statistic (TSS; Allouche et al., 2006) and the Area Under the Curve statistic (AUC; Fielding and Bell, 1997). Our best model for predictions of A. catenella presence at ≥1000 cells L–1 was based on SST and SSS. This selected model was appropriate for climatic predictions (decadal scale) on a large spatial scale and was named the HARM (Harmful Algae Risk Model- Equation 1).
To take into account spatial patterns potentially present in the data, sampled stations (Station) were added to the model as a random effect (bs = “re”). Temporal autocorrelation was calculated by means of full and partial autocorrelation function plots following model fitting. Since a lag of approximately 20–30 days was detected in our model, a second order autoregressive moving average process nested within each year sampled was included. We transformed predictions to presence/absence data with a threshold determined by an approach that maximizes (sensibility + sensitivity)/2 (Freeman and Moisen, 2008).
A. catenella-Ocean Model and Validation
The HARM was used in conjunction with a Regional Ocean Model, named CANOPA, developed by Brickman and Drozdowski (2012) for the EGSL, the Scotian Shelf, and the BoF/GoM to model and study the occurrence of A. catenella blooms under current and future atmospheric and oceanographic forcing. This regional ice-ocean model is based on the code from the Nucleus for European Modeling of the Ocean (NEMO) and includes ice cover, tides, oceanic surface momentum, heat and salt fluxes. The grid features a horizontal resolution of 1/12° (∼6.5 km) and a vertical resolution of 46 vertical layers with vertical thickness resolutions varying from 6 m at the surface to 250 m at 5000 m depths. The model includes runoff from 78 main rivers to account for the freshwater fluxes into the domain (main rivers and their average discharge are shown in Figure 1). A simulation for the 1999–2008 periods using the updated atmospheric conditions obtained from the National Centers for Environmental Predictions (NCEP) was successfully compared to field data including temperature and salinity in the EGSL, Scotian Shelf, and BoF/GoM (Kalnay et al., 1996; Brickman and Drozdowski, 2012; Lavoie et al., 2017). This hindcast of daily temperature and salinity was first used to test predictive capabilities of the HARM to predict A. catenella risk-days from May through October 1999–2008 in the EGSL. We compared hindcasted predictions for A. catenella to field observations coming from the DFO-HAB monitoring program to look for spatial and temporal coherencies. Since monitoring stations were not sampled every day, field results needed to be adjusted for visual comparisons with our daily predictions. To achieve this, sums of bloom occurrences for every month and every year, sampled at the monitoring stations, were multiplied by the 1999–2008 average number of days between samples (namely by 7.8 days).
Future Predictions of A. catenella Bloom Occurrences
Future A. catenella bloom occurrences were obtained by the HARM using daily SST and SSS predictions obtained from CANOPA under future atmospheric, hydrologic and boundary oceanic conditions. The future atmospheric conditions were obtained from three downscaled climate scenarios adapted to our study region using the Canadian Regional Climate Model (CRCM), following Long et al. (2016). Three oceanic simulations with high frequency output were performed separately with the CRCM downscaled forcing, as driven by the coarser resolution global simulations, by the Earth System Model (ESM) MPI-ESM-LR, under the representative concentration pathway (RCP) scenarios 8.5 and 4.5 and, as a comparison, the Canadian Earth System Model (CanESM2) under RCP 8.5 (Chylek et al., 2011; Giorgetta et al., 2013; IPCC, 2013). MPI-ESM-LR was first selected as a model because of its global performance in reproducing the historical conditions in the Northwest Atlantic region (Lavoie et al., 2013); one of the most dynamically complex regions of the globe with cold and low salinity waters flowing southward from the Labrador Sea and warm and saline waters flowing northward with the Gulf Stream. We are confident that these key oceanographic processes, which can influence our bordering model conditions (and per se our predictions), are well represented by the MPI-ESM-LR RCP 4.5 and RCP 8.5 scenarios. The second model, CanESM2, that is structurally different to MPI-ESM-LR, was arbitrarily selected among the other CMIP5 multi-model ensemble prior to have in hand a complete high-frequency downscaling ensemble for the region. In terms of future atmospheric CO2 emissions, RCP 4.5 is a scenario in which mitigation occurs and greenhouse gas emissions are slowed by 2050. RCP 8.5 is considered a “business as usual” scenario in which anthropogenic CO2 emissions continue to increase until 2100. It is important to note here that predictions of the future evolution of regional oceanic conditions include changes in runoff of the 78 rivers included in the CANOPA model, such as estimated from Lambert et al. (2013)’s hydrological model, which uses precipitation and temperature outputs from the CRCM downscaling of the ESMs’ atmospheric conditions.
From the HARM predictions, we extracted averages of the number of risk-days for each model cell from May through October for decades 1999–2008, 2050–2059, and 2090–2099. Monthly numbers of risk-days were also computed for these decades. The differences in risk-days (ΔDays) were also computed between years 2050–2059 and 1999–2008 (Δ2050–2059) as well as between 2090–2099 and 1999–2008 (Δ2090–2099) in order to highlight the long-term trends and mitigate the biases of the model (overestimations/underestimations). In addition, we present the full time series (2001–2099) of the predicted average number of risk-days from May through October using the MPI-ESM-LR RCP 8.5 predictions. These results are presented for eight “regions” in order to look into spatio-temporal variations of A. catenella risk-days throughout our study area (Figure 1). For each region, we computed simple linear models to investigate how the average number of risk-days varied as a function of time during the next decades. Numbers of risk-days y–1 averaged over each region were obtained using Equation 2, where the grid cell area is in km2.
Additionally, we computed a simple linear model in each grid cell to determine how the number of risk-days varied as a function of time throughout our domain.
Year of emergence of the climate signal (Hawkins and Sutton, 2011) was also estimated for A. catenella bloom occurrence patterns and defined as the year when the long-term trend line is above the mean of the contemporary period + 1 SD. Here, we used the 2001–2020 period as a contemporary reference. In addition, we computed the climate signal emergence time defined as the difference between the year of emergence of the climate signal and the year corresponding to the middle of the contemporary period (Hawkins and Sutton, 2011).
Results
The HARM has two significant predictor variables, SST (p < 2∗10–16) and SSS (p < 2∗10–16), that amount to a TSS of 0.62 and an AUC of 0.88, which are considered as “useful” and “good” modeling capabilities respectively, according to Zhang et al. (2015). Differences between internal and external validation statistics are very small (TSS SD = 0.03), showing that the model can produce accurate predictions on a wide range of data points in the EGSL (Table 1). Partial residuals showed the positive influence of predictors on A. catenella presence when SST was between 9 and 19°C (optimal value: 14°C) and SSS was between 15 and 28 (optimal value: 23) (Table 1 and Figure 2).
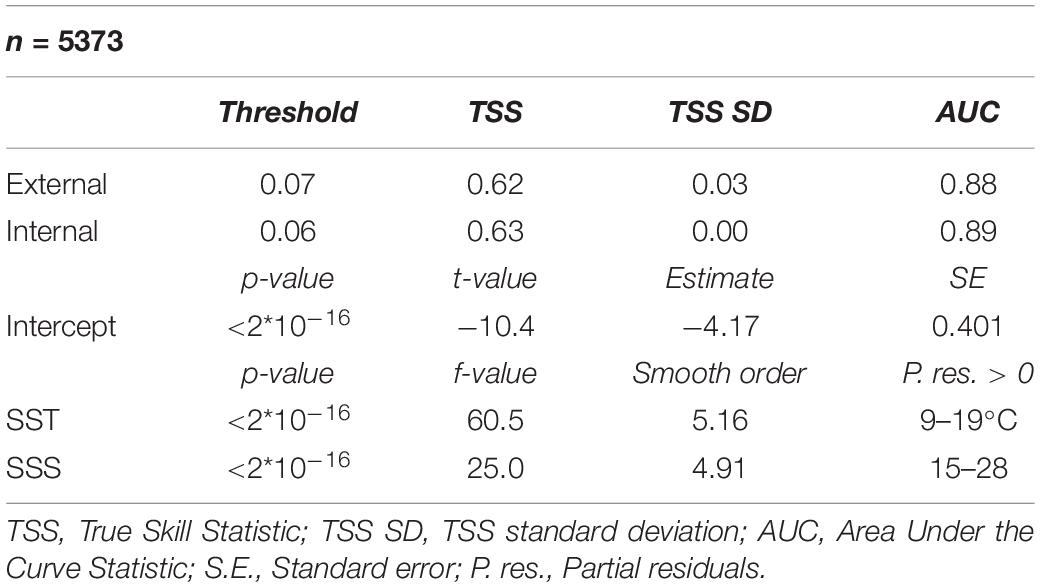
Table 1. Generalized additive mixed model results.
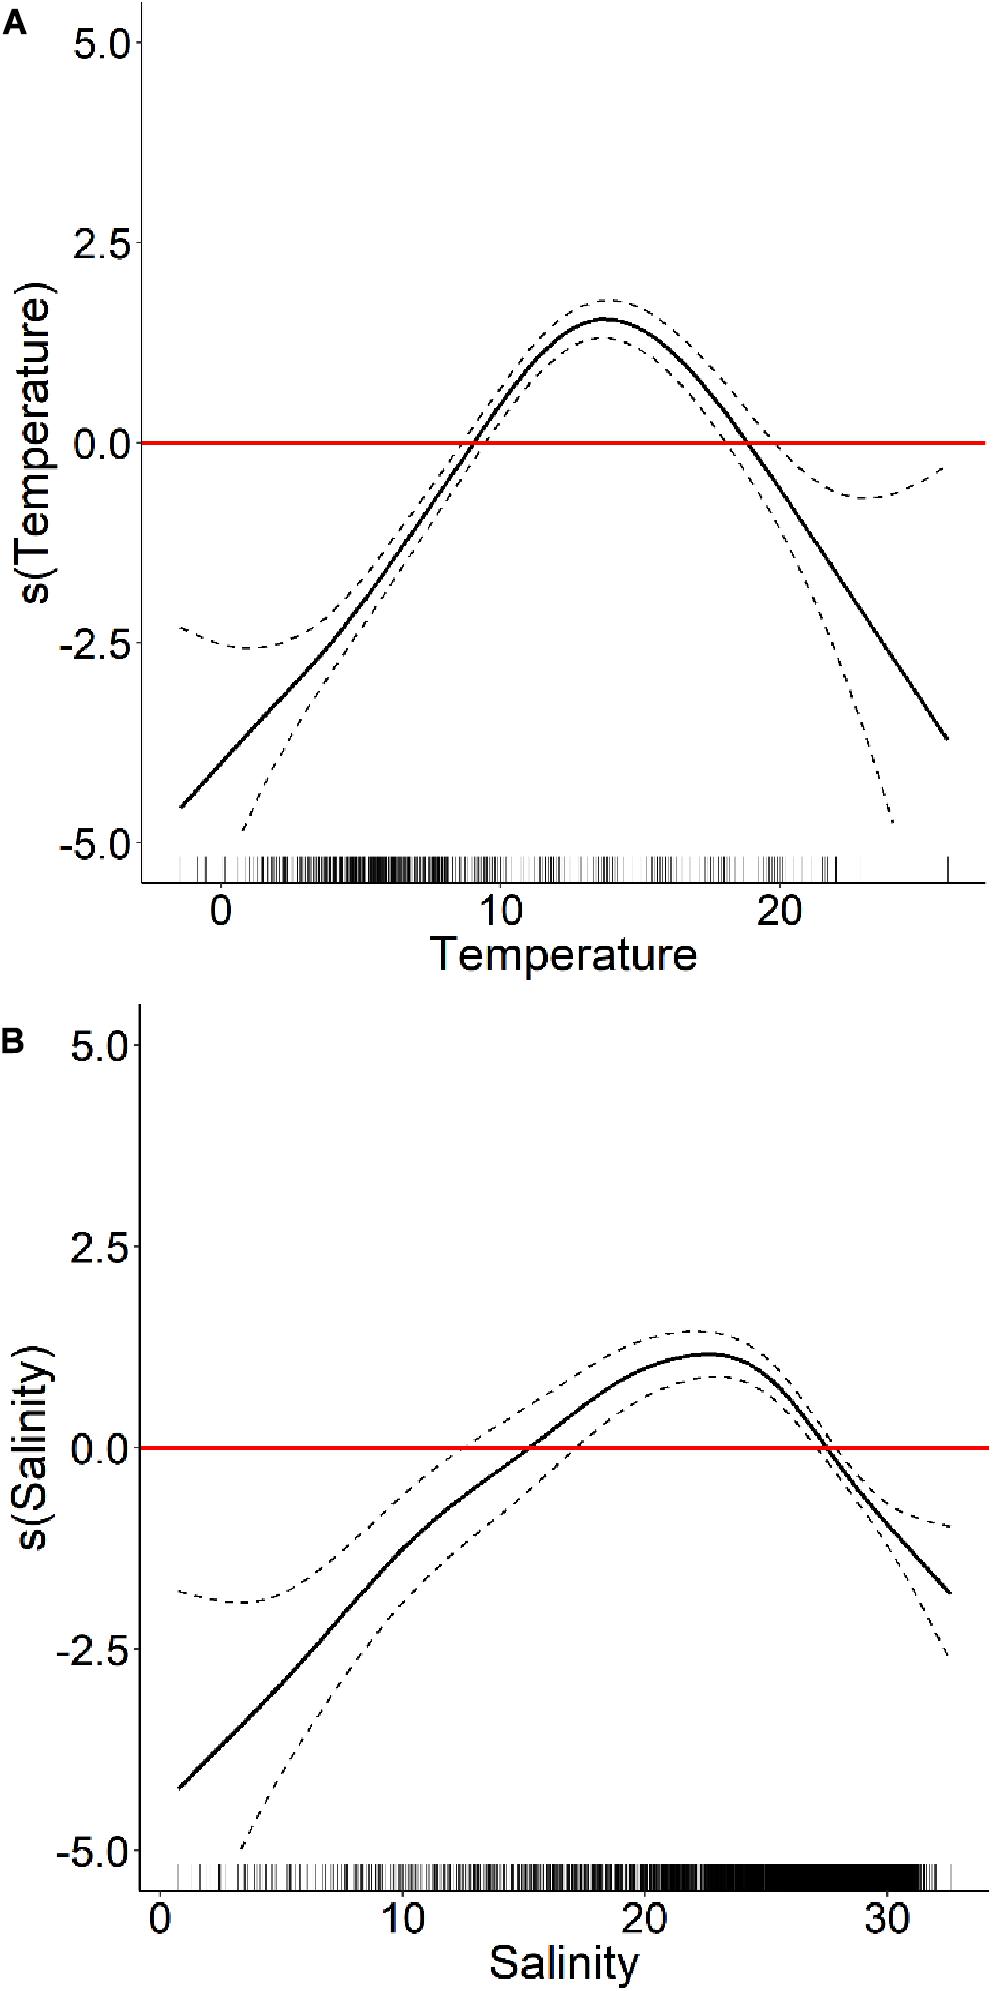
Figure 2. Generalized additive mixed model partial response curves (black line) ± standard deviation (black dashed line) showing the influence of (A) sea surface temperature and (B) sea surface salinity on Alexandrium catenella occurrence (bloom events ≥ 1000 A. catenella cells L− 1) in the Estuary and Gulf of St. Lawrence. The red line indicates a neutral influence of the predictor variable on the presence of A. catenella.
A. catenella Ocean Model Validation
The hindcasted predictions of A. catenella obtained with the HARM using daily SST and SSS from the CANOPA ocean model with NCEP past atmospheric forcing fields were compared to field observations. Figures 3, 4 show that the predictions reproduced relatively well the observed distribution patterns of maxima and minima, as well as spatial extent and seasonal variability of A. catenella risk-days. Overall, the model of risk-days over May–October statistically matched A. catenella observations (AUC = 0.68). Temporal predictions of A. catenella risk-days were visually similar to observations made from May through October 1999–2008, and the large spatial extent simulated in July successfully matched observations (Figures 3, 4). Indeed, the hindcast’s number of risk-days throughout the months of June, July, and August has a good fit (AUC = 0.64, 0.60, and 0.69, respectively). Although AUCs were much lower for May and October (Figure 4), the model is skillful enough in reproducing the very low or non-existent observations for these months. Close examination of predictions and observations reveals nevertheless that our model somewhat overestimates the frequency of risk-days at certain stations – notably along the southern shore of the St. Lawrence Estuary and in Chaleur Bay. For example, through the May–October average, the maximum number of risk-days is 101 for hindcasted data whereas the adjusted observed data show a maximum of 37 risk-day y–1 (Figure 3). Monthly patterns show a similar overestimation, with hindcasts showing maxima of 31 risk-day along the southern shore of the LSLE (Lower St. Lawrence Estuary) compared with a maximum of 16 risk-day A. catenella adjusted observations in July (Figure 4). Overestimations near the Gaspé Peninsula and in Chaleur Bay are notable during August, September and October. In spite of these overestimations, the predictions of the HARM reproduced well the bloom recurrence in the EGSL.
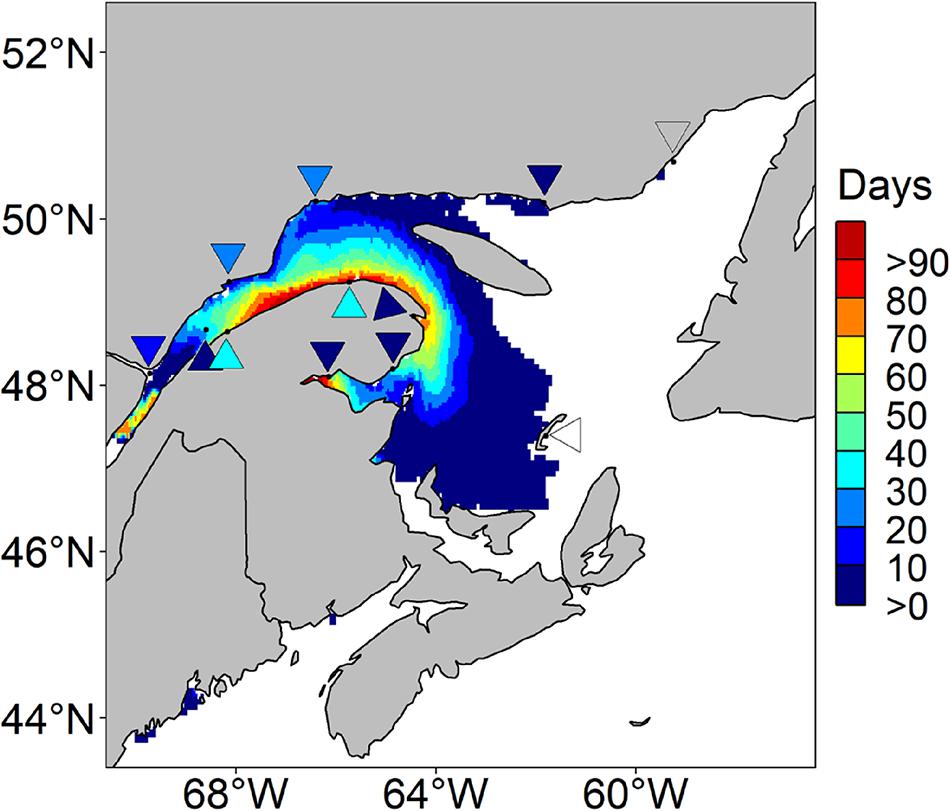
Figure 3. Average number of risk days with Alexandrium catenella ≥ 1000 cells L− 1 from May through October in the Estuary and Gulf of St. Lawrence. Hindcasted risk days (map) and adjusted observed days (reversed triangles) are presented from 1999 through 2008, inclusively.
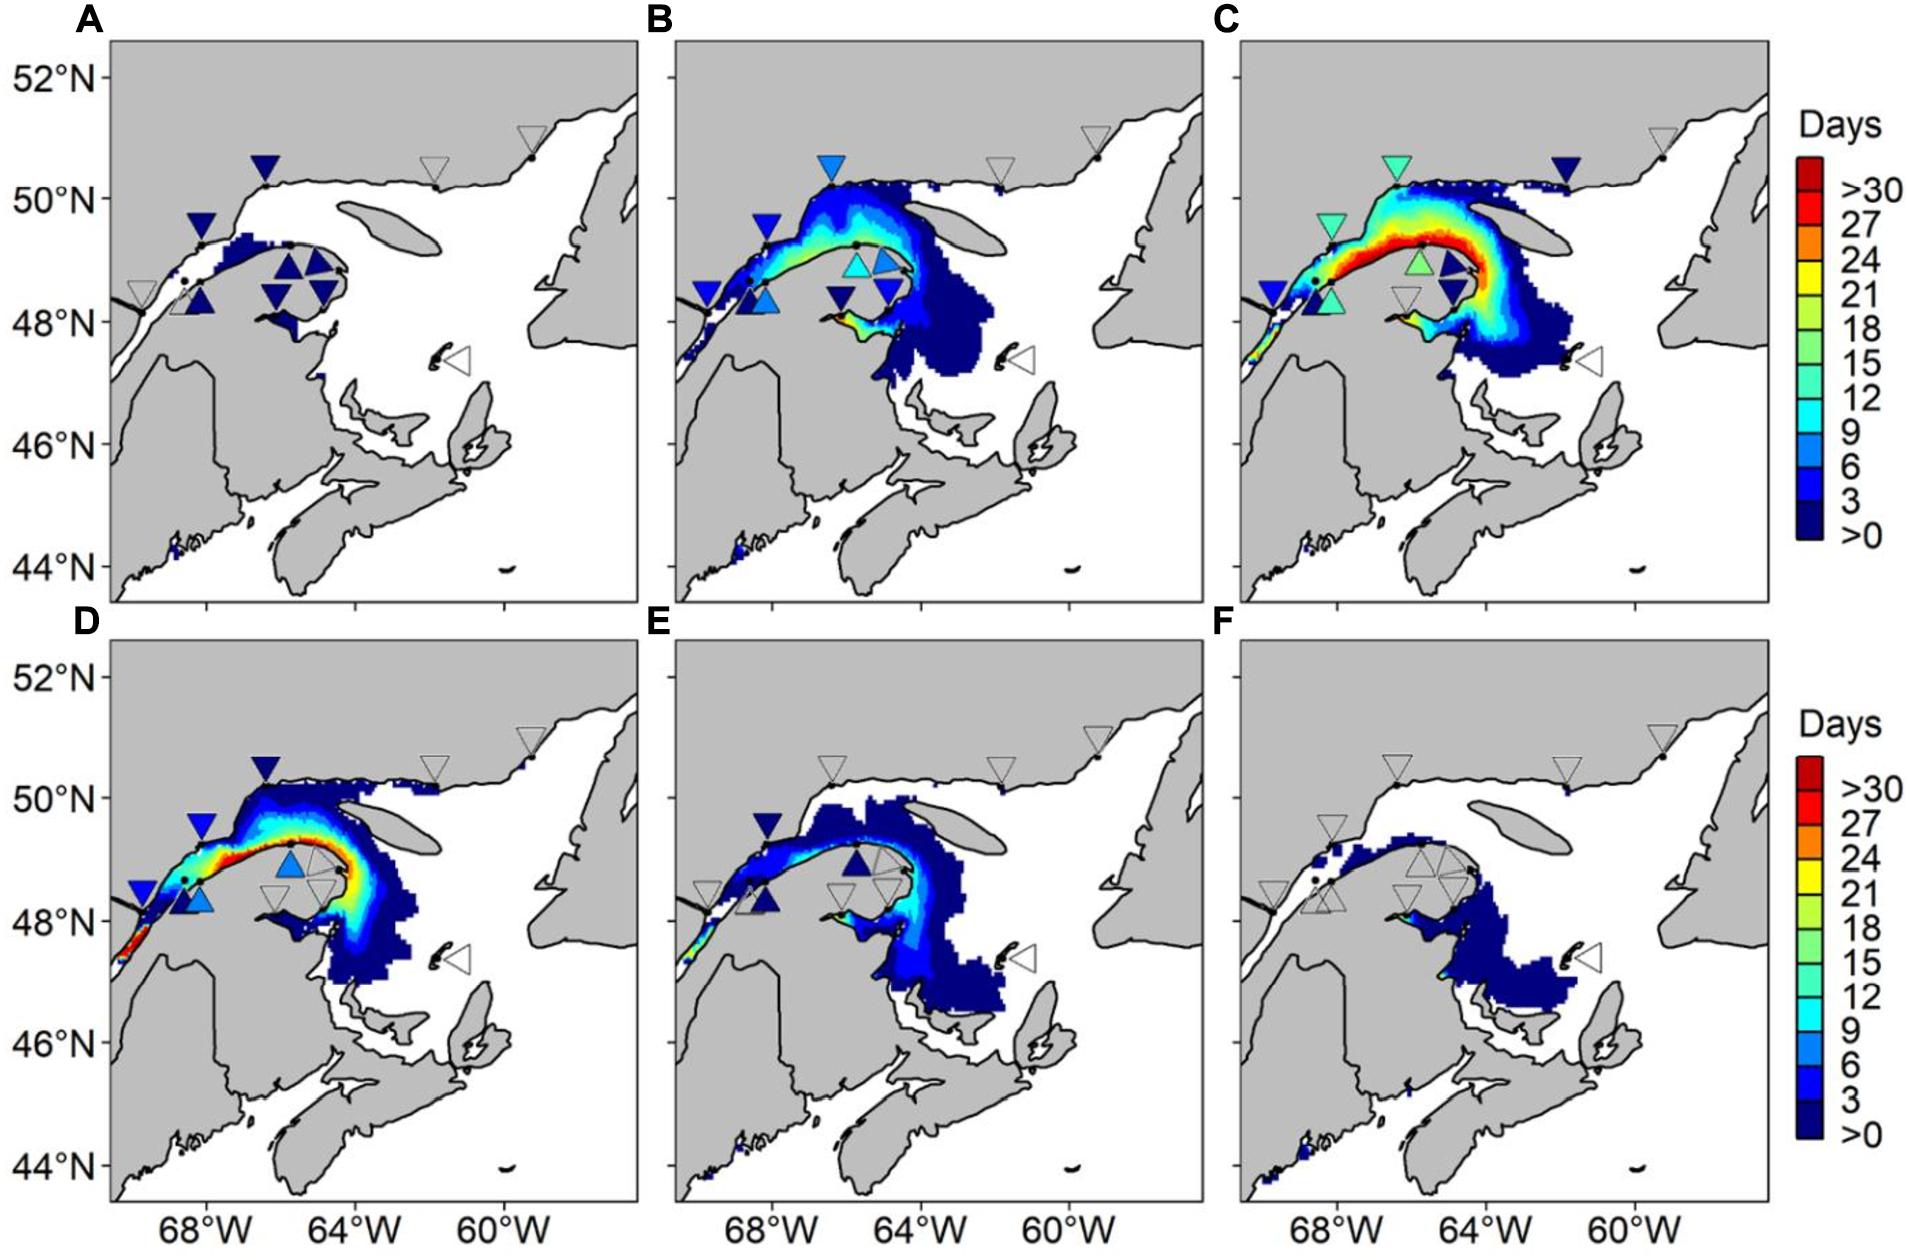
Figure 4. Average number of risk days with Alexandrium catenella ≥ 1000 cells L− 1 for the month of (A) May, (B) June, (C) July, (D) August, (E) September, and (F) October in the Estuary and Gulf of St. Lawrence. Hindcasted risk days (map) and adjusted observed days (reversed triangles) are presented from 1999 to 2008, inclusively.
Future Predictions of A. catenella Occurrences Under the MPI-ESM-LR RCP 4.5 Scenario
Predicted data for decade 1999–2008 under MPI-ESM-LR RCP 4.5 are relatively comparable with our hindcast using NCEP past atmospheric forcings, showing a maximum of 97 risk-day y–1 on the South shore of the St. Lawrence Estuary, along the Gaspé peninsula (Figure 5). Risk-days along the Gaspé peninsula remain high in 2050–2059 and 2090–2099, with a maxima of 111 and 108 risk-day y–1, respectively. Zones near rivers along the Lower North Shore show up to 20 risk-day y–1 in 2090–2099, where no risk-days were reported during the 1999–2008 reference period. In 2090–2099, up to 30 risk-day y–1 are also predicted along the northern coastline of Prince Edward Island (PEI) and risk-days extend to the Scotian Shelf. For Δ2090-2099, an increase of up to 30 risk-day y–1 is recorded in the BoF, near Penobscot Bay. Maximum increases of 42 and 57 risk-day y–1 in the EGSL are forecasted for Δ2050–2059 and Δ2090–2099, respectively. Differences in the monthly number of risk-days are highest in June, September and October, with increases of up to 20 risk-day y–1 for Δ2090–2099 (Figure 6). In July, August, and September, increases in A. catenella risk-days are aggregated in the St. Lawrence Estuary and in the Northwestern Gulf (NW Gulf), whereas increases in May, June, and October are recorded near PEI and Chaleur Bay. Large monthly decreases of 9 risk-day y–1 for Δ2050–2059 and 20 risk-day y–1 for Δ2090–2099 are obtained in July, August, and September mostly around PEI and Chaleur Bay.
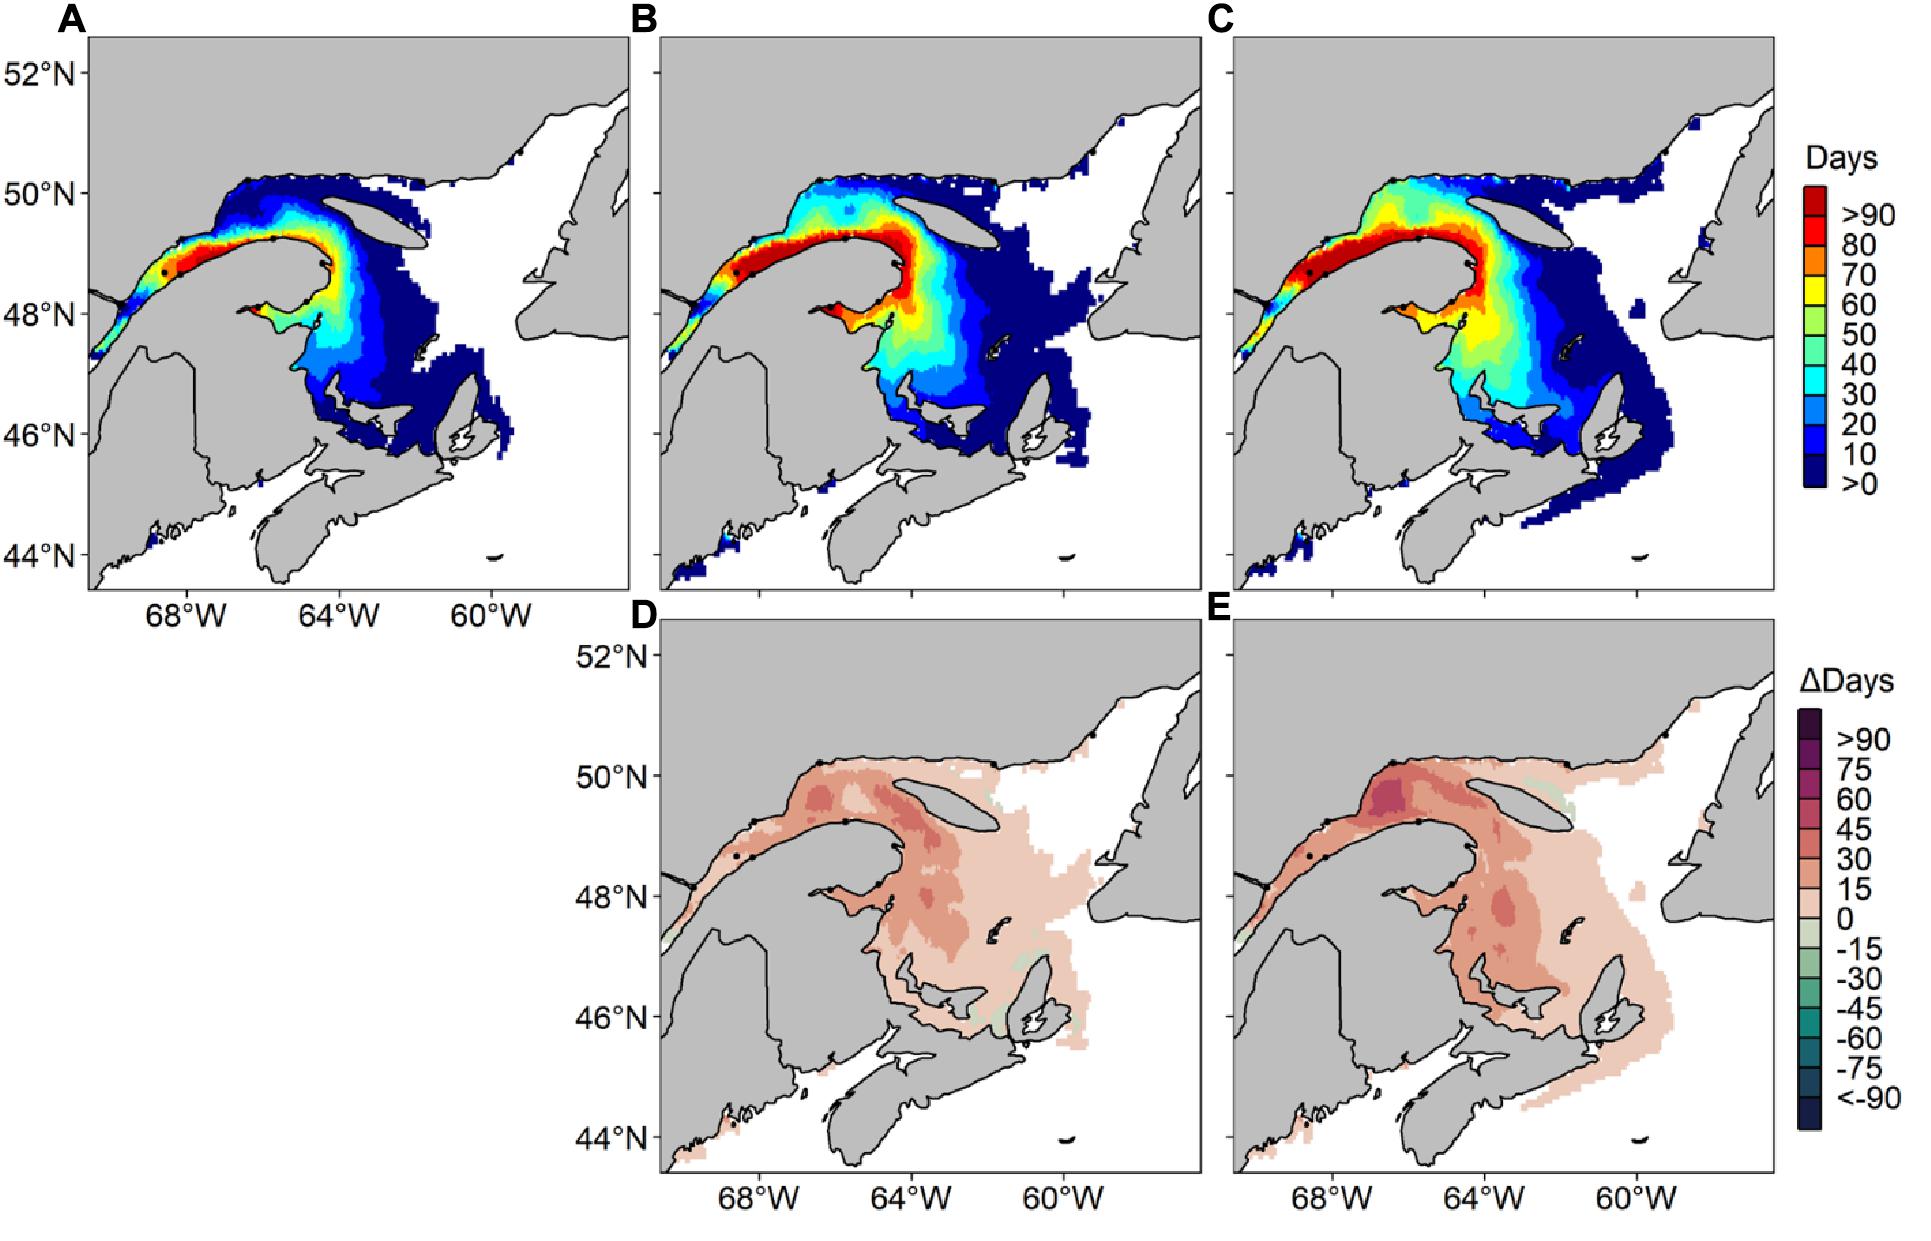
Figure 5. Average number of risk days with Alexandrium catenella ≥ 1000 cells L− 1 from May through October along Canada’s East coast under MPI-ESM-LR RCP 4.5 for (A) 1999–2008, (B) 2050–2059, (C) 2090–2099 and difference in average number of risk days between (D) 1999–2008 and 2050–2059 and (E) 1999–2008 and 2090–2099.
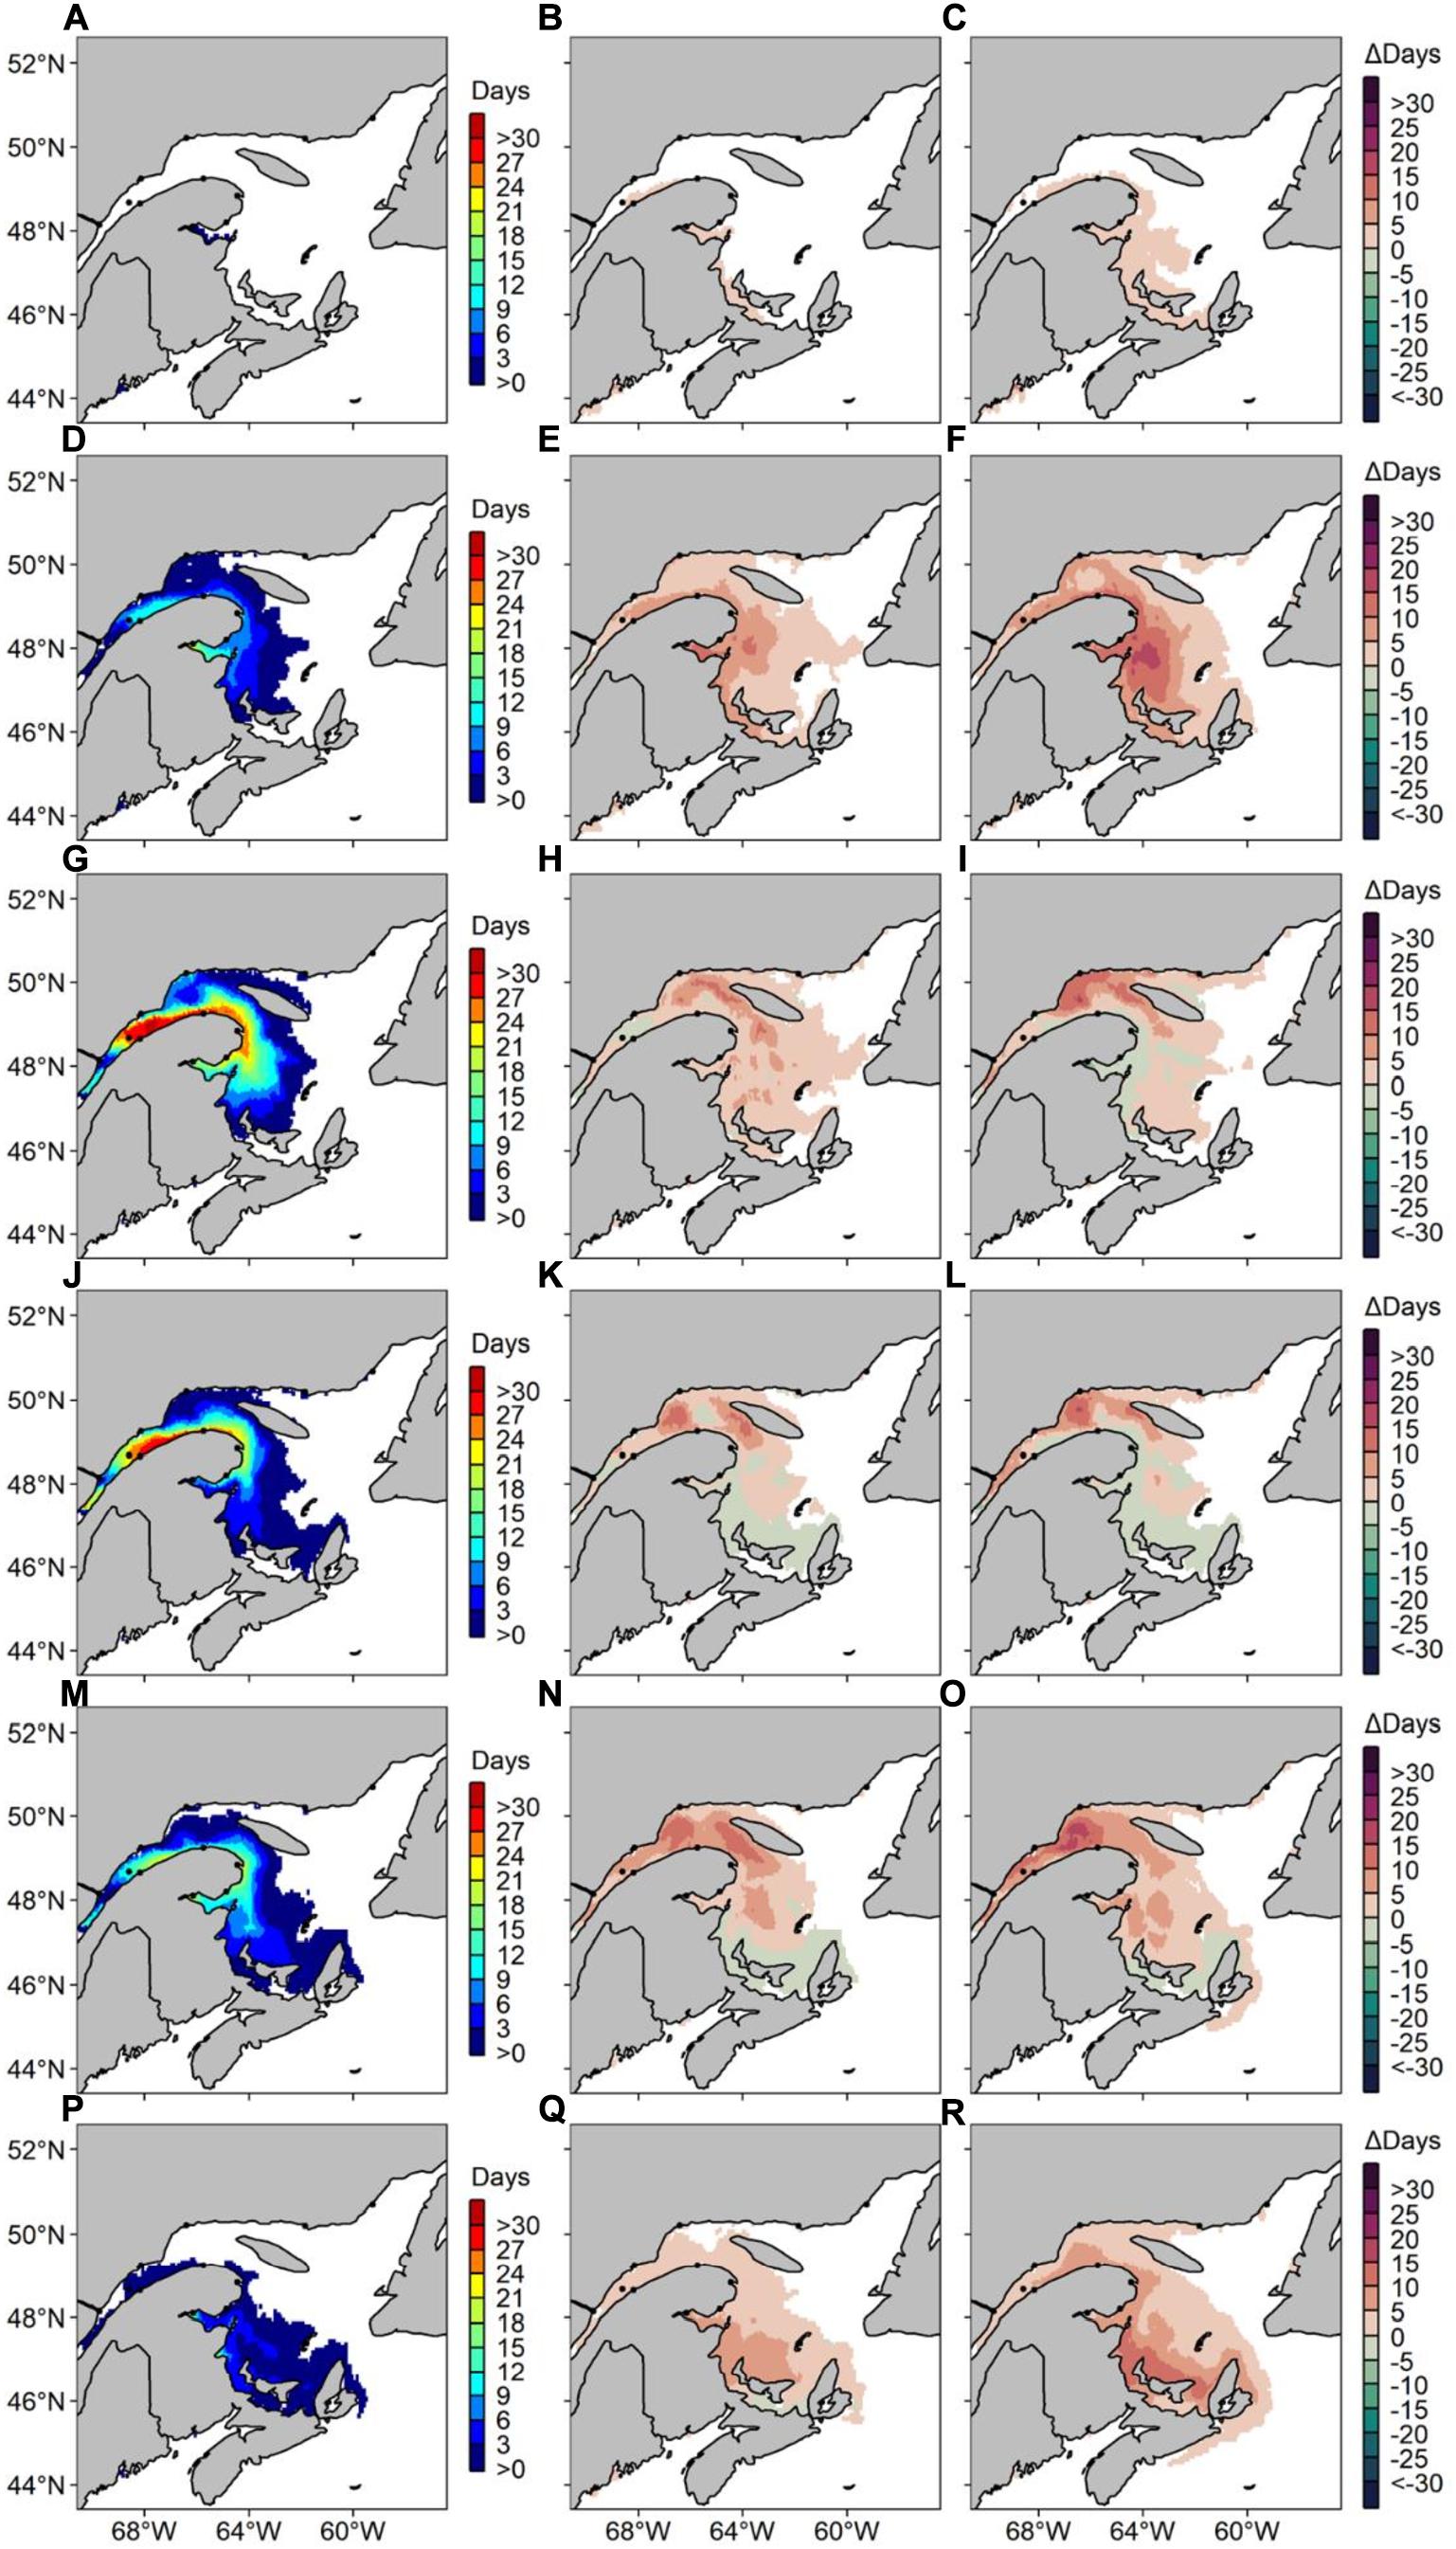
Figure 6. Average number of risk days with Alexandrium catenella ≥ 1000 cells L− 1 along Canada’s East coast under MPI-ESM-LR RCP 4.5 for (A) May 1999–2008, (B) difference in average number of risk days between May 1999–2008 and May 2050–2059 and (C) difference in average number of risk days between May 1999–2008 and May 2090–2099. Same pattern applies for (D–F) June, (G–I) July, (J–L) August, (M–O) September, and (P–R) October.
Future Predictions of A. catenella Occurrences Under the MPI-ESM-LR RCP 8.5 Scenario
Under the MPI-ESM-LR RCP 8.5 scenario, the annual A. catenella occurrences increase by 45–60 risk-day y−1 (Figure 7). For the 2090–2099 periods, a small number of risk-days are visible on the Scotian Shelf and on Newfoundland’s West Coast. For the same decade, predictions indicate higher risk-days annually compared to MPI-ESM-LR RCP 4.5 along the Lower North Shore, with up to 40 risk-day y–1. Up to 20 risk-day y–1 are visible near PEI’s northern point and up to 50 risk-day y–1 are recorded in the NW Gulf for the 2090–2099 periods. The number of risk-days during the months of May, June, September and October reach 20 days all throughout our study region for the 2090–2099 period (Figure 8). An increase in number of risk-days compared to MPI-ESM-LR RCP 4.5 is observed in the BoF, with maximum increases of 45 and 86 risk-day y–1 for Δ2050–2059 and Δ2090–2099, respectively. Maximum decreases reach 15 risk-day y–1 for Δ2050–2059 near Anticosti Island and 35 risk-day y–1 for Δ2090–2099 near Chaleur Bay compared to the reference period. July and August show decreases of 20 risk-day y–1 along the southern shore of the LSLE in Δ2090–2099. In October, increases are visible mostly near PEI for Δ2050–2059, and concentrated in the LSLE for Δ2090–2099.
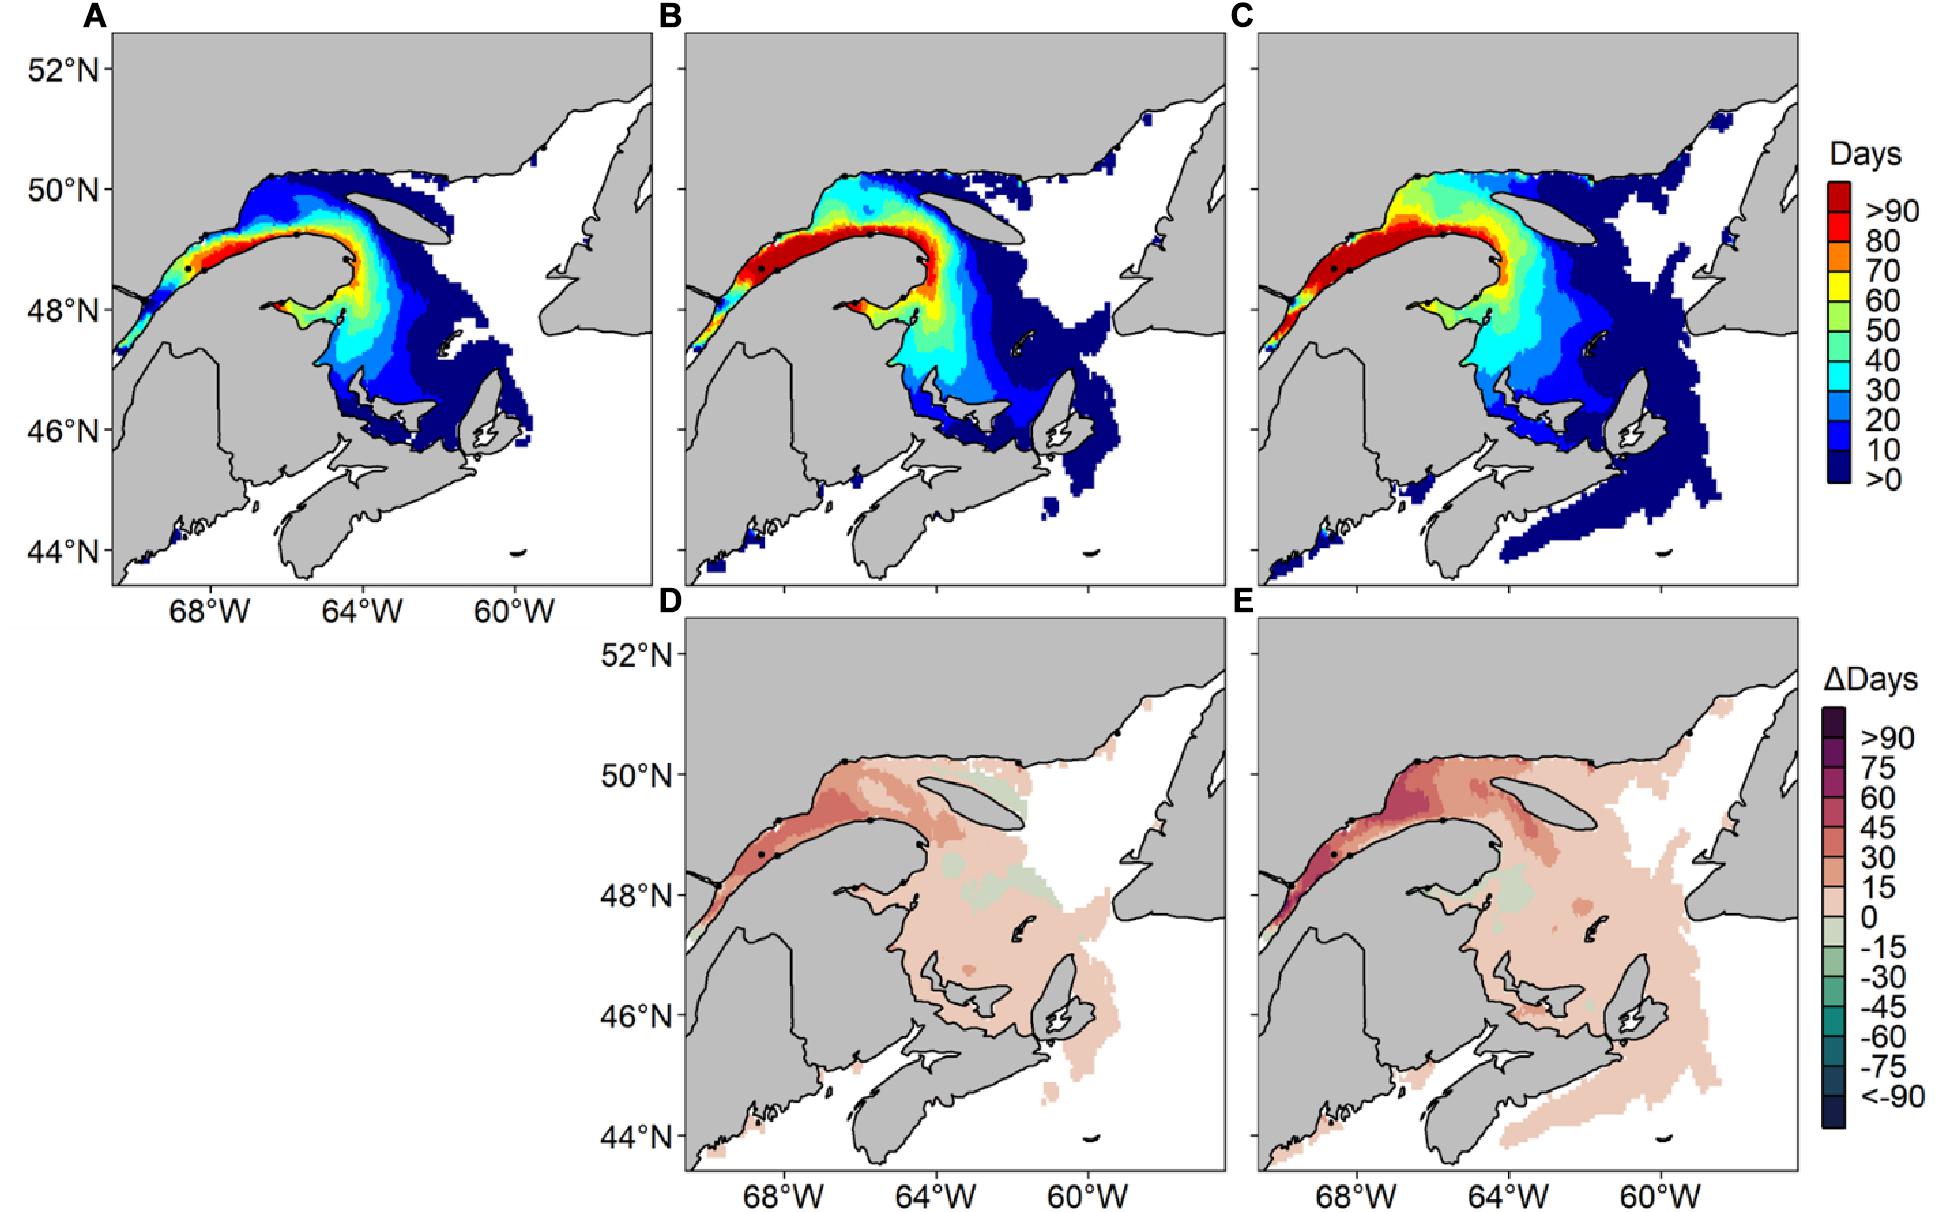
Figure 7. Average number of risk days with Alexandrium catenella ≥ 1000 cells L− 1 from May through October along Canada’s East coast under MPI-ESM-LR RCP 8.5 for (A) 1999-2008, (B) 2050–2059, (C) 2090–2099 and difference in average number of risk days between (D) 1999–2008 and 2050–2059 and (E) 1999–2008 and 2090–2099.
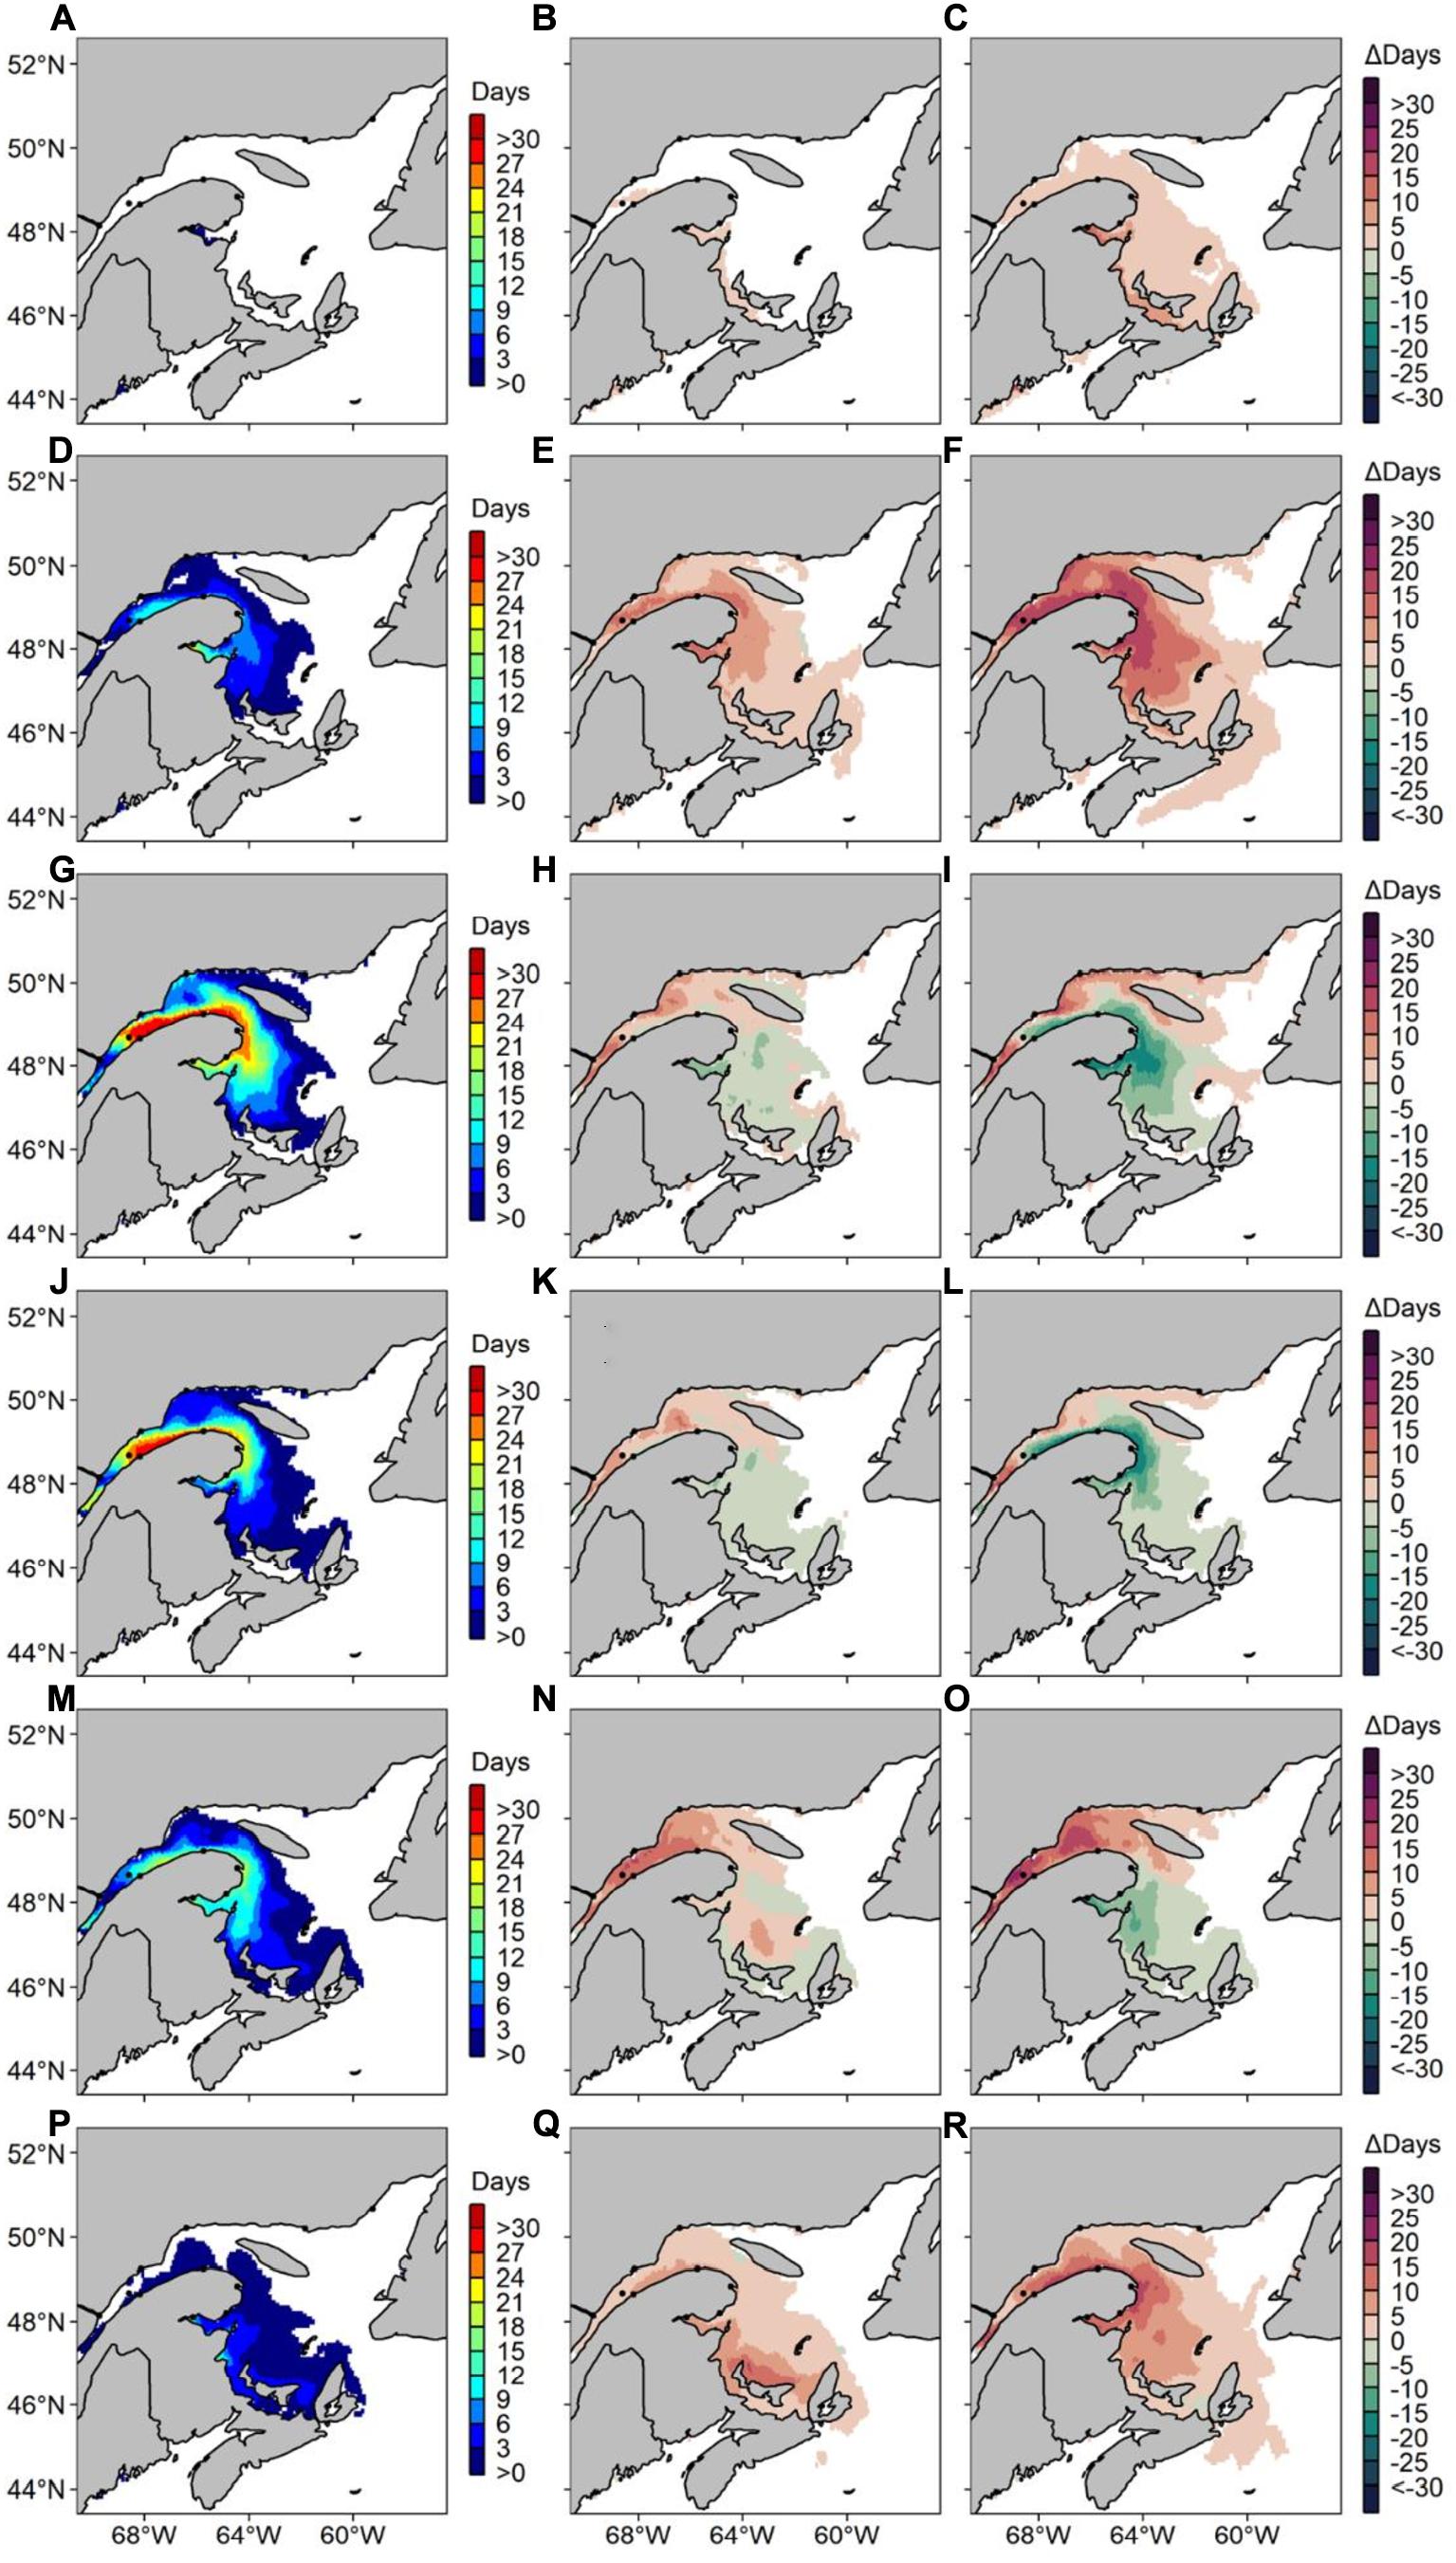
Figure 8. Average number of risk days with Alexandrium catenella ≥ 1000 cells L− 1 along Canada’s East coast under MPI-ESM-LR RCP 8.5 for (A) May 1999-2008, (B) difference in average number of risk days between May 1999–2008 and May 2050–2059 and (C) difference in average number of risk days between May 1999–2008 and May 2090–2099. Same pattern applies for (D–F) June, (G–I) July, (J–L) August, (M–O) September, and (P–R) October.
Future Predictions of A. catenella Occurrences Under the CanESM2 RCP 8.5 Scenario
Forecasted A. catenella risk-days under CanESM2 RCP 8.5 are most frequent in the LSLE compared to our MPI-ESM-LR RCP 8.5 scenario (Figure 9). In this scenario, future conditions on the Lower North Shore are predicted to become more favorable to A. catenella’s presence, where up to 80 risk-day y–1 are predicted in 2090–2099. Only rare occurrences are forecasted on the Scotian Shelf and in the BoF/GoM in 2090–2099, with maxima of 10–20 risk-day y–1. Compared to MPI-ESM-LR RCP 8.5, CanESM2 RCP 8.5 predicts a lower number of risk-days for PEI, with maxima of 10 risk day y–1. Increases mostly occur in the LSLE for Δ2090–2099, reaching up to 122 risk-day y–1. In CanESM2 RCP 8.5, maximum decreases are more visible than in MPI-ESM-LR RCP 8.5 and reach up to 34 and 46 risk-day y–1 for Δ2050–2059 and Δ2090–2099, respectively. As with other models presented herein, CanESM2 RCP 8.5 predicts increases throughout the months of May, June, and October in the St. Lawrence Estuary throughout the 21st century (Figure 10). Similar to MPI-ESM-LR RCP 8.5, decreasing risk-days in CanESM2 RCP 8.5 are most visible in July, August and September for Δ2090–2099 and take place in the Gaspé Current and in Chaleur Bay.
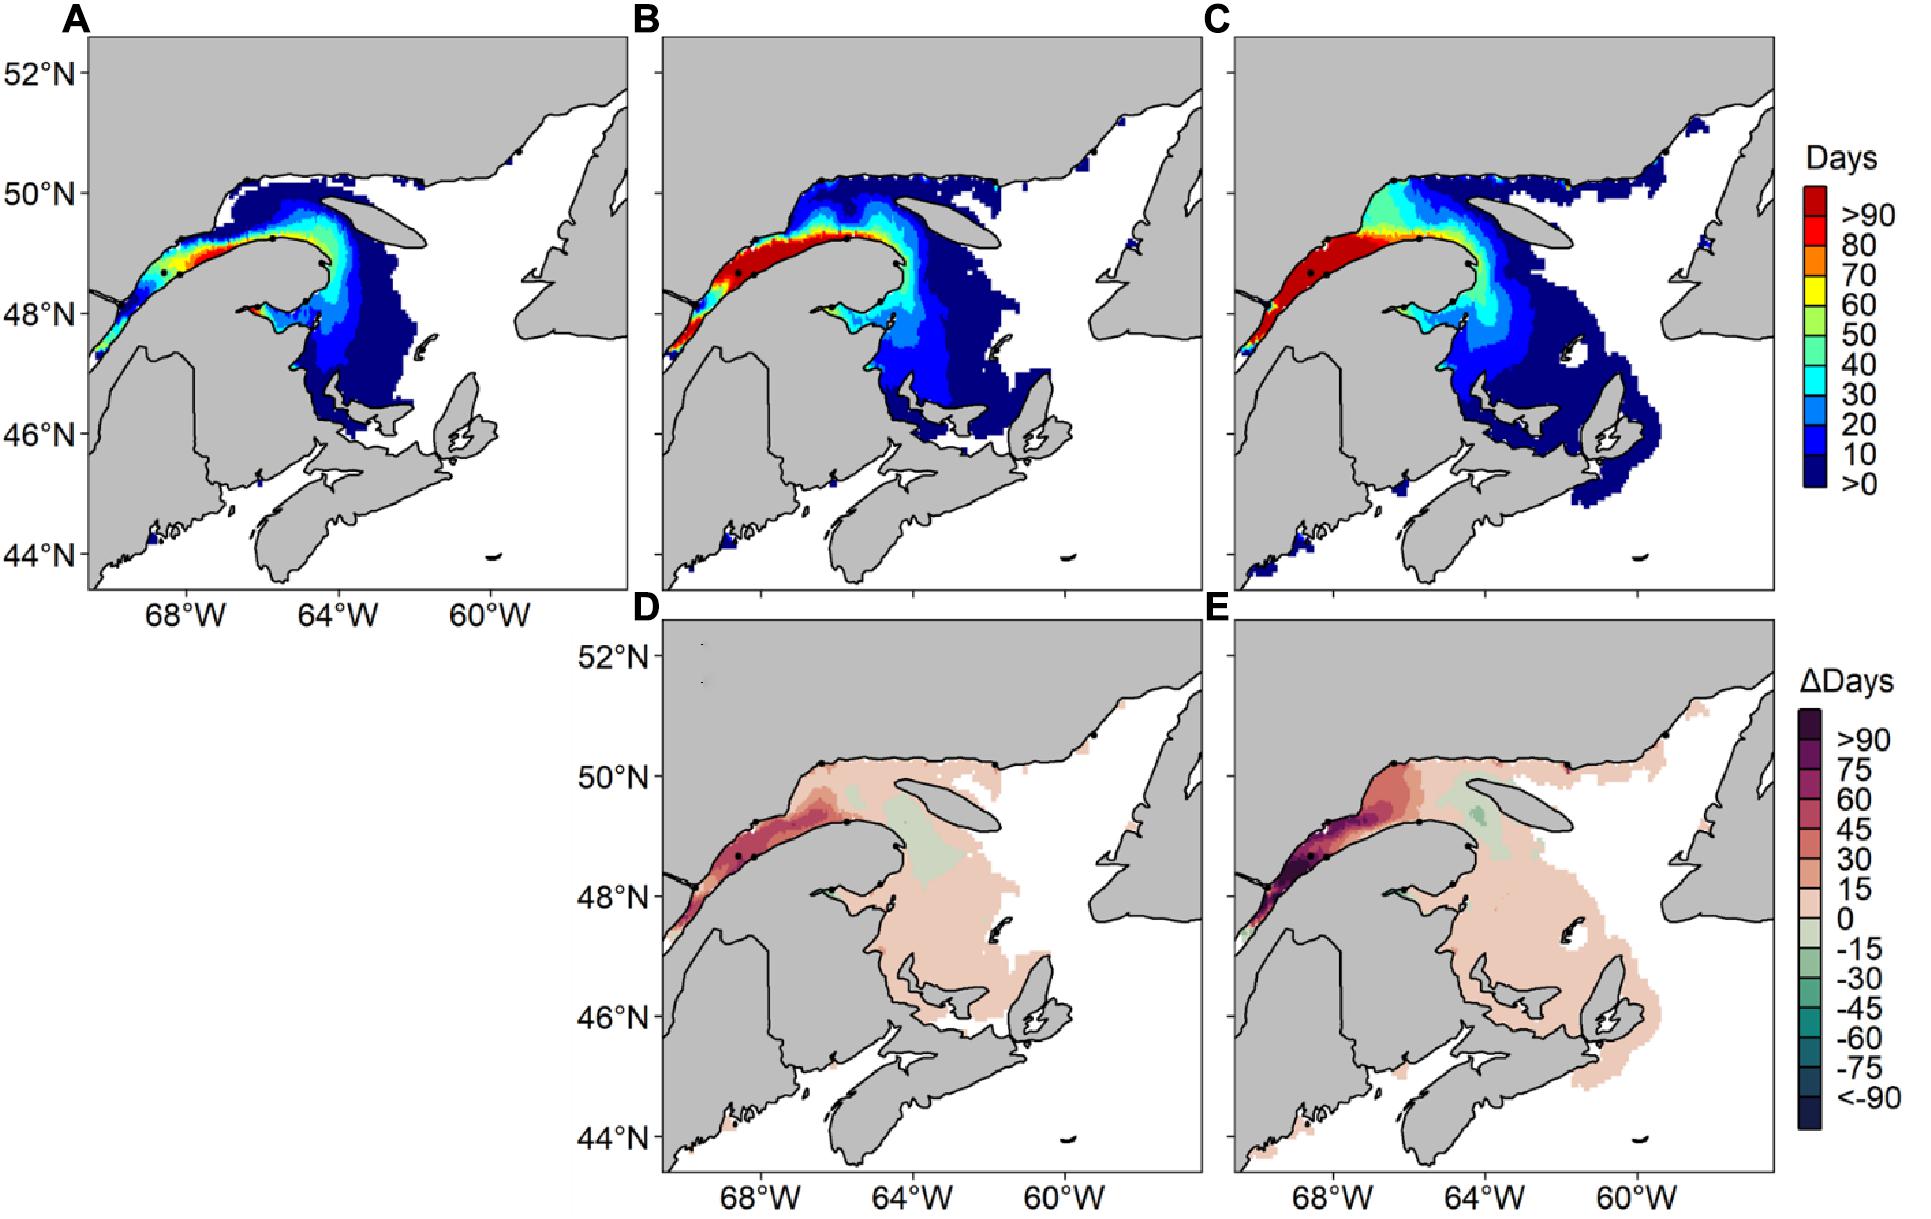
Figure 9. Average number of risk days with Alexandrium catenella ≥ 1000 cells L− 1 from May through October along Canada’s East coast under CanESM2 RCP 8.5 for (A) 1999–2008, (B) 2050–2059, (C) 2090–2099 and difference in average number of risk days between (D) 1999–2008 and 2050–2059 and (E) 1999–2008 and 2090–2099.
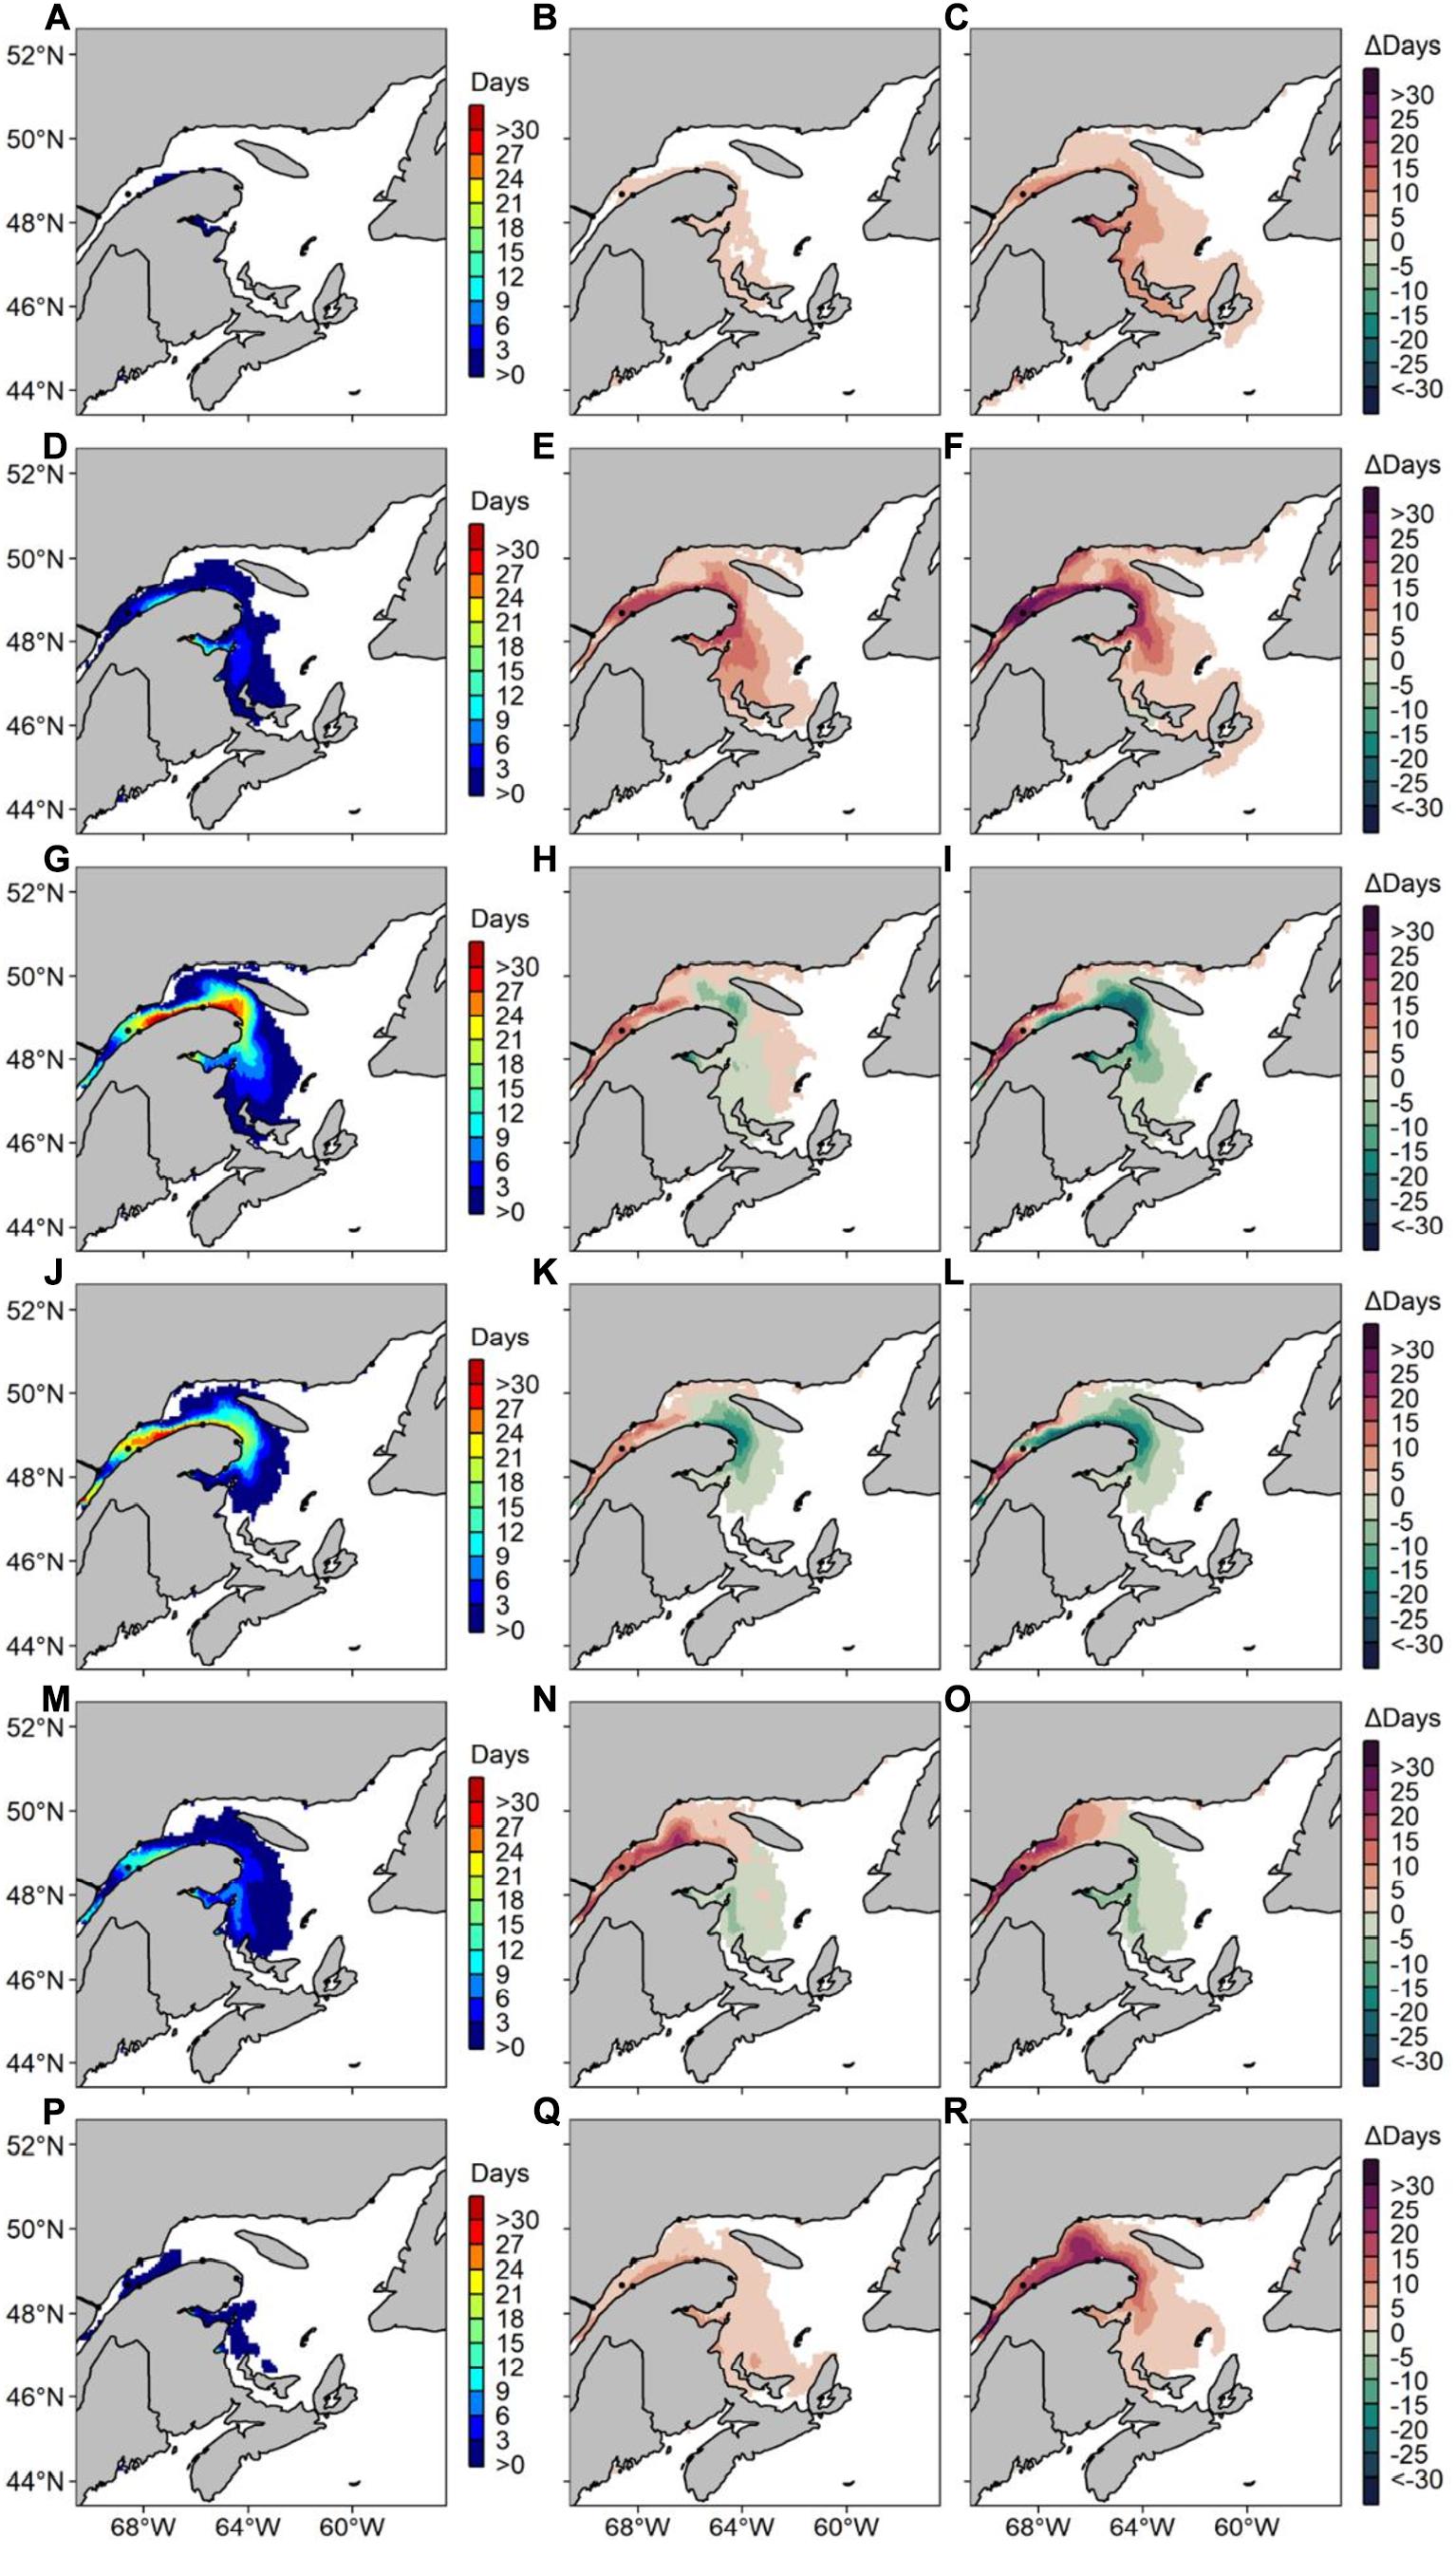
Figure 10. Average number of risk days with Alexandrium catenella ≥ 1000 cells L− 1 along Canada’s East coast under CanESM2 RCP 8.5 for (A) May 1999–2008, (B) difference in average number of risk days between May 1999–2008 and May 2050–2059 and (C) difference in average number of risk days between May 1999–2008 and May 2090–2099. Same pattern applies for (D–F) June, (G–I) July, (J–L) August, (M–O) September, and (P–R) October.
Evolution of A. catenella Occurrences Throughout the 21st Century Under the MPI-ESM-LR RCP 8.5 Scenario
From 2001 to 2099, our model based on the downscaled MPI-ESM-LR RCP 8.5 scenario predicts significant increases of A. catenella risk-days in all regions previously defined in Figure 1, except for Chaleur Bay and the Scotian Shelf (Figure 11). The LSLE, NW Gulf, and PEI show the most dramatic increases in risk-days (SD), with increases of 3.97 (0.35), 3.53 (0.53), and 1.11 (0.29) risk-day per decade (Table 2). The Magdalen Islands, the Lower North Shore, the Scotian Shelf, and the BoF exhibit increases in risk-days (SD) on a smaller scale, with increases of 0.70 (0.18), 0.20 (0.05), 0.03 (0.02), and 0.01 (0.00) risk-day per decade respectively. The LSLE has the earliest climate signal emergence year (2031) and the shortest climate signal emergence time (20.85 years). The Lower North Shore is the second fastest to emerge in 2032 with an emergence time of 21.14 years. The NW Gulf, PEI, the Magdalen Islands and the BoF regions emerge in 2038, 2043, 2057, and 2038, respectively. Their times of emergence vary between 27.78 and 46.81 years. Increases in the interannual variability of risk-days are predicted until 2099 in most areas of the model domain.
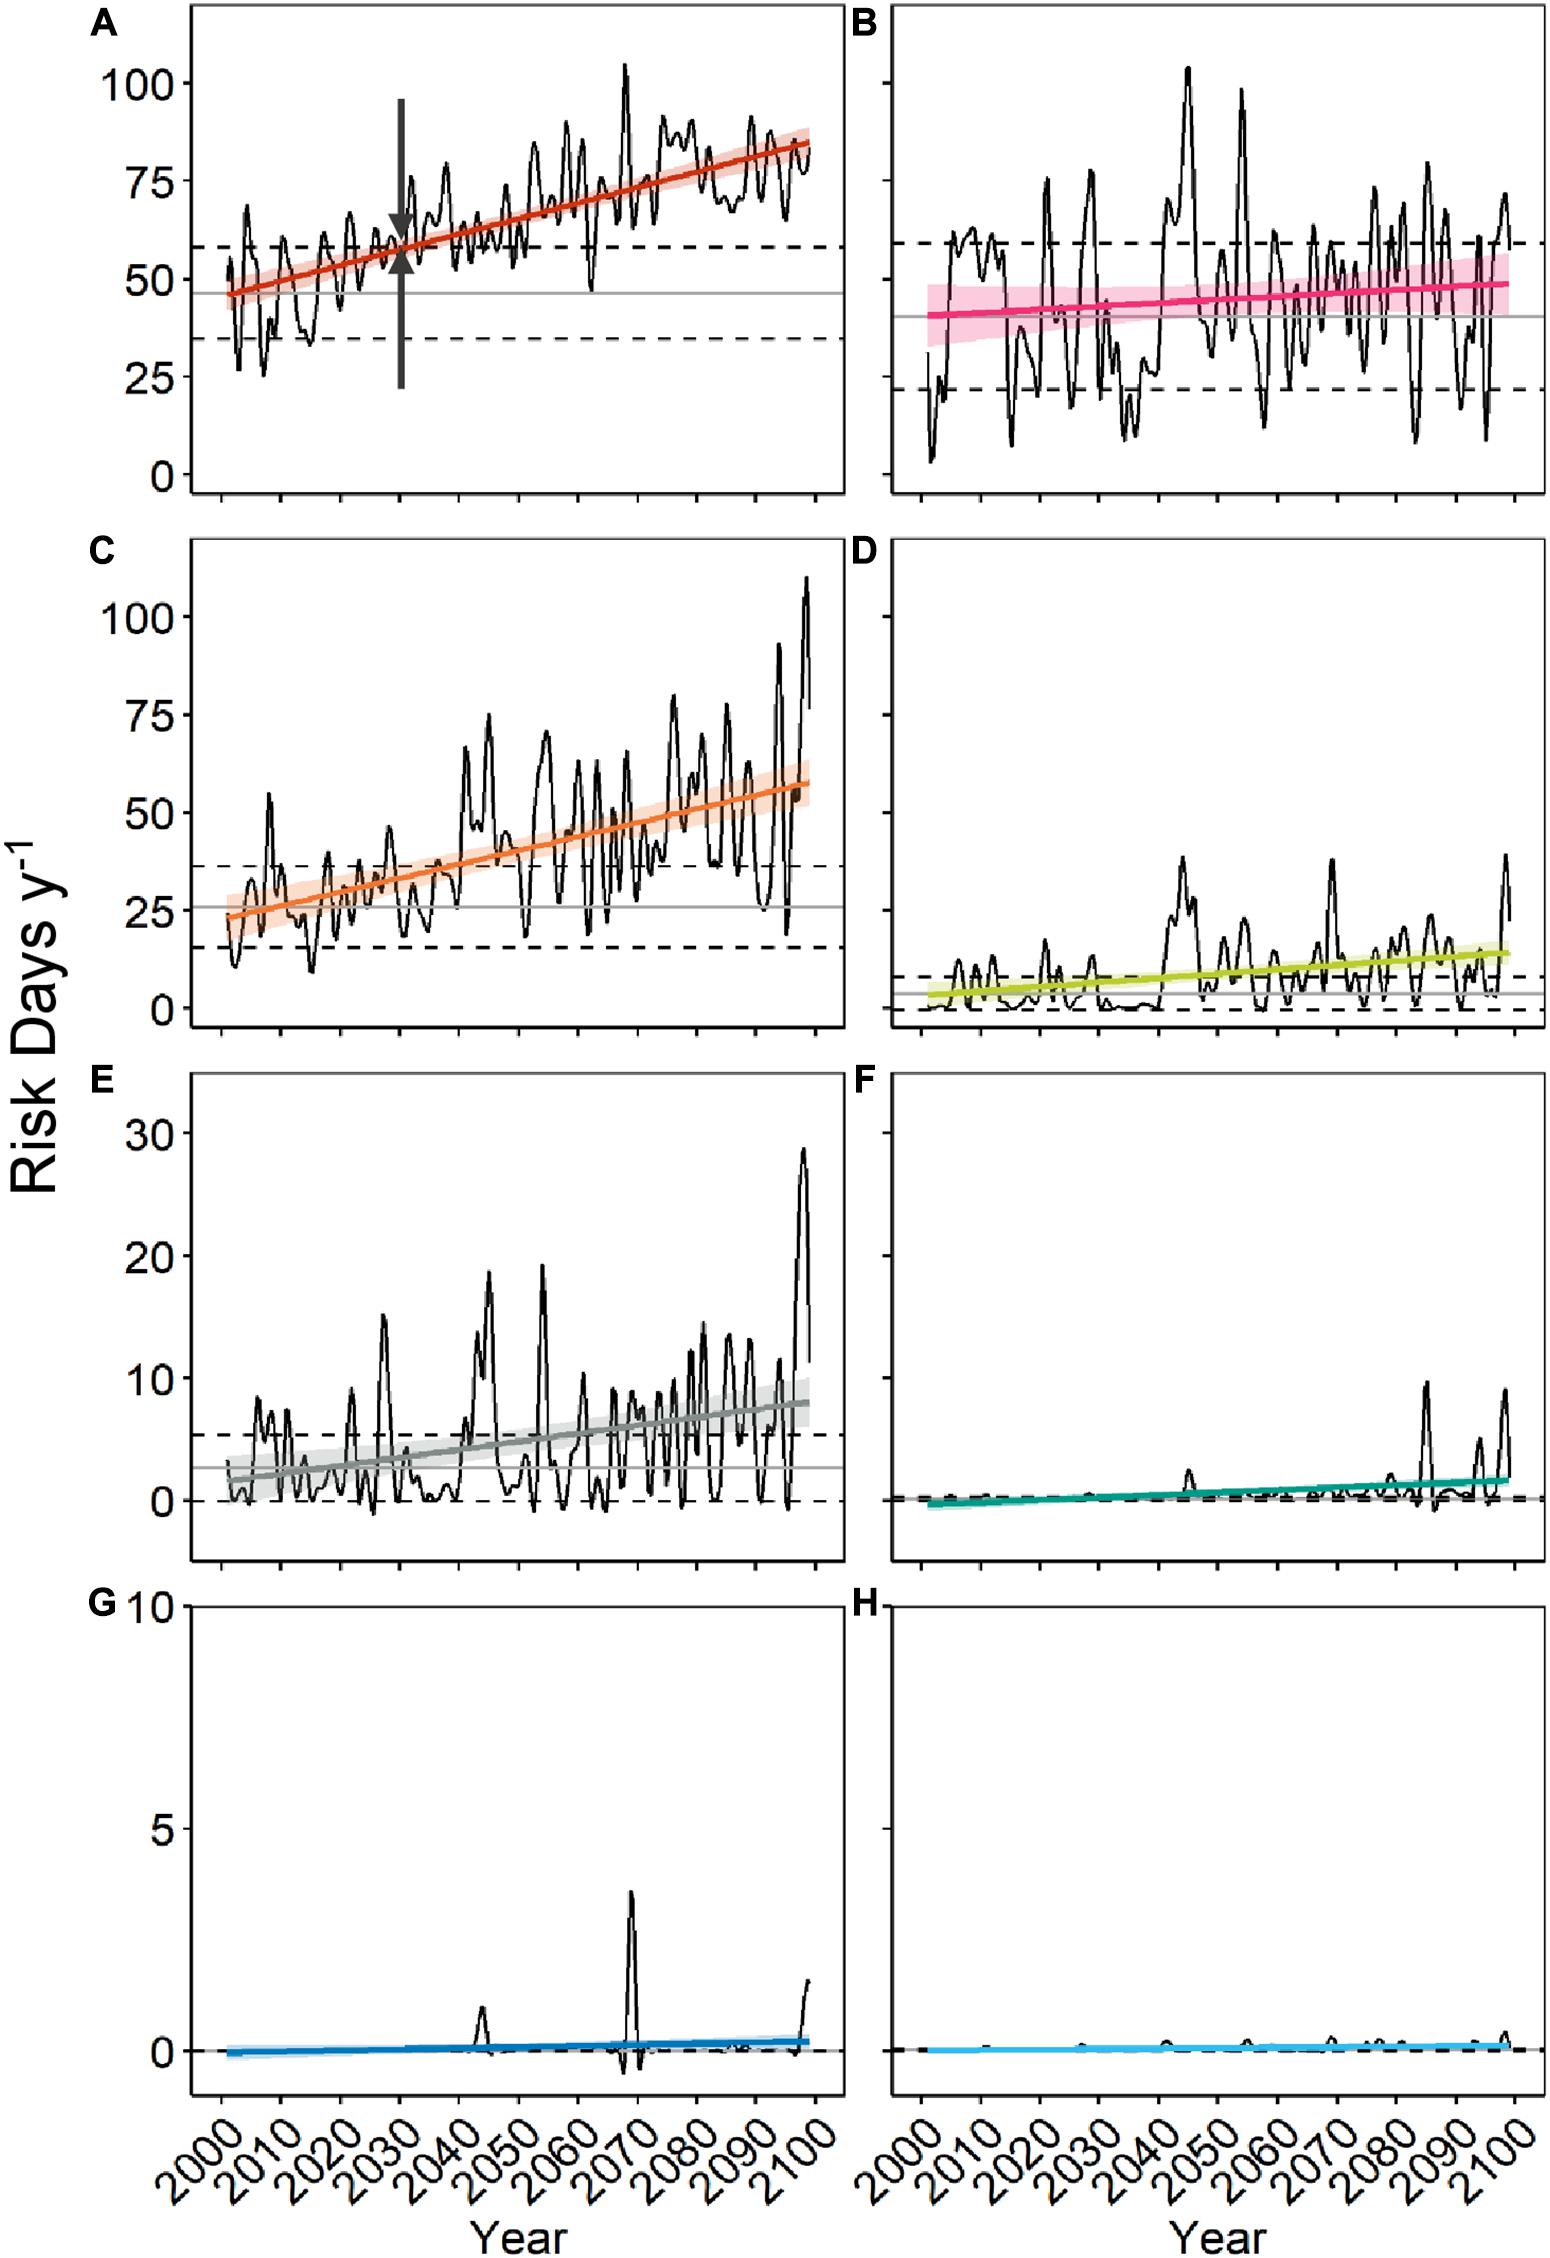
Figure 11. Average number of risk days of Alexandrium catenella ≥ 1000 cells L− 1 per region (see Figure 1 – LSLE, Lower St. Lawrence Estuary) from May through October along Canada’s East coast under MPI-ESM-LR RCP 8.5 between 2001 and 2099 for (A) LSLE, (B) Chaleur Bay, (C) NW Gulf, (D) Prince Edward Island, (E) Magdalen Islands, (F) Lower North Shore, (G) Scotian Shelf, and (H) Bay of Fundy. Year of emergence is exemplified in (A) by the dark gray arrows. Refer to Figure 1 for color code.
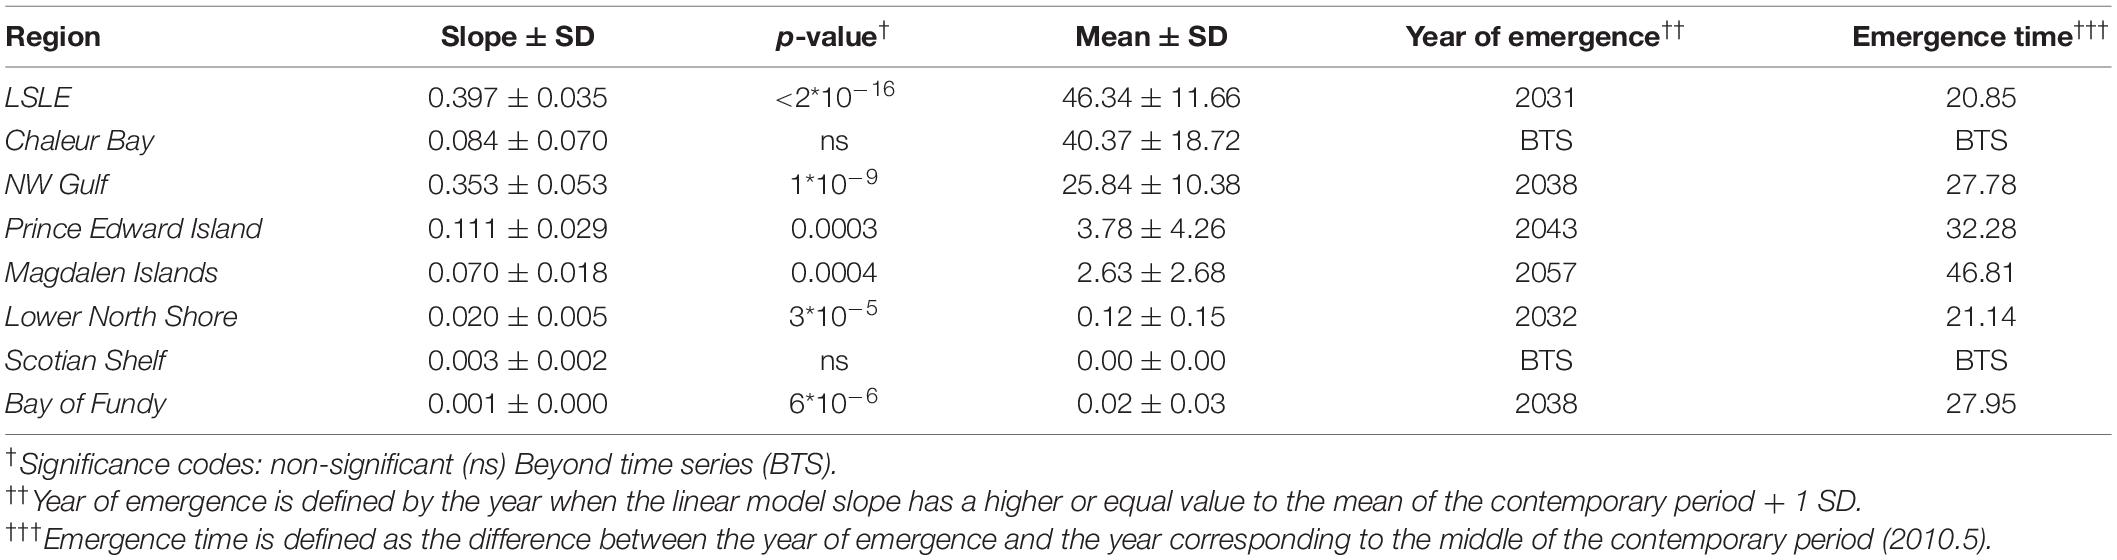
Table 2. Changes in mean annual risk days predicted over the period 2001–2099 under MPI-ESM-LR RCP 8.5 within each region defined in Figure 1 (LSLE, Lower St. Lawrence Estuary): linear model slope ± Standard deviation (SD) and p-value, average sum of risk days ± SD of the contemporary period (2001–2020), year of emergence of climate signal and climate signal emergence time.
Figure 12 confirms that increases in A. catenella risk-days from 2001 to 2099 are most intense in the LSLE and in the NW Gulf, with a maximum increase of 9.44 risk-day per decade. Increases near river mouths are particularly visible, notably along the Lower North Shore as well as in the BoF and the GoM. Small increases are also forecasted throughout the EGSL, around PEI and the Magdalen Islands, on the Scotian Shelf and on Newfoundland’s West Coast (<2 risk-day per decade). The standard error of the slope estimate is highest in Chaleur Bay and in the St. Lawrence Estuary (±1.1 risk-day per decade). Linear trends are significant mostly in the LSLE, the NW Gulf and along the Lower North Shore, as well as around PEI and the Magdalen Islands (p < 0.05). Significant risk-day increases are also predicted in the BoF, near Penobscot Bay, Saint-John River and Casco Bay.
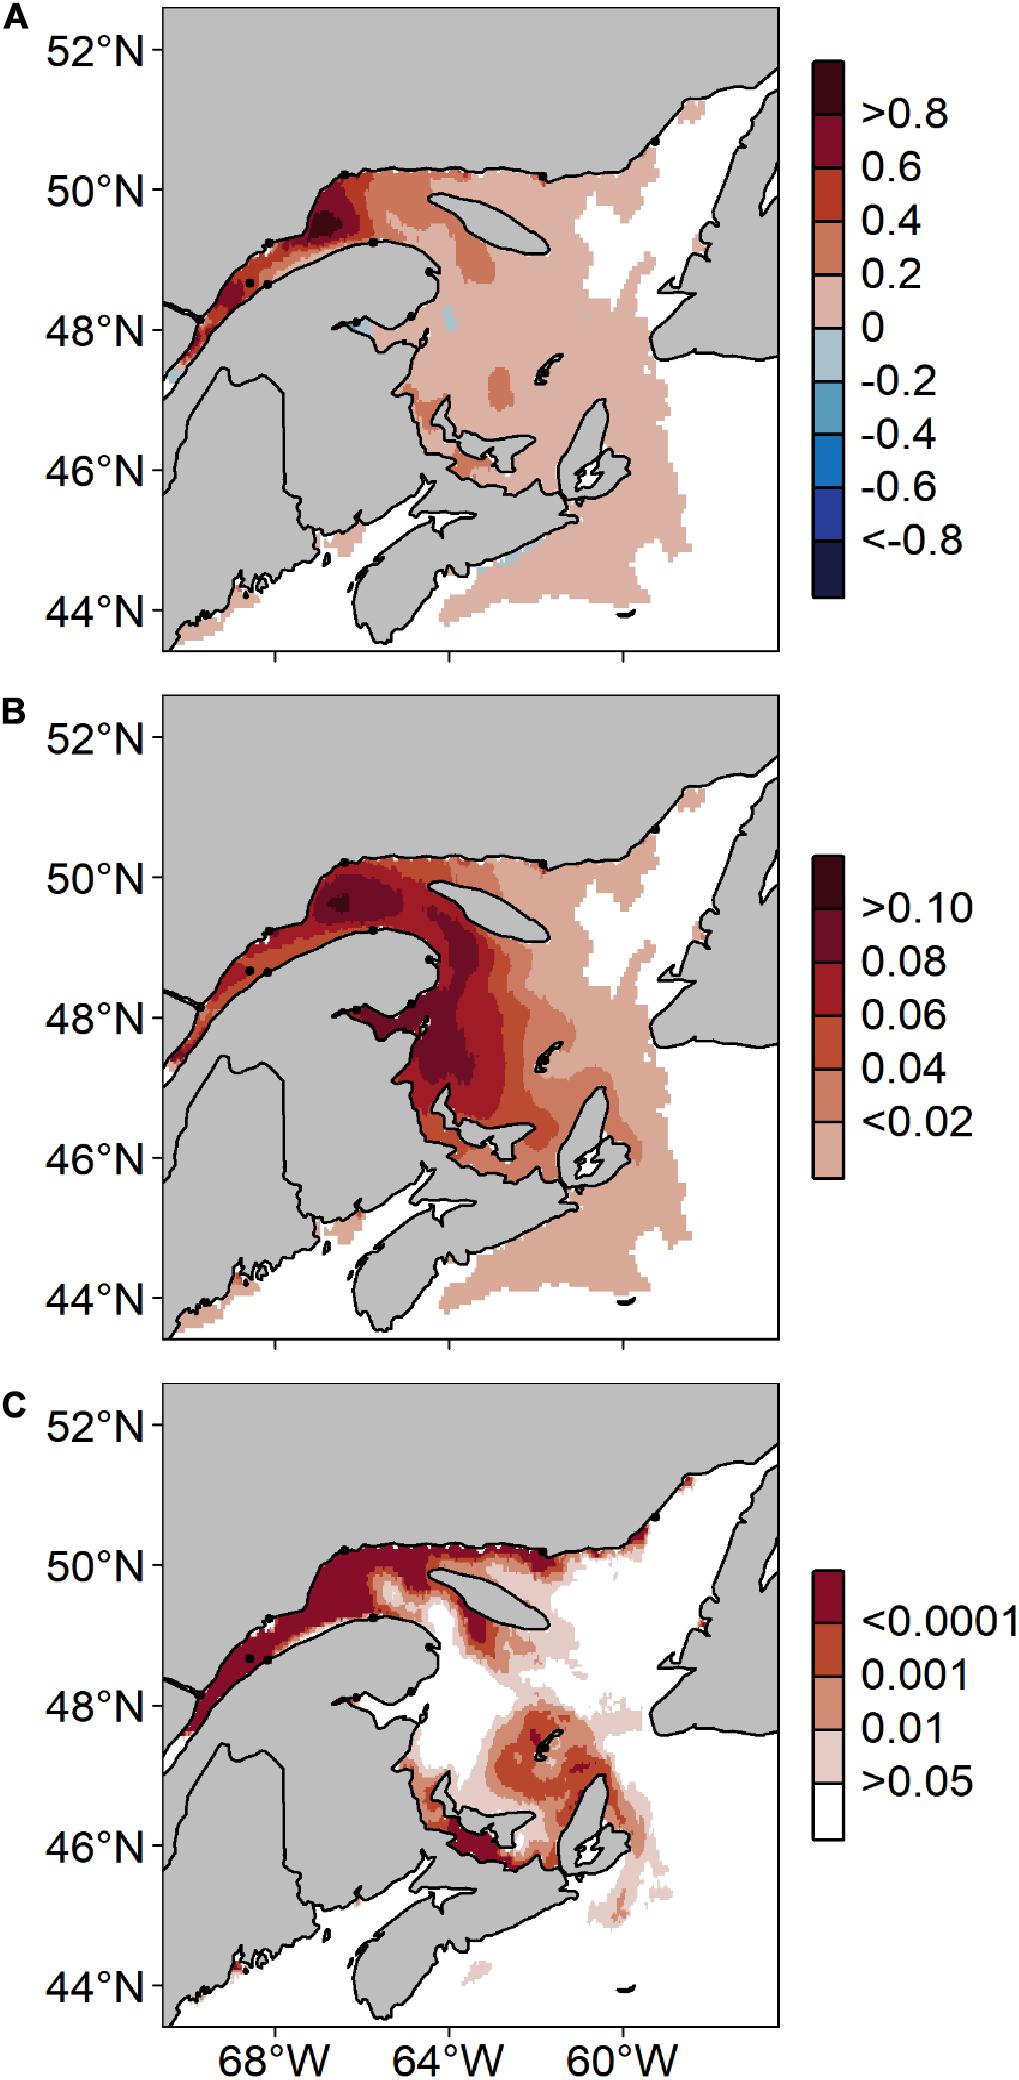
Figure 12. Predicted changes along Canada’s East coast in mean annual risk days with Alexandrium catenella ≥ 1000 cells L− 1 throughout the period 2001–2099 under MPI-ESM-LR RCP 8.5: (A) rate of change (number of days y− 1), (B) standard error and (C) p-value based on the linear regression for each model grid.
Discussion
In this study, we developed a model that can predict A. catenella potential occurrences ≥ 1000 cells L–1 (referred herein as “risk-days”) using an ecological niche approach. The model was run using two ESMs (MPI-ESM-LR andCanESM2) under two climate scenarios (RCP 4.5 and 8.5). RCP 4.5 is a scenario in which greenhouse gas emissions increase steadily until 2040, before slowing down by 2050. In this mitigation scenario, global temperatures are expected to rise by 1.1–2.6°C by 2081–2100 compared to 1986–2005. In RCP 8.5, anthropogenic CO2 emissions increase rapidly until 2100. In this scenario termed “business as usual,” global temperatures are expected to rise by 2.6–4.8°C by 2081–2100 relative to 1986–2005. Changes in global temperatures and CO2 levels are expected to have major effects on the hydrological cycle as a whole, including water temperature and salinity. Projection results were used to evaluate future A. catenella risk days throughout the 21st century (IPCC, 2013). All climate change scenarios explored predict increases in frequency, spatial expansion, and changes in seasonality of A. catenella blooms with expected changes in water temperature and salinity along Canada’s East Coast.
A. catenella GAMM Description
The HARM succeeded at modeling average A. catenella spatio-temporal extent over a 23 years monitoring program that took place in the EGSL. The model fit our samples accurately (AUC = 0.88). Our GAMM predicts A. catenella bloom occurrences to be most likely when SSS is 15–28 and SST is 9–19°C (optima at 23 and 14°C, respectively), which is consistent with several laboratory and field studies showing that optimal growth rates and/or high abundances of this species are measured within this environmental window (Etheridge and Roesler, 2005; Condie et al., 2019; Paredes-Mella et al., 2020). Our results compare to past observations made by Weise et al. (2002) in the EGSL near Sept-Îles, who showed that the highest A. catenella concentrations occurred when SSS was 20–26 and SST was ≥12°C. In July 1998, during a red tide event in the LSLE, A. catenella in situ growth rates were highest when SSS was ≤24.5 and SST was ≥10°C (Fauchot et al., 2005). Etheridge and Roesler (2005) have shown experimentally that optimal growth rates were about 15°C and 25 salinity units for two A. catenella strains (previously known as A. fundyense) isolated from the GoM and BoF.
Temperatures and salinity are already known to have direct effects on Alexandrium’s growth (Bill et al., 2016; Brosnahan et al., 2020). Salinity, however, could fulfill multiple roles in our model as it is linked to a variety of different factors which are known to affect A. catenella bloom occurrence. Low salinity values are a marker for increased freshwater input in the EGSL, either from river runoff and/or from precipitation, and have been identified as a trigger for bloom occurrence (Weise et al., 2002; Starr et al., 2017). A fresher surface layer increases stratification strength, which in turn favors active vertically migrating dinoflagellates such as A. catenella (in contrast to less mobile phytoplankton) to accumulate in the euphotic zone and grow with an access to nutrients at depth if depleted in surface (Margalef, 1978; Weise et al., 2002; Hallegraeff, 2010; Glibert, 2016; Condie et al., 2019). In the EGSL’s coastal areas, salinity is often identified as the main driver of vertical stratification (Koutitonsky and Bugden, 1991). This typical association between A. catenella and freshwater plumes has also been previously attributed to the beneficial effects of riverine input of nutrients that can serve as growth stimulants (Fauchot et al., 2005; Collos et al., 2007; McGillicuddy et al., 2011). However, model fitting during our study suggested that SSS as a predictor variable is likely mostly linked to physical factors, rather than nutrients (notably PO32– and NO3–) such as suggested by Condie et al. (2019). In fact, SSS was a more significant predictor variable when combined to SST, compared to NO3– or PO32– combined with SST (data not shown). We do not, however, exclude that freshwater runoff often causes humic substance injections into the EGSL, which have been shown to favor A. catenella growth (Gagnon et al., 2005).
No other environmental variables examined improved the model significantly, although these variables had initially been chosen for their potential influence on A. catenella. For example, high wind speeds are known to inhibit A. catenella occurrences (Weise et al., 2002; Fauchot et al., 2005; Starr et al., 2017). However, the addition of wind intensity as a predictor was found to be insignificant when GAMM fitting was performed. In addition, the close examination of partial response curves indicated that the effect of wind intensity on A. catenella occurrence was weak. Wind speed is known to generate vertical mixing of the water column that can eventually erode stratification. As this latter is directly linked to SSS, this may explain weaker power of prediction of winds. Together, these results highlight that SST and SSS are the most important environmental factors controlling A. catenella bloom occurrence in the EGSL, as well as in other regions of the globe (Fauchot et al., 2005; Li et al., 2009; McGillicuddy et al., 2011; Bill et al., 2016; Condie et al., 2019). Globally, these environmental drivers are well recognized as important for the structuring of ocean plankton communities (Glibert, 2016).
Observations and Hindcasts
When driven by the 1999–2008 hindcast, the HARM reproduced A. catenella occurrences fairly well (AUC = 0.68) and succeeded in hindcasting past general patterns of A. catenella spatial extent and bloom seasonality in the EGSL. Occurrence maxima happened in July and August and occurrence minima took place in May, September and October. Maximum A. catenella concentrations were found in the LSLE, on the northern shore of the St. Lawrence Estuary, and around the Gaspé Peninsula. Blasco et al. (2003) observed similar spatio-temporal patterns during the 1984–1994 periods, with A. catenella maxima in the LSLE and around the Gaspé Coast, through the months of June, July, and August. Fauchot et al. (2008) modeled similar seasonal and spatial patterns when looking at A. catenella abundance in the LSLE. The model correctly reproduced the bloom initiation in June and abundance maxima in the northern LSLE.
Occurrence overestimations are present on the southern shore of the St. Lawrence Estuary along the Gaspé Current, and in Chaleur Bay. In the Gaspé Current, our model predicts a high number of A. catenella risk days. In real conditions, however, A. catenella cells along the Gaspé Current are exposed to strong currents and are likely to be advected away from this area (El-Sabh and Silverberg, 1990). Our model does not account for cell advection, which explains why higher risk days are predicted in this section of the EGSL. A similar mechanism could also explain the differences observed in Chaleur Bay. Although relatively simple, our GAMM is deemed appropriate for A. catenella occurrence prediction in our study region.
The BoF and GoM usually show high A. catenella occurrences during the bloom season (Anderson et al., 2014; Martin et al., 2014; Bates et al., 2020; McKenzie et al., 2020), which is not completely captured by our model. The BoF/GoM is an oceanographically complex region where A. catenella cells are advected from a “donor” to a “receiver” region (Keafer et al., 2005). Note that the analysis of Lavoie et al. (2017) also shows that the oceanographic predictions obtained in the GoM have a greater uncertainty than those obtained in the EGSL. Lavoie et al. (2017) attribute these biases to weaknesses in the predictions obtained from the ESMs along the open boundaries. In spite of these biases, the predicted trends remain of interest.
Our model does not account for A. catenella acclimation and adaptation to future climate conditions. However, HAB range shifts induced by warming temperatures are expected and have already been observed, as well as lengthening of the bloom season window in temperate regions (Wells et al., 2015; Barton et al., 2016; Gobler et al., 2017; Brandenburg et al., 2019). Considering these findings, we determined that adding acclimation and adaptation to our model by shifting or widening A. catenella’s niche was not necessary. Instead, we have kept our model flexible by avoiding temporal variables in our GAMM (such as weekly or monthly sampling) to allow for future A. catenella occurrences to happen outside of their current bloom window.
Projected Changes in Occurrence of the Toxic Algae Alexandrium catenella Along Canada’s East Coast
Our results show that A. catenella risk days will increase and show more year to year variability throughout the 21st century along Canada’s East Coast. Future climate conditions will favor a warmer and fresher surface layer (Supplementary Figures S1–S18), that will expand across our study region. The effect of increased runoff and expansion of freshwater plumes on A. catenella risk days are evident along the Lower North Shore, in the LSLE and in the NW Gulf under all climate scenarios investigated. Under MPI-ESM-LR RCP 4.5, A. catenella risk days increase at the lowest rate, with maximum increases > 50 risk-day y–1 recorded for 2090–2099. Changes are most intense under CanESM2 and MPI-ESM-LR RCP 8.5, the “business as usual” scenarios, and reach > 80 risk-day y–1 increases in 2090–2099. In these scenarios, rates of increase are projected to be more pronounced in the LSLE and in the NW Gulf. Under MPI-ESM-LR RCP 8.5, the climate signal emergence years vary between 2031 and 2057. Regions with the earliest emergence years, such as the LSLE, the NW Gulf and PEI, could be the first to see associated effects on socio-economically valuable marine fauna.
Increasing bloom frequency will be accompanied by spatial expansion of A. catenella risk days across the EGSL and on the Scotian Shelf. Spatial expansion and range shifts of phytoplankton species have already been documented and predicted (Hallegraeff, 2010 and references therein), especially poleward shifts, related to higher sea temperatures in the North Atlantic and Arctic Oceans (Neukermans et al., 2017; Renaut et al., 2018). Our downscaled predictions clearly show increased SST in the future as well as decreased SSS over most of the Northwest Atlantic coast (Supplementary Figures S1–S18). Consequently, stratification exhibits an increase in future predictions (Long et al., 2016). This process will contribute to increasing A. catenella’s spatial extent, by limiting mixing with deeper waters. Moreover, the estuarine circulation shows seasonal changes with a decrease in the estuarine ratio in winter and an increase in summer (Long et al., 2016). Since most A. catenella occurrences happen during summer, the amplification of the estuarine circulation during that period will likely contribute to a spatial expansion of HABs. MPI-ESM-LR RCP 4.5 and 8.5 both show increases in risk days near PEI, the Magdalen Islands and across the Scotian Shelf. Lower SSS in these regions (Supplementary Figures S1–S9) enables A. catenella to expand into the Gulf. Conversely, in CanESM2 RCP 8.5, the spatial expansion is not as intense as in MPI-ESM-LR scenarios; the expansion is limited by high temperatures (≥19°C) that reach PEI, the Magdalen Islands and the Scotian Shelf. In this instance, our climate “worst case scenario” might dampen the effects of A. catenella occurrences on PEI, the Scotian Shelf and the Magdalen Islands. However, mitigation efforts will most likely not prevent A. catenella from widening its reach across the EGSL.
Changes in bloom seasonality of A. catenella were observed across all climate change scenarios investigated. A. catenella is projected to bloom earlier in the season (May) and to remain active until September-October due to longer favorable conditions in the EGSL. Earlier blooming in phytoplankton has already been measured and verified in the North Atlantic (Barton et al., 2016; Gobler et al., 2017) and is predicted to continue during the 21st century (Brosnahan et al., 2020). In the mitigation scenario MPI-ESM-LR RCP 4.5, more risk days are predicted to take place through the entire May–October period. In MPI-ESM-LR RCP 8.5 and CanESM2 RCP 8.5 estimates, a decrease of risk days is nevertheless predicted mostly during the months of July and August in some regions of the EGSL. This period corresponds to the usual peak of A. catenella blooms observed for our reference period 1999–2008, previously reported by Blasco et al. (2003), Fauchot et al. (2005), and Starr et al. (2017) in the EGSL. In both RCP 8.5 scenarios, increasingly high temperatures during summer are projected in 2050–2059 and 2090–2099 (Supplementary Figures S10–S18). In some regions of the EGSL, these conditions exceed A. catenella’s thermal niche and consequently limit the number of risk days during this period of the year. Decreases are most noticeable along the Gaspé Peninsula, in Chaleur Bay and around PEI. Similar declines of Alexandrium midseason growth rates were reported for present-day conditions in the North Atlantic by Gobler et al. (2017), when SST values became higher than the species’ optimal yield. As for spatial expansion, changes in bloom seasonality could affect mussel farms as well as other open ocean aquaculture sites in these areas.
In all climate scenarios studied, increases in risk days are predicted at the mouth of the St. Croix River, which is a known cyst bed and nursery for A. catenella cells in the BoF. Moreover, increases are also predicted in Penobscot Bay and Casco Bay, regions of the GoM to which A. catenella cells are usually advected, from the St. Croix River (Keafer et al., 2005). These observations indicate that the BoF and the GoM could become more favorable to A. catenella by the end of the 21st century, as it is the case in the EGSL.
Impacts of the Projected Changes
Alexandrium catenella blooms represent an immediate threat to marine vertebrates. Toxins produced by A. catenella are efficiently transferred to higher trophic levels via bioaccumulation in invertebrate filter-feeders, who remain relatively tolerant to PSTs (Doucette et al., 2006a). In 2008, a mass mortality event of marine species was recorded during an intense A. catenella bloom in the LSLE (Starr et al., 2017). During this event, mortalities of beluga whales (Delphinapterus leucas), seals, porpoises, marine birds and fish were recorded. At-risk species vulnerable to PSTs, such as beluga whales, are important tourist attractions and hold historical value in the EGSL (Williams et al., 2017). Projected increases in HAB occurrence may further endanger these species and the socio-economic context surrounding them. In addition, the expansion of A. catenella risk days could pose a threat to the mussel industry on PEI’s coastlines, which is already exposed to domoic acid produced by Pseudo-nitzschia spp. (Bates et al., 1989). In 2016, PEI produced > 80% of Canada’s mussel production, which is valued at CAN$23.8 million (Bates et al., 2020). A. catenella occurrence in this region of the EGSL could trigger more frequent mussel farm closures. In addition, the endangered North Atlantic right whale is also potentially threatened by A. catenella’s expansion (Doucette et al., 2006b, 2012).
Perspectives
As emphasized by Wells et al. (2015) and by the IPCC’s Special Report on the Ocean and Cryosphere in a Changing Climate (2019), our results further support the importance of maintaining sustained HAB monitoring programs like the one presented herein. The GAMM developed in this study is eventually intended to be used as an operational prediction tool for governments and the industry. Predictions produced by our model could be verified a posteriori using short term, high resolution hindcasts, as well as various occurrence thresholds (500 cells L–1, 5000 cells L–1). Our model could also be refitted annually to account for any changes in A. catenella’s realized niche and to increase model accuracy. Such short-term predictions have been effectively applied in Europe through the ASIMUTH program (Maguire et al., 2016). Short term predictions would be beneficial to mussel farms and aquaculture sites as an “early warning” tool. This tool would enable industries to make prompt management decisions when A. catenella-favorable conditions are predicted in their region.
Conclusion
Long-term A. catenella predictions produced by the HARM based on three climate change scenarios show increasing frequency, spatial extent and lengthening of the bloom season along Canada’s East Coast by the end of the 21st century. The mitigation scenario, which follows RCP 4.5, still shows increasing A. catenella occurrences across our study region, albeit on a smaller scale than under both RCP 8.5 scenarios. An aggregation of A. catenella occurrences in the LSLE and spatial expansion of blooms into the Gulf and on the Scotian shelf could threaten endangered species, such as the beluga whale and North Atlantic right whale. Changes in bloom timing and increased interannual variability could become problematic to mussel farms and aquaculture sites in the EGSL. The model presented herein is proposed to become an early warning tool for governments and industries on the Canadian East Coast. Our modeling approach could eventually be applied to appropriately downscaled climate models in other coastal regions of the globe where A. catenella poses a threat, particularly in mid- and high latitudes where warming and freshening of waters are intensifying.
Data Availability Statement
The raw data supporting the conclusions of this article will be made available by the authors, without undue reservation.
Author Contributions
MS and JC designed the project. All the authors helped to design the experiment and edit the manuscript. AB-R analyzed the data and wrote the initial manuscript.
Funding
This work was supported by the Aquatic Climate Change Adaptation Services Program (ACCASP) within the Department of Fisheries and Oceans Canada.
Conflict of Interest
The authors declare that the research was conducted in the absence of any commercial or financial relationships that could be construed as a potential conflict of interest.
Acknowledgments
We thank all DFO laboratory technicians that analyzed HAB monitoring samples, and more specifically Jean-Yves Couture and Sylvie Lessard. We also thank Alain Caron (UQAR) and Caroline Lehoux (DFO) for the help with GAMM fitting and cross-validation. Finally, we are also very grateful to Nicolas Lambert (DFO) who prepared the atmospheric files for running the CANOPA model.
Supplementary Material
The Supplementary Material for this article can be found online at: https://www.frontiersin.org/articles/10.3389/fmars.2020.608021/full#supplementary-material
Supplementary Figure 1 | Average sea surface salinity from May through October along Canada’s East Coast under MPI-ESM-LR RCP 4.5 for (A) 1999–2008, (B) 2050–2059, and (C) 2090–2099 and difference in average sea surface salinity between (D) 1999–2008 and 2050–2059 and (E) 1999–2008 and 2090–2099.
Supplementary Figure 2 | Average sea surface salinity along Canada’s East Coast under MPI-ESM-LR RCP 4.5 for (A) May 1999–2008, (B) May 2050–2059, and (C) May 2090–2099. Same pattern applies for (D–F) June, (G–I) July, (J–L) August, (M–O) September, and (P–R) October.
Supplementary Figure 3 | Average sea surface salinity along Canada’s East Coast under MPI-ESM-LR RCP 4.5 for (A) May 1999–2008, (B) difference in average sea surface salinity between May 1999–2008 and 2050–2059 and (C) difference in average sea surface salinity between May 1999–2008 and 2090–2099. Same pattern applies for (D–F) June, (G–I) July, (J–L) August, (M–O) September, and (P–R) October.
Supplementary Figure 4 | Average sea surface salinity from May through October along Canada’s East Coast under MPI-ESM-LR RCP 8.5 for (A) 1999–2008, (B) 2050–2059, and (C) 2090–2099 and difference in average sea surface salinity between (D) 1999–2008 and 2050–2059 and (E) 1999–2008 and 2090–2099.
Supplementary Figure 5 | Average sea surface salinity along Canada’s East Coast under MPI-ESM-LR RCP 8.5 for (A) May 1999–2008, (B) May 2050–2059, and (C) May 2090–2099. Same pattern applies for (D–F) June, (G–I) July, (J–L) August, (M–O) September, and (P–R) October.
Supplementary Figure 6 | Average sea surface salinity along Canada’s East Coast under MPI-ESM-LR RCP 8.5 for (A) May 1999–2008, (B) difference in average sea surface salinity between May 1999–2008 and 2050–2059 and (C) difference in average sea surface salinity between May 1999–2008 and 2090–2099. Same pattern applies for (D–F) June, (G–I) July, (J–L) August, (M–O) September, and (P–R) October.
Supplementary Figure 7 | Average sea surface salinity from May through October along Canada’s East Coast under CanESM2 RCP 8.5 for (A) 1999–2008, (B) 2050–2059 and (C) 2090–2099 and difference in average sea surface salinity between (D) 1999–2008 and 2050–2059 and (E) 1999–2008 and 2090–2099.
Supplementary Figure 8 | Average sea surface salinity along Canada’s East Coast under CanESM2 RCP 8.5 for (A) May 1999–2008, (B) May 2050–2059, and (C) May 2090–2099. Same pattern applies for (D–F) June, (G–I) July, (J–L) August, (M–O) September, and (P–R) October.
Supplementary Figure 9 | Average sea surface salinity along Canada’s East Coast under CanESM2 RCP 8.5 for (A) May 1999–2008, (B) difference in average sea surface salinity between May 1999–2008 and 2050–2059 and (C) difference in average sea surface salinity between May 1999–2008 and 2090–2099. Same pattern applies for (D–F) June, (G–I) July, (J–L) August, (M–O) September, and (P–R) October.
Supplementary Figure 10 | Average sea surface temperature (°C) from May through October along Canada’s East Coast under MPI-ESM-LR RCP 4.5 for (A) 1999–2008, (B) 2050–2059, and (C) 2090–2099 and difference in average sea surface temperature between (D) 1999–2008 and 2050–2059 and (E) 1999–2008 and 2090–2099.
Supplementary Figure 11 | Average sea surface temperature (°C) along Canada’s East Coast under MPI-ESM-LR RCP 4.5 for (A) May 1999–2008, (B) May 2050–2059, and (C) May 2090–2099. Same pattern applies for (D–F) June, (G–I) July, (J–L) August, (M–O) September, and (P–R) October.
Supplementary Figure 12 | Average sea surface temperature (°C) along Canada’s East Coast under MPI-ESM-LR RCP 4.5 for (A) May 1999–2008, (B) difference in average sea surface temperature between May 1999–2008 and 2050–2059 and (C) difference in average sea surface temperature between May 1999–2008 and 2090–2099. Same pattern applies for (D–F) June, (G–I) July, (J–L) August, (M–O) September, and (P–R) October.
Supplementary Figure 13 | Average sea surface temperature (°C) from May through October along Canada’s East Coast under MPI-ESM-LR RCP 8.5 for (A) 1999–2008, (B) 2050–2059, and (C) 2090–2099 and difference in average sea surface temperature between (D) 1999–2008 and 2050–2059 and (E) 1999–2008 and 2090–2099.
Supplementary Figure 14 | Average sea surface temperature (°C) along Canada’s East Coast under MPI-ESM-LR RCP 8.5 for (A) May 1999–2008, (B) May 2050–2059, and (C) May 2090–2099. Same pattern applies for (D–F) June, (G–I) July, (J–L) August, (M–O) September, and (P–R) October.
Supplementary Figure 15 | Average sea surface temperature (°C) along Canada’s East Coast under MPI-ESM-LR RCP 8.5 for (A) May 1999–2008, (B) difference in average sea surface temperature between May 1999–2008 and 2050–2059 and (C) difference in average sea surface temperature between May 1999–2008 and 2090–2099. Same pattern applies for (D–F) June, (G–I) July, (J–L) August, (M–O) September, and (P–R) October.
Supplementary Figure 16 | Average sea surface temperature (°C) from May through October along Canada’s East Coast under CanESM2 RCP 8.5 for (A) 1999–2008, (B) 2050–2059, and (C) 2090–2099 and difference in average sea surface temperature between (D) 1999–2008 and 2050–2059 and (E) 1999–2008 and 2090–2099.
Supplementary Figure 17 | Average sea surface temperature (°C) along Canada’s East Coast under CanESM2 RCP 8.5 for (A) May 1999–2008, (B) May 2050–2059, and (C) May 2090–2099. Same pattern applies for (D–F) June, (G–I) July, (J–L) August, (M–O) September, and (P–R) October.
Supplementary Figure 18 | Average sea surface temperature (°C) along Canada’s East Coast under CanESM2 RCP 8.5 for (A) May 1999–2008, (B) difference in average sea surface temperature between May 1999–2008 and 2050–2059 and (C) difference in average sea surface temperature between May 1999–2008 and 2090–2099. Same pattern applies for (D–F) June, (G–I) July, (J–L) August, (M–O) September, and (P–R) October.
Supplementary Figure 19 | Average number of risk days with Alexandrium catenella ≥ 1000 cells L–1 along Canada’s East Coast under MPI-ESM-LR RCP 4.5 for (A) May 1999–2008, (B) May 2050–2059, and (C) May 2090–2099. Same pattern applies for (D–F) June, (G–I) July, (J–L) August, (M–O) September, and (P–R) October estimated using the HARM.
Supplementary Figure 20 | Average number of risk days with Alexandrium catenella ≥ 1000 cells L–1 along Canada’s East Coast under MPI-ESM-LR RCP 8.5 for (A) May 1999–2008, (B) May 2050–2059, and (C) May 2090–2099. Same pattern applies for (D–F) June, (G–I) July, (J–L) August, (M–O) September, and (P–R) October using the HARM.
Supplementary Figure 21 | Average number of risk days with Alexandrium catenella ≥ 1000 cells L–1 along Canada’s East Coast under CanESM2 RCP 8.5 for (A) May 1999–2008, (B) May 2050–2059, and (C) May 2090–2099. Same pattern applies for (D–F) June, (G–I) July, (J–L) August, (M–O) September, and (P–R) October using the HARM.
Footnotes
References
Albouy-Boyer, S., Plourde, S., Pepin, P., Johnson, C. L., Lehoux, C., Galbraith, P. S., et al. (2016). Habitat modelling of key copepod species in the northwest Atlantic ocean based on the atlantic zone monitoring program. J. Plankton Res. 38, 589–603. doi: 10.1093/plankt/fbw020
Aleynik, D., Dale, A. C., Porter, M., and Davidson, K. (2016). A high resolution hydrodynamic model system suitable for novel harmful algal bloom modelling in areas of complex coastline and topography. Harmful algae 53, 102–117. doi: 10.1016/j.hal.2015.11.012
Allouche, O., Tsoar, A., and Kadmon, R. (2006). Assessing the accuracy of species distribution models: prevalence, kappa and the true skill statistic (TSS). J. Appl. Ecol. 43, 1223–1232. doi: 10.1111/j.1365-2664.2006.01214.x
Anderson, C. R., Sapiano, M. R. P., Prasad, M. B. K., Long, W., Tango, P. J., Brown, C. W., et al. (2010). Predicting potentially toxigenic Pseudo-nitzschia blooms in the Chesapeake Bay. J. Mar. Syst. 83, 127–140. doi: 10.1016/j.jmarsys.2010.04.003
Anderson, D. M., Alpermann, T. J., Cembella, A. D., Collos, Y., Masseret, E., and Montresor, M. (2012). The globally distributed genus Alexandrium: multifaceted roles in marine ecosystems and impacts on human health. Harmful Algae 14, 10–35. doi: 10.1016/j.hal.2011.10.012
Anderson, D. M., Keafer, B. A., Kleindinst, J. L., McGillicuddy, D. J. Jr., Martin, J. L., Norton, K., et al. (2014). Alexandrium fundyense cysts in the Gulf of Maine : Long-term time series of abundance and distribution and linkages to past and future blooms. Deep Sea Res. Pt. II 103, 6–26. doi: 10.1016/j.dsr2.2013.10.002
Barton, A. D., Irwin, A. J., Finkel, Z. V., and Stock, C. A. (2016). Anthropogenic climate change drives shift and shuffle in North Atlantic phytoplankton communities. Proc. Natl. Acad. Sci. U.S.A. 113, 2965–2969. doi: 10.1073/pnas.1519080113
Bates, S. S., Beach, D. G., Comeau, L. A., Haigh, N., Lewis, N. I., Locke, A., et al. (2020). Marine harmful algal blooms and phycotoxins of concern to Canada. Can. Tech. Rep. Fish. Aquat. Sci. 3384:322.
Bates, S. S., Bird, C. J., de Freitas, A. S. W., Foxall, R., Gilgan, M., Hanic, L. A., et al. (1989). Pennate diatom Nitzschia pungens as the primary source of domoic acid, a toxin in shellfish from Eastern Prince Edward Island, Canada. Can. J. Fish. Aquat. Sci. 46, 1203–1215. doi: 10.1139/f89-156
Bill, B. D., Moore, S. K., Hay, L. R., Anderson, D. M., and Trainer, V. L. (2016). Effects of temperature and salinity on the growth of Alexandrium (dinophyceae) isolates from the Salish Sea. J. Phycol. 52, 230–238. doi: 10.1111/jpy.12386
Blasco, D., Levasseur, M., Bonneau, E., Gelinas, R., and Packard, T. T. (2003). Patterns of paralytic shellfish toxicity in the St. Lawrence region in relationship with the abundance and distribution of Alexandrium tamarense. Sci. Mar. 67, 261–278. doi: 10.3989/scimar.2003.67n3261
Brandenburg, K. M., Velthuis, M., and Van de Waal, B. D. (2019). Meta-analysis reveals enhanced growth of marine harmful algae from temperate regions with warming and elevated CO2 levels. Glob. Change Biol. 25, 2607–2618. doi: 10.1111/gcb.14678
Bricelj, V. M., and Shumway, S. E. (1998). Paralytic shellfish toxins in bivalve molluscs: occurrence, transfer kinetics, and biotransformation. Rev. Fish. Sci. 6, 315–383. doi: 10.1080/10641269891314294
Brickman, D., and Drozdowski, A. (2012). Development and validation of a regional shelf model for Maritime Canada based on the NEMO-OPA circulation model. Can. Tech. Rep. Hydrogr. Ocean Sci. 278:57.
Brosnahan, M. L., Fischer, A. D., Lopez, C. B., Moore, S. K., and Anderson, D. M. (2020). Cyst-forming dinoflagellates in a warming climate. Harmful Algae 91:101728. doi: 10.1016/j.hal.2019.101728
Cembella, A. D., Quilliam, M. A., Lewis, N. I., Bauder, A. G., Dell’Aversano, C., Thomas, K., et al. (2002). The toxigenic marine dinoflagellate Alexandrium tamarense as the probable cause of mortality of caged salmon in Nova Scotia. Harmful Algae 1, 313–325. doi: 10.1016/S1568-9883(02)00048-3
Chylek, P., Li, J., Dubey, M. K., Wang, M., and Lesins, G. (2011). Observed and model simulated 20th century Arctic temperature variability: Canadian Earth System Model CanESM2. Atmos. Chem. Phys. Discuss 11, 22893–22907. doi: 10.5194/acpd-11-22893-2011
Collos, Y., Vaquer, A., Laabir, M., Abadie, E., Laugier, T., Pastoureaud, A., et al. (2007). Contribution of several nitrogen sources to growth of Alexandrium catenella during blooms in Thau lagoon, southern France. Harmful Algae 6, 781–789. doi: 10.1016/j.hal.2007.04.003
Condie, S. A., Oliver, E. C. J., and Hallegraeff, G. M. (2019). Environmental drivers of unprecedented Alexandrium catenella dinoflagellate blooms off eastern Tasmania, 2012–2018. Harmful Algae 87:101628. doi: 10.1016/j.hal.2019.101628
Cusack, C., Dabrowski, T., Lyons, K., Berry, A., Westbrook, G., Salas, R., et al. (2016). Harmful algal bloom forecast system for SW Ireland. Part II: Are operational oceanographic models useful in a HAB warning system. Harmful Algae 53, 86–101. doi: 10.1016/j.hal.2015.11.013
Dabrowski, T., Lyons, K., Nolan, G., Berry, A., Cusack, C., and Silke, J. (2016). Harmful algal bloom forecast system for SW Ireland. Part I: Description and validation of an operational forecasting model. Harmful Algae 53, 64–76. doi: 10.1016/j.hal.2015.11.015
Díaz, P. A., Álvarez, G., Varela, D., Pérez-Santos, I., Díaz, M., Molinet, C., et al. (2019). Impacts of harmful algal blooms on the aquaculture industry: Chile as a case study. Perspect. Phycol. 6, 39–50. doi: 10.1127/pip/2019/0081
Doucette, G. J, Maneiro, I., Riveiro, I., and Svensen, C. (2006a). “Phycotoxin Pathways in Aquatic Food Webs: Transfer, Accumulation and Degradation,” in Ecology of Harmful Algae, eds E. Granéli and J. T. Turner (Berlin: Springer-Verlag), 283–295. doi: 10.1007/978-3-540-32210-8_22
Doucette, G. J., Cembella, A. D., Martin, J. L., Michaud, J., Cole, T. V. N., and Rolland, R. M. (2006b). Paralytic shellfish poisoning (PSP) toxins in North Atlantic right whales Eubalaena glacialis and their zooplankton prey in the Bay of Fundy. Canada. Mar. Ecol. Prog. Ser. 306, 303–313. doi: 10.3354/meps306303
Doucette, G. J., Mikulski, C. M., King, K. L., Roth, P. B., Wang, Z., Leandro, et al. (2012). Endangered North Atlantic right whales (Eubalaena glacialis) experience repeated, concurrent exposure to multiple environmental neurotoxins produced by marine algae. Environ. Res. 112, 67–76. doi: 10.1016/j.envres.2011.09.010
El-Sabh, M., and Silverberg, N. (1990). Oceanography of a Large-Scale Estuarine System: The St. Lawrence. New York, NY: Springer- Verlag.
Etheridge, S. M. (2010). Paralytic shellfish poisoning: seafood safety and human health perspectives. Toxicon 56, 108–122. doi: 10.1016/j.toxicon.2009.12.013
Etheridge, S. M., and Roesler, C. S. (2005). Effects of temperature, irradiance, and salinity on photosynthesis, growth rates, total toxicity, and toxin composition for Alexandrium fundyense isolates from the Gulf of Maine and Bay of Fundy. Deep Sea Res. Pt. II 52, 2491–2500. doi: 10.1016/j.dsr2.2005.06.026
Fauchot, J., Levasseur, M., Roy, S., Gagnon, R., and Weise, A. M. (2005). Environmental factors controlling Alexandrium tamarense (dinophyceae) growth rate during a red tide event in the St. Lawrence estuary (Canada). J. Phycol. 41, 263–272. doi: 10.1111/j.1529-8817.2005.03092.x
Fauchot, J., Saucier, F. J., Levasseur, M., Roy, S., and Zakardjian, B. (2008). Wind-driven river plume dynamics and toxic Alexandrium tamarense blooms in the St. Lawrence estuary (Canada): a modeling study. Harmful Algae 7, 214–227. doi: 10.1016/j.hal.2007.08.002
Fielding, A. H., and Bell, J. H. (1997). A review of methods for the assessment of prediction errors in conservation presence/absence models. Environ. Conserv. 24, 38–49. doi: 10.1017/s0376892997000088
Freeman, E. A., and Moisen, G. G. (2008). PresenceAbsence: an R package for presence-absence model analysis. J. Stat. Softw. 23:15651. doi: 10.18637/jss.v023.i11
Gagnon, R., Levasseur, M., Weise, A. M., Fauchot, J., Campbell, P. G. C., Weissenboeck, B. J., et al. (2005). Growth stimulation of Alexandrium tamarense (dinophyceae) by humic substances from the Manicouagan River (Eastern Canada). J. Phycol. 41, 489–497. doi: 10.1111/j.1529-8817.2005.00077.x
Gillibrand, P. A., Siemering, B., Miller, P. I., and Davidson, K. (2016). Individual-based modelling of the development and transport of a Karenia mikimotoi bloom on the North-west European continental shelf. Harmful Algae 53, 118–134. doi: 10.1016/j.hal.2015.11.011
Giorgetta, M. A., Jungclaus, J., Reick, C. H., Legutke, S., Bader, J., Böttinger, M., et al. (2013). Climate and carbon cycle changes from 1850 to 2100 in MPI-ESM simulations for the Coupled Model Intercomparison Project phase 5. J. Adv. Modelt Earth Syst. 5, 572–597. doi: 10.1002/jame.20038
Glibert, P. M. (2016). Margalef revisited: a new phytoplankton mandala incorporating twelve dimensions, including nutritional physiology. Harmful Algae 55, 25–30. doi: 10.1016/j.hal.2016.01.008
Gobler, C. J., Doherty, O. M., Hattenrath-Lehmann, T. K., Griffith, A. W., Kang, Y., and Litaker, R. W. (2017). Ocean warming since 1982 has expanded the niche of toxic algal blooms in the North Atlantic and North Pacific oceans. Proc. Natl. Acad. Sci. U.S.A. 114, 4975–4980. doi: 10.1073/pnas.1619575114
Guisan, A., Edwards, T. C., and Hastie, T. (2002). Generalized linear and generalized additive models in studies of species distributions: setting the scene. Ecol. Model. 157, 89–100. doi: 10.1016/S0304-3800(02)00204-1
Hallegraeff, G. M. (2010). Ocean climate change, phytoplankton community responses, and harmful algal blooms : a formidable predictive challenge. J. Phycol. 46, 220–235. doi: 10.1111/j.1529-8817.2010.00815.x
Hawkins, E., and Sutton, R. (2011). Time of emergence of climate signals. Geophys. Res. Lett. 39:L01702. doi: 10.1029/2011GL050087
IPCC (2013). Climate Change 2013: The Physical Science Basis. Contribution of Working Group I to the Fifth Assessment Report of the Intergovernmental Panel on Climate Change. Cambridge: Cambridge University Press.
Kalnay, E., Kanamitsu, M., Kistler, R., Collins, W., Deaven, D., Gandin, L., et al. (1996). The NCEP/NCAR 40-year reanalysis project. Bull. Am. Meteor. Soc. 77, 437–472.
Keafer, B. A., Churchill, J. H., McGillicuddy, D. J. Jr., and Anderson, D. M. (2005). Bloom development and transport of toxic Alexandrium fundyense populations within a coastal plume in the Gulf of Maine. Deep Sea Res. Pt. II 52, 2674–2697. doi: 10.1016/j.dsr2.2005.06.016
Koutitonsky, V. G., and Bugden, G. L. (1991). The Physical Oceanography of the Gulf of St. Lawrence: a review with emphasis on the synoptic variability of the motion. Can. Spec. Publ. Fish. Aquat. Sci. 113, 57–90.
Lambert, N., Chassé, J., Perrie, W., Long, Z., Guo, L., and Morrison, J. (2013). Projection of future river runoffs in Eastern Atlantic Canada from Global and Regional climate models. Can. Tech. Rep. Hydrogr. Ocean. Sci 288:34.
Landsberg, J. H. (2009). The effects of harmful algal blooms on aquatic organisms. Rev. Fish. Sci. 10, 113–190. doi: 10.1080/20026491051695
Lane, J. Q., Raimondi, P. T., and Kudela, R. M. (2009). Development of a logistic regression model for the prediction of toxigenic Pseudo-nitzschia blooms in Monterey Bay. California. Mar. Ecol. Prog. Ser. 383, 37–51. doi: 10.3354/meps07999
Lavoie, D., Lambert, N., and Gilbert, D. (2017). Projections of Future Trends in Biogeochemical Conditions in the Northwest Atlantic Using CMIP5 Earth System Models. Atmos. Ocean 57, 18–40. doi: 10.1080/07055900.2017.1401973
Lavoie, D., Lambert, N., ben Mustapha, S., and van der Baaren, A. (2013). Projections of future physical and biogeochemical conditions in the Northwest Atlantic from CMIP5 global climate models. Can. Tech. Rep. Hydrogr. Ocean. Sci. 285:156.
Li, Y., He, R., McGillicuddy, D. J., Anderson, D. M., and Keafer, B. A. (2009). Investigation of the 2006 Alexandrium fundyense bloom in the Gulf of Maine: in-situ observations and numerical modeling. Cont. Shelf Res. 29, 2069–2082. doi: 10.1016/j.csr.2009.07.012
Long, Z., Perrie, W., Chassé, J., Brickman, D., Guo, L., Drozdowski, A., et al. (2016). Impacts of climate change in the Gulf of St. Lawrence. Atmos. Ocean 54, 337–351. doi: 10.1080/07055900.2015.1029869
Maguire, J., Cusack, C., Ruiz-Villarreal, M., Silke, J., McElligott, D., and Davidson, K. (2016). Applied simulations and integrated modelling for the understanding of toxic and harmful algal blooms (ASIMUTH): integrated HAB forecast systems for Europe’s Atlantic Arc. Harmful Algae 53, 160–166. doi: 10.1016/j.hal.2015.11.006
Margalef, R. (1978). Life-forms of phytoplankton as survival alternatives in an unstable environment. Oceanol. Acta 1, 493–509.
Martin, J. L., LeGresley, M. M., and Hanke, A. R. (2014). Thirty years – Alexandrium fundyense cyst, bloom dynamics and shellfish toxicity in the Bay of Fundy, eastern Canada. Deep-Sea Res. Pt. II 103, 27–39. doi: 10.1016/j.dsr2.2013.08.004
McGillicuddy, D. J. Jr., Townsend, D. W., He, R., Keafer, B. A., Kleindinst, J. L., Li, Y., et al. (2011). Suppression of the 2010 Alexandrium fundyense bloom by changes in physical, biological, and chemical properties of the Gulf of Maine. Limnol. Oceanogr. 56, 2411–2426. doi: 10.4319/lo.2011.56.6.2411
McKenzie, C. H., Bates, S. S., Martin, J. L., Haigh, N., Howland, K. L., Lewis, N. I., et al. (2020). Three decades of Canadian marine harmful algal events: phytoplankton and phycotoxins of concern to human and ecosystem health. Harmful Algae 101852. doi: 10.1016/j.hal.2020.101852
Neukermans, G., Oziel, L., and Babin, M. (2017). Increased intrusion of warming Atlantic water leads to rapid expansion of temperate phytoplankton in the Arctic. Glob. Chang. Biol. 24, 2545–2553. doi: 10.1111/gcb.14075
Ní Rathaille, A., and Raine, R. (2011). Seasonality in the excystment of Alexandrium minutum and Alexandrium tamarense in Irish coastal waters. Harmful Algae 10, 629–635. doi: 10.1016/j.hal.2011.04.015
Paredes-Mella, J., Varela, D., Fernández, P., and Espinoza-González, O. (2020). Growth performance of Alexandrium catenella from the Chilean fjords under different environmental drivers: plasticity as a response to a highly variable environment. J. Plankton Res. 42, 119–134. doi: 10.1093/plankt/fbaa011
Parkhill, J.-P., and Cembella, A. D. (1999). Effects of salinity, light and inorganic nitrogen on growth and toxigenecity of the marine dinoflagellate Alexandrium tamarense from northeastern Canada. J. Plankton Res. 21, 939–955. doi: 10.1093/plankt/21.5.939
R Core Team (2018). R: A Language and Environment for Statistical Computing. Vienna: R Foundation for Statistical Computing.
Raine, R., McDermott, G., Silke, J., Lyons, K., Nolan, G., and Cusack, C. (2010). A simple short range model for the prediction of harmful algal events in the bays of southwestern Ireland. J. Marine Syst. 83, 150–157. doi: 10.1016/j.jmarsys.2010.05.001
Raven, J. A., Gobler, C. J., and Hansen, P. J. (2020). Dynamic CO2 and pH levels in coastal, estuarine, and inland waters: theoretical and observed effects on harmful algal blooms. Harmful Algae 91:101594. doi: 10.1016/j.hal.2019.03.012
Renaut, S., Devred, E., and Babin, M. (2018). Northward expansion and intensification of phytoplankton growth during the early ice-free season in arctic. Geophys. Res. Lett. 45, 590–598. doi: 10.1029/2018GL078995
Roggatz, C. C., Fletcher, N., Benoit, D. M., Algar, A. C., Doroff, A., Wright, B., et al. (2019). Saxitoxin and tetrodotoxin bioavailability increases in future oceans. Nat. Clim. Change 9, 840–844. doi: 10.1038/s41558-019-0589-3
Shumway, S. E. (1990). A review of the effects of algal blooms on shellfish and aquaculture. J. World Aquacult. Soc. 21, 65–104. doi: 10.1111/j.1749-7345.1990.tb00529.x
Starr, M., Lair, S., Michaud, S., Scarratt, M., Quilliam, M., Lefaivre, D., et al. (2017). Multispecies mass mortality of marine fauna linked to a toxic dinoflagellate bloom. PLoS One 12:e0176299. doi: 10.1371/journal.pone.0176299
Townhill, B. L., Tinker, J., Jones, M., Pitois, S., Creach, V., Simpson, S. D., et al. (2018). Harmful algal blooms and climate change: exploring future distribution changes. ICES J. Mar. Sci. 75, 1882–1893. doi: 10.1093/icesjms/fsy113
Trainer, V. L., Moore, S. K., Hallegraeff, G., Kudela, R. M., Clement, A., Mardones, J. I., et al. (2020). Pelagic harmful algal blooms and climate change: lessons from nature’s experiments with extremes. Harmful Algae 91:101591. doi: 10.1016/j.hal.2019.03.009
Valbi, E., Ricci, F., Capellacci, S., Casabianca, S., Scardi, M., and Penna, A. (2019). A model predicting the PSP toxic dinoflagellate Alexandrium minutum occurrence in the coastal waters of the NW Adriatic Sea. Sci. Rep. 9:4166. doi: 10.1038/s41598-019-40664-w
Weise, A. M., Levasseur, M., Saucier, F. J., Senneville, S., Bonneau, E., Roy, S., et al. (2002). The link between precipitation, river runoff, and blooms of the toxic dinoflagellate Alexandrium tamarense in the St. Lawrence. Can. J. Fish. Aquat. Sci. 59, 464–473. doi: 10.1139/f02-024
Wells, M. L., Trainer, V. L., Smayda, T. J., Karlson, B. S. O., Trick, C. G., Kudela, R. M., et al. (2015). Harmful algal blooms and climate change: learning from the past and present to forecast the future. Harmful Algae 49, 68–93. doi: 10.1016/j.hal.2015.07.009
Williams, R., Lacy, R. C., Ashe, E., Hall, A., Lehoux, C., Lesage, V., et al. (2017). Predicting Responses of St. Lawrence beluga to environmental change and anthropogenic threats to orient effective management actions. DFO Can. Sci. Advis. Sec. Res. Doc 2017:44.
Wood, S. N. (2003). Thin plate regression splines. J. Roy. Stat. Soc. B Met. 65, 95–114. doi: 10.1111/1467-9868.00374
Wood, S. N. (2017). Generalized Additive Models: An Introduction with R. Boca Raton, FL: Chapman and Hall.
Yee, T. W., and Mitchell, N. D. (1991). Generalized additive models in plant ecology. J. Veg. Sci. 2, 587–602. doi: 10.2307/3236170
Zhang, L., Liu, S., Sun, P., Wang, T., Wang, G., Zhang, X., et al. (2015). Consensus forecasting of species distributions: the effects of niche model performance and niche properties. PLoS One 10:e0120056. doi: 10.1371/journal.pone.0120056
Keywords: Alexandrium catenella, climate change, harmful algal blooms, GAMM, predictions, Canada’s East Coast
Citation: Boivin-Rioux A, Starr M, Chassé J, Scarratt M, Perrie W and Long Z (2021) Predicting the Effects of Climate Change on the Occurrence of the Toxic Dinoflagellate Alexandrium catenella Along Canada’s East Coast. Front. Mar. Sci. 7:608021. doi: 10.3389/fmars.2020.608021
Received: 18 September 2020; Accepted: 08 December 2020;
Published: 07 January 2021.
Edited by:
Rui Rosa, University of Lisbon, PortugalReviewed by:
Raphael M. Kudela, University of California, Santa Cruz, United StatesShauna Murray, University of Technology Sydney, Australia
Copyright © 2021 Boivin-Rioux, Starr, Chassé, Scarratt, Perrie and Long. This is an open-access article distributed under the terms of the Creative Commons Attribution License (CC BY). The use, distribution or reproduction in other forums is permitted, provided the original author(s) and the copyright owner(s) are credited and that the original publication in this journal is cited, in accordance with accepted academic practice. No use, distribution or reproduction is permitted which does not comply with these terms.
*Correspondence: Michel Starr, michel.starr@dfo-mpo.gc.ca